
Protein Tyrosine Phosphatase 1B Inhibitors of Pueraria lobata Based on the Spectrum–Effect Relationship by Q-Marker Selection

Abstract
:
1. Introduction
2. Results and Discussion
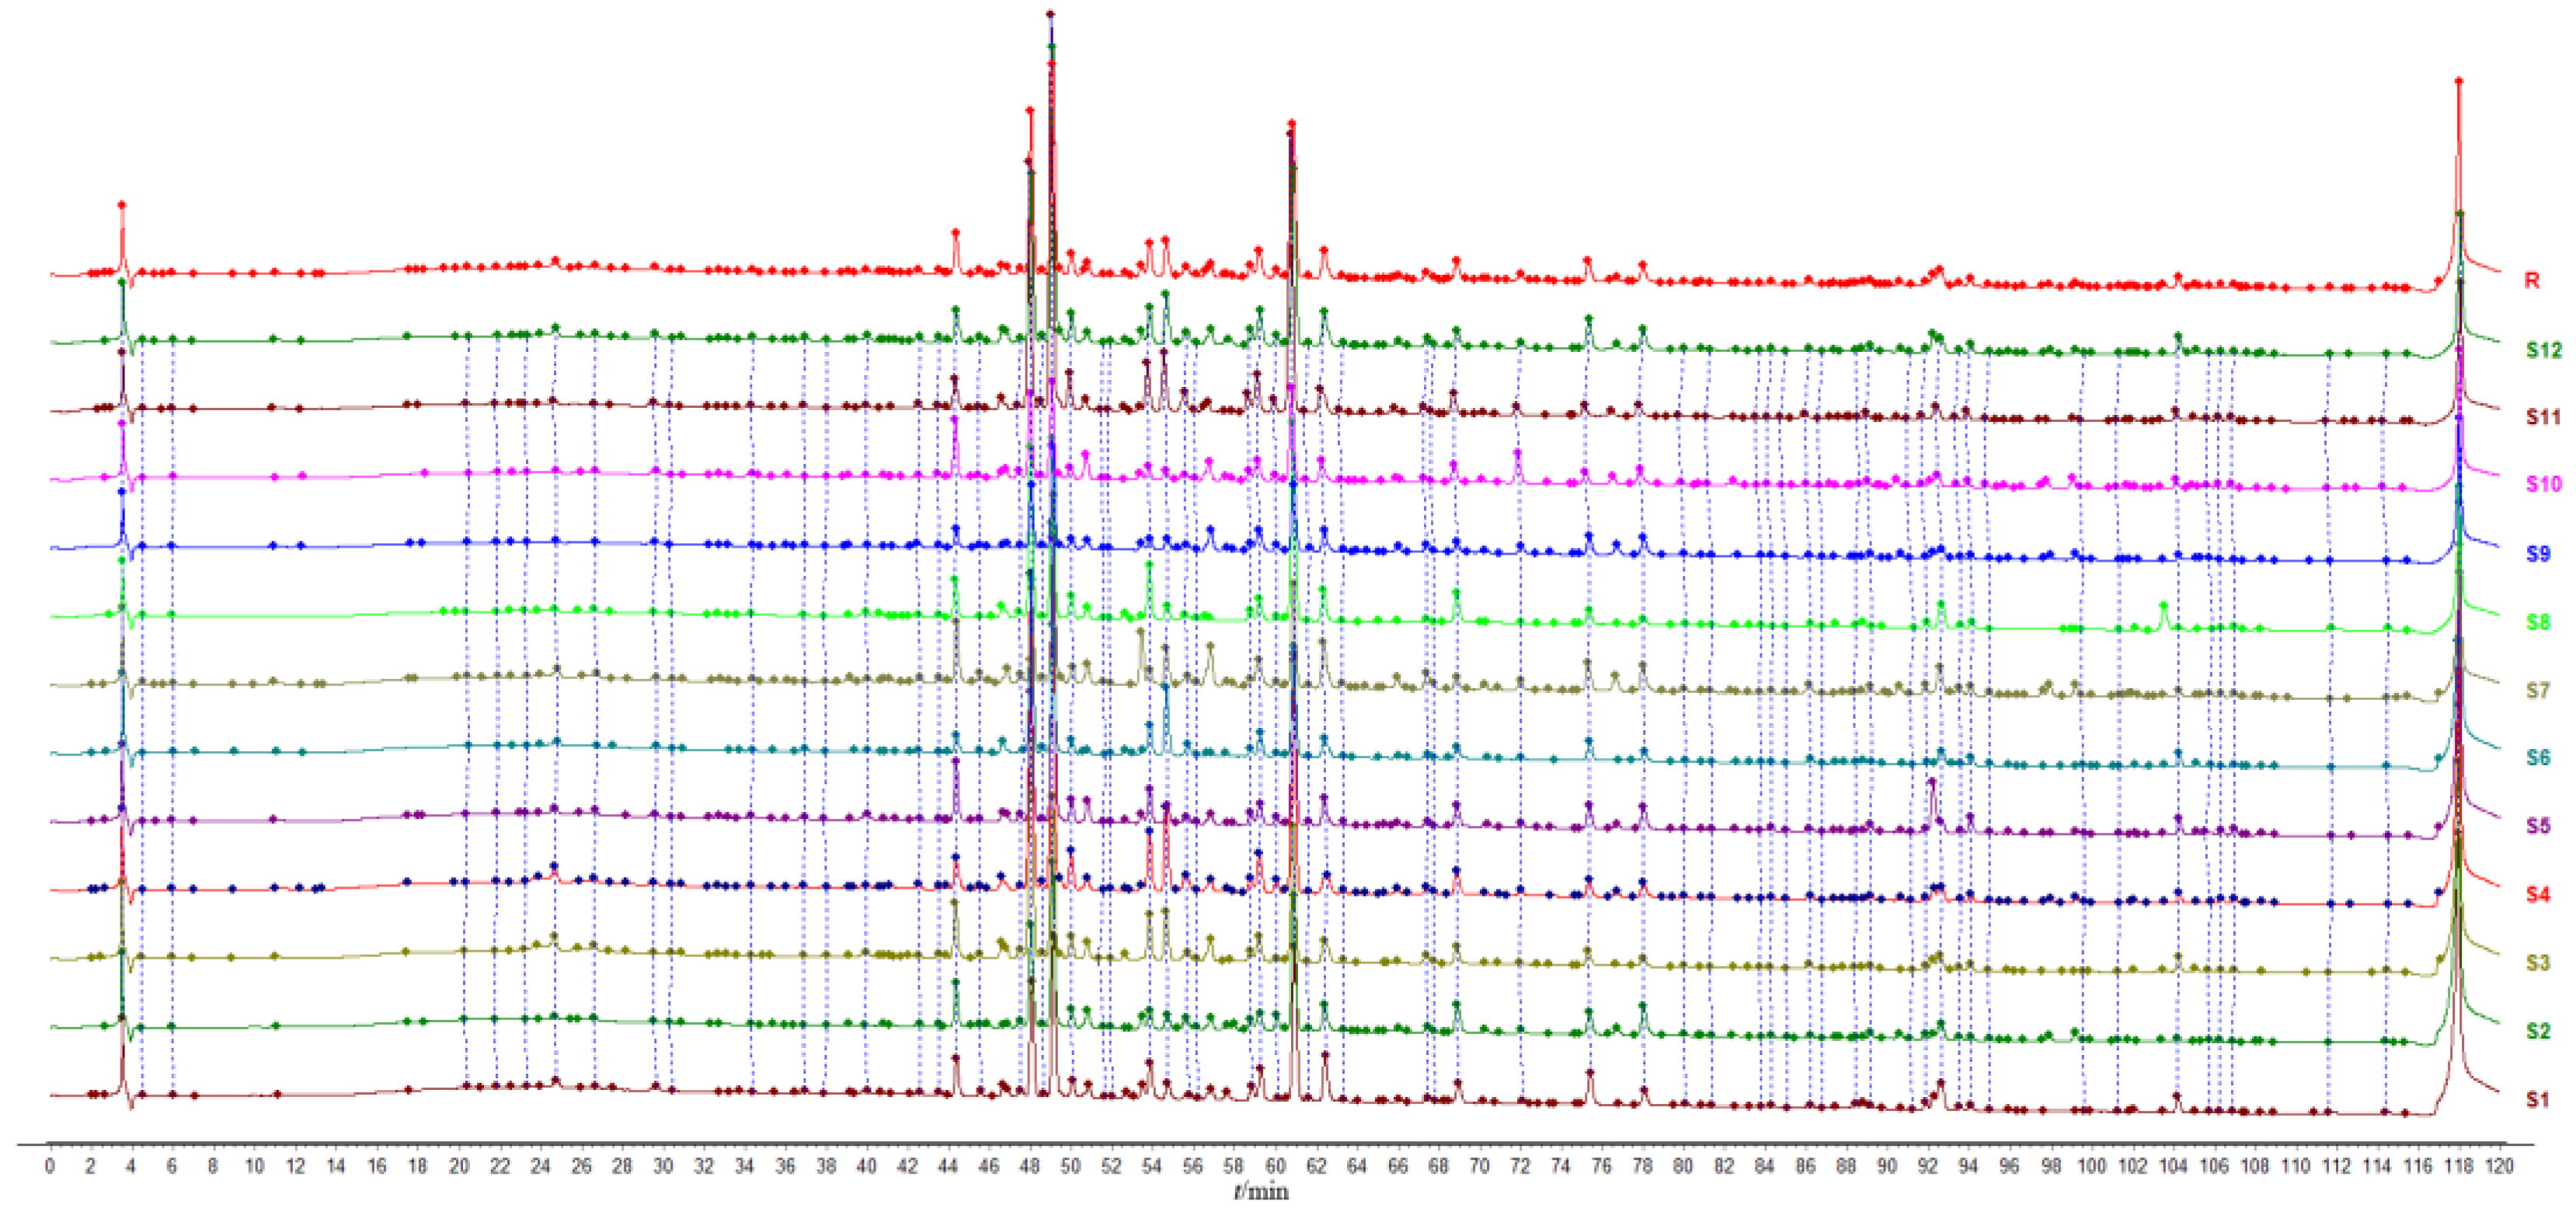
2.1. Establishment of Fingerprint of P. lobata Extract
2.2. Analysis of Inhibitory Activity of P. lobata Extract on PTP1B
2.3. Multivariate Analysis Results
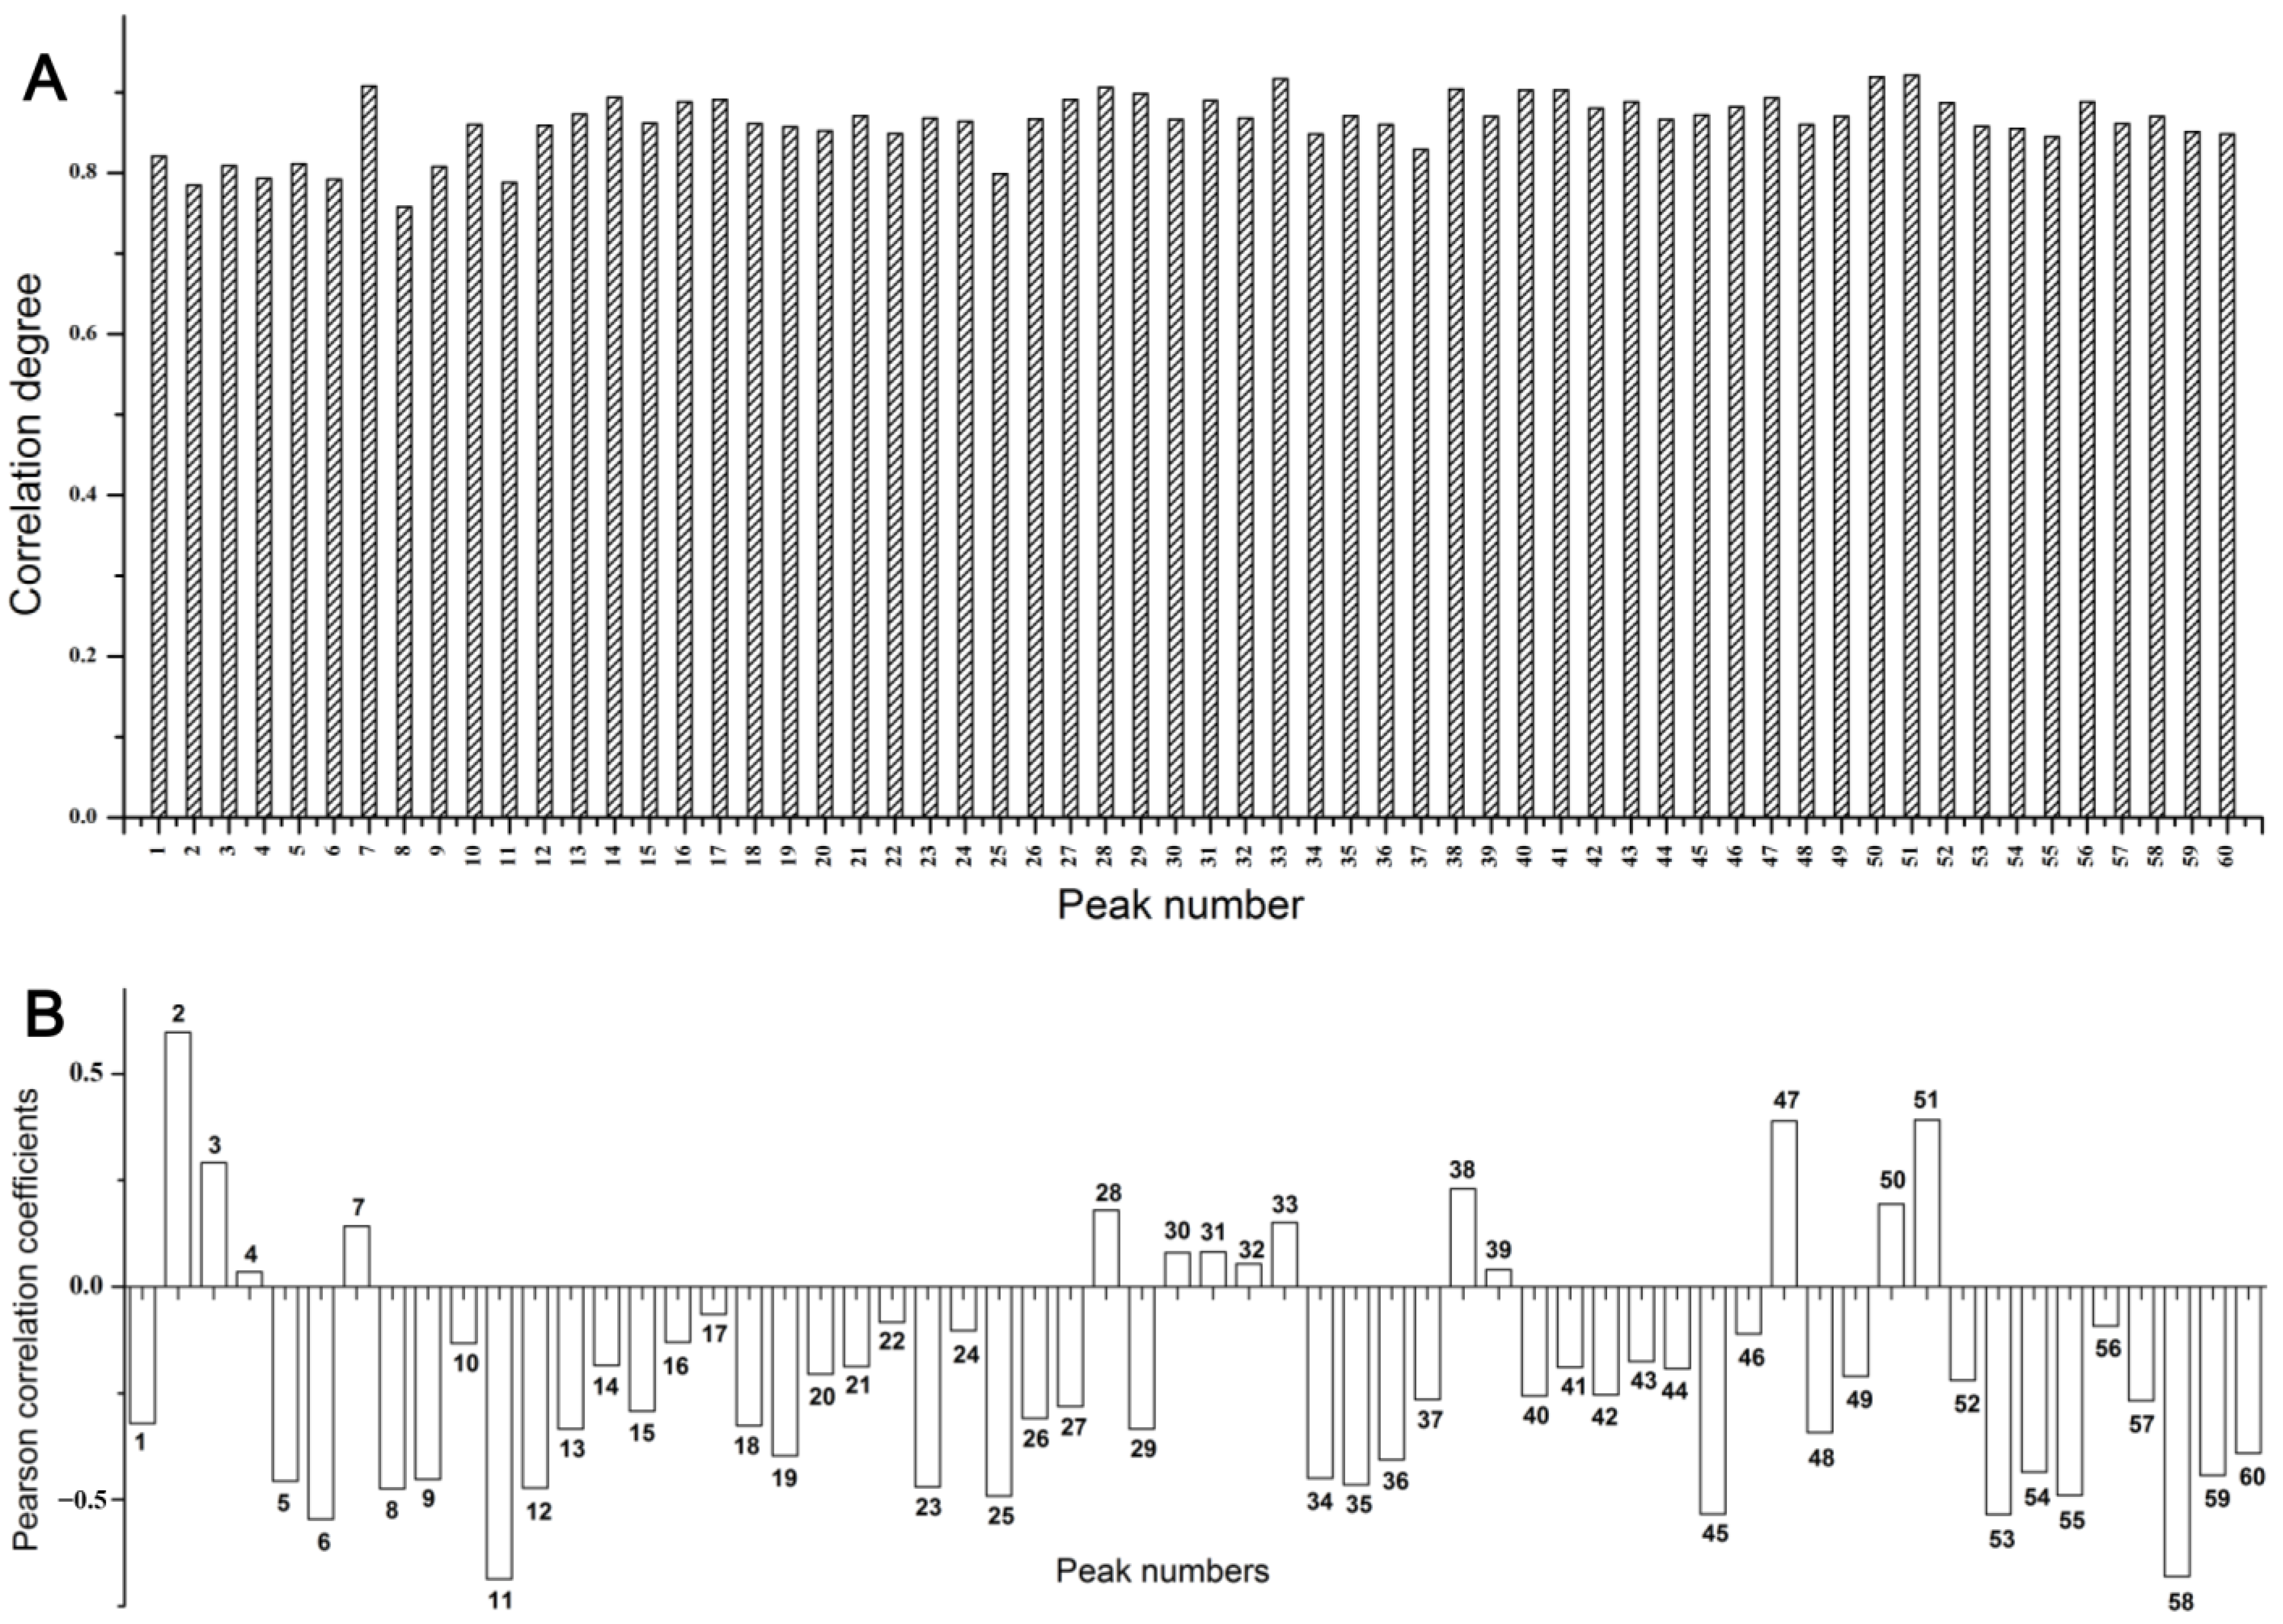
2.3.1. Grey Relational Analysis (GRA)
2.3.2. Bivariate Correlation Analysis (BCA)
2.3.3. Hierarchical Cluster Analysis (HCA)
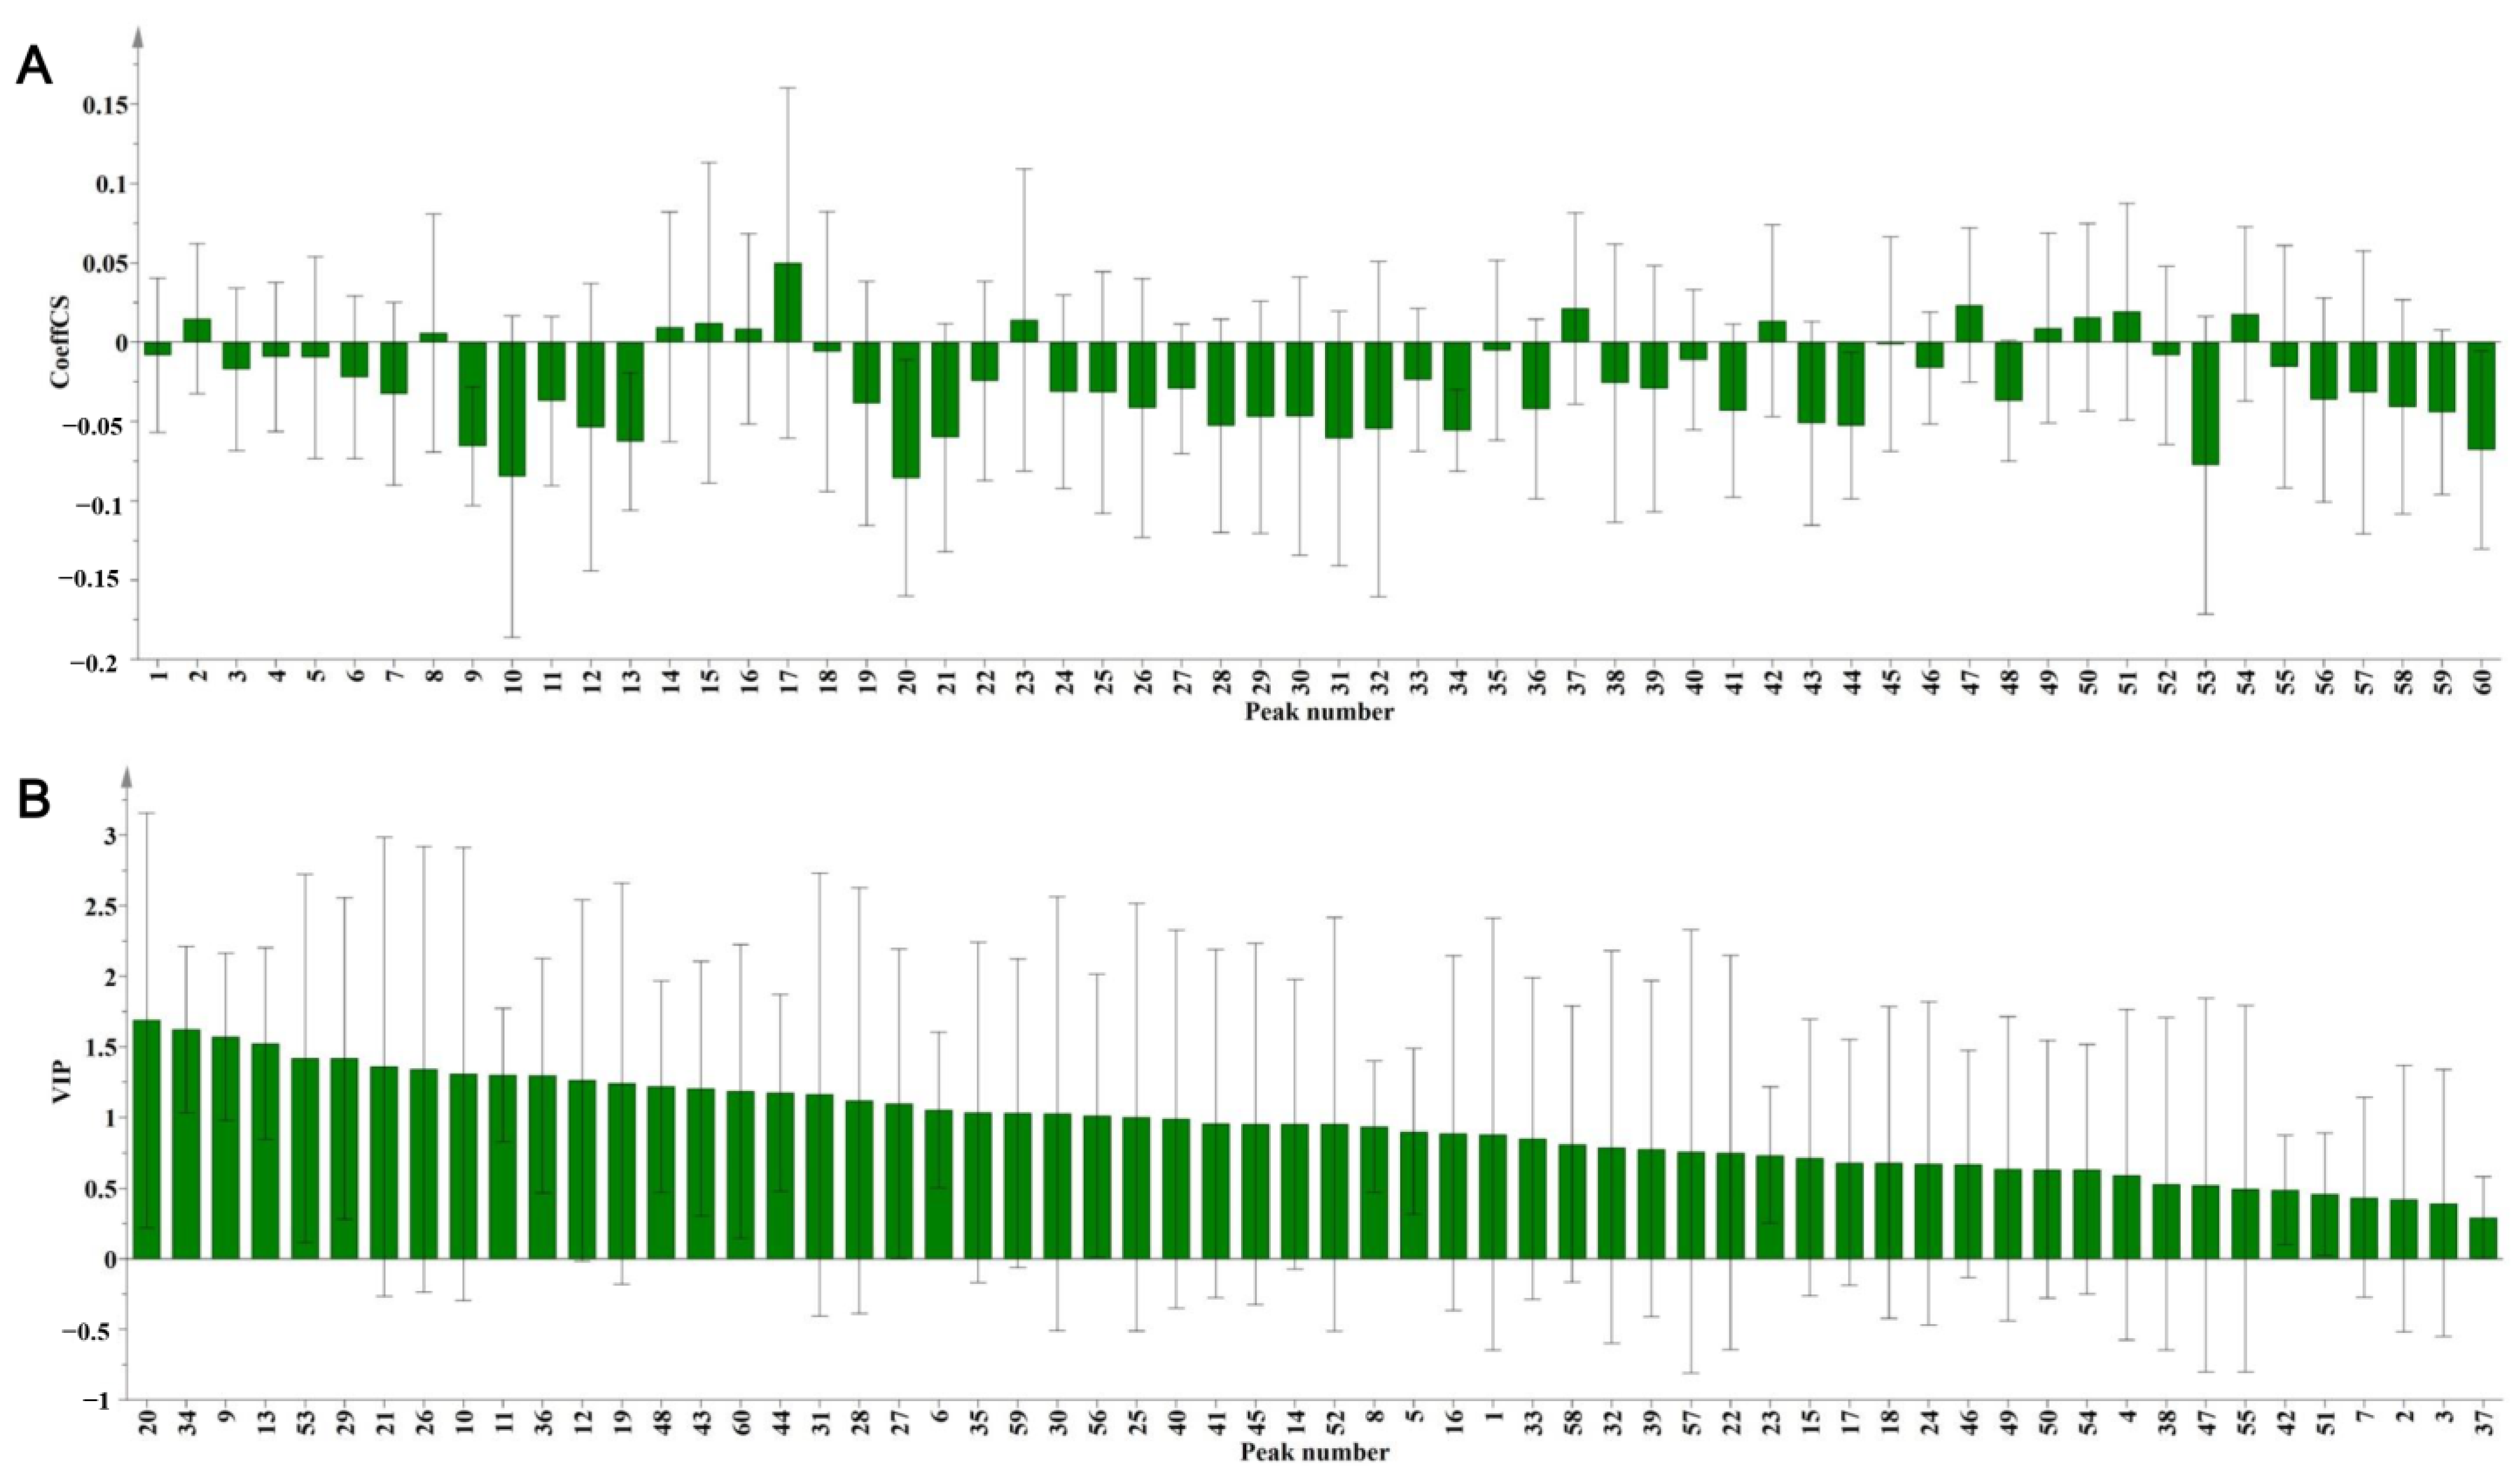
2.3.4. Partial Least Squares Discriminant Analysis (PLS-DA)
2.3.5. Integration of Analytical Results
2.4. Verification Experiment of PTP1B Inhibitory Activity
2.5. Molecular Docking
3. Materials and Methods
3.1. Reagents and Materials
3.2. Sample Preparation
3.3. HPLC Analysis
3.4. Determination of Inhibitory Activity of P. lobata on PTP1B In Vitro
3.5. Multivariate Analysis
4. Conclusions
Supplementary Materials
Author Contributions
Funding
Institutional Review Board Statement
Informed Consent Statement
Data Availability Statement
Acknowledgments
Conflicts of Interest
References
- Harding, J.L.; Pavkov, M.E.; Magliano, D.J.; Shaw, J.E.; Gregg, E.W. Global trends in diabetes complications: A review of current evidence. Diabetologia 2018, 62, 3–16. [Google Scholar] [CrossRef] [PubMed]
- IDF. IDF Diabetes Atlas, 10th ed.; IDF: Brussels, Belgium, 2021; pp. 1–141. [Google Scholar]
- Sacks, D.B.; Arnold, M.; Bakris, G.L.; Bruns, D.E.; Horvath, A.R.; Lernmark, Å.; Metzger, B.E.; Nathan, D.M.; Kirkman, M.S. Guidelines and Recommendations for Laboratory Analysis in the Diagnosis and Management of Diabetes Mellitus. Diabetes Care 2023, 46, e151–e199. [Google Scholar] [CrossRef] [PubMed]
- Genovese, M.; Nesi, I.; Caselli, A.; Paoli, P. Natural α-Glucosidase and Protein Tyrosine Phosphatase 1B Inhibitors: A Source of Scaffold Molecules for Synthesis of New Multitarget Antidiabetic Drugs. Molecules 2021, 26, 4818. [Google Scholar] [CrossRef] [PubMed]
- White, M.F. Insulin Signaling in Health and Disease. Science 2003, 302, 1710–1711. [Google Scholar] [CrossRef] [PubMed]
- Rath, P.; Ranjan, A.; Chauhan, A.; Verma, N.K.; Bhargava, A.; Prasad, R.; Jindal, T. A Critical Review on Role of Available Synthetic Drugs and Phytochemicals in Insulin Resistance Treatment by Targeting PTP1B. Appl. Biochem. Biotechnol. 2022, 194, 4683–4701. [Google Scholar] [CrossRef] [PubMed]
- Chen, X.; Yu, J.; Shi, J. Management of Diabetes Mellitus with Puerarin, a Natural Isoflavone FromPueraria lobata. Am. J. Chin. Med. 2019, 46, 1771–1789. [Google Scholar] [CrossRef]
- Wang, S.; Zhang, S.; Wang, S.; Gao, P.; Dai, L. A comprehensive review on Pueraria: Insights on its chemistry and medicinal value. Biomed. Pharmacother. 2020, 131, 110734. [Google Scholar] [CrossRef]
- Wang, C.; Xu, N.; Cui, S. Comparative transcriptome analysis of roots, stems, and leaves of Pueraria lobata (Willd.) Ohwi: Identification of genes involved in isoflavonoid biosynthesis. PeerJ 2021, 9, e10885. [Google Scholar] [CrossRef] [PubMed]
- Combs, A.P. Recent Advances in the Discovery of Competitive Protein Tyrosine Phosphatase 1B Inhibitors for the Treatment of Diabetes, Obesity, and Cancer. J. Med. Chem. 2009, 53, 2333–2344. [Google Scholar] [CrossRef]
- Jin, J.; He, Y.; Guo, J.; Pan, Q.; Wei, X.; Xu, C.; Qi, Z.; Li, Q.; Ma, S.; Lin, J.; et al. BACH1 controls hepatic insulin signaling and glucose homeostasis in mice. Nat. Commun. 2023, 14, 8428. [Google Scholar] [CrossRef]
- Xiong, Y.; Ma, P.; Huang, L.; Li, Y.; Wang, X. Widely targeted metabolomics analysis of different parts of kudzu. Biomed. Chromatogr. 2022, 37, e5545. [Google Scholar] [CrossRef] [PubMed]
- Fan, Y.; Huang, G. Preparation, Structural Analysis and Antioxidant Activity of Polysaccharides and Their Derivatives from Pueraria lobata. Chem. Biodivers. 2023, 20, e202201253. [Google Scholar] [CrossRef] [PubMed]
- Sun, Y.-J.; Cao, S.-J.; Liang, F.-N.; Li, J.-Y.; Zhang, X.-Y.; Li, W.; Ding, L.-Q.; Qiu, F. Puerol and pueroside derivatives from Pueraria lobata and their anti-inflammatory activity. Phytochemistry 2023, 205, 113507. [Google Scholar] [CrossRef] [PubMed]
- Elchebly, M.; Payette, P.; Michaliszyn, E.; Cromlish, W.; Collins, S.; Loy, A.L.; Normandin, D.; Cheng, A.; Himms-Hagen, J.; Chan, C.-C.; et al. Increased Insulin Sensitivity and Obesity Resistance in Mice Lacking the Protein Tyrosine Phosphatase-1B Gene. Science 1999, 283, 1544–1548. [Google Scholar] [CrossRef] [PubMed]
- Ding, H.; Zhang, Y.; Xu, C.; Hou, D.; Li, J.; Zhang, Y.; Peng, W.; Zen, K.; Zhang, C.-Y.; Jiang, X. Norathyriol reverses obesity- and high-fat-diet-induced insulin resistance in mice through inhibition of PTP1B. Diabetologia 2014, 57, 2145–2154. [Google Scholar] [CrossRef] [PubMed]
- Xu, L.; Li, Y.; Dai, Y.; Peng, J. Natural products for the treatment of type 2 diabetes mellitus: Pharmacology and mechanisms. Pharmacol. Res. 2018, 130, 451–465. [Google Scholar] [CrossRef] [PubMed]
- van Smoorenburg, A.N.; Hertroijs, D.F.L.; Dekkers, T.; Elissen, A.M.J.; Melles, M. Patients’ perspective on self-management: Type 2 diabetes in daily life. BMC Health Serv. Res. 2019, 19, 605. [Google Scholar] [CrossRef] [PubMed]
- Dou, Z.; Xia, Y.; Zhang, J.; Li, Y.; Zhang, Y.; Zhao, L.; Huang, Z.; Sun, H.; Wu, L.; Han, D.; et al. Syndrome Differentiation and Treatment Regularity in Traditional Chinese Medicine for Type 2 Diabetes: A Text Mining Analysis. Front. Endocrinol. 2021, 12, 728032. [Google Scholar] [CrossRef] [PubMed]
- Yimin, L.; Yanhua, J.; Mengjie, C.; Xiaojun, Y.; Hongning, L.; Zhijun, Z. Research progress of Gegen Qinlian Decoction and its modified prescriptions in improving insulin resistance in type 2 diabetes. Chin. J. Exp. Tradit. Med. Formulae 2024, 30, 1–11. [Google Scholar] [CrossRef]
- Li, J.; Li, Y.; Yuan, X.; Yao, D.; Gao, Z.; Niu, Z.; Wang, Z.; Zhang, Y. The effective constituent puerarin, from Pueraria lobata, inhibits the proliferation and inflammation of vascular smooth muscle in atherosclerosis through the miR-29b-3p/IGF1 pathway. Pharm. Biol. 2022, 61, 1–11. [Google Scholar] [CrossRef]
- Su, B.; Kan, Y.; Xie, J.; Hu, J.; Pang, W. Relevance of the Pharmacokinetic and Pharmacodynamic Profiles of Puerariae lobatae Radix to Aggregation of Multi-Component Molecules in Aqueous Decoctions. Molecules 2016, 21, 845. [Google Scholar] [CrossRef] [PubMed]
- Wu, W.; Yang, S.; Liu, P.; Yin, L.; Gong, Q.; Zhu, W. Systems Pharmacology-Based Strategy to Investigate Pharmacological Mechanisms of Radix Puerariae for Treatment of Hypertension. Front. Pharmacol. 2020, 11, 11345. [Google Scholar] [CrossRef]
- He, H.; Peng, S.; Song, X.; Jia, R.; Zou, Y.; Li, L.; Yin, Z. Protective effect of isoflavones and triterpenoid saponins from pueraria lobata on liver diseases: A review. Food Sci. Nutr. 2021, 10, 272–285. [Google Scholar] [CrossRef]
- Zhang, Z.-T.; Guo, N.; Zhuang, G.-D.; Deng, S.-M.; He, W.-J.; Chen, Z.-Q.; Xu, Y.-H.; Tang, D.; Wang, S.-M. Metabolic Profiling of Carbonyl Compounds for Unveiling Protective Mechanisms of Pueraria lobata against Diabetic Nephropathy by UPLC-Q-Orbitrap HRMS/MS Analysis. J. Agric. Food Chem. 2021, 69, 10943–10951. [Google Scholar] [CrossRef]
- Yang, L.; Chen, J.; Lu, H.; Lai, J.; He, Y.; Liu, S.; Guo, X. Pueraria lobatafor Diabetes Mellitus: Past, Present and Future. Am. J. Chin. Med. 2019, 47, 1419–1444. [Google Scholar] [CrossRef]
- She, S.; Liu, W.; Li, T.; Hong, Y. Effects of puerarin in STZ-induced diabetic rats by oxidative stress and the TGF-β1/Smad2 pathway. Food Funct. 2014, 5, 944–950. [Google Scholar] [CrossRef]
- Sun, R.; Deng, X.; Zhang, D.; Xie, F.; Wang, D.; Wang, J.; Tavallaie, M.S.; Jiang, F.; Fu, L. Anti-diabetic potential of Pueraria lobata root extract through promoting insulin signaling by PTP1B inhibition. Bioorg. Chem. 2019, 87, 12–15. [Google Scholar] [CrossRef] [PubMed]
- Jonas, J.C.; Plant, T.D.; Gilon, P.; Detimary, P.; Nenquin, M.; Henquin, J.C. Multiple effects and stimulation of insulin secretion by the tyrosine kinase inhibitor genistein in normal mouse islets. Br. J. Pharmacol. 2012, 114, 872–880. [Google Scholar] [CrossRef] [PubMed]
- Klaman, L.D.; Boss, O.; Peroni, O.D.; Kim, J.K.; Martino, J.L.; Zabolotny, J.M.; Moghal, N.; Lubkin, M.; Kim, Y.B.; Sharpe, A.H.; et al. Increased energy expenditure, decreased adiposity, and tissue-specific insulin sensitivity in protein-tyrosine phosphatase 1B-deficient mice. Mol. Cell. Biol. 2020, 20, 5479–5489. [Google Scholar] [CrossRef]
- Goldstein, B.J.; Bittner-Kowalczyk, A.; White, M.F.; Harbeck, M. Tyrosine dephosphorylation and deactivation of insulin receptor substrate-1 by protein-tyrosine phosphatase 1B. Possible facilitation by the formation of a ternary complex with the Grb2 adaptor protein. J. Biol. Chem. 2020, 275, 4283–4289. [Google Scholar] [CrossRef]
- Agouni, A.; Tual-Chalot, S.; Chalopin, M.; Duluc, L.; Mody, N.; Martinez, M.C.; Andriantsitohaina, R.; Delibegović, M. Hepatic protein tyrosine phosphatase 1B (PTP1B) deficiency protects against obesity-induced endothelial dysfunction. Biochem. Pharmacol. 2014, 92, 607–617. [Google Scholar] [CrossRef] [PubMed]
- Vakili, S.; Ebrahimi, S.S.S.; Sadeghi, A.; Gorgani-Firuzjaee, S.; Beigy, M.; Pasalar, P.; Meshkani, R. Hydrodynamic-based delivery of PTP1B shRNA reduces plasma glucose levels in diabetic mice. Mol. Med. Rep. 2013, 7, 211–216. [Google Scholar] [CrossRef] [PubMed]
- Liu, R.; Mathieu, C.; Berthelet, J.; Zhang, W.; Dupret, J.-M.; Rodrigues Lima, F. Human Protein Tyrosine Phosphatase 1B (PTP1B): From Structure to Clinical Inhibitor Perspectives. Int. J. Mol. Sci. 2022, 23, 7027. [Google Scholar] [CrossRef] [PubMed]
- Zhang, H.; Wei, Z.; Tong, Y.; Song, X.; Li, S.; Sun, Y.; Liu, C.; Han, F.; Yu, J. Spectrum-effect relationship study to reveal the pharmacodynamic substances in Flos Puerariae-Semen Hoveniae medicine pair for the treatment of alcohol-induced liver damage. J. Ethnopharmacol. 2023, 314, 116628. [Google Scholar] [CrossRef]
- Baskaran, S.K.; Goswami, N.; Selvaraj, S.; Muthusamy, V.S.; Lakshmi, B.S. Molecular Dynamics Approach to Probe the Allosteric Inhibition of PTP1B by Chlorogenic and Cichoric Acid. J. Chem. Inf. Model. 2012, 52, 2004–2012. [Google Scholar] [CrossRef]


 represent hydrogen bonds;
  represent salt bridge;
  represent π–π stacking.
represent hydrogen bonds; represent salt bridge; represent π–π stacking.
represent π–π stacking.
represent hydrogen bonds; represent salt bridge; represent π–π stacking.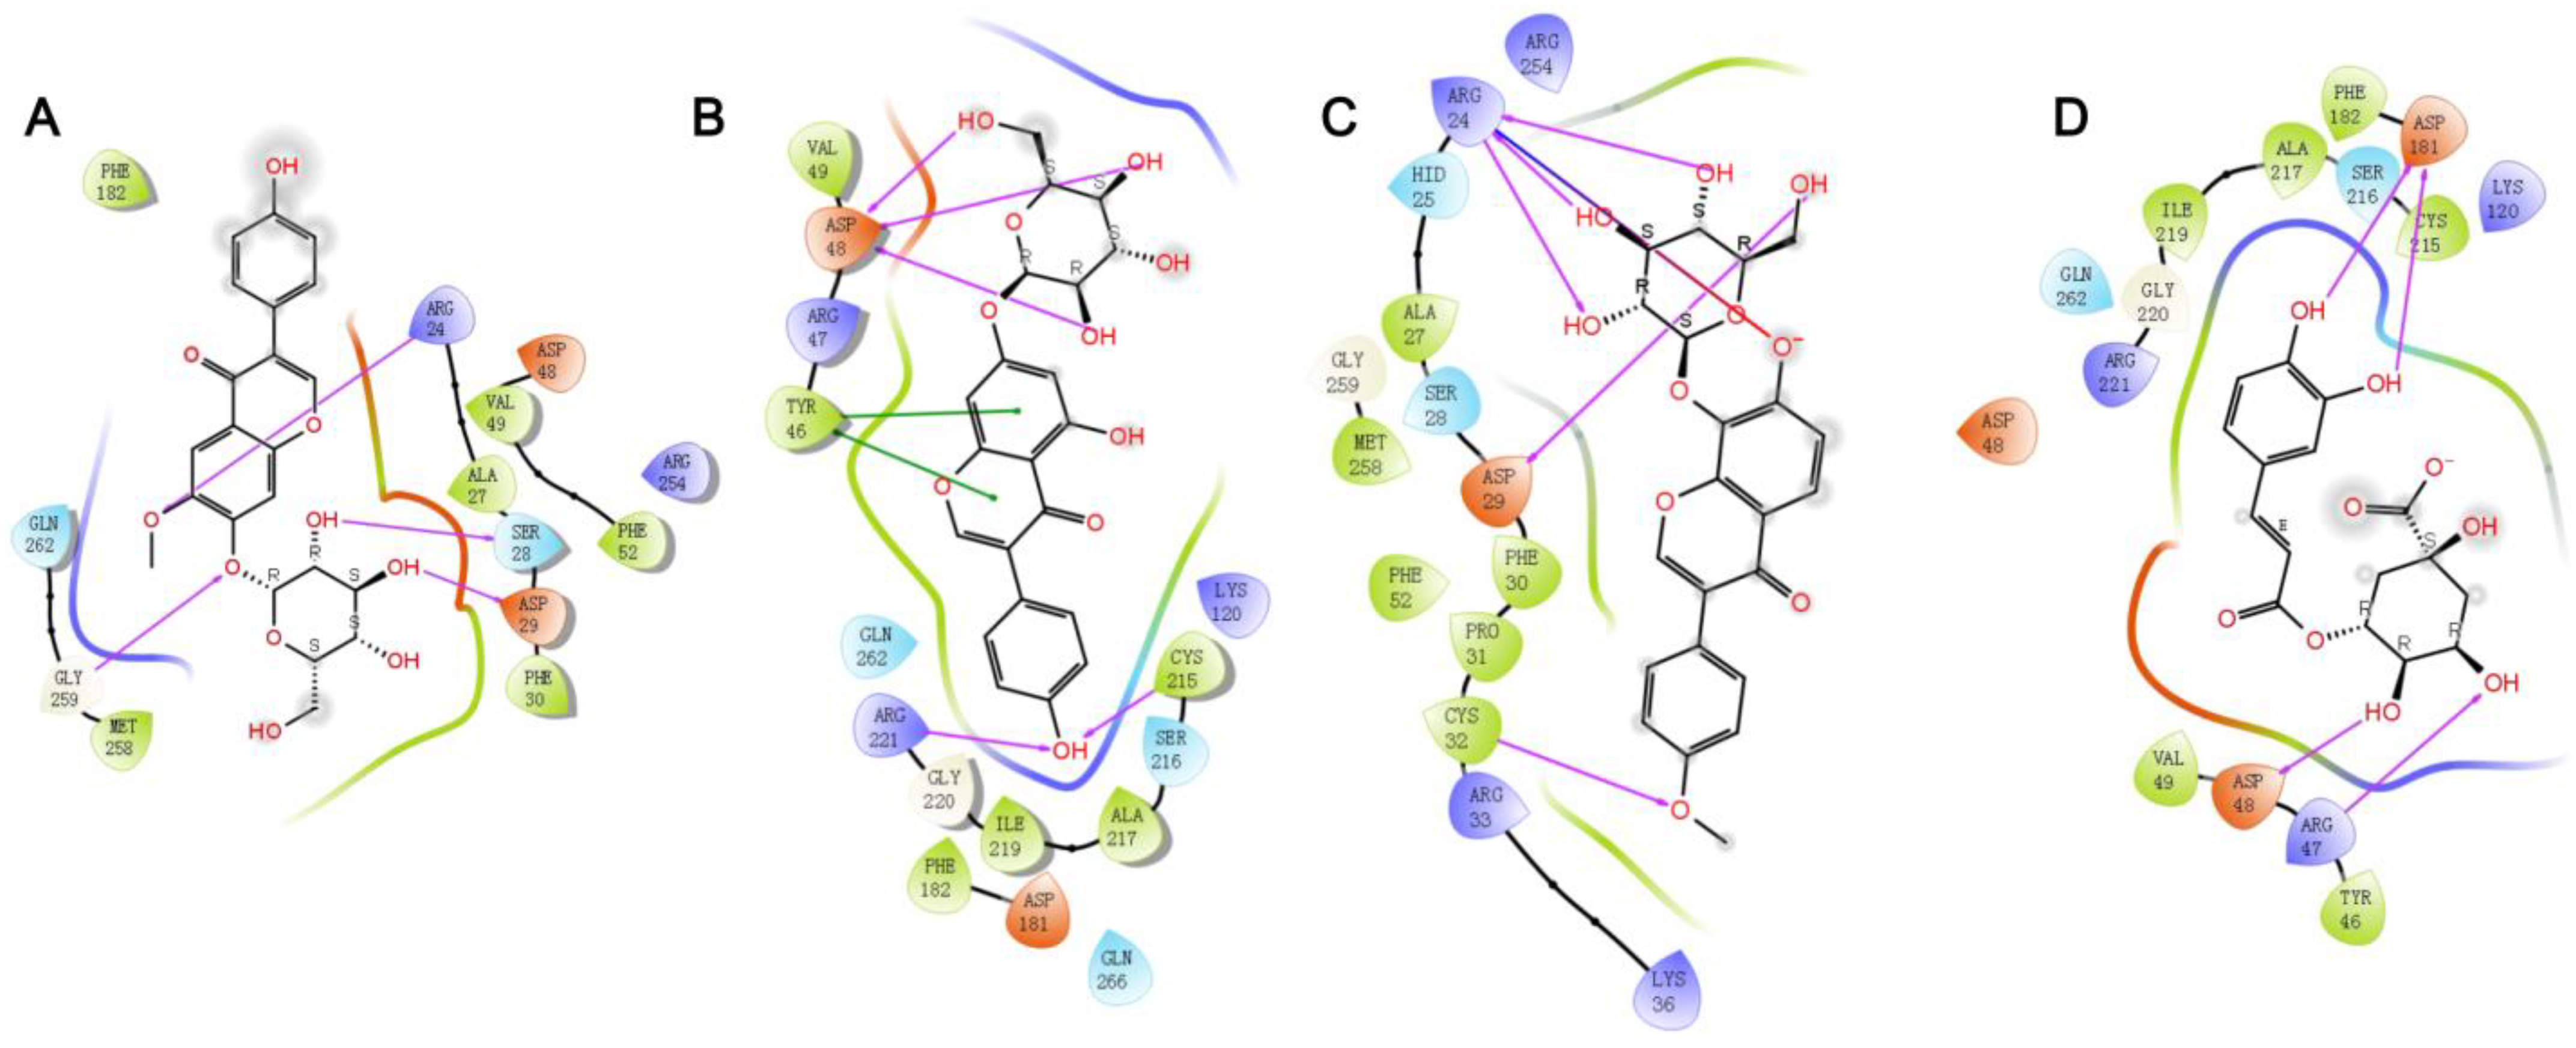

| Sample No. | Origin | Longitude and Latitude | Similarity |
|---|---|---|---|
| S1 | Liuan, Anhui Province, China | 116.53 east, 32.01 north | 0.959 |
| S2 | Anqing, Anhui Province, China | 116.50 east, 30.20 north | 0.955 |
| S3 | Tongling, Anhui Province, China | 117.61 east, 30.89 north | 0.969 |
| S4 | Nanyang, Henan Province, China | 112.39 east, 32.96 north | 0.981 |
| S5 | Pingdingshan, Henan Province, China | 113.24 east, 33.56 north | 0.987 |
| S6 | Liuan, Anhui Province, China | 116.28 east, 32.06 north | 0.966 |
| S7 | Luohe, Henan Province, China | 113.77 east, 33.61 north | 0.962 |
| S8 | Huaibei, Anhui Province, China | 116.71 east, 33.91 north | 0.963 |
| S9 | Fuyang, Anhui Province, China | 116.13 east, 32.75 north | 0.978 |
| S10 | Anqing, Anhui Province, China | 116.26 east, 30.31 north | 0.961 |
| S11 | Xinyang, Henan Province, China | 114.50 east, 31.83 north | 0.888 |
| S12 | Nanyang, Henan Province, China | 112.77 east, 32.90 north | 0.946 |
Disclaimer/Publisher’s Note: The statements, opinions and data contained in all publications are solely those of the individual author(s) and contributor(s) and not of MDPI and/or the editor(s). MDPI and/or the editor(s) disclaim responsibility for any injury to people or property resulting from any ideas, methods, instructions or products referred to in the content. |
© 2024 by the authors. Licensee MDPI, Basel, Switzerland. This article is an open access article distributed under the terms and conditions of the Creative Commons Attribution (CC BY) license (https://creativecommons.org/licenses/by/4.0/).
Share and Cite
Zhang, Y.; Liu, H.; Lv, T.; Xiao, M.; Gao, G. Protein Tyrosine Phosphatase 1B Inhibitors of Pueraria lobata Based on the Spectrum–Effect Relationship by Q-Marker Selection. Molecules 2024, 29, 2731. https://doi.org/10.3390/molecules29122731
Zhang Y, Liu H, Lv T, Xiao M, Gao G. Protein Tyrosine Phosphatase 1B Inhibitors of Pueraria lobata Based on the Spectrum–Effect Relationship by Q-Marker Selection. Molecules. 2024; 29(12):2731. https://doi.org/10.3390/molecules29122731
Chicago/Turabian StyleZhang, Yong, Haipeng Liu, Tianci Lv, Mengqian Xiao, and Guihua Gao. 2024. "Protein Tyrosine Phosphatase 1B Inhibitors of Pueraria lobata Based on the Spectrum–Effect Relationship by Q-Marker Selection" Molecules 29, no. 12: 2731. https://doi.org/10.3390/molecules29122731