


The Use of Various Types of Waste Paper for the Removal of Anionic and Cationic Dyes from Aqueous Solutions

 , , , and
Abstract

1. Introduction
2. Results and Discussion
2.1. Characterization of the Tested Sorbents (FTIR Analysis, Specific Surface Area, SEM Analysis)
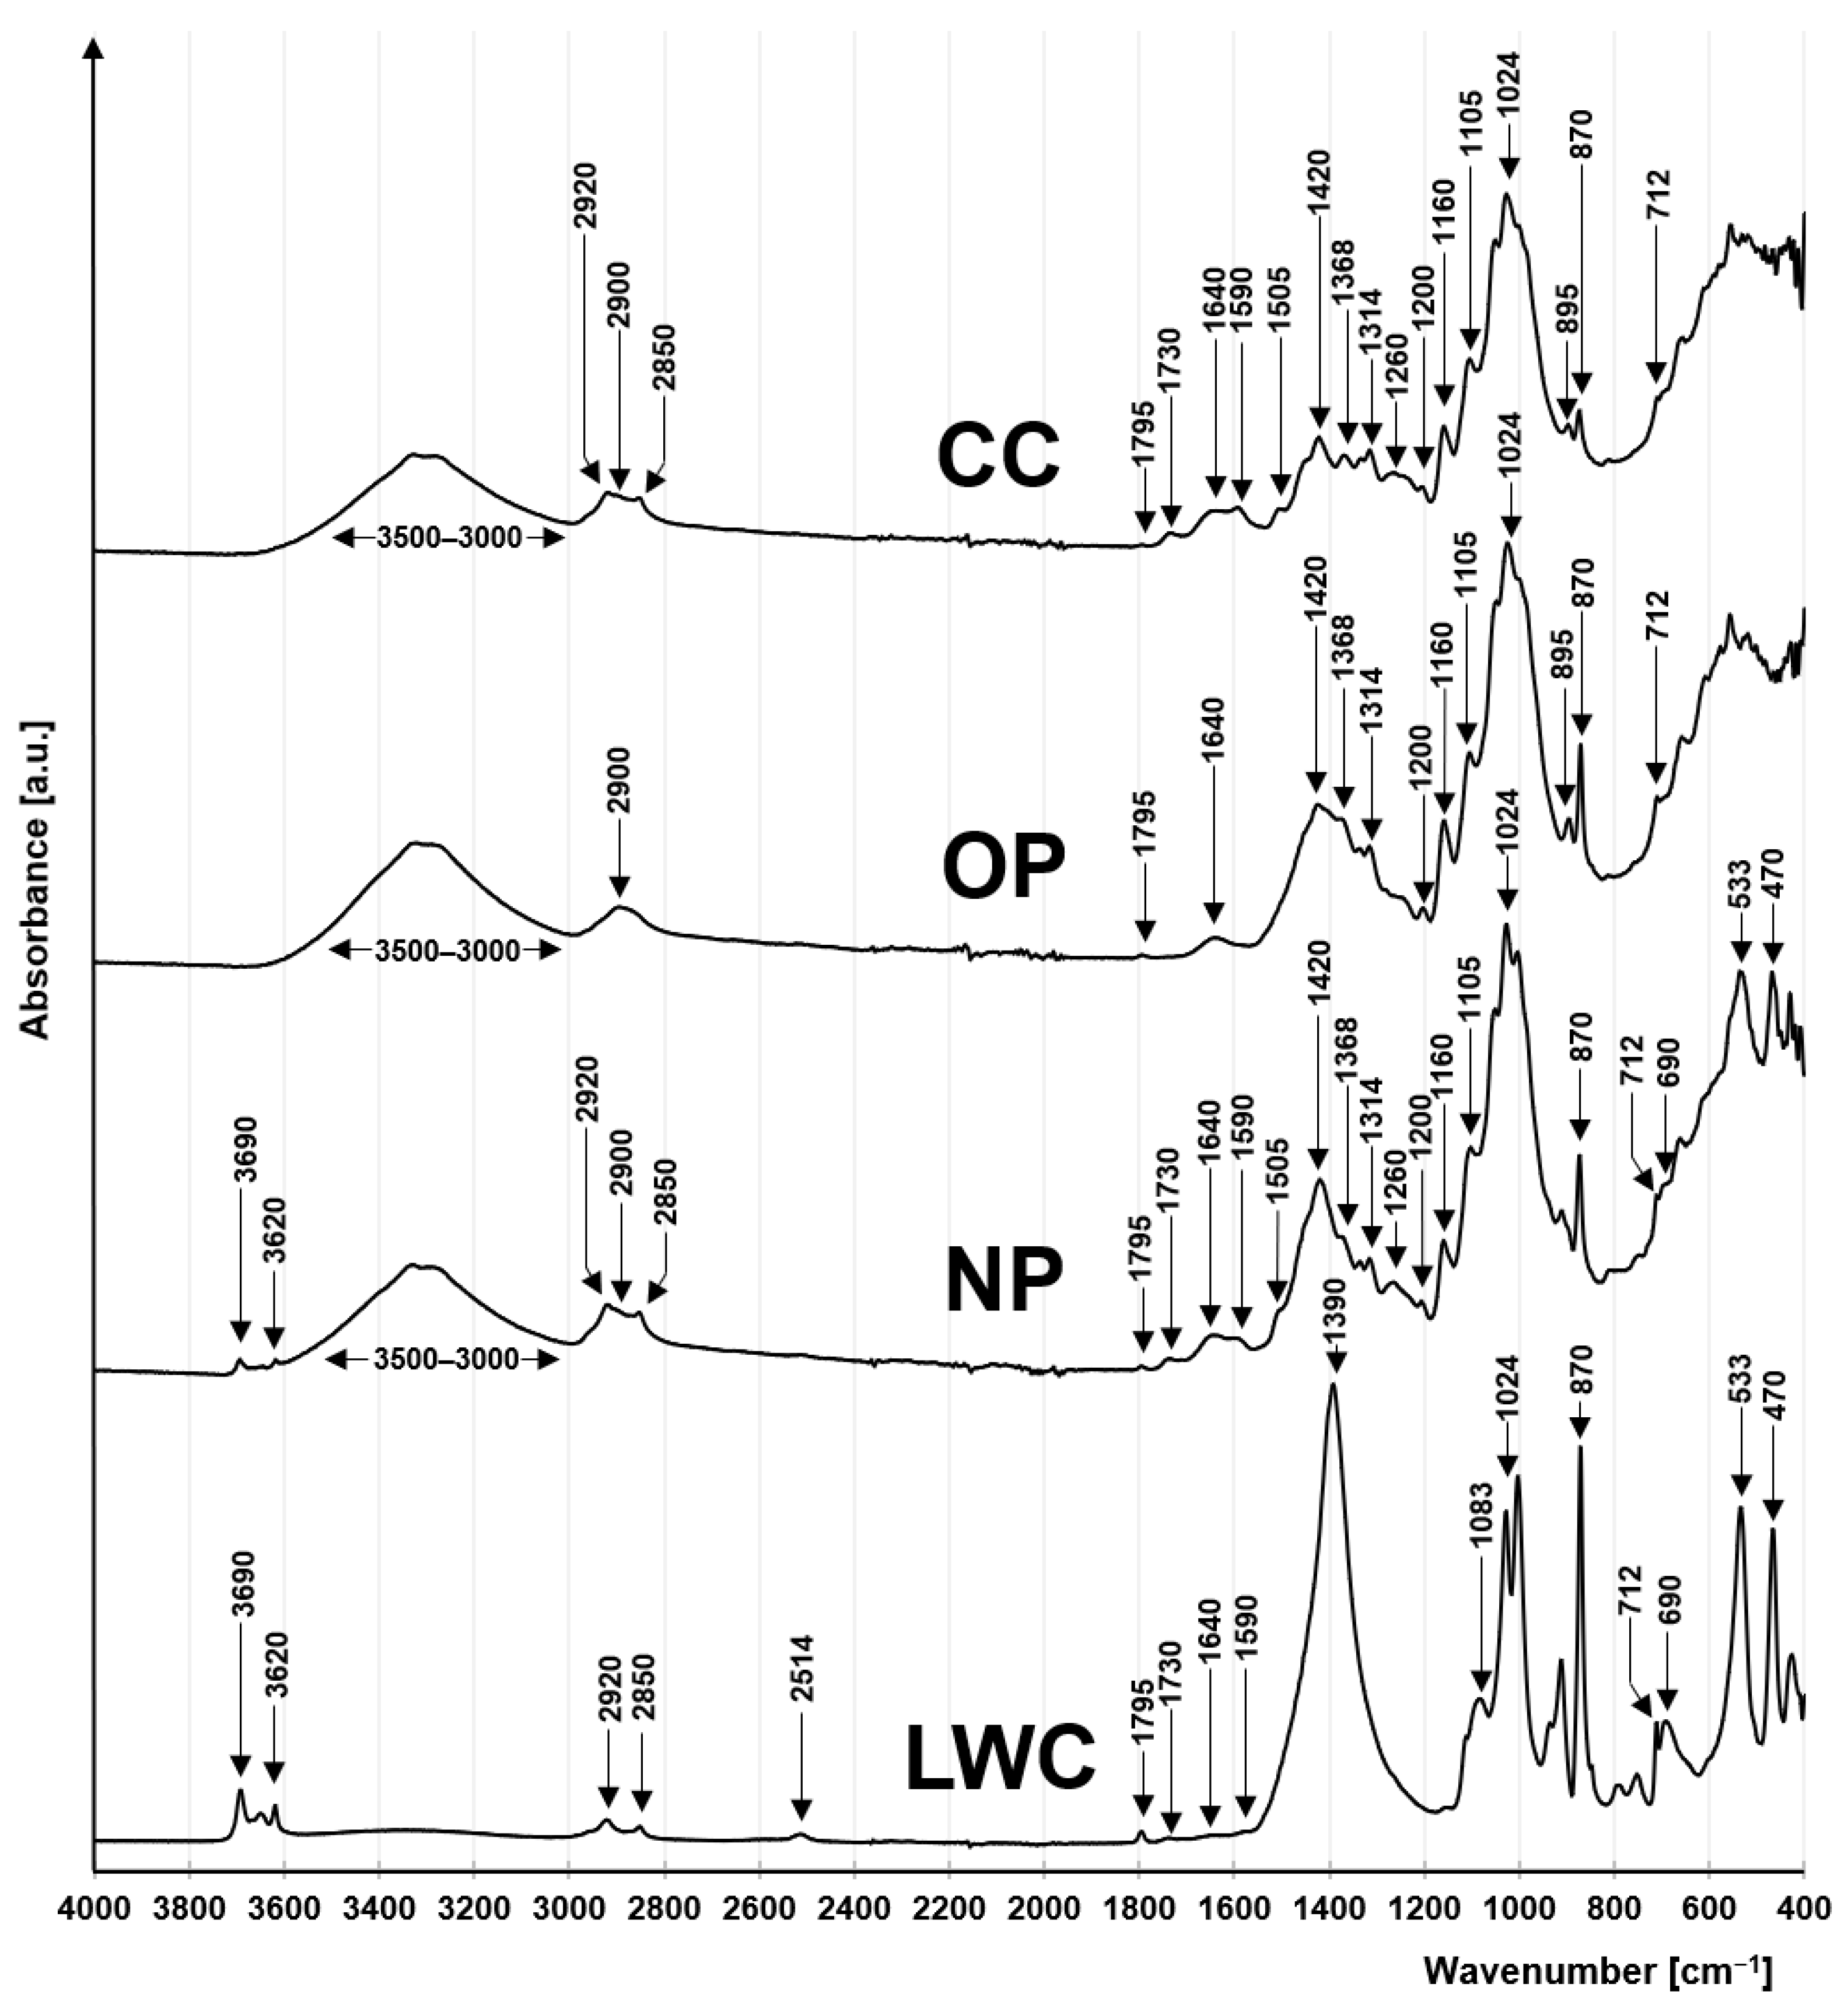
2.1.1. FTIR Analysis
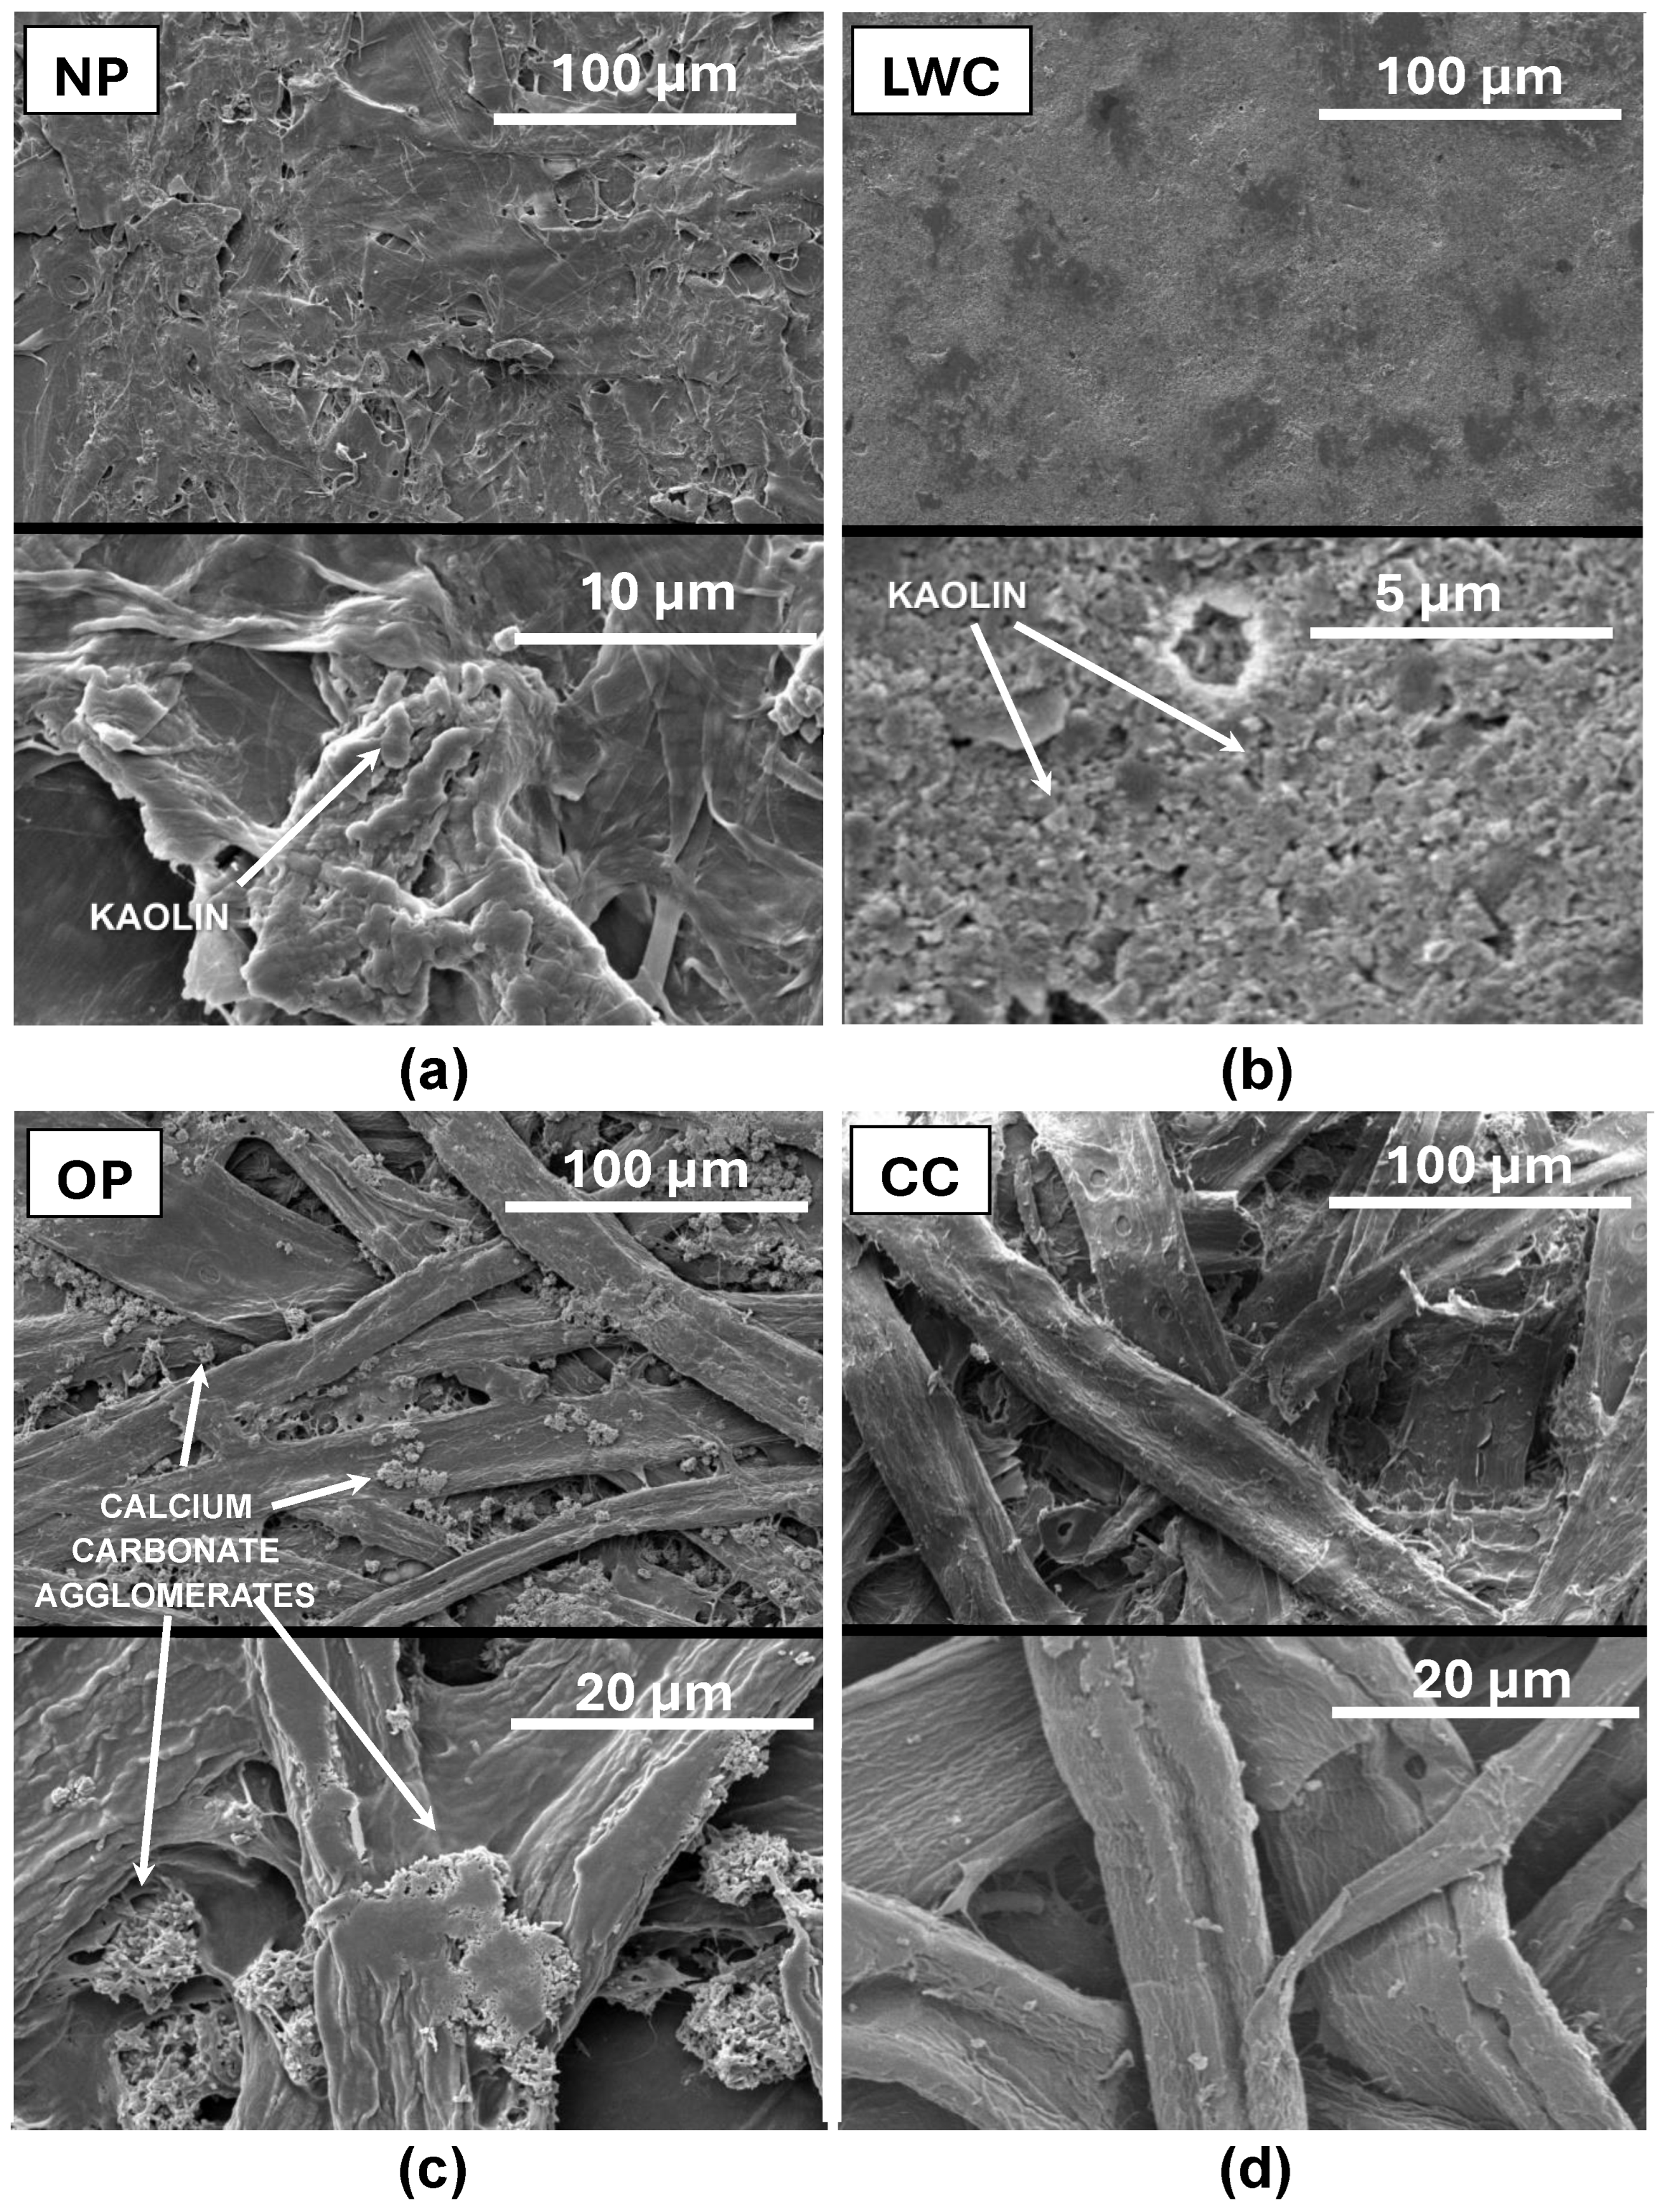
2.1.2. SEM Analysis
2.1.3. Analysis of Specific Surface Area and Porosity
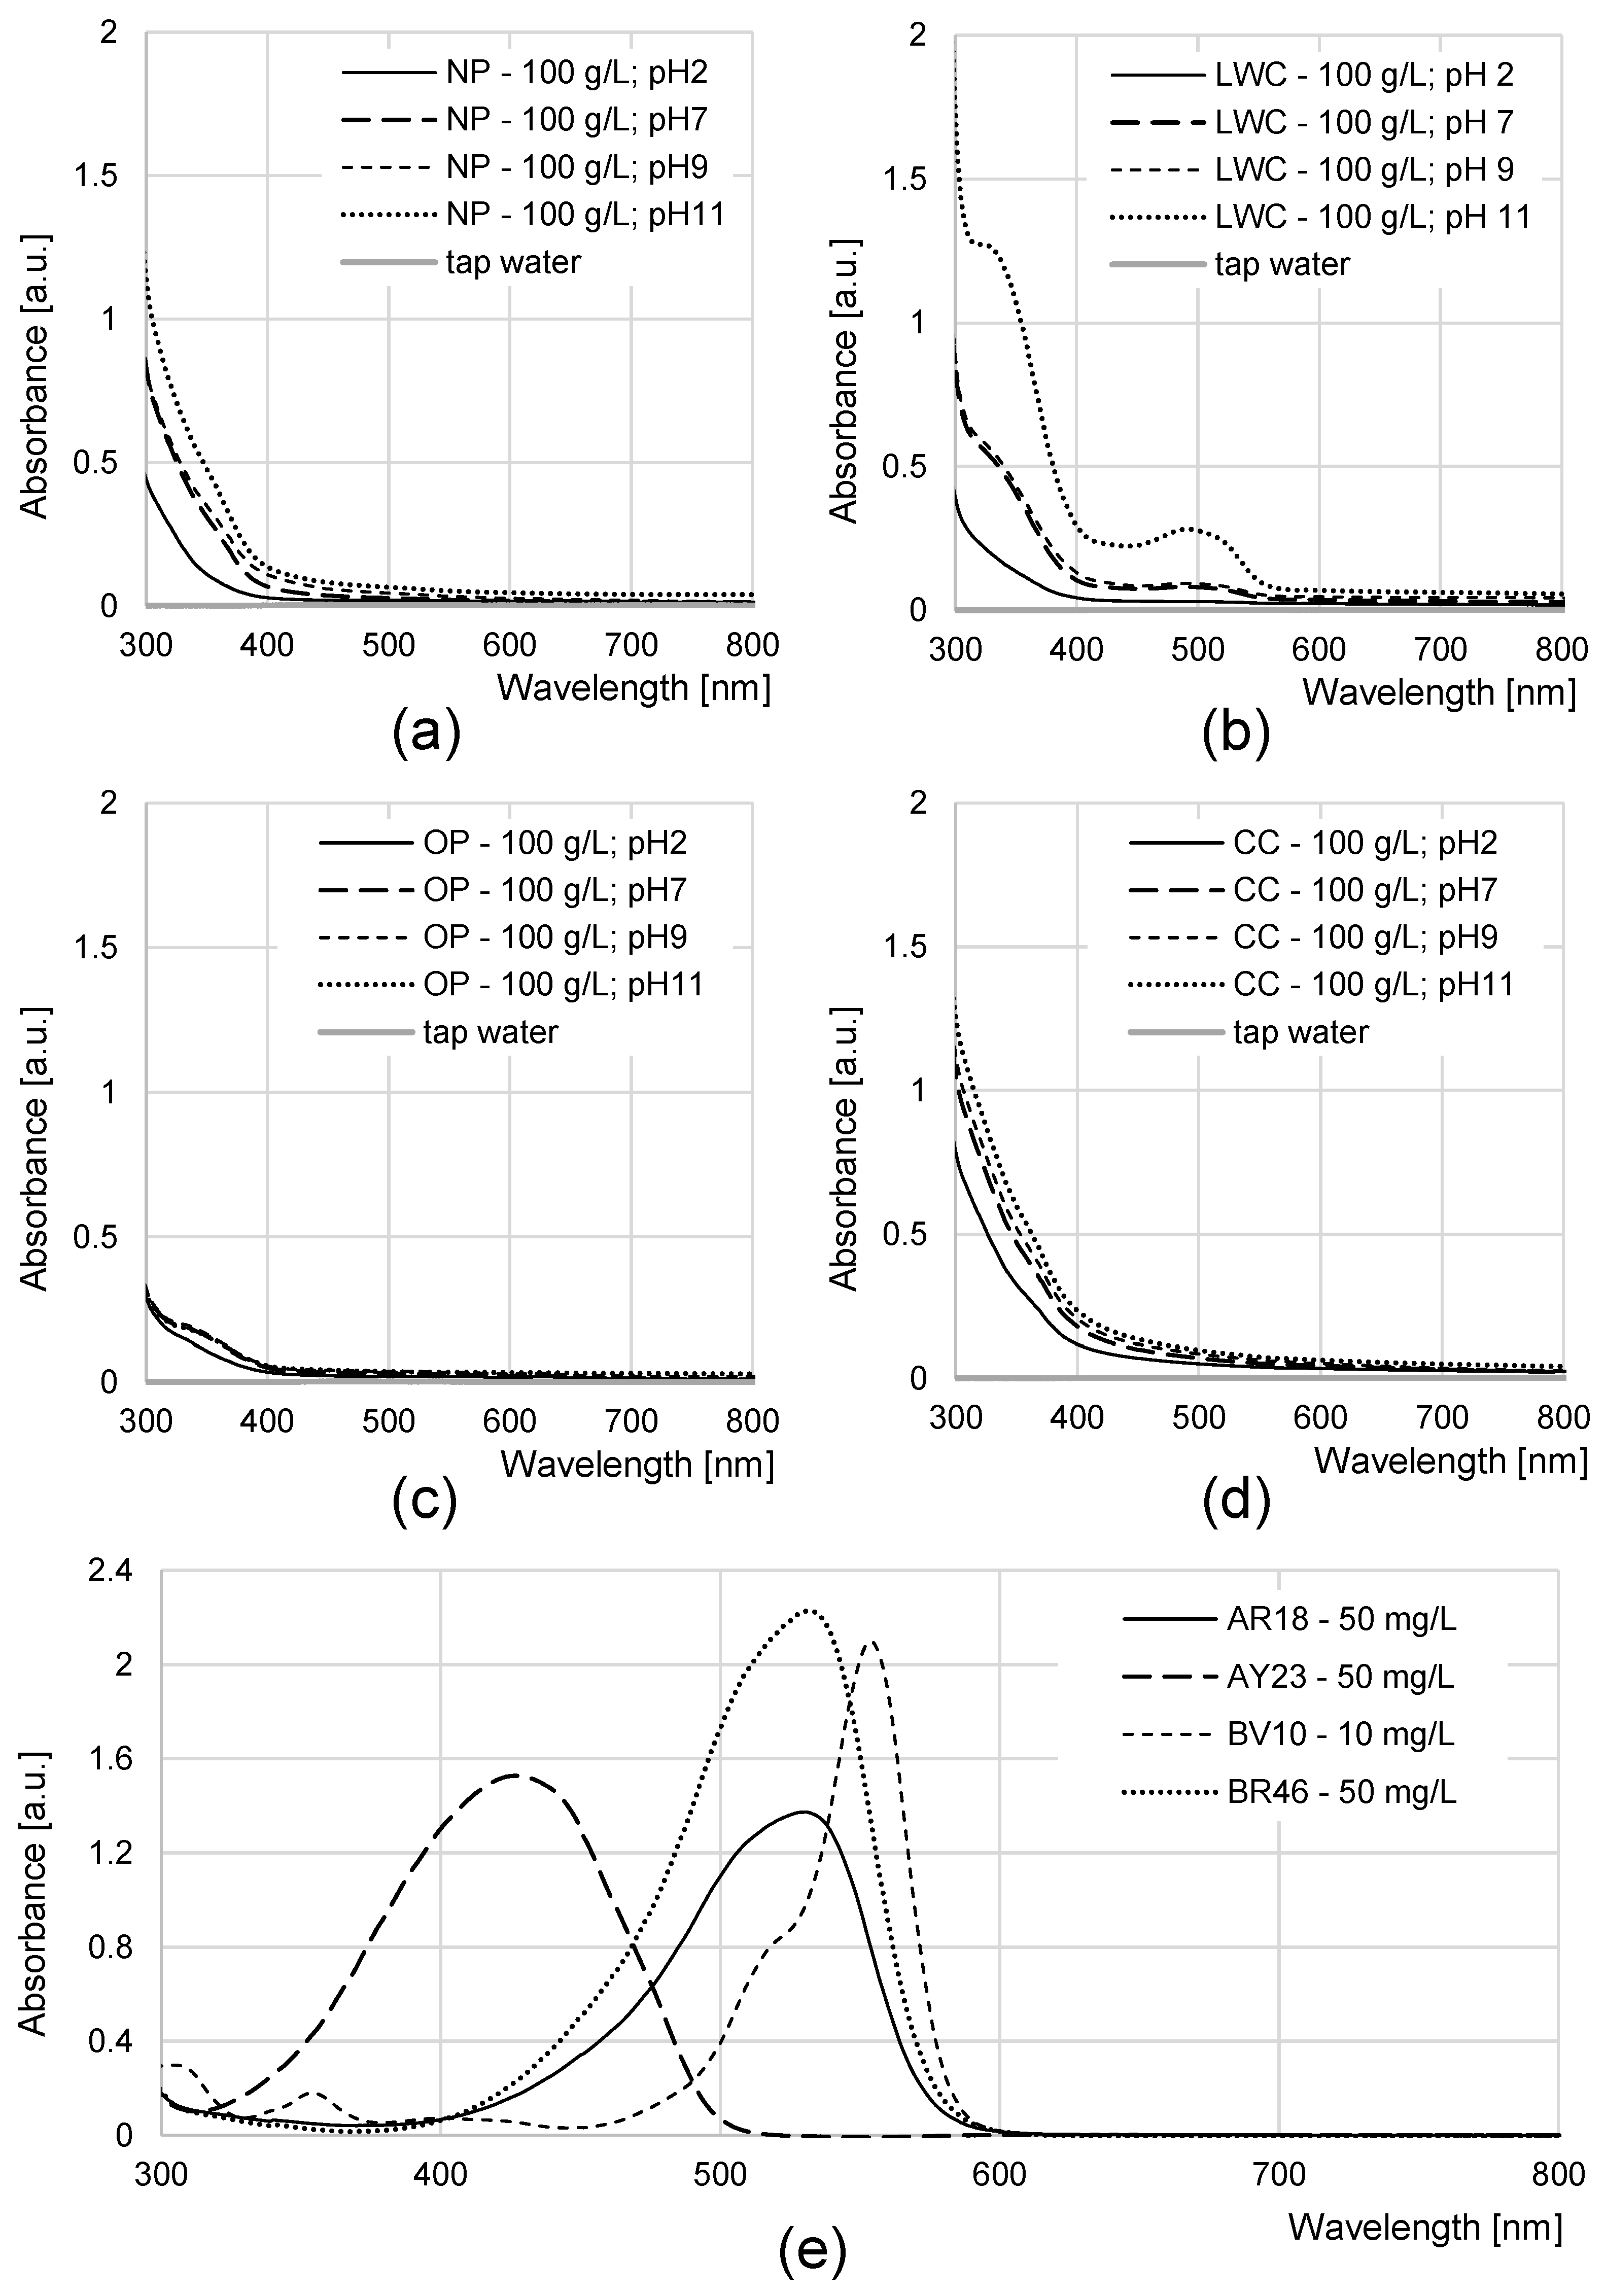
2.2. Effectiveness of Aqueous Solution Coloration by NP, LWC, OP, and CC
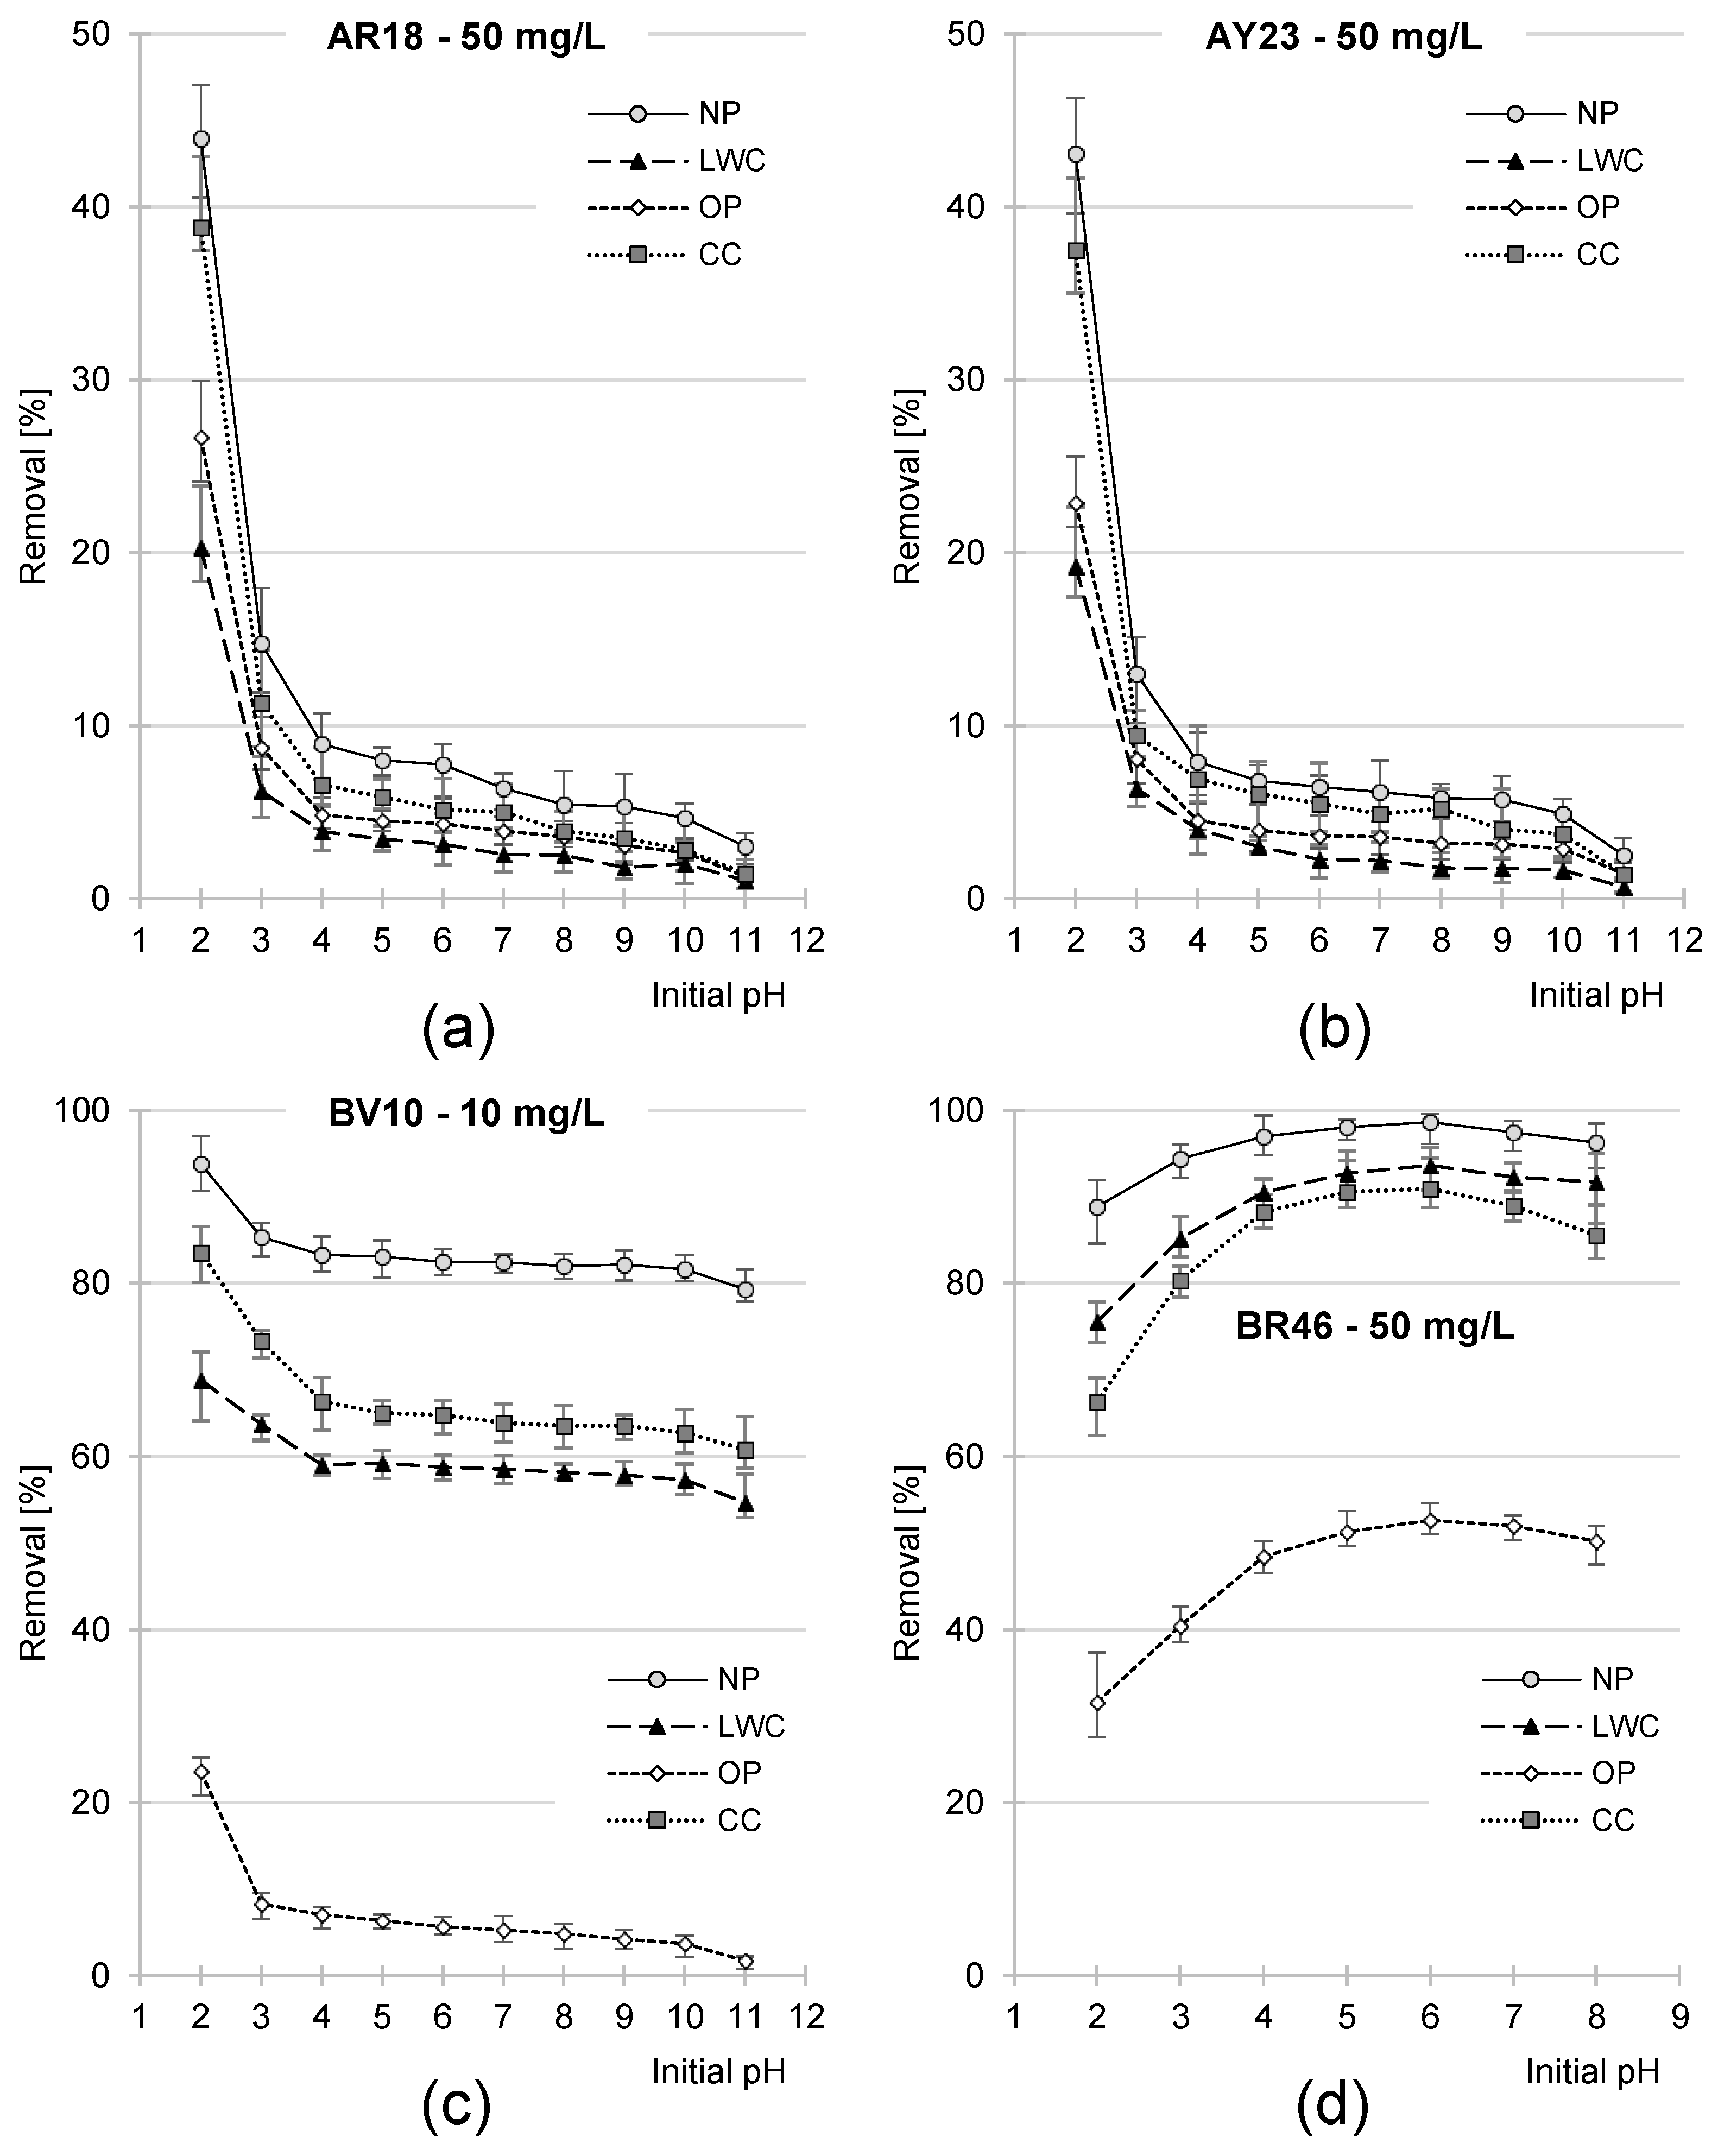
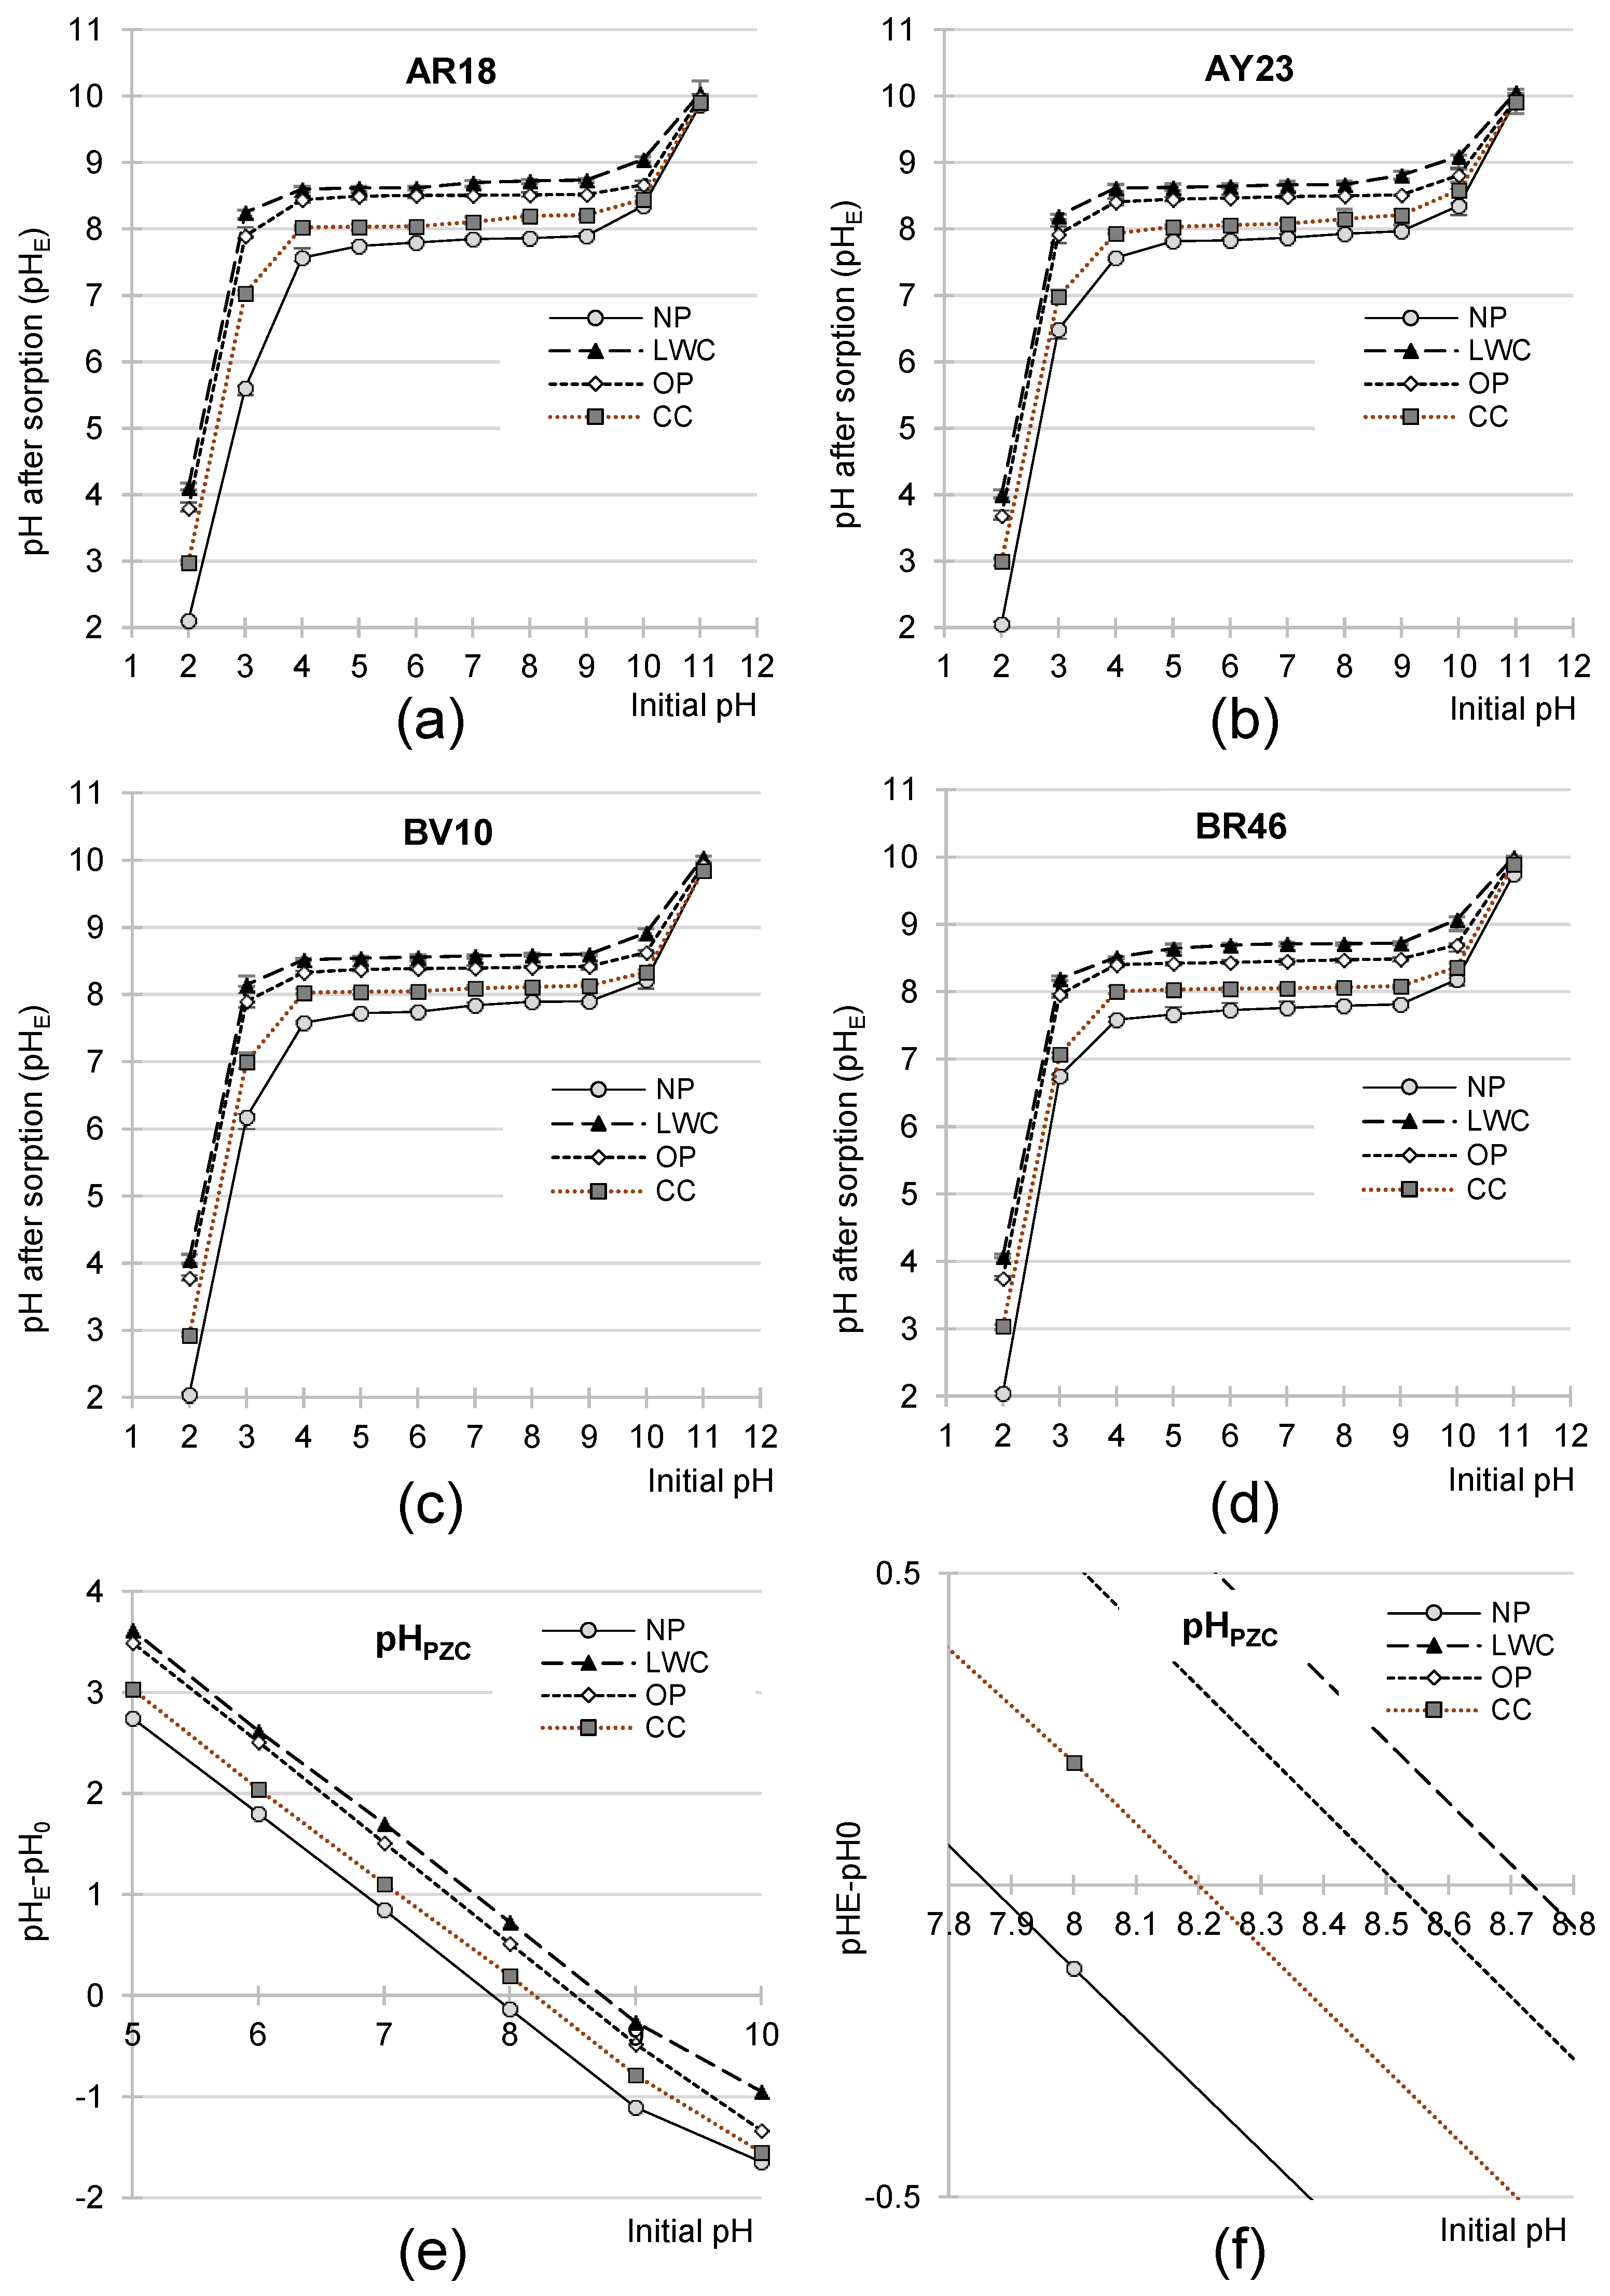
2.3. Effect of pH on the Effectiveness of Dye Sorption on NP, LWC, OP, and CC
2.4. Kinetics of Dye Sorption on NP, LWC, OP, and CC
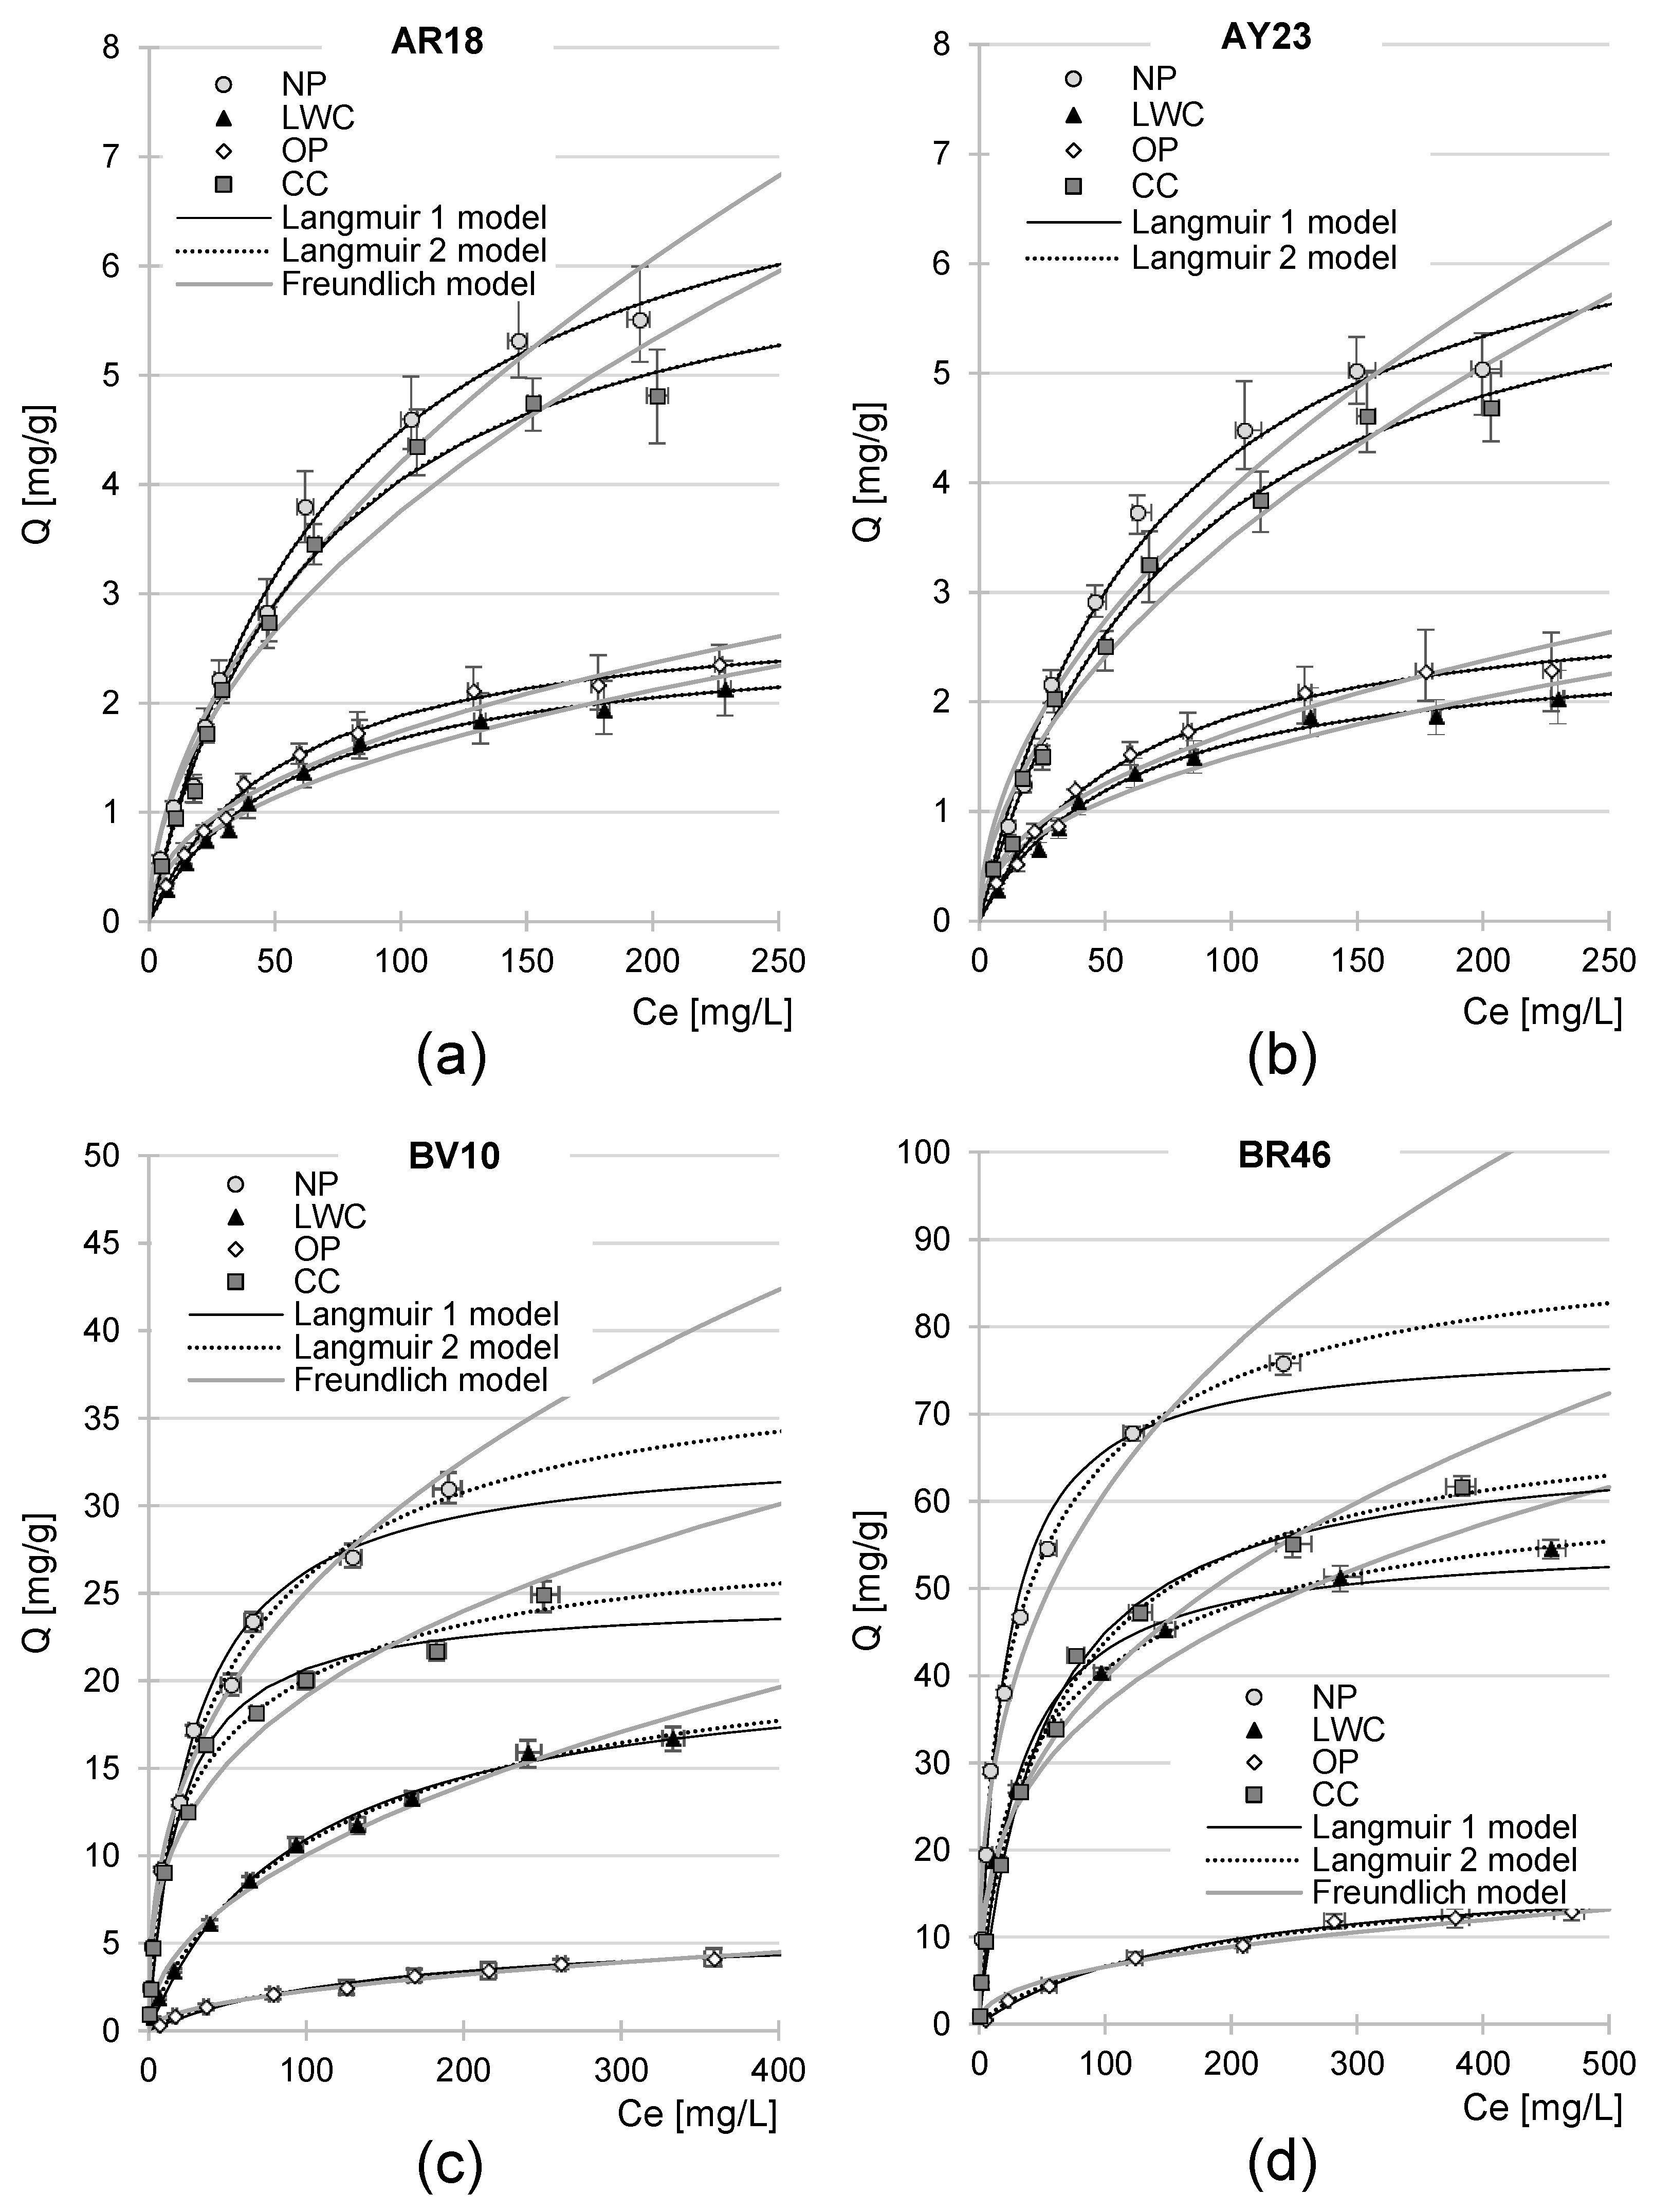
2.5. Maximum Sorption Capacity of NP, LWC, OP, and CC
3. Materials
3.1. Analyzed Types of Waste Paper
3.2. Dyes
3.3. Chemical Reagents
- Hydrochloric acid (HCl)—37%—(solution pH correction);
- Sodium hydroxide (NaOH) > 99.9%—micropellets—(solution pH correction);
- Acetone (C3H6O, >99.5%)—cleaning the diamond crystal in the ATR attachment of the spectrometer;
- Buffer solutions (pH 4 ± 0.05/pH 7 ± 0.05/pH 10 ± 0.05)—calibration of the pH meter.
- All the chemical reagents used were purchased from POCH S.A., Gliwice, Poland, and were of p.a. (analytical purity) grade or higher.
3.4. Laboratory Equipment
- HI 110 pH meter (HANNA Instruments, Olsztyn, Poland)—for the measurement and correction of pH solutions;
- Laboratory shaker SK-71 (JEIO TECH, Daejeon, Republic of Korea)—for the sorption process;
- Multi-Channel Stirrer MS-53M (JEIO TECH, Daejeon, Republic of Korea)—for dye sorption analyses;
- UV-3100 PC spectrophotometer (VWR spectrophotometers, VWR International LLC., Mississauga, ON, Canada)—for determination of the concentration of dye in solutions;
- FT/IR-4700LE FT-IR Spectrometer with single reflection ATR attachment (JASCO International, Tokyo, Japan)—for the preparation of sorbent FTIR spectra;
- ASAP 2020 (Micromeritics, Norcross, GA, USA)—for measurements of porosity and surface area of the sorbent;
- Quanta 200 Scanning Electron Microscope (FEI, Eindhoven, The Netherlands) —for taking images of the sorbent surface morphology.
4. Methods
4.1. Preparation of Sorbents
4.2. Determination of the Coloration Effectiveness of Aqueous Solutions by the Tested Sorbents
4.3. Determination of pH Effect on Dye Sorption Effectiveness
4.4. Determination of Dye Sorption Kinetics
4.5. Determination of the Maximum Sorption Capacity of the Tested Sorbents
Comments to Section 4.3, Section 4.4 and Section 4.5
- Each sorbent (NP, LWC, OP, and CC) was tested with respect to 4 dyes (AR18, AY23, BV10, and BR46).
- All dye solutions were prepared based on deionized water.
- All experimental series were performed in three replications.
- Portions of sorbents were weighed on a precise scale with an accuracy of 0.001 g.
- The mixing parameters set on the shaker or multi-channel mixer ensured sorbent mixing throughout the entire solution’s volume.
- Concentrations of dyes left in the solution were determined with the spectrophotometric method, using a UV-VIS spectrophotometer with a cuvette with an optical path length of 10 mm.
- Calibration curves plotted for AR18, AY23, and BR46 dyes enabled determinations in the solution concentration range of 0–50 mg/L, whereas the curve plotted for BV10 allowed for determinations in the solution concentration range of 0–10 mg/L. Solutions with higher concentrations were diluted with deionized water.
- In the case of the analyses conducted in Section 4.3, Section 4.4 and Section 4.5, additional experimental series without dye were performed for each tested sorbent. Aqueous solutions obtained in this way were used to calibrate the spectrophotometer before dye concentration analysis. This procedure enabled the elimination of measurement errors triggered by putative colored contaminants released to the solutions from the waste paper materials.
- The air temperature in the laboratory was kept stable at 25 °C throughout the course of the analyses.
4.6. FTIR Analysis, SEM Analysis, and Determination of Specific Surface Area and Porosity of the Tested Sorbents
4.7. Computation Methods
- QS—mass of sorbed dye [mg/g];
- C0—initial concentration of dye [mg/L];
- CS—concentration of dye after sorption [mg/L];
- V—volume of the solution [L];
- m—mass of the sorbent [g].
- q—instantaneous value of sorbed dye [mg/g];
- qe—the amount of dye sorbed at the equilibrium state [mg/g];
- t—time of sorption [min];
- k1—pseudo-first-order adsorption rate constant [1/min];
- k2—pseudo-second-order adsorption rate constant [g/(mg × min)];
- kid—intraparticular diffusion model adsorption rate constant [mg/(g × min0.5)].
- Q—mass of sorbed dye [mg/g];
- Qmax—maximum sorption capacity in Langmuir equation [mg/g];
- b1—maximum sorption capacity of sorbent (type I active sites) [mg/g];
- b2—maximum sorption capacity of sorbent (type II active sites) [mg/g];
- KC—constant in Langmuir equation [L/mg];
- K1,K2—constants in Langmuir 2 equation [L/mg];
- K—the equilibrium sorption constant in the Freundlich model;
- n—Freundlich equilibrium constant;
- C—concentration of the dye remaining in the solution [mg/L].
5. Conclusions
Supplementary Materials
Author Contributions
Funding
Institutional Review Board Statement
Informed Consent Statement
Data Availability Statement
Conflicts of Interest
References
- Kumar, A.; Dixit, U.; Singh, K.; Gupta, S.P.; Beg, M.S.J.; Kumar, A.; Dixit, U.; Singh, K.; Gupta, S.P.; Beg, M.S.J. Structure and Properties of Dyes and Pigments. Dyes Pigment. Novel Appl. Waste Treat. 2021, 11, 131. [Google Scholar] [CrossRef]
- Tripathi, M.; Singh, S.; Pathak, S.; Kasaudhan, J.; Mishra, A.; Bala, S.; Garg, D.; Singh, R.; Singh, P.; Singh, P.K.; et al. Recent Strategies for the Remediation of Textile Dyes from Wastewater: A Systematic Review. Toxics 2023, 11, 940. [Google Scholar] [CrossRef]
- Ryu, S.; Park, Y.K.; Shim, J.; Lim, S.; Kim, M. Highly Sustainable Dyes Adsorption in Wastewater Using Textile Filters Fabricated by UV Irradiation. Polymers 2024, 16, 15. [Google Scholar] [CrossRef]
- Garg, A.; Chopra, L. Dye Waste: A Significant Environmental Hazard. Mater. Today Proc. 2022, 48, 1310–1315. [Google Scholar] [CrossRef]
- Al-Tohamy, R.; Ali, S.S.; Li, F.; Okasha, K.M.; Mahmoud, Y.A.G.; Elsamahy, T.; Jiao, H.; Fu, Y.; Sun, J. A Critical Review on the Treatment of Dye-Containing Wastewater: Ecotoxicological and Health Concerns of Textile Dyes and Possible Remediation Approaches for Environmental Safety. Ecotoxicol. Environ. Saf. 2022, 231, 113160. [Google Scholar] [CrossRef] [PubMed]
- Liu, Y.; Li, C.; Bao, J.; Wang, X.; Yu, W.; Shao, L. Degradation of Azo Dyes with Different Functional Groups in Simulated Wastewater by Electrocoagulation. Water 2022, 14, 123. [Google Scholar] [CrossRef]
- Lellis, B.; Fávaro-Polonio, C.Z.; Pamphile, J.A.; Polonio, J.C. Effects of Textile Dyes on Health and the Environment and Bioremediation Potential of Living Organisms. Biotechnol. Res. Innov. 2019, 3, 275–290. [Google Scholar] [CrossRef]
- Alguacil, F.J.; López, F.A. Organic Dyes versus Adsorption Processing. Molecules 2021, 26, 5440. [Google Scholar] [CrossRef] [PubMed]
- Nizam, N.U.M.; Hanafiah, M.M.; Mahmoudi, E.; Halim, A.A.; Mohammad, A.W. The Removal of Anionic and Cationic Dyes from an Aqueous Solution Using Biomass-Based Activated Carbon. Sci. Rep. 2021, 11, 8623. [Google Scholar] [CrossRef]
- Husien, S.; El-taweel, R.M.; Salim, A.I.; Fahim, I.S.; Said, L.A.; Radwan, A.G. Review of Activated Carbon Adsorbent Material for Textile Dyes Removal: Preparation, and Modelling. Curr. Res. Green Sustain. Chem. 2022, 5, 100325. [Google Scholar] [CrossRef]
- Mpongwana, N.; Rathilal, S. A Review of the Techno-Economic Feasibility of Nanoparticle Application for Wastewater Treatment. Water 2022, 14, 1550. [Google Scholar] [CrossRef]
- Xie, L.Q.; Jiang, X.Y.; Yu, J.G. A Novel Low-Cost Bio-Sorbent Prepared from Crisp Persimmon Peel by Low-Temperature Pyrolysis for Adsorption of Organic Dyes. Molecules 2022, 27, 5160. [Google Scholar] [CrossRef] [PubMed]
- Miros-Kudra, P.; Sobczak, P.; Gzyra-Jagieła, K.; Ciepliński, M. Removal of Zinc Ions from Aqueous Solutions with the Use of Lignin and Biomass Part II. Fibres Text. East. Eur. 2023, 31, 11–25. [Google Scholar] [CrossRef]
- Miros-Kudra, P.; Sobczak, P.; Kopania, E. Removal of Heavy Metals from Aqueous Solutions with the Use of Lignins and Biomass. Fibres Text. East. Eur. 2022, 30, 99–111. [Google Scholar] [CrossRef]
- Senila, M.; Börklü Budak, T. Adsorption of Basic Yellow 28 and Basic Blue 3 Dyes from Aqueous Solution Using Silybum Marianum Stem as a Low-Cost Adsorbent. Molecules 2023, 28, 6639. [Google Scholar] [CrossRef]
- Bourechech, Z.; Seghier, A.; Mokhtar, A. Assessment of Physically Treated Banana Leaves as a Low-Cost and Eco-Friendly Adsorbent for Removal of a Textile Azo Dye. Biomass Convers. Biorefin. 2023, 13, 14241–14252. [Google Scholar] [CrossRef]
- Mosoarca, G.; Vancea, C.; Popa, S.; Dan, M.; Boran, S. The Use of Bilberry Leaves (Vaccinium myrtillus L.) as an Efficient Adsorbent for Cationic Dye Removal from Aqueous Solutions. Polymers 2022, 14, 978. [Google Scholar] [CrossRef] [PubMed]
- Jó´zwiak, T.J.; Filipkowska, U. The Use of Rapeseed Husks to Remove Acidic and Basic Dyes from Aquatic Solutions. Appl. Sci. 2024, 14, 1174. [Google Scholar] [CrossRef]
- Felista, M.M.; Wanyonyi, W.C.; Ongera, G. Adsorption of Anionic Dye (Reactive Black 5) Using Macadamia Seed Husks: Kinetics and Equilibrium Studies. Sci. Afr. 2020, 7, e00283. [Google Scholar] [CrossRef]
- Lazarova, S.; Tonev, R.; Dimitrova, S.; Dimova, G.; Mihailova, I. Valorization of Peanut and Walnut Shells through Utilisation as Biosorbents for the Removal of Textile Dyes from Water. Processes 2023, 11, 2291. [Google Scholar] [CrossRef]
- Shkliarenko, Y.; Halysh, V.; Nesterenko, A. Adsorptive Performance of Walnut Shells Modified with Urea and Surfactant for Cationic Dye Removal. Water 2023, 15, 1536. [Google Scholar] [CrossRef]
- Abu Hassan, N.H.; Adenan, N.H. Influence of Pre-Treated Local Fruit Peels in Remediating Dye Pollutant. Mater. Today Proc. 2023, 88, 10–14. [Google Scholar] [CrossRef]
- Tolkou, A.K.; Tsoutsa, E.K.; Kyzas, G.Z.; Katsoyiannis, I.A. Sustainable Use of Low-Cost Adsorbents Prepared from Waste Fruit Peels for the Removal of Selected Reactive and Basic Dyes Found in Wastewaters. Environ. Sci. Pollut. Res. Int. 2024, 31, 14662–14689. [Google Scholar] [CrossRef]
- Stavrinou, A.; Aggelopoulos, C.A.; Tsakiroglou, C.D. Exploring the Adsorption Mechanisms of Cationic and Anionic Dyes onto Agricultural Waste Peels of Banana, Cucumber and Potato: Adsorption Kinetics and Equilibrium Isotherms as a Tool. J. Environ. Chem. Eng. 2018, 6, 6958–6970. [Google Scholar] [CrossRef]
- Vasu, G.; Sivamani, S. Adsorptive Removal of Reactive Blue Dye by Cucumber Peel Adsorbent: Isotherm, Kinetics and Mass Transfer Studies. In Textile Wastewater Treatment: Sustainable Bio-nano Materials and Macromolecules; Springer: Singapore, 2022; pp. 329–347. [Google Scholar] [CrossRef]
- Pimentel, C.H.; Freire, M.S.; Gómez-Díaz, D.; González-Álvarez, J. Removal of Wood Dyes from Aqueous Solutions by Sorption on Untreated Pine (Pinus radiata) Sawdust. Cellulose 2023, 30, 4587–4608. [Google Scholar] [CrossRef]
- Rahman, N.U.; Bahadar, W.; Alam, S.; Zahoor, M.; Zekker, I.; Khan, F.A.; Ullah, R.; Ali, E.A.; Murthy, H.C.A. Activated Sawdust-Based Adsorbent for the Removal of Basic Blue 3 and Methylene Green from Aqueous Media. Adsorpt. Sci. Technol. 2022, 2022, 4551212. [Google Scholar] [CrossRef]
- Al-Zawahreh, K.; Barral, M.T.; Al-Degs, Y.; Paradelo, R. Competitive Removal of Textile Dyes from Solution by Pine Bark-Compost in Batch and Fixed Bed Column Experiments. Environ. Technol. Innov. 2022, 27, 102421. [Google Scholar] [CrossRef]
- Litefti, K.; Freire, M.S.; Stitou, M.; González-Álvarez, J. Adsorption of an Anionic Dye (Congo Red) from Aqueous Solutions by Pine Bark. Sci. Rep. 2019, 9, 16530. [Google Scholar] [CrossRef] [PubMed]
- Debnath, S.; Ballav, N.; Maity, A.; Pillay, K. Competitive Adsorption of Ternary Dye Mixture Using Pine Cone Powder Modified with β-Cyclodextrin. J. Mol. Liq. 2017, 225, 679–688. [Google Scholar] [CrossRef]
- Yagub, M.T.; Sen, T.K.; Ang, M. Removal of Cationic Dye Methylene Blue (MB) from Aqueous Solution by Ground Raw and Base Modified Pine Cone Powder. Environ. Earth Sci. 2014, 71, 1507–1519. [Google Scholar] [CrossRef]
- Bulgariu, L.; Escudero, L.B.; Bello, O.S.; Iqbal, M.; Nisar, J.; Adegoke, K.A.; Alakhras, F.; Kornaros, M.; Anastopoulos, I. The Utilization of Leaf-Based Adsorbents for Dyes Removal: A Review. J. Mol. Liq. 2019, 276, 728–747. [Google Scholar] [CrossRef]
- Huynh, P.T.; Nguyen, D.K.; Duong, B.N.; Nguyen, P.H.; Dinh, V.P. Methylene Orange and Methyl Blue Adsorption Behavior on Pine Leaves Biomass (Pinus kesiya). Res. Sq. 2023, 1, 1–20. [Google Scholar] [CrossRef]
- Kowalkowska, A.; Jóźwiak, T. Utilization of Pumpkin (Cucurbita pepo) Seed Husks as a Low-Cost Sorbent for Removing Anionic and Cationic Dyes from Aqueous Solutions. Desalination Water Treat. 2019, 171, 397–407. [Google Scholar] [CrossRef]
- Jóźwiak, T.; Filipkowska, U.; Struk-Sokołowska, J.; Bryszewski, K.; Trzciński, K.; Kuźma, J.; Ślimkowska, M. The Use of Spent Coffee Grounds and Spent Green Tea Leaves for the Removal of Cationic Dyes from Aqueous Solutions. Sci. Rep. 2021, 11, 9584. [Google Scholar] [CrossRef] [PubMed]
- de Oliveira, D.M.; de Bomfim, A.S.C.; de Benini, K.C.; Cioffi, M.O.H.; Voorwald, H.J.C.; Rodrigue, D. Waste Paper as a Valuable Resource: An Overview of Recent Trends in the Polymeric Composites Field. Polymers 2023, 15, 426. [Google Scholar] [CrossRef] [PubMed]
- Abushammala, H.; Masood, M.A.; Ghulam, S.T.; Mao, J. On the Conversion of Paper Waste and Rejects into High-Value Materials and Energy. Sustainability 2023, 15, 6915. [Google Scholar] [CrossRef]
- Bangrowska, A.M. Morfologia Książki. Bibl. Nostra Śl. Kwart. Naukowy 2011, 4, 40–51. [Google Scholar]
- About Newsprint Paper|Newsprint Primer|PaperIndex Academy|PaperIndex. Available online: https://www.paperindex.com/academy/paper-grades/newsprint-primer (accessed on 16 April 2024).
- Mniej Papieru Dla Gazet to Wpływ Wysokich Cen Energii i Spowolnienia Gospodarczego-Press.Pl-Najnowsze Informacje z Branży Medialnej, Marketingowej, Reklamowej i Public Relations. Available online: https://www.press.pl/tresc/77563,mniej-papieru-dla-gazet-to-wplyw-wysokich-cen-energii-i-spowolnienia-gospodarczego (accessed on 16 April 2024).
- Stenius, P.; Gullichsen, J.; Paulapuro, H. Papermaking Science and Technology, Book 3.Forest Products Chemistry. Fapet Oy: Jyväskylä, Finland, 2000; ISBN 952-5216-03-9. [Google Scholar]
- Global Printing & Writing Paper Demand 2021–2032|Statista. Available online: https://www.statista.com/statistics/1089445/global-writing-and-printing-paper-demand/ (accessed on 16 April 2024).
- Paper Production Process|Fefco. Available online: https://www.fefco.org/lca/dscription-of-production-system/paper-production (accessed on 16 April 2024).
- Paper Packaging: What Are the Trends in the Folding Carton Industry for the Next Five Years? Available online: https://www.allinprint.com/en/press_center/exhibition_ews/3733.html (accessed on 16 April 2024).
- McKinney, R.W.J.; Roland, W.J. (Eds.) Technology of Paper Recycling; Blackie Academic & Professional: New York, NY, USA, 1995; ISBN 9780751400175. [Google Scholar]
- Mohamed, M.A.; Salleh, W.N.W.; Jaafar, J.; Asri, S.E.A.M.; Ismail, A.F. Physicochemical Properties of “Green” Nanocrystalline Cellulose Isolated from Recycled Newspaper. RSC Adv. 2015, 5, 29842–29849. [Google Scholar] [CrossRef]
- Investigations on Paper Making Raw Materials and Determination of Paper Quality by FTIR-UATR and UV-Vis DRS Spectroscopy. Available online: https://www.researchgate.net/publication/286439904_Investigations_on_Paper_Making_Raw_Materials_and_Determination_of_Paper_Quality_by_FTIR-UATR_and_UV-Vis_DRS_Spectroscopy (accessed on 29 April 2024).
- Woźniak, M.; Ratajczak, I.; Szentner, K.; Kwaśniewska, P.; Mazela, B. Propolis and Organosilanes in Wood Protection. Part I: FTIR Analysis and Biological Tests. Ann. Wars. Univ. Life Sci. SGGW. For. Wood Technol. 2015, 91, 218–224. [Google Scholar]
- Wulandari, W.T.; Rochliadi, A.; Arcana, I.M. Nanocellulose Prepared by Acid Hydrolysis of Isolated Cellulose from Sugarcane Bagasse. IOP Conf. Ser. Mater. Sci. Eng. 2016, 107, 012045. [Google Scholar] [CrossRef]
- Zhang, S.; Zhang, F.; Jin, L.; Liu, B.; Mao, Y.; Liu, Y.; Huang, J. Preparation of Spherical Nanocellulose from Waste Paper by Aqueous NaOH/Thiourea. Cellulose 2019, 26, 5177–5185. [Google Scholar] [CrossRef]
- Hospodarova, V.; Singovszka, E.; Stevulova, N. Characterization of Cellulosic Fibers by FTIR Spectroscopy for Their Further Implementation to Building Materials. Am. J. Analyt. Chem. 2018, 09, 303–310. [Google Scholar] [CrossRef]
- Witowski, A.M.; Sawicka, M.; Fizyki, W.; Warszawskiego, U.; Girdwoyń, P.A.; Tomaszewski, T.J. Nowe Aspekty Spektroskopii Papieru w Podczerwieni i Obszarze Teraherców. Probl. Współcz. Kryminal. 2023, 24, 153–164. [Google Scholar] [CrossRef]
- Pasieczna-Patkowska, S.C. Zastosowanie Spektroskopii IR w Inżynierii Środowiska. 2019. Available online: http://kis.pan.pl/index.php?option=com_content&view=article&id=63&Itemid=193&lang=pl (accessed on 16 April 2024).
- Md Salim, R.; Asik, J.; Sarjadi, M.S. Chemical Functional Groups of Extractives, Cellulose and Lignin Extracted from Native Leucaena Leucocephala Bark. Wood Sci. Technol. 2021, 55, 295–313. [Google Scholar] [CrossRef] [PubMed]
- Louati, S.; Baklouti, S.; Samet, B. Geopolymers Based on Phosphoric Acid and Illito-Kaolinitic Clay. Adv. Mater. Sci. Eng. 2016, 2016, 2359759. [Google Scholar] [CrossRef]
- Kim, Y.; Caumon, M.C.; Barres, O.; Sall, A.; Cauzid, J. Identification and Composition of Carbonate Minerals of the Calcite Structure by Raman and Infrared Spectroscopies Using Portable Devices. Spectrochim. Acta Part A Mol. Biomol. Spectrosc. 2021, 261, 119980. [Google Scholar] [CrossRef]
- dos Santos, V.H.J.M.; Pontin, D.; Ponzi, G.G.D.; e Stepanha, A.S.D.G.; Martel, R.B.; Schütz, M.K.; Einloft, S.M.O.; Dalla Vecchia, F. Application of Fourier Transform Infrared Spectroscopy (FTIR) Coupled with Multivariate Regression for Calcium Carbonate (CaCO3) Quantification in Cement. Constr. Build. Mater. 2021, 313, 125413. [Google Scholar] [CrossRef]
- Vicente, A.T.; Araújo, A.; Gaspar, D.; Santos, L.; Marques, A.C.; Mendes, M.J.; Pereira, L.; Fortunato, E.; Martins, R. Optoelectronics and Bio Devices on Paper Powered by Solar Cells. In Nanostructured Solar Cells; IntechOpen: Rijeka, Croatia, 2017. [Google Scholar] [CrossRef]
- Viana, L.C.; Potulski, D.C.; de Muniz, G.I.B.; de Andrade, A.S.; da Silva, E.L. Nanofibrillated Cellulose as an Additive for Recycled Paper. Cerne 2018, 24, 140–148. [Google Scholar] [CrossRef]
- Wu, H.; Chiang, S.W.; Lin, W.; Yang, C.; Li, Z.; Liu, J.; Cui, X.; Kang, F.; Wong, C.P. Towards Practical Application of Paper Based Printed Circuits: Capillarity Effectively Enhances Conductivity of the Thermoplastic Electrically Conductive Adhesives. Sci. Rep. 2014, 4, srep06275. [Google Scholar] [CrossRef]
- Pigments Used in the Coating of Paper and Cardboards. Available online: https://www.researchgate.net/publication/329217111_PIGMENTS_USED_IN_THE_COATING_OF_PAPER_AND_CARDBOARDS (accessed on 29 April 2024).
- Singh, A.; Yadav, K.; Kumar Sen, A. Sal (Shorea Robusta) Leaves Lignin Epoxidation and Its Use in Epoxy Based Coatings. Am. J. Polym. Sci. 2012, 2, 14–18. [Google Scholar] [CrossRef]
- Melro, E.; Filipe, A.; Sousa, D.; Valente, A.J.M.; Romano, A.; Antunes, F.E.; Medronho, B. Dissolution of Kraft Lignin in Alkaline Solutions. Int. J. Biol. Macromol. 2020, 148, 688–695. [Google Scholar] [CrossRef]
- Zhang, H.; Fu, S.; Chen, Y. Basic Understanding of the Color Distinction of Lignin and the Proper Selection of Lignin in Color-Depended Utilizations. Int. J. Biol. Macromol. 2020, 147, 607–615. [Google Scholar] [CrossRef] [PubMed]
- Al Omari, M.M.H.; Rashid, I.S.; Qinna, N.A.; Jaber, A.M.; Badwan, A.A. Calcium Carbonate. Profiles Drug Subst. Excip. Relat. Methodol. 2016, 41, 31–132. [Google Scholar] [CrossRef]
- Ghadami Jadval Ghadam, A.; Idrees, M. Characterization of CaCO3 Nanoparticles Synthesized by Reverse Microemulsion Technique in Different Concentrations of Surfactants. Iran. J. Chem. Chem. Eng. 2013, 32, 27–35. [Google Scholar] [CrossRef]
- Božanić, D.K.; Djoković, V.; Bibić, N.; Sreekumari Nair, P.; Georges, M.K.; Radhakrishnan, T. Biopolymer-Protected CdSe Nanoparticles. Carbohydr. Res. 2009, 344, 2383–2387. [Google Scholar] [CrossRef] [PubMed]
- Jóźwiak, T.; Filipkowska, U. Aminated Rapeseed Husks (Brassica napus) as an Effective Sorbent for Removing Anionic Dyes from Aqueous Solutions. Molecules 2024, 29, 843. [Google Scholar] [CrossRef]
- Jóźwiak, T.; Filipkowska, U.; Brym, S.; Kopeć, L. Use of Aminated Hulls of Sunflower Seeds for the Removal of Anionic Dyes from Aqueous Solutions. Int. J. Environ. Sci. Technol. 2020, 17, 1211–1224. [Google Scholar] [CrossRef]
- Banerjee, S.; Chattopadhyaya, M.C. Adsorption Characteristics for the Removal of a Toxic Dye, Tartrazine from Aqueous Solutions by a Low Cost Agricultural by-Product. Arab. J. Chem. 2017, 10, S1629–S1638. [Google Scholar] [CrossRef]
- Jóźwiak, T.; Filipkowska, U.; Brym, S.; Zyśk, M. The Use of Aminated Cotton Fibers as an Unconventional Sorbent to Remove Anionic Dyes from Aqueous Solutions. Cellulose 2020, 27, 3957–3969. [Google Scholar] [CrossRef]
- Filipkowska, U.; Kuczajowska-Zadrożna, M.; Jóźwiak, T.; Szymczyk, P.; Kaczyński, A. Adsorption of Basic Yellow 28 (BY 28) and Acid Yellow 23 (AY 23) Dyes onto Chitin. Prog. Chem. Appl. Chitin Deriv. 2015, 20, 34–42. [Google Scholar] [CrossRef]
- Gautam, R.K.; Gautam, P.K.; Banerjee, S.; Rawat, V.; Soni, S.; Sharma, S.K.; Chattopadhyaya, M.C. Removal of Tartrazine by Activated Carbon Biosorbents of Lantana Camara: Kinetics, Equilibrium Modeling and Spectroscopic Analysis. J. Environ. Chem. Eng. 2015, 3, 79–88. [Google Scholar] [CrossRef]
- Brice, D.N.C.; Manga, N.H.; Arnold, B.S.; Daouda, K.; Victoire, A.A.; Giresse, N.N.A.; Nangah, C.R.; Nsami, N.J.; Brice, D.N.C.; Manga, N.H.; et al. Adsorption of Tartrazine onto Activated Carbon Based Cola Nuts Shells: Equilibrium, Kinetics, and Thermodynamics Studies. Open J. Inorg. Chem. 2021, 11, 1–19. [Google Scholar] [CrossRef]
- Chukwuemeka-Okorie, H.O.; Ekuma, F.K.; Akpomie, K.G.; Nnaji, J.C.; Okereafor, A.G. Adsorption of Tartrazine and Sunset Yellow Anionic Dyes onto Activated Carbon Derived from Cassava Sievate Biomass. Appl. Water Sci. 2021, 11, 27. [Google Scholar] [CrossRef]
- Jóźwiak, T.; Filipkowska, U.; Pyko, B. Use of Waste Biomass of Common Mushroom (Agaricus bisporus) as a Sorbent for the Removal of Reactive Black 5 and Basic Violet 10 Dyes from Aqueous Solutions. Desalination Water Treat. 2022, 272, 303–315. [Google Scholar] [CrossRef]
- Shen, K.; Gondal, M.A. Removal of Hazardous Rhodamine Dye from Water by Adsorption onto Exhausted Coffee Ground. J. Saudi Chem. Soc. 2017, 21, S120–S127. [Google Scholar] [CrossRef]
- Jóźwiak, T.; Filipkowska, U.; Marciniak, P. Use of Hen Feathers to Remove Reactive Black 5 and Basic Red 46 from Aqueous Solutions. Desalination Water Treat. 2021, 232, 129–139. [Google Scholar] [CrossRef]
- Kurowska, P.; Jóźwiak, T.; Filipkowska, U.; Bakuła, T. The use of chitin in the moults and exoskeletons of mealworms (Tenebrio molitor) to remove cationic dyes from aqueous solutions. Prog. Chem. Appl. Chitin Deriv. 2023, 28, 56–74. [Google Scholar] [CrossRef]
- Jóźwiak, T.; Filipkowska, U.; Zajko, P. Use of Citrus Fruit Peels (Grapefruit, Mandarin, Orange, and Lemon) as Sorbents for the Removal of Basic Violet 10 and Basic Red 46 from Aqueous Solutions. Desalination Water Treat. 2019, 163, 385–397. [Google Scholar] [CrossRef]
- Józwiak, T.; Filipkowska, U.; Bugajska, P.; Kalkowski, T. The Use of Coconut Shells for the Removal of Dyes from Aqueous Solutions. J. Ecol. Eng. 2018, 19, 129–135. [Google Scholar] [CrossRef]
- Fjellström, H.; Höglund, H.; Forsberg, S.; Paulsson, M. Inhibition of Light-Induced Brightness Reversion of High-Yield Pulps: The UV-Screening Properties of Coating Layers Containing Kaolin or Calcium Carbonate Pigments. Nord. Pulp Pap. Res. J. 2007, 22, 350–355. [Google Scholar] [CrossRef]
- Johns, R.E.; Moore, J.L. Moore Recent Developments in Kaolin-Based Paper Coating Pigments:Innovating to Meet Changing Industry Needs. J. Korea TAPPI 2002, 34, 77–85. [Google Scholar]
- Zazouli, M.A.; Moradi, E.; Zazouli, M.A.; Moradi, E. Adsorption Acid Red18 Dye Using Sargassum Glaucescens Biomass from Aqueous Solutions. Iran. J. Health Sci. 2015, 3, 7–13. [Google Scholar] [CrossRef]
- Neolaka, Y.A.B.; Riwu, A.A.P.; Aigbe, U.O.; Ukhurebor, K.E.; Onyancha, R.B.; Darmokoesoemo, H.; Kusuma, H.S. Potential of Activated Carbon from Various Sources as a Low-Cost Adsorbent to Remove Heavy Metals and Synthetic Dyes. Results Chem. 2023, 5, 100711. [Google Scholar] [CrossRef]
- Kuczajowska-Zadrożna, M.; Filipkowska, U.; Jóźwiak, T.; Szymczyk, P. The Use of Polysaccharides for Acid Red 18 Anionic Dye Removal from Aqueous Solutions. Prog. Chem. Appl. Chitin Deriv. 2017, 22, 106–117. [Google Scholar] [CrossRef]
- Heibati, B.; Rodriguez-Couto, S.; Al-Ghouti, M.A.; Asif, M.; Tyagi, I.; Agarwal, S.; Gupta, V.K. Kinetics and Thermodynamics of Enhanced Adsorption of the Dye AR 18 Using Activated Carbons Prepared from Walnut and Poplar Woods. J. Mol. Liq. 2015, 208, 99–105. [Google Scholar] [CrossRef]
- de Souza Macedo, J.; da Costa Júnior, N.B.; Almeida, L.E.; da Silva Vieira, E.F.; Cestari, A.R.; de Fátima Gimenez, I.; Carreño, N.L.V.; Barreto, L.S. Kinetic and Calorimetric Study of the Adsorption of Dyes on Mesoporous Activated Carbon Prepared from Coconut Coir Dust. J. Colloid Interface Sci. 2006, 298, 515–522. [Google Scholar] [CrossRef] [PubMed]
- Ali, H.; Muhammad, S.K. Biosorption of Crystal Violet from Water on Leaf Biomass of Calotropis Procera. J. Environ. Sci. Technol. 2008, 1, 143–150. [Google Scholar] [CrossRef]
- Sureshkumar, M.V.; Namasivayam, C. Adsorption Behavior of Direct Red 12B and Rhodamine B from Water onto Surfactant-Modified Coconut Coir Pith. Colloids Surfaces A Physicochem. Eng. Asp. 2008, 317, 277–283. [Google Scholar] [CrossRef]
- Jóźwiak, T.; Filipkowska, U.; Bakuła, T.; Bralewska-Piotrowicz, B.; Karczmarczyk, K.; Gierszewska, M.; Olewnik-Kruszkowska, E.; Szyryńska, N.; Lewczuk, B. The Use of Chitin from the Molts of Mealworm (Tenebrio molitor) for the Removal of Anionic and Cationic Dyes from Aqueous Solutions. Materials 2023, 16, 545. [Google Scholar] [CrossRef]
- El-Sayed, G.O.; Mohammed, T.Y.; Salama, A.A.-A. Batch Adsorption of Maxilon Red GRL from Aqueous Solution by Natural Sugarcane Stalks Powder. ISRN Environ. Chem. 2013, 2013, 514154. [Google Scholar] [CrossRef]
- EL Haddad, M.; Rachid, M.; Slimani, R.; Nabil, S.; Ridaoui, M.; Lazar, S. Adsorptive removal of a cationic dye -basic red 46 -from aqueous solutions using animal bone meal. J. Eng. Stud. Res. 2012, 18, 43–52. [Google Scholar]
- Laasri, L.; Elamrani, M.K.; Cherkaoui, O. Removal of Two Cationic Dyes from a Textile Effluent by Filtration-Adsorption on Wood Sawdust. Environ. Sci. Pollut. Res. Int. 2007, 14, 237–240. [Google Scholar] [CrossRef]
- Zamouche, M.; Hamdaoui, O. Sorption of Rhodamine B by Cedar Cone: Effect of PH and Ionic Strength. Energy Procedia 2012, 18, 1228–1239. [Google Scholar] [CrossRef]
- Li, X.; He, Y.; Sui, H.; He, L. One-Step Fabrication of Dual Responsive Lignin Coated Fe3O4 Nanoparticles for Efficient Removal of Cationic and Anionic Dyes. Nanomaterials 2018, 8, 162. [Google Scholar] [CrossRef]
- Heise, K.; Koso, T.; King, A.W.T.; Nypelö, T.; Penttilä, P.; Tardy, B.L.; Beaumont, M. Spatioselective Surface Chemistry for the Production of Functional and Chemically Anisotropic Nanocellulose Colloids. J. Mater. Chem. A Mater. 2022, 10, 23413–23432. [Google Scholar] [CrossRef]
- Pham, L.T.M.; Deng, K.; Northen, T.R.; Singer, S.W.; Adams, P.D.; Simmons, B.A.; Sale, K.L. Experimental and Theoretical Insights into the Effects of PH on Catalysis of Bond-Cleavage by the Lignin Peroxidase Isozyme H8 from Phanerochaete Chrysosporium. Biotechnol. Biofuels 2021, 14, 108. [Google Scholar] [CrossRef]
- Ziółkowska, D.; Shyichuk, A.; Karwasz, I.; Witkowska, M. Adsorption of Cationic and Anionic Dyes onto Commercial Kaolin. Adsorp. Sci. Technol. 2009, 27, 205–214. [Google Scholar] [CrossRef]
- Triunfo, C.; Gärtner, S.; Marchini, C.; Fermani, S.; Maoloni, G.; Goffredo, S.; Gomez Morales, J.; Cölfen, H.; Falini, G. Recovering and Exploiting Aragonite and Calcite Single Crystals with Biologically Controlled Shapes from Mussel Shells. ACS Omega 2022, 7, 43992–43999. [Google Scholar] [CrossRef]
- Okoniewska, E. Removal of the Dye of Acid Bright Red 4R from Water Solutions on Activated Carbons. Eng. Prot. Environ. 2016, 19, 331–340. [Google Scholar] [CrossRef]
- Wang, L.; Yan, W.; He, C.; Wen, H.; Cai, Z.; Wang, Z.; Chen, Z.; Liu, W. Microwave-Assisted Preparation of Nitrogen-Doped Biochars by Ammonium Acetate Activation for Adsorption of Acid Red 18. Appl. Surf. Sci. 2018, 433, 222–231. [Google Scholar] [CrossRef]
- Suresh, S.; Sugumar, R.W.; Maiyalagan, T. Adsorption of Acid Red 18 from Aqueous Solution onto Activated Carbon Prepared from Murraya Koenigii (Curry tree) Seeds. Asian J. Chem. 2011, 23, 219. [Google Scholar]
- Ben Dassi, R.; Chamam, B.; Trabelsi, I. Combination of Coagulation-Flocculation and Adsorption on Granular Activated Carbon for Color Removal from AR18 and Real Textile Wastewater. J. Tunis. Chem. Soc. 2017, 19, 295–302. Available online: http://www.sctunisie.org/journal-sct/index.php?article645/combination-of-coagulation-flocculation-and-adsorption-on-granular-activated-carbon-for-color-removal-from-ar18-and-real-textile-wastewater (accessed on 29 April 2024).
- Saratale, R.G.; Sivapathan, S.S.; Jung, W.J.; Kim, H.Y.; Saratale, G.D.; Kim, D.S. Preparation of Activated Carbons from Peach Stone by H4P2O7 Activation and Its Application for the Removal of Acid Red 18 and Dye Containing Wastewater. J. Environ. Sci. Health Part A 2016, 51, 164–177. [Google Scholar] [CrossRef]
- Reza Samarghandi, M.; Zarrabi, M.; Noori Sepehr, M.; Amrane, A.; Hossein Safari, G.; Bashiri, S. Application of Acidic Treated Pumice as an Adsorbent for the Removal of Azo Dye from Aqueous Solutions: Kinetic, Equilibrium and Thermodynamic Studies. Iran. J. Environ. Health Sci. Eng. 2012, 9, 9. [Google Scholar] [CrossRef]
- Hamidi, F.; Dehghani, M.H.; Kasraee, M.; Salari, M.; Shiri, L.; Mahvi, A.H. Acid Red 18 Removal from Aqueous Solution by Nanocrystalline Granular Ferric Hydroxide (GFH); Optimization by Response Surface Methodology & Genetic-Algorithm. Sci. Rep. 2022, 12, 4761. [Google Scholar] [CrossRef] [PubMed]
- Xu, H.; Tian, W.; Zhang, Y.; Tang, J.; Zhao, Z.; Chen, Y. Reduced Graphene Oxide/Attapulgite-Supported Nanoscale Zero-Valent Iron Removal of Acid Red 18 from Aqueous Solution. Water Air Soil Pollut. 2018, 229, 388. [Google Scholar] [CrossRef]
- Berizi, Z.; Hashemi, S.Y.; Hadi, M.; Azari, A.; Mahvi, A.H. The Study of Non-Linear Kinetics and Adsorption Isotherm Models for Acid Red 18 from Aqueous Solutions by Magnetite Nanoparticles and Magnetite Nanoparticles Modified by Sodium Alginate. Water Sci. Technol. 2016, 74, 1235–1242. [Google Scholar] [CrossRef]
- Kyzioł-Komosińska, J.; Rosik-Dulewska, C.; Dzieniszewska, A.; Pająk, M. Compost as Biosorbent for Removal of Acid Dyes from the Wastewater Generated by the Textile Industry. Arch. Environ. Prot. 2011, 37, 3–14. [Google Scholar]
- Mirzaei, N.; Ghaffari, H.R.; Sharafi, K.; Velayati, A.; Hoseindoost, G.; Rezaei, S.; Mahvi, A.H.; Azari, A.; Dindarloo, K. Modified Natural Zeolite Using Ammonium Quaternary Based Material for Acid Red 18 Removal from Aqueous Solution. J. Environ. Chem. Eng. 2017, 5, 3151–3160. [Google Scholar] [CrossRef]
- Chaleshtori, A.N.; Meghadddam, F.M.; Sadeghi, M.; Rahimi, R.; Hemati, S.; Ahmadi, A. Removal of Acid Red 18 (Azo-Dye) from Aqueous Solution by Adsorption onto Activated Charcoal Prepared from Almond Shell. J. Environ. Sci. Manag. 2019, 20, 9–16. [Google Scholar] [CrossRef]
- Borysiak, M.; Gabrus, E. Adsorptive Removal of Cochineal Red a Dye from Aqueous Solutions Using Yeast. Chem. Process. Eng. 2020, 41, 105–117. [Google Scholar] [CrossRef]
- Balarak, D.; Mahdavi, Y.; Sadeghi, S. Adsorptive Removal of Acid Red 18 Dye (AR 18) from Aqueous Solutions by Red Mud: Characteristics, Isotherm and Kinetic Studies. Sch. Acad. J. Biosci. 2015, 3, 644–649. [Google Scholar]
- Wawrzkiewicz, M.; Hubicki, Z. Removal of Tartrazine from Aqueous Solutions by Strongly Basic Polystyrene Anion Exchange Resins. J. Hazard. Mater. 2009, 164, 502–509. [Google Scholar] [CrossRef]
- Dotto, G.L.; Vieira, M.L.G.; Pinto, L.A.A. Kinetics and Mechanism of Tartrazine Adsorption onto Chitin and Chitosan. Ind. Eng. Chem. Res. 2012, 51, 6862–6868. [Google Scholar] [CrossRef]
- Mittal, A.; Mittal, J.; Kurup, L. Adsorption Isotherms, Kinetics and Column Operations for the Removal of Hazardous Dye, Tartrazine from Aqueous Solutions Using Waste Materials—Bottom Ash and De-Oiled Soya, as Adsorbents. J. Hazard. Mater. 2006, 136, 567–578. [Google Scholar] [CrossRef] [PubMed]
- Jibril, M.; Noraini, J.; Poh, L.S.; Mohammed Evuti, A. Removal of Colour from Waste Water Using Coconut Shell Activated Carbon (CSAC) and Commercial Activated Carbon (CAC). J. Teknol. 2012, 60, 15–19. [Google Scholar] [CrossRef]
- Rivera-Arenas, D.; Macías-Quiroga, I.F.; Dávila-Arias, M.T.; Vélez-Upegui, J.J.; Sanabria-González, N.R. Adsorption of Acid Yellow 23 Dye on Organobentonite/Alginate Hydrogel Beads in a Fixed-Bed Column. J. Compos. Sci. 2023, 7, 362. [Google Scholar] [CrossRef]
- Mohammadi, M.; Hassani, A.J.; Mohamed, A.R.; Najafpour, G.D. Removal of Rhodamine b from Aqueous Solution Using Palm Shell-Based Activated Carbon: Adsorption and Kinetic Studies. J. Chem. Eng. Data 2010, 55, 5777–5785. [Google Scholar] [CrossRef]
- Porkodi, K.; Vasanth Kumar, K. Equilibrium, Kinetics and Mechanism Modeling and Simulation of Basic and Acid Dyes Sorption onto Jute Fiber Carbon: Eosin Yellow, Malachite Green and Crystal Violet Single Component Systems. J. Hazard. Mater. 2007, 143, 311–327. [Google Scholar] [CrossRef] [PubMed]
- Annadurai, G.; Juang, R.S.; Lee, D.J. Use of Cellulose-Based Wastes for Adsorption of Dyes from Aqueous Solutions. J. Hazard. Mater. 2002, 92, 263–274. [Google Scholar] [CrossRef]
- Al-Zawahreh, K.; Barral, M.T.; Al-Degs, Y.; Paradelo, R. Comparison of the Sorption Capacity of Basic, Acid, Direct and Reactive Dyes by Compost in Batch Conditions. J. Environ. Manag. 2021, 294, 113005. [Google Scholar] [CrossRef]
- Parab, H.; Sudersanan, M.; Shenoy, N.; Pathare, T.; Vaze, B. Use of Agro-Industrial Wastes for Removal of Basic Dyes from Aqueous Solutions. Clean 2009, 37, 963–969. [Google Scholar] [CrossRef]
- Ju, D.J.; Byun, I.G.; Park, J.J.; Lee, C.H.; Ahn, G.H.; Park, T.J. Biosorption of a Reactive Dye (Rhodamine-B) from an Aqueous Solution Using Dried Biomass of Activated Sludge. Bioresour. Technol. 2008, 99, 7971–7975. [Google Scholar] [CrossRef]
- Khan, T.A.; Sharma, S.; Ali, I. Adsorption of Rhodamine B Dye from Aqueous Solution onto Acid Activated Mango (Magnifera Indica) Leaf Powder: Equilibrium, Kinetic and Thermodynamic Studies. J. Toxicol. Environ. Health Sci. 2011, 3, 286–297. [Google Scholar] [CrossRef]
- Jóźwiak, T.; Filipkowska, U.; Filipkowska, M. Effect of ionic and covalent crosslinking of hydrogel chitosan beads on the adsorption efficiency of basic violet 10 and basic green 4 dyes from aqueous solutions. Prog. Chem. Appl. Chitin Deriv. 2022, 27, 116–134. [Google Scholar] [CrossRef]
- Namasivayam, C.; Dinesh Kumar, M.; Selvi, K.; Ashruffunissa Begum, R.; Vanathi, T.; Yamuna, R.T. “Waste” Coir Pith-A Potential Biomass for the Treatment of Dyeing Wastewaters. Biomass Bioenergy 2001, 21, 477–483. [Google Scholar] [CrossRef]
- Wang, S.; Soudi, M.; Li, L.; Zhu, Z.H. Coal Ash Conversion into Effective Adsorbents for Removal of Heavy Metals and Dyes from Wastewater. J. Hazard. Mater. 2006, 133, 243–251. [Google Scholar] [CrossRef]
- Martin, M.J.; Artola, A.; Balaguer, M.D.; Rigola, M. Activated Carbons Developed from Surplus Sewage Sludge for the Removal of Dyes from Dilute Aqueous Solutions. Chem. Eng. J. 2003, 94, 231–239. [Google Scholar] [CrossRef]
- Azmi, N.A.I.; Zainudin, N.F.; Ali, U.F.M. Adsorption of Basic Red 46 Using Sea Mango (Cerbera odollam) Based Activated Carbon. AIP Conf. Proc. 2015, 1660, 4915786. [Google Scholar] [CrossRef]
- Alipanahpour Dil, E.; Ghaedi, M.; Asfaram, A.; Mehrabi, F.; Bazrafshan, A.A.; Tayebi, L. Synthesis and Application of Ce-Doped TiO2 Nanoparticles Loaded on Activated Carbon for Ultrasound-Assisted Adsorption of Basic Red 46 Dye. Ultrason. Sonochem. 2019, 58, 104702. [Google Scholar] [CrossRef]
- Madeła, D.M.; Krzemińska, E.N. Wpływ Procesu Fentona Na Skuteczność Usuwania Zanieczyszczeń Ze Ścieków Przemysłowych Na Węglach Aktywnych. Technol. Wody 2014, 5, 46–50. [Google Scholar]
- Deniz, F.; Saygideger, S.D. Removal of a Hazardous Azo Dye (Basic Red 46) from Aqueous Solution by Princess Tree Leaf. Desalination 2011, 268, 6–11. [Google Scholar] [CrossRef]
- Deniz, F.; Saygideger, S.D. Investigation of Adsorption Characteristics of Basic Red 46 onto Gypsum: Equilibrium, Kinetic and Thermodynamic Studies. Desalination 2010, 262, 161–165. [Google Scholar] [CrossRef]
- Moradi, O. Adsorption Behavior of Basic Red 46 by Single-Walled Carbon Nanotubes Surfaces. Full Nanotub. Carbon Nanostructures 2013, 21, 286–301. [Google Scholar] [CrossRef]
- Yang, X.; Zhu, W.; Song, Y.; Zhuang, H.; Tang, H. Removal of Cationic Dye BR46 by Biochar Prepared from Chrysanthemum morifolium Ramat Straw: A Study on Adsorption Equilibrium, Kinetics and Isotherm. J. Mol. Liq. 2021, 340, 116617. [Google Scholar] [CrossRef]
- Yeddou, N.; Bensmaili, A. Kinetic Models for the Sorption of Dye from Aqueous Solution by Clay-Wood Sawdust Mixture. Desalination 2005, 185, 499–508. [Google Scholar] [CrossRef]
- Chen, H.; Han, Q.; Venditti, R.A.; Jameel, H. Enzymatic Hydrolysis of Pretreated Newspaper Having High Lignin Content for Bioethanol Production. Bioresources 2015, 10, 4077–4098. [Google Scholar] [CrossRef]
- Mattsson, A.; Joelsson, T.; Miettinen, A.; Ketoja, J.A.; Pettersson, G.; Engstrand, P. Lignin Inter-Diffusion Underlying Improved Mechanical Performance of Hot-Pressed Paper Webs. Polymers 2021, 13, 2485. [Google Scholar] [CrossRef]
- Ioelovich, M. Waste Paper as Promising Feedstock for Production of Biofuel. J. Sci. Res. Rep. 2014, 3, 905–916. [Google Scholar] [CrossRef] [PubMed]
- Contreras, K.P.; Yáñez, J.M.S.; Aguilar-Virgen, Q.; Taboada-González, P.; Marquez-Benavides, L. Potential for Methane Generation by Lignocellulosic Household Waste. Sustainability 2018, 10, 3461. [Google Scholar] [CrossRef]
- Ioelovich, M. Recent Findings and the Energetic Potential of Plant Biomass as a Renewable Source of Biofuels—A Review. Bioresources 2015, 10, 1879–1914. [Google Scholar] [CrossRef]
- Ximenes, F.A.; Kathuria, A.; Barlaz, M.A.; Cowie, A.L. Carbon Dynamics of Paper, Engineered Wood Products and Bamboo in Landfills: Evidence from Reactor Studies. Carbon Balance Manag. 2018, 13, 27. [Google Scholar] [CrossRef] [PubMed]


| Tested Sorbent | BET Surface Area [m2/g] | Pore Volume [cm3/g] | Pore Size (Average) [nm] |
|---|---|---|---|
| NP | 0.488 ± 0.0331 | 0.00212 | 25.0 |
| LCW | 2.380 ± 0.0636 | 0.02100 | 18.8 |
| OP | 1.280 ± 0.0255 | 0.00862 | 15.3 |
| CC | 0.789 ± 0.0182 | 0.00532 | 19.8 |
| Solution pH | Color of Aqueous Solution after 72 h Contact with Tested Materials; 10 g/L Material Dose. Color APHA—[mg Pt-Co/L] | Tap Water (at Our Laboratory) | |||
|---|---|---|---|---|---|
| NP | LWC | OP | CC | ||
| 2 | 6.95 | 11.56 | 8.16 | 24.05 | 3.13 [mg Pt-Co/L] |
| 7 | 12.32 | 26.71 | 12.60 | 34.47 | |
| 9 | 20.34 | 30.87 | 14.52 | 41.22 | |
| 11 | 27.94 | 82.58 | 14.63 | 46.87 | |
| Sorbent | Dye | Dye Conc. [mg/L] | Pseudo-First-Order Model | Pseudo-Second-Order Model | Exp. Data | Equil. Time | ||||
|---|---|---|---|---|---|---|---|---|---|---|
| k1 | qe, cal. | R2 | k2 | qe, cal. | R2 | qe, exp. | [min] | |||
| [mg/L] | [1/min] | [mg/g] | - | [g/mg × min] | [mg/g] | - | [mg/g] | [min] | ||
| NP | AR18 | 50 | 0.0939 | 2.16 | 0.9912 | 0.1053 | 2.29 | 0.9974 | 2.20 | 90 |
| 250 | 0.1947 | 5.25 | 0.9955 | 0.0759 | 5.38 | 0.9995 | 5.29 | 60 | ||
| AY23 | 50 | 0.1028 | 2.16 | 0.9920 | 0.0861 | 2.28 | 0.9973 | 2.19 | 90 | |
| 250 | 0.1603 | 5.00 | 0.9939 | 0.0775 | 5.16 | 0.9993 | 5.04 | 60 | ||
| BV10 | 50 | 0.0630 | 4.60 | 0.9886 | 0.0200 | 4.98 | 0.9982 | 4.69 | 120 | |
| 250 | 0.0741 | 19.46 | 0.9920 | 0.0060 | 20.85 | 0.9968 | 19.71 | 90 | ||
| BR46 | 250 | 0.0999 | 24.04 | 0.9955 | 0.0075 | 25.33 | 0.9967 | 24.29 | 90 | |
| 1000 | 0.1815 | 75.03 | 0.9939 | 0.0064 | 77.06 | 0.9990 | 75.84 | 60 | ||
| LWC | AR18 | 50 | 0.0856 | 1.09 | 0.9889 | 0.2306 | 1.16 | 0.9975 | 1.11 | 90 |
| 250 | 0.1895 | 2.09 | 0.9915 | 0.1333 | 2.15 | 0.9993 | 2.09 | 60 | ||
| AY23 | 50 | 0.0913 | 1.06 | 0.9932 | 0.1460 | 1.13 | 0.9959 | 1.07 | 90 | |
| 250 | 0.1576 | 2.02 | 0.9919 | 0.0988 | 2.09 | 0.9988 | 2.04 | 60 | ||
| BV10 | 50 | 0.0722 | 3.32 | 0.9948 | 0.0337 | 3.56 | 0.9960 | 3.67 | 120 | |
| 250 | 0.0870 | 11.51 | 0.9906 | 0.0127 | 12.22 | 0.9980 | 11.68 | 90 | ||
| BR46 | 250 | 0.0935 | 22.77 | 0.9937 | 0.0071 | 27.09 | 0.9967 | 23.09 | 90 | |
| 1000 | 0.1790 | 53.97 | 0.9933 | 0.0067 | 55.46 | 0.9988 | 54.56 | 60 | ||
| OP | AR18 | 50 | 0.0924 | 1.30 | 0.9944 | 0.1223 | 1.37 | 0.9953 | 1.30 | 90 |
| 250 | 0.1387 | 2.28 | 0.9863 | 0.1209 | 2.37 | 0.9987 | 2.29 | 60 | ||
| AY23 | 50 | 0.0951 | 1.18 | 0.9920 | 0.1989 | 1.25 | 0.9967 | 1.20 | 90 | |
| 250 | 0.1725 | 2.28 | 0.9949 | 0.1360 | 2.35 | 0.9990 | 2.30 | 60 | ||
| BV10 | 50 | 0.0606 | 1.31 | 0.9897 | 0.0657 | 1.43 | 0.9967 | 1.32 | 120 | |
| 250 | 0.0906 | 3.39 | 0.9959 | 0.0458 | 3.59 | 0.9964 | 3.44 | 90 | ||
| BR46 | 250 | 0.0808 | 8.30 | 0.9908 | 0.0258 | 8.85 | 0.9971 | 8.42 | 90 | |
| 1000 | 0.1631 | 15.13 | 0.9887 | 0.0155 | 15.63 | 0.9978 | 15.37 | 60 | ||
| CC | AR18 | 50 | 0.0558 | 2.13 | 0.9845 | 0.0361 | 2.33 | 0.9992 | 2.19 | 150 |
| 250 | 0.0880 | 4.70 | 0.9926 | 0.0272 | 5.13 | 0.9946 | 4.81 | 120 | ||
| AY23 | 50 | 0.0890 | 2.02 | 0.9884 | 0.0730 | 2.15 | 0.9981 | 2.08 | 150 | |
| 250 | 0.1261 | 4.66 | 0.9959 | 0.0562 | 4.85 | 0.9967 | 4.71 | 120 | ||
| BV10 | 50 | 0.0257 | 4.34 | 0.9873 | 0.0059 | 5.11 | 0.9939 | 4.38 | 210 | |
| 250 | 0.0251 | 18.26 | 0.9879 | 0.0014 | 21.57 | 0.9920 | 18.19 | 150 | ||
| BR46 | 250 | 0.0238 | 22.50 | 0.9888 | 0.0010 | 26.83 | 0.9949 | 22.81 | 210 | |
| 1000 | 0.0280 | 61.28 | 0.9859 | 0.0005 | 71.26 | 0.9928 | 61.23 | 150 | ||
| Sorbent | Dye | Dye Conc. | Phase I | Phase II | ||||
|---|---|---|---|---|---|---|---|---|
| kd1 | Durat. | R2 | kd2 | Durat. | R2 | |||
| [mg/L] | [mg/(g × min0.5)] | [min] | - | [mg/(g × min0.5)] | [min] | - | ||
| NP | AR18 | 50 | 0.4126 | 20 | 0.9953 | 0.0758 | 70 | 0.9604 |
| 250 | 1.4461 | 10 | 0.9999 | 0.1514 | 50 | 0.9444 | ||
| AY23 | 50 | 0.4244 | 20 | 0.9931 | 0.0667 | 70 | 0.9623 | |
| 250 | 1.3008 | 10 | 0.9999 | 0.1965 | 50 | 0.9412 | ||
| BV10 | 50 | 0.7053 | 30 | 0.9944 | 0.1664 | 90 | 0.9656 | |
| 250 | 3.4016 | 20 | 0.9992 | 0.9134 | 70 | 0.9650 | ||
| BR46 | 250 | 4.6736 | 20 | 0.9954 | 0.7335 | 70 | 0.9316 | |
| 1000 | 20.3320 | 10 | 0.9999 | 2.5411 | 50 | 0.9646 | ||
| LWC | AR18 | 50 | 0.2039 | 20 | 0.9989 | 0.0434 | 70 | 0.9825 |
| 250 | 0.5737 | 10 | 0.9999 | 0.0571 | 50 | 0.9676 | ||
| AY23 | 50 | 0.2042 | 20 | 0.9998 | 0.0343 | 70 | 0.9758 | |
| 250 | 0.5228 | 10 | 0.9999 | 0.0802 | 50 | 0.9448 | ||
| BV10 | 50 | 0.5473 | 30 | 0.9985 | 0.0878 | 90 | 0.9386 | |
| 250 | 2.1564 | 20 | 0.9985 | 0.4622 | 70 | 0.9623 | ||
| BR46 | 250 | 4.3954 | 20 | 0.9991 | 0.7680 | 70 | 0.9672 | |
| 1000 | 14.6150 | 10 | 0.9999 | 1.8556 | 50 | 0.9537 | ||
| OP | AR18 | 50 | 0.2487 | 20 | 0.9994 | 0.0398 | 70 | 0.9661 |
| 250 | 0.5755 | 10 | 0.9999 | 0.1003 | 50 | 0.9796 | ||
| AY23 | 50 | 0.2265 | 20 | 0.9972 | 0.0357 | 70 | 0.9745 | |
| 250 | 0.6072 | 10 | 0.9999 | 0.0803 | 50 | 0.9269 | ||
| BV10 | 50 | 0.2021 | 30 | 0.9981 | 0.0460 | 90 | 0.9561 | |
| 250 | 0.6404 | 20 | 0.9991 | 0.1121 | 70 | 0.9416 | ||
| BR46 | 250 | 1.4912 | 20 | 0.9971 | 0.3604 | 70 | 0.9568 | |
| 1000 | 4.0086 | 10 | 0.9999 | 0.6008 | 50 | 0.9920 | ||
| CC | AR18 | 50 | 0.3127 | 30 | 0.9967 | 0.0718 | 120 | 0.9570 |
| 250 | 0.8837 | 20 | 0.9999 | 0.1237 | 100 | 0.9082 | ||
| AY23 | 50 | 0.3436 | 30 | 0.9839 | 0.0372 | 120 | 0.9669 | |
| 250 | 0.9565 | 20 | 0.9994 | 0.0693 | 100 | 0.9011 | ||
| BV10 | 50 | 0.3847 | 120 | 0.9929 | 0.0502 | 90 | 0.9008 | |
| 250 | 1.7042 | 90 | 0.9986 | 0.7042 | 60 | 0.9946 | ||
| BR46 | 250 | 1.9793 | 120 | 0.9969 | 0.3457 | 90 | 0.9050 | |
| 1000 | 5.8362 | 90 | 0.9957 | 2.1081 | 60 | 0.9518 | ||
| Sorbent | Dye | Langmuir 1 Model | Langmuir 2 Model | Freundlich Model | |||||||||
|---|---|---|---|---|---|---|---|---|---|---|---|---|---|
| Qmax | Kc | R2 | Qmax | b1 | K1 | b2 | K2 | R2 | k | n | R2 | ||
| [mg/g] | [L/mg] | - | [mg/g] | [mg/g] | [L/mg] | [mg/g] | [L/mg] | - | - | - | - | ||
| NP | AR18 | 7.77 | 0.014 | 0.9916 | 7.77 | 3.86 | 0.014 | 3.91 | 0.014 | 0.9916 | 0.367 | 0.529 | 0.9693 |
| AY23 | 7.20 | 0.014 | 0.9851 | 7.20 | 3.60 | 0.014 | 3.60 | 0.014 | 0.9851 | 0.355 | 0.523 | 0.9402 | |
| BV10 | 33.53 | 0.036 | 0.9759 | 38.87 | 6.90 | 0.804 | 31.97 | 0.015 | 0.9957 | 4.417 | 0.377 | 0.9879 | |
| BR46 | 78.01 | 0.054 | 0.9888 | 90.82 | 38.88 | 0.158 | 51.94 | 0.012 | 0.9991 | 12.532 | 0.344 | 0.9590 | |
| LWC | AR18 | 2.64 | 0.017 | 0.9945 | 2.64 | 1.52 | 0.017 | 1.12 | 0.017 | 0.9945 | 0.194 | 0.451 | 0.9602 |
| AY23 | 2.54 | 0.018 | 0.9908 | 2.54 | 1.27 | 0.018 | 1.27 | 0.018 | 0.9908 | 0.191 | 0.447 | 0.9552 | |
| BV10 | 21.52 | 0.010 | 0.9951 | 23.22 | 1.90 | 0.130 | 21.32 | 0.007 | 0.9975 | 1.090 | 0.482 | 0.9823 | |
| BR46 | 55.59 | 0.034 | 0.9884 | 63.28 | 26.72 | 0.110 | 36.56 | 0.008 | 0.9994 | 8.376 | 0.321 | 0.9581 | |
| OP | AR18 | 2.89 | 0.019 | 0.9943 | 2.89 | 1.43 | 0.019 | 1.46 | 0.019 | 0.9943 | 0.229 | 0.441 | 0.9615 |
| AY23 | 3.01 | 0.016 | 0.9902 | 3.01 | 1.39 | 0.016 | 1.62 | 0.016 | 0.9902 | 0.204 | 0.464 | 0.9544 | |
| BV10 | 5.89 | 0.007 | 0.9889 | 7.28 | 6.03 | 0.043 | 1.25 | 0.003 | 0.9959 | 0.239 | 0.490 | 0.9872 | |
| BR46 | 18.41 | 0.006 | 0.9926 | 19.61 | 2.35 | 0.044 | 17.26 | 0.004 | 0.9947 | 0.911 | 0.430 | 0.9719 | |
| CC | AR18 | 6.62 | 0.016 | 0.9918 | 6.62 | 3.31 | 0.016 | 3.31 | 0.016 | 0.9918 | 0.375 | 0.501 | 0.9549 |
| AY23 | 6.62 | 0.013 | 0.9901 | 6.62 | 3.24 | 0.013 | 3.38 | 0.013 | 0.9901 | 0.299 | 0.534 | 0.9642 | |
| BV10 | 24.66 | 0.052 | 0.9787 | 28.87 | 11.20 | 0.220 | 17.67 | 0.011 | 0.9929 | 4.262 | 0.326 | 0.9651 | |
| BR46 | 67.36 | 0.020 | 0.9896 | 71.27 | 7.49 | 0.607 | 63.78 | 0.013 | 0.9965 | 7.190 | 0.372 | 0.9736 | |
| Dye | Sorbent | Sorption Capacity [mg/g] | pH of Sorption | Time of Sorption [min] | Source |
|---|---|---|---|---|---|
| AR18 | Activated carbon WG-12 | 100.00 | – | – | [101] |
| Biochar from Phragmites australis | 95.22 | 2 | 720 | [102] | |
| Activated carbon from curry tree seeds | 53.19 | - | 120 | [103] | |
| Rapeseed husk | 49.4 | 2 | 150 | [18] | |
| Granular activated carbon | 45.45 | 9 | 120 | [104] | |
| Activated carbon from carrot waste | 41.00 | 3 | 80 | [85] | |
| Chitosan flakes | 39.90 | 4 | 180 | [86] | |
| Activated carbon from peach stone | 34.24 | 3 | 480 | [105] | |
| Activated carbon from poplar wood | 30.30 | 5 | 120 | [87] | |
| Carboxymethyl cellulose | 29.70 | 6 | 120 | [86] | |
| Acidic treated pumice | 29.70 | 3.5 | 180 | [106] | |
| Granular ferric hydroxide | 29.13 | 5 | 85 | [107] | |
| Reduced graphenoxide/attapulgite | 26.59 | 2 | 30 | [108] | |
| Magnetite nanoparticles | 16.25 | 3 | 120 | [109] | |
| Sargassum glaucescens biomass | 15.0 | 6 | 60 | [84] | |
| Compost | 13.51 | 7 | 1440 | [110] | |
| Nano-pumice | 12.84 | 4.5 | 90 | [107] | |
| Zeolite | 11.10 | 7 | 150 | [111] | |
| Activated charcoal almond shell | 10.75 | 2 | 60 | [112] | |
| Powdered yeast | 10.16 | 3 | 120 | [113] | |
| Agar | 10.16 | 6 | 120 | [86] | |
| Newsprint paper (used)—NP | 7.77 | 2 | 90 | This work | |
| Red mud | 7.14 | 3 | 75 | [114] | |
| Corrugated cardboard (used)—CC | 6.62 | 2 | 150 | This work | |
| Office paper (used)—OP | 2.89 | 2 | 90 | This work | |
| Lightweight coated paper (used)—LWC | 2.64 | 2 | 90 | This work | |
| Sunflower seed hulls (SSHs) | 1.80 | 3 | 90 | [69] | |
| Coconut Shells | 0.66 | 2 | 45 | [81] | |
| AY23 | Activated carbon of Lantana Camara | 58.82 | 2 | 30 | [73] |
| Commercial activated carbon | 56.50 | 8 | 120 | [88] | |
| Amberlite IRA-900 | 49.88 | 4.5 | 20 | [115] | |
| Rapeseed husks | 41.52 | 2 | 150 | [18] | |
| Chitin | 30.50 | 3 | 240 | [116] | |
| Deoiled soya | 24.60 | 2 | - | [117] | |
| Chitin flakes | 24.20 | 2 | 120 | [72] | |
| Activated carbon-based cola nut shells | 21.59 | 2 | 10 | [74] | |
| Activated carbon from Cassava sievate | 20.83 | 2 | 90 | [75] | |
| Bottom ash | 12.60 | 2 | - | [117] | |
| Newsprint paper (used)—NP | 7.20 | 2 | 90 | This work | |
| Corrugated cardboard (used)—CC | 6.62 | 2 | 150 | This work | |
| Sawdust | 4.71 | 3 | 70 | [70] | |
| Cotton fibers | 3.58 | 3 | 240 | [71] | |
| Office paper (used)—OP | 3.01 | 2 | 90 | This work | |
| Lightweight coated paper (used)—LWC | 2.54 | 2 | 90 | This work | |
| Sunflower seed hulls (SSHs) | 2.30 | 3 | 90 | [69] | |
| Activated carbon from coconut shell | 2.30 | 1.7 | 60 | [118] | |
| Coconut shells | 0.53 | 2 | 45 | [81] | |
| Organobentonite/alginate hydrogel | 0.50 | 4.5 | - | [119] |
| Dye | Sorbent | Sorption Capacity [mg/g] | pH of Sorption | Time of Sorption [min] | Source |
|---|---|---|---|---|---|
| BV10 | Newsprint paper (used)—NP | 38.87 | 2 | 120 | This work |
| Activated carbon (palm shell-based) | 30.00 | 3 | - | [120] | |
| Activated carbon from jute fiber | 28.00 | 8 | 220 | [121] | |
| Corrugated cardboard (used)—CC | 24.66 | 2 | 210 | This work | |
| Lightweight coated paper (used)—LWC | 21.52 | 2 | 120 | This work | |
| Rapeseed husks | 20.90 | 3 | 180 | [68] | |
| Banana peels | 20.60 | 7 | 1440 | [122] | |
| Municipal solid waste compost | 19.30 | 3 | 1440 | [123] | |
| Cedar cones | 17.20 | 5 | 480 | [95] | |
| Coconut fiber | 14.90 | 9.2 | 90 | [90] | |
| Sugar cane fiber | 10.40 | - | - | [124] | |
| Molts of mealworm | 6.44 | 3 | 210 | [79] | |
| Office paper (used)—OP | 5.89 | 2 | 120 | This work | |
| Lemon peels | 5.70 | 3 | 240 | [80] | |
| Unmodified activated sludge | 4.60 | 6.5 | 120 | [125] | |
| Cedar cones | 4.60 | 0 | 720 | [95] | |
| Grapefruit peels | 4.60 | 3 | 240 | [80] | |
| Calotropis procera leaf biomass | 4.10 | - | 60 | [89] | |
| Champignon biomass | 4.00 | 2 | 210 | [76] | |
| Mango leaves (powder) | 3.30 | - | 50 | [126] | |
| Chitin from the molts of mealworms | 3.22 | 6 | 120 | [91] | |
| Orange peels | 3.20 | 4 | 240 | [80] | |
| Chitosan (non-cross-linked granules) | 2.94 | 6 | 1440 | [127] | |
| Coal-fired coconut fiber | 2.60 | 6.5 | 150 | [128] | |
| Powdered coffee | 2.50 | 2 | 180 | [77] | |
| Fly ash washed with NaOH | 2.50 | 6.2 | 4320 | [129] | |
| BR46 | Activated carbon Chemviron GW | 106.00 | 7.4 | 120 | [130] |
| Newsprint paper (used)—NP | 90.82 | 6 | 90 | This work | |
| Corrugated cardboard (used)—CC | 71.27 | 6 | 210 | This work | |
| Activated carbon from biomass | 65.70 | 7 | 90 | [131] | |
| Lightweight coated paper (used)—LWC | 63.28 | 6 | 90 | This work | |
| Rapeseed hulls | 59.10 | 6 | 180 | [18] | |
| TiO2 nanopart. loaded on activ. carbon | 58.61 | 5.5 | 4 | [132] | |
| Spent green tea leaves | 58.00 | 6 | 240 | [35] | |
| Lemon peels | 54.00 | 6 | 240 | [80] | |
| Molts of mealworm (MM) | 50.90 | 6 | 150 | [79] | |
| Coconut shells | 49.40 | 6 | 120 | [81] | |
| Activated carbon ROW 08 | 45.00 | 8 | 60 | [133] | |
| Paulownia tomentosa tree leaves | 43.10 | 8 | 72 | [134] | |
| Gypsum | 39.17 | 10 | 60 | [135] | |
| Single-walled carbon nanotubes | 38.35 | 9 | 100 | [136] | |
| Biochar from Chrysanthemum morifolium straw | 32.30 | 10 | 60 | [137] | |
| Exoskeletons of mealworm (ME) | 31.50 | 6 | 180 | [79] | |
| Nut sawdust | 30.10 | 7 | - | [138] | |
| Activated carbon | 26.41 | 5 | 4 | [132] | |
| Natural sugarcane stalks powder | 20.96 | 7.2 | 60 | [92] | |
| Bone meal | 24.60 | 6 | 90 | [93] | |
| Office paper (used)—OP | 19.61 | 6 | 90 | This work | |
| Beech sawdust | 19.24 | - | 150 | [94] | |
| Wood sawdust | 19.20 | - | 120 | [94] | |
| Kaolin | 12.80 | 6.6 | 60 | [99] | |
| Hen feathers | 4.06 | 5 | 210 | [78] |
| Waste Paper Type | Grammage [g/m2] | Percentage Content [%] | |||
|---|---|---|---|---|---|
| Cellulose | Hemicellulose | Lignin | Others (Fillers, Glues, Inks) | ||
| NP | 50 | 38.0–55.0 | 18.0–40.0 | 18.0–30.0 | 1.0–6.0 |
| LWC | 60 | 28.0–46.0 | 17.0–32.0 | 6.0–17.2 | 20.0–30.0 |
| OP | 80 | 60.0–78.6 | 4.7–14.2 | 0.9–1.0 | 12.3–30.0 |
| CC | 350 | 58.0–60.0 | 14.0–15.0 | 13.6–15.4 | 7.7–20.0 |
| Dye Name | Acid Red 18 (AR18) | Acid Yellow 23 (AY23) | Basic Violet 10 (BV10) | Basic Red 46 (BR46) |
|---|---|---|---|---|
| Structural formula | 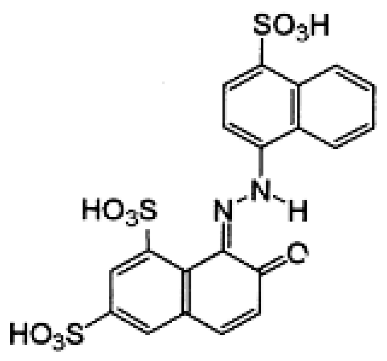 |  | 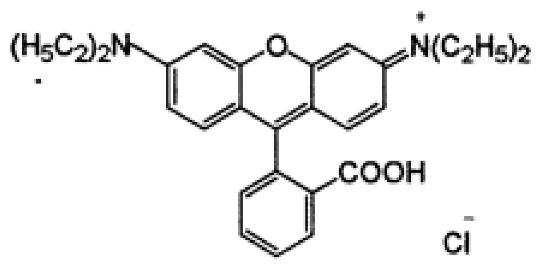 |  |
| Chemical formula | C20H11N2Na3O10S3 | C16H9N4Na3O9S2 | C28H31ClN2O3 | C18H21BrN6 |
| Molecular weight | 604.5 g/mol | 534.4 g/mol | 479.0 g/mol | 321.4 g/mol |
| Dye class | single azo dye | single azo dye | xanthene dye | single azo dye |
| Dye type | anionic (acidic) | anionic (acidic) | cationic (basic) | cationic (basic) |
| UV-VIS spectrum of dye | 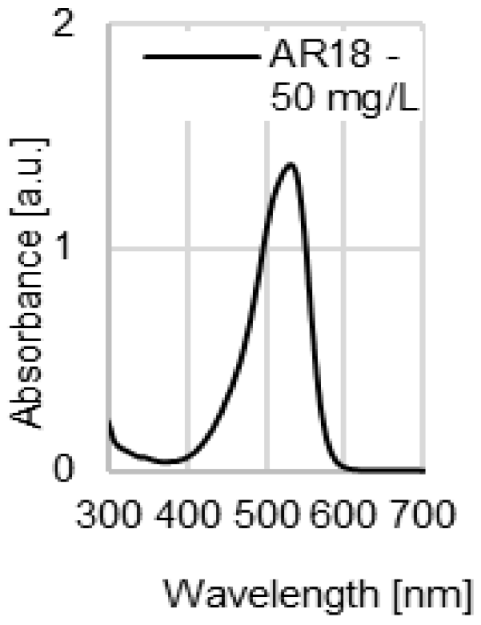 | 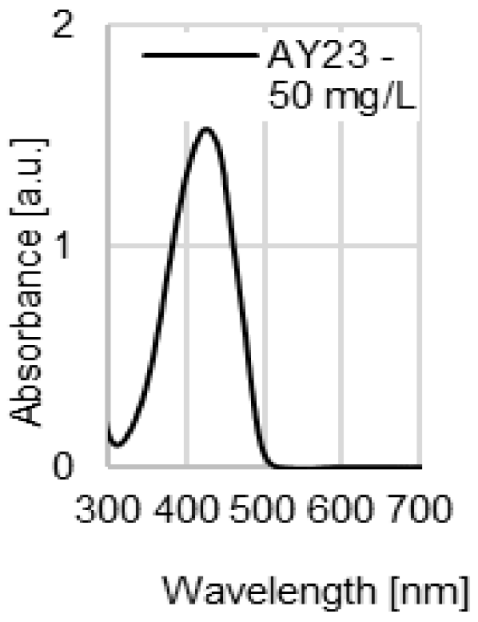 | 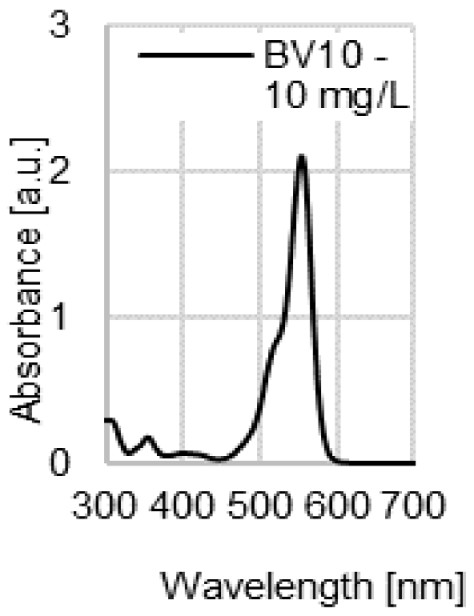 |  |
| λmax | 509 nm | 428 nm | 554 nm | 530 nm |
| Uses | Dyeing wool, silk, polyamide fiber | Dyeing wool, silk, polyamide fiber | Dyeing textiles, paper, leather | Dyeing leather, paper, wool, and acrylic fibers |
| Other trade names | Acid Brilliant Red 3R, Acid Scarlet 3R | Tartrazine, Acid Tartrazine | Rhodamine B, Basic Red RB | Anilan Red GRL, Basic Red X-GRL |
Disclaimer/Publisher’s Note: The statements, opinions and data contained in all publications are solely those of the individual author(s) and contributor(s) and not of MDPI and/or the editor(s). MDPI and/or the editor(s) disclaim responsibility for any injury to people or property resulting from any ideas, methods, instructions or products referred to in the content. |
© 2024 by the authors. Licensee MDPI, Basel, Switzerland. This article is an open access article distributed under the terms and conditions of the Creative Commons Attribution (CC BY) license (https://creativecommons.org/licenses/by/4.0/).
Share and Cite
Jóźwiak, T.; Filipkowska, U.; Bednarowicz, A.; Zielińska, D.; Wiśniewska-Wrona, M. The Use of Various Types of Waste Paper for the Removal of Anionic and Cationic Dyes from Aqueous Solutions. Molecules 2024, 29, 2809. https://doi.org/10.3390/molecules29122809
Jóźwiak T, Filipkowska U, Bednarowicz A, Zielińska D, Wiśniewska-Wrona M. The Use of Various Types of Waste Paper for the Removal of Anionic and Cationic Dyes from Aqueous Solutions. Molecules. 2024; 29(12):2809. https://doi.org/10.3390/molecules29122809
Chicago/Turabian StyleJóźwiak, Tomasz, Urszula Filipkowska, Anna Bednarowicz, Dorota Zielińska, and Maria Wiśniewska-Wrona. 2024. "The Use of Various Types of Waste Paper for the Removal of Anionic and Cationic Dyes from Aqueous Solutions" Molecules 29, no. 12: 2809. https://doi.org/10.3390/molecules29122809
APA StyleJóźwiak, T., Filipkowska, U., Bednarowicz, A., Zielińska, D., & Wiśniewska-Wrona, M. (2024). The Use of Various Types of Waste Paper for the Removal of Anionic and Cationic Dyes from Aqueous Solutions. Molecules, 29(12), 2809. https://doi.org/10.3390/molecules29122809