Article

An Immunochromatographic Test Strip for Rapid Quantitative Control of Monoclonal Antibodies against Programmed Cell Death Protein 1

1
Zhejiang Provincial Key Laboratory of Biometrology and Inspection & Quarantine, College of Life Sciences, China Jiliang University, Xueyuan Street, Xiasha Higher Education District, Hangzhou 310018, China
2
Hangzhou Mingzhi Medical Laboratory Co., Ltd., Hangzhou 310020, China
*
Authors to whom correspondence should be addressed.
Molecules 2024, 29(13), 3046; https://doi.org/10.3390/molecules29133046
Submission received: 6 May 2024 / Revised: 14 June 2024 / Accepted: 23 June 2024 / Published: 27 June 2024

Abstract

:
Cancer is one of the major public health challenges in the world, which is characterized by rapid progression and high mortality. Immunotherapy, represented by PD-1 monoclonal antibody, has significantly improved the efficacy of malignant tumors and has become one of the most popular immunotherapy methods at present. Therefore, there is an increasing demand for novel detection methods for PD-1 monoclonal antibodies. The aim of this work was to establish a rapid, simple, and sensitive immunochromatographic test strip (ICTS) based on the AuNPs enlargement for both visual and instrumental detection of the PD-1 monoclonal antibody concentration. The mixed solution of NH2OH·HCl and HAuCl4 was used as an enhancement solution to lower the detection limit and achieve higher sensitivity. A test strip reader was used to construct a visualized quantitative detection standard curve for the PD-1 monoclonal antibody concentration. The LOD was 1.58 ng/mL through a triple signal-to-noise ratio. The detection time was within 10 min. The constructed test strips can rapidly, accurately, and efficiently detect the concentration of PD-1 monoclonal antibody in real samples.

1. Introduction

In recent years, the global market of biological products has grown rapidly. The market size of protein-based biological products accounts for nearly 90% and maintains an annual growth rate of nearly 10%, mainly including antibodies such as PD-1 monoclonal antibody, cytokines such as interleukin, enzymes such as thrombin, and antibody–drug conjugates, which are mostly developed by European and American countries. Recently, China’s production capacity of protein biological products has developed, but the overall level still lags behind Europe and the United States, especially the low level of quality control, resulting in insufficient market competitiveness of domestic products. Therefore, improving the product quality detection ability is an important research field of protein biological products.
Programmed cell death protein 1 (PD-1), a member of the CD28/B7 family, is a checkpoint co-suppressor expressed on the surface of immune cells, playing a crucial role in the negative regulation of the immune response [1,2]. Programmed death ligand 1 (PD-L1), the main ligand of PD-1, exerts its function of inhibiting T cell activity by binding to PD-1, preventing T cells from recognizing cancer cells [3]. Studies have shown that anti-tumor immunity can be enhanced by blocking the PD-1/PD-L1 pathway [4,5]. Immunotherapy, represented by the PD-1 monoclonal antibody, has dramatically improved the efficacy of malignant tumors and has become one of the most popular immunotherapy methods at present [6]. PD-1 antibody drugs include Pabolizumab, Sindilizumab injection, Tirellizumab injection, etc., which are used in the treatment of Hodgkin’s lymphoma, lung cancer, melanoma, colorectal cancer, primary liver cancer, etc. [7,8,9,10,11,12,13,14,15]. In the in-depth clinical research on the PD-1 monoclonal antibody, the quality detection of the antibody is so important to ensure that the antibody has a high purity and titer. Therefore, there is an increasing demand for new PD-1 monoclonal antibody detection methods. Puszkiel et al. reported an ELISA method for the quantification of nivolumab in plasma from NSCLC patients [16]. The detection limit of this method was 5 g/mL. Iwamoto et al. validated the LC–MS/MS analysis of immune checkpoint inhibitor nivolumab in human plasma using a Fab peptide-selective quantitation method; the detection limit was 0.977 g/mL [17]. Pluim et al. used an enzyme-linked immunosorbent assay (ELISA) for the quantification of nivolumab and pembrolizumab in human serum and cerebrospinal fluid with a detection limit of 2 ng/mL [18]. So far, commonly used detection methods for the PD-1 antibody concentration have the benefits of excellent detectability and high specificity, but the drawbacks include a high detection cost, complex operation, and dependence on large instruments. As mentioned above, instrument methods, such as LC/MS/MS, involve sample processing, such as denaturation, reduction, alkylation, and digestion of protein analytes, which require a long experiment time and rely on large instruments. An immunoassay, such as the ELISA method, still requires approximately 2 h of time and a microplate reader [19]. Consequently, it is crucial to develop a more rapid, simple, and sensitive method for detecting the PD-1 antibody concentration. Immunochromatographic test strips (ICTS) have been considered to be attractive sensing tools because of their rapidity, portability, low cost, and on-site detection format. This method does not need sophisticated instruments, and the operation is very easy. The detection time is as little as 5–15 min [20,21]. ICTS have been extensively used in food hazard detection, environmental monitoring, in vitro diagnosis, medical diagnosis, and other aspects [22,23].
The aim of this work was to establish a rapid, simple, and sensitive immunochromatographic test strip (ICTS) for both visual and instrumental detection of the concentration of the PD-1 monoclonal antibody. The commonly used method for antibody detection is non-competitive immunochromatography, but one kind of additional antibody needs to be added. For the purpose of cost reduction, in this work, competitive immunochromatography was used, which would not be too expensive. The principle of this work was shown in Scheme 1. AuNPs-PD-L1 (a compound of PD-L1 and AuNPs) is used as the probe. PD-1 is fixed to the T-line of the test strip. When the concentration of PD-1 monoclonal antibody is 0 mg/mL, AuNPs-PD-L1 will bind to PD-1, and the color of the T-line is the darkest at this time. When the concentration of the PD-1 monoclonal antibody increases, AuNPs-PD-L1 and the PD-1 monoclonal antibody will compete to bind PD-1, and the color of the T-line gradually becomes lighter. Qualitative detection of PD-1 monoclonal antibody is performed using the naked eye, while quantification is performed using a test strip reader. In order to achieve the optimal test performance, all assay parameters were investigated [24].

2. Results and Discussion

2.1. Characterization and Identification of AuNPs and AuNPs-PD-L1

The color of AuNPs depended on their diameter, and the AuNPs with the diameter of 10–20 nm were wine red [25]. As shown in Figure 1a, the prepared AuNPs were wine red to the naked eye, with a clear color and no impurities. Furthermore, the prepared AuNPs and AuNPs-PD-L1 were scanned by a spectrometer. As shown in Figure 1b, the prepared AuNPs had an obvious single characteristic absorption peak at 519 nm. When combined with PD-L1, the peak value shifted from 519 nm to 524 nm, indicating that AuNPs and PD-L1 were combined successfully. Moreover, as shown by TEM characterization in Figure 1c, AuNPs had a uniform diameter and good dispersibility, and there was no agglomeration phenomenon. According to the diameter analysis in Figure 1d, the diameter of the prepared AuNPs was 13.56 nm, and the lattice spacing was 1.24 nm, as shown in Figure 1e. The results showed that the AuNPs were prepared successfully in the small and uniform diameter.

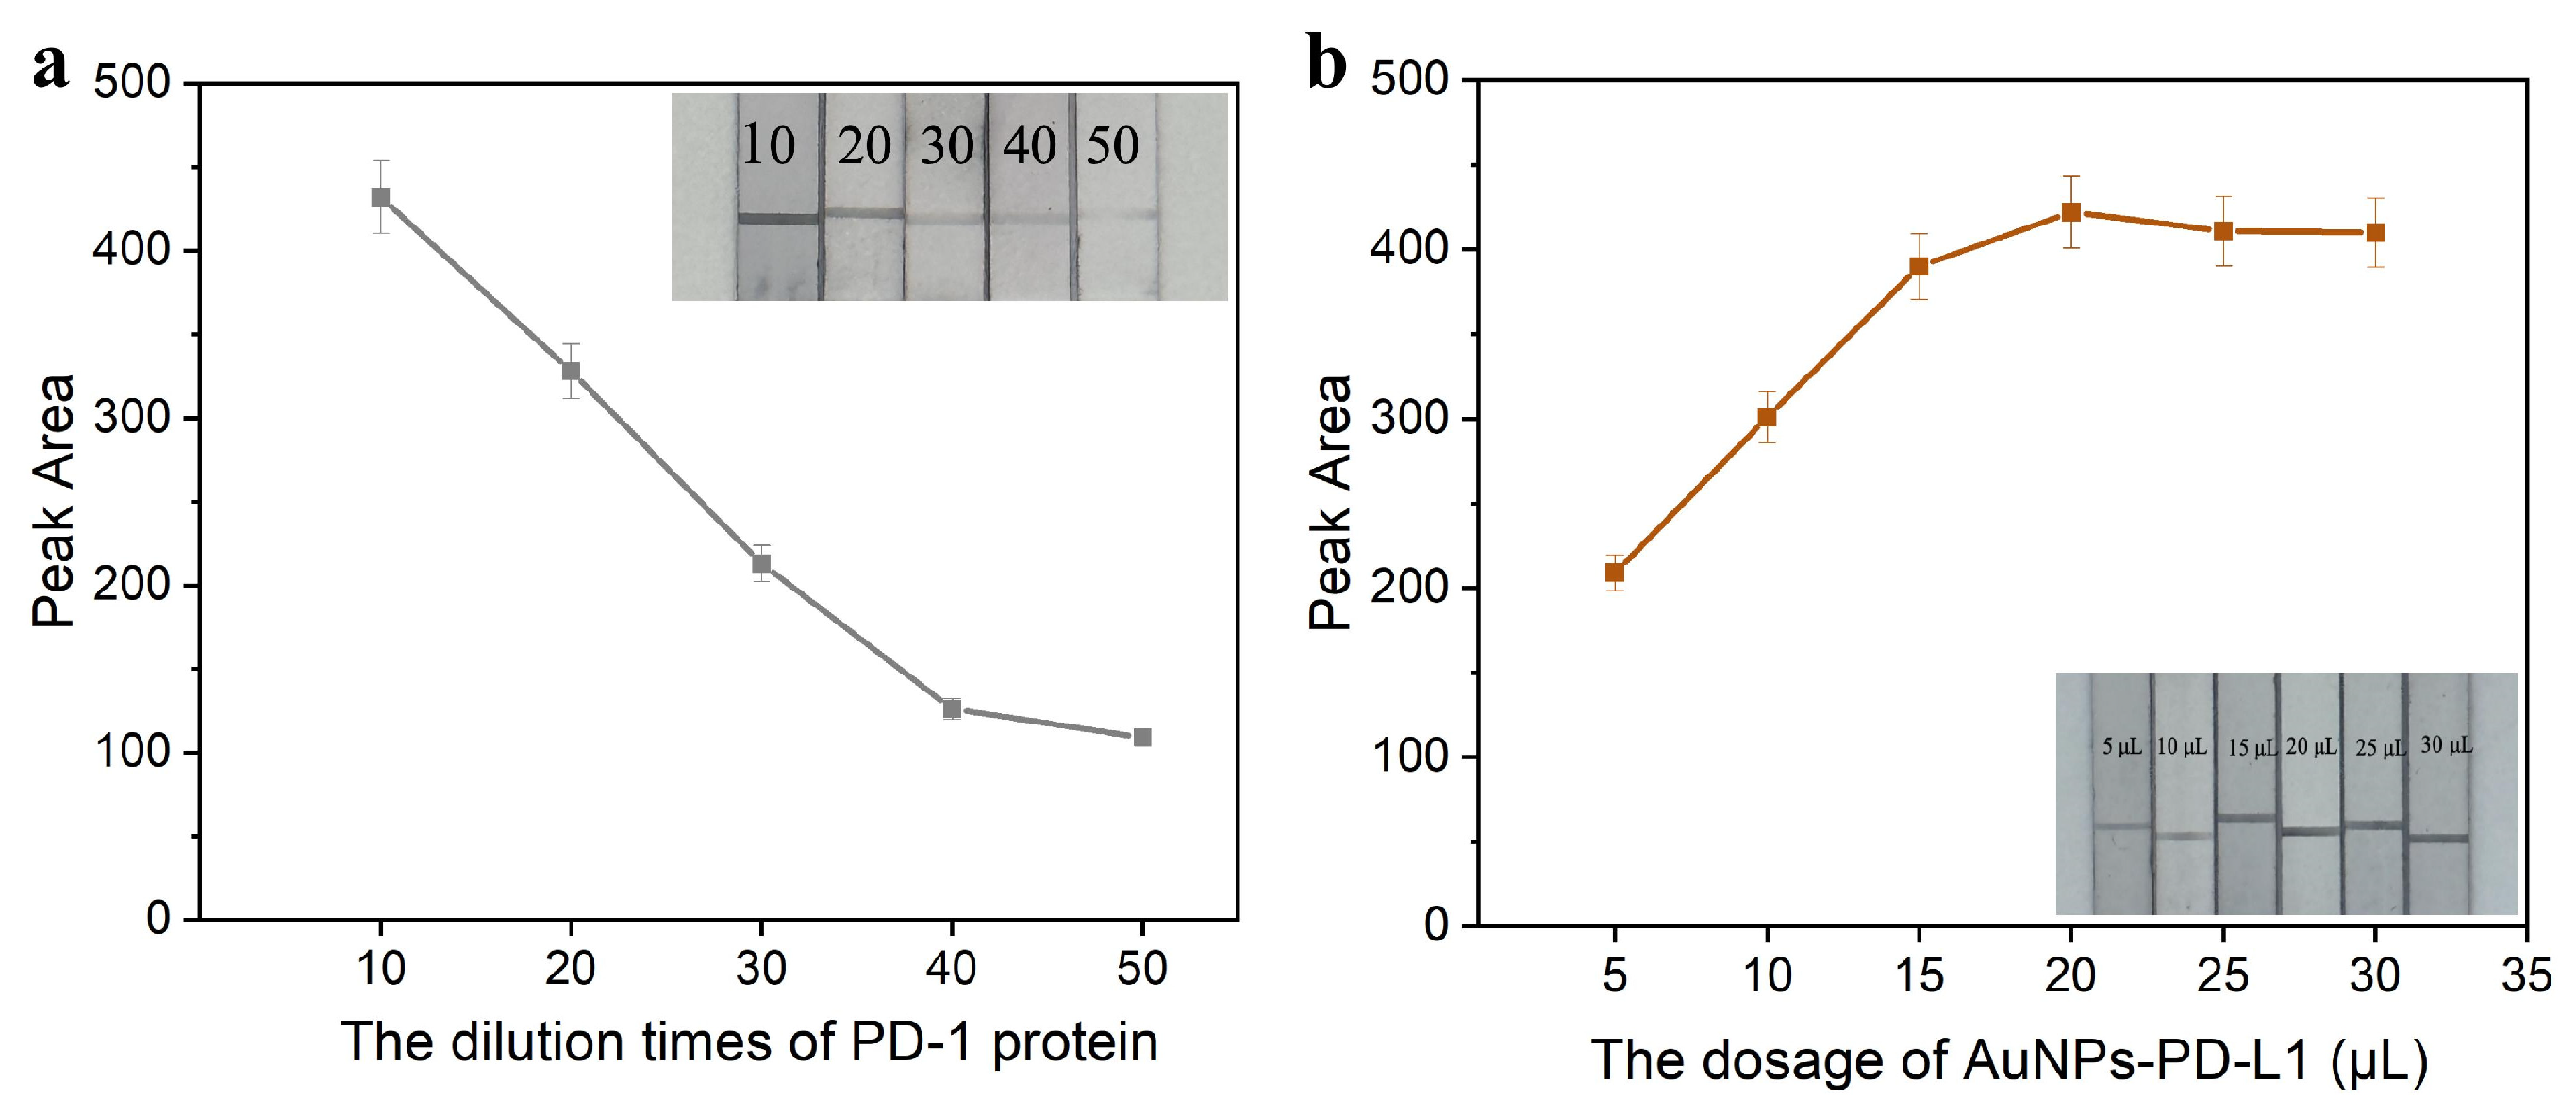
2.2. Optimization Results of Experimental Conditions

As shown in Figure S1a, the PH of AuNPs was adjusted with K2CO3. When 1 mL of AuNPs was added with 2 μL of K2CO3, the color of AuNPs was wine red and would not change any more. The results showed that the optimal PH was 1 mL of AuNPs added with 2 μL of 0.2 mol/L potassium carbonate. As shown in Figure S1b, when 1 mL of AuNPs was added with 1 μL of PD-L1, the color of AuNPs changed from blue to red, indicating that the dosage of 1 μL of PD-L1 to 1 mL of AuNPs was the most appropriate.
As shown in Figure 2a, when PD-1 protein was diluted 10 times (the concentration of PD-1 protein was 0.17 mg/mL), the T-line color of the test strip was the darkest, and the peak area was 432. When increasing the dilution times of PD-1 protein, the color of the T-line gradually became lighter, and the peak area declined. Therefore, a dilution of 10 times was the best dilution of PD-1 protein. As shown in Figure 2b, when increasing the dosage of AuNPs-PD-L1, the color of the T-line gradually became darker. When the dosage of AuNPs-PD-L1 was 20 μL, the color of the T-line was obvious, and the peak area was 422. Subsequently, when increasing the dosage of AuNPs-PD-L1, the color of the T-line, as well as the peak area, were basically unchanged. Therefore, the optimal dosage of AuNPs-PD-L1 was 20 μL.
As shown in Figure S1c, when ultra-pure water was used, the T-line had no color. When PB buffer was used, the color of the T-line was the darkest, but the test result was a false-positive. When PBST and PBS buffer were used, the T-line color was moderate, and when PBS buffer was used, the T-line was darker and clearer. Therefore, the best loading buffer was the PBS buffer. As shown in Figure S1d, when the ratio of HAuCl4 to NH2OH·HCl was 1:5, the color of the T-line appeared darker, but when different concentrations of PD-1 monoclonal antibody were added, the T-line color did not change, indicating the presence of false-positive results. When the ratio was 1:15, the color of the T-line was lighter, indicating a decrease in sensitivity. When the ratio was 1:10, distinct colors were visible on the T-line, with no false-positive results. Therefore, the optimal ratio between HAuCl4 and NH2OH·HCl was chosen as 1:10.

2.3. Results of Analytical Performance

As shown in Figure 3a, when the concentration of the PD-1 monoclonal antibody decreased, the T-line color of the test strip gradually became darker. When the concentration of the PD-1 monoclonal antibody was 1.58 ng/mL, the peak area was 485. With the decrease in the concentration of the PD-1 monoclonal antibody, the peak area did not change. Therefore, the LOD was 1.58 ng/mL through a triple signal-to-noise ratio. As shown in Figure 3b, the T-line color of the test strip with the addition of the PD-1 monoclonal antibody became lighter, and the peak area was about 435. There was no significant change in the T-line color of the test strip with adding BSA and OVA, with peak areas of 429 and 435, respectively. This indicated that the test strip did not react with other proteins and had high specificity. As shown in Figure 3c, the test strips were tested at different times, the test results were basically consistent, and the peak area was about 435. The strips were clear and stable. As shown in Figure 3d, the thickness and uniformity of the T-line of the test strips in batches A, B, C, and D were basically consistent, and the peak area was about 432, indicating that the test strip had good repeatability.
As shown in Table 1, the recovery rates of samples in PBS buffer and human serum were 95.00–107.40% and 96.67–99.28%, respectively. The relative standard deviations were 5.06–8.81% and 3.10–9.29%, respectively.
As shown in Table S2, the recovery rates of samples in the PBS buffer and human serum via the ELISA method were 99.33–101.15% and 98.33–101.33%, respectively. The relative standard deviations were 2.09–9.84% and 1.37–9.50%, which were consistent with the results of the immunochromatographic test strip, indicating the test strip has good accuracy and precision and can be applied in detecting human serum.
As shown in Table 2, two real samples were detected; the measurement value of the ICTS method was 4.82 mg/mL and 9.82 mg/mL, respectively, close to the actual concentration of the real samples. The relative standard deviation of the ICTS method was 1.43–2.04%, while that of the ELISA method was 1.49–1.87%, indicating that the immunochromatographic test strip was applicable in real samples and had practical application value.

3. Materials and Methods

3.1. Materials and Reagents

Human Anti-PDCD1/PD-1/CD279 Reference Antibody (pembrolizumab), Human PD-1 protein, and PD-L1 protein were purchased from Sanyou Biopharmaceutical Co., LTD. (Shanghai, China). Tetrachloro-auric acid (HAuCl4) and OVA were purchased from Sigma-Aldrich (Saint Louis, MO, USA). Hydroxylamine hydrochloride (NH2OH·HCl) and trisodium citrate were purchased from Shanghai Macklin Biochemical Technology Co., LTD. (Shanghai, China). Bovine Serum Albumin (BSA) was purchased from Beijing Solarbio Science & Technology Co., Ltd. (Beijing, China). PBST, PBS, PB, and Tween-20 were purchased from Aladdin Reagent (Shanghai) Co., LTD. (Shanghai, China). All elements of immunochromatographic test strip (Sample pad, Nitrocellulose membrane (Catalogue No. NCKB15A-25, Model No. NCKB15A, pore size: 15 um, Batch No. SRB022022, Width: 25 mm), absorbent pad and PVC plywood) were obtained from the Shanghai Gold Label Biological Company (Shanghai, China).

3.2. Preparation of AuNPs-PD-L1

According to previous work [26], AuNPs were prepared as follows: a mixture of 100 μL 10% (v/v) HAuCl4 and 99.9 mL of ultra-pure water was boiled. Then, 2.5 mL 1% citric acid was added quickly and heated for 15 min. When the color of the solution gradually turned wine red, heating was stopped immediately. The solution was cooled to room temperature. Finally, the solution was kept away from light and stored in a refrigerator at 4 °C. The prepared AuNPs were characterized by a spectrometer and Transmission Electron Microscope.
AuNPs-PD-L1 was prepared as follows: PD-L1 was added to 1 mL AuNPs, and the PH was adjusted with 0.2 M K2CO3. After mixing well, the PD-L1 was placed in a refrigerator at 4 °C for 1 h. Then, 20 μL of 20% BSA was added, and the mixed solution was once again placed at 4 °C for 1 h. The reaction solution was centrifuged at high speed (11,180× g) for 15 min. The precipitation was dispersed in 100 μL of buffer solution (0.02 mol/L PB, pH of 7.4) to obtain the AuNPs-PD-L1 and stored in a refrigerator at 4 °C away from light. The prepared AuNPs-PD-L1 was characterized by spectrometer.

3.3. Optimization of Experimental Conditions

In order to improve the sensitivity of the established immunochromatographic strips, it was essential to optimize different experimental conditions such as dosages of K2CO3 and PD-L1 in the preparation of AuNPs-PD-L1, PD-1 protein dilution times, dosage of AuNPs-PD-L1, loading buffer, and the ratio of HAuCl4 and NH2OH·HCl. The selections of the optimal experimental conditions were based on the T-line color as well as the peak area of the test strip reader.
Initially, in the preparation of AuNPs-PD-L1, the dosages of K2CO3 (0.2 mol/L) and PD-L1 would affect the coupling effect of AuNPs and PD-L1. Therefore, the dosages of K2CO3 and PD-L1 were optimized in this experiment. Different dosages of K2CO3 (1 μL, 2 μL, 3 μL, 4 μL, and 5 μL) and PD-L1 (0.5 μL, 1 μL, 1.5 μL, 2 μL, and 2.5 μL) were added, respectively, and the remaining experimental steps are referred to in Section 2.2. The color changes of each tube were observed; when the AuNPs were wine red without change, the dosages of K2CO3 and PD-L1 added to the tube were optimal. Then, PD-1 protein (1.66 mg/mL) was diluted at different times (10, 20, 30, 40, and 50) with buffer, and the final concentration of PD-1 protein was 0.166 mg/mL, 0.083 mg/mL, 0.055 mg/mL, 0.042 mg/mL, and 0.033 mg/mL. Immunochromatographic test strips with different T-line concentrations were prepared. In addition, different dosages of AuNPs-PD-L1 (5 μL, 10 μL, 15 μL, 20 μL, 25 μL, and 30 μL) were mixed with Tween-20 and PD-1 monoclonal antibody, respectively. The mixed solutions were added to the immunochromatographic test strips. Further, ultra-pure water, PBST, PBS, and PB were chosen as different buffers to dilute the PD-1 antibody. Tween-20, AuNPs-PD-L1, and PD-1 monoclonal antibody were mixed with different buffers and added to the immunochromatographic test strips. Furthermore, the optimal ratio of HAuCl4 and NH2OH·HCl was critical in the experiment, which might affect whether the experimental results could be read smoothly. HAuCl4 and NH2OH·HCl were mixed at the ratio of 1:5, 1:10, and 1:15. A certain dosage of AuNPs-PD-L1, 100 μL of buffer, and Tween-20 were mixed and added to the immunochromatographic test strips. Then, the enhancement solution was added to the sample pad after 5 min. The results of the test strips were observed, and the optimal experimental conditions were selected.

3.4. Preparation of Immunochromatographic Strips

The strips were made of sample pads, nitrocellulose membranes, absorbent pads, and PVC plywood. The nitrocellulose membranes, sample pad, and absorbent pad were assembled on the PVC plywood in turn, overlapping each other by about 2 mm. PD-1 protein was allocated to nitrocellulose membrane at a rate of 0.5 μL/cm to prepare the test area of the immunochromatographic strip, forming the T-line, and the strips were dried for 8 h at 37 °C in the oven. The strips were then cut into 4 mm wide pieces and kept in a dry environment. The assembly diagram of the immunochromatographic strip is shown in Figure S2.

3.5. Establishment of the AuNP Enlargement Immunochromatographic Methods

The principle of the AuNPs enlargement immunochromatographic methods is as follows: without AuNPs, NH2OH·HCl has a weak reducibility to HAuCl4, thus slowly generating AuNPs. On the contrary, in the presence of AuNPs, the reduction process between NH2OH·HCl and HAuCl4 can be catalyzed by AuNPs, thereby rapidly generating new AuNPs. These new AuNPs will rapidly deposit and cover the surface of the initial AuNPs to form larger AuNPs, which will significantly amplify the signal at the T-line of the strip [27].
Figure 4 depicts the process of detecting the concentration of PD-1 monoclonal antibody on a strip. The mixed solution of PD-1 monoclonal antibody, AuNPs-PD-L1, and Tween-20 was dripped onto the sample pad, and the mixed solution flowed forward due to driving capillary action. According to the specific antigen and antibody recognition, the PD-1 protein fixed on the nitrocellulose membrane was captured, resulting in the accumulation of AuNPs on the surface of the area, and the excess AuNPs continued to flow until being absorbed [28]. The color of the T-line was red at this time. Then, the enhancement solution (a solution of NH2OH·HCl and HAuCl4 mixed in a certain ratio) was dripped onto the sample pad. The newly generated AuNPs were accumulated onto the T-line to form the larger diameter of AuNPs, significantly enhancing the signal on the T-line. The color of the T-line became purple at this time.

3.6. Test Strip Reader

A portable test strip reader was developed, which could match the immunochromatographic test strip. The reader used the photoelectric sensing system to detect the reflected light on the test samples using a light-emitting diode, and the photoelectric sensor converted the light signal into an electrical signal and output the detection data after processing. By using the reader to distinguish the color change of the test strip, the subjective error caused by human interpretation could be avoided, and the test results could be obtained quickly, with high accuracy and repeatability. The concentration of the PD-1 monoclonal antibody was detected by measuring the reflected light intensity to reflect the color of the strip. Using the peak area method, the vertical coordinate was the peak area, and the horizontal coordinate was the experimental parameters of the PD-1 monoclonal antibody, plotting the experimental results.

3.7. Analytical Performance of Immunochromatographic Test Strips

While under the selected optimal experimental conditions, the detection limit, the specificity, the stability, the repeatability, the accuracy, and the applicability of the immunochromatographic strips for PD-1 monoclonal antibody were assessed to indicate analytical performance of immunochromatographic test strips.
Firstly, 10 μL of Tween-20, 20 μL of AuNPs-PD-L1, and 90 μL of PD-1 antibodies were mixed and added to the immunochromatographic test strips. Then, the strips were left for 10 min, and the color changes of the T-line were observed. Then, 1% HAuCl4 and NH2OH·HCl were mixed at a certain ratio as enhancement solution. Next, 100 μL of enhancement solution was added to the sample pad, and the color changes of T-line were observed after being left for 5 min. According to the principle of competitive immunochromatography, when the concentration of PD-1 monoclonal antibody was 0 mg/mL, the color of the T-line should be the darkest, and with the increase in the concentration of PD-1 monoclonal antibody, the color of the T-line gradually became lighter until disappearing. At this time, the concentration of PD-1 monoclonal antibody was the detection limit of the immunochromatography strips.
In addition, the prepared immunochromatographic strips were used to detect PD-1 monoclonal antibody, BSA, OVA, and other samples. PD-1 monoclonal antibody, BSA, and OVA were added, respectively. Their concentrations were the same, 0.5 mg/mL. If the color of the T-line became lighter, it indicated that there was a reaction. The color change of the T-line was observed, and the specificity of the immunochromatographic strip was evaluated.
Further, the prepared immunochromatographic strips were placed in a plastic bag equipped with desiccants and placed at room temperature. The immunochromatographic strips were detected at 1, 2, 3, 4, 5, 6, and 12 months after storage. The stability of the immunochromatographic strips was evaluated according to the color change of T-line.
Moreover, four different batches of immunochromatographic strips, A, B, C, and D, were prepared. The detection results were compared, and the repeatability of the immunochromatographic strip was evaluated according to the color change of the T-line.
Moreover, different concentrations of PD-1 monoclonal antibody standard were added to the PBS buffer and human serum. The recovery rates and relative standard deviations were calculated by both ICTS method and ELISA method to evaluate the accuracy.
Lastly, two kinds of real samples were detected by both ICTS method and ELISA method to test the applicability of the prepared immunochromatographic strips.

4. Conclusions

In this work, a rapid, simple, and sensitive immunochromatographic strip (ICTS) was developed for visual and instrumental detection of the concentration of the PD-1 monoclonal antibody. This study also features the establishment of AuNPs enlargement immunochromatographic methods. Further, the establishment of the AuNPs enlargement methods improved the sensitivity of PD-1 monoclonal antibody detection based on traditional AuNPs. After optimization, HAuCl4 and NH2OH·HCl were added to the sample pad in the ratio of 1:10. Under the optimal conditions, the LOD was 1.58 ng/mL with a triple signal-to-noise ratio. The entire testing process took only 10 min to obtain results, which was significantly shorter than other testing methods. The visual quantitative detection standard curve of PD-1 monoclonal antibody concentration was constructed by using the test strip reader. The constructed immunochromatographic strip had good stability, repeatability, and specificity and can rapidly, accurately, and efficiently detect the concentration of the PD-1 monoclonal antibody in real samples.

Supplementary Materials

The following supporting information can be downloaded at: https://www.mdpi.com/article/10.3390/molecules29133046/s1, Figure S1: Assembly diagram of immunochromatographic test strips; Figure S2: Optimization of experimental conditions; Table S1: Comparison of the methods for the detection of PD-1 monoclonal antibody drugs [16,17,18]; Table S2: Accuracy and precision of ELISA methods.

Author Contributions

Conceptualization, writing—original draft preparation, validation, J.Z.; conceptualization, writing—original draft preparation, data curation, C.L. and F.L.; validation, methodology, Y.C. and X.W.; project administration, writing—review and editing, funding acquisition, Y.F., X.Y., B.Z. and Z.Y. All authors have read and agreed to the published version of the manuscript.

Funding

This research was funded by the National Key Research and Development Programs of China (Grant No. 2021YFF0600800) and the Zhejiang Provincial Natural Science Foundation of China (Grant No. LQ23C200006).

Institutional Review Board Statement

Not applicable.

Informed Consent Statement

Not applicable.

Data Availability Statement

The datasets generated for this study are available on request to the corresponding author.

Conflicts of Interest

The authors declare that they have no known competing financial interests or personal relationships that could appear to influence the work reported in this paper.

References

  1. Greenwald, R.J.; Freeman, G.J.; Sharpe, A.H. The B7 family revisited. Annu. Rev. Immunol. 2005, 23, 515–548. [Google Scholar] [CrossRef]
  2. Wang, J.; Zhao, X.; Wang, Y.; Ren, F.; Sun, D.; Yan, Y.; Kong, X.; Bu, J.; Liu, M.; Xu, S. circRNA-002178 act as a ceRNA to promote PDL1/PD1 expression in lung adenocarcinoma. Cell Death Dis. 2020, 11, 32. [Google Scholar] [CrossRef]
  3. Azadi, S.; Aboulkheyr Es, H.; Razavi Bazaz, S.; Thiery, J.P.; Asadnia, M.; Ebrahimi Warkiani, M. Upregulation of PD-L1 expression in breast cancer cells through the formation of 3D multicellular cancer aggregates under different chemical and mechanical conditions. Biochimica et biophysica acta. Mol. Cell Res. 2019, 1866, 118526. [Google Scholar] [CrossRef]
  4. Liu, X.G.; Hou, M.; Liu, Y. TIGIT, A Novel Therapeutic Target for Tumor Immunotherapy. Immunol. Investig. 2017, 46, 172–182. [Google Scholar] [CrossRef]
  5. Pardoll, D.M. The blockade of immune checkpoints in cancer immunotherapy. Nature reviews. Cancer 2012, 12, 252–264. [Google Scholar]
  6. Zou, W.; Wolchok, J.D.; Chen, L. PD-L1 (B7-H1) and PD-1 pathway blockade for cancer therapy: Mechanisms, response biomarkers, and combinations. Sci. Transl. Med. 2016, 8, 328rv324. [Google Scholar] [CrossRef]
  7. Wang, Y.; Wang, Y.; Jiang, M.; Zhao, Y.; Zhang, X. Effect of Pembrolizumab on T Lymphocyte Subsets in Patients with Advanced Non-small Cell Lung Cancer and Its Therapeutic Effect. Zhongguo Fei Ai Za Zhi = Chin. J. Lung Cancer 2021, 24, 182–187. [Google Scholar]
  8. Uldrick, T.S.; Gonçalves, P.H.; Abdul-Hay, M.; Claeys, A.J.; Emu, B.; Ernstoff, M.S.; Fling, S.P.; Fong, L.; Kaiser, J.C.; Lacroix, A.M.; et al. Assessment of the Safety of Pembrolizumab in Patients with HIV and Advanced Cancer-A Phase 1 Study. JAMA Oncol. 2019, 5, 1332–1339. [Google Scholar] [CrossRef]
  9. Lam, V.K.; Forde, P.M. Another Brick in the Wall: Sintilimab Plus Chemotherapy in Advanced Lung Cancer. J. Thorac. Oncol. Off. Publ. Int. Assoc. Study Lung Cancer 2020, 15, 1556–1558. [Google Scholar] [CrossRef]
  10. Lee, A.; Keam, S.J. Tislelizumab: First Approval. Drugs 2020, 80, 617–624. [Google Scholar] [CrossRef]
  11. Al-Sawaf, O.; Ligtvoet, R.; Robrecht, S.; Stumpf, J.; Fink, A.M.; Tausch, E.; Schneider, C.; Boettcher, S.; Mikusko, M.; Ritgen, M.; et al. Tislelizumab plus zanubrutinib for Richter transformation: The phase 2 RT1 trial. Nat. Med. 2024, 30, 240–248. [Google Scholar] [CrossRef]
  12. Garon, E.B.; Rizvi, N.A.; Hui, R.; Leighl, N.; Balmanoukian, A.S.; Eder, J.P.; Patnaik, A.; Aggarwal, C.; Gubens, M.; Horn, L.; et al. Pembrolizumab for the treatment of non-small-cell lung cancer. N. Engl. J. Med. 2015, 372, 2018–2028. [Google Scholar] [CrossRef]
  13. Robert, C.; Ribas, A.; Wolchok, J.D.; Hodi, F.S.; Hamid, O.; Kefford, R.; Weber, J.S.; Joshua, A.M.; Hwu, W.J.; Gangadhar, T.C.; et al. Anti-programmed-death-receptor-1 treatment with pembrolizumab in ipilimumab-refractory advanced melanoma: A randomised dose-comparison cohort of a phase 1 trial. Lancet 2014, 384, 1109–1117. [Google Scholar] [CrossRef]
  14. Topalian, S.L.; Hodi, F.S.; Brahmer, J.R.; Gettinger, S.N.; Smith, D.C.; McDermott, D.F.; Powderly, J.D.; Carvajal, R.D.; Sosman, J.A.; Atkins, M.B.; et al. Safety, activity, and immune correlates of anti-PD-1 antibody in cancer. N. Engl. J. Med. 2012, 366, 2443–2454. [Google Scholar] [CrossRef]
  15. Qin, S.; Kudo, M.; Meyer, T.; Bai, Y.; Guo, Y.; Meng, Z.; Satoh, T.; Marino, D.; Assenat, E.; Li, S.; et al. Tislelizumab vs Sorafenib as First-Line Treatment for Unresectable Hepatocellular Carcinoma: A Phase 3 Randomized Clinical Trial. JAMA Oncol. 2023, 9, 1651–1659. [Google Scholar] [CrossRef]
  16. Puszkiel, A.; Noé, G.; Boudou-Rouquette, P.; Cossec, C.L.; Arrondeau, J.; Giraud, J.S.; Thomas-Schoemann, A.; Alexandre, J.; Vidal, M.; Goldwasser, F.; et al. Development and validation of an ELISA method for the quantification of nivolumab in plasma from non-small-cell lung cancer patients. J. Pharm. Biomed. Anal. 2017, 139, 30–36. [Google Scholar] [CrossRef]
  17. Iwamoto, N.; Shimada, T.; Terakado, H.; Hamada, A. Validated LC-MS/MS analysis of immune checkpoint inhibitor Nivolumab in human plasma using a Fab peptide-selective quantitation method: Nano-surface and molecular-orientation limited (nSMOL) proteolysis. J. Chromatogr. B Anal. Technol. Biomed. Life Sci. 2016, 1023–1024, 9–16. [Google Scholar] [CrossRef]
  18. Pluim, D.; Ros, W.; van Bussel, M.T.J.; Brandsma, D.; Beijnen, J.H.; Schellens, J.H.M. Enzyme linked immunosorbent assay for the quantification of nivolumab and pembrolizumab in human serum and cerebrospinal fluid. J. Pharm. Biomed. Anal. 2019, 164, 128–134. [Google Scholar] [CrossRef]
  19. Yin, M.; Hu, X.; Sun, Y.; Xing, Y.; Xing, G.; Wang, Y.; Li, Q.; Wang, Y.; Deng, R.; Zhang, G. Broad-spectrum detection of zeranol and its analogues by a colloidal gold-based lateral flow immunochromatographic assay in milk. Food Chem. 2020, 321, 126697. [Google Scholar] [CrossRef]
  20. Wang, J.; Meng, H.-M.; Chen, J.; Liu, J.; Zhang, L.; Qu, L.; Li, Z.; Lin, Y. Quantum Dot-Based Lateral Flow Test Strips for Highly Sensitive Detection of the Tetanus Antibody. ACS Omega 2019, 4, 6789–6795. [Google Scholar] [CrossRef]
  21. Quesada-González, D.; Merkoçi, A. Nanoparticle-based lateral flow biosensors. Biosens. Bioelectron. 2015, 73, 47–63. [Google Scholar] [CrossRef] [PubMed]
  22. Wu, P.; Xue, F.; Zuo, W.; Yang, J.; Liu, X.; Jiang, H.; Dai, J.; Ju, Y. A Universal Bacterial Catcher Au-PMBA-Nanocrab-Based Lateral Flow Immunoassay for Rapid Pathogens Detection. Anal. Chem. 2022, 94, 4277–4285. [Google Scholar] [CrossRef] [PubMed]
  23. Wang, Y.; Wang, T.; Wang, M.; Wang, J.; Xu, Z.; Zhang, H. Photothermal card reader assay using the commercial colloidal gold test strip for the rapid quantitative detection of food hazards. Mikrochim. Acta 2022, 189, 112. [Google Scholar] [CrossRef] [PubMed]
  24. Mermiga, E.; Pagkali, V.; Kokkinos, C.; Economou, A. An Aptamer-Based Lateral Flow Biosensor for Low-Cost, Rapid and Instrument-Free Detection of Ochratoxin A in Food Samples. Molecules 2023, 28, 8135. [Google Scholar] [CrossRef]
  25. Sun, F.; Yan, C.; Jia, Q.; Wu, W.; Cao, Y. A Novel Aptamer Lateral Flow Strip for the Rapid Detection of Gram-positive and Gram-negative Bacteria. J. Anal. Test. 2023, 7, 79–88. [Google Scholar] [CrossRef]
  26. Yao, D.; Liang, A.; Yin, W.; Jiang, Z. Resonance light scattering determination of trace bisphenol A with signal amplification by aptamer-nanogold catalysis. Lumin. J. Biol. Chem. Lumin. 2014, 29, 516–521. [Google Scholar] [CrossRef]
  27. Li, J.; Zou, M.; Chen, Y.; Xue, Q.; Zhang, F.; Li, B.; Wang, Y.; Qi, X.; Yang, Y. Gold immunochromatographic strips for enhanced detection of avian influenza and Newcastle disease viruses. Anal. Chim. Acta 2013, 782, 54–58. [Google Scholar] [CrossRef]
  28. Tong, B. Study on High-Sensitive Immunochromatographic Assay Detection of Salmonella Enteritidis; Northwest A&F University: Xianyang, China, 2018. [Google Scholar]
Scheme 1. Schematic illustration of immunochromatographic strips. (a) Preparation of AuNPs-PD-L1; (b) Detection principle; (c) Result reading.
Molecules 29 03046 sch001
Figure 1. Characterization analysis of AuNPs and AuNPs-PD-L1. (a) An image of AuNPs to the naked eye; (b) Visible absorption spectra of AuNPs and AuNPs-PD-L1; (c) TEM image of AuNPs; (d) The diameter analysis of AuNPs; (e) The lattice spacing of AuNPs.
Molecules 29 03046 g001
Figure 2. Optimization results of experimental conditions. (a) Optimization of PD-1 protein dilution times (the concentration of PD-1 protein was 0.166 mg/mL, 0.083 mg/mL, 0.055 mg/mL, 0.042 mg/mL, and 0.033 mg/mL, n = 3). (b) Optimization of AuNPs-PD-L1 dosage (n = 3).
Molecules 29 03046 g002
Figure 3. Performance identification of immunochromatographic test strips. (a) Detection limit (the PD-1 antibody concentrations from left to right were 0.28 mg/mL, 0.09 mg/mL, 0.03 mg/mL, 0.01 mg/mL, 3.4 mg/mL, 1.12 μg/mL, 0.38 μg/mL, 0.13 μg/mL, 0.04 μg/mL, 14.0 ng/mL, 4.7 ng/mL, 1.58 ng/mL, and 0 ng/mL); (b) Specificity (the concentrations of PD-1 antibody, BSA, and OVA were 0.5 mg/mL, n = 3); (c) Stability (n = 3); (d) Repeatability (n = 3).
Molecules 29 03046 g003
Figure 4. Flow chart of immunochromatographic test strips for detecting the PD-1 monoclonal antibody concentration.
Molecules 29 03046 g004
Table 1. Accuracy and precision of immunochromatographic test strips.
Addition Concentration (mg/mL)Measurement Value (mg/mL)Average Value (mg/mL)Recovery Rate (%)Relative Standard
Deviation (%)
PBS buffer10.010.63
10.77
11.67
10.57
9.99
10.81
10.74107.405.06
1.00.99
1.11
0.91
0.99
1.01
1.13
1.02102.338.07
0.10.09
0.09
0.10
0.09
0.09
0.11
0.1095.008.81
human serum10.09.57
9.73
10.20
10.32
9.82
10.21
9.9399.283.10
1.01.09
1.06
0.97
0.99
0.89
0.86
0.9897.679.29
0.100.09
0.09
0.1
0.11
0.1
0.09
0.0196.678.45
Table 2. Application of immunochromatographic test strips to real samples (n = 3).
SamplesAcutal Concentration (mg/mL)ICTS MethodELISA Method
Measurement Value
(mg/mL)
Relative Standard
Deviation (%)
Measurement Value
(mg/mL)
Relative Standard
Deviation (%)
Sample 15.04.822.044.931.87
Sample 210.09.821.439.681.49
Disclaimer/Publisher’s Note: The statements, opinions and data contained in all publications are solely those of the individual author(s) and contributor(s) and not of MDPI and/or the editor(s). MDPI and/or the editor(s) disclaim responsibility for any injury to people or property resulting from any ideas, methods, instructions or products referred to in the content.

