Article

Molecular and Phytochemical Characteristics of Flower Color and Scent Compounds in Dog Rose (Rosa canina L.)

by
Parisa Jariani
1,
Ali-Akbar Shahnejat-Bushehri
1,
Roohangiz Naderi
2,
Meisam Zargar
3 and
Mohammad Reza Naghavi
1,3,*
1
Division of Biotechnology, Department of Agronomy and Plant Breeding, College of Agricultural and Natural Resources, University of Tehran, Karaj 31587-77871, Iran
2
Department of Horticulture Science, College of Agriculture and Natural Resources, University of Tehran, Karaj 31587-77871, Iran
3
Department of Agrobiotechnology, Institute of Agriculture, RUDN University, 117198 Moscow, Russia
*
Author to whom correspondence should be addressed.
Molecules 2024, 29(13), 3145; https://doi.org/10.3390/molecules29133145
Submission received: 18 February 2024 / Revised: 12 March 2024 / Accepted: 16 March 2024 / Published: 2 July 2024
(This article belongs to the Section Natural Products Chemistry)

Abstract

:
This study delves into the chemical and genetic determinants of petal color and fragrance in Rosa canina L., a wild rose species prized for its pharmacological and cosmetic uses. Comparative analysis of white and dark pink R. canina flowers revealed that the former harbors significantly higher levels of total phenolics (TPC) and flavonoids (TFC), while the latter is distinguished by elevated total anthocyanins (TAC). Essential oils in the petals were predominantly composed of aliphatic hydrocarbons, with phenolic content chiefly constituted by flavonols and anthocyanins. Notably, gene expression analysis showed an upregulation in most genes associated with petal color and scent biosynthesis in white buds compared to dark pink open flowers. However, anthocyanin synthase (ANS) and its regulatory gene RhMYB1 exhibited comparable expression levels across both flower hues. LC-MS profiling identified Rutin, kaempferol, quercetin, and their derivatives as key flavonoid constituents, alongside cyanidin and delphinidin as the primary anthocyanin compounds. The findings suggest a potential feedback inhibition of anthocyanin biosynthesis in white flowers. These insights pave the way for the targeted enhancement of R. canina floral traits through metabolic and genetic engineering strategies.

1. Introduction

Rose (Rosa L.) is a well-known ornamental plant that is admired for its attractive and aromatic petals [1]. The petals exhibit a wide range of colors and scents, which are of great interest for several industries, especially cosmetics and perfumery. The petals are the main source of rose oils, also known as “liquid gold”, which are highly sought-after for their distinctive fragrance and therapeutic benefits. However, rose oils are rare and costly, as roses have a low oil yield and no adequate natural or synthetic alternatives [2,3,4]. Hence, genetic diversity is essential for enhancing the quality and quantity of rose oils through breeding programs [5]. R. canina, or the dog rose, is a variable and climbing wild rose species that is native to Europe, northwest Africa, and western Asia [6]. It belongs to the Caninae section of the Rosa genus, which consists of about 20 species that share common features such as prickles, pinnate leaves, and deciduous sepals [7,8]. R. canina has a wide distribution in Iran, which is regarded as its primary center of diversity [9]. It produces flowers with white to pink petals that differ in color and shape among various populations. The flowers are followed by bright red fruits, called hips, that contain numerous seeds and are rich in vitamin C and other bioactive compounds [10,11,12]. R. canina has a long history of use for medicinal, cosmetic, and culinary purposes [13]. In particular, it is a valuable source of rose oils, which are obtained from the petals and used in perfumery and aromatherapy for their unique scent and therapeutic properties.
The emission of volatile organic compounds (VOCs) and the accumulation of various pigments, such as flavonoids and anthocyanins, are important functions of petals [14]. VOCs are produced by flowers through three main metabolic pathways: terpenoids, phenylpropanoids/benzenoids, and fatty acid derivatives [4]. These pathways utilize common precursors from the shikimate (SA), methylerythritol 4-phosphate (MEP), and mevalonate (MVA) pathways [14,15]. Terpenes, a major class of VOCs, are synthesized either in plastids via the MEP pathway or in cytosol via the MVA pathway [16]. Phenylpropanoids generate aromatic compounds, such as benzyl acetate, eugenol, methyl benzoate, phenylethyl acetate, and phenylethanol, using L-phenylalanine from the SA pathway as the main precursor [17]. Fatty acid derivatives, another class of VOCs, comprise low-molecular weight alcohols, aldehydes, and lipids. They are catalyzed by the lipoxygenase (LOX) pathway using linolenic and linoleic acid as initiators [18]. The color of rose flowers is mainly determined by flavonoids, anthocyanins, carotenoids, betalains, and other floral pigments, with flavonoids being the predominant group of secondary metabolites in plants [19]. Phenolic compounds are significant in R. canina due to their complex structure and antioxidant activity [20]. Flavonoids are the principal phenolic compounds in plants and have various biological effects [21]. Therefore, it is essential to identify and analyze different phenolic compounds in R. canina petals by LC-MS analysis.
Polyphenols are widely used in health and industry, but their isolation and characterization are difficult. Flavonoids are a group of polyphenolic pigments that are synthesized in the cytosol via the SA pathway [22]. They originate from phenylalanine, which competes with chalcone for anthocyanin production [23,24]. Flavonoids can be divided into several subclasses, such as chalcone, aurone, flavone, flavanone, flavonol, isoflavone, catechin, anthocyanidin, and anthocyanin [25]. Anthocyanins are the main water-soluble pigments that accumulate in the vacuolar part of epidermal cells in reproductive and vegetative tissues [26]. There are six major classes of anthocyanin pigments: delphinidin, cyanidin, pelargonidin, peonidin, petunidin, and malvidin. Among them, the pelargonidin and cyanidin classes are responsible for the pink, orange, and red colors of petals and belong to the main phenolic compounds [25,27,28]. Flavones and flavonols act as co-pigments with anthocyanins, enhancing the intensity of anthocyanins [26]. Molecular biology has become more relevant in the evaluation of aromatic plants in recent years [3].
Recent studies on the Rosa genus have unveiled a wealth of information on the complex phenolic profiles and flavonoid compounds within these species, as highlighted by Fetni et al. [29] and Behnamnia et al. [30]. These insights point to the significant potential of these constituents in promoting human health and advancing plant cultivars. However, there remains a gap in the literature regarding the molecular and chemical characteristics of dog rose petals, especially in relation to their role in floral scent and color biosynthesis. The current research seeks to fill this void by undertaking a comprehensive analysis of the essential oil composition of dog rose flowers at different developmental stages using gas chromatography–mass spectrometry (GC-MS), quantifying the total phenol and flavonoid content in petals through hydro-methanolic extracts, examining gene expression involved in flavonoid biosynthesis via qRT-PCR [31], and identifying phenolic compounds using LC-MS. The objective is to elucidate the genetic and metabolic regulation of flower color and fragrance in dog rose, which will inform strategies to enhance its scent, color, and phytochemical profiles for sustainable cultivation and production. This research not only contributes to the ongoing scientific dialogue but also aims to tap into the therapeutic and industrial potential of the Rosa genus.

2. Results

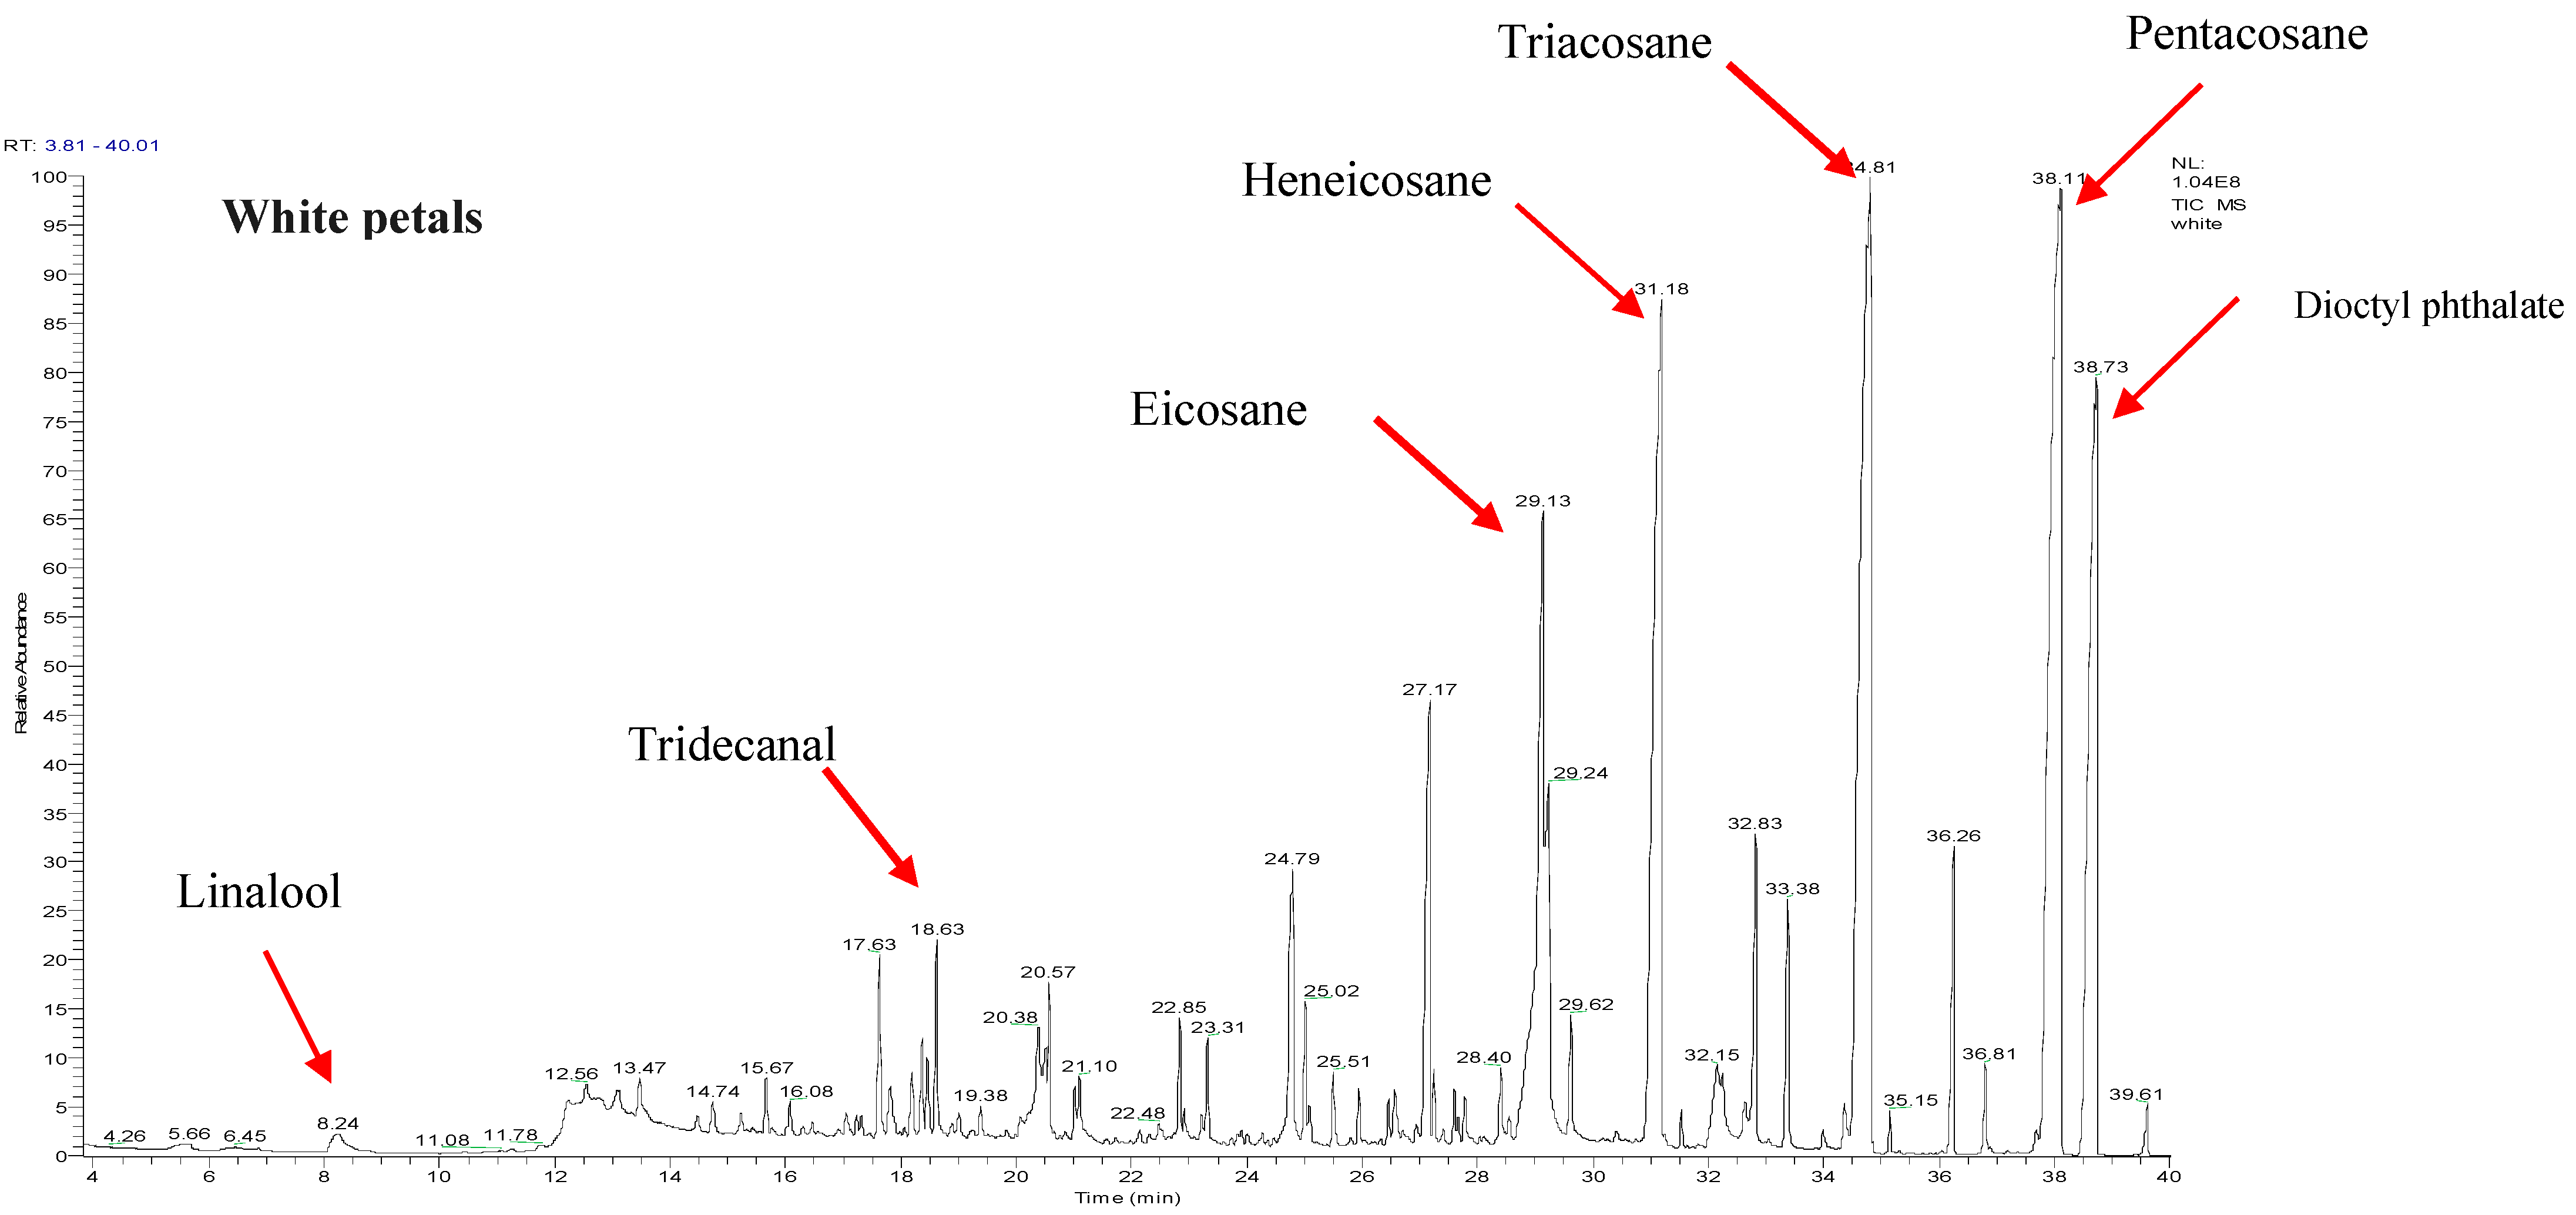
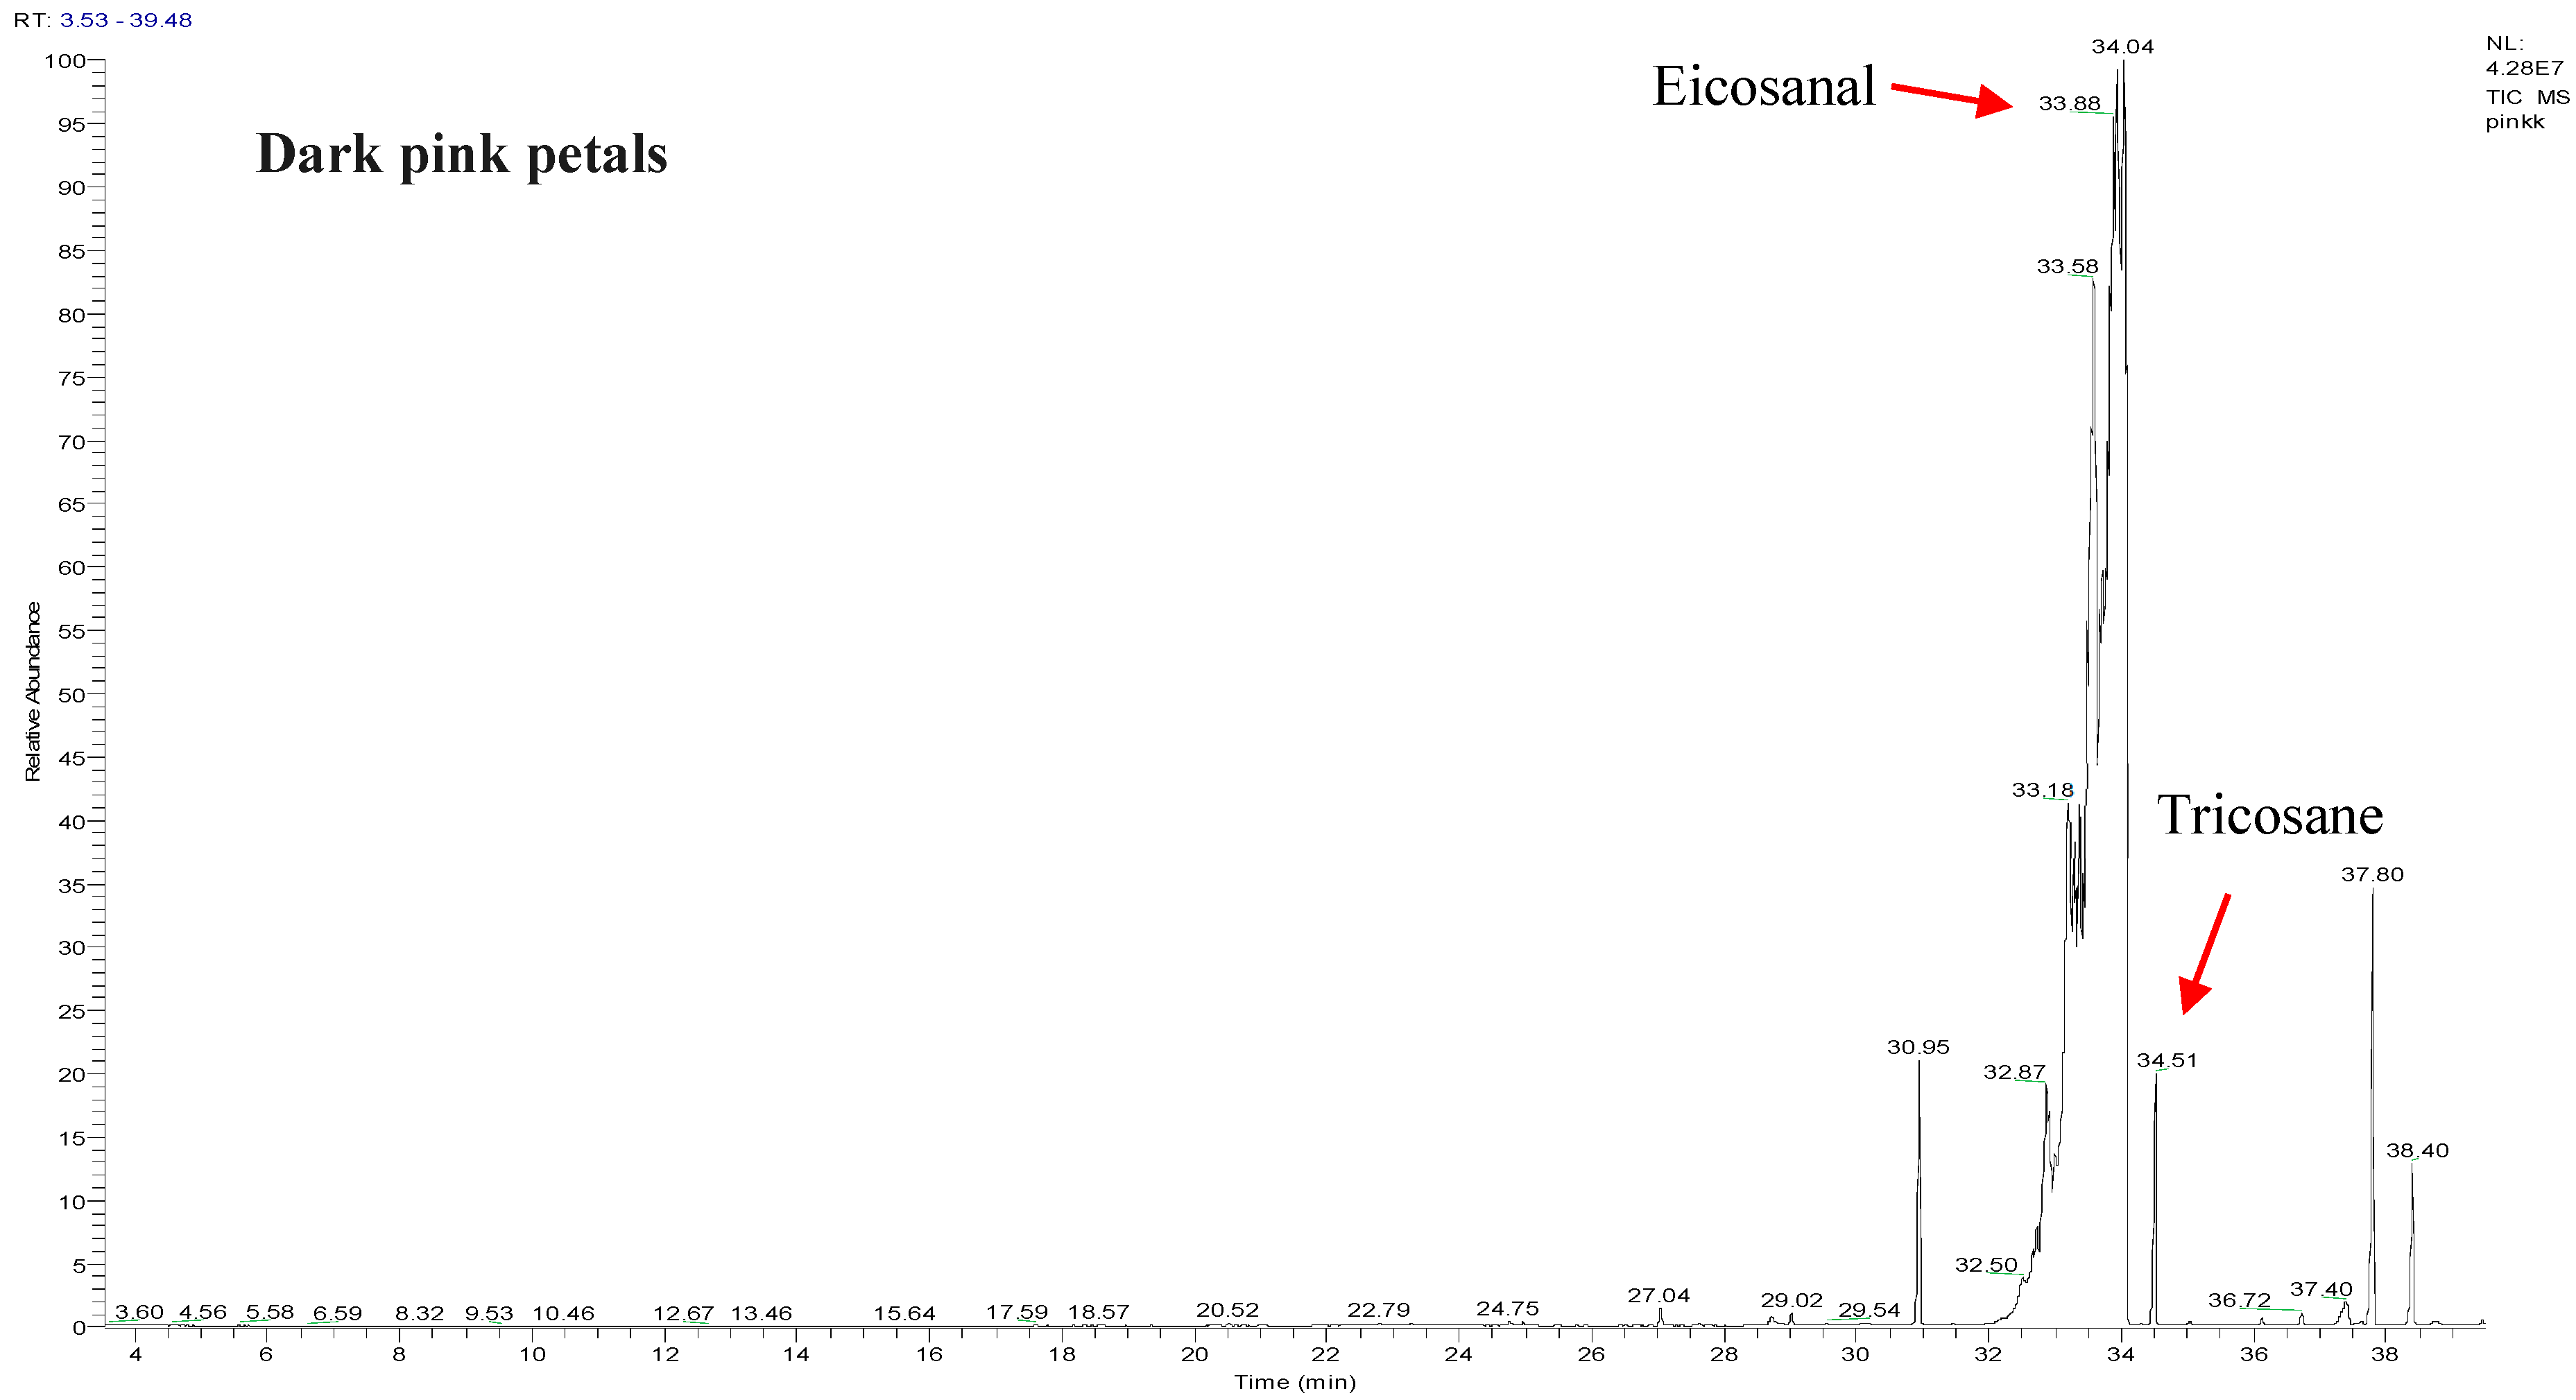
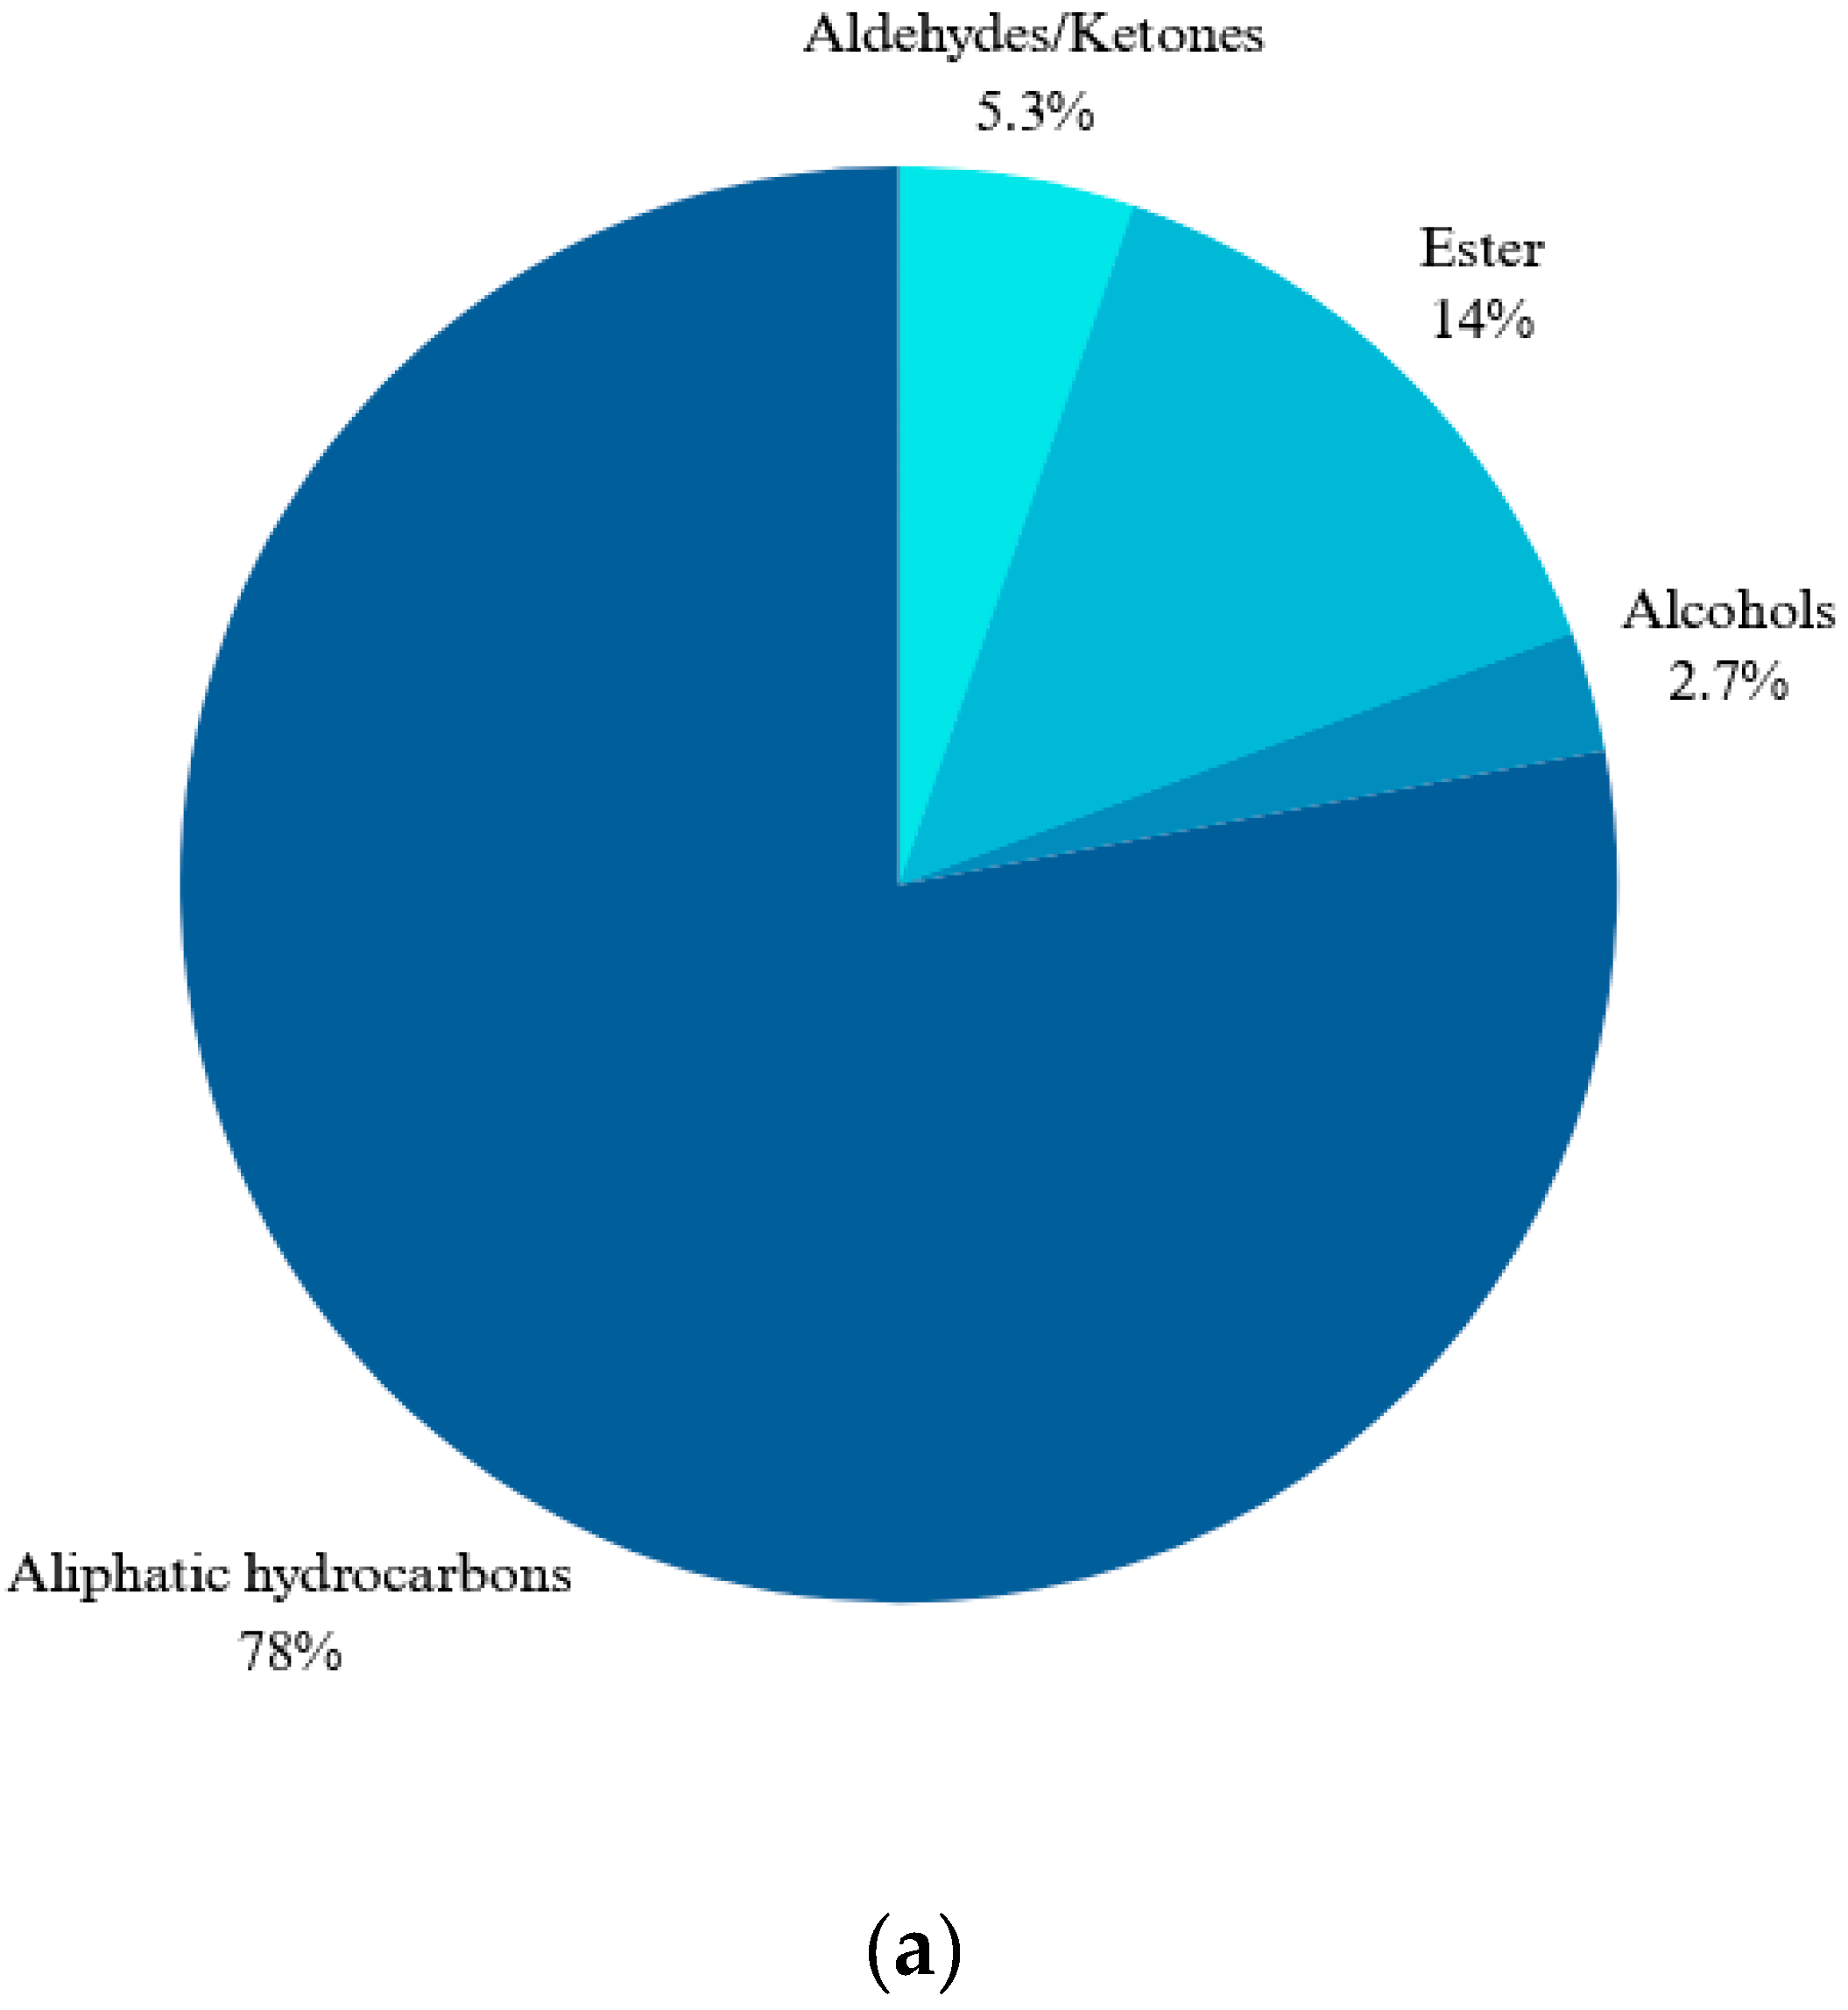
2.1. Chemical Compositions of the R. canina Essential Oil by GC-MS Analysis

The chemical composition of essential oil extracted from R. canina petals by hydrodistillation was analyzed by GC-MS. Two petal color variants, white and dark pink, were compared. The GC-MS analysis detected 32 and 15 compounds in the white and dark pink samples, respectively (Table 1 and Table 2). These compounds belonged to four classes: aliphatic hydrocarbons, aldehydes/ketones, alcohols, and esters. Aliphatic hydrocarbons predominated in both samples, accounting for 76.8% and 99% of the total oil composition in the white and dark pink samples, respectively. The white sample also contained two monoterpenes, linalool and geranial, and their corresponding acetate esters, citronellyl acetate and linalool acetate. Pentacosane was the most abundant hydrocarbon in the white sample (22.34%). Moreover, bis(2-ethylhexyl) terephthalate (DEHT), a natural diester of terephthalic acid and 2-ethylhexanol, was identified in the white sample. DEHT, also known as octyl, has a similar chemical formula and structure to the synthetic plasticizer bis(2-ethylhexyl) phthalate (DEHP) [32]. DEHT is a natural constituent of rose oil, as reported in previous studies [33,34,35,36,37]. Figure 1 indicates the Total Ion Chromatogram (TIC) of white and dark pink R. canina L. petals and Figure 2 shows the relative percentages of the volatile compounds in the two samples.

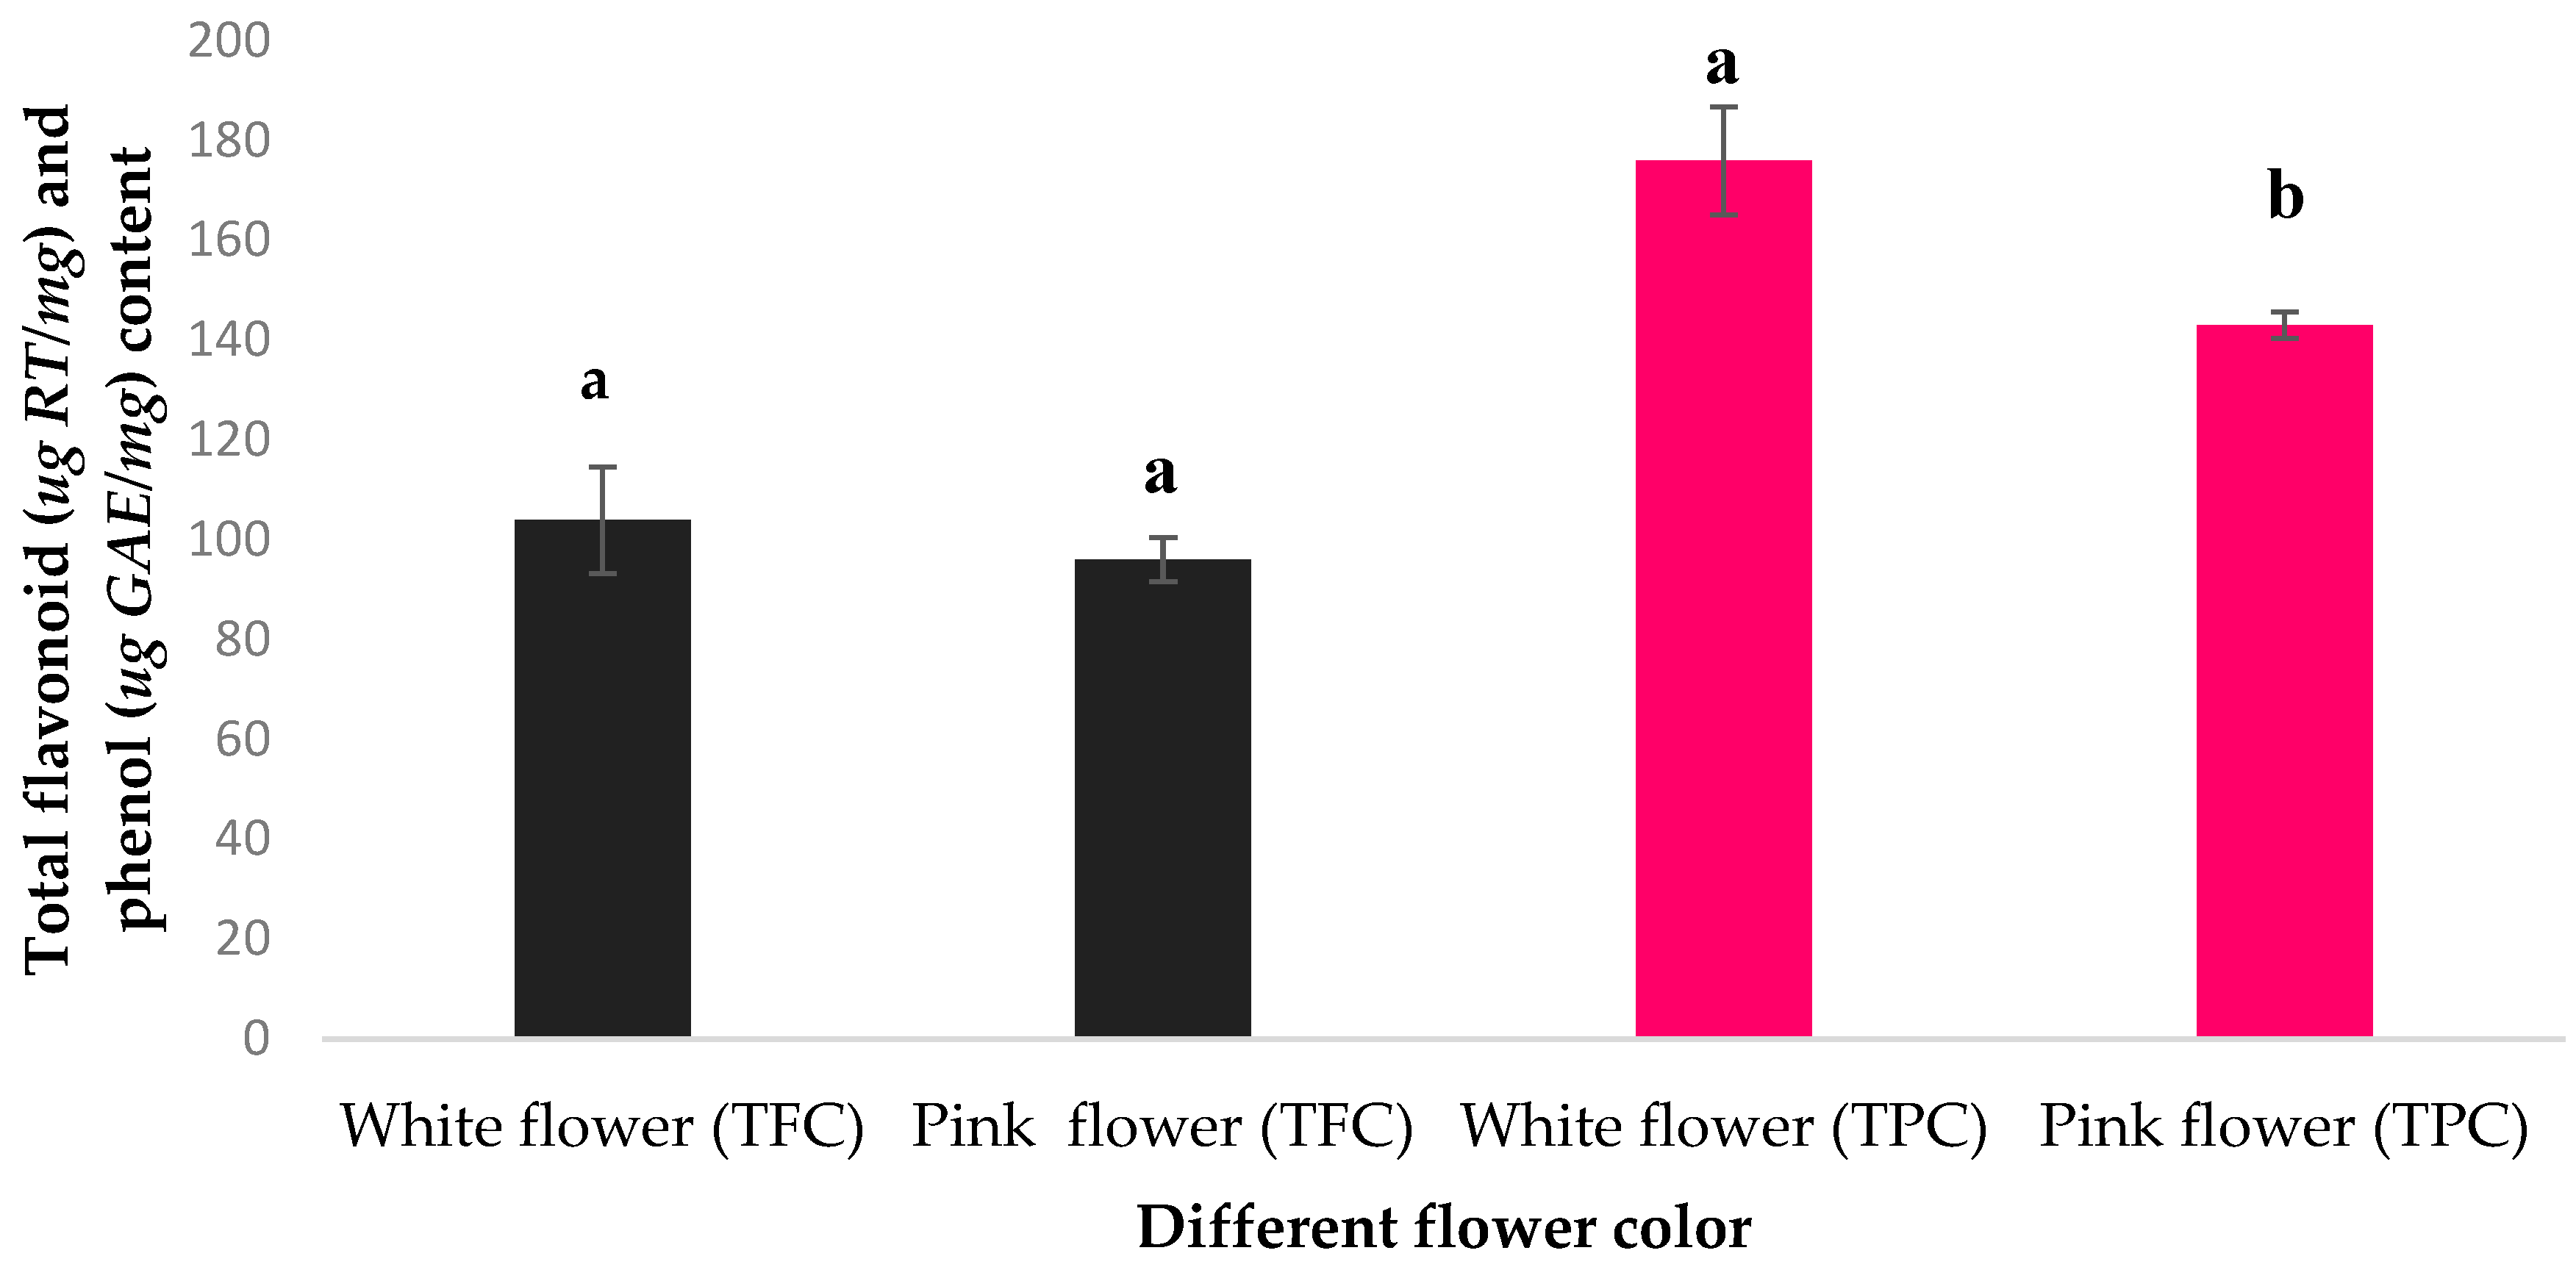
2.2. Total Phenolic and Flavonoid Content of the Petal Extracts

The Folin–Ciocalteu and aluminum chloride methods were used to measure the total phenolic content (TPC) and total flavonoid content (TFC) of the hydro-methanolic extracts of R. canina petals, respectively. The TPC and TFC values were expressed as micrograms of gallic acid equivalents (GAE) and micrograms of Rutin equivalents (RE) per milligram of dry weight (DW) of petals, respectively. The standard curve equations for TPC and TFC were (y = −0.0153 + 0.0066x) and (y = 0.0142 + 0.0008x), respectively. The TPC and TFC of the white-petaled and dark pink-petaled cultivars of R. canina were compared in Figure 3. The white-petaled cultivar had a significantly higher TPC than the dark pink-petaled cultivar (p < 0.05), while the TFC was slightly higher but not significantly different p > 0.05).

2.3. Total Anthocyanin Content (TAC)

The TAC of white and dark pink petals was determined using a spectrophotometric method. The results showed that dark pink petals had a significantly higher TAC than white petals. The mean TAC values were 9.12 µmol/g for dark pink petals and 3.21 µmol/g for white petals. The difference in TAC between the two types of petals could be attributed to the presence of different anthocyanin pigments, which are responsible for the color variation. Anthocyanins are water-soluble plant pigments that belong to the phenylpropanoid pathway. They have various biological functions and health benefits, which will be discussed in the next chapter.

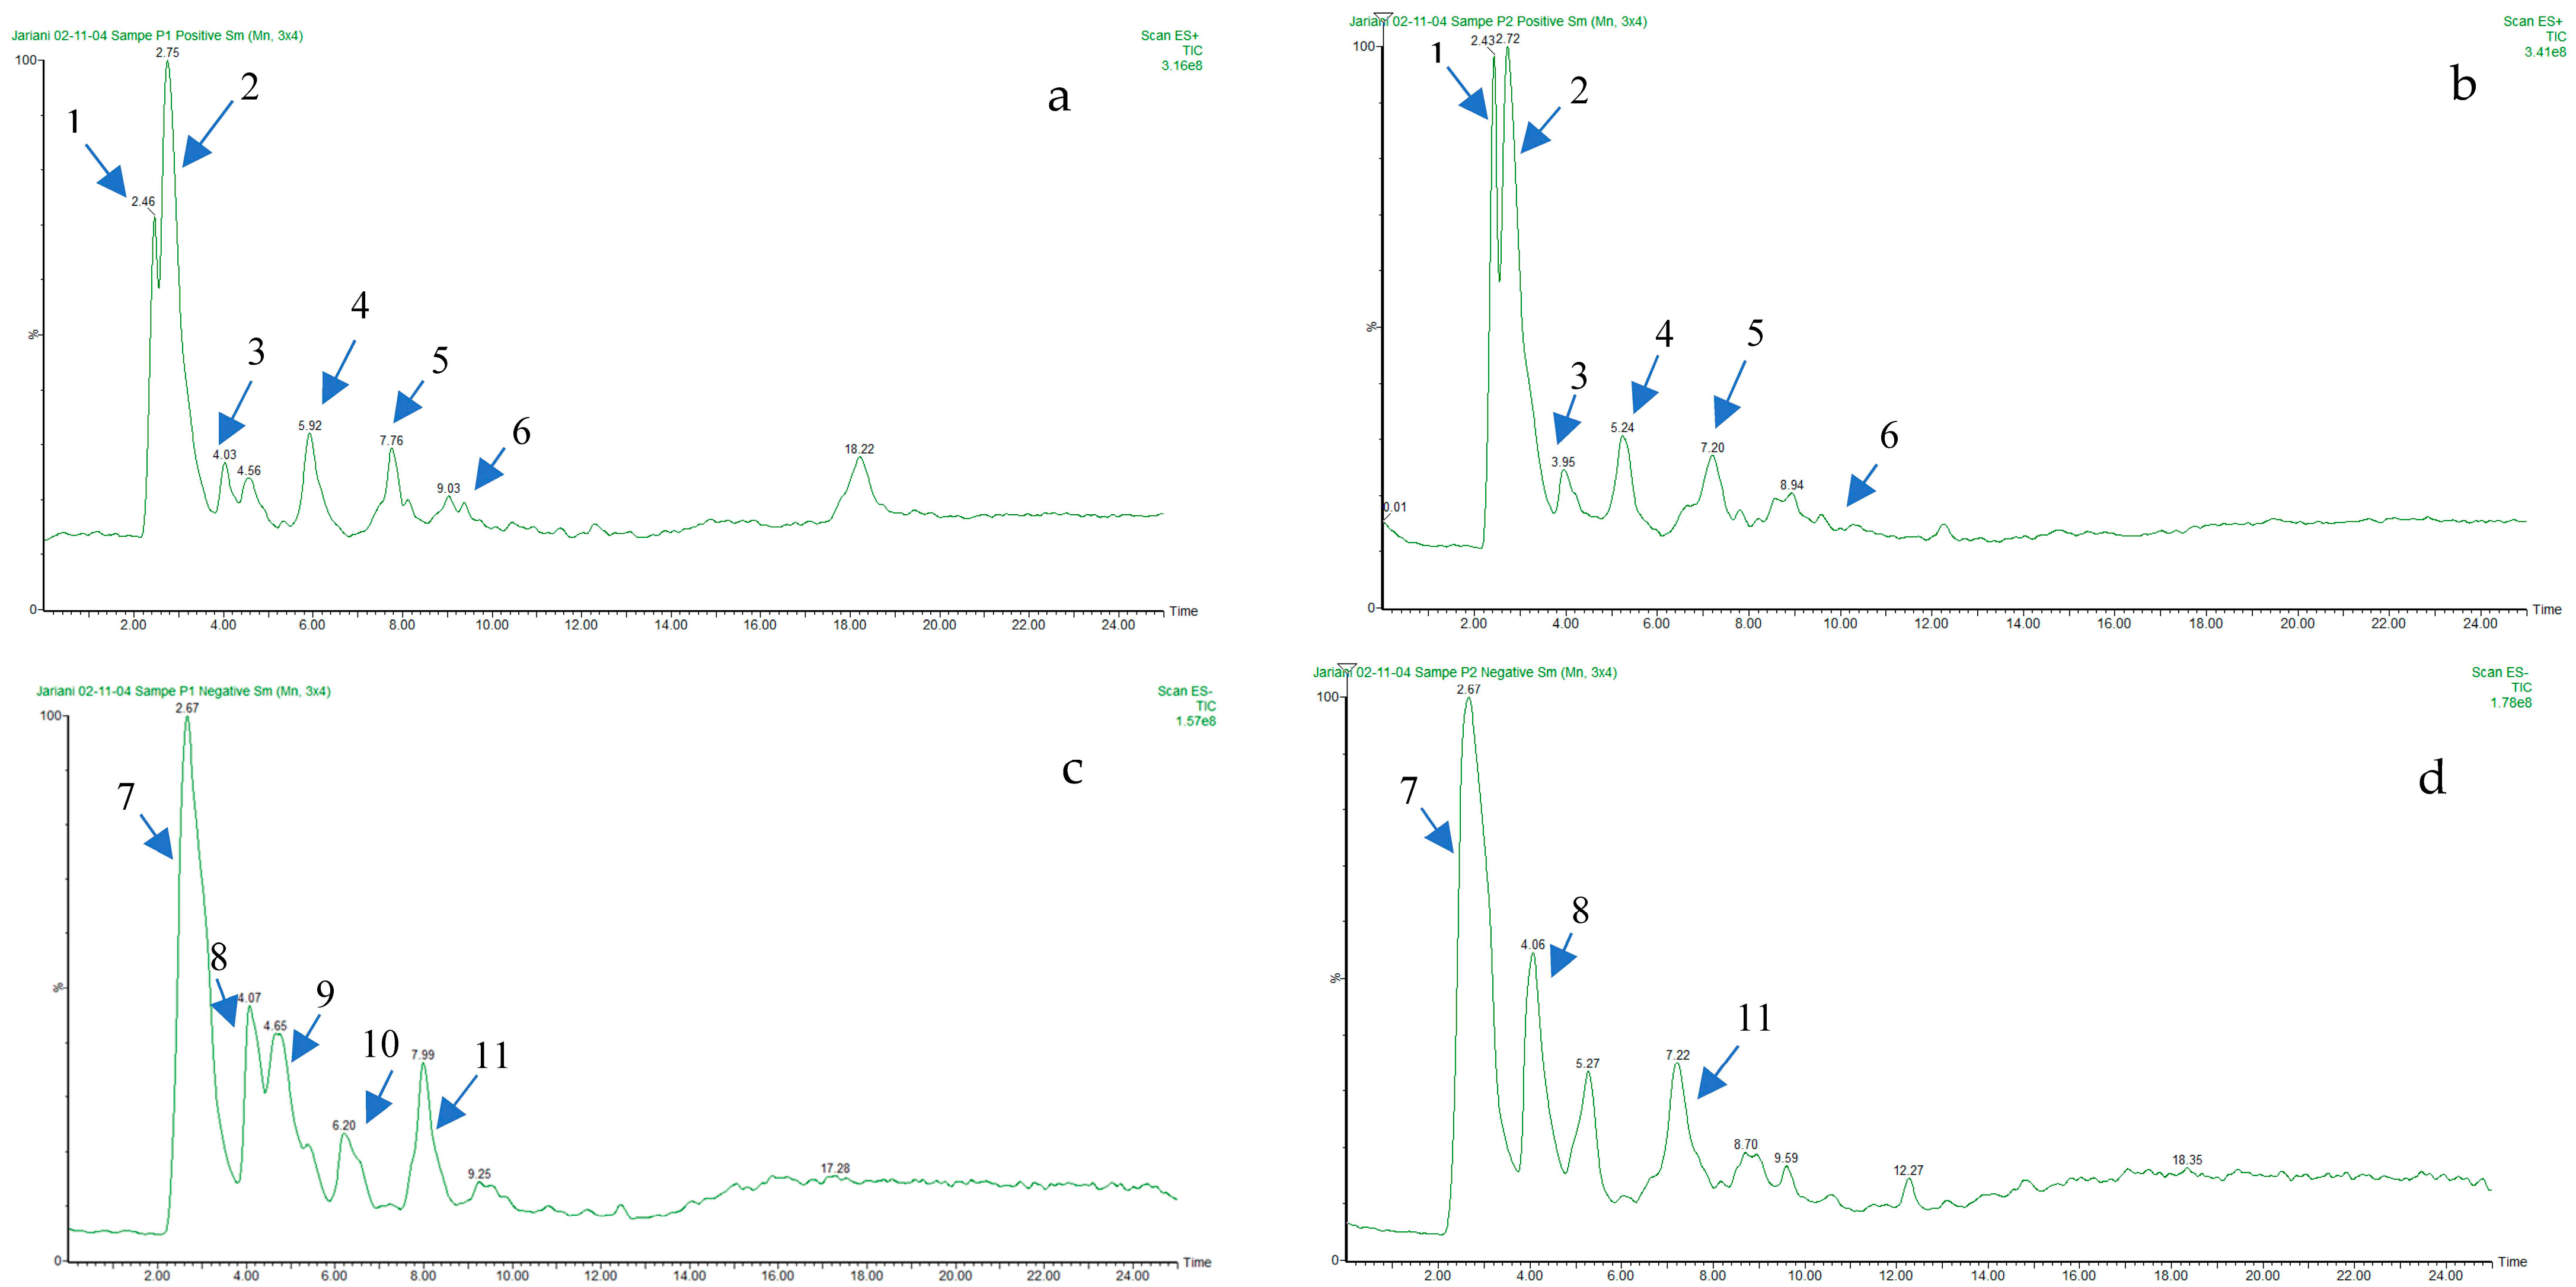
2.4. Liquid Chromatography-Electrospray Ionization-Tandem Mass Spectrometry (LC-ESI-MS) Phenolic Profile of R. canina Methanolic Extract

Phenolic compounds are a diverse group of plant metabolites that exhibit antioxidant activity and complex structure. Flavonoids are the most abundant phenolic compounds in plants and have various biological effects. R. canina is a plant species that contains high levels of flavonoids and other phenolic compounds in its petals. To identify and characterize the phenolic profile of R. canina methanolic extract, liquid chromatography-electrospray ionization-tandem mass spectrometry (LC-ESI-MS) was employed. This technique allows the separation and identification of phenolic compounds based on their retention time and mass fragmentation pattern in positive and negative ionization modes. The results were verified by comparing them with previous studies. The LC-ESI-MS analysis revealed that flavonoids, especially rutin, quercetin, kaempferol, and their derivatives, were the predominant phenolic compounds in R. canina methanolic extract. Gallic acid and ellagic acid were the main phenolic acids detected. Moreover, cyanidin, delphinidin, and pelargonidin were the major anthocyanins in white and dark pink petals, respectively. Figure 4 shows the total ion chromatograms of R. canina petals in both ionization modes. Table 3 summarizes the different phenolic compounds and their characteristics that were identified by LC-ESI-MS.

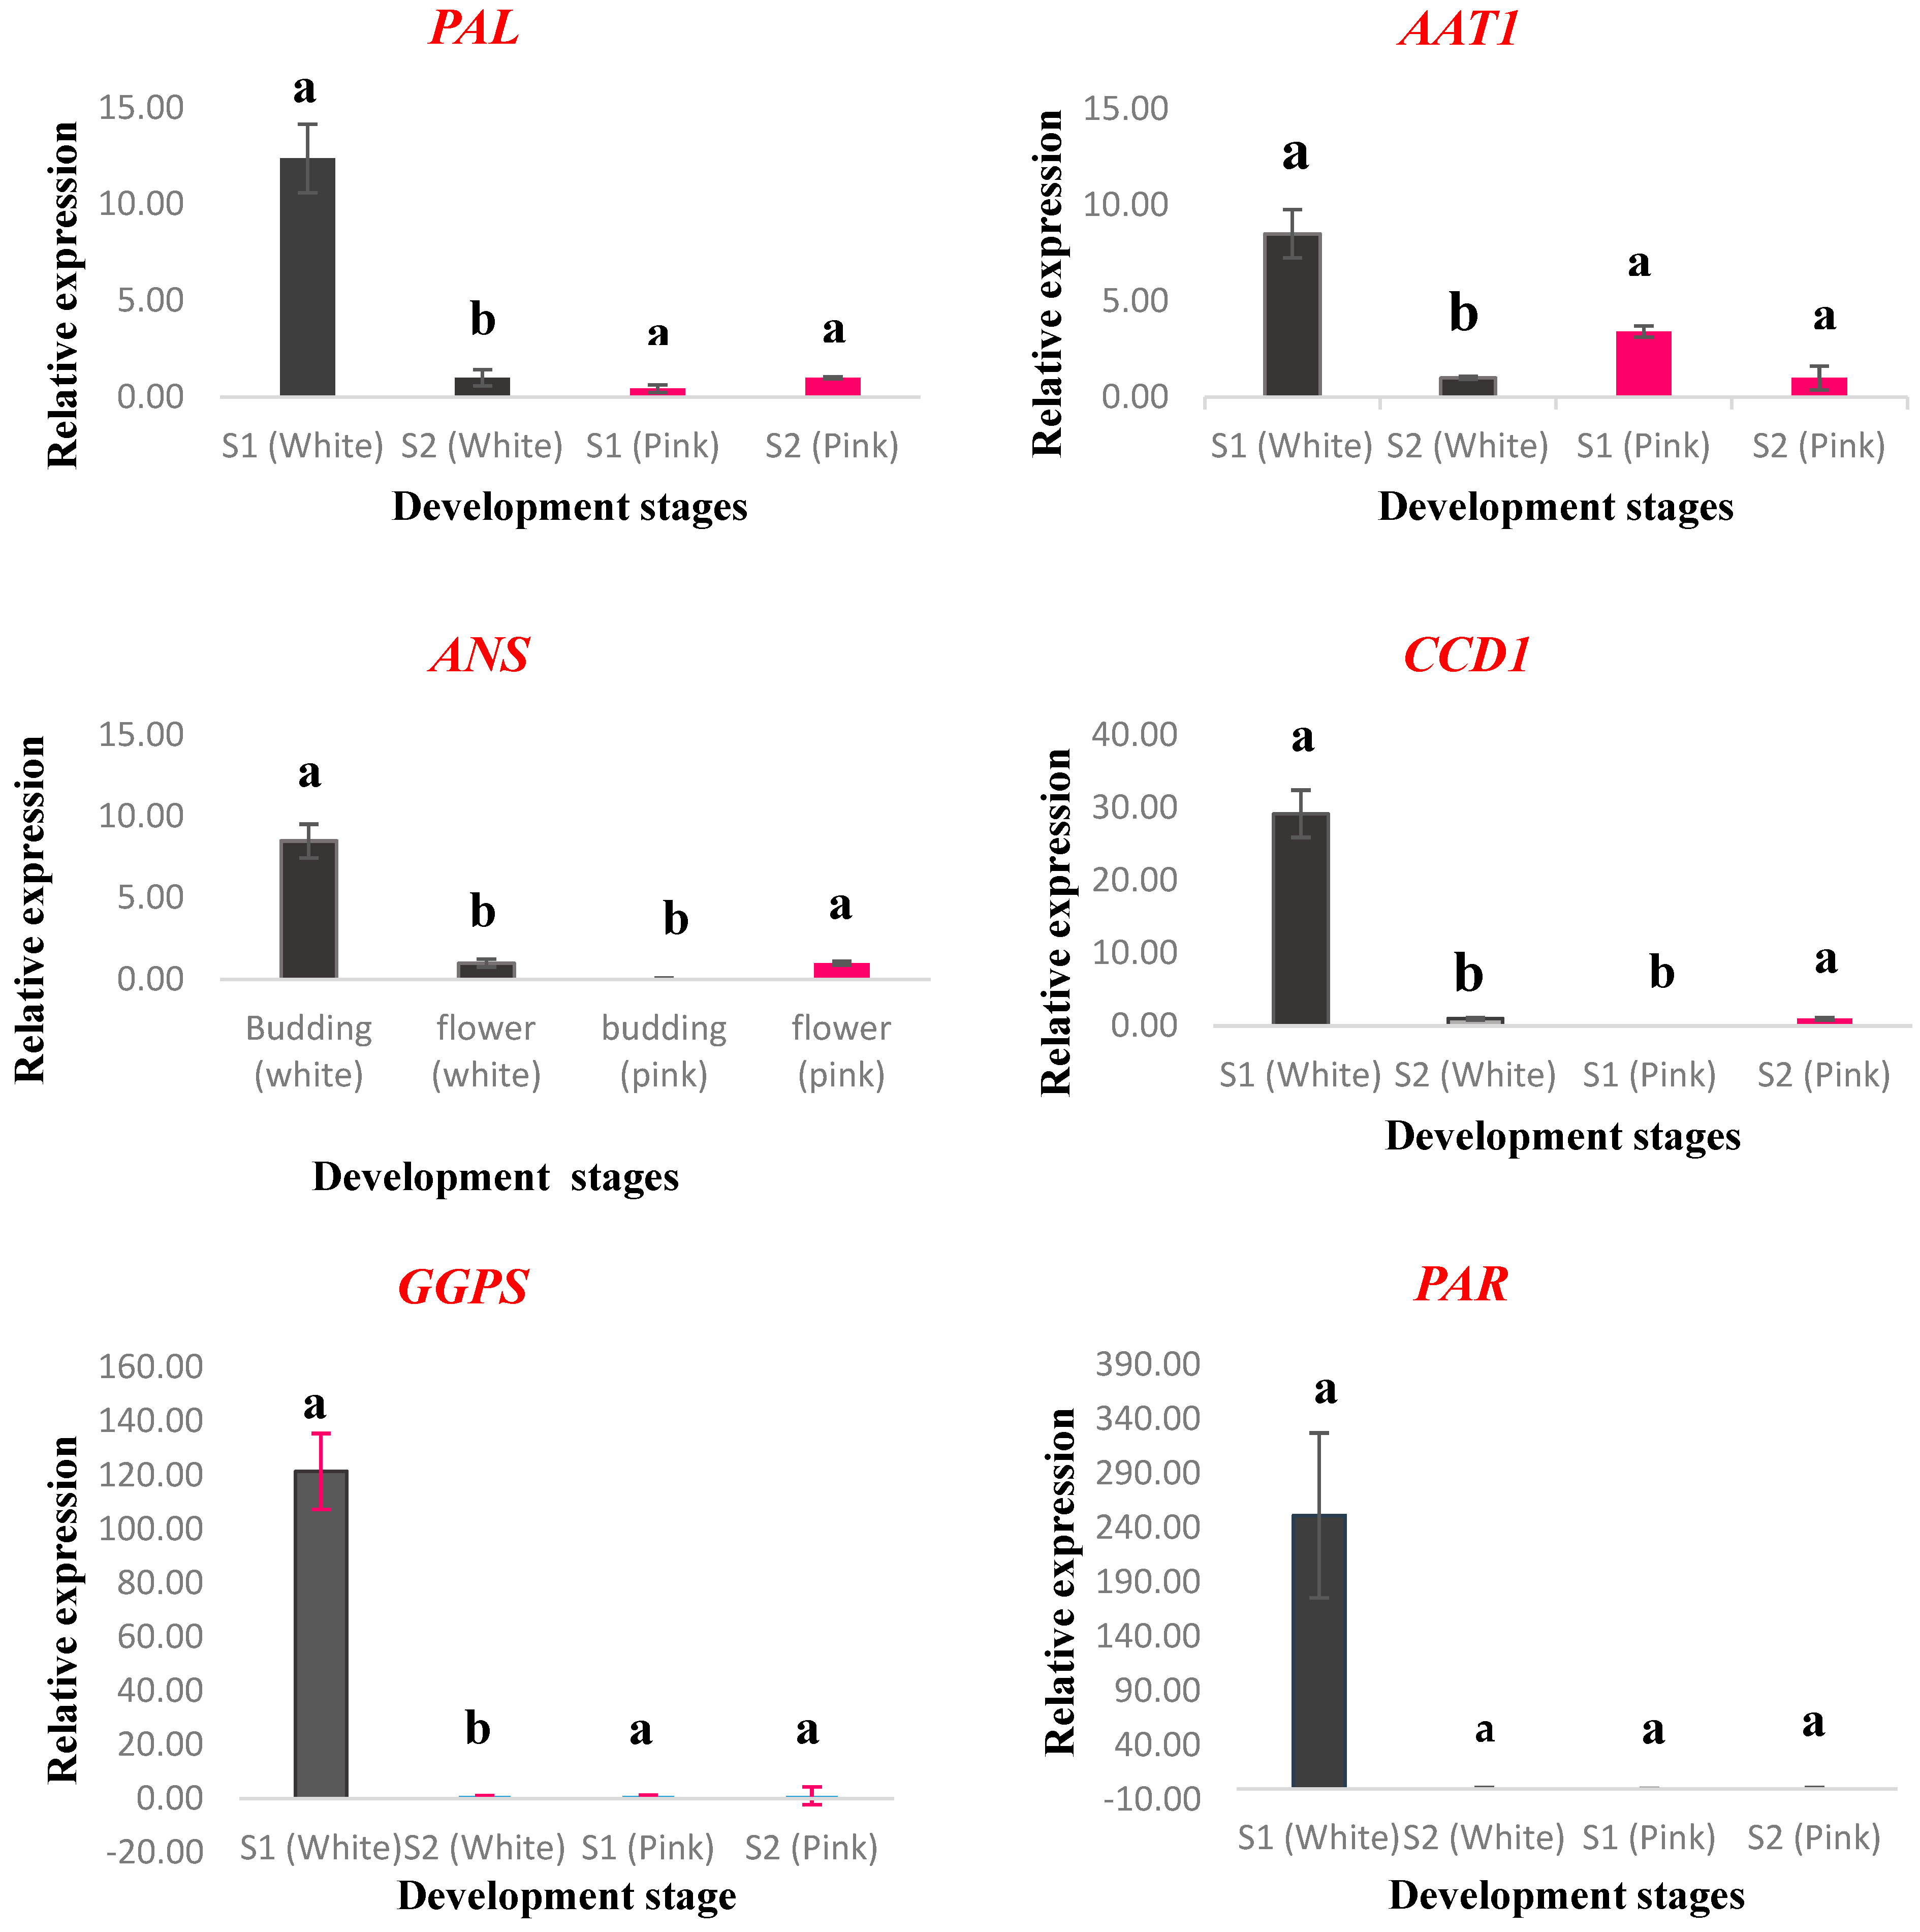
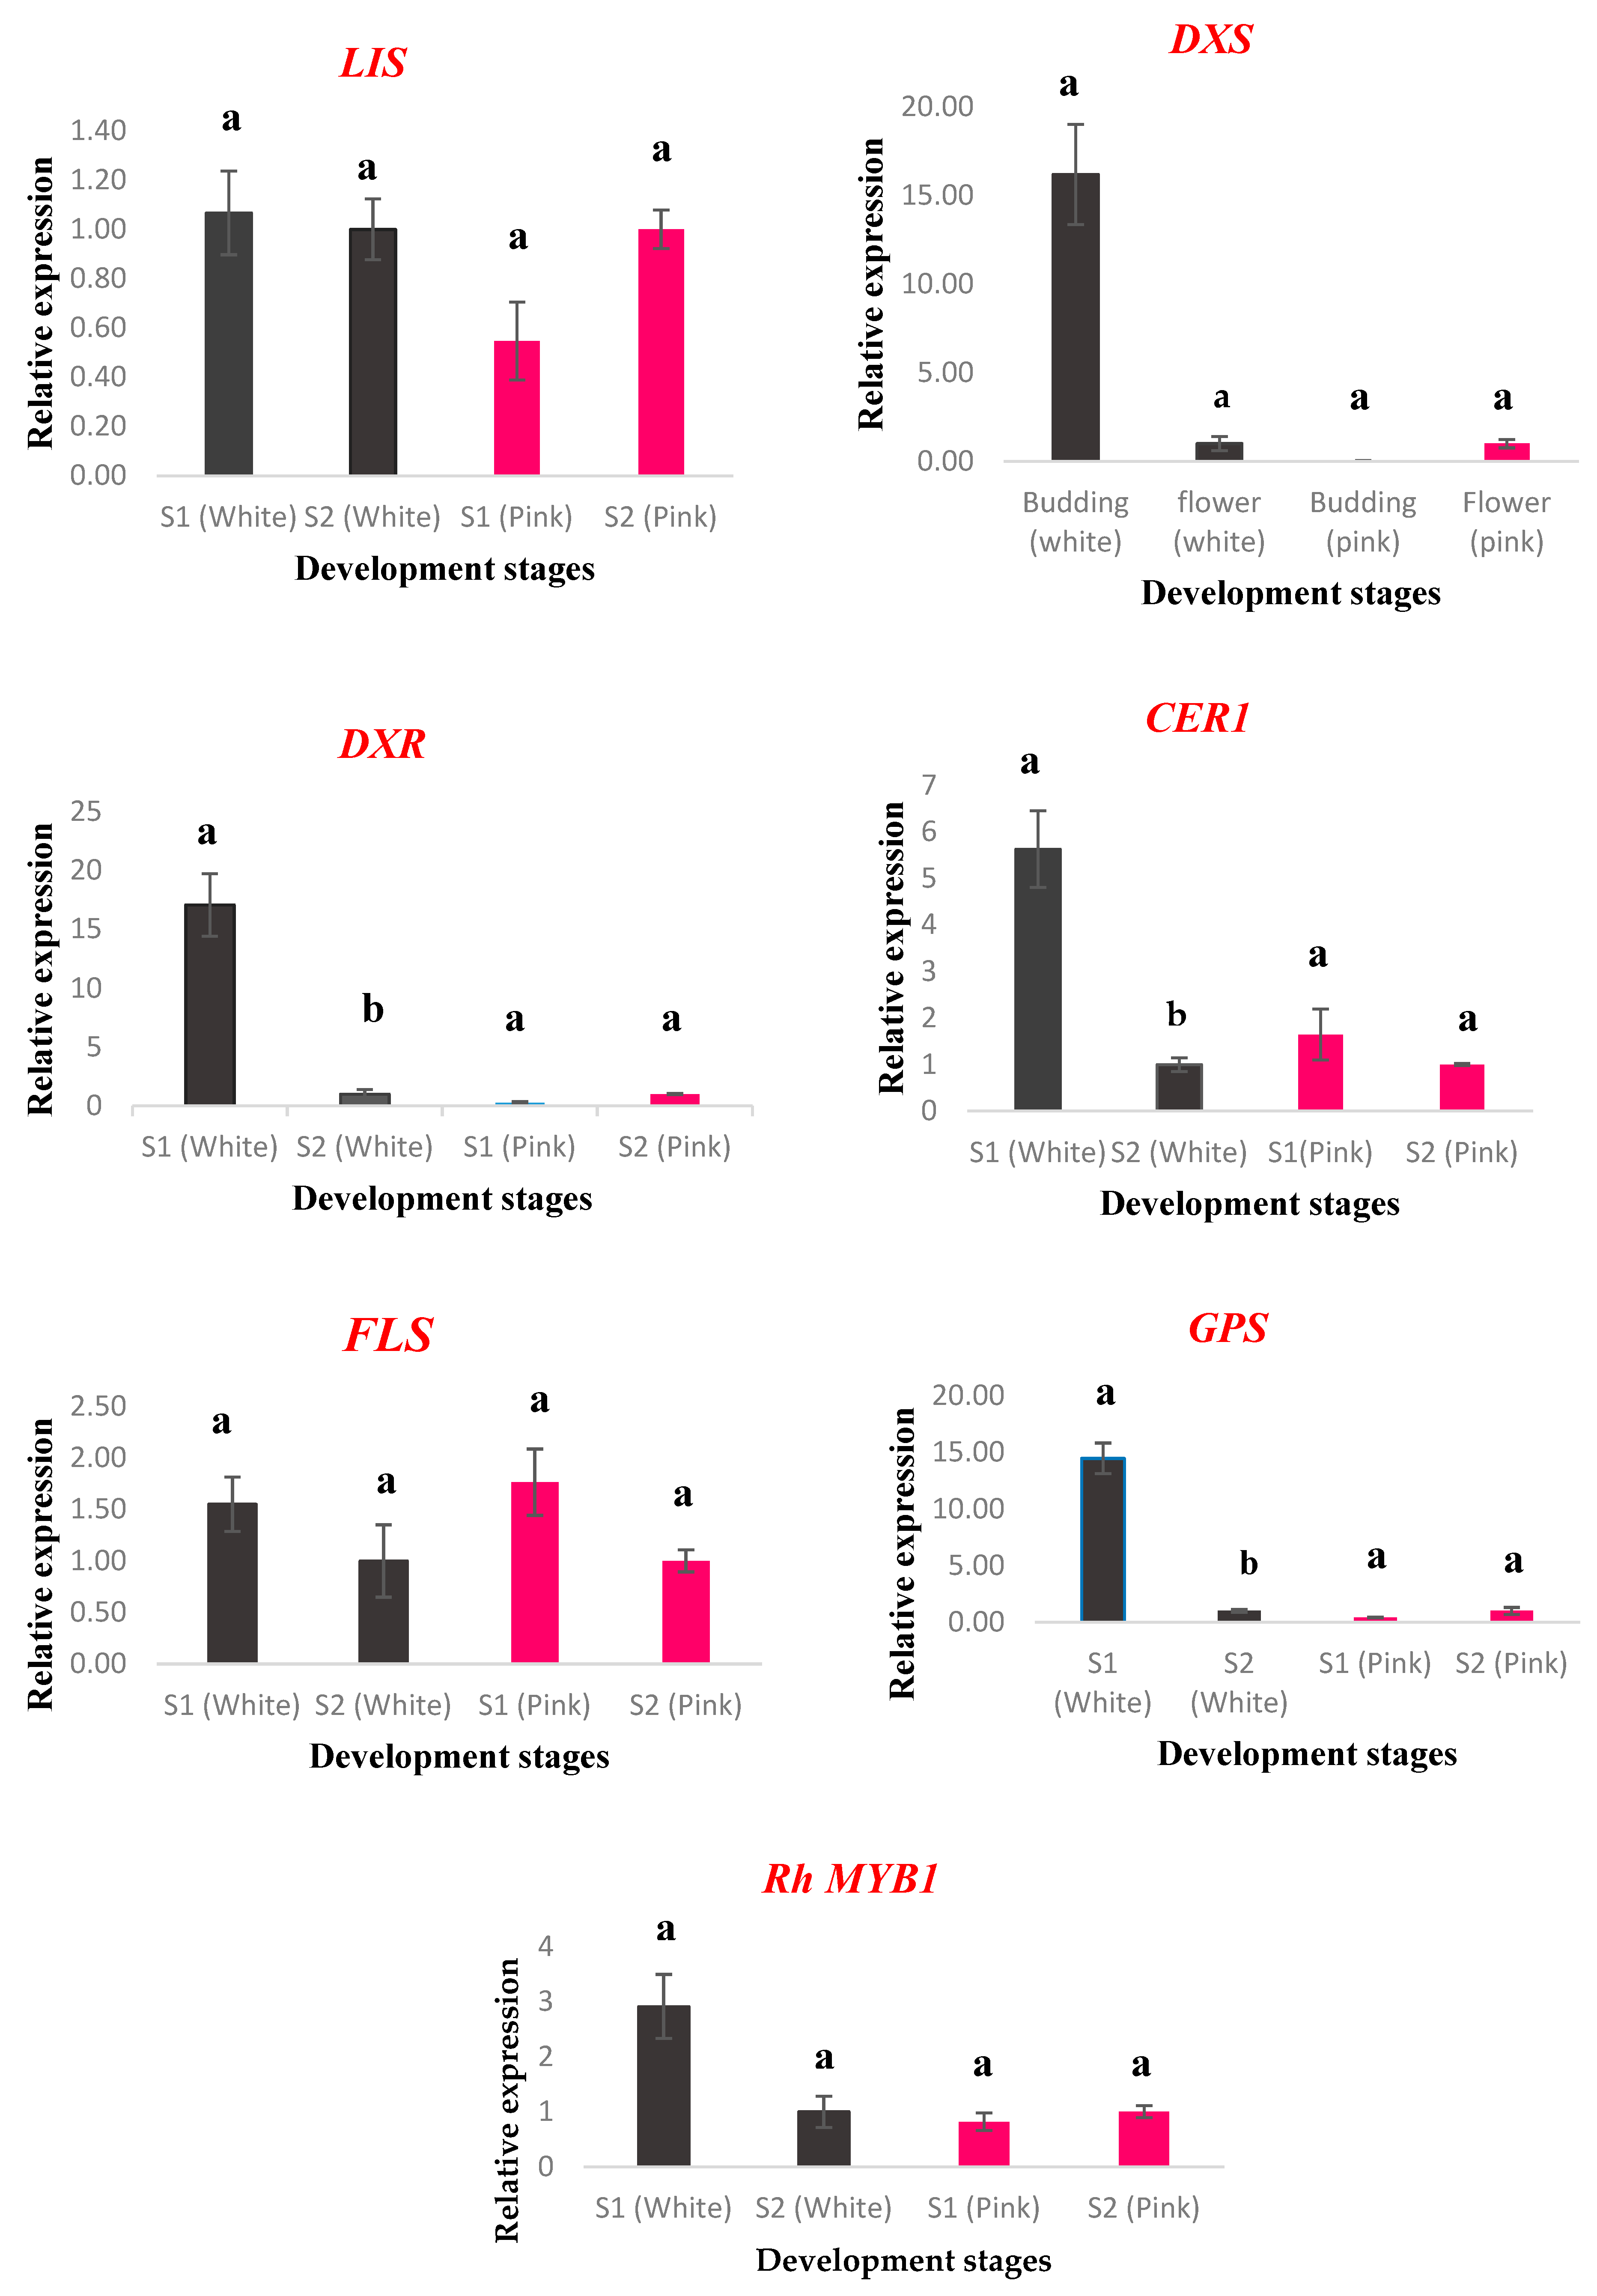
2.5. Gene Expression Analysis

The qRT-PCR method measured and compared the relative expression levels of 13 genes involved in floral color and scent biosynthesis at two key stages of flower development when scent emission occurs: budding and open-flower. The genes were PAR, GPS, GGPPS, PAL, DXR, DXS, LIS, CCD1, AAT1, ANS, FLS, CER1, and RhMYB1. Figure 5 shows the expression patterns of these genes at different stages.
White flowers had higher expression levels of all main genes at the budding stage than at the open-flower stage. The expression profiles of these genes gradually decreased as the flowers opened. Seven genes (GPS, GGPPS, DXR, DXS, LIS, CCD1, and AAT1) related to floral terpene volatile compound biosynthesis showed similar expression trends. Among them, GGPS had the highest expression level in white floral buds (121.38-fold), followed by CCD1 (29.18-fold), DXR (17.06-fold), DXS (16.19-fold), and GPS (14.49-fold). Except for FLS, DXS, LIS, and PAR, the other genes in white flowers had significant differences in expression levels among different stages.
Dark pink petals had higher expression levels of the ANS gene, which participates in anthocyanin synthesis, than white petals. The expression of ANS and CCD1 differed significantly in dark pink petals, while the other genes did not. The ANS gene had remarkably higher expression levels at white flower buds (8.50-fold) than at dark pink flower buds, followed by the FLS gene (1.55-fold). The FLS gene, which is the key gene for flavonol synthesis, had higher expression levels at the budding stage (1.77-fold) than at the open-flower stage in dark pink flowers. The ANS gene had the opposite trend: it had higher expression levels at the open-flower stage than at the budding stage in dark pink flowers. The FLS gene catalyzes flavanol biosynthesis, which peaks in the early stages of flower development before anthocyanin accumulation. The ANS gene catalyzes anthocyanin formation, such as pelargonidin and cyanidin.
In white petals, the expression of the ANS and PAL genes, which are related to anthocyanin biosynthesis, was the highest at the budding stage. In dark pink petals, the expression levels of PAL and PAR genes, which are also related to anthocyanin biosynthesis, were lower at the budding stage than at the open-flower stage. The PAR gene had the highest expression level (251.31-folds) at the budding stage of white flowers, followed by the PAL gene (12.38-folds). The CER1 gene, which is involved in long-chain alkane synthesis in epidermal parts of flower petals, had higher expression levels in white flower buds (5.63-folds) than in dark pink flower buds. The RhMYB1 gene, a key transcription factor that regulates the anthocyanin biosynthesis pathway, had consistent expression results with the main genes, especially the ANS gene. For white flowers, the RhMYB1 gene had higher expression levels at the budding stage (2.91-folds) than at the open-flower stage. For dark pink flowers, the RhMYB1 gene had lower expression levels at the budding stage than at the open-flower stage.

2.6. Cluster Analysis

As depicted in Figure 6, the correlation and cluster analysis revealed distinct groupings among the genes. The ANS and RhMYB1 genes, along with PAR, were first grouped into a single cluster. In contrast, GGPS, PAR, and DXS formed another separate group. Furthermore, genes associated with the terpene biosynthesis pathway, such as DXR, GPS, PAL, CCD1, DXS, and GGPS, exhibited high similarity and were categorized within a similar cluster. Subsequently, these groups were amalgamated into the same cluster in the following step of the analysis. This clustering suggests a potential regulatory relationship and functional proximity within the color and scent biosynthesis pathway.
This figure presents a heatmap alongside cluster analysis, illustrating gene expression patterns related to flower color and scent across two distinct developmental stages: budding stage (S1) and open-flower stage (S2). The heatmap visualizes fold changes in gene expression, with darker shades indicating higher expression levels and lighter shades denoting lower levels. Hierarchical clustering is depicted through dendrograms positioned above and to the left of the heatmap, representing the fold changes and various treatments, respectively. The clustering employs the Ward method, highlighting similarities in gene expression profiles.

3. Discussion

R. canina is a rare type C wild rose that displays distinct features, such as high monoterpene levels at the bud stage, low geraniol content, short floral longevity, and white petals [38]. Monoterpenes are volatile metabolites that perform various roles in plant physiology, such as mitigating oxidative damage by reactive oxygen species (ROS), modulating isoprenoid hormone levels, and extending floral lifespan [39]. The decrease in monoterpene levels at the senescence stage may account for the reduced floral longevity of type C roses, as hypothesized by [38]. This is because monoterpenes may have antioxidant properties and protect the petals from ROS-induced oxidative stress during senescence [40]. Furthermore, monoterpenes may influence the levels of abscisic acid (ABA), a plant hormone that controls senescence and wilting [41]. Hence, lower monoterpene levels may lead to higher ROS and ABA levels, which may accelerate the senescence process and shorten the floral lifespan. These characteristics were corroborated by the findings of this study, which unveiled new aspects of the volatile profile of R. canina essential oil. The examination of the essential oil revealed that linalool was the dominant monoterpene compound in dog rose oil, followed by geranial. Linalool is an acyclic monoterpene alcohol with a fresh and sweet odor that belongs to the fruity odor group [42].
Geranial is a monoterpene aldehyde that adds to the floral scent of roses [43]. The relatively high proportion of these compounds in R. canina essential oil suggests that this species may have an appealing and fruity fragrance that could lure pollinators and consumers. However, the findings of this study were in line with a previous study that reported a decline in monoterpene synthesis during flower aging [44]. The diminution of monoterpenes at the senescence stage may be linked to the shorter floral longevity of type C roses, as proposed by Dani et al. [38]. Moreover, the findings showed that R. canina essential oil contained a substantial amount of long-chain hydrocarbons, particularly nonadecane and heneicosane, which caused the oil to solidify at room temperature. This observation concurs with [45], who reported that R. canina oil had a high percentage of long-chain hydrocarbons and a low percentage of geraniol compared to other rose species.
The stability and quality of R. canina essential oil may depend on the presence of long-chain hydrocarbons, which have different properties from short-chain hydrocarbons. Long-chain hydrocarbons exhibit lower volatility and higher viscosity, which may influence the evaporation rate and oxidation susceptibility of R. canina essential oil [46,47]. These factors may alter its chemical composition and aroma over time. Moreover, long-chain hydrocarbons may affect the biological activity and safety of R. canina essential oil, as they may have different interactions with biological molecules than short-chain hydrocarbons [48]. Thus, the implications of long-chain hydrocarbons for the stability and quality of R. canina essential oil, as well as their potential applications in various domains, should be investigated. This study demonstrated that the chemical composition of R. canina flowers is affected by the number and color of petals. Aromatic hydrocarbons were more abundant in flowers with four single petals than in those with more petals, which contained higher levels of terpenoids. This is in accordance with previous researches by [1,49], who reported that the number of petals modulates the biosynthesis and emission of scent compounds in roses. This study also revealed that white petals contained more aromatic compounds than dark pink ones, indicating that petal color influences the floral scent profile as well. This is congruent with the findings of [38,50,51,52,53], who observed that light-colored flowers produce more intense and diverse scents than dark pink flowers. Future studies could examine the biological activities and pharmacological properties of R. canina essential oil, as well as its possible applications in perfumery, cosmetics, or aromatherapy. The results also showed that the white petals had higher levels of both phenolic and flavonoid compounds than the dark pink petals, suggesting a possible association between petal color and phytochemical content. These results are consistent with a previous study that found higher phenolic and flavonoid contents in white R. canina flowers compared to other colors [54]. Phenolic and flavonoid compounds are known to possess various biological activities, such as antioxidant, anti-inflammatory, anti-microbial, and anti-cancer properties [55]. The white petals of R. canina have higher flavonoid content than the dark pink petals, which may indicate their higher potential for medicinal and cosmetic applications. Flavonoids are known to have antioxidant, antimutagenic, and anticarcinogenic effects [56,57].
The white petals of R. canina var. assiensis had a higher total flavonoid content (163.3 mg/100 g frozen pulp) than other rose species (101.3–143.7 mg/100 g frozen pulp) [58]. The flavonoid content of R. canina fruits was much lower (41 mg/100 g dry matter) than that of white petals [59]. Thus, the petal color of flowering plants may reflect their phytochemical composition and bioactivity, besides their ornamental value. Different pigments, such as anthocyanins, flavonoids, and carotenoids, confer various colors to petals and also exhibit biological activities, such as antioxidant, anti-inflammatory, and enzyme inhibition effects. Hence, choosing the best cultivars with optimal petal colors could offer multiple advantages for different applications, such as herbal remedies, natural dyes, or landscaping. Previous studies have demonstrated the relationship between petal color and phytochemical content in different species of flowering plants. For instance, Paeonia delavayi showed significant differences in anthocyanin and flavonoid content and antioxidant and enzyme inhibition activities among purple, red, and yellow petals [60]. Similarly, marigold flowers with different petal colors from off-white to deep orange had varying amounts of carotenoids, phenolics, flavonoids, and antioxidant potential [61]. These findings indicate that petal color could be a useful criterion for selecting the most appropriate cultivars of flowering plants for different purposes. Moreover, these results may improve the understanding of the biosynthesis and regulation of phenolic and flavonoid compounds in plants, which are affected by various factors such as genetic, environmental, and developmental factors [62]. This study examined the relationship between petal color and total TAC in two cultivars of chrysanthemum with different petal colors: white and dark pink. The expression levels of the ANS gene, which is a key enzyme in anthocyanin biosynthesis, were also assessed in the petals at different developmental stages. The results revealed that dark pink petals had significantly higher TAC and ANS expression than white petals, especially at the blooming stage. This implies that anthocyanin synthesis and accumulation are increased in the dark pink petals through the phenylpropanoid pathway. These findings are in agreement with previous reports that showed a positive correlation between petal color intensity and TAC in various plant species [28]. However, it was also noticed that white petals had relatively high ANS expression at the budding stage, suggesting that anthocyanin biosynthesis is initiated but not completed in these petals. This could be due to the absence of other enzymes or cofactors required for anthocyanin production, or the presence of inhibitors or degrading factors that prevent anthocyanin accumulation. Further studies are needed to clarify the molecular mechanisms underlying the color difference between the white and dark pink petals.
Petal color in plants is influenced by anthocyanins, which are plant pigments that belong to the flavonoid family. Anthocyanins have various health benefits for humans and animals, such as protecting against oxidative stress, inflammation, cancer, diabetes, and neurodegeneration [63]. They also affect the attraction of pollinators, which influences plant reproduction and adaptation. The phenolic composition of R. canina petals, which are rich in flavonoids, especially Rutin, quercetin, kaempferol, and their derivatives, as well as phenolic acids, such as gallic acid and ellagic acid, was analyzed in this study. These phenolic compounds have been reported to have antioxidant, anti-microbial, anti-inflammatory, and anticancer activities. Therefore, R. canina petals could be a potential source of natural bioactive compounds for health and industry applications. The phenolic composition of R. canina petals was consistent with previous research [64]. These compounds could be unique to R. canina or specific to the geographical origin or cultivar of the plant. Further studies are needed to confirm their identity and biological activities. The phenolic content of white and pink petals, which differed in color due to the presence and concentration of anthocyanins, a subclass of flavonoids, was also compared in this study. Anthocyanins are responsible for the red, purple, and blue colors in plants, while flavonols, such as quercetin and kaempferol, are responsible for the yellow color [65]. White petals had less anthocyanins and more flavonols than pink petals, resulting in higher phenolic content. This finding was in agreement with previous studies that showed a negative correlation between anthocyanin content and total phenolic content in rose petals [66]. The expression levels of several genes related to the fragrance and color of roses were also investigated in this study. The results showed that the GPS, CCD1, RrAAT1, LIS, DXS, DXR, and PAR genes were significantly upregulated in fragrant roses compared to non-fragrant ones [67,68]. Moreover, MYB, bHLH, and WD40 transcription factors were differentially expressed between white and pink roses (Wei et al., 2007) [69]. These results were consistent with previous studies that have identified these genes and transcription factors as key players in the biosynthesis of volatile compounds and pigments in roses and other plants [3,24,50,69,70,71,72,73,74,75,76].
This study explores the molecular mechanisms that cause variation in rose fragrance and color, which are important for breeding and consumer preferences. A putative gene, RhMYB1, was found to be expressed in wild rose species with pleasant fragrance compounds, but not in non-aromatic roses [75]. The phenolic content and composition of rose petals depend on their color and genotype. Previous studies have shown that darker-colored petals, such as red and purple, have more anthocyanins than lighter-colored ones, such as white and yellow [77]. However, lighter-colored petals have more flavonoids than darker-colored ones, resulting in higher total phenolic content. This is consistent with other studies that reported a negative correlation between anthocyanin and total phenolic content in rose petals [78]. The effects of different light conditions on the phenolic content and composition of rose petals from different genotypes were investigated in this study. Rose petals are also known for their fragrance, which is mainly derived from volatile compounds such as monoterpenes, sesquiterpenes, and carotenoids [67]. Several genes involved in the biosynthesis of these compounds have been identified and isolated from roses, such as GGPPS, GPS, RrAAT1, DXS, DXR, LIS, CCD1, PAR, and PAL [68,73,79,80]. These genes encode enzymes that catalyze different steps of the metabolic pathways leading to various volatile compounds. For example, GPS synthesizes GPP, a precursor of C10 monoterpenoids; CCD1 cleaves carotenoids to produce apocarotenoids; RrAAT1 converts terpen alcohols to acetic esters; and LIS synthesizes linalool from GPP [3,67,73,81]. The expression levels of these genes in rose petals under different light conditions were measured and correlated with the volatile profiles of the petals. The color and fragrance of rose petals are also regulated by transcription factors (TFs) that modulate the expression of structural genes involved in the biosynthesis of pigments and volatiles. Some of the TFs that play a key role in this process are MYB, bHLH, and WD40 [74]. These TFs form complexes that bind to specific DNA sequences and activate or repress the transcription of target genes [72]. For instance, MYB-TFs regulate anthocyanin and flavonoid biosynthesis by activating structural genes such as CHS, F3H, DFR, ANS, and UFGT [82]. Similarly, bHLH and WD40 TFs interact with MYB-TFs to regulate anthocyanin biosynthesis by forming MBW complexes [77,78]. Moreover, RhMYB1 is a putative TF that is expressed in aromatic roses but not in non-aromatic roses, suggesting its role in regulating volatile biosynthesis [75]. The expression levels of these TFs in rose petals under different light conditions were analyzed and examined their relationship with the pigment and volatile contents of the petals.
The developmental stages of flowers significantly affect the volatile compounds they emit, as previous studies have shown [67,83,84]. The fragrant compounds also vary considerably throughout the flower development. The authors of [85] examined the volatile components of R. odorata and R. chinensis and reported that the flowers with four single petals had higher amounts of total volatile compounds in the first stage of development and then decreased sharply. These results agreed with the findings of the phytochemical investigation. The authors of [86,87] found a positive correlation between the expression of DXR, DXS, LIS, and AAT1 genes and the rate of monoterpene biosynthesis pathway in the rose flower. They inferred that higher DXR expression could be associated with higher monoterpene accumulation, implying that the DXR gene has a critical role in monoterpene biosynthesis in R. canina petals. Other studies explored the link between monoterpene content in Artemisia annua and the expression of key genes in the MEP and artemisinin biosynthesis pathway, which is the main monoterpene biosynthesis pathway in plants. They used qRT-PCR to verify that the upregulation of the main MEP pathway genes led to more monoterpenes in plant tissues. Ahmadian [88] observed changes in the relative gene expression and metabolites of terpenoids and phenylpropanoids compounds during different flower developmental stages in tuberose. This research emphasized the importance of timing the developmental stages when studying the regulation of secondary metabolites. Ranjbar [89] analyzed the expression patterns of artemisinin biosynthesis genes in eight different Artemisia species at three developmental stages. The study detected significant differences in the expression levels of these genes among species and developmental stages. The expression of FLS gene, which catalyzes flavanol synthesis, was higher at the budding stage than at the open-flower stage in both cultivars, while the expression of ANS gene, which catalyzes anthocyanin formation, was higher at the open-flower stage than at the budding stage in the dark pink cultivar, but not in the white cultivar. The differential expression of anthocyanin biosynthetic genes in the petals of R. canina explains the molecular basis of the color variation between the dark pink and white cultivars. Among these genes, ANS was the most significantly upregulated gene in the dark pink petals, indicating its key role in regulating the anthocyanin accumulation in this tissue. This finding offers a valuable target for breeding strategies aimed at improving the anthocyanin production and quality in R. canina and other ornamental plants. Flavanol synthesis is more active in the early stages of flower development, before anthocyanin accumulation, which is consistent with previous studies. The higher expression of ANS gene in the dark pink cultivar at the open-flower stage may be related to the increase in vacuolar pH during flower opening, which enhances anthocyanin stability and color intensity [90,91]. White petals of R. canina gradually fade to pure white during flower development due to downregulation of anthocyanin biosynthesis-related genes [92].
Ahmadian [88] reported that the relative gene expression and metabolites of terpenoids and phenylpropanoids compounds varied during different flower developmental stages in tuberose. This finding underscores the need to account for the timing of developmental stages in the analysis of secondary metabolites. [89] examined the expression patterns of genes involved in artemisinin biosynthesis in eight Artemisia species at three developmental stages. They detected significant differences in the expression levels of these genes among species and developmental stages. This result corroborates the study of (Ahmadian et al., 2018) [88], which showed that PAR gene accumulation was higher in flowers at the budding stage due to the presence of fresh stamen, while it was lower in open flowers. This result was consistent with the GC-MS data analysis, which indicated that the essential oil with the highest percentage of aliphatic hydrocarbons was obtained from flowers at the budding stage. This study also revealed that phenylalanine metabolism differed between white and pink roses, affecting their fragrance production. White flowers had higher levels of 2-phenylethanol, which is derived from phenylalanine at the initial step of the phenylpropanoid biosynthesis pathway. Pink roses, however, used phenylalanine to produce anthocyanins, which gave them their color. Consequently, the expression of genes related to phenylpropanoid biosynthesis, such as PAL and PAR, was lower in pink roses than in white flowers. Nevertheless, PAL also contributed to anthocyanin biosynthesis, which might influence the trade-off between fragrance and color production in different rose varieties. Comparative transcriptomic analysis indicated that GGPPS and PAR were the key regulatory genes for monoterpene and phenylpropanoid biosynthesis, respectively, in white flowers at the budding stage.

4. Materials and Methods

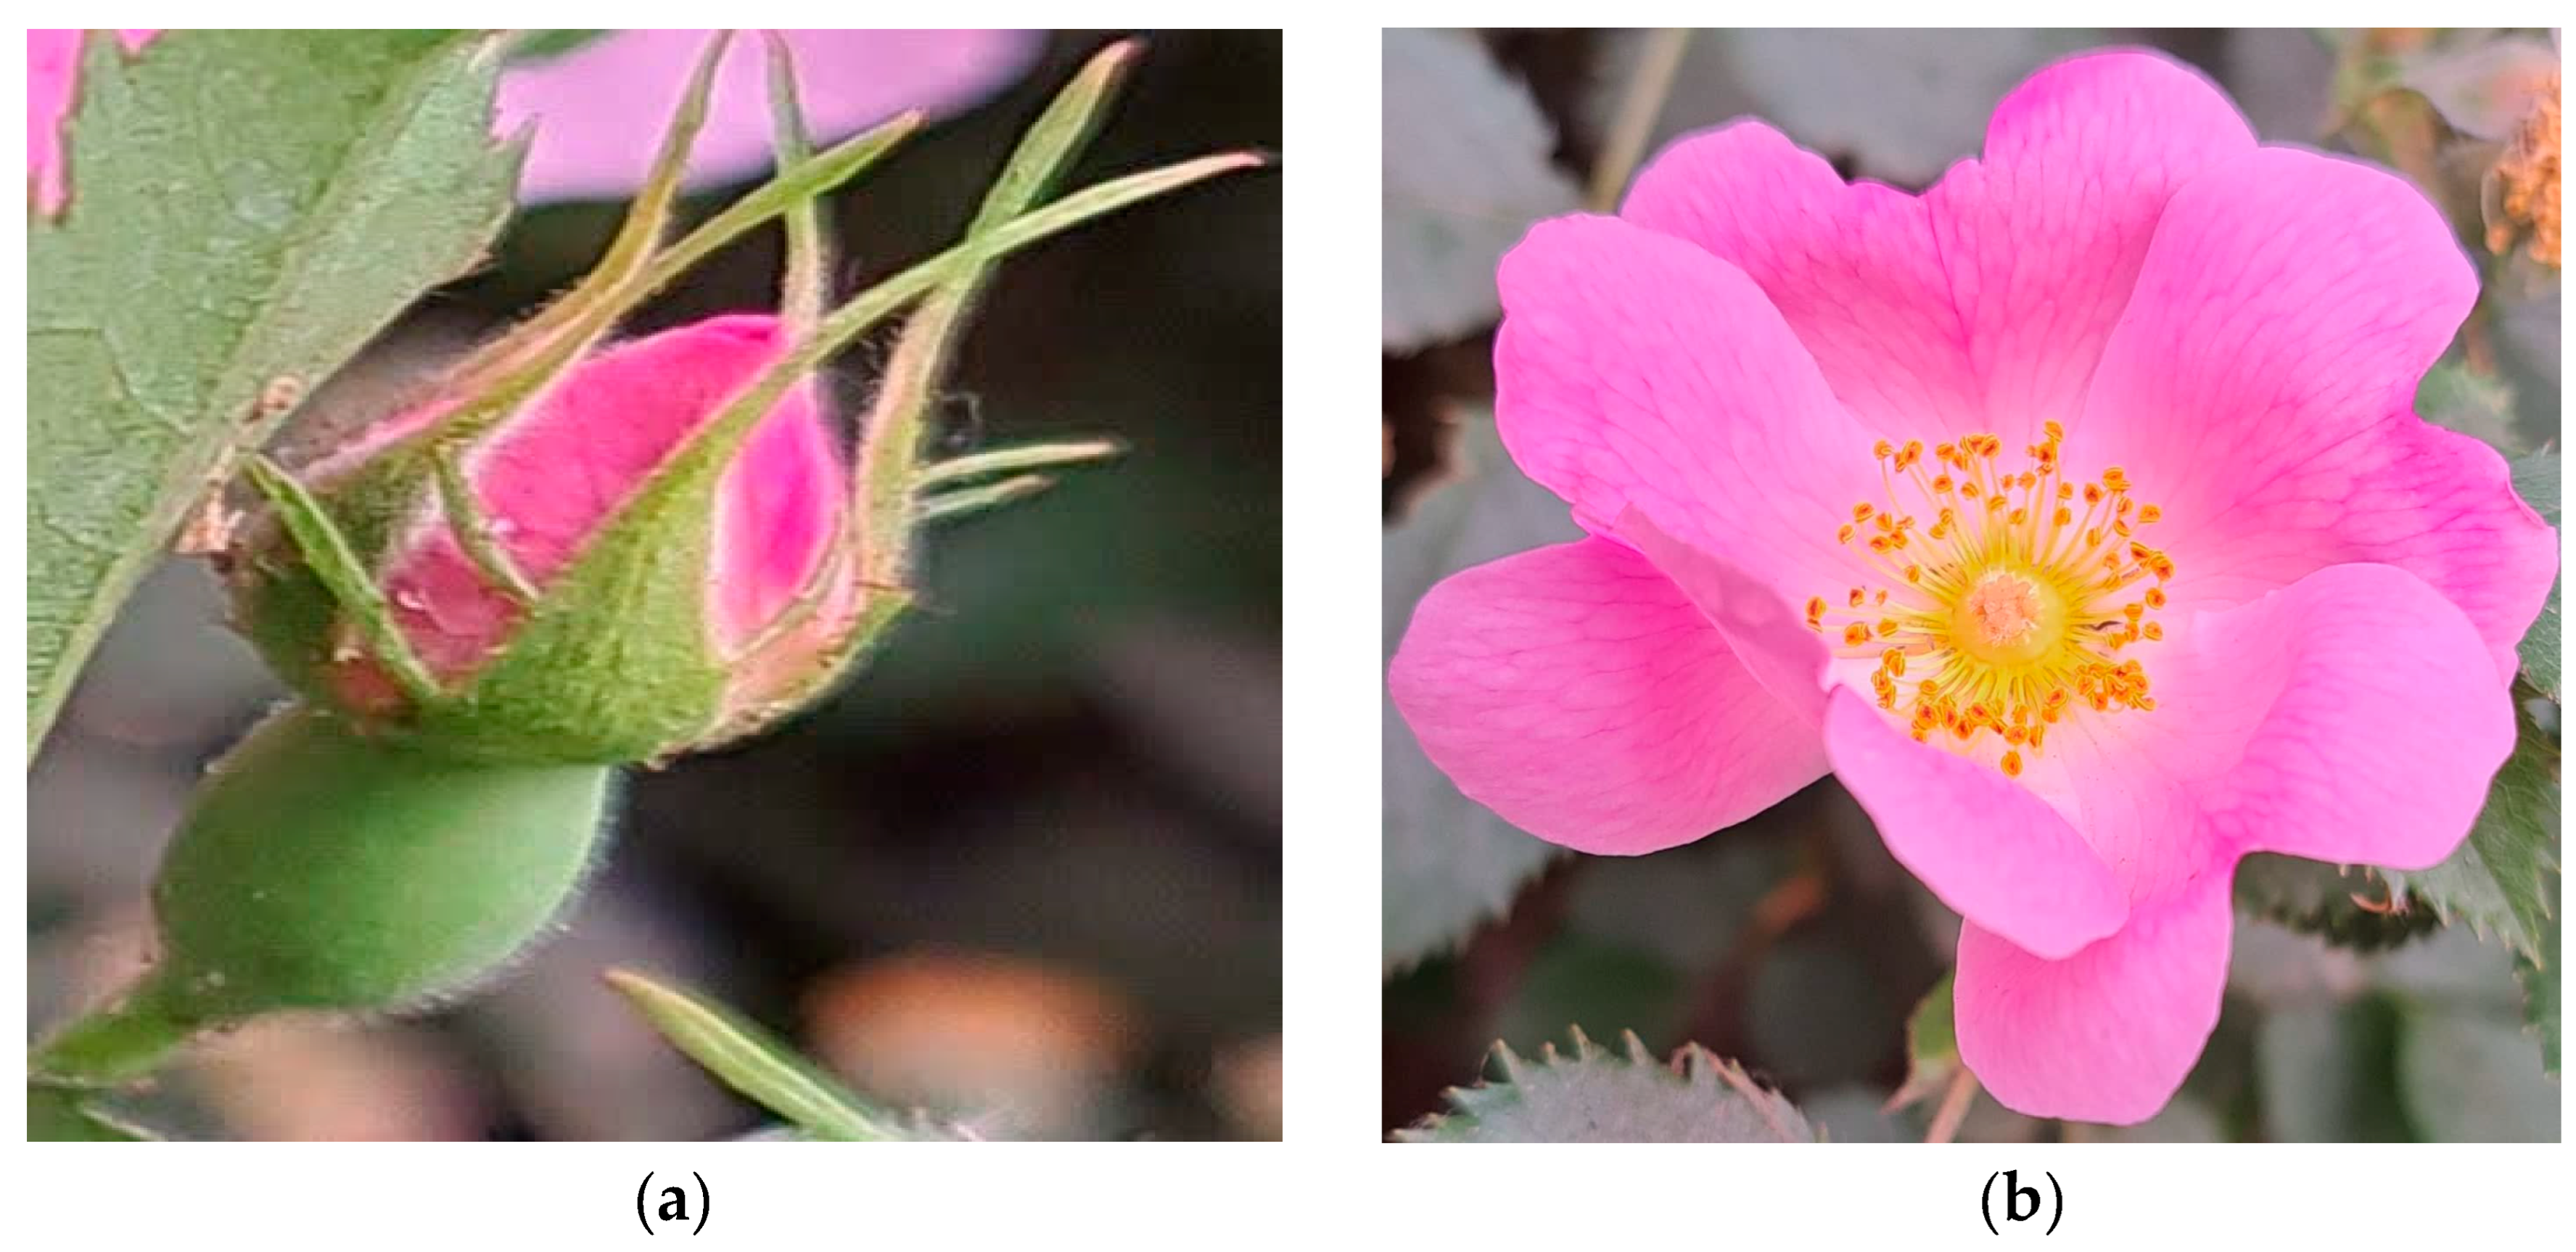
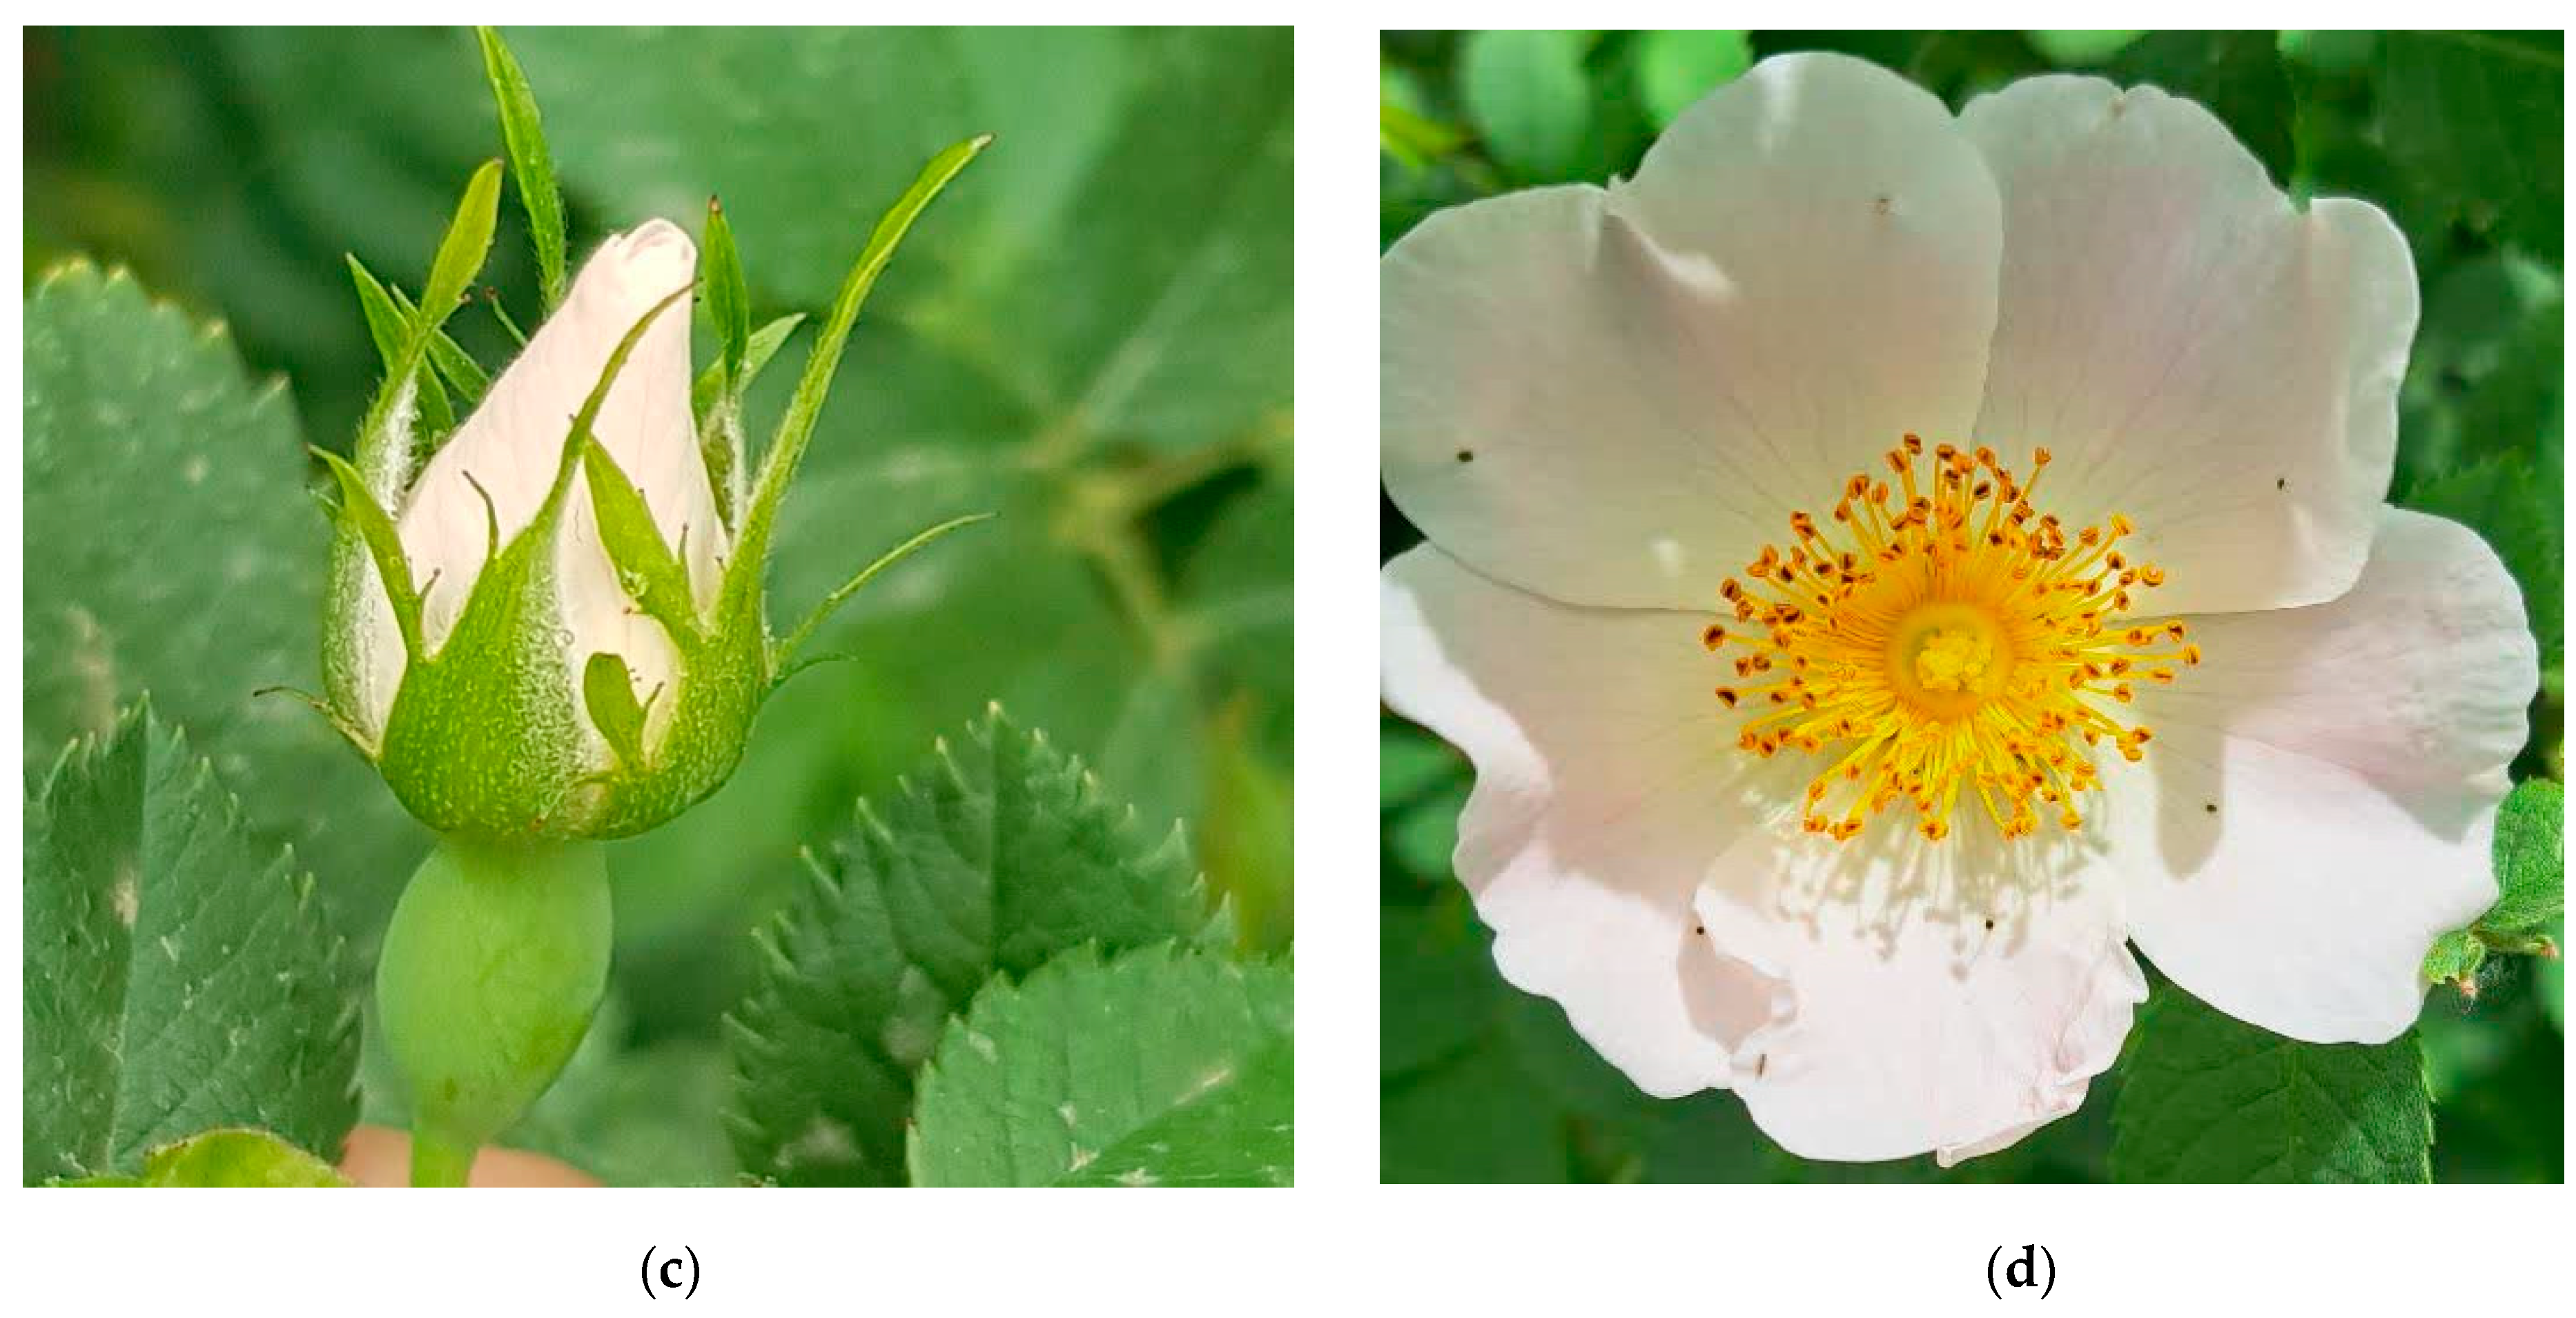
4.1. Plant Materials

The study used two color morphs of R. canina flowers, white and dark pink, which are endemic to the mountainous areas of Taleghan, Alborz province, Iran. The flowers were collected from a wild population at 36°10′18.8″ N and 50°46′12.7″ E and identified by their morphological features of leaves, fruits, and flowers, based on the methods of [93,94]. A voucher specimen (number 006962) was deposited in the Herbarium Instituti Agronomici KeredJensis (HIAK) by a botanist from the horticulture department of the University of Tehran (Dr. Vahideh Nazeri Jounghani). The flowers were harvested in the evening (6:00 p.m.) before sunset, which previous studies [95,96] indicated is the optimal time for volatile oil content.
White and dark pink shrub samples were obtained from the same plant. For each sample, three technical replicates were prepared for molecular analysis. The flowers were picked at two stages of floral development that were important for scent emission: the budding stage (S1) and the open-flower stage (S2) [97]. The development stages were determined by measuring the flower length, weight, and diameter, and by observing the sepal shape and the pollen color and texture. In the budding stage (S1), the sepals were closed but the petal colors were visible. In the open-flower stage (S2), the pollen was light yellow and the petals were fresh and dark. These two stages had higher scent emission than the senescence stage, based on phenotypic characteristics (Figure 7). To prevent RNA degradation, the fresh samples were immediately frozen in liquid nitrogen and stored at −80 °C until further analysis. For dried petals powder preparation, the petals were detached and dried in a cool and dark place, then ground into powder [98].

4.2. Extraction of the Essential Oils

To extract Rosa essential oils (EOs), the fresh petals were carefully separated from the other parts of the flower [99]. Around 200 g of fresh petals from both white and dark pink flowers were weighed and used for the extraction process. The EOs extraction was carried out using the hydrodistillation method, which involves heating water and plant material in a closed system and condensing the vapor containing the volatile compounds [100]. This method was chosen because it is simple, inexpensive, and widely used for extracting EOs from various plants [101]. The extraction was performed using a 2 L Clevenger apparatus for a duration of 4 h. The extracted EOs were stored in a dark glass vial and kept at a low temperature of −4 °C to prevent evaporation and loss of EOs until GC-MS analysis.

4.3. Chemical Compositions of the R. canina Essential Oil by GC-MS Analysis

The chemical composition of the essential oils (EOs) was analyzed by GC-MS using a ThermoQuest Finnigan TRACE MS system with a quadrupole mass analyzer, as described by Naquvi et al. [102]. The GC column was a non-polar DB-5 fused silica capillary (30 m × 0.25 mm × 0.25 µm film thickness), and the carrier gas was helium at a flow rate of 1.1 mL/min. The injection volume was 1 µL, and the split ratio was 1:10. The injector and detector temperatures were 250 °C and 280 °C, respectively. The oven temperature was programmed from 60 °C to 250 °C at 5 °C/min, and then held at 250 °C for 10 min. The mass spectra were recorded in the electron ionization mode at 70 eV, scanning from 40 to 460 m/z, with a scan time of 0.4 s. The peak areas of the GC-MS chromatograms were integrated using the Xcalibur software (version 2.0, Thermo Fisher Scientific, Waltham, MA, USA). The peak identification was based on the comparison of the retention indices (RI) and the mass spectra of the compounds with those of authentic standards and literature data. The RI values were calculated by interpolation using a homologous series of n-alkanes (C8–C20) as reference compounds, according to the following formula:
RI: 100 × Cn + 100 × (Tn − Sn)/ (Sn+1 − Sn)
where RI is the retention index of the compound, Cn is the number of carbon atoms in the n-alkane eluting before the compound, Tn is the retention time of the compound, Sn is the retention time of the n-alkane eluting before the compound, and Sn+1 is the retention time of the n-alkane eluting after the compound. The relative percentages of the identified compounds were calculated based on the peak areas without using correction factors. The GC-MS data were also analyzed using the Kyoto Encyclopedia of Genes and Genomes (KEGG) [103] and MetaCyc [104] databases to identify the key genes involved in the biosynthesis of floral aromatic compounds. The metabolic pathways and enzymes were retrieved from the databases using the compound names and structures as queries [105,106].

4.4. Measurement of Total Phenol Content

The total phenolic content of white and dark pink R. canina petals was determined by the Folin–Ciocalteu method, following the procedures of [107,108]. The samples were analyzed in triplicate and their absorbance was measured at 760 nm using a microplate reader (Epoch, BioTek, Winooski, VT, USA) with Gene 5 software. The results were expressed as mg of gallic acid equivalents per g of dry weight. A completely randomized design was used to analyze the data with SAS 9.4 software (SAS Institute Inc., Tokyo, Japan). Duncan’s test was performed to compare the means at the significance levels of 5% (p ≤ 0.05) and 1% (p ≤ 0.01).

4.5. Measurement of Total Flavonoid Content

The spectrophotometric assay of Popova et al. [109] was applied to determine the total flavonoid content. This method relies on the complexation of aluminum ion with the carbonyl and hydroxyl groups of the flavonoid. The flavonoid content was expressed as rutin equivalents, using rutin as a standard. An Elisa system microplate reader (Epoch, BioTek) equipped with Gene 5 software, which is a device that measures the absorbance of a solution, was used to perform the assay at 510 nm [110]. The experiment was replicated three times for accuracy. SAS 9.4 software, which is a statistical software that can conduct various tests and analyses, was used to analyze the data with a completely randomized design (CRD). The mean values were compared by Duncan’s test at 5% and 1% significance levels (p ≤ 0.05 and p ≤ 0.01, respectively).

4.6. Measurement of Total Anthocyanin Content

The method of [111] was used to quantify the anthocyanin content of white and dark pink petals. Acidified methanol (1%, v/v; methanol/HCl = 99:1) was used to extract fresh petals (0.1 g) in 10 mL of solvent. The extract was centrifuged at 4 °C and 4000× g for 15 min and the supernatant was stored overnight at 5 °C in the dark. The supernatant was then filtered through a membrane filter and its absorbance at 530 nm was measured using a UV–VIS spectroscopy (Shimadzu, Kyoto, Japan, model UV-1601) with distilled water as a blank.

4.7. UPLC–Electrospray Ionization Mass Spectrometry (ESI-MS) Analysis

The methanolic extract of R. canina was analyzed for polyphenolic compounds, including phenolic acid and flavonoid components, by LC-ESI-MS [112,113]. The LC system was a Waters Alliance 2695 equipped with a C18 column (4.6 mm × 150 mm, 5 μm) maintained at 35 °C. The mobile phase consisted of acetonitrile with 0.1% formic acid (solvent C) and water with 0.1% formic acid (solvent B). The flow rate was 0.30 mL min−1. The MS system was a Micromass Quattro micro API operating in ESI mode with the following parameters: cone voltage, 20 V; capillary voltage, 4 kV; extractor, 2 V; RF lens, 0.2 V; collision energy, −eV; gas nebulizer, N_2 (grade 5); flow gas, 200 L/h; source temperature, 120 °C; desolvation temperature, 350 °C. The sample was filtered through a MILLEX GV membrane filter (0.22 μm pore size, Millipore, Burlington, MA, USA) before injection.

4.8. RNA Isolation and Quantitative Real-Time PCR (qRT-PCR)

For expression analysis of genes involved in flower color and scent, approximately 200 mg of petal sample was used. The samples were ground into a powder in liquid nitrogen, and total RNA was extracted using a modified CTAB method [114,115]. Genomic DNA contamination was eliminated using DNase I, RNase-Free DNase Set (Fermentas, Waltham, MA, USA). The quality and quantity of RNA samples were assessed using agarose gel electrophoresis and Nanodrop ND-1000, respectively [116,117]. To synthesize the first strand complementary DNA (cDNA), 1 μg of total RNA was converted into cDNA using the cDNA synthesis kit (A101161, Reverse Transcription Kit made by Parstous Iran) following the manufacturer’s instructions. The main genes identified by GC-MS data analysis and literature review were selected (Figure 8 and Figure 9).
The online version of primer3 software [118] was used to design the corresponding primers for PAL, FLS, MYB1, PAR, GPS, GGPS, ANS, CCD1, LIS1, AAT1, DXR, DXS, and CER1 genes. The primer efficiency was checked using the Oli-go-analyzer tool and NCBI/Primer-BLAST software (https://www.ncbi.nlm.nih.gov/tools/primer-blast/). Table 4 lists the sequences of the forward and reverse primers used for qRT-PCR. The beta-actin gene served as a housekeeping gene for normalizing the expression of target genes. QIAGEN’s real-time PCR system was used to perform qRT-PCR following the manufacturer’s instructions [119,120]. Each reaction consisted of a 15 μL mixture containing 7.5 μL of SYBR green Master Mix 2X (ROX), 4.7 μL of RNase-free H2O, 2 μL of cDNA, 0.4 μL of forward primer, and 0.4 μL of reverse primer. The qRT-PCR thermal and temporal profiles were set to 15 min at 95 °C for initial denaturation, followed by 40 three-step cycles of amplification: 15 s of denaturation at 95 °C, 20 s of annealing at 56–59 °C (depending on the specific annealing temperature for each primer pair according to the gradient PCR results), and 20 s of extension at 72 °C. The 2−ΔΔCT method [121] was used to calculate the relative expression levels of mRNAs. SAS 9.4 software was used to analyze the gene expression results based on a Completely Random Design (CRD). Duncan’s test was applied to examine the mean values of significance at the 5% (p ≤ 0.05) and 1% (p ≤ 0.01) levels.
To examine the patterns of similarity among the gene expression results, cluster analysis was performed using the R package. A heatmap was generated to visualize the clustering results based on the Ward distance method. The heatmap indicates the degree of association between the flower color and scent biosynthesis pathway by using a color scale [122,123].

5. Conclusions

This study examined the molecular and biochemical basis of petal color and scent variation in R. canina, a wild rose species with multiple medicinal and cosmetic uses. The results showed that R. canina petals produce a range of bioactive compounds that have positive effects on human health and well-being, such as flavonoids, anthocyanins, and volatile organic compounds. The white and dark pink petals differed significantly in their TPC, TFC, and TAC, with the white petals having higher TPC and TFC and the dark pink petals having higher TAC. The gene expression analysis revealed that most genes involved in petal color and scent biosynthesis were more highly expressed in the white buds than in the dark pink open flowers, except for anthocyanin synthase (ANS) and its regulator RhMYB1, which had similar expression levels in both flower colors. These findings indicate that R. canina flowers are rich sources of essential oils and that anthocyanin synthesis may be subject to feedback inhibition in white flowers. This study also demonstrated the genetic and metabolic diversity of R. canina petals and highlighted their potential as a valuable resource of natural products with high added value. The study also compared the results with those from other roses or plants and revealed that R. canina petals have distinctive characteristics that set them apart from other plant-derived compounds. For instance, the main phenolic compounds were flavonoids, especially quercetin, kaempferol, and their derivatives. Gallic acid and quinic acid were also detected as the predominant phenolic acids in R. canina petals. The white-petaled cultivar had a higher content of fragrant rose flower essential oil, which has been reported to possess anti-inflammatory, antioxidant, and antimicrobial properties. Thus, this study contributed to the understanding of the biology and biotechnology of R. canina petals and create new possibilities for their optimal exploitation and utilization. The study also suggested the need for further research on the biology and biotechnology of R. canina petals, such as the identification of the regulatory factors and the functional characterization of the genes, as well as the evaluation of the safety and efficacy of the bioactive compounds. This study lays the foundation for improving R. canina floral traits using metabolic and genetic engineering.

Author Contributions

P.J.—Conducting the entire experiments, data collection, literature search and manuscript writing. A.-A.S.-B.—Designing a part of the molecular and phytochemical experiments. R.N.—Designing a part of the molecular and phytochemical experiments. M.Z. and M.R.N.—Developing the idea, project administration, overall supervision of the experiment, and funding acquisition. All authors have read and agreed to the published version of the manuscript.

Funding

The authors would like to acknowledge the University of Tehran for their support of this work. Moreover, this study was supported by the RUDN University Strategic Academic Leadership Program.

Institutional Review Board Statement

Not applicable.

Informed Consent Statement

Not applicable.

Data Availability Statement

The data presented in this study are available on request from the corresponding author.

Conflicts of Interest

The authors declare no conflicts of interest.

References

  1. Baudino, S.; Sun, P.; Caissard, J.C.; Nairaud, B.; Moja, S.; Magnard, J.L.; Bony, A.; Jullien, F.; Schuurink, R.C.; Vergne, P.; et al. Rose Floral Scent. Acta Hortic. 2019, 1232, 69–80. [Google Scholar] [CrossRef]
  2. Tabaei-Aghdaei, S.R.; Babaei, A.; Khosh-Khui, M.; Jaimand, K.; Rezaee, M.B.; Assareh, M.H.; Naghavi, M.R. Morphological and Oil Content Variations amongst Damask Rose (Rosa damascena Mill.) Landraces from Different Regions of Iran. Sci. Hortic. 2007, 113, 44–48. [Google Scholar] [CrossRef]
  3. Feng, L.; Chen, C.; Li, T.; Wang, M.; Tao, J.; Zhao, D.; Sheng, L. Flowery Odor Formation Revealed by Differential Expression of Monoterpene Biosynthetic Genes and Monoterpene Accumulation in Rose (Rosa rugosa Thunb.). Plant Physiol. Biochem. 2014, 75, 80–88. [Google Scholar] [CrossRef] [PubMed]
  4. Shi, S.; Zhang, Z. Genetic and Biochemical Aspects of Floral Scents in Roses. Int. J. Mol. Sci. 2022, 23, 8014. [Google Scholar] [CrossRef] [PubMed]
  5. Babaei, A.; Tabaei-Aghdaei, S.R.; Khosh-Khui, M.; Omidbaigi, R.; Naghavi, M.R.; Esselink, G.D.; Smulders, M.J.M. Microsatellite Analysis of Damask Rose (Rosa damascena Mill.) Accessions from Various Regions in Iran Reveals Multiple Genotypes. BMC Plant Biol. 2007, 7, 12. [Google Scholar] [CrossRef] [PubMed]
  6. Ahmad, N.; Anwar, F.; Gilani, A.-u.-H. Rose Hip (Rosa canina L.) Oils. In Essential Oils in Food Preservation, Flavor and Safety; Academic Press: Cambridge, MA, USA, 2016; pp. 667–675. [Google Scholar] [CrossRef]
  7. Ouerghemmi, S.; Rhimi, A.; Achour, H.; Dhaouadi, K.; Khebour Allouche, F.; Chaar, H.; Sebei, H. Ecological Distribution, Phytochemistry and Biological Properties of Rosa Species in Tunisia. In Agriculture Productivity in Tunisia Under Stressed Environment; Springer: Berlin/Heidelberg, Germany, 2021; pp. 73–136. [Google Scholar] [CrossRef]
  8. Schanzer, I.A.; Vagina, A. V ISSR (Inter Simple Sequence Repeat) Markers Reveal Natural Intersectional Hybridization in Wild Roses [Rosa L., Sect. Caninae (DC.) Ser. and Sect. Cinnamomeae (DC.) Ser.]. Wulfenia 2007, 14, 1–14. [Google Scholar]
  9. Ercisli, S. Rose (Rosa Spp.) Germplasm Resources of Turkey. Genet. Resour. Crop Evol. 2005, 52, 787–795. [Google Scholar] [CrossRef]
  10. Czyzowska, A.; Klewicka, E.; Pogorzelski, E.; Nowak, A. Polyphenols, Vitamin C and Antioxidant Activity in Wines from Rosa canina L. and Rosa rugosa Thunb. J. Food Compos. Anal. 2015, 39, 62–68. [Google Scholar] [CrossRef]
  11. Demir, N.; Yildiz, O.; Alpaslan, M.; Hayaloglu, A.A. Evaluation of Volatiles, Phenolic Compounds and Antioxidant Activities of Rose Hip (Rosa L.) Fruits in Turkey. LWT—Food Sci. Technol. 2014, 57, 126–133. [Google Scholar] [CrossRef]
  12. Tabaszewska, M.; Najgebauer-Lejko, D. The Content of Selected Phytochemicals and in Vitro Antioxidant Properties of Rose Hip (Rosa canina L.) Tinctures. NFS J. 2020, 21, 50–56. [Google Scholar] [CrossRef]
  13. Živković, J.; Stojković, D.; Petrović, J.; Zdunić, G.; Glamočlija, J.; Soković, M. Rosa canina L.—New Possibilities for an Old Medicinal Herb. Food Funct. 2015, 6, 3687–3692. [Google Scholar] [CrossRef]
  14. Yeon, J.Y.; Kim, W.S. Biosynthetic Linkage between the Color and Scent of Flowers: A Review. Hortic. Sci. Technol. 2021, 39, 697–713. [Google Scholar] [CrossRef]
  15. Li, Y.; Gao, R.; Zhang, J.; Wang, Y.; Kong, P.; Lu, K.; Adnan; Liu, M.; Ao, F.; Zhao, C.; et al. The Biochemical and Molecular Investigation of Flower Color and Scent Sheds Lights on Further Genetic Modification of Ornamental Traits in Clivia Miniata. Hortic. Res. 2022, 9, uhac114. [Google Scholar] [CrossRef] [PubMed]
  16. Ramya, M.; Jang, S.; An, H.R.; Lee, S.Y.; Park, P.M.; Park, P.H. Volatile Organic Compounds from Orchids: From Synthesis and Function to Gene Regulation. Int. J. Mol. Sci. 2020, 21, 1160. [Google Scholar] [CrossRef]
  17. Mohd-Hairul, A.R.; Namasivayam, P.; Cheng Lian, G.E.; Abdullah, J.O. Terpenoid, Benzenoid, and Phenylpropanoid Compounds in the Floral Scent of Vanda Mimi Palmer. J. Plant Biol. 2010, 53, 358–366. [Google Scholar] [CrossRef]
  18. Shi, S.; Zhang, S.; Wu, J.; Liu, X.; Zhang, Z. Identification of Long Non-Coding RNAs Involved in Floral Scent of Rosa hybrida. Front. Plant Sci. 2022, 13, 996474. [Google Scholar] [CrossRef] [PubMed]
  19. Grotewold, E. The genetics and biochemistry of floral pigments. Annu. Rev. Plant Biol. 2006, 57, 761–780. [Google Scholar] [CrossRef] [PubMed]
  20. Akbulut, M. Phenolic Content and Antioxidant Activity of Some Spices. World Appl. Sci. J. 2009, 6, 373–377. [Google Scholar]
  21. Tungmunnithum, D.; Thongboonyou, A.; Pholboon, A.; Yangsabai, A. Flavonoids and Other Phenolic Compounds from Medicinal Plants for Pharmaceutical and Medical Aspects: An Overview. Medicines 2018, 5, 93. [Google Scholar] [CrossRef] [PubMed]
  22. Pichersky, E.; Noel, J.P.; Dudareva, N. Biosynthesis of Plant Volatiles: Nature’s Diversity and Ingenuity. Science 2006, 311, 808–811. [Google Scholar] [CrossRef]
  23. Muhlemann, J.K.; Klempien, A.; Dudareva, N. Floral Volatiles: From Biosynthesis to Function. Plant Cell Environ. 2014, 37, 1936–1949. [Google Scholar] [CrossRef] [PubMed]
  24. Zvi, M.M.B.; Negre-Zakharov, F.; Masci, T.; Ovadis, M.; Shklarman, E.; Ben-Meir, H.; Tzfira, T.; Dudareva, N.; Vainstein, A. Interlinking Showy Traits: Co-Engineering of Scent and Colour Biosynthesis in Flowers. Plant Biotechnol. J. 2008, 6, 403–415. [Google Scholar] [CrossRef] [PubMed]
  25. Yin, X.; Wang, T.; Zhang, M.; Zhang, Y.; Irfan, M.; Chen, L.; Zhang, L. Role of Core Structural Genes for Flavonoid Biosynthesis and Transcriptional Factors in Flower Color of Plants. Biotechnol. Biotechnol. Equip. 2021, 35, 1214–1229. [Google Scholar] [CrossRef]
  26. Katsumoto, Y.; Fukuchi-Mizutani, M.; Fukui, Y.; Brugliera, F.; Holton, T.A.; Karan, M.; Nakamura, N.; Yonekura-Sakakibara, K.; Togami, J.; Pigeaire, A.; et al. Engineering of the Rose Flavonoid Biosynthetic Pathway Successfully Generated Blue-Hued Flowers Accumulating Delphinidin. Plant Cell Physiol. 2007, 48, 1589–1600. [Google Scholar] [CrossRef] [PubMed]
  27. Ogata, J.; Kanno, Y.; Itoh, Y.; Tsugawa, H.; Suzuki, M. Anthocyanin Biosynthesis in Roses. Nature 2005, 435, 757–758. [Google Scholar] [CrossRef] [PubMed]
  28. Liu, W.; Feng, Y.; Yu, S.; Fan, Z.; Li, X.; Li, J.; Yin, H. The Flavonoid Biosynthesis Network in Plants. Int. J. Mol. Sci. 2021, 22, 12824. [Google Scholar] [CrossRef]
  29. Fetni, S.; Bertella, N.; Ouahab, A. LC–DAD/ESI–MS/MS Characterization of Phenolic Constituents in Rosa canina L. and Its Protective Effect in Cells. Biomed. Chromatogr. 2020, 34, e4961. [Google Scholar] [CrossRef]
  30. Behnamnia, S.; Rahimmalek, M.; Haghighi, M.; Nikbakht, A.; Gharibi, S.; Pachura, N.; Szumny, A.; Łyczko, J. Variation in Flavonoid Compounds, Volatiles and Yield Related Traits in Different Iranian Rosa damascena Mill. Cultivars Based on SPME Arrow and LC-MS/MS. Foods 2024, 13, 668. [Google Scholar] [CrossRef]
  31. Salehi, M.; Karimzadeh, G.; Naghavi, M.R. Synergistic Effect of Coronatine and Sorbitol on Artemisinin Production in Cell Suspension Culture of Artemisia annua L. Cv. Anamed. Plant Cell Tissue Organ Cult. (PCTOC) 2019, 3, 587–597. [Google Scholar] [CrossRef]
  32. Sauvageau, D.; Sauvageau, D. Microbial Esterase and the Degradation of Plasticizers. Master’s Thesis, McGill University, Montreal, QC, Canada, 2004. [Google Scholar]
  33. Wu, Y.; Han, X.; Yuan, W.Q.; Wang, X.X.; Meng, D.H.; Hu, J.Z.; Lv, Z.L. Salt Intervention for the Diversities of Essential Oil Composition, Aroma and Antioxidant Activities of Kushui Rose (R. Setate × R. Rugosa). Ind. Crops Prod. 2020, 150, 112417. [Google Scholar] [CrossRef]
  34. Khazayi, M.; Afshari, H.; Hashemi-Moghaddam, H. Evaluation of Extraction Method and Chemical Modifier on Chemical Composition of the Essential Oils from the Roots of Rosa canina L. J. Essent. Oil Bear. Plants 2019, 22, 131–140. [Google Scholar] [CrossRef]
  35. Tanjga, B.B.; Lončar, B.; Aćimović, M.; Kiprovski, B.; Šovljanski, O.; Tomić, A.; Travičić, V.; Cvetković, M.; Raičević, V.; Zeremski, T. Volatile Profile of Garden Rose (Rosa hybrida) Hydrosol and Evaluation of Its Biological Activity In Vitro. Horticulturae 2022, 8, 895. [Google Scholar] [CrossRef]
  36. Hosseini, H.; Zahedi, B.; Jowkar, A.; Kermani, M.J.; Karami, A. Investigation of Floral Scent and Essential Oil of Rosa Iberica Petals. J. Ornam. Plants 2021, 11, 89–97. [Google Scholar]
  37. Yari, E.; Sari, S.; Kelidari, H.; Asare-Addo, K.; Nokhodchi, A. Effect of Rosa damascena Essential Oil Loaded in Nanostructured Lipid Carriers on the Proliferation of Human Breast Cancer Cell Line MDA-MB-231 in Comparison with Cisplatin. J. Pharm. Innov. 2024, 19, 4. [Google Scholar] [CrossRef]
  38. Dani, K.G.S.; Fineschi, S.; Michelozzi, M.; Trivellini, A.; Pollastri, S.; Loreto, F. Diversification of Petal Monoterpene Profiles during Floral Development and Senescence in Wild Roses: Relationships among Geraniol Content, Petal Colour, and Floral Lifespan. Oecologia 2020, 197, 957–969. [Google Scholar] [CrossRef] [PubMed]
  39. Bartwal, A.; Mall, R.; Lohani, P.; Guru, S.K.; Arora, S. Role of Secondary Metabolites and Brassinosteroids in Plant Defense Against Environmental Stresses. J. Plant Growth Regul. 2013, 32, 216–232. [Google Scholar] [CrossRef]
  40. Assimopoulou, A.N.; Sinakos, Z.; Papageorgiou, V.P. Radical Scavenging Activity of Crocus Sativus L. Extract and Its Bioactive Constituents. Phytother. Res. 2005, 19, 997–1000. [Google Scholar] [CrossRef] [PubMed]
  41. Finkelstein, R.R.; Rock, C.D. Abscisic Acid Biosynthesis and Response. Arab. Book/Am. Soc. Plant Biol. 2002, 1, e0058. [Google Scholar] [CrossRef]
  42. Mohsen, E.; Younis, I.Y.; Farag, M.A. Metabolites Profiling of Egyptian Rosa damascena Mill. Flowers as Analyzed via Ultra-High-Performance Liquid Chromatography-Mass Spectrometry and Solid-Phase Microextraction Gas Chromatography-Mass Spectrometry in Relation to Its Anti-Collagenase Skin Effect. Ind. Crops Prod. 2020, 155, 112818. [Google Scholar] [CrossRef]
  43. Schwab, W.; Davidovich-Rikanati, R.; Lewinsohn, E. Biosynthesis of Plant-Derived Flavor Compounds. Plant J. 2008, 54, 712–732. [Google Scholar] [CrossRef]
  44. Elsharif, S.A.; Banerjee, A.; Buettner, A. Structure-Odor Relationships of Linalool, Linalyl Acetate and Their Corresponding Oxygenated Derivatives. Front. Chem. 2015, 3, 57. [Google Scholar] [CrossRef]
  45. Sterrett, F.S. The Nature of Essential Oils. II. Chemical Constituents, Analysis. J. Chem. Educ. 1962, 39, 246–251. [Google Scholar] [CrossRef]
  46. Qian, Y.; Bian, S.; Zhao, P.; Wang, T.; Hua, Y.; Liu, Y.; Teng, Q.; Tao, C. The Investigation of Evaporation Behavior of Lubricating Oil Droplet at High Ambient Temperature. Int. Commun. Heat Mass Transf. 2020, 117, 104689. [Google Scholar] [CrossRef]
  47. Restrepo-Cano, J.; Ordonez-Loza, J.; Guida, P.; Roberts, W.L.; Chejne, F.; Sarathy, S.M.; Im, H.G. Evaporation, Break-up, and Pyrolysis of Multi-Component Arabian Light Crude Oil Droplets at Various Temperatures. Int. Commun. Heat Mass Transf. 2022, 183, 122175. [Google Scholar] [CrossRef]
  48. Pawar, K.R.; Babu, R.J. Polymeric and Lipid-Based Materials for Topical Nanoparticle Delivery Systems. Crit. Rev. Trade Ther. Drug Carr. Syst. 2010, 27, 419–459. [Google Scholar] [CrossRef] [PubMed]
  49. Piechulla, B.; Effmert, U. Biosynthesis and Regulation of Flower Scent. Plant Dev. Biol. 2010, 2, 189–205. [Google Scholar] [CrossRef]
  50. Cseke, L.J.; Kaufman, P.B.; Kirakosyan, A. The Biology of Essential Oils in the Pollination of Flowers. Nat. Prod. Commun. 2019, 2, 1317–1336. [Google Scholar] [CrossRef]
  51. Palmqvist, B.; Brazeau, H.A.; Parachnowitsch, A.L. Differences in Floral Scent and Petal Reflectance Between Diploid and Tetraploid Chamerion Angustifolium. Front. Ecol. Evol. 2021, 9, 734128. [Google Scholar] [CrossRef]
  52. Guterman, I.; Shalit, M.; Menda, N.; Piestun, D.; Dafny-Yelin, M.; Shalev, G.; Bar, E.; Davydov, O.; Ovadis, M.; Emanuel, M.; et al. Rose Scent Genomics Approach to Discovering Novel Floral Fragrance–Related Genes. Plant Cell 2002, 14, 2325–2338. [Google Scholar] [CrossRef]
  53. Ghazghazi, H.; Miguel, M.G.; Hasnaoui, B.; Sebei, H.; Ksontini, M.; Figueiredo, A.C.; Pedro, L.G.; Barroso, J.G. Phenols, Essential Oils and Carotenoids of Rosa canina from Tunisia and Their Antioxidant Activities. Afr. J. Biotechnol. 2012, 9, 2709–2716. [Google Scholar]
  54. Shraim, A.M.; Ahmed, T.A.; Rahman, M.M.; Hijji, Y.M. Determination of Total Flavonoid Content by Aluminum Chloride Assay: A Critical Evaluation. LWT 2021, 150, 111932. [Google Scholar] [CrossRef]
  55. Panche, A.N.; Diwan, A.D.; Chandra, S.R. Flavonoids: An Overview. J. Nutr. Sci. 2016, 5, e47. [Google Scholar] [CrossRef]
  56. Roy, A.; Khan, A.; Ahmad, I.; Alghamdi, S.; Rajab, B.S.; Babalghith, A.O.; Alshahrani, M.Y.; Islam, S.; Islam, M.R. Flavonoids a Bioactive Compound from Medicinal Plants and Its Therapeutic Applications. Biomed. Res. Int. 2022, 2022, 5445291. [Google Scholar] [CrossRef] [PubMed]
  57. Roman, I.; Stǎnilǎ, A.; Stǎnilǎ, S. Bioactive Compounds and Antioxidant Activity of Rosa canina L. Biotypes from Spontaneous Flora of Transylvania. Chem. Cent. J. 2013, 7, 73. [Google Scholar] [CrossRef] [PubMed]
  58. Adamczak, A.; Buchwald, W.; Zieliński, J.; Mielcarek, S. Flavonoid and Organic Acid Content in Rose Hips (Rosa L., Sect. Caninae Dc. Em. Christ.). Acta Biol. Crac. Ser. Bot. 2012, 54, 105–112. [Google Scholar] [CrossRef]
  59. Song, J.; Zhang, H.; Wang, Z.; Wang, J. The Antioxidant Activity, α-Glucosidase and Acetylcholinesterase Inhibition Activity, and Chemical Composition of Paeonia delavayi Petal. Food Qual. Saf. 2022, 6, fyac020. [Google Scholar] [CrossRef]
  60. Manivannan, A.; Narasegowda, S.; Prakash, T. Comparative Study on Color Coordinates, Phenolics, Flavonoids, Carotenoids, and Antioxidant Potential of Marigold (Tagetes Sp.) with Diverse Colored Petals. J. Food Meas. Charact. 2021, 15, 4343–4353. [Google Scholar] [CrossRef]
  61. Singleton, V.L.; Orthofer, R.; Lamuela-Raventós, R.M. [14] Analysis of Total Phenols and Other Oxidation Substrates and Antioxidants by Means of Folin-Ciocalteu Reagent. Methods Enzym. 1999, 299, 152–178. [Google Scholar] [CrossRef]
  62. Castañeda-Ovando, A.; de Pacheco-Hernández, M.L.; Páez-Hernández, M.E.; Rodríguez, J.A.; Galán-Vidal, C.A. Chemical Studies of Anthocyanins: A Review. Food Chem. 2009, 113, 859–871. [Google Scholar] [CrossRef]
  63. Ahadi, H.; Shokrpour, M.; Fatahi, R.; Naghavi, M.R.; Mirjalili, M.H. Essential Oil, Flavonoids and Anthocyanins Profiling of Some Iranian Damask Rose (Rosa damascena Mill.) Genotypes. Ind. Crops Prod. 2023, 205, 117579. [Google Scholar] [CrossRef]
  64. Zheng, J.; Meenu, M.; Xu, B. A Systematic Investigation on Free Phenolic Acids and Flavonoids Profiles of Commonly Consumed Edible Flowers in China. J. Pharm. Biomed. Anal. 2019, 172, 268–277. [Google Scholar] [CrossRef]
  65. Alizadeh, Z.; Fattahi, M. Essential Oil, Total Phenolic, Flavonoids, Anthocyanins, Carotenoids and Antioxidant Activity of Cultivated Damask Rose (Rosa damascena) from Iran: With Chemotyping Approach Concerning Morphology and Composition. Sci. Hortic. 2021, 288, 110341. [Google Scholar] [CrossRef]
  66. Rasouli, O.; Ahmadi, N.; Rashidi Monfared, S.; Sefidkon, F. Physiological, Phytochemicals and Molecular Analysis of Color and Scent of Different Landraces of Rosa damascena during Flower Development Stages. Sci. Hortic. 2018, 231, 144–150. [Google Scholar] [CrossRef]
  67. Sun, Y.; Wang, W.; Zhao, L.; Zheng, C.; Ma, F. Changes in Volatile Organic Compounds and Differential Expression of Aroma-Related Genes during Flowering of Rosa rugosa ‘Shanxian’. Hortic. Environ. Biotechnol. 2019, 60, 741–751. [Google Scholar] [CrossRef]
  68. Defilippi, B.G.; Kader, A.A.; Dandekar, A.M. Apple Aroma: Alcohol Acyltransferase, a Rate Limiting Step for Ester Biosynthesis, Is Regulated by Ethylene. Plant Sci. 2005, 168, 1199–1210. [Google Scholar] [CrossRef]
  69. Wei, Y.L.; Li, J.N.; Lu, J.; Tang, Z.L.; Pu, D.C.; Chai, Y.R. Molecular Cloning of Brassica napus TRANSPARENT TESTA 2 Gene Family Encoding Potential MYB Regulatory Proteins of Proanthocyanidin Biosynthesis. Mol. Biol. Rep. 2007, 34, 105–120. [Google Scholar] [CrossRef] [PubMed]
  70. Gang, D.R. Evolution of flavors and scents. Annu. Rev. Plant Biol. 2005, 56, 301–325. [Google Scholar] [CrossRef] [PubMed]
  71. Rameneni, J.J.; Choi, S.R.; Chhapekar, S.S.; Man-Sun, K.; Singh, S.; Yi, S.Y.; Heon, O.S.; Kim, H.; Lee, C.Y.; Man-Ho, O.; et al. Red Chinese Cabbage Transcriptome Analysis Reveals Structural Genes and Multiple Transcription Factors Regulating Reddish Purple Color. Int. J. Mol. Sci. 2020, 21, 2901. [Google Scholar] [CrossRef] [PubMed]
  72. Simkin, A.J.; Schwartz, S.H.; Auldridge, M.; Taylor, M.G.; Klee, H.J. The Tomato Carotenoid Cleavage Dioxygenase 1 Genes Contribute to the Formation of the Flavor Volatiles β-Ionone, Pseudoionone, and Geranylacetone. Plant J. 2004, 40, 882–892. [Google Scholar] [CrossRef]
  73. Walter, M.H.; Strack, D. Carotenoids and Their Cleavage Products: Biosynthesis and Functions. Nat. Prod. Rep. 2011, 28, 663–692. [Google Scholar] [CrossRef]
  74. Yan, H.; Zhang, H.; Wang, Q.; Jian, H.; Qiu, X.; Wang, J.; Tang, K. Isolation and Identification of a Putative Scent-Related Gene RhMYB1 from Rose. Mol. Biol. Rep. 2011, 38, 4475–4482. [Google Scholar] [CrossRef]
  75. Zhu, C.; Bai, C.; Sanahuja, G.; Yuan, D.; Farré, G.; Naqvi, S.; Shi, L.; Capell, T.; Christou, P. The Regulation of Carotenoid Pigmentation in Flowers. Arch. Biochem. Biophys. 2010, 504, 132–141. [Google Scholar] [CrossRef]
  76. Liu, J.; Osbourn, A.; Ma, P. MYB Transcription Factors as Regulators of Phenylpropanoid Metabolism in Plants. Mol. Plant 2015, 8, 689–708. [Google Scholar] [CrossRef]
  77. Zhao, L.; Gao, L.; Wang, H.; Chen, X.; Wang, Y.; Yang, H.; Wei, C.; Wan, X.; Xia, T. The R2R3-MYB, BHLH, WD40, and Related Transcription Factors in Flavonoid Biosynthesis. Funct. Integr. Genom. 2013, 13, 75–98. [Google Scholar] [CrossRef]
  78. Tholl, D. Biosynthesis and Biological Functions of Terpenoids in Plants. Adv. Biochem. Eng. Biotechnol. 2015, 148, 63–106. [Google Scholar] [CrossRef]
  79. Dudareva, N.; Pichersky, E. Biochemical and Molecular Genetic Aspects of Floral Scents. Plant Physiol. 2000, 122, 627–634. [Google Scholar] [CrossRef] [PubMed]
  80. Dudareva, N.; Cseke, L.; Blanc, V.M.; Pichersky, E. Evolution of Floral Scent in Clarkia: Novel Patterns of S-Linalool Synthase Gene Expression in the C. Breweri Flower. Plant Cell 1996, 8, 1137–1148. [Google Scholar] [CrossRef] [PubMed]
  81. Yan, H.; Pei, X.; Zhang, H.; Li, X.; Zhang, X.; Zhao, M.; Chiang, V.L.; Sederoff, R.R.; Zhao, X. MYB-Mediated Regulation of Anthocyanin Biosynthesis. Int. J. Mol. Sci. 2021, 22, 3103. [Google Scholar] [CrossRef] [PubMed]
  82. Fan, J.; Zhang, W.; Zhang, D.; Wang, G.; Cao, F. Flowering Stage and Daytime Affect Scent Emission of Malus Ioensis “Prairie Rose”. Molecules 2019, 24, 2356. [Google Scholar] [CrossRef] [PubMed]
  83. Kantsa, A.; Garcia, J.E.; Raguso, R.A.; Dyer, A.G.; Steen, R.; Tscheulin, T.; Petanidou, T. Intrafloral Patterns of Color and Scent in Capparis spinosa L. and the Ghosts of Its Selection Past. Am. J. Bot. 2023, 110, e16098. [Google Scholar] [CrossRef] [PubMed]
  84. Zhou, L.; Yu, C.; Cheng, B.; Wan, H.; Luo, L.; Pan, H.; Zhang, Q. Volatile Compound Analysis and Aroma Evaluation of Tea-Scented Roses in China. Ind. Crops Prod. 2020, 155, 112735. [Google Scholar] [CrossRef]
  85. Yeon, J.Y.; Kim, W.S. Floral Pigment-Scent Associations in Eight Cut Rose Cultivars with Various Petal Colors. Hortic. Environ. Biotechnol. 2020, 61, 633–641. [Google Scholar] [CrossRef]
  86. Feng, L.; Wang, M.; Wang, J.; Zang, S.; Xia, W.; Sheng, L. Isolation of 2-Phenylethanol Biosynthesis Related Genes and Their Relationship with 2-Phenylethanol Accumulation in Rosa rugosa. Acta Physiol. Plant 2015, 37, 256. [Google Scholar] [CrossRef]
  87. Jariani, P.; Shahnejat-Bushehri, A.A.; Naderi, R.; Naghavi, M.R.; Mofidi, S.S.H. Identification of MiRNAs and Their Target Genes Involved in the Biosynthesis of Flower Color and Scent in Rosa canina L. Iran. J. Sci. 2024, 48, 31–43. [Google Scholar] [CrossRef]
  88. Ahmadian, M.; Ahmadi, N.; Babaei, A.; Naghavi, M.R.; Ayyari, M. Comparison of Volatile Compounds at Various Developmental Stages of Tuberose (Polianthes tuberosa L. Cv. Mahallati) Flower with Different Extraction Methods. J. Essent. Oil Res. 2018, 30, 197–206. [Google Scholar] [CrossRef]
  89. Ranjbar, M.; Naghavi, M.R.; Alizadeh, H.; Soltanloo, H. Expression of Artemisinin Biosynthesis Genes in Eight Artemisia Species at Three Developmental Stages. Ind. Crops Prod. 2015, 76, 836–843. [Google Scholar] [CrossRef]
  90. Rasouli, O.; Ahmadi, N.; Rashidi Monfared, S. Molecular Characterization and Expression Pattern of RhPAR, RhMYB1 and RhANS Genes Involving in Scent and Color Production in Rosa damascena. Sci. Hortic. 2020, 272, 109399. [Google Scholar] [CrossRef]
  91. Schmitzer, V.; Veberic, R.; Osterc, G.; Stampar, F. Color and Phenolic Content Changes during Flower Development in Groundcover Rose. J. Am. Soc. Hortic. Sci. 2010, 135, 195–202. [Google Scholar] [CrossRef]
  92. Han, M.; Yang, C.; Zhou, J.; Zhu, J.; Meng, J.; Shen, T.; Xin, Z.; Li, H. Analysis of Flavonoids and Anthocyanin Biosynthesis-Related Genes Expression Reveals the Mechanism of Petal Color Fading of Malus hupehensis (Rosaceae). Braz. J. Bot. 2020, 43, 81–89. [Google Scholar] [CrossRef]
  93. Koobaz, P.; Hosseini, Z.S.; Khatamsaz, M.; Jafarkhani Kermani, M. Taxonomical Study of Section Caninae (Rosa) and Their Hybrids in Iran. Rostaniha 2019, 20, 85–97. [Google Scholar] [CrossRef]
  94. Shameh, S.; Hosseini, B.; Alirezalu, A.; Maleki, R. Phytochemical Composition and Antioxidant Activity of Petals of Six Rosa Species from Iran. J. AOAC Int. 2018, 101, 1788–1793. [Google Scholar] [CrossRef] [PubMed]
  95. De Almeida, L.F.R.; De Portella, R.O.; Bufalo, J.; Marques, M.O.M.; Facanali, R.; Frei, F. Non-Oxygenated Sesquiterpenes in the Essential Oil of Copaifera langsdorffii Desf. Increase during the Day in the Dry Season. PLoS ONE 2016, 11, e0149332. [Google Scholar] [CrossRef]
  96. Hazrati, S.; Beidaghi, P.; Beyraghdar Kashkooli, A.; Hosseini, S.J.; Nicola, S. Effect of Harvesting Time Variations on Essential Oil Yield and Composition of Sage (Salvia officinalis). Horticulturae 2022, 8, 149. [Google Scholar] [CrossRef]
  97. Yan, H.; Zhang, H.; Chen, M.; Jian, H.; Baudino, S.; Caissard, J.C.; Bendahmane, M.; Li, S.; Zhang, T.; Zhou, N.; et al. Transcriptome and Gene Expression Analysis during Flower Blooming in Rosa chinensis ‘Pallida’. Gene 2014, 540, 96–103. [Google Scholar] [CrossRef] [PubMed]
  98. Gargi, A.; Singh, J.; Rasane, P.; Kaur, S.; Kaur, J.; Kumar, M.; Sowdhanya, D.; Gunjal, M.; Choudhary, R.; Ercisli, S. Effect of Drying Methods on the Nutritional and Phytochemical Properties of Pumpkin Flower (Cucurbita maxima) and Its Characterization. J. Food Meas. Charact. 2023, 17, 5330–5343. [Google Scholar] [CrossRef]
  99. Sivaraj, C.; Abhirami, R.; Deepika, M.; Sowmiya, V.; Saraswathi, K.; Arumugam, P. Antioxidant, Antibacterial Activities and GC-MS Analysis of Fresh Rose Petals Aqueous Extract of Rosa damascena Mill L. J. Drug Deliv. Ther. 2019, 9, 68–77. [Google Scholar] [CrossRef]
  100. Maciąg, A.; Kalemba, D. Composition of Rugosa Rose (Rosa rugosa Thunb.) Hydrolate According to the Time of Distillation. Phytochem. Lett. 2015, 11, 373–377. [Google Scholar] [CrossRef]
  101. Mohamadi, M.; Mostafavi, A.; Shamspur, T. Effect of Storage on Essential Oil Content and Composition of Rosa damascena Mill. Petals under Different Conditions. J. Essent. Oil Bear. Plants 2013, 14, 430–441. [Google Scholar] [CrossRef]
  102. Naquvi, K.J.; Ansari, S.H.; Ali, M.; Najmi, A.K.; Kamran, C.; Naquvi, J. Volatile Oil Composition of Rosa damascena Mill. (Rosaceae). J. Pharmacogn. Phytochem. 2014, 2, 177–181. [Google Scholar]
  103. Kanehisa, M. Subramaniam The KEGG Database. Novartis Found. Symp. 2002, 247, 91–103. [Google Scholar] [CrossRef]
  104. Caspi, R.; Billington, R.; Fulcher, C.A.; Keseler, I.M.; Kothari, A.; Krummenacker, M.; Latendresse, M.; Midford, P.E.; Ong, Q.; Ong, W.K.; et al. The MetaCyc Database of Metabolic Pathways and Enzymes. Nucleic Acids Res. 2018, 46, D633–D639. [Google Scholar] [CrossRef]
  105. Caspi, R.; Billington, R.; Keseler, I.; Kothari, A.; Krummenacker, M.; Midford, P.; Ong, W.K.; Paley, S.; Subhraveti, P.; Karp, P. MetaCyc: A Database of Enzymes and Pathways with a Broad Coverage of Natural Products Biosynthesis. In Proceedings of the 3rd International Conference on Natural Products Discovery and Development in the Genomic Era. SIMB, San Diego, CA, USA, 12–16 January 2020. [Google Scholar]
  106. Kanehisa, M.; Sato, Y.; Furumichi, M.; Morishima, K.; Tanabe, M. New Approach for Understanding Genome Variations in KEGG. Nucleic Acids Res. 2019, 47, D590–D595. [Google Scholar] [CrossRef]
  107. Gao, M.R.; Xu, Q.D.; He, Q.; Sun, Q.; Zeng, W.C. A Theoretical and Experimental Study: The Influence of Different Standards on the Determination of Total Phenol Content in the Folin–Ciocalteu Assay. J. Food Meas. Charact. 2019, 13, 1349–1356. [Google Scholar] [CrossRef]
  108. McDonald, S.; Prenzler, P.D.; Antolovich, M.; Robards, K. Phenolic Content and Antioxidant Activity of Olive Extracts. Food Chem. 2001, 73, 73–84. [Google Scholar] [CrossRef]
  109. Popova, M.; Bankova, V.; Butovska, D.; Petkov, V.; Nikolova-Damyanova, B.; Sabatini, A.G.; Marcazzan, G.L.; Bogdanov, S. Validated Methods for the Quantification of Biologically Active Constituents of Poplar-Type Propolis. Phytochem. Anal. 2004, 15, 235–240. [Google Scholar] [CrossRef] [PubMed]
  110. Hassan, A.; Al-Salman, F.; Ali Redha, A.; Salem, M.; Saeed, Z. Phytochemical investigations of 10 edible plants and their antioxidant and antidiabetic activity. Int. J. Res. Pharm. Chem. 2020, 10, 260–272. [Google Scholar] [CrossRef] [PubMed]
  111. Mori, T.; Sakurai, M.; Shigeta, J.-I.; Yoshida, K.; Kondo, T. Formation of Anthocyanins from Cells Cultured from Different Parts of Strawberry Plants. J. Food Sci. 1993, 58, 788–792. [Google Scholar] [CrossRef]
  112. Sarikurkcu, C.; Ozer, M.S.; Tlili, N. Comparison of the Influence of the Solvent on the Extraction of the Bioactive Compounds from Marrubium Lutescens Using Liquid Chromatography–Electrospray Ionization Tandem Mass Spectrometry (LC-ESI-MS/MS). Anal. Lett. 2020, 53, 2222–2234. [Google Scholar] [CrossRef]
  113. Tlili, N.; Sarikurkcu, R.T.; Ozer, M.S.; Sarikurkcu, C. Liquid Chromatography–Electrospray Ionization Tandem Mass Spectrometry (LC-ESI-MS/MS) Identification of Phytochemicals and the Effects of Solvents on Phenolic Constituents, Antioxidant Capacity, Skin-Whitening and Anti-Diabetic Activity of Onosma Mitis. Anal. Lett. 2022, 55, 32–46. [Google Scholar] [CrossRef]
  114. Morante-Carriel, J.; Sellés-Marchart, S.; Martínez-Márquez, A.; Martínez-Esteso, M.J.; Luque, I.; Bru-Martínez, R. RNA Isolation from Loquat and Other Recalcitrant Woody Plants with High Quality and Yield. Anal. Biochem. 2014, 452, 46–53. [Google Scholar] [CrossRef]
  115. Zarei, A.; Zamani, Z.; Mousavi, A.; Fatahi, R.; Karimi Alavijeh, M.; Dehsara, B.; Alireza Salami, S. An Effective Protocol for Isolation of High-Quality RNA from Pomegranate Seeds. Asian Australas. J. Plant Sci. Biotechnol. 2012, 6, 32–37. [Google Scholar]
  116. Aranda, P.S.; Lajoie, D.M.; Jorcyk, C.L. Bleach Gel: A Simple Agarose Gel for Analyzing RNA Quality. Electrophoresis 2012, 33, 366–369. [Google Scholar] [CrossRef]
  117. Fleige, S.; Pfaffl, M.W. RNA Integrity and the Effect on the Real-Time QRT-PCR Performance. Mol. Asp. Med. 2006, 27, 126–139. [Google Scholar] [CrossRef] [PubMed]
  118. Koressaar, T.; Remm, M. Enhancements and Modifications of Primer Design Program Primer3. Bioinformatics 2007, 23, 1289–1291. [Google Scholar] [CrossRef] [PubMed]
  119. Jozefczuk, J.; Adjaye, J. Quantitative Real-Time PCR-Based Analysis of Gene Expression. Methods Enzym. 2011, 500, 99–109. [Google Scholar] [CrossRef]
  120. Salehi, M.; Karimzadeh, G.; Naghavi, M.R.; Naghdi Badi, H.; Rashidi Monfared, S. Expression of Artemisinin Biosynthesis and Trichome Formation Genes in Five Artemisia Species. Ind. Crops Prod. 2018, 112, 130–140. [Google Scholar] [CrossRef]
  121. Livak, K.J.; Schmittgen, T.D. Analysis of Relative Gene Expression Data Using Real-Time Quantitative PCR and the 2−ΔΔCT Method. Methods 2001, 25, 402–408. [Google Scholar] [CrossRef]
  122. Balasubramaniyan, R.; Hüllermeier, E.; Weskamp, N.; Kämper, J. Clustering of Gene Expression Data Using a Local Shape-Based Similarity Measure. Bioinformatics 2005, 21, 1069–1077. [Google Scholar] [CrossRef]
  123. Jiang, D.; Tang, C.; Zhang, A. Cluster Analysis for Gene Expression Data: A Survey. IEEE Trans. Knowl. Data Eng. 2004, 16, 1370–1386. [Google Scholar] [CrossRef]
Figure 1. Total Ion Chromatogram (TIC) of white and dark pink R. canina L. petals.
Molecules 29 03145 g001aMolecules 29 03145 g001b
Figure 2. Percentage of chemical compositions of essential oils in white (a) and dark pink (b) petals.
Molecules 29 03145 g002aMolecules 29 03145 g002b
Figure 3. The amount of total flavonoid content (TFC) and total phenol content (TPC) in white and pink flowers, compared by Duncan’s multiple range test. Different letters (a and b) indicate significant differences at p < 0.05.
Molecules 29 03145 g003
Figure 4. Total Ion Chromatograms of R. canina petals in positive and negative modes. The figure shows the chromatograms of white (a,c) and dark pink (b,d) petals in positive (a,b) and negative (c,d) modes, respectively. The peaks correspond to the compounds detected in the petals. The compounds are as follows: 1: Quercetin-3-O-rutinoside-7-O-glucoside, 2: Dihydroxy-dimethoxy flavone, 3: Gallic acid, 4: Cyanidin, 5: Quercetin-3-O-hexoside, 6: Kaempferol-3-O-rutinoside, 7: Kaempferol 3-O-(6″-malonyl-glucoside), 8: Tetra-O-galloyl-hexoside, 9: Myricetin, 10: Ellagic acid, and 11: Kaempferol-3-O-glucoside.
Molecules 29 03145 g004
Figure 5. Relative expression of main genes which are involved in flower color and scent biosynthesis in rose flower. Different flower developmental stages including budding stage (S1) and open-flower stage (S2) was selected for this assay. The fold change expression was calculated after normalization to the beta-actin gene. The open-flower stage (S2) was selected as a reference for white and dark pink petals. Standard errors are indicated by vertical bars. The values of error bars are revealed mean ± SE, n = 3. Different letters (a and b) indicate significant differences at p < 0.05 between S1 and S2 for each petal color, as determined by one-way ANOVA and Duncan’s test.
Molecules 29 03145 g005aMolecules 29 03145 g005b
Figure 6. Heatmap and cluster analysis of gene expression in flower development stages.
Molecules 29 03145 g006
Figure 7. Different developmental stages of dark pink and white R. canina flowers. Budding stage (S1) (a,c); open-flower stage (S2) (b,d).
Molecules 29 03145 g007aMolecules 29 03145 g007b
Figure 8. Schematic representation of the MEP pathway for terpenoids biosynthesis in roses. G3P, glyceraldehyde-3-phosphate; DXS, 1-deoxy-d-xylulose-5-phosphate synthase; DXR, 1-Deoxy-D-xylulose 5-phosphate reductoisomerase; LIS, linalool synthase; AAT1, aromatic amino acid aminotransferase; CCD1, carotenoid cleavage dioxygenase 1.
Molecules 29 03145 g008
Figure 9. Schematic illustration of phenylpropanoids/benzenoids biosynthesis in rose flowers. PAL-phenylalanine ammonia lyase; PAR-phenyl acetaldehyde reductase; AAT-alcohol acetyltransferase.
Molecules 29 03145 g009
Table 1. Percentage composition of the essential oils isolated from white R. canina petals.
No.Compound NameRIPercentage Peak Area
1Nonanal11160.21
2Linalool11180.31
3Linalool acetate12681.06
4Geranial12790.82
5Undecanal13130.14
6Citronellyl acetate13520.24
7Tetradecane13970.21
8Dauca-5,8-diene14720.91
9γ-Himachalene14800.25
102-Tridecanone14970.3
11Isodaucene15040.41
12Tridecanal15150.83
13Dodecanoic acid15881.03
14Hexadecane15960.73
15Heptadecane16960.48
16Pentadecanal17180.41
17Benzyl benzoate17892.03
18Octadecane18000.54
19Nonadecane19033.49
20Eicosane20038.16
21Hexadecenoic acid20092.77
22Octadecanal20290.48
23Heneicosane211413.84
24Linoleic acid21660.73
254 Docosane22031.69
26Eicosanal22341.26
27Triacosane231719.74
28Tetracosane23961.61
291-Docosanol24320.32
30Pentacosane249622.34
31Dioctyl phthalate253212.49
32Hexacosane2595 0.17
Table 2. Percentage composition of the essential oils isolated from pink R. canina petals.
No.Compound NameRIPercentage Peak Area
1Benzyl benzoate17870.04
2Octadecane17970.02
3Nonadecane18970.09
4Hexadecenoic acid19820.13
5Eicosane19970.06
6Heneicosane21011.11
7Octadecanoic acid21851.12
8Docosane222392.63
9Tricosane22991.2
10Tetracosane23960.08
11Docosanal24320.11
12Data MS24720.43
13Pentacosane24962
14Diisooctyl phthalate25320.88
15Hexacosane25950.1
Table 3. Flavonoid and anthocyanin profiles of white and dark pink R. canina determined by LC-MS.
PeakRt (min)MWIon ModeCompoundsChemical FormulaPeak Intensity in White FlowerPeak Intensity in Dark Pink FlowerMaximum AbsorbanceMass Fragments
[M + H]+[M − H]
12.43772773-Quercetin-3-O-rutinoside-7-O-glucosideC33H40O212.18 × 1054.26 × 1043.23 × 105343, 344, 361, 366, 193, 194
22.49533534-Pelargonidin 3-O-(6″-succinyl glucoside)C25H25O131.15 × 1053.10 × 1051.34 × 105136, 343, 193
32.52290291-EpicatechinC15H14O66.26 × 1059.81 × 1054.16 × 107136, 193, 209
42.67534-533Kaempferol 3-O-(6″-malonyl- glucoside)C24H22O141.86 × 1061.27 × 1067.95 × 105180, 192, 226, 372
52.81314315-Dihydroxy-dimethoxy flavoneC17H14O64.84 × 1053.50 × 1051.43 × 105104, 116, 118, 183, 187
62.85270271269ApigeninC15H10O54.41 × 1075.71 × 1074.03 × 105104, 116, 118
73.04566-565Quercetin-3-O-dipentosideC25H26O158.90 × 1046.62 × 1049.69 × 104133
83.05298299-Apigenin-7,4′-dimethyl etherC17H14O51.12 × 1067.26 × 1051.26 × 106174, 183, 329
93.9170-169Gallic acidC7H6O58.57 × 10661.90 × 1071.19 × 107169, 171
104.06788-787Tetra-O-galloyl-hexoside 1.14 × 1063.12 × 1061.54 × 106169, 392, 393, 477, 786, 787
114.23470-469Valoneic acid dilactoneC21H10O131.03 × 107 1.61 × 1067.47 × 105316, 317, 610, 611, 470, 484
124.64318-317MyricetinC15H10O88.33 × 105 9.23 × 1061.08 × 106316, 484, 485
134.70434435-Delphinidin-O-pentosideC29H33O181.65 × 106 2.39 × 1061.92 × 106612, 613, 435, 450, 288,
144.85610-609RutinC27H30O167.76 × 1061.15 × 1068.30 × 106609, 610, 612
154.89448449-Kaempferol-3-O glucosideC21H20O2.36 × 1061.96 × 1062.64 × 106612, 613, 392, 288, 289, 449,135, 245, 183
164.89448449-Cyanidin-O-hexosideC21H21ClO112.36 × 1061.96 × 1062.64 × 106
174.89448449-QuercitrinC21H20O112.36 × 1061.96 × 106
185.89302303-DelphinidinC15H11O71.97 × 1071.38 × 1072.23 × 107303, 286, 142, 205, 164
195.92286287-CyanidinC15H11O61.15 × 1061.06 × 1061.37 × 106303, 286, 304, 205, 164
206.21302-301Ellagic acidC14H6O87.04 × 1052.87 × 1067.68 × 105301, 302, 603, 604
217.17302-301QuercetinC15H10O71.60 × 1064.32 × 1057.68 × 105
227.68600-599Flavonol diglycoside 1.26 × 1071.14 × 1071.63 × 106599, 600, 601
237.74464465-Quercetin-3-O-hexosideC21H20O121.32 × 1061.76 × 1061.54 × 106288, 289, 450, 464, 465, 288, 289
247.94448-447Kaempferol-3-O-glucosideC21H20O113.73 × 1065.04 × 1064.20 × 106447, 448
258.87418-417Kaempferol-3-O-pentoside-1.20 × 1061.37 × 1062.68 × 105416, 417, 625, 626
269.90594-593Kaempferol-3-O-rutinosideC27H30O158.47 × 1052.60 × 1063.83 × 105449, 450, 593, 594, 595, 596
279.90594-593Kaempferol-3,7-hexose-rhamnoside-8.47 × 1052.60 × 1063.83 × 105
2811.85286-285KaempferolC15H10O61.14 × 1063.49 × 1051.61 × 105190, 192, 372
2912.41290-289CatchinC15H14O62.44 × 1067.35 × 1063.98 × 105288, 289
3014.82592593-Cyanidin 3-O-(6″-dioxalyl-glucoside)C25H20O178.26 × 1057.06 × 1041.12 × 105225, 236, 237, 360, 519, 521
3114.91432433-Cyanidin-O-deoxyhexoside-1.16 × 1054.29 × 1051.63 × 105236, 237, 330, 446
3214.91432433-Apigenin-5-O-glucosideC21H20O101.16 × 1054.29 × 1051.63 × 105236, 237, 330, 446
3315.06616617-Cyanidin 3-O-sambubiosideC26H29ClO156.10 × 1053.66 × 1052.79 × 105236, 618, 330, 360
3415.31610611-Cyanidin 3,5-O-diglucosideC27H31O16Cl2.52 × 1052.25 × 1051.24 × 105142, 183, 225, 230, 236
Table 4. Primer sequences used in qRT-PCR for gene expression analysis.
Target GeneGene Bank Accession NumberPrimer Sequences (Sequence in 5′-3′ Direction)
PALMG922976.1F: GAGTACAGGAAGCCAGTGGT
R: CCATAGCTGTCCGTACCCTT
FLSAB038247.1F: AAGGGTGGGTGGATCATCTG
R: CATCACCACCAACTGCCTTC
CER1XM_024319816.2F: GGGAGATGGGTTGGTCATGA
R: CGATCAACAGAGTTGCCACC
AAT1MG820126.1F: GCCCTCACTGGTTTTCTCTG
R: GCTCCCTGGTGCTGTATCAT
MYB1EU082130.1F: CTATGTCAAGACTCGCACGC
R: CAACGAGTGCAGGTGAGATG
GGPPSKX661005.1F: CACAAAACTGCGGCTCTTCT
R: AGTCCTTCCCAGCAGTCTTC
PARAB426519F: ACAGACCCAAAGGCAGAAC
R: TCATCAACCACTACATCAGGAG
ANSBI977949F: GCTCGTCAACAAGGAGAAGG
R: GGTAGAGG CGAGAGCTTCCT
CCD1EU327776.1F: CGAAAATTGAGGTTGGAGGA
R: GCATGGAA CCCATATGGAAC
DXRJX518618.1F: GTGACCTCACCTTCCCTC
R: CTACGCCACATCTACCAG
GPSDQ286930F: TGGCAACTGTTGTGGAACAT
R: AGCACGAGACTTCAGCACT
LIS1AGB14629F: ATGGCTGAGTGTGAGTGTGA
R: AGCTTTTGTTTATGGCCGGC
DXSACD70396F: GGGTTACCTTGATTCCGACA
R: CAACTTTTGCTGCCAGTTCA
beta-actinRXHM01003052.1F: GGGGAAAATATGGCATCACACG
R: GATTGCGACATACATTGCTGGG
Disclaimer/Publisher’s Note: The statements, opinions and data contained in all publications are solely those of the individual author(s) and contributor(s) and not of MDPI and/or the editor(s). MDPI and/or the editor(s) disclaim responsibility for any injury to people or property resulting from any ideas, methods, instructions or products referred to in the content.

