
New Series of Hydrogen-Bonded Liquid Crystal with High Birefringence and Conductivity
 , , and
Abstract
:1. Introduction
2. Results
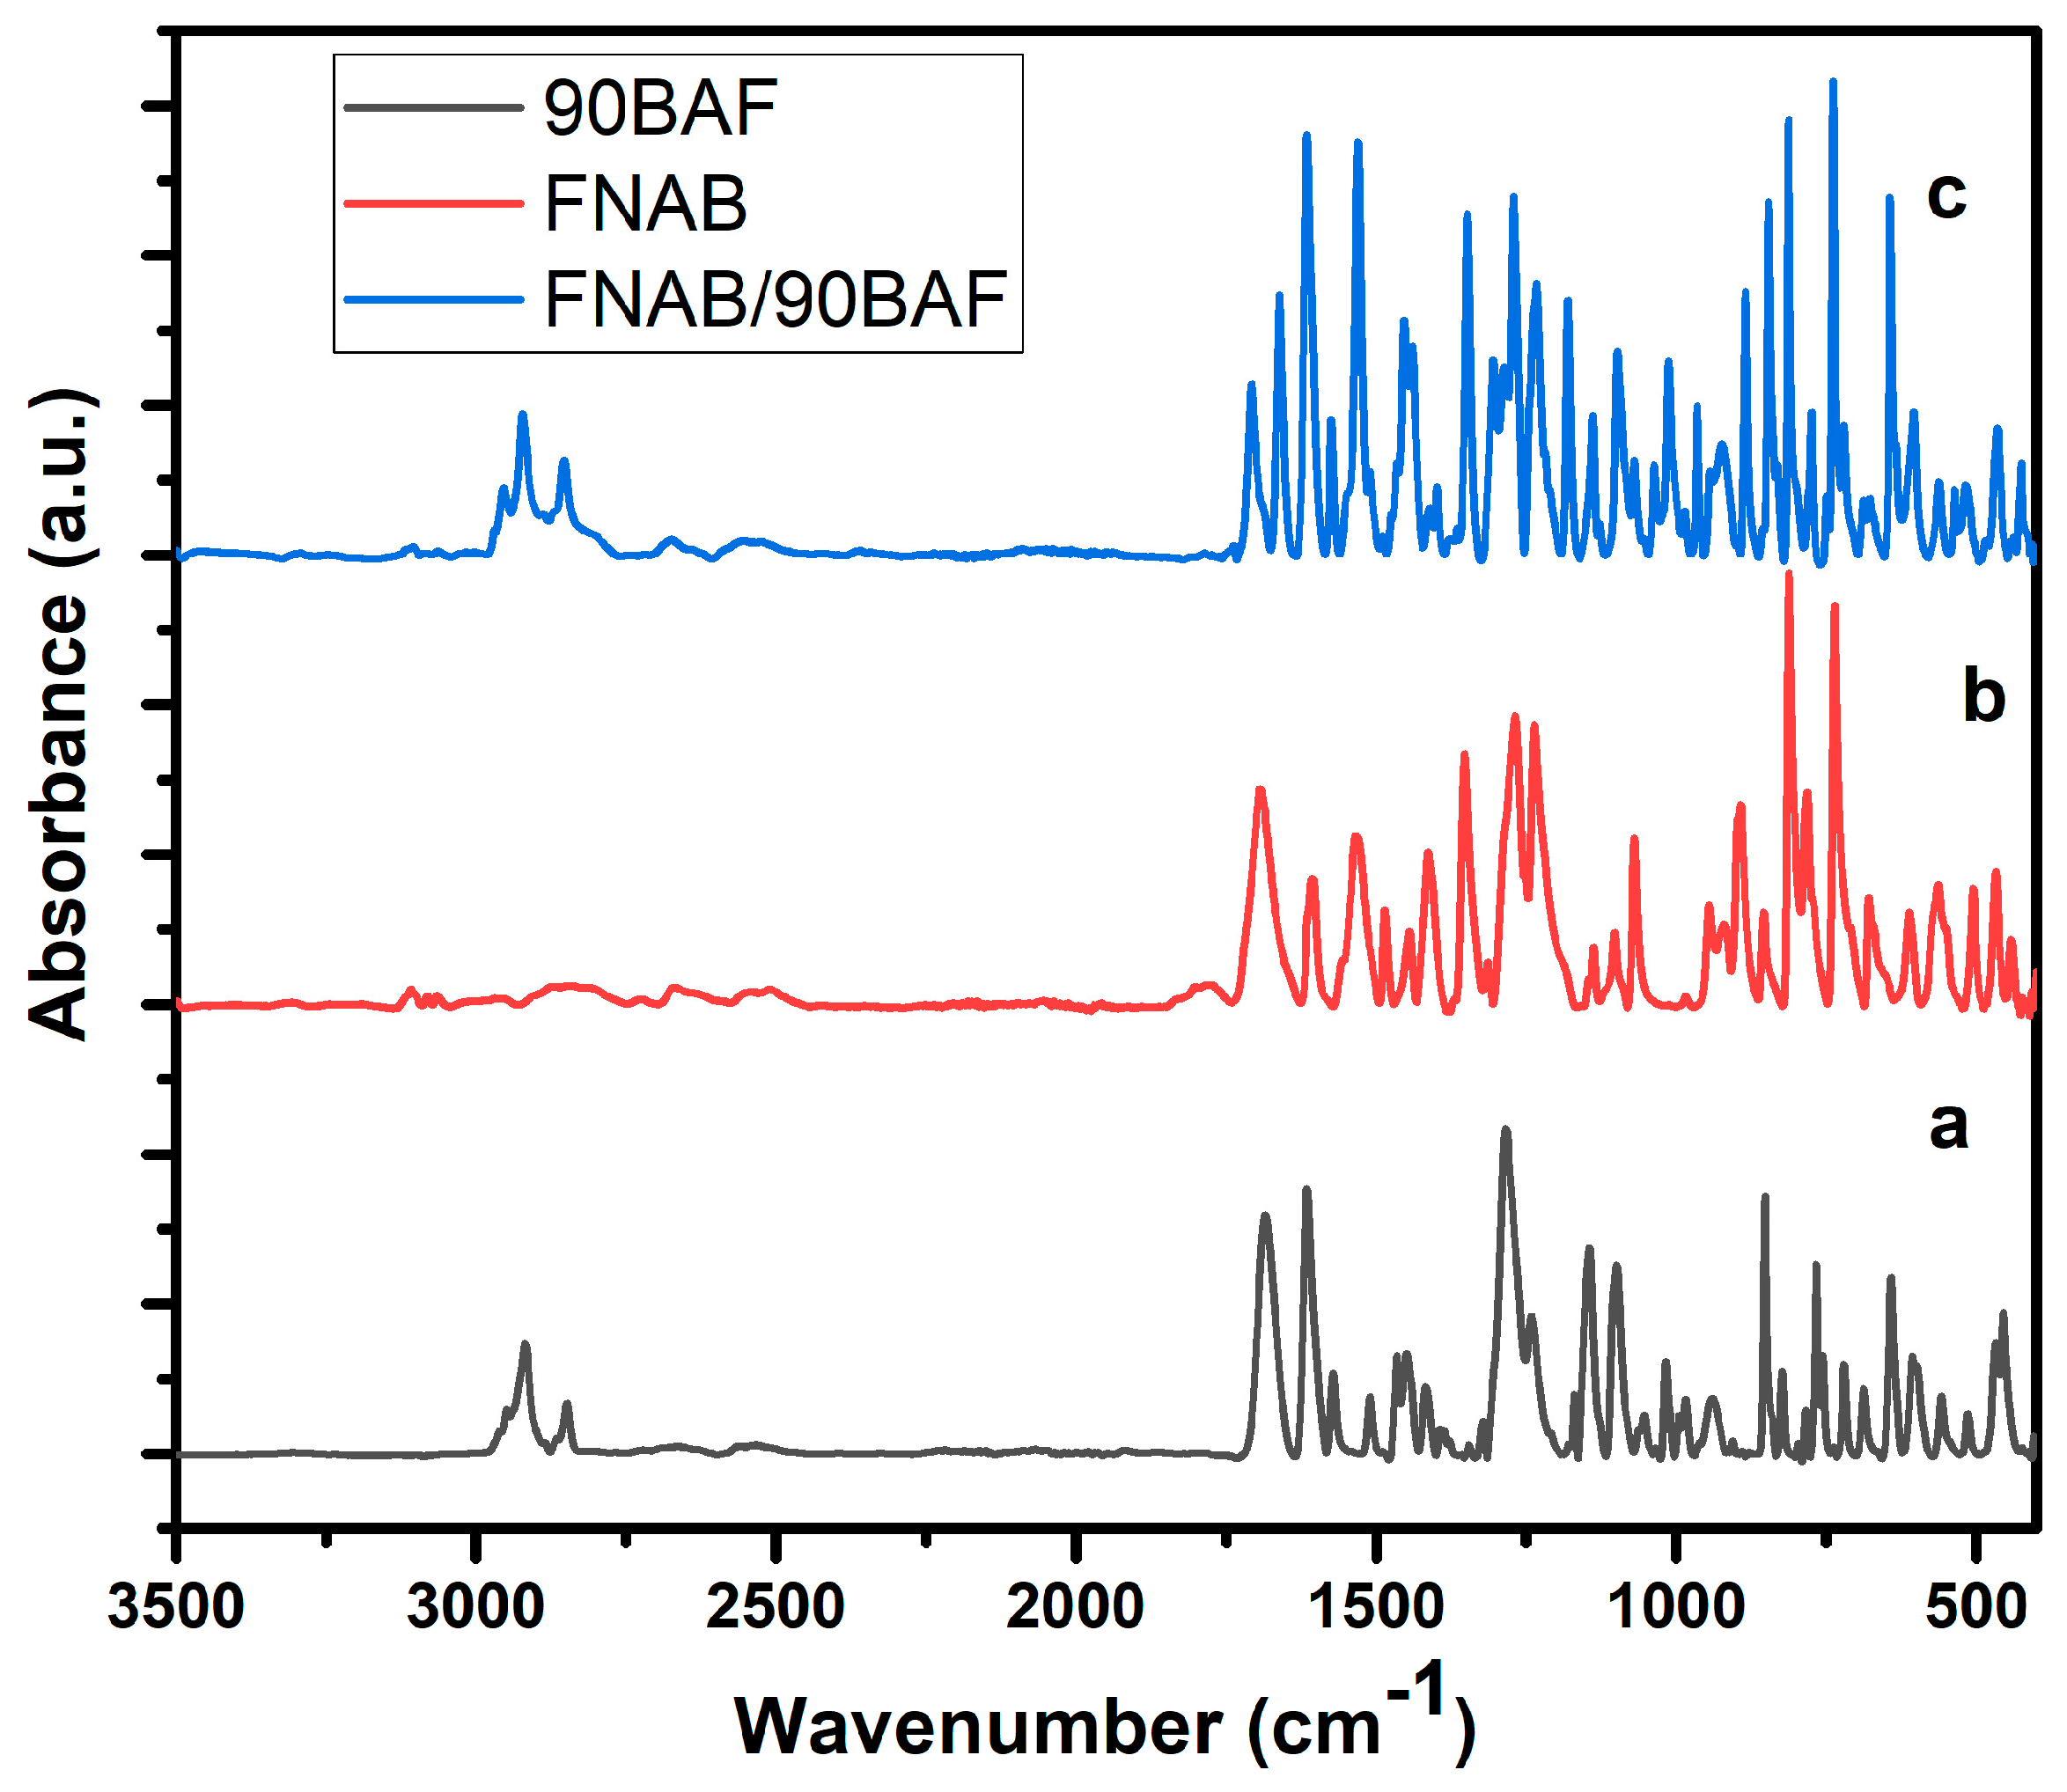
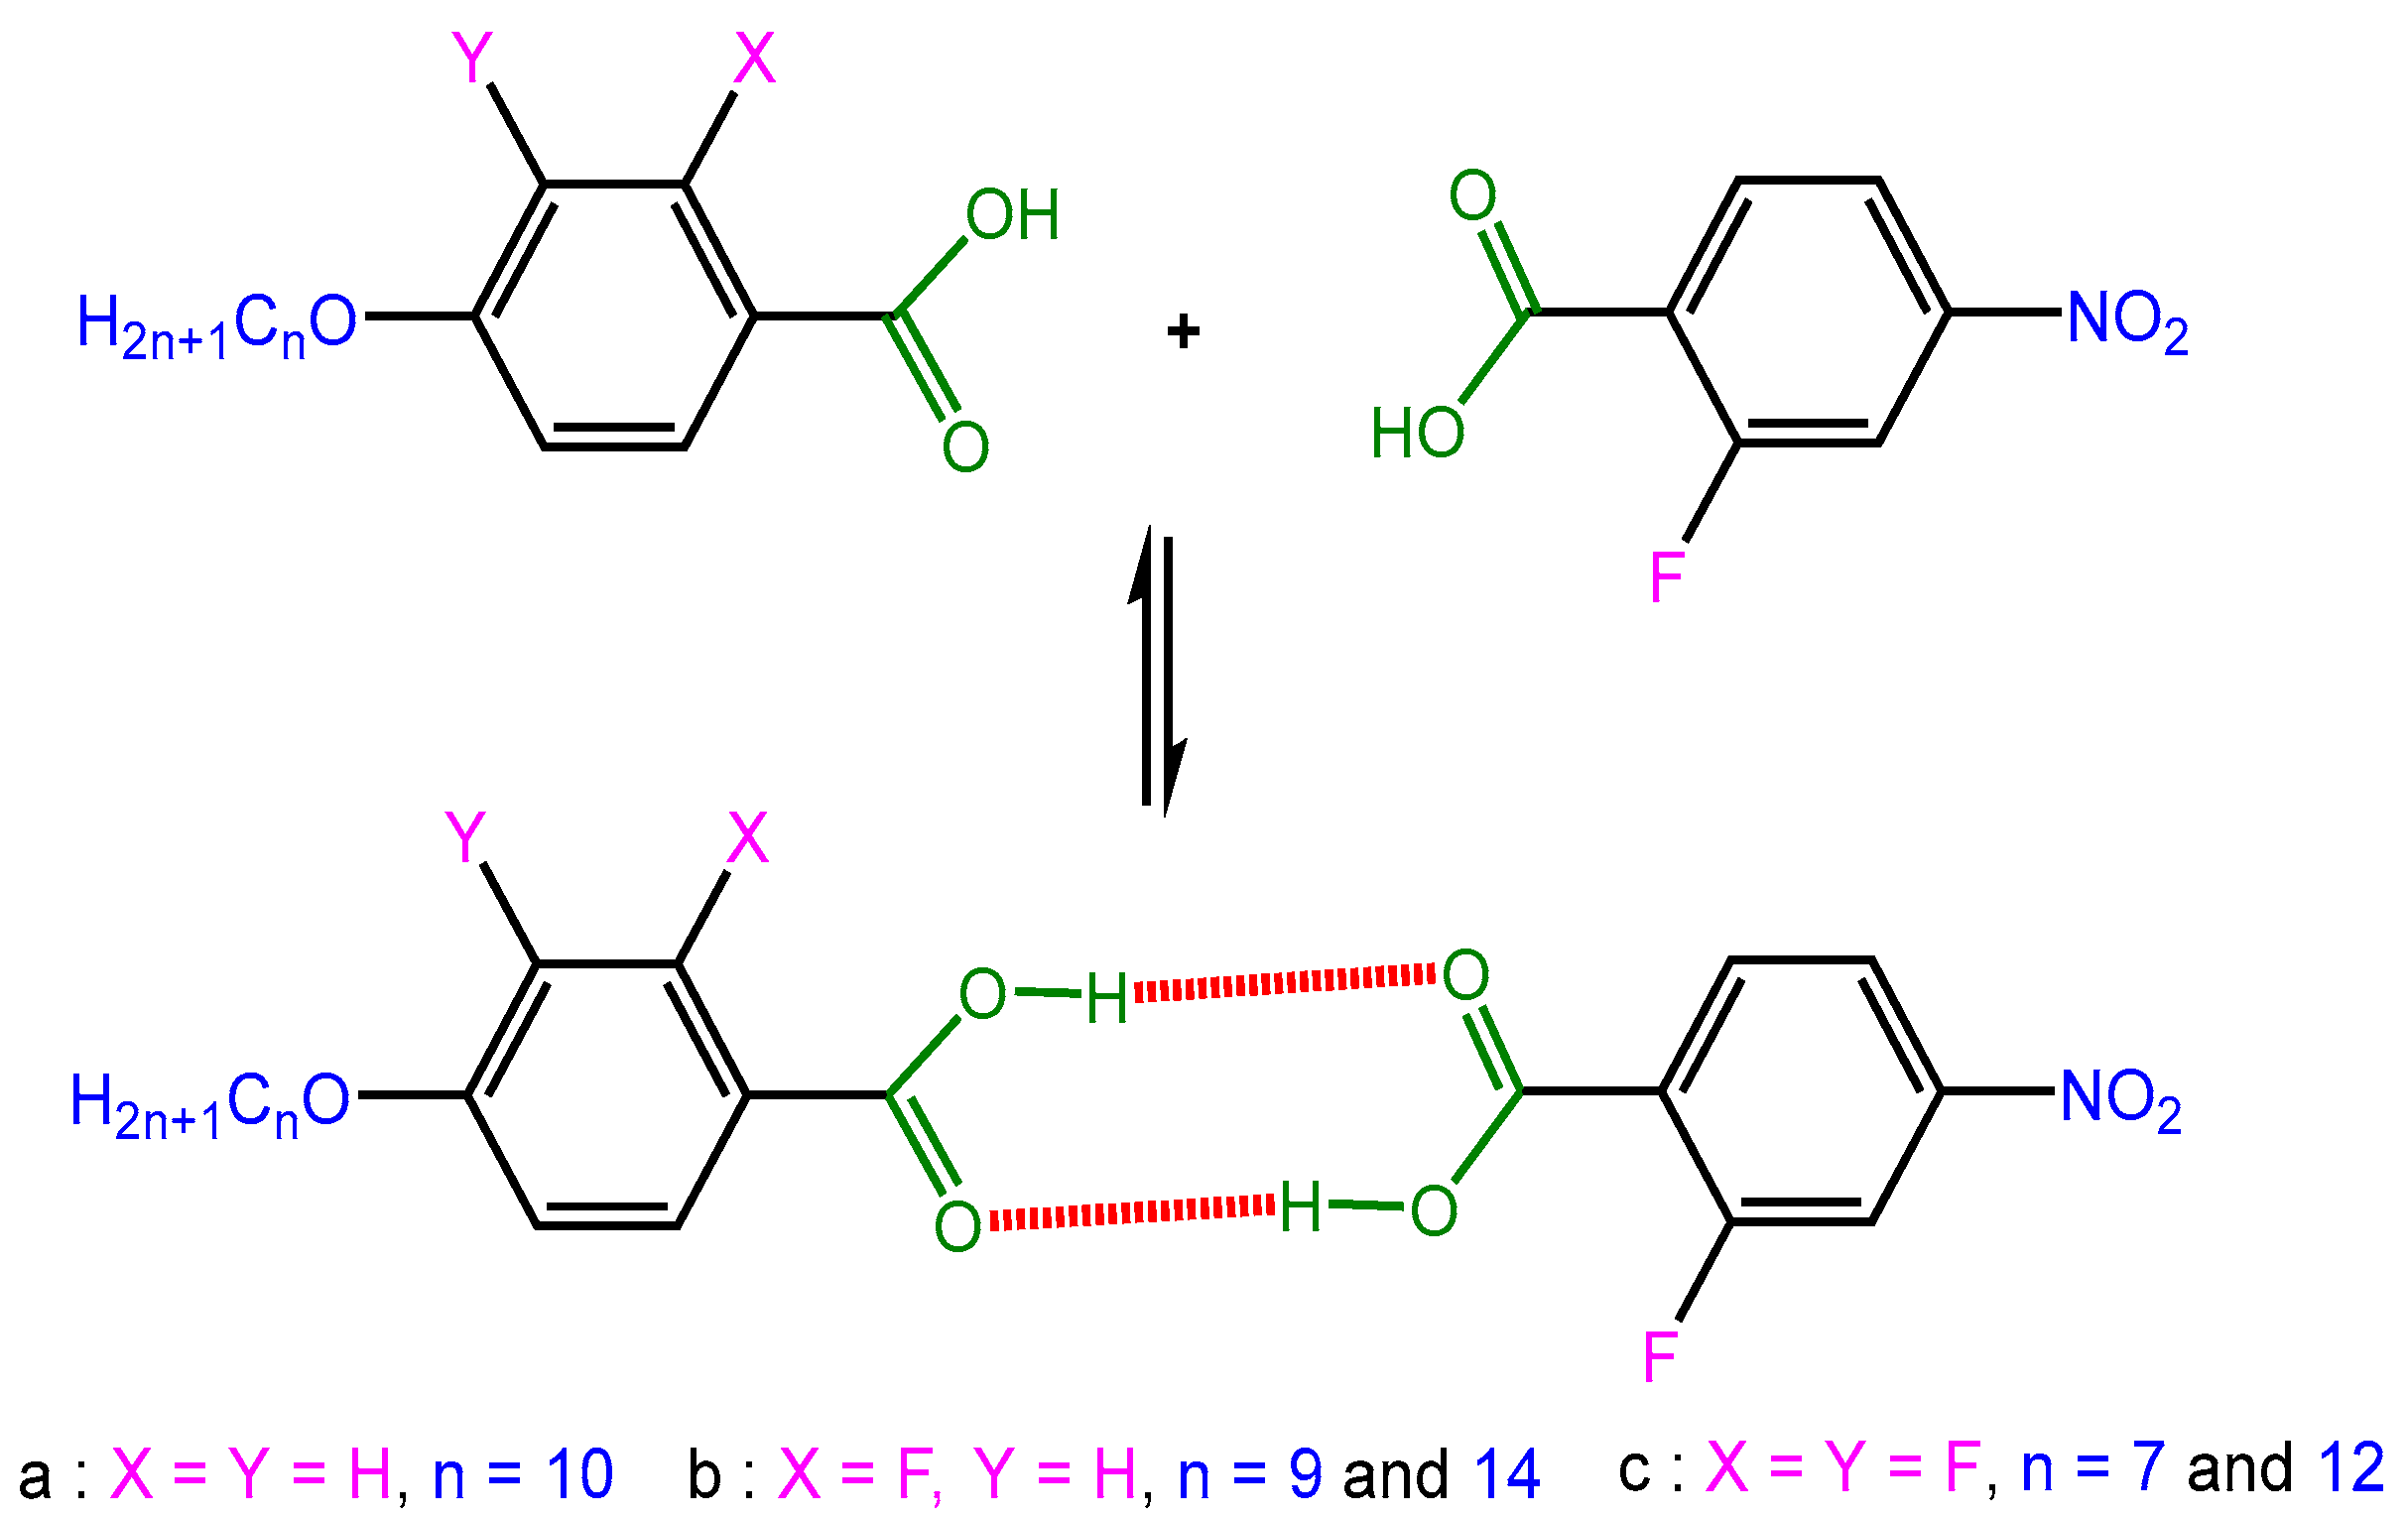
2.1. FTIR Analysis
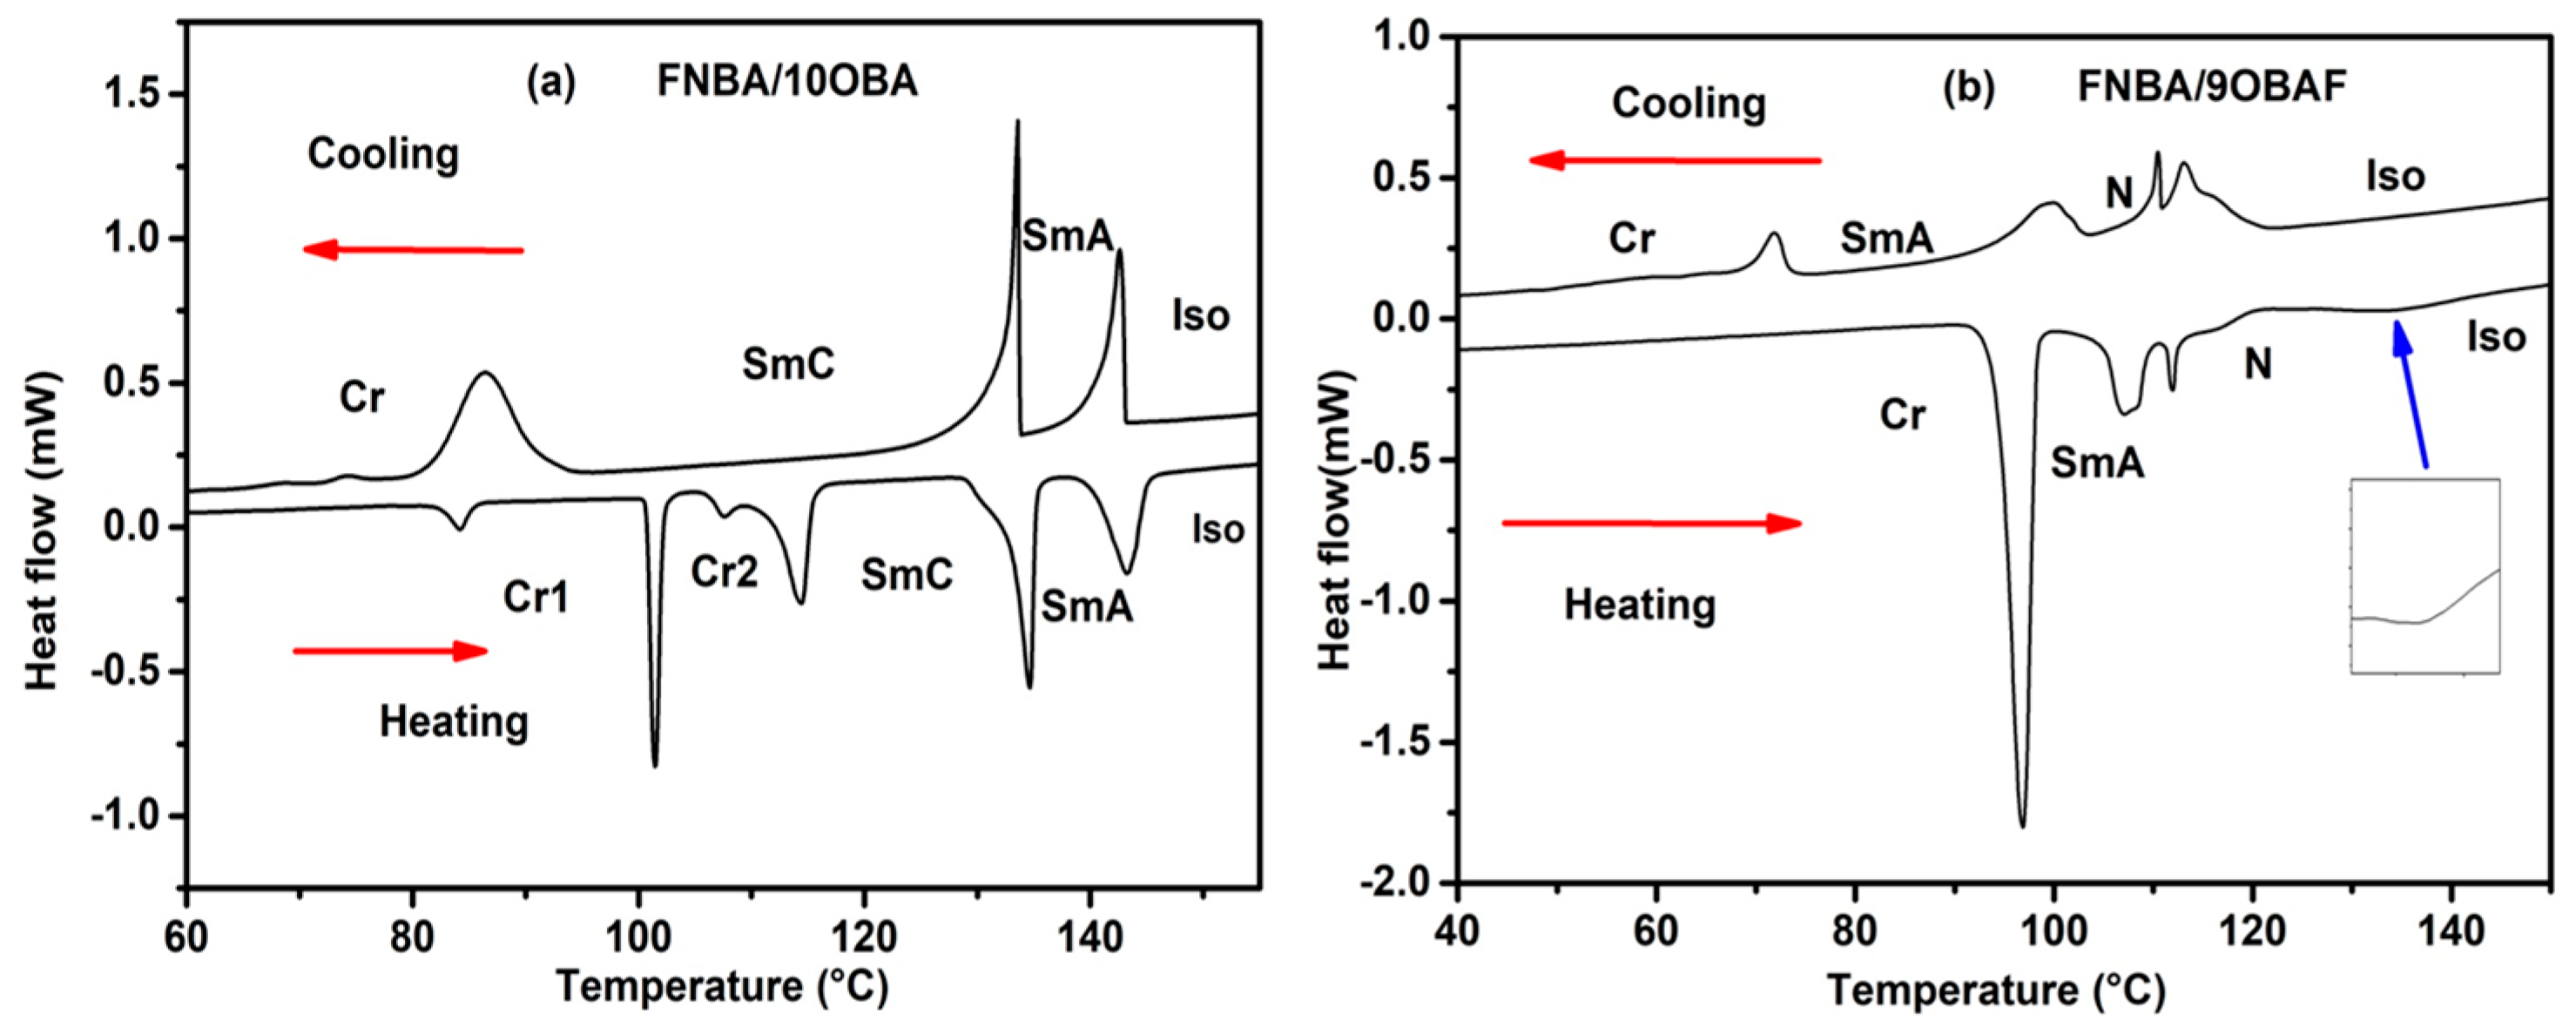
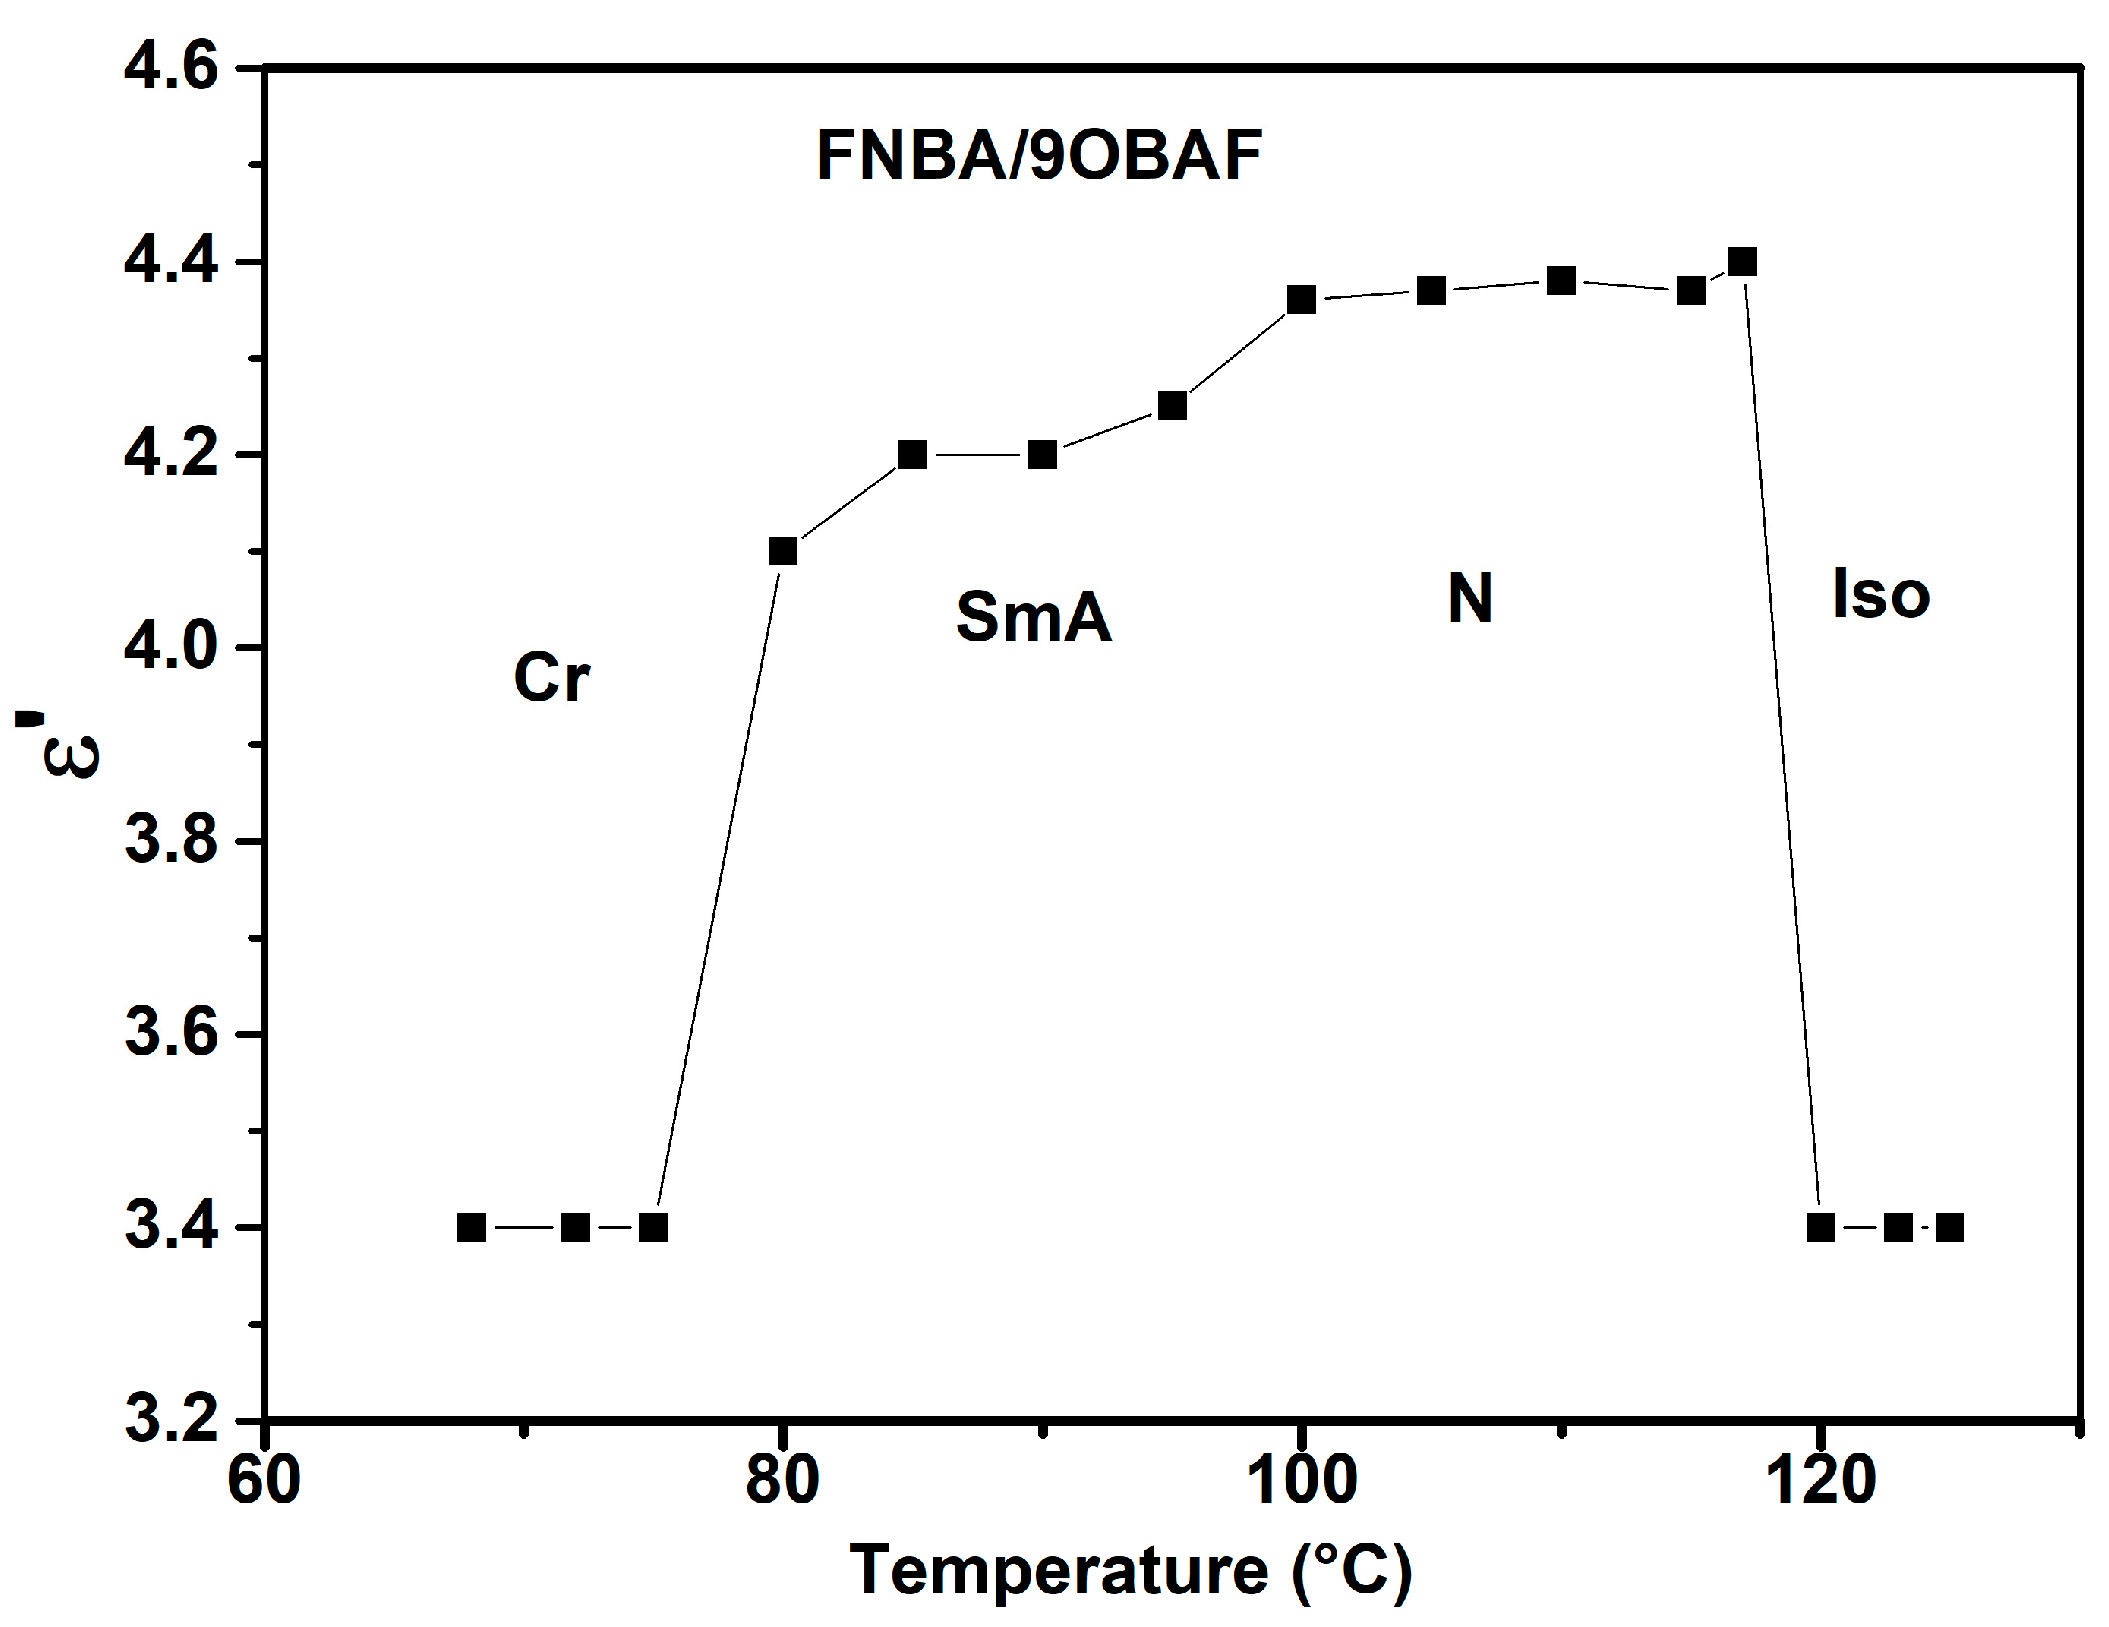
2.2. Phase Behavior
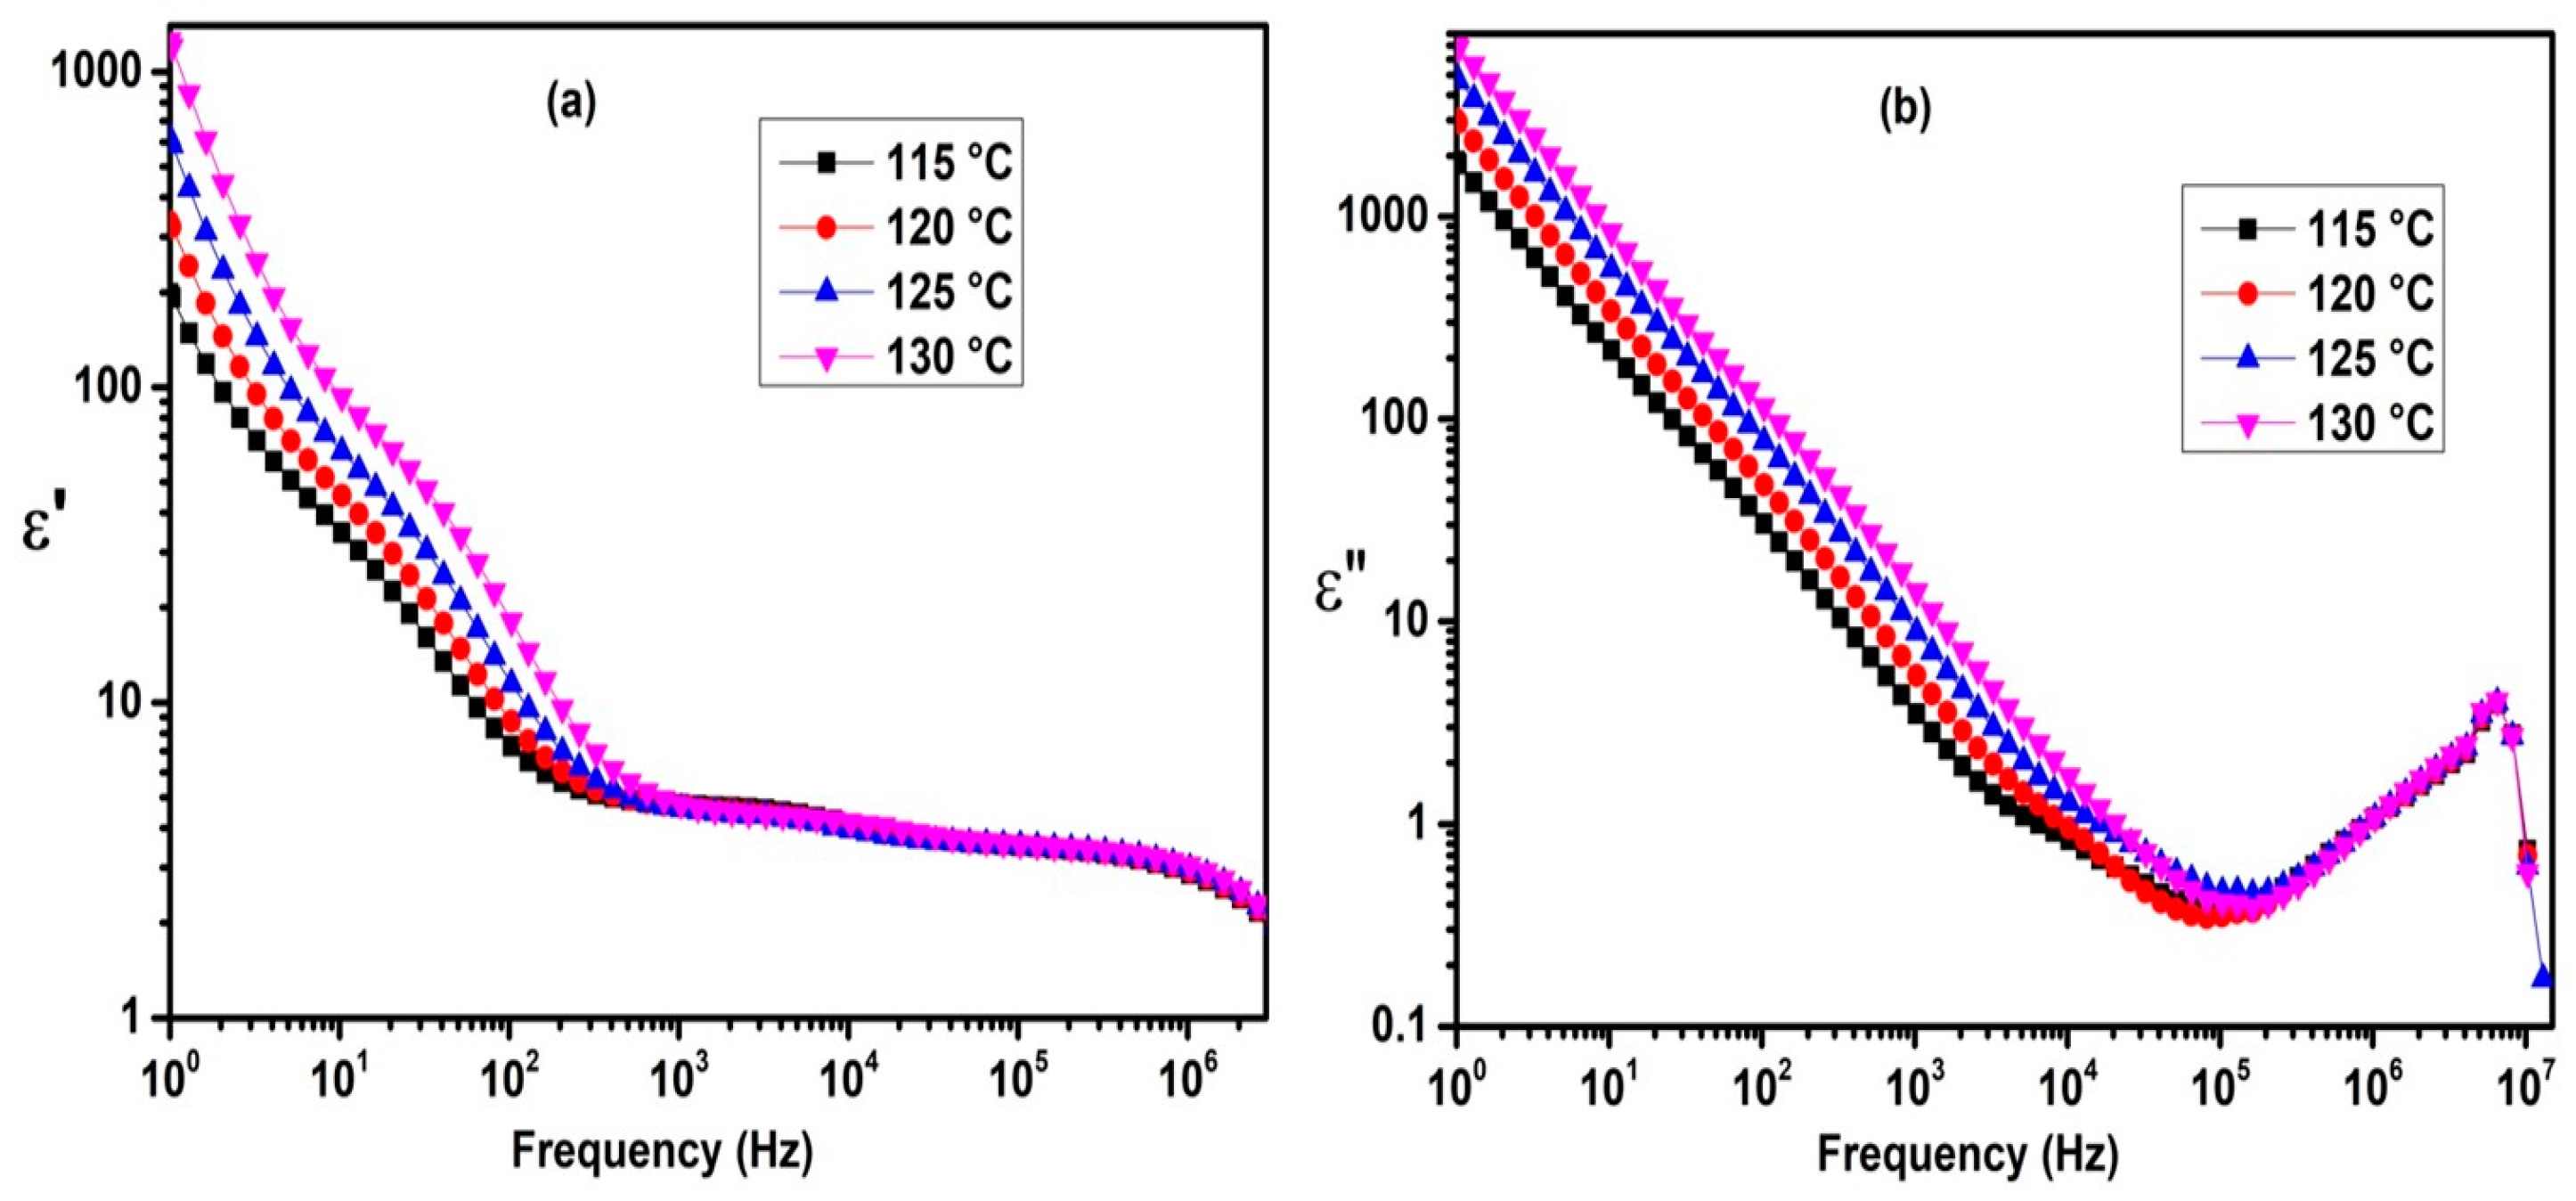
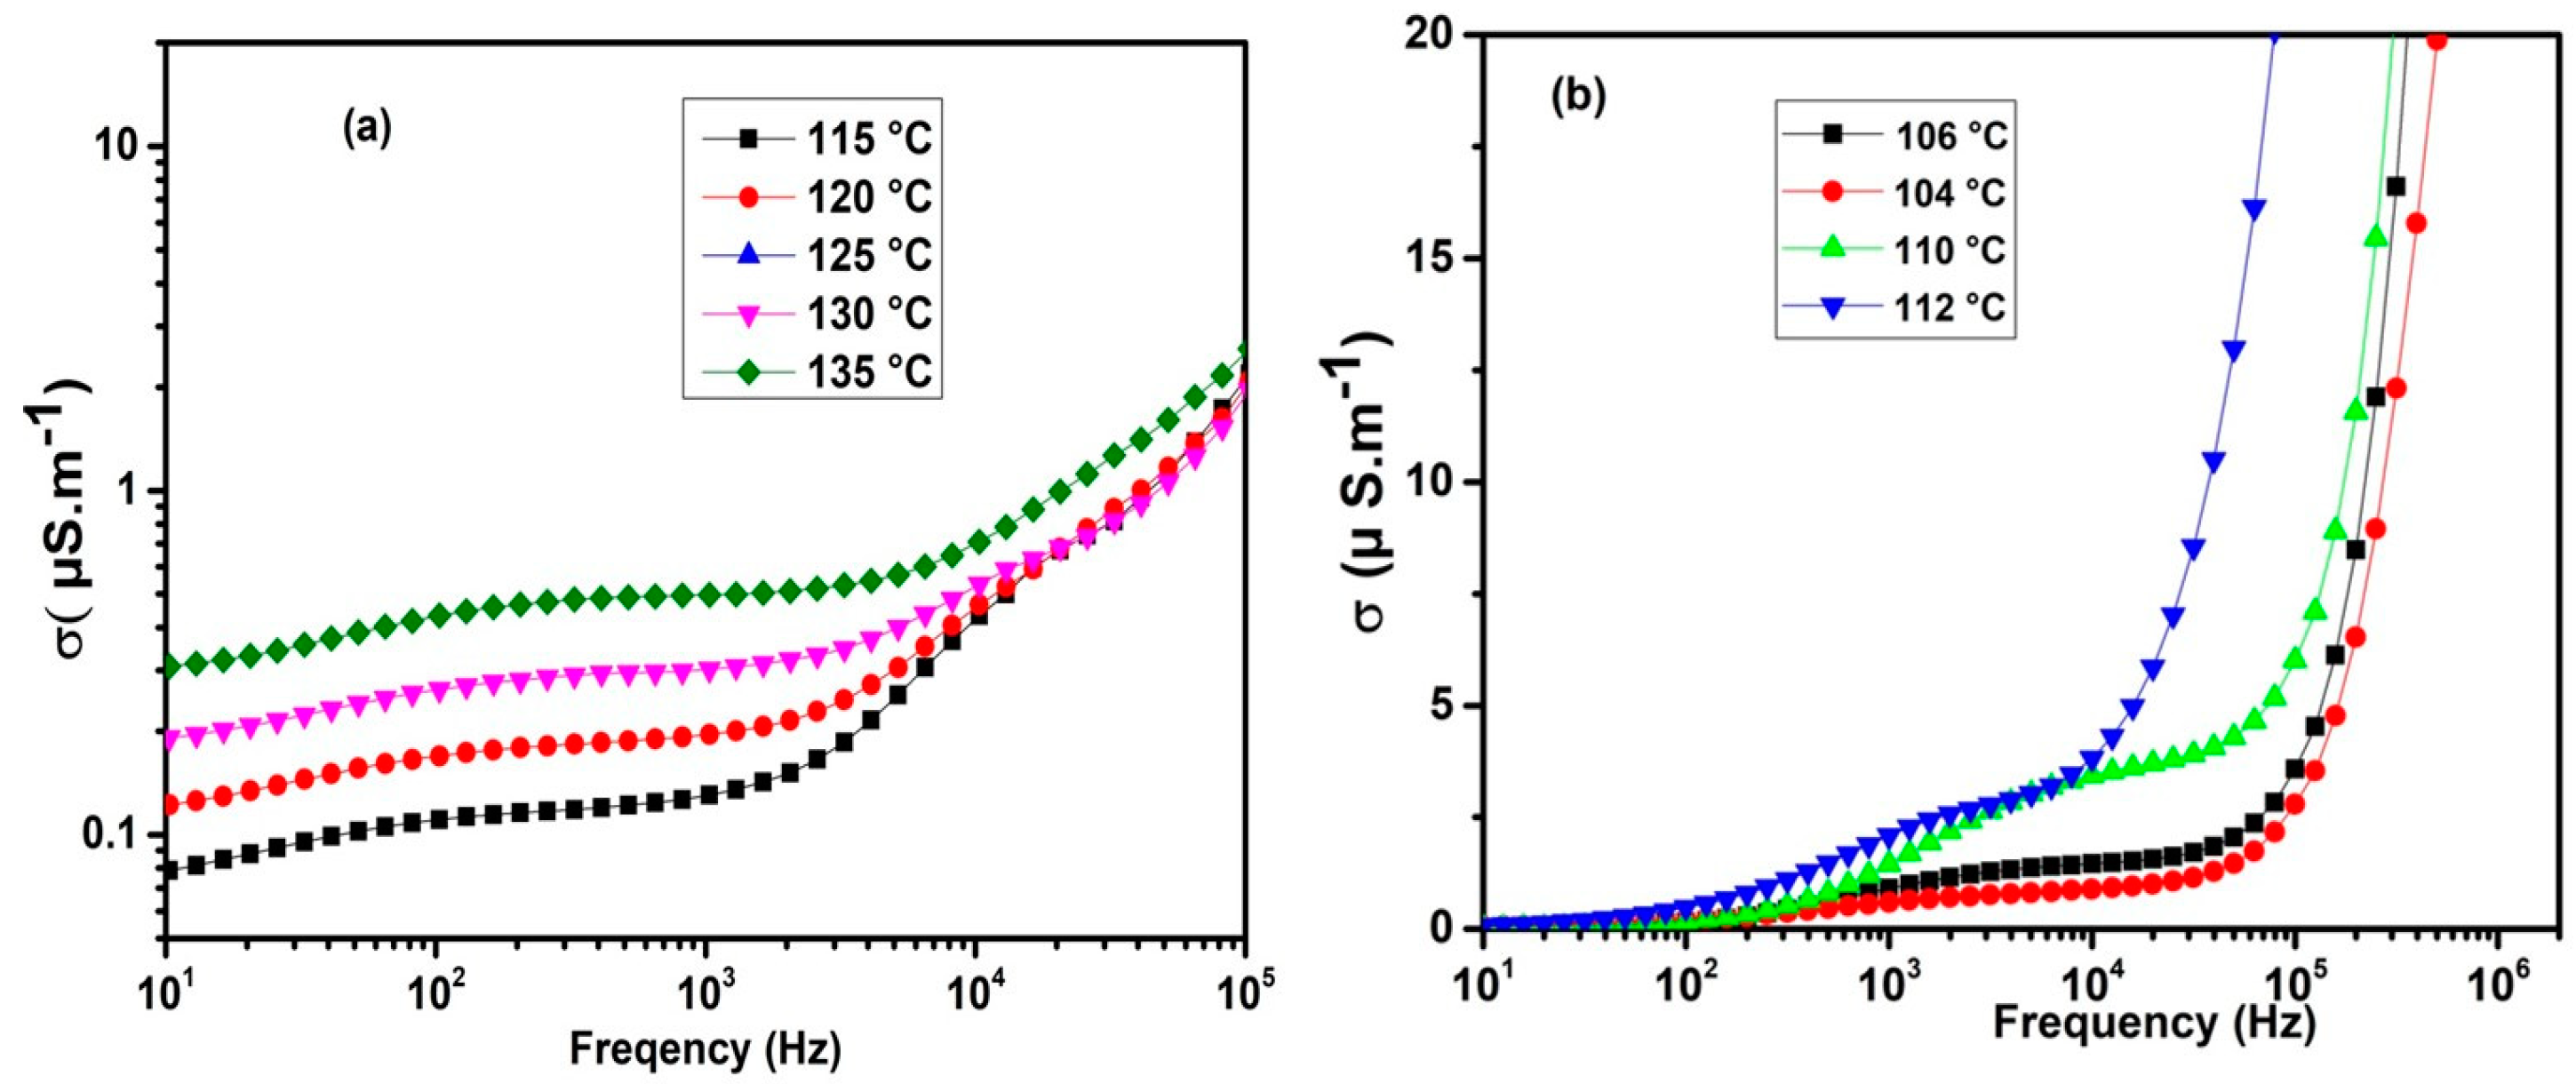
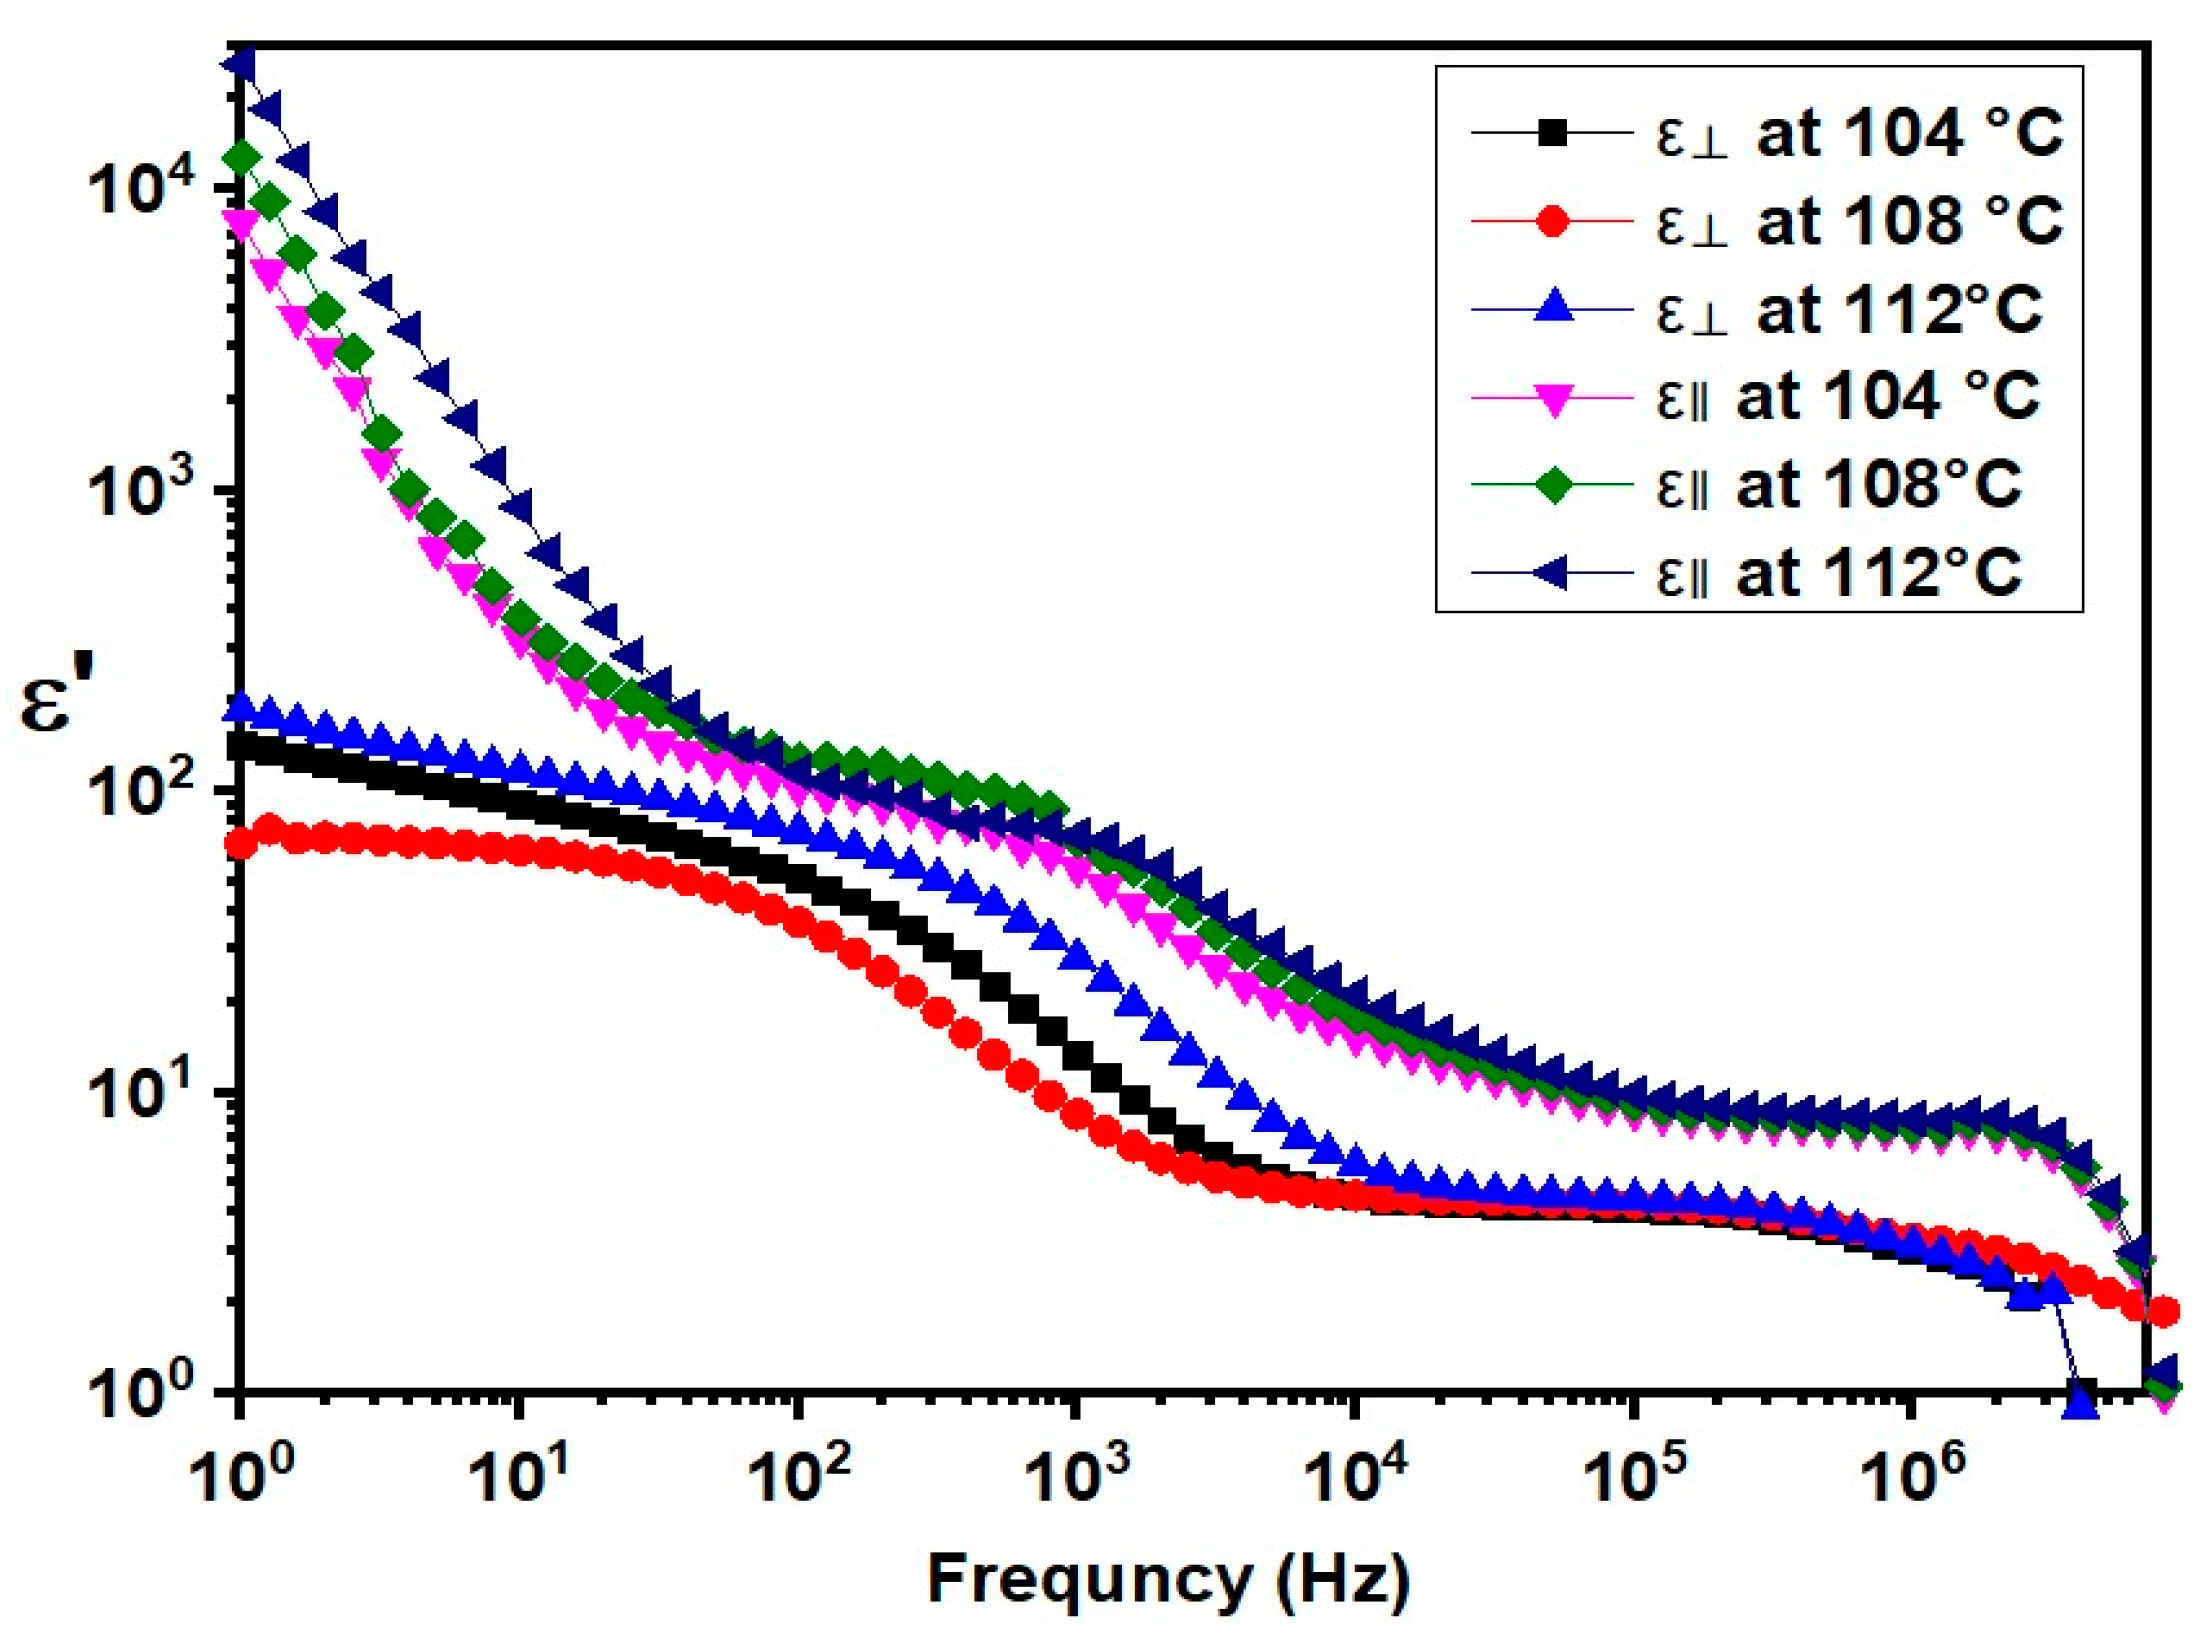
2.3. Dielectric Properties
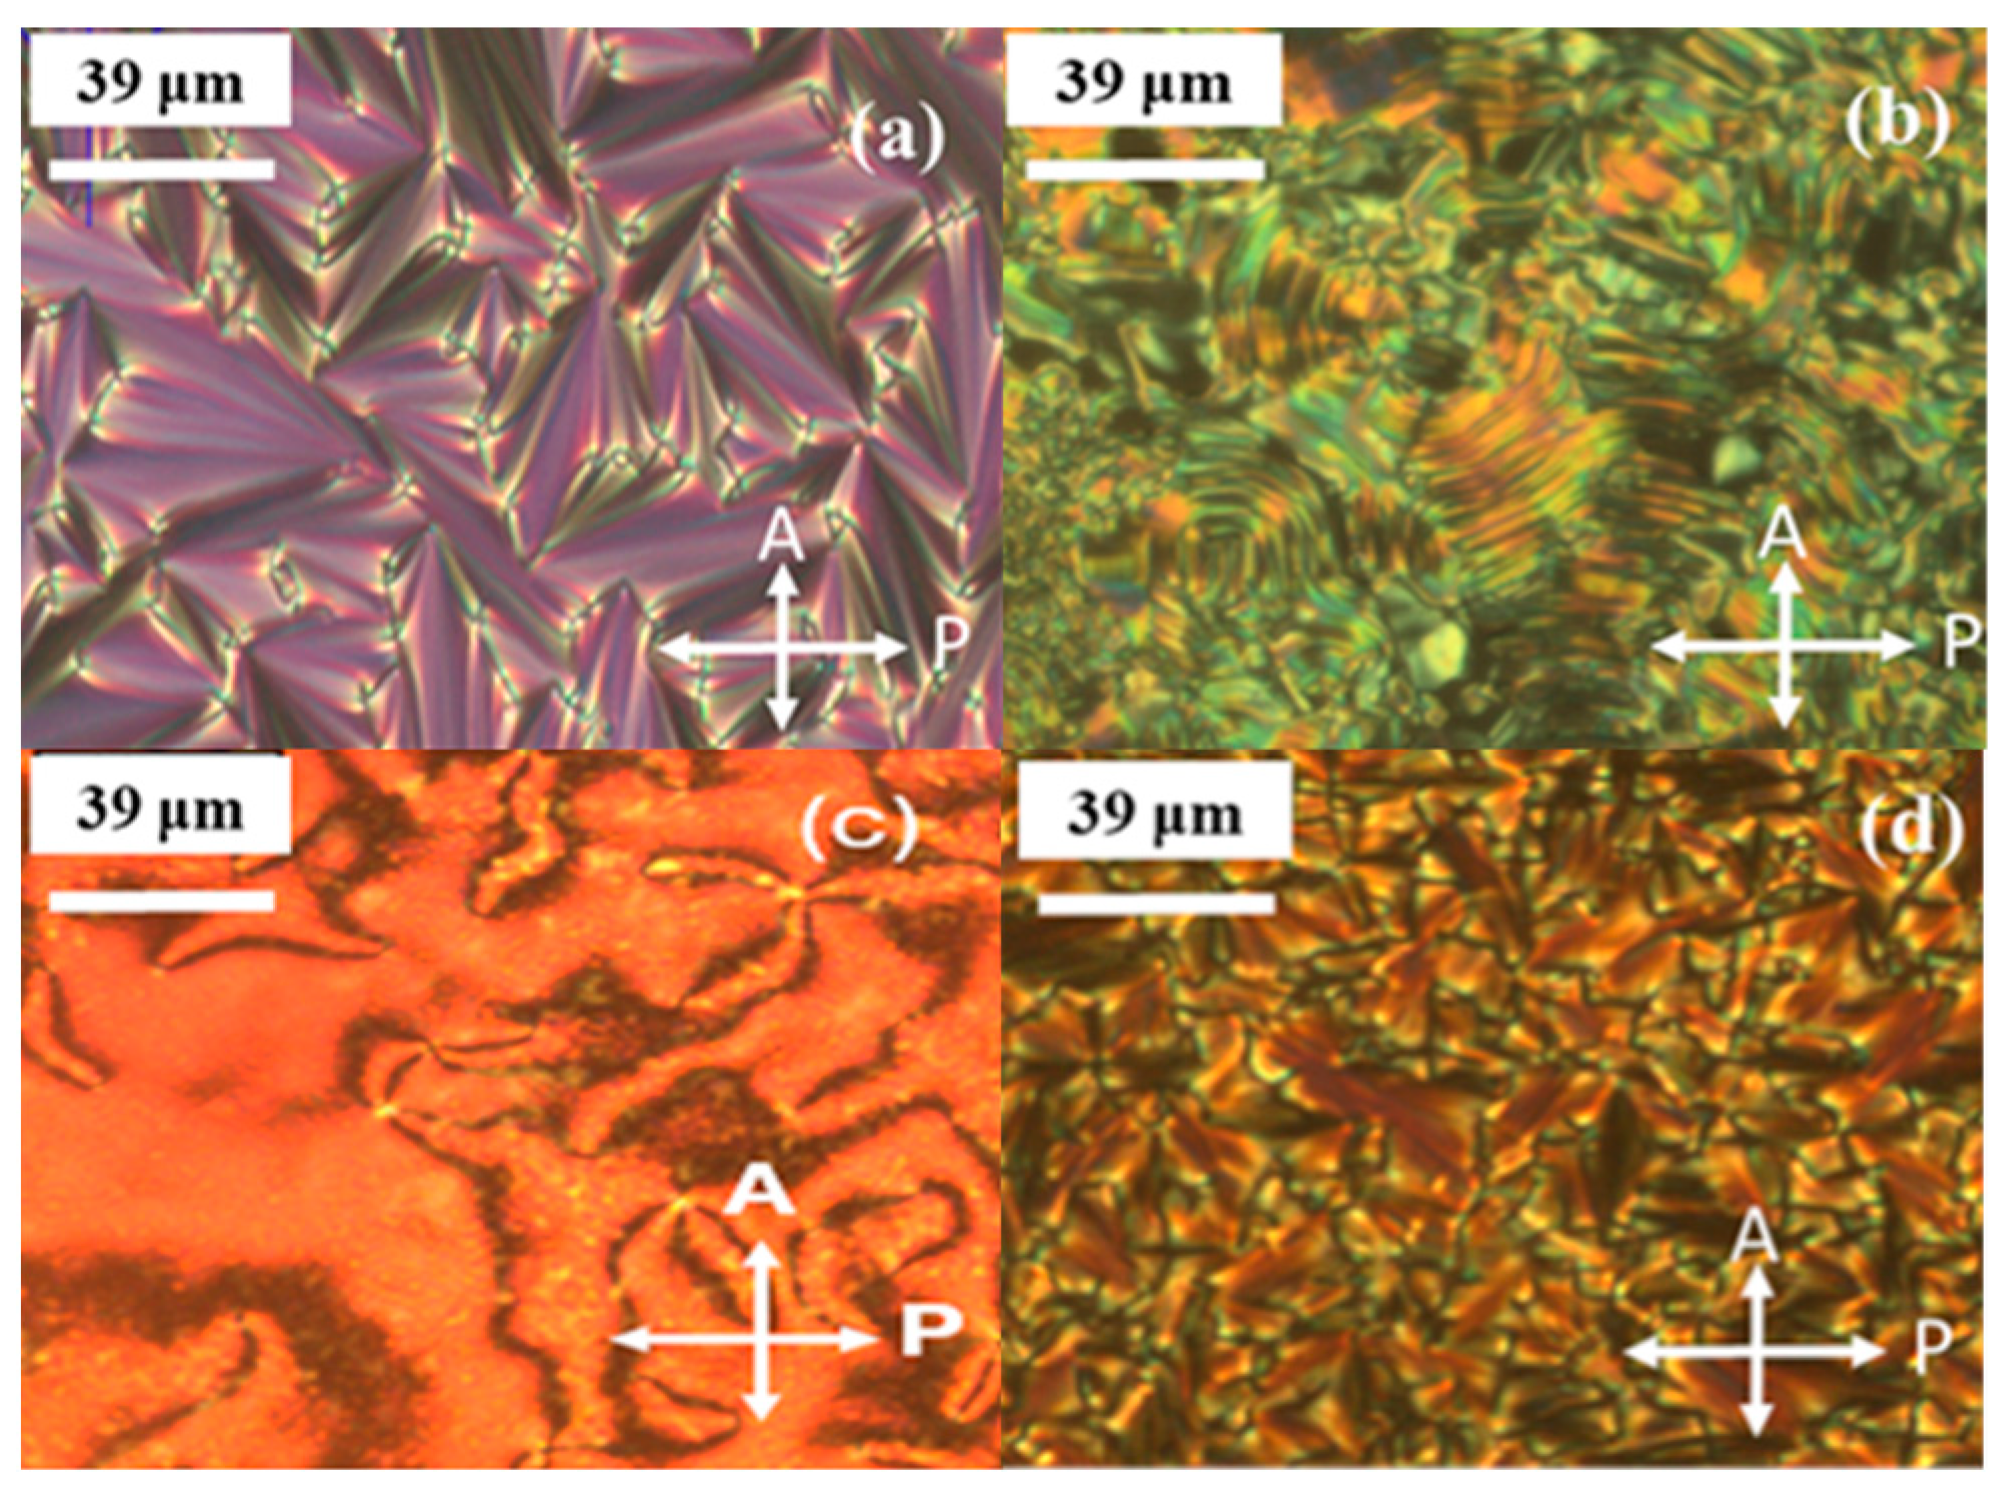
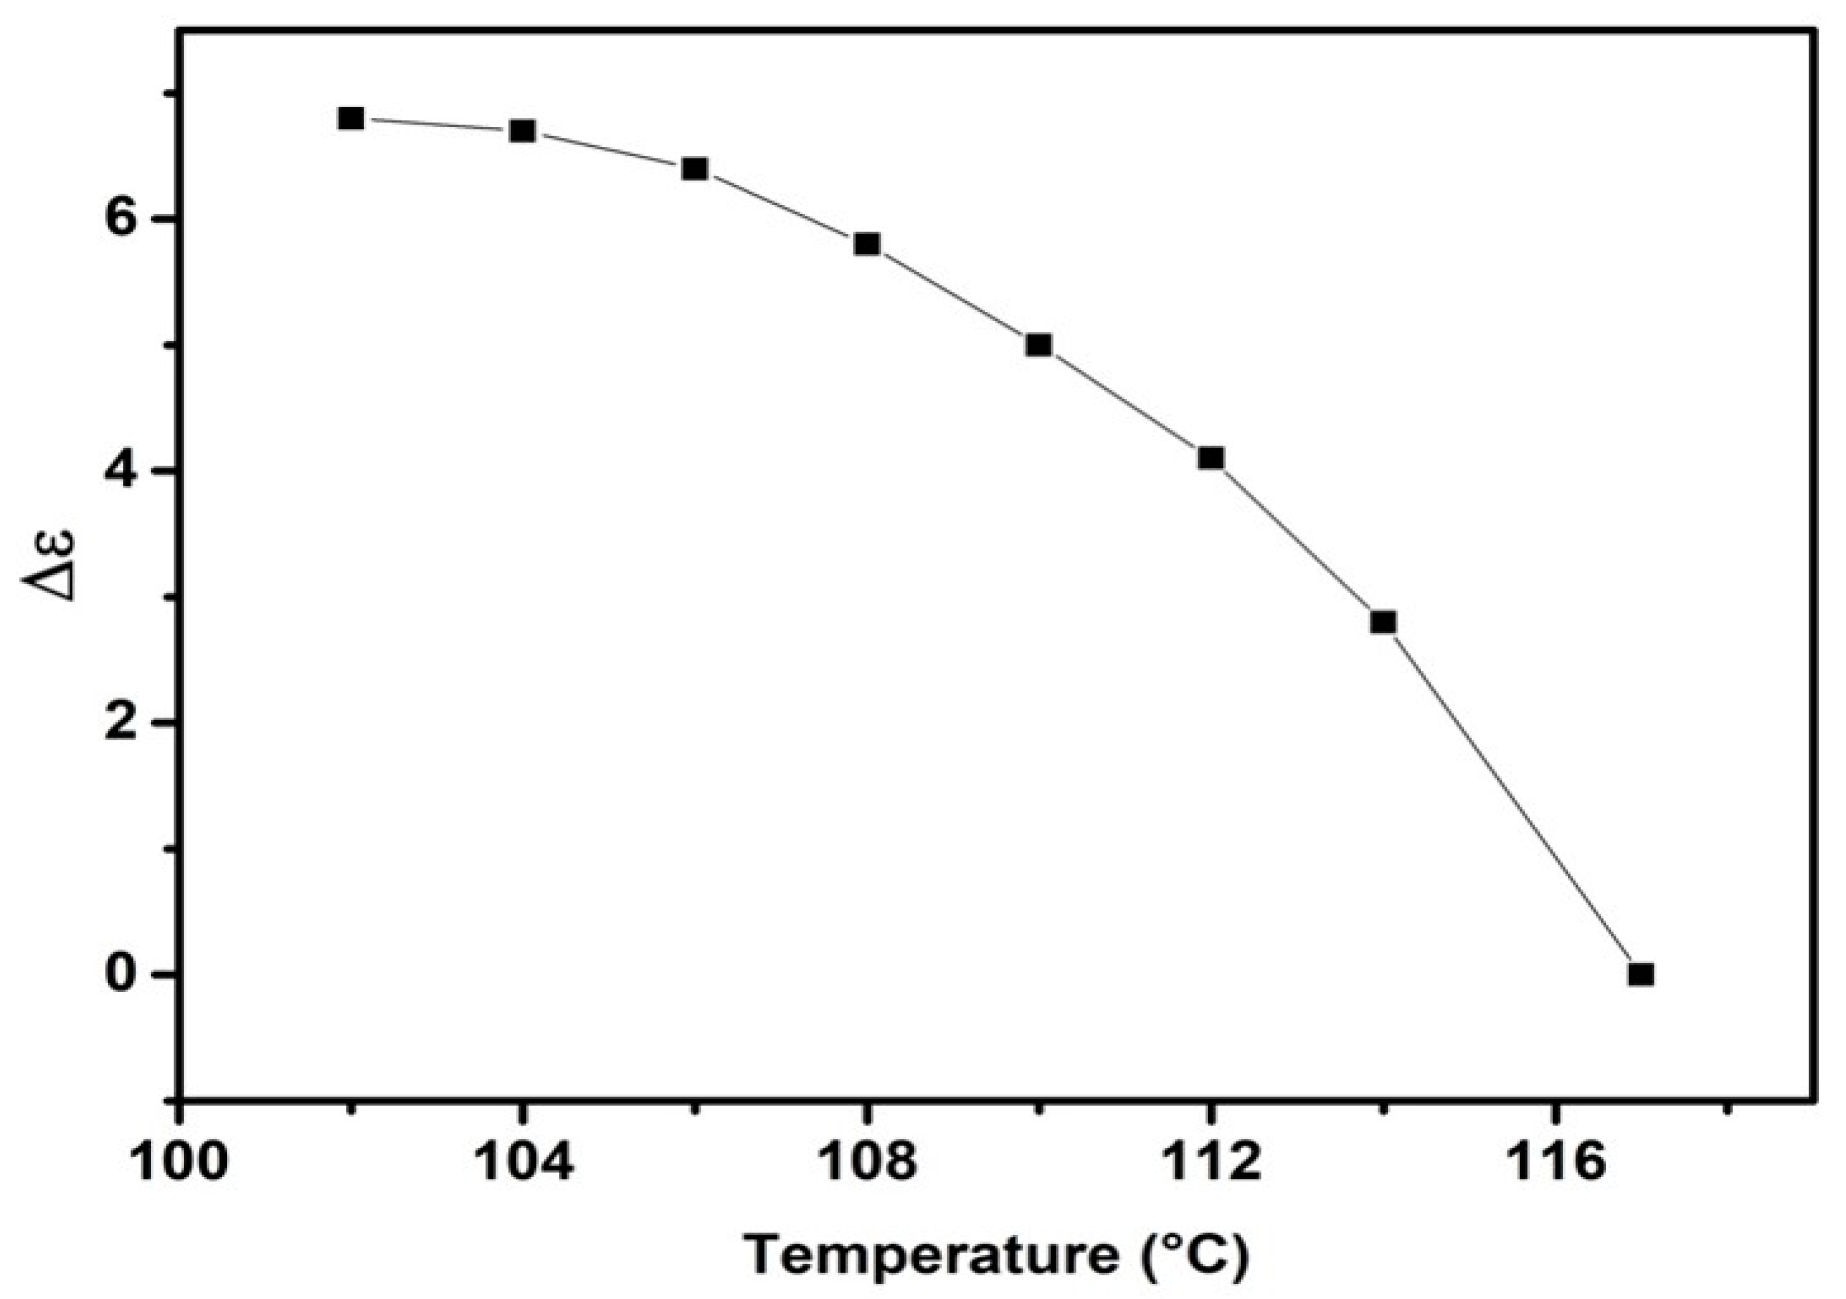
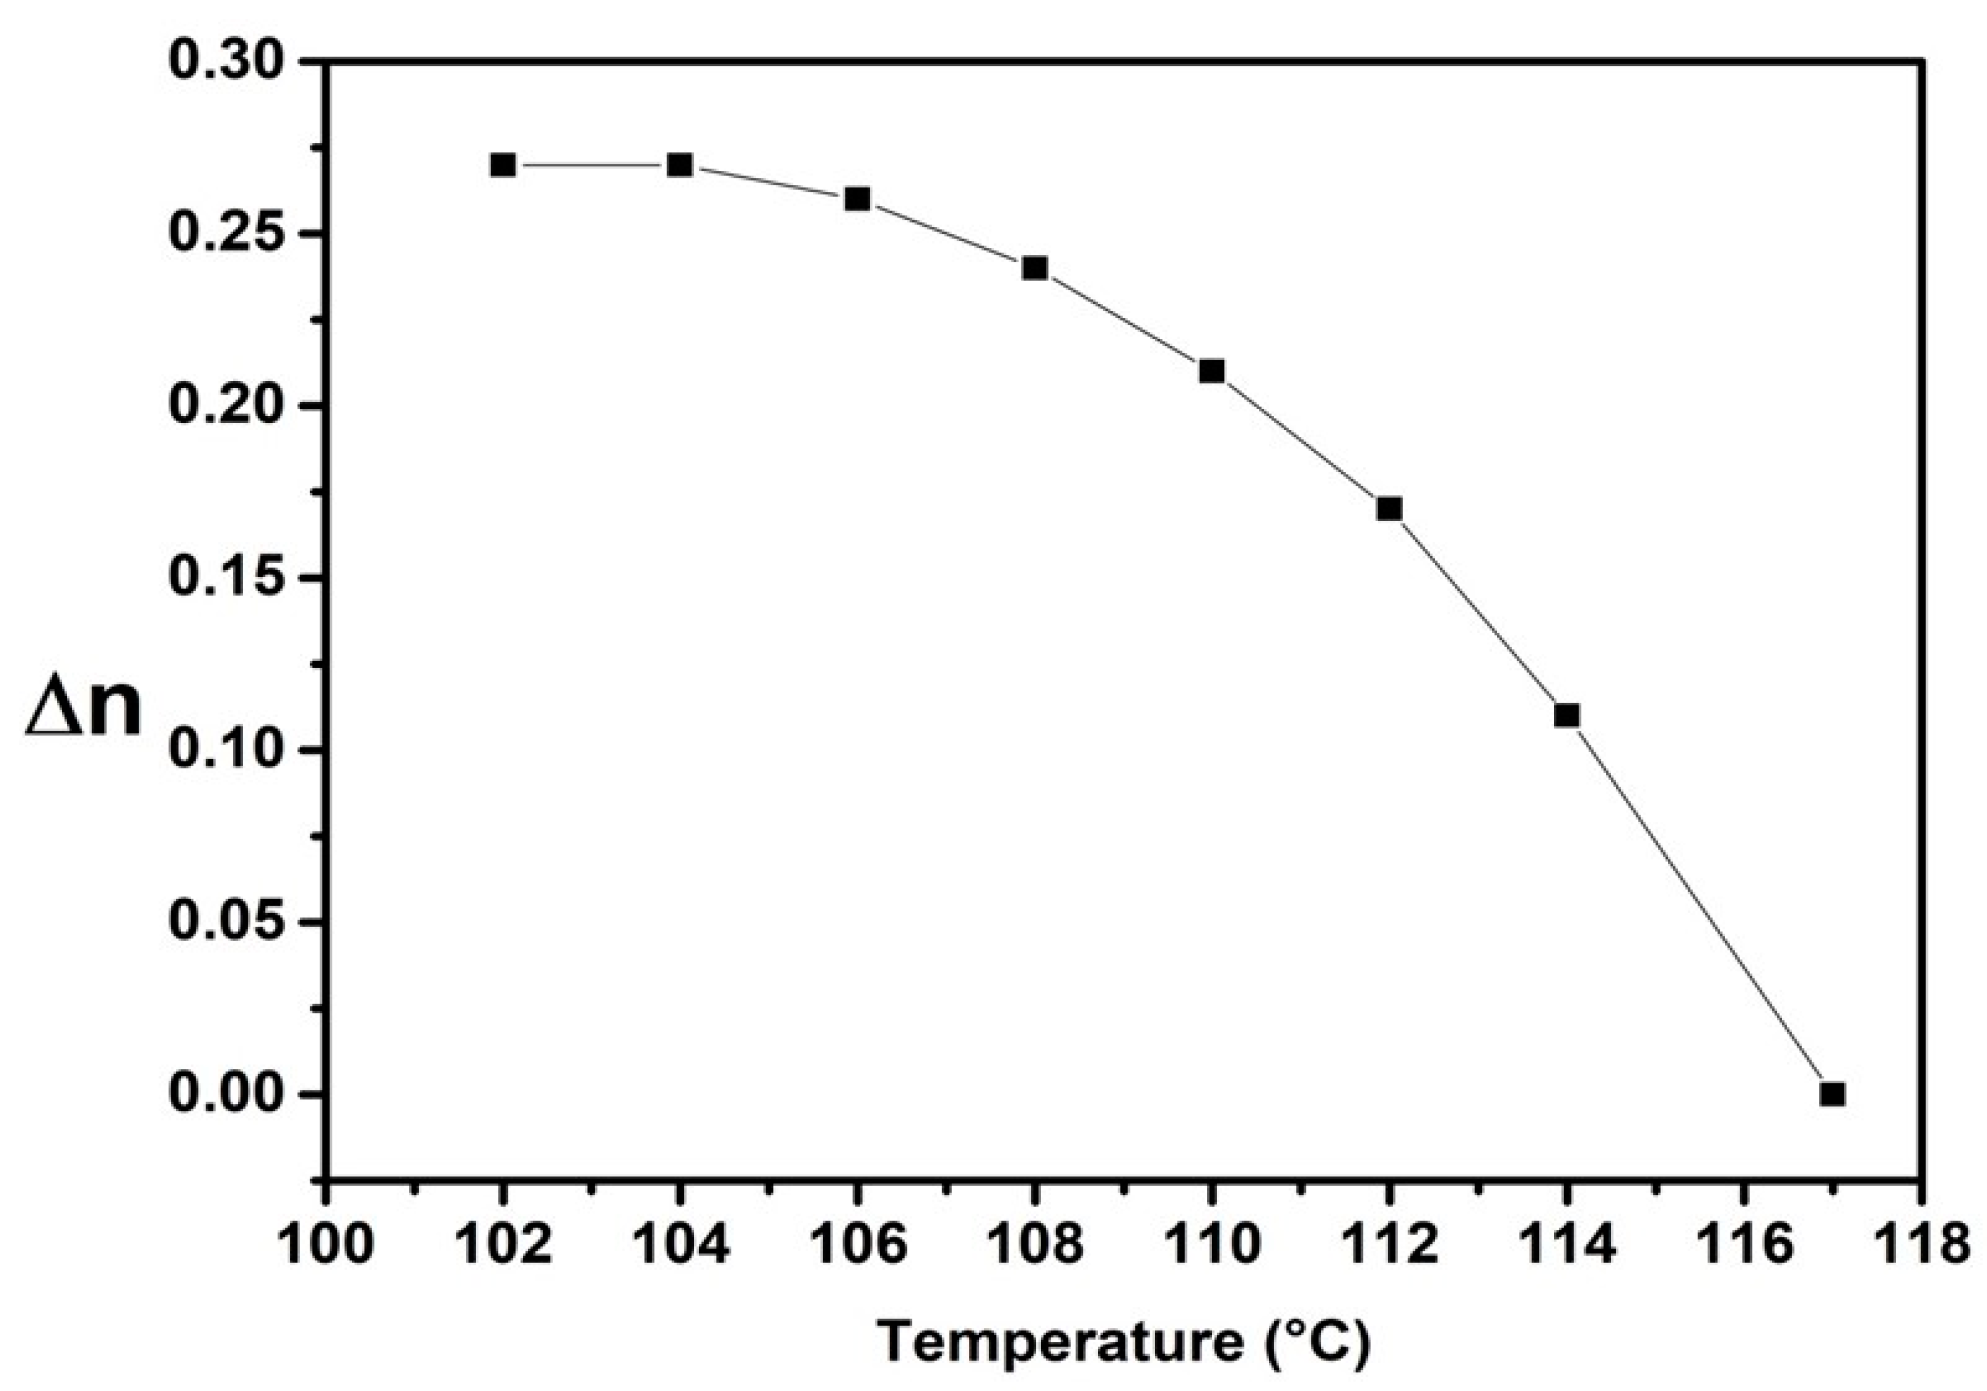
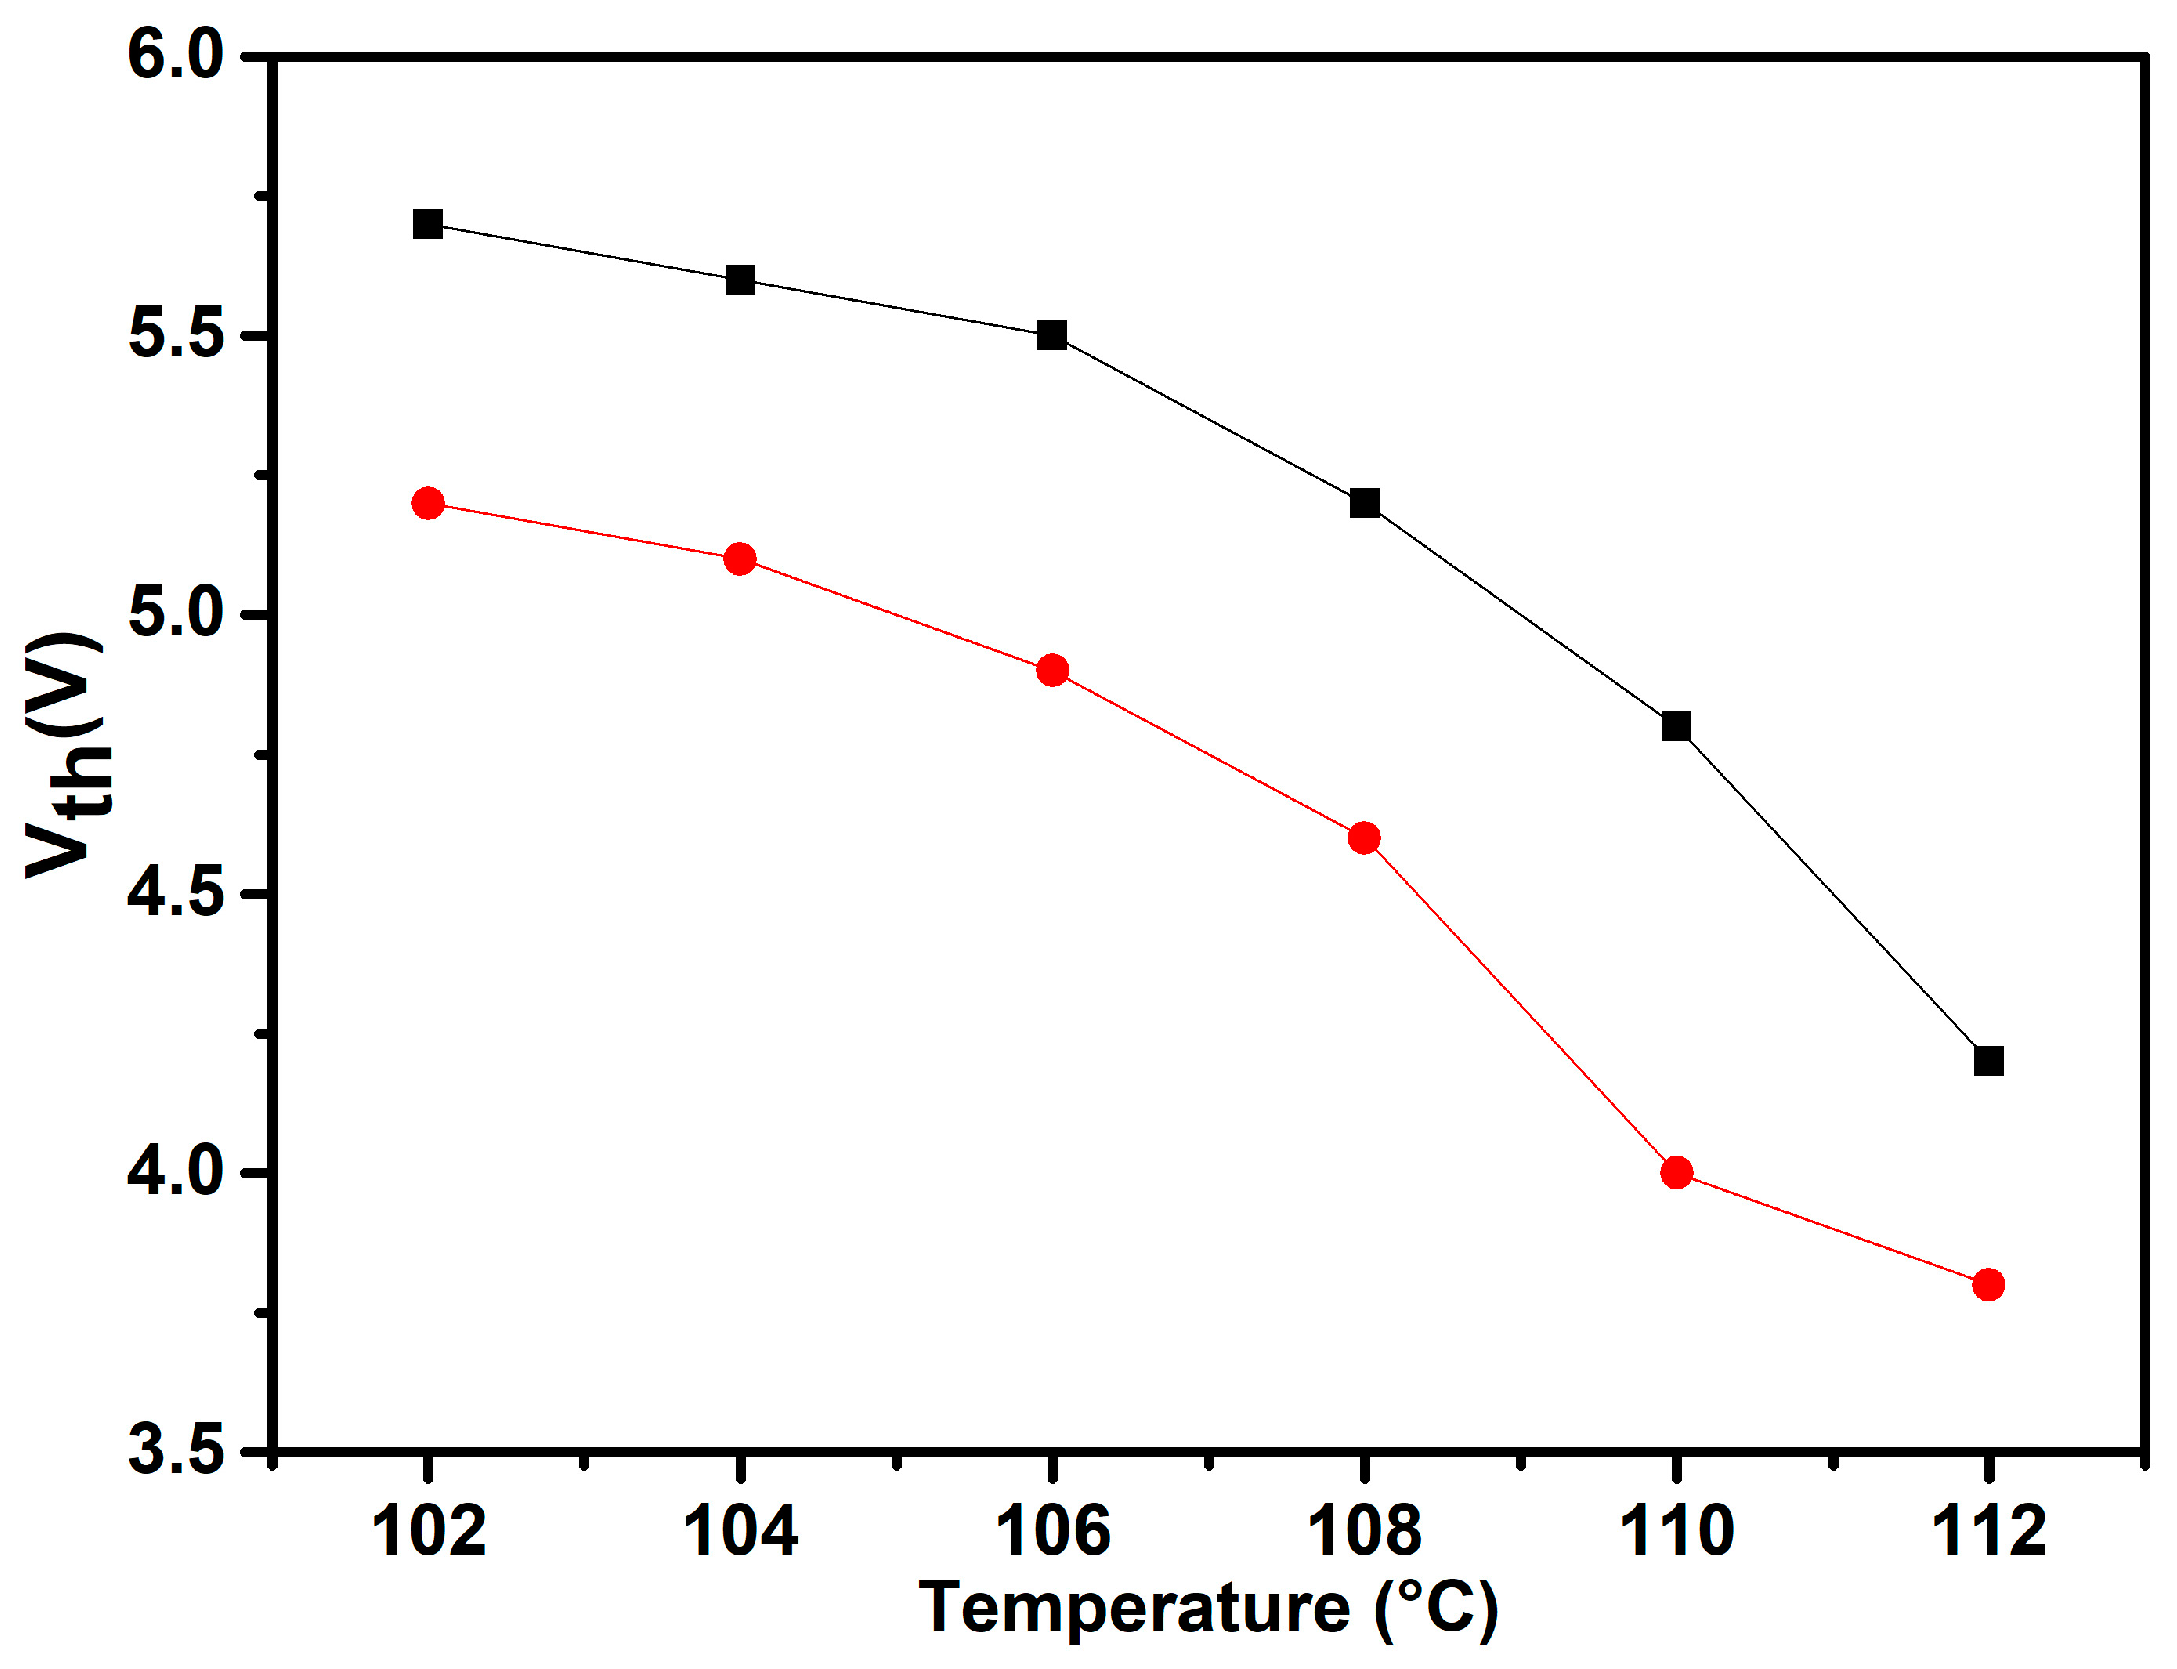
2.4. Properties of the Nematic Phase
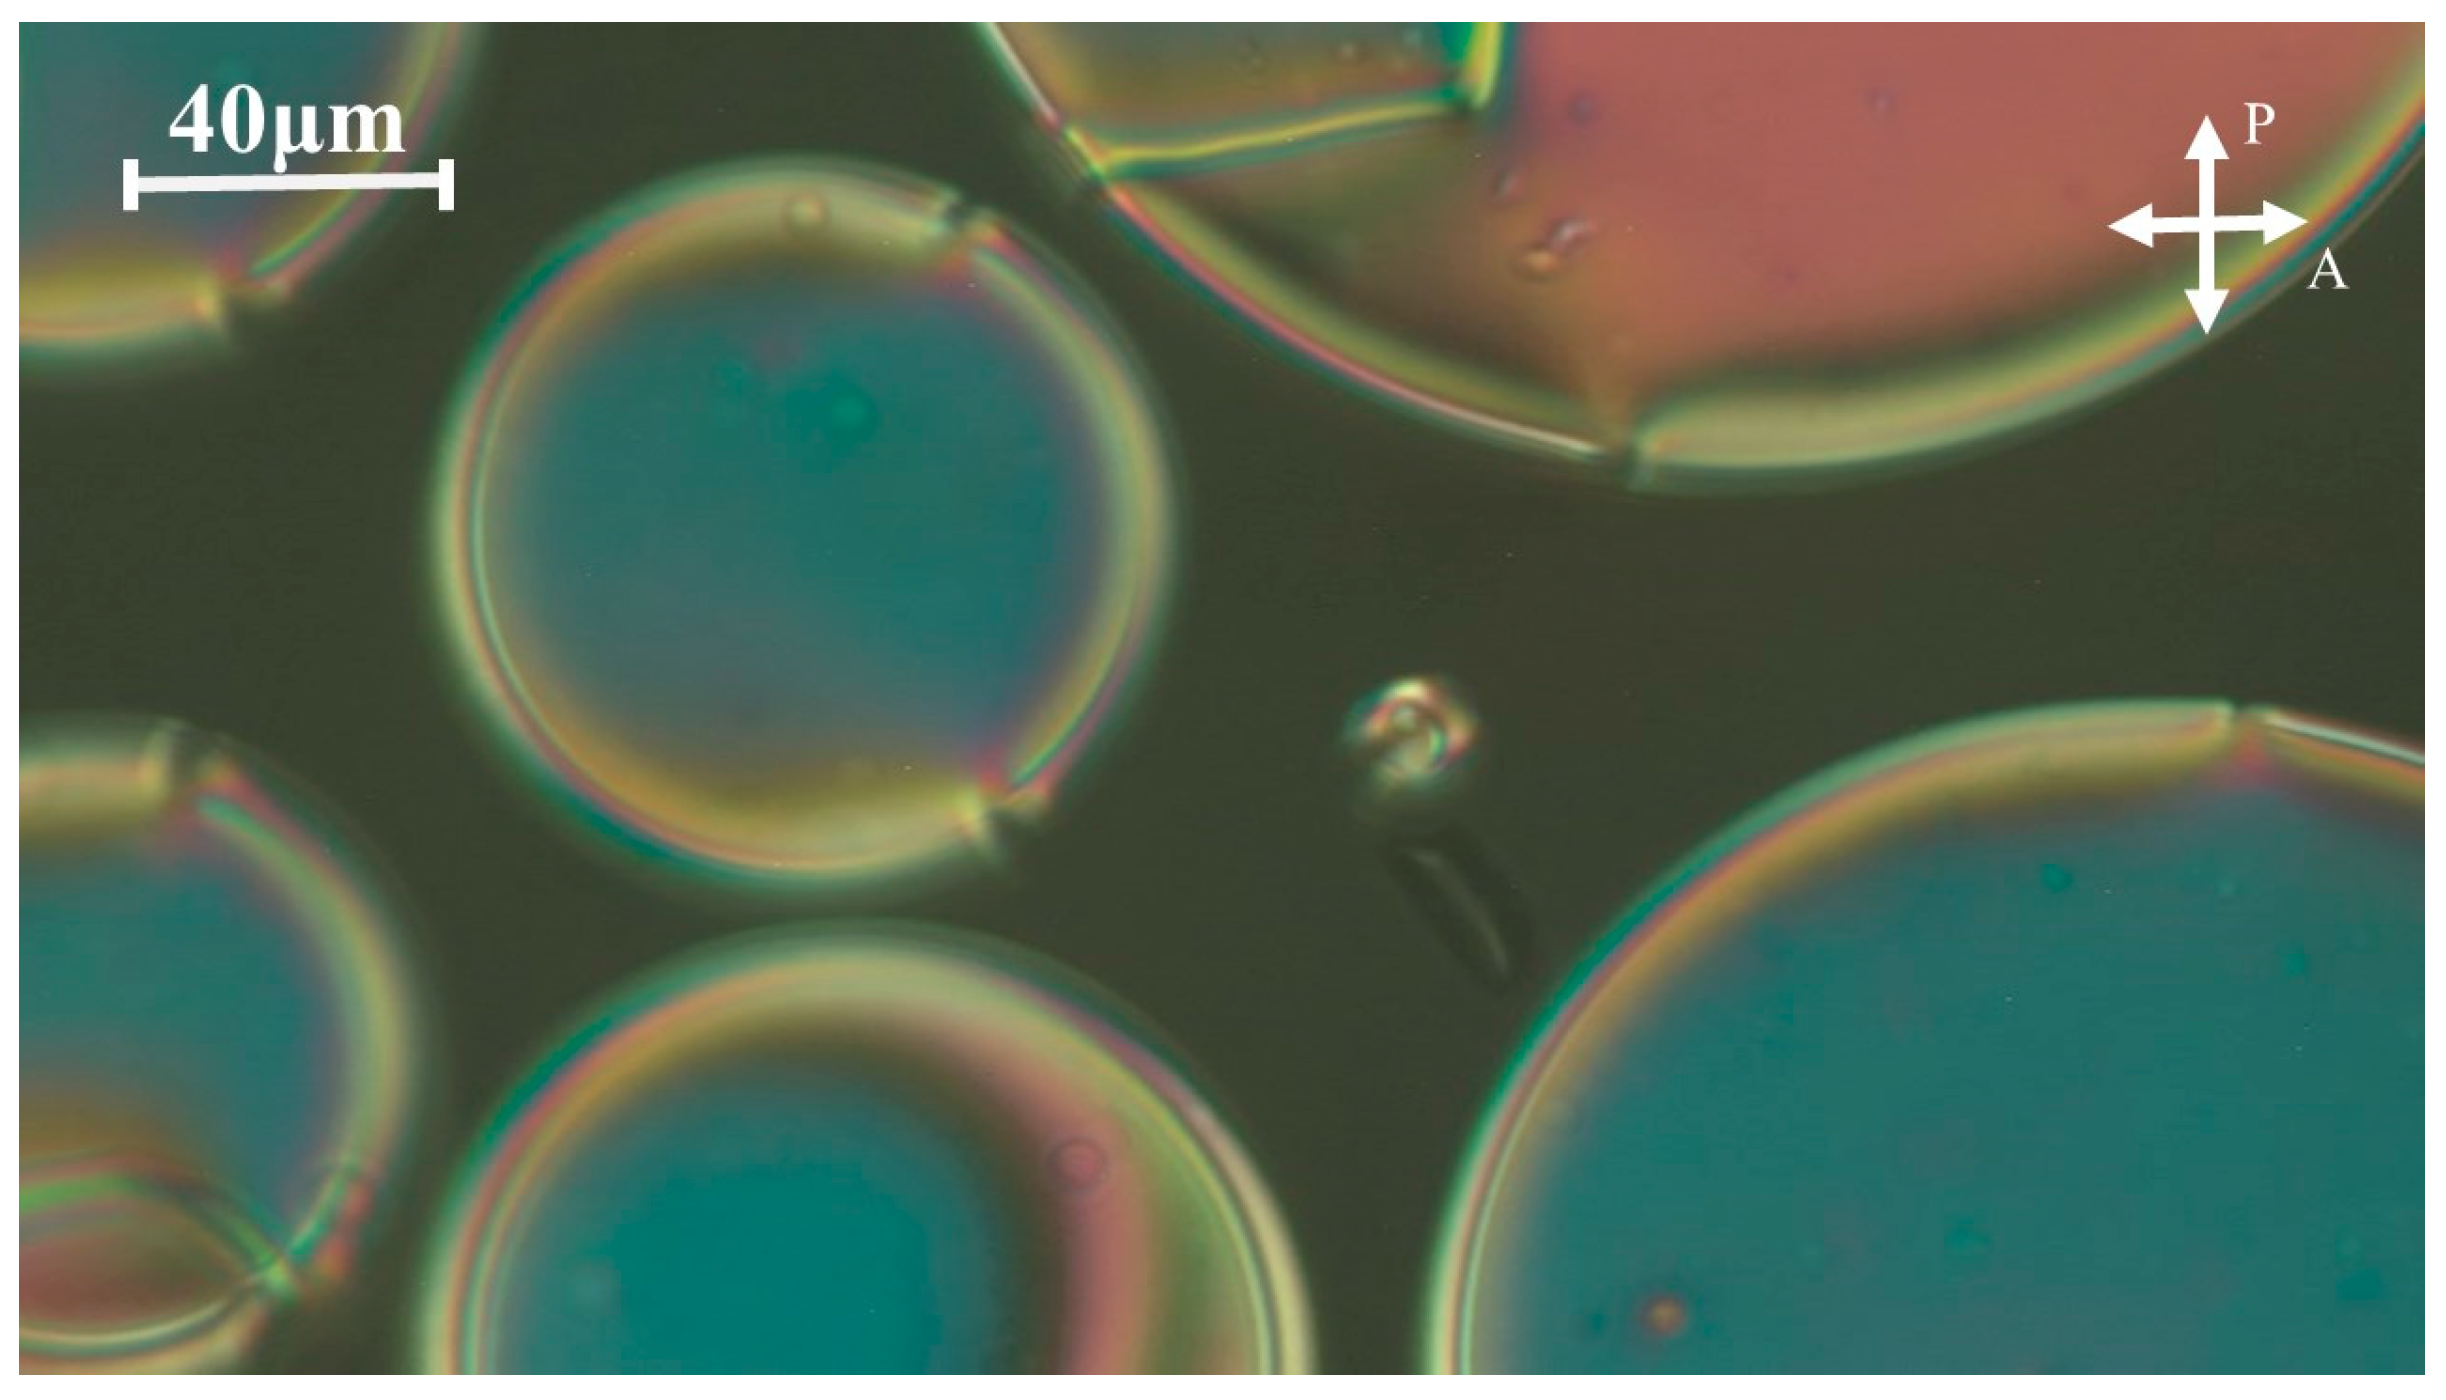
2.5. Polymer Dispersed Liquid Crystals
3. Materials and Methods
3.1. Preparation of Mixtures
3.2. Measurement Set-Up and Instruments
4. Conclusions
Author Contributions
Funding
Institutional Review Board Statement
Informed Consent Statement
Data Availability Statement
Acknowledgments
Conflicts of Interest
References
- Hagar, M.; Ahmed, H.A.; Alnoman, R.B.; Jaremko, M.; Emwas, A.-H.; Sioud, S.; Abu Al-Ola, K.A. New liquid crystal assemblies based on cyano-hydrogen bonding interactions. Front. Chem. 2021, 9, 679885. [Google Scholar] [CrossRef] [PubMed]
- Okumuş, M. Synthesis and characterization of hydrogen bonded liquid crystal complexes by 4-octyloxy benzoic acid and some dicarboxylic acids. J. Mol. Liq. 2018, 266, 529–534. [Google Scholar] [CrossRef]
- Chen, R.; Wang, L.; An, Z.; Chen, X.; Chen, P. Fluorination improves the mesomorphic and photovoltaic performance of rod-like liquid crystal molecules. Dyes Pigm. 2023, 215, 111301. [Google Scholar] [CrossRef]
- Arakawa, Y.; Komatsu, K.; Inui, S.; Tsuji, H. Thioether-linked liquid crystal dimers and trimers: The twist-bend nematic phase. J. Mol. Struct. 2020, 1199, 126913. [Google Scholar] [CrossRef]
- Wang, C.; Guo, H.; Leng, S.; Yu, J.; Feng, K.; Cao, L.; Huang, J. Regulation of hydrophilicity/hydrophobicity of aluminosilicate zeolites: A review. Crit. Rev. Solid State Mater. Sci. 2021, 46, 330–348. [Google Scholar] [CrossRef]
- Alhaddad, O.; Ahmed, H.; Hagar, M. Experimental and theoretical approaches of new nematogenic chair architectures of supramolecular H-bonded liquid crystals. Molecules 2020, 25, 365. [Google Scholar] [CrossRef] [PubMed]
- Saha, R.; Feng, C.; Eremin, A.; Jákli, A. Antiferroelectric bent-core liquid crystal for possible high-power capacitors and electrocaloric devices. Crystals 2020, 10, 652. [Google Scholar] [CrossRef]
- Arakawa, Y.; Ishida, Y.; Tsuji, H. Ether-and Thioether-Linked Naphthalene-Based Liquid-Crystal Dimers: Influence of Chalcogen Linkage and Mesogenic-Arm Symmetry on the Incidence and Stability of the Twist–Bend Nematic Phase. Chem. Eur. J. 2020, 26, 3767–3775. [Google Scholar] [CrossRef]
- Mandle, R.J. A ten-year perspective on twist-bend nematic materials. Molecules 2022, 27, 2689. [Google Scholar] [CrossRef]
- Asiya, S.; Pal, K.; El-Sayyad, G.S.; Abd Elkodous, M.; Demetriades, C.; Kralj, S.; Thomas, S. Reliable optoelectronic switchable device implementation by CdS nanowires conjugated bent-core liquid crystal matrix. Org. Electron. 2020, 82, 105592. [Google Scholar] [CrossRef]
- Ocak, H.; Eran, B.B.; Nuray, S.; Özkonstanyan, A.; Poppe, S.; Tschierske, C. Extraordinary magnetic field effects on the LC phases of homochiral and racemic 4-cyanoresorcinol-based diamagnetic bent-core mesogens. J. Mater. Chem. C 2021, 9, 1895–1910. [Google Scholar] [CrossRef]
- Fouzai, M.; Hamdi, R.; Ghrab, S.; Soltani, T.; Ionescu, A.; Othman, T. Properties of binary mixtures derived from hydrogen bonded liquid crystals. J. Mol. Liq. 2018, 249, 1279–1286. [Google Scholar] [CrossRef]
- Okumuş, M.; Dindar, S. Thermal and mesomorphic properties of 8OBA/nABA (n=3,4) hydrogen-bonded liquid crystalline complexes. J. Therm. Anal. Calorim. 2023, 148, 11577–11587. [Google Scholar] [CrossRef]
- Krivoshey, A.; Mikhailenko, V.; Popova, E.; Fedoryako, A.; Vashchenko, O.; Vlasenko, H.; Vashchenko, V. p-Terphenyl-containing symmetric tetraesters for nano-scale pitch ferroelectric liquid crystal materials. J. Mol. Liq. 2022, 356, 119051. [Google Scholar] [CrossRef]
- Ayeb, H.; Derbali, M.; Mouhli, A.; Soltani, T.; Jomni, F.; Fresnais, J.; Lacaze, E. Viscoelastic and dielectric properties of 5CB nematic liquid crystal doped by magnetic and nonmagnetic nanoparticles. Phys. Rev. E 2020, 102, 052703. [Google Scholar] [CrossRef] [PubMed]
- Salah, M.B.; Nasri, R.; Alharbi, A.N.; Althagafi, T.M.; Soltani, T. Thermotropic liquid crystal doped with ferroelectric nanoparticles: Electrical behavior and ion trapping phenomenon. J. Mol. Liq. 2022, 357, 119142. [Google Scholar] [CrossRef]
- Li, J.; Wang, Z.; Deng, M.; Zhu, Y.; Zhang, X.; Xia, R.; Song, Y.; Hisai, Y.; Aya, S.; Huang, M. General phase-structure relationship in polar rod-shaped liquid crystals: Importance of shape anisotropy and dipolar strength. Giant 2022, 11, 100109. [Google Scholar] [CrossRef]
- Sebastián, N.; Mandle, R.J.; Petelin, A.; Eremin, A.; Mertelj, A. Electrooptics of mm-scale polar domains in the ferroelectric nematic phase. Liq. Cryst. 2021, 48, 2055–2071. [Google Scholar]
- Mandle, R.J.; Cowling, S.J.; Goodby, J.W. Rational design of rod-like liquid crystals exhibiting two nematic phases. Chem. Eur. J. 2017, 23, 14554–14562. [Google Scholar] [CrossRef]
- Vaupotič, N.; Pociecha, D.; Rybak, P.; Matraszek, J.; Čepič, M.; Wolska, J.M.; Gorecka, E. Dielectric response of a ferroelectric nematic liquid crystalline phase in thin cells. Liq. Cryst. 2023, 50, 584–595. [Google Scholar] [CrossRef]
- Erkoreka, A.; Martinez-Perdiguero, J.; Mandle, R.J.; Mertelj, A.; Sebastián, N. Dielectric spectroscopy of a ferroelectric nematic liquid crystal and the effect of the sample thickness. J. Mol. Liq. 2023, 387, 122566. [Google Scholar] [CrossRef]
- Manabe, A.; Bremer, M.; Kraska, M. Ferroelectric nematic phase at and below room temperature. Liq. Cryst. 2021, 48, 1079–1086. [Google Scholar] [CrossRef]
- Huang, Y.; He, Z.; Wu, S.-T. Fast-response liquid crystal phase modulators for augmented reality displays. Opt. Express. 2017, 25, 32757–32766. [Google Scholar] [CrossRef]
- Peng, F.; Chen, Y.; Wu, S.-T.; Tripathi, S.; Twieg, R. Low loss liquid crystals for infrared applications. Liq. Cryst. 2014, 41, 1545–1552. [Google Scholar] [CrossRef]
- Gou, F.; Chen, R.; Hu, M.; Li, J.; Li, J.; An, Z.; Wu, S.-T. Submillisecond-response polymer network liquid crystals for mid-infrared applications. Opt. Express 2018, 26, 29735–29743. [Google Scholar] [CrossRef] [PubMed]
- Camley, R.; Celinski, Z.; Garbovskiy, Y.; Glushchenko, A. Liquid crystals for signal processing applications in the microwave and millimeter wave frequency ranges. Liq. Cryst. Rev. 2018, 6, 17–52. [Google Scholar] [CrossRef]
- Zeng, H.; Gong, S.; Wang, L.; Zhou, T.; Zhang, Y.; Lan, F.; Cong, X.; Wang, L.; Song, T.; Zhao, Y. A review of terahertz phase modulation from free space to guided wave integrated devices. J. Nanophotonics 2022, 11, 415–437. [Google Scholar] [CrossRef]
- Tang, J.; Mao, Z.; An, Z.; Chen, R.; Chen, X.; Chen, P. Difluorovinyl liquid crystal diluters improve the electro-optical properties of high-∆n liquid crystal mixture for AR displays. Molecules 2023, 28, 2458. [Google Scholar] [CrossRef] [PubMed]
- Dąbrowski, R.; Kula, P.; Herman, J. High birefringence liquid crystals. Crystals 2013, 3, 443–482. [Google Scholar] [CrossRef]
- Qian, Y.; Li, S.; Tang, H.; Sun, J.; Cai, M.; Zhao, T.; Yang, C.; Ye, W.; Zhang, Z. Effect of substituents on the properties of fluorine-containing polyphenyl liquid crystal compounds. J. Mol. Liq. 2023, 391, 123289. [Google Scholar] [CrossRef]
- Derbali, M.; Soltani, T.; Guesmi, A.; Hamadi, N.B.; Jeanneau, E.; Chevalier, Y. Synthesis, thermal, dielectric and electro-optic properties of new series of fluorinated hydrogen-bonded liquid crystals. J. Mol. Liq. 2022, 367, 120510. [Google Scholar] [CrossRef]
- Madhu Mohan, M.L.N. Diversified application of hydrogen bond liquid crystal. IOP Conf. Ser. Mater. Sci. Eng. 2021, 1084, 012089. [Google Scholar] [CrossRef]
- Yamaguchi, R. Physical properties of hydrogen bonded nematic liquid crystals and electro-optical properties in terahertz waves. Opt. Mater. Express. 2023, 13, 2147–2157. [Google Scholar] [CrossRef]
- Ma, Y.; Shan, Y.; Cheng, Y.; Yang, R.; Kwok, H.-S.; Zhao, J. The Birefringence and Extinction Coefficient of Ferroelectric Liquid Crystals in the Terahertz Range. Photonics 2023, 10, 1368. [Google Scholar] [CrossRef]
- Missaoui, T.; Amor, I.B.; Soltani, T.; Guesmi, A.; Hamadi, N.B.; Jeanneau, E.; Chevalier, Y. Dielectric and electro-optic properties of cybotactic nematic phase in hydrogen-bonded liquid crystals. J. Mol. Liq. 2020, 304, 112726. [Google Scholar] [CrossRef]
- Salah, M.B.; Jaoued, N.; Soltani, T.; Guesmi, A.; Hamadi, N.B.; Hbaib, S. Thermotropic liquid crystal doped with silica, silica grafted with aniline (ANI@SiO2) and polyaniline (PANI@SiO2). Liq. Cryst. 2023, 50, 1872. [Google Scholar] [CrossRef]
- Ye, W.; Li, Z.; Yuan, R.; Zhang, P.; Sun, T.; Cai, M.; Wang, X.; Zhu, J.; Sun, Y.; Xing, H. Accurate measurement of the twist elastic constant of liquid crystal by usingcapacitance method. Liq. Cryst. 2019, 46, 349. [Google Scholar]
- Hamdi, R. Synthesis and physicochemical studies of double fluorinated hydrogen-bonded liquid crystals (n-OBAFF). J. Mol. Liq. 2022, 349, 118201. [Google Scholar] [CrossRef]
- Łoś, J.; Drozd-Rzoska, A.; Rzoska, S.J.; Czupryński, K. The impact of ionic contribution to dielectric permittivity in 11CB liquid crystal and its colloids with BaTiO3 nanoparticles. Eur. Phys. J. E 2022, 45, 74. [Google Scholar] [CrossRef]
- Barrera, A.; Binet, C.; Dubois, F.; Hébert, P.-A.; Supiot, P.; Foissac, C.; Maschke, U. Dielectric spectroscopy analysis of liquid crystals recovered from end-of-life liquid crystal displays. Molecules 2021, 26, 2873. [Google Scholar] [CrossRef]
- Selvaraj, P.; Subramani, K.; Hsu, C.-J.; Huang, C.-Y. A Comparative Study on Electro-Optic Effects of Organic N-Benzyl-2-Methyl-4-Nitroaniline and Morpholinium 2-Chloro-4-Nitrobenzoate Doped in Nematic Liquid Crystals E7. Polymers 2020, 12, 2977. [Google Scholar] [CrossRef] [PubMed]
- Islam, M.S.; Chan, K.-Y.; Thien, G.S.H.; Low, P.-L.; Lee, C.-L.; Wong, S.K.; Noor, E.E.M.; Au, B.W.-C.; Ng, Z.-N. Performances of Polymer-Dispersed Liquid Crystal Films for Smart Glass Applications. Polymers 2023, 15, 3420. [Google Scholar] [CrossRef] [PubMed]
- Saeed, M.H.; Zhang, S.; Cao, Y.; Zhou, L.; Hu, J.; Muhammad, I.; Xiao, J.; Zhang, L.; Yang, H. Recent Advances in The Polymer Dispersed Liquid Crystal Composite and Its Applications. Molecules 2020, 25, 5510. [Google Scholar] [CrossRef] [PubMed]
- Zhao, C.; Hu, Y.; Xu, J.; Yu, M.; Zou, C.; Wang, Q.; Gao, Y.; Yang, H. Research on the Morphology, Electro-Optical Properties and Mechanical Properties of Electrochromic Polymer-Dispersed Liquid Crystalline Films Doped with Anthraquinone Dyes. Crystals 2023, 13, 735. [Google Scholar] [CrossRef]
- Gardymova, A.P.; Krakhalev, M.N.; Zyryanov, V.Y.; Gruzdenko, A.A.; Alekseev, A.A.; Rudyak, V.Y. Polymer Dispersed Cholesteric Liquid Crystals with a Toroidal Director Configuration under an Electric Field. Polymers 2021, 13, 732. [Google Scholar] [CrossRef]
- Kajiyama, T.; Nagata, Y.; Washizu, S.; Takayanagi, M. Characterization and gas permeation of polycarbonate/liquid crystal composite membrane. J. Membr. Sci. 1982, 11, 39–52. [Google Scholar] [CrossRef]

| Substances | Transition Temperatures (°C) and Enthalpy (J/g) |
|---|---|
| FNBA/10OBA | Cr 86 (49.2) SmC 133.4 (37.2) SmA 142 (22.7)Iso |
| FNBA/9OBAF | Cr 71.6 (18.1) SmA 101 (13.5) N 115.4 (17.4) Iso |
| FNBA/14OBAF | Cr 70.4 (61.5) SmA 109 (24.3) N 121.5 (12.6) Iso |
| FNBA/7OBAFF | Cr 79.3 (51.2) SmA 104 (6.4) N 120.9 (7.3) Iso |
| FNBA/12OBAFF | Cr 70 (78.3) SmA 99.5 (1.7) N 112 (1.3) Iso |
| D (m2s−1) | n (m−3) | µ (m2s−1V−1) | |
|---|---|---|---|
| FNBA/10OBA (106 °C) | 6.1 × 10⁻¹¹ | 9.6 × 10¹⁹ | 1.43 × 10⁻⁹ |
| FNBA/10OBA (112 °C) | 4.3 × 10⁻¹¹ | 2.3 × 10²⁰ | 1.8 × 10⁻⁹ |
| FNBA/10OBA (106 °C) | 4.1 × 10⁻¹⁰ | 1.8 × 10¹⁹ | 8.1 × 10⁻⁹ |
| FNBA/10OBA (112 °C) | 7.6 × 10⁻¹⁰ | 2.5 × 10¹⁹ | 9.4 × 10⁻⁹ |
Disclaimer/Publisher’s Note: The statements, opinions and data contained in all publications are solely those of the individual author(s) and contributor(s) and not of MDPI and/or the editor(s). MDPI and/or the editor(s) disclaim responsibility for any injury to people or property resulting from any ideas, methods, instructions or products referred to in the content. |
© 2024 by the authors. Licensee MDPI, Basel, Switzerland. This article is an open access article distributed under the terms and conditions of the Creative Commons Attribution (CC BY) license (https://creativecommons.org/licenses/by/4.0/).
Share and Cite
Ben Salah, M.; Saadaoui, L.; Soltani, T.; Ben Hamadi, N.; Guesmi, A.; Maschke, U. New Series of Hydrogen-Bonded Liquid Crystal with High Birefringence and Conductivity. Molecules 2024, 29, 3422. https://doi.org/10.3390/molecules29143422
Ben Salah M, Saadaoui L, Soltani T, Ben Hamadi N, Guesmi A, Maschke U. New Series of Hydrogen-Bonded Liquid Crystal with High Birefringence and Conductivity. Molecules. 2024; 29(14):3422. https://doi.org/10.3390/molecules29143422
Chicago/Turabian StyleBen Salah, Manel, Lotfi Saadaoui, Taoufik Soltani, Naoufel Ben Hamadi, Ahlem Guesmi, and Ulrich Maschke. 2024. "New Series of Hydrogen-Bonded Liquid Crystal with High Birefringence and Conductivity" Molecules 29, no. 14: 3422. https://doi.org/10.3390/molecules29143422