Article

Impact of Processing on the Phenolic Content and Antioxidant Activity of Sorghum bicolor L. Moench

by
Aduba Collins
1,
Abishek Santhakumar
1,2,*,
Sajid Latif
3,
Kenneth Chinkwo
1,2,
Nidhish Francis
2,4 and
Christopher Blanchard
1,2
1
School of Dentistry and Medical Sciences, Faculty of Science and Health, Charles Sturt University, Wagga Wagga, NSW 2650, Australia
2
Gulbali Institute, Charles Sturt University, Wagga Wagga, NSW 2650, Australia
3
National Life Sciences Hub, Charles Sturt University, Wagga Wagga, NSW 2650, Australia
4
School of Agricultural, Environmental and Veterinary Sciences, Charles Sturt University, Wagga Wagga, NSW 2650, Australia
*
Author to whom correspondence should be addressed.
Molecules 2024, 29(15), 3626; https://doi.org/10.3390/molecules29153626 (registering DOI)
Submission received: 19 June 2024 / Revised: 19 July 2024 / Accepted: 30 July 2024 / Published: 31 July 2024
(This article belongs to the Special Issue Natural Antioxidants in Functional Food)

Abstract

:
Sorghum, a cereal grain rich in nutrients, is a major source of phenolic compounds that can be altered by different processes, thereby modulating their phenolic content and antioxidant properties. Previous studies have characterised phenolic compounds from pigmented and non-pigmented varieties. However, the impact of processing via the cooking and fermentation of these varieties remains unknown. Wholegrain flour samples of Liberty (WhiteLi1 and WhiteLi2), Bazley (RedBa1 and RedBa2), Buster (RedBu1 and RedBu2), Shawaya black (BlackSb), and Shawaya short black 1 (BlackSs) were cooked, fermented, or both then extracted using acidified acetone. The polyphenol profiles were analysed using a UHPLC-Online ABTS and QTOF LC-MS system. The results demonstrated that combining the fermentation and cooking of the BlackSs and BlackSb varieties led to a significant increase (p < 0.05) in total phenolic content (TPC) and antioxidant activities, as determined through DPPH, FRAP, and ABTS assays. The 2,2′-azino-bis (3-ethylbenzothiazoline-6-sulfonic acid) (ABTS) radical scavenging activity of WhiteLi1, BlackSb, RedBu2, and BlackSs increased by 46%, 32%, 25%, and 10%, respectively, post fermentation and cooking. Conversely, fermentation only or cooking generally resulted in lower phenolic content and antioxidant levels than when samples were fully processed compared to raw. Notably, most of the detected antioxidant peaks (53 phenolic compounds) were only detected in fermented and cooked black and red pericarp varieties. The phenolic compounds with the highest antioxidant activities in pigmented sorghum included 3-aminobenzoic acid, 4-acetylburtyic acid, malic acid, caffeic acid, and luteolin derivative. Furthermore, the growing location of Bellata, NSW, showed more detectable phenolic compounds following processing compared to Croppa Creek, NSW. This study demonstrates that sorghum processing releases previously inaccessible polyphenols, making them available for human consumption and potentially providing added health-promoting properties.

1. Introduction

Increased awareness of the health-promoting benefits of wholegrains has prompted investigations into the benefits of processing for dietary consumption [1,2]. Sorghum whole grains are rich in health-promoting phenolic compounds such as phenolic acids, flavonoids, and anthocyanins, primarily found in varieties with darker pigmentation [3,4]. These compounds possess antioxidant and free radical scavenging properties that have been shown to exhibit a protective role against oxidative stress, inflammation, obesity, and cancer development [5,6,7].
Processing technologies have primarily focused on reducing the anti-nutritional content in sorghum grains. However, food processing techniques have the potential to transform raw materials into edible and nutritious food [8]. Most wholegrains are not consumed raw but go through industrial or domestic processing, impacting their taste, composition, and bioaccessibility. Some of the common food processes include the open-pan boiling, fermentation, and cooking of fermented flour [2]. For example, sorghum porridge, known as “medida” in east African countries, is boiled from a slurry of milled flour [9]. The preliminary step of fermentation changes the porridge’s smell, texture, taste, and phenolic antioxidants [10]. This is due to microbial and enzymatic activity during fermentation that causes the release of bound polyphenols, resulting in variations to the antioxidant activities of sorghum metabolites [11].
Variations in the phenolic profile and antioxidant activities in processed sorghum can also be due to the growing location, processing time, the presence of microbes, and their enzymatic activity [12]. During fermentation, microorganisms, such as Lactobacillus bacteria, can alter the composition of phenolic compounds by producing polyphenol-associated enzymes [13]. These enzymes have been reported to release bound phenols, e.g., tannates, esterases, phenolic acid decarboxylates, and glucosidases [14]. Moreover, cooking can result in the loss of crystalline structures in the starch molecules amylose and amylopectin [15]. As a result, more water is absorbed by the starch molecules, leading to interactions with proteins and polysaccharides and, ultimately, the formation of highly accessible and bioactive water-soluble compounds.
It is crucial to optimise sorghum cooking to improve its nutritional content, mainly phenolic compounds associated with disease prevention. An extensive amount of research has primarily focused on raw sorghum grain polyphenols, with emerging studies on the impact of different processes [16,17]. The findings of this study provide novel insights into the changes in phenolic composition and antioxidant activity of sorghum grain polyphenols after processing via cooking, fermentation, and a combination of both. Furthermore, an appropriate selection of sorghum genotypes and processing methods that inform the consumer market for foods with notable health benefits is warranted. Therefore, this study aimed to determine the effect of various cooking and processing techniques on the phenolic content and antioxidant activity of eight pigmented and non-pigmented sorghum varieties. A UHPLC-online ABTS system coupled with QTOF LC-MS was also used to identify and quantify phenolic compounds in the processed and unprocessed sorghum varieties. This study provides a comprehensive understanding of the impact of various sorghum cooking and preparation techniques for optimum use for human consumption with added health benefits.

2. Results and Discussion

2.1. Impact of Processing on Total Phenolic Content (TPC)

The eight sorghum varieties investigated exhibited a significant variation in TPC when compared to a gallic acid standard curve p < 0.05 (Table 1, Figure 1). Raw BlackSs had the highest TPC at 9.66 ± 1.66 mg/g GAE. An increase in TPC to 10.93 ± 0.85 mg/g GAE was observed post fermentation and cooking. A similar trend was observed in BlackSb, which had the second highest TPC at 6.67 ± 0.64 mg/g GAE in raw extracts. The TPC of BlackSb also increased to 6.86 ± 0.73 mg/g GAE following fermentation and cooking (Table 1). In comparison, the TPC of RedBa2 and WhiteLi1 did not change after fermentation and cooking (0.56 ± 0.04 mg/g GAE to 0.55 ± 0.12 mg/g GAE and 0.33 ± 0.01 mg/g GAE to 0.34 ± 0.11, respectively) (Table 1). The fermentation process increased the TPC of BlackSb, RedBa1, and WhiteLi1 (Table 1). Cooking decreased the TPC for all pigmented varieties except for RedBa1 (0.50 ± 0.13 mg/g GAE to 0.67 ± 0.25 mg/g GAE). These TPC findings suggest that sorghum processing causes a breakdown in the structural characteristics of some phenolic compounds, thereby increasing their accessibility for detection [18]. The mechanism of action during the cooking process is likely due to the starch content in sorghum grains expanding, becoming compressed with increasing temperatures and producing amylose [15]. Additionally, part of the starch granules can then form starch–lipid complexes that can interfere with the hydrolysis of bioactive compounds, explaining the decrease in TPC [14,19]. However, during the fermentation process, live microorganisms such as Lactobacillus bacteria are introduced [13]. These bacteria can result in the biotransformation of polyphenols and the production of enzymes that release bound phenols [16]. Furthermore, it is evident that the combined cooking and fermentation processes had the most favourable outcome due to the release of the bound polyphenols from starch molecules and pH modifications after fermentation [20].
The variation in the TPC of sorghum primarily depends on pericarp pigmentation, genotype, and, as previously demonstrated, susceptibility to environmental conditions at different growing locations [21]. In addition, extraction methods using solvents such as ethanol or hexane also contribute to variations in TPC levels [22,23]). A study by Wu et al. (2017) [24] used an 80% aqueous methanol extraction method to obtain free phenolics. In comparison, the current study used an acidified acetone extraction method (70% acetone, 29.5% water, and 0.5% acetic acid) and found raw TPC levels to be slightly lower for BlackSs. However, the TPC of fermented cooked BlackSs increased, demonstrating that the fermentation and cooking processes have a greater impact on phenolic concentrations despite the extraction solvents used.

2.2. Total Proanthocyanidin Content (TPAC)

Commonly known as proanthocyanidins, tannins and condensed tannins have been reported in darker-pigmented sorghum varieties in high quantities [25,26]). The current study determined that the fermented and cooked processes increased the TPAC for all varieties when compared to a catechin standard curve (p < 0.05) except for BlackSs when compared to raw samples (8.38 ± 0.44 mg/g CE to 7.05 ± 0.58 mg/g CE) (Table 1, Figure 1). Despite cooking decreasing the TPAC of BlackSs by 50% (8.38 ± 0.44 mg/g CE to 4.88 ± 0.67 mg/g CE), the fermentation process increased the cooked TPAC of BlackSs (4.88 ± 0.67 mg/g CE, 6.44 ± 0.03 mg/g CE and 7.05 ± 0.58 mg/g CE, respectively). Interestingly, RedBa2 and RedBu2 showed higher TPAC concentrations for the fermented cooked processes than RedBa1 and RedBu1. The variations in TPAC are presumably due to the release and detection of cell-wall-bound proanthocyanidins, leading to the synthesis of free forms of various bioactive compounds [27]. A study demonstrated that red sorghum processing decreased TPAC by 64% then increased it by 52% depending on the technique used [28]. The degradation of proanthocyanidin oligomeric species into smaller and more-soluble monomeric and dimeric units was determined as the mechanism of action. Susanti et al. (2021) [17] also determined that processing red sorghum via extract encapsulation increased the proanthocyanidin content from 9.11 mg/g to 9.23 mg/g. Therefore, the changes to TPAC as a result of processing in the current study agree with the range of values described in the literature.

2.3. Post Processing Variation in Antioxidant Activity

Three antioxidant assays, including ABTS, DPPH, and FRAP, were used to determine the overall antioxidant and radical scavenging activity of eight sorghum varieties. Fermented and cooked sorghum samples exhibited a significant increase in ABTS for all eight varieties (p < 0.05). WhiteLi1 showed a two-fold increase in antioxidant activity (0.25 ± 0.05 mg 100−1 TE to 0.54 ± 0.07 mg 100−1 TE) followed by BlackSb (32%) and RedBu2 (25%) after combining fermentation and cooking (Table 1). Cooking also increased the antioxidant activity of all varieties; however, BlackSs showed a 30% decrease in ABTS. A possible explanation for the increased ABTS is that darker-pigmented varieties of sorghum lack or contain low levels of the starch components amylose and amylopectin, which can be attached to bound polyphenols. A study reported that the starch content of sorghum varies greatly between 32.1 and 72.5 g/100 g [29]. Rather than releasing the antioxidants, the high temperatures during cooking may degrade, causing a loss of water-soluble compounds [13]. The production of melanoidins via the “Maillard reaction” has also been reported as a by-product of amino acids reacting with sugars when food is cooked at high temperatures [30]. These compounds can decrease phenolic recovery due to heat-induced degradation of flavonols. Interestingly, BlackSb did not exhibit a decrease in antioxidant activity, demonstrating that this sorghum variety may contain compounds with structural bonds that can withstand high temperatures during cooking.
The DPPH results demonstrated significant differences in antioxidant activity (p < 0.05). Similar to the ABTS, six of the eight sorghum varieties demonstrated a surge in DPPH following fermentation and cooking (Table 1). Despite the two red varieties, RedBa1 and RedBu1, exhibiting a decrease in DPPH when fermented and cooked, their antioxidant activities increased when compared to fermentation alone (1.99 ± 0.17 mg/g TE to 2.33 ± 0.12 mg/g TE and 1.80 ± 0.17 mg/g TE to 2.15 ± 0.15 mg/g TE, respectively). It is reasonable to assume that the cultivation location (Bellata, NSW) influenced the DPPH of the detectable phenolic compounds despite the implementation of the different processes used. Bianco-Gomes et al. (2022) [31] and Adebo et al. (2018) [32] have reported similar results of heat-processing and fermentation, causing an increase in radical scavenging activity. These processes induce the liberation of structurally bound phenolic compounds in addition to hydrolysis and depressurisation at the end of the heating process.
The FRAP radical scavenging activity of the processed sorghum varieties was determined by their ability to reduce Fe (III). The fermented cooked process exhibited the greatest radical scavenging activity in seven sorghum varieties (p < 0.05) (Table 1). BlackSb, RedBu1, WhiteLi1, and WhiteLi2 showed the highest antioxidant activity, increasing by 40–60% when fermented and cooked. RedBa2 remained unchanged at FRAP values of 5.56 ± 0.04 mg/g TE to 5.53 ± 0.65 mg/g TE and decreased when fermented only (5.56 ± 0.04 mg/g TE to 4.55 ± 0.72 mg/g TE); however, this was not a significant variation. Fermentation alone also significantly decreased FRAP in BlackSs by 32%, demonstrating that the altered pH from the resultant acid production may cause a loss in detectable phenolic compounds. Unexpectedly, ferric reducing ability was increased when cooking alone was implemented for all eight varieties, with the highest FRAP value found for BlackSs (23.27 ± 3.50 mg/g TE to 28.57 ± 2.22 mg/g TE), followed by BlackSb (7.29 ± 1.26 mg/g TE to 9.13 ± 1.55 mg/g TE) and RedBa1 (6.69 ± 0.66 mg/g TE to 8.24 ± 1.46 mg/g TE). Zaroug et al. (2014) [33] reported an increase in FRAP radical scavenging activity after red pericarp sorghum dough baking but varied results after fermentation for 24 h and then 32 h (gradual increase, then a 45% decrease). A recent study also found similar FRAP results for processed pigmented red and non-pigmented white pericarp sorghum varieties [28]. The results in the current study differed from the mentioned studies as the processing technologies implemented increased the antioxidant and radical scavenging activity of all eight varieties, especially the black varieties. This suggests that the influence of domestic cooking techniques exhibits favourable outcomes in some sorghum varieties over others. Similar to the other assays, we hypothesise that the disruption to the cell wall matrix of high-molecular-weight compounds provides phenolic accessibility for extraction to occur, revealing highly detectable compounds [34].

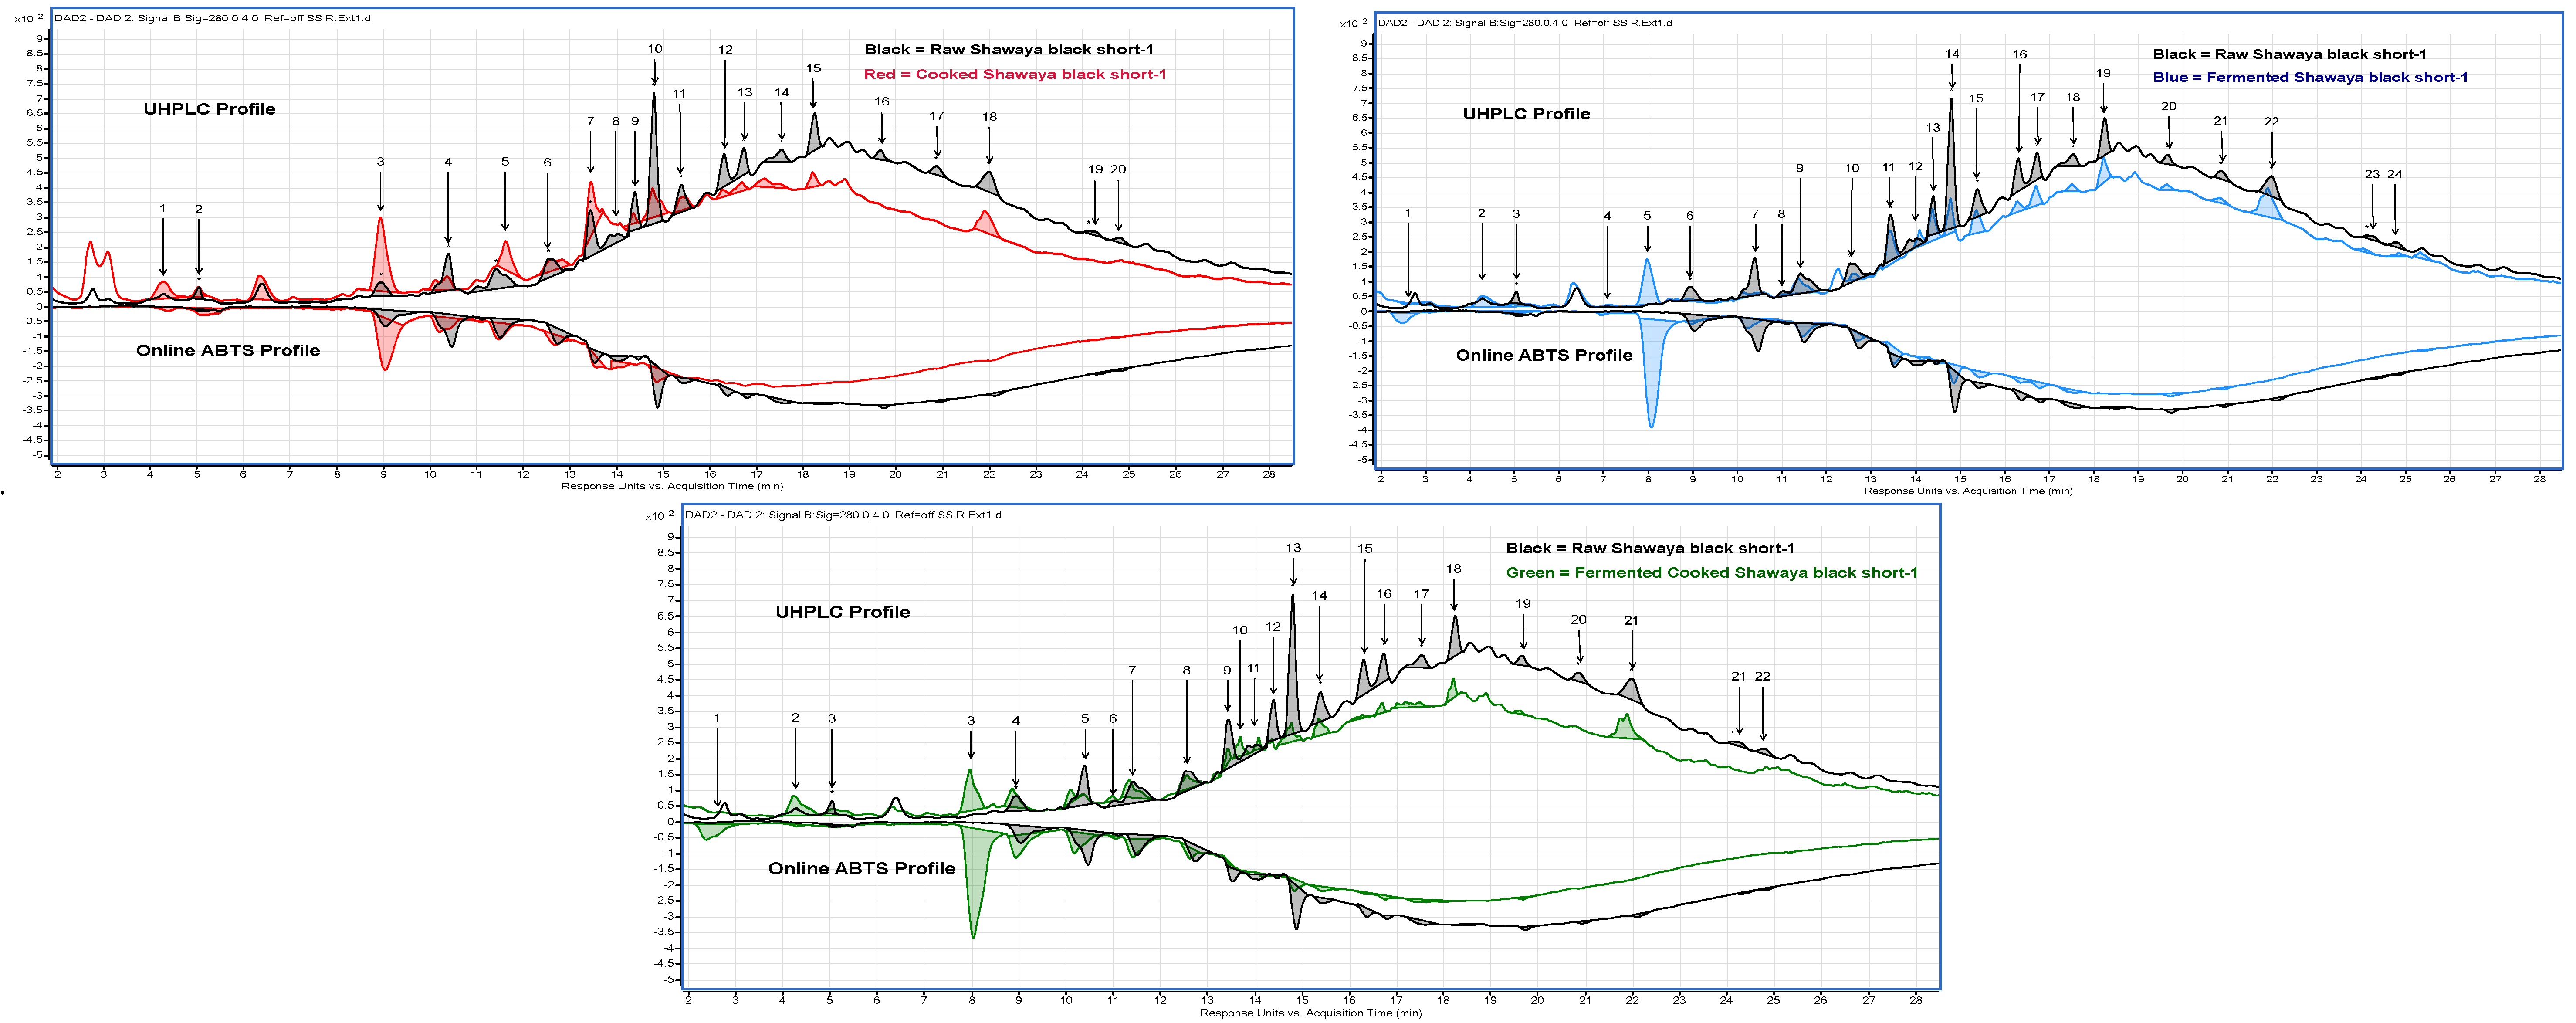
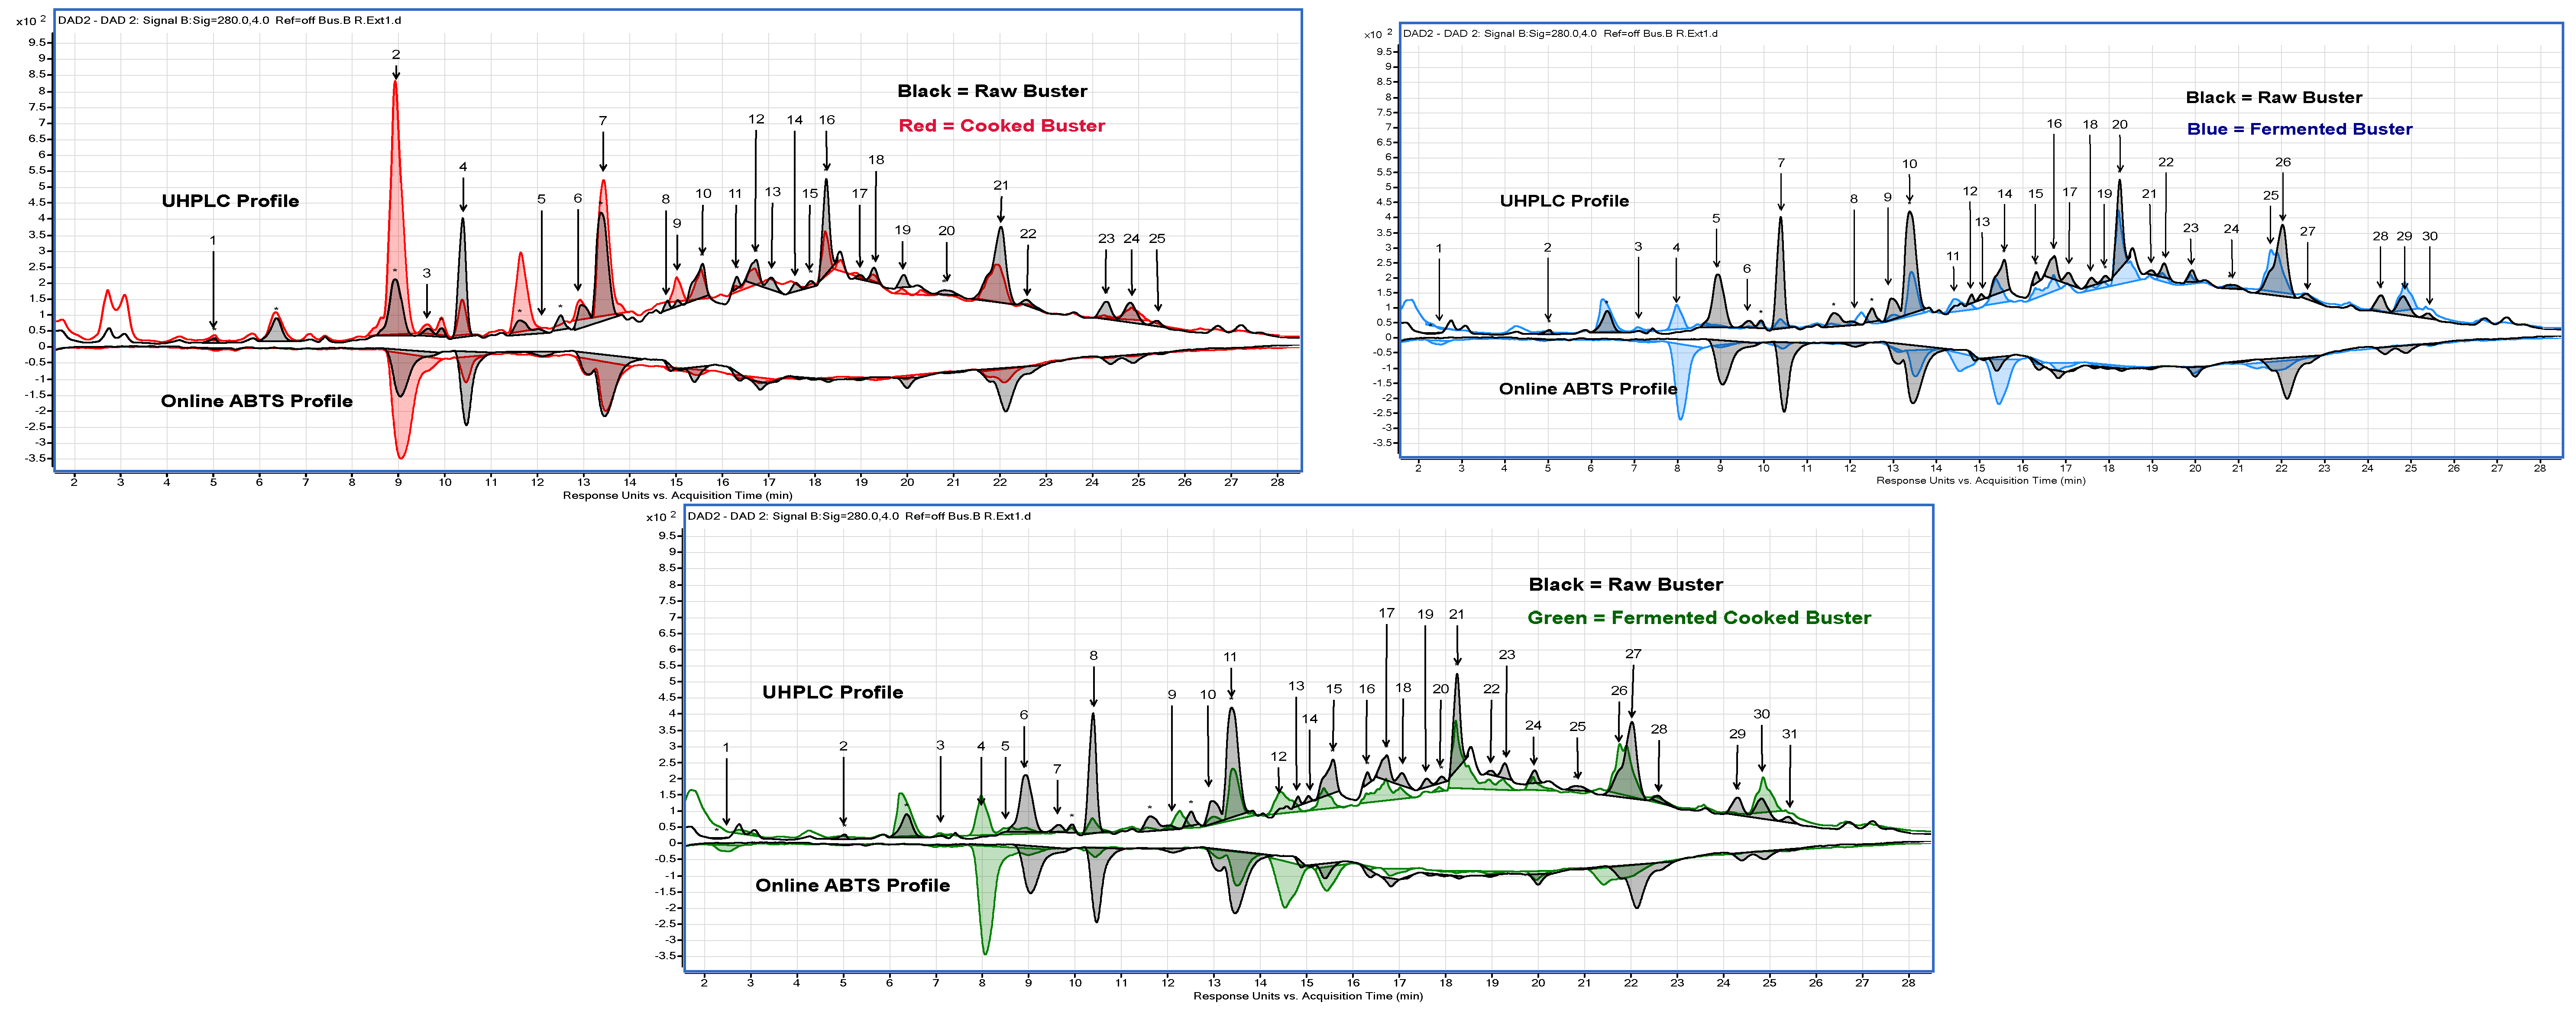
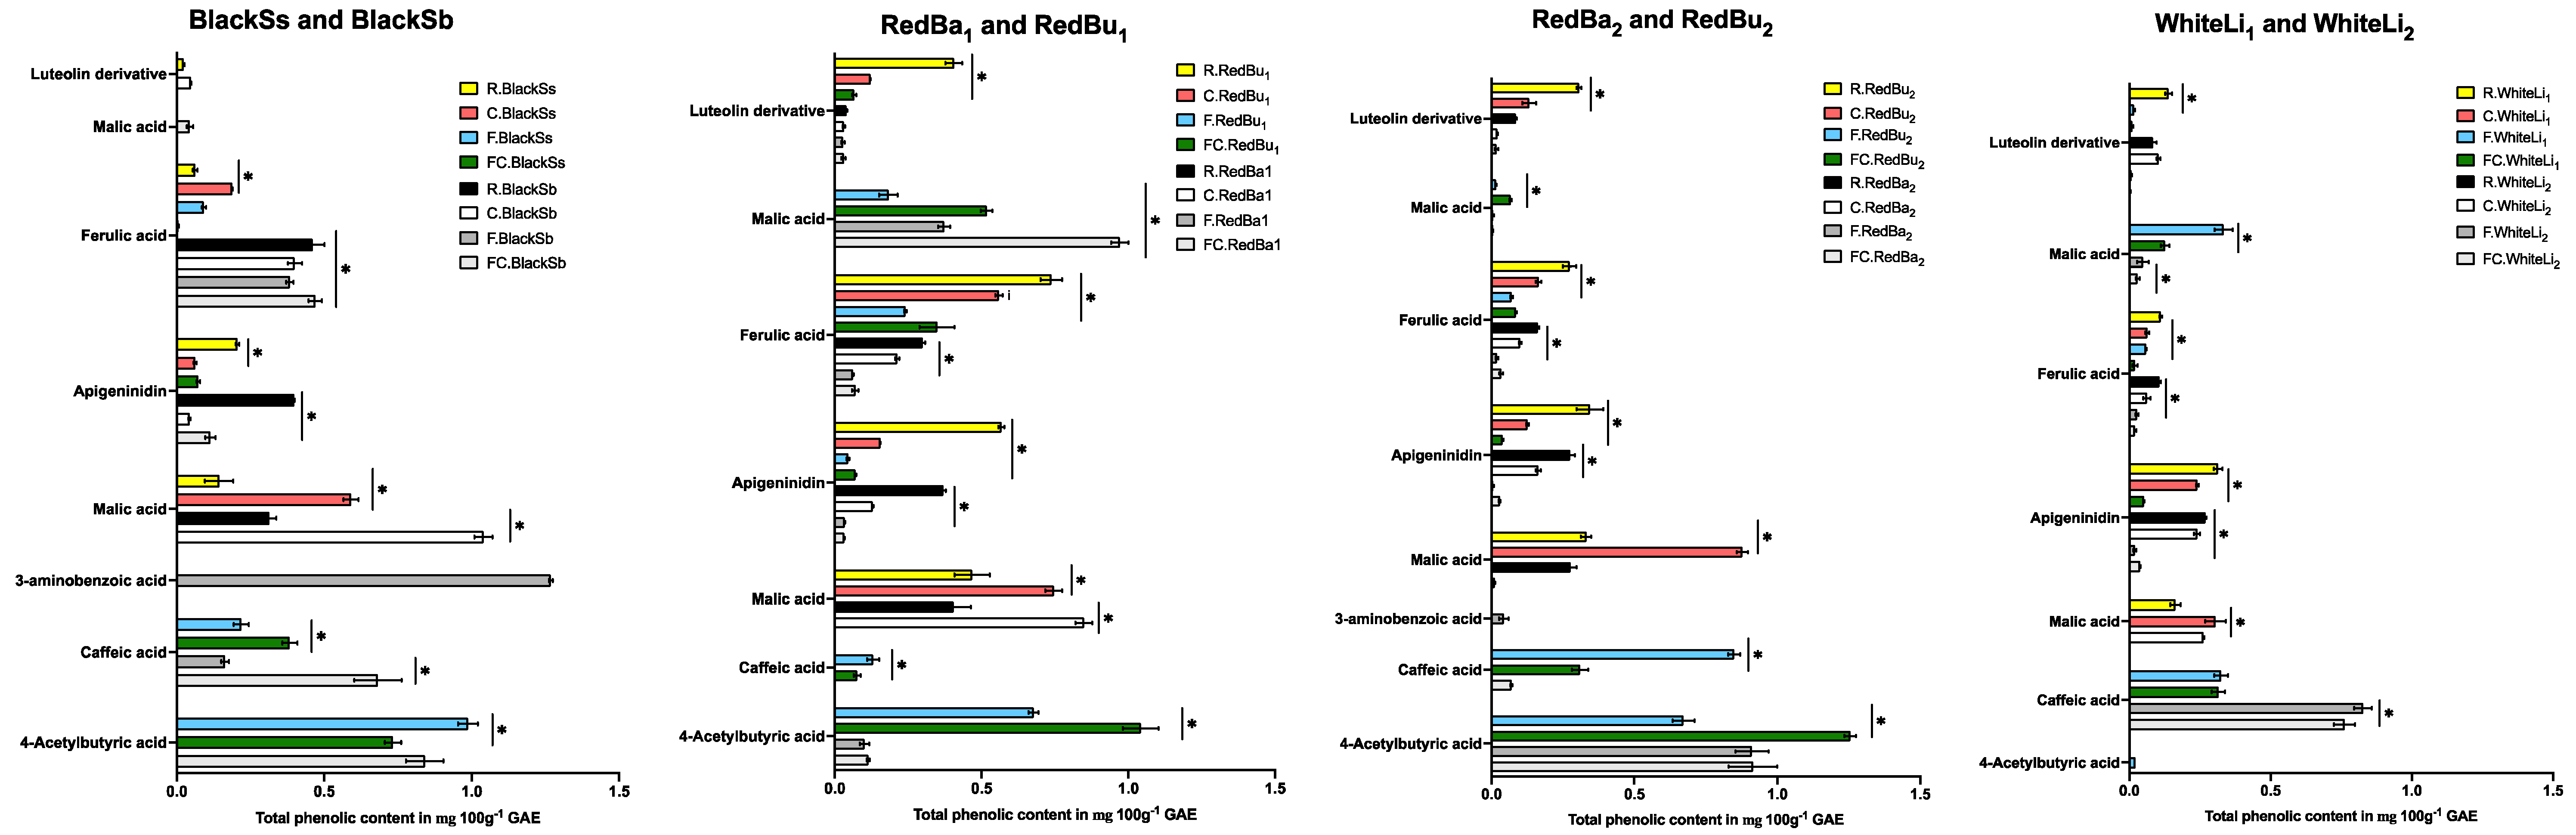
2.4. Quantification and Identification Using UHPLC with Online ABTS and QTOF LC-MS

The UHPLC-online ABTS characterisation of the eight sorghum varieties exhibited a significant variation in total phenolic content and antioxidant activity (p < 0.05). Cooking, fermentation, and a combination of both processes showed a higher number of different phenolic compounds in the black sorghum varieties than in red and white. A total of 87 peaks were identified (Table 2 and Figure 2, Figure 3 and Figure 4) across the eight varieties with measurable antioxidant activity. Out of these, only seven phenolic compounds were retained from the raw extracts and throughout the fermentation and cooking processes. These compounds were trans-resveratroloside, catechin, glucomalcomiin, luteolin-7-O-glucoside, taxifolin, voacamine, and taxifolin-O-pentoside. Most of the peaks (53 phenolic compounds) were detected only after processing either with cooking, fermentation, or both. The compound 3-aminobenzoic acid (peak 22 and 56) was the major polyphenol detected following fermentation. This compound was detected in fermented or fermented cooked RedBa2, RedBu1, and WhiteLi1 and with abundance in the BlackSb variety at 1.27 ± 0.01 mg 100 g−1 GAE (Figure 5). The phenolic compound 4-acetylbutyric acid (peak 20) was primarily detected in fermented cooked samples and was abundant in fermented cooked RedBu2. The TPC of this compound increased in RedBu1 and RedBu2 by two-fold from 0.68 ± 0.02 to 1.04 ± 0.06 and 0.67 ± 0.04 to 1.26 ± 0.02 mg 100 g−1 GAE, which correlates with the benchtop TPC results in Table 1. Ferulic acid (peak 43) was the major compound in all the raw sorghum samples (Figure 5). This compound was detected in all sorghum varieties for all processing techniques, with the most abundant amount detected in raw RedBu1 and fermented cooked BlackSb at 0.74 ± 0.04 and 0.47 ± 0.02 mg 100 g−1 GAE. Eighteen compounds were detected in all sorghum varieties, including apigeninidin (peak 31) and n’.n’-dicafferoylspermidine (peak 42). However, several processed samples of BlackSs, BlackSb, RedBu2, RedBa2, and WhiteLi1 did not have detectable amounts of these compounds. Caffeic acid (peak 21) was the most abundant in fermented RedBu2 at 0.85 ± 0.02 followed by fermented and fermented cooked WhiteLi2 at 0.83 ± 0.03 and 0.76 ± 0.04 mg 100 g−1 GAE, respectively. Malic acid (peak 24 and 46) was the major compound in cooked sorghum samples; it was abundant in cooked BlackSb at 1.04 ± 0.03 mg 100 g−1 GAE and, secondly, in fermented cooked RedBa1 at 0.97 ± 0.03 mg 100 g−1 GAE. Only four compounds were identified exclusively after cooking the black and red sorghum varieties—vanillin, luteolin derivative, eriodictyol deoxyhexoside, and apigenin.
The numbers in the level of ID column indicate the source of tentatively identified compounds. The number 1 indicates that the compound was identified using a standard; 2 indicates that the compound was identified using Massbank (Massbank, 2006) database; 3 indicates that the compound was identified using the Chemspider (Chemspider, 2024) database; 4 indicates that the compound was identified using the PubChem (PubChem, 2024) database; 5 indicates that the compound was identified using the Metlin (Metlin, 2006) database.Antioxidant activity was higher in processed sorghum extracts compared to raw (Figure 6). The highest antioxidant activity was exhibited by 3-aminobenzoic acid (peak 22) and 4-acetylbutyric acid (peak 20) in fermented BlackSb and fermented cooked RedBu2 at 0.38 ± 00 and 0.32 ± 0.02 mg 100 g−1 TE, respectively. Luteolin derivative (peak 80) reduced in antioxidant activity following processing in all varieties except for RedBa1 and WhiteLi2, which did not change. The antioxidant activity of caffeic acid (peak 21) in RedBa2 and WhiteLi2 also did not change following fermentation and cooking. In the varieties BlackSb, RedBa2, RedBu1, and WhiteLi1, the concentration of 3-aminobenzoic acid (peak 56) increased, which resulted in a decrease in malic acid (peak 46).
These phenolic compounds displayed opposite peak sizes when samples were fermented and then cooked (Figure 3 and Figure 4), suggesting that processing influences certain compounds’ free radical scavenging activity in connection to others. Generally, cooking causes a reduction in the phenolic content and antioxidants. However, the fermentation step generally resulted in increased, or retention of, total phenolic content and the antioxidant activity of some sorghum polyphenols. Several compounds were identified only due to the application of cooking or fermentation or both.
Similar to other cereal processes, fermentation of sorghum flour leads to a modification in integral metabolites, a decrease in pH, increased microbial activity, and the activation of enzymes [11]. These enzymes can hydrolyse the β-glucosidic bonds of various phenolic compounds present as conjugates with sugar residues linked to hydroxyl groups [18]. The proposed mechanism of action is the breakdown of the cell wall matrix by the secretions of fermenting microbes. Furthermore, it can be hypothesised that the microbial action by Lactobacillus strains and other aerobic microflora during fermentation led to the changes in antioxidant activities in our study [16]. Additionally, it has been reported that shelf life, aroma, and structural changes are also apparent due to fermentation [18]. In the current study, the flour samples contained distinct differences following processing, such as a finer texture, colour change, and a noticeable scent. Investigations by Zaroug et al. (2014) [33] used 8, 16, 24, and 32 h fermentation time points and determined that total phenol, tannins, and flavonoids content increased with longer fermentation periods. This observation agrees with the current study, which used 48 h as the maximum fermentation time.
The total phenolic content of the eight raw sorghum varieties observed in this study was similar to the values reported in the literature (16,35]. Our study detected a greater number of different polyphenols scarcely identified in unprocessed sorghum grains. These include stilbenes, such as trans-piceid and trans-resveratroloside, which were detected in RedBa1, RedBu1, and RedBu2. Also, catechin and its isomers were only detected in BlackSb and BlackSs. The current study observed the radical scavenging activity in the black sorghum varieties, predominantly attributed to various concentration changes for malic acid, 3-aminobenzoic acid, and 4-acetylbutyric acid. In contrast, Punia et al. (2021) [27] observed higher antioxidant activities for caffeic acid, taxifolin, and apigeninidin, which were also identified in the current study. However, these compounds were not as greatly affected by processing.
It has been reported that food processing depends upon factors such as cultivation conditions and the genotype of the grain [8]. The composition of polyphenols varied not only between the processes implemented but also between the same varieties from different growing locations. Three major differences were observed: the detection of gallic acid (peak 11) in only one white variety (WhiteLi1), linoleic acid (peak 15) in one red variety (RedBa1), and epicat-(4beta → 6)-epicatechin-(2beta → 7,4beta → 8)-epicatechin (peak 58) in one red variety (RedBu1), all of which were grown in Bellata, NSW. Therefore, the growing location could have a major impact on the different compounds present in grain samples and their potential to be released after food processing. Interestingly, the polyphenols detected in each sorghum sample varied in number with respect to the processing technique, e.g., raw, cooked, fermented, and fermented cooked BlackSs had 22, 23, 16, and 21 compounds, respectively. A similar trend was observed for other varieties; however, the antioxidant concentrations generally increased. As previously mentioned, a possible explanation is the breakdown of polymers and covalent bonds, allowing for the observation of otherwise undetectable polyphenols.
Food processing has had a negative reputation for reducing the nutritional benefits of functional foods [9]. However, cooked sorghum, with or without the fermentation step, has the potential to be introduced into the human diet due to its diverse range of bioactive compounds. Potential health benefits are attributed to several of the detected flavonoid compounds identified in this study. For example, apigeninidin and ferulic acid have been attributed to reducing oxidative stress and the onset and development of gastrointestinal cancers [7]. In this study, we have demonstrated that the fermentation and cooking processes can provide higher accessibility to compounds with known health benefits in sorghum grains. In contrast to the study by Hithamani and Srinivasan (2014) [9], the current study showed that the concentration of ferulic acid was retained following cooking, fermentation, and a combination of both. This compound has been reported to reduce tumour-promoting inflammatory markers and decrease cancer cell growth in vivo [35,36]. Several compounds that were identified have yet to be studied for their biological activity, particularly those detected only after one or more processes were applied to the sorghum samples.

3. Materials and Methods

3.1. Materials

3.1.1. Samples

Eight different pigmented sorghum (Sorghum bicolor L. Moench) grains were used for experimentation. One Liberty white and two Bazley and Buster red varieties (WhiteLi1, RedBa1, RedBu1) were grown in 2021 in Bellata, New South Wales, as part of the New South Wales Department of Primary Industries (DPI) field trials. Identical varieties were grown in 2021 in Croppa Creek, New South Wales (WhiteLi2, RedBa2, RedBu2). The black varieties Shawaya short black-1 and Shawaya black (BlackSs and BlackSb) were grown in 2021 glasshouse trials conducted at the Hermitage Research Facility, Warwick, Queensland, by the Department of Agriculture and Fisheries. All sorghum samples were collected at maturity and stored in cold rooms at 4 °C. Experimental analysis for biological and technical replicates was conducted in triplicate.

3.1.2. Standards and Reagents

Chemicals were purchased from Chem Supply Pty Ltd. (Port Adelaide, SA, Australia), ThermoFisher (Scoresby, VIC, Australia), or Sigma-Aldrich (St. Louis, MO, USA).
Hexane, acetone, acetic acid, methanol, sodium carbonate, potassium persulfate, hydrochloric acid, and sulphuric acid were obtained from Chem Supply Pty Ltd. Trolox (6-Hydroxy-2,5,7,8-tetra-methylchroman-2-carboxylic acid), DPPH (2,2-diphenyl-1-picrylhydrazyl), Folin–Ciocalteu reagent, TPTZ (2,4,6-tris(2-pyridyl)-s-tria-zine), ABTS (2,2′-azino-bis (3-ethylben-zothiazoline-6-sulfonic acid), iron (III) chloride, formic acid, peonidin 3-O glucoside chloride, delphinidin chloride, apigenin, petunidin 3-O glucoside, luteolin, procyanidin B3, cyanidin-3-O glucoside, procyanidin B1, phosphotungstic acid, isovanillic acid, hippuric acid, gallic acid, protocatechuic acid, syringic acid, vanillic acid, ellagic acid, trans-cinnamic acid, o-coumaric acid, caffeic acid, p-coumaric acid, phlorodizin, sinapic acid, chlorogenic acid, rutin, catechin, naringenin, coumarin, quercetin, ferulic acid, and vanillin were purchased from Sigma-Aldrich.

3.2. Methods

3.2.1. Flour Preparation

Sorghum flour was obtained by finely grinding wholegrain sorghum with a 0.5 mm sieve in a Retsch Ultra Centrifugal Mill ZM 200 (Haan, North Rhine-Westphalia, Germany). Sorghum flour was defatted three times with hexane at a ratio of 1:20 (w/v) and air-dried overnight. Defatted, raw sorghum flour samples were stored at 4 °C for subsequent processing.

3.2.2. Cooking of Sorghum Flour

The cooking method by Proietti et al. (2013) [37] was used to obtain sorghum porridge samples. A slurry was obtained by mixing 10 g of each previously prepared flour sample with 20 mL of sterile water. The slurry was added to 80 mL boiling water with constant stirring for 10 min at approximately 95 °C to obtain porridge then cooled in a water bath for 5 min. Cooled sorghum porridge samples were lyophilised at −80 °C in a Model Alpha 2–4 LD Plus Christ freeze dryer (Biotech International, Kaltenkirchen, Germany), and the resultant dry samples were stored at 4 °C for subsequent analysis.

3.2.3. Fermentation of Sorghum Flour

The fermentation process method for this study was performed according to traditional methods as commonly practiced in African countries [38]. Briefly, eight varieties of sorghum flour (10 g each) were mixed with 20 mL of cool sterilised water to obtain a slurry. The mixtures were covered, sealed, and left to ferment at room temperature (25 °C) for 48 h with the natural microflora to pH 4. To stop the fermentation process, 80 mL of cool sterilised water was added to each mixture to obtain a ratio of 1:10 (w/v). The samples were lyophilised at −80 °C in a Model Alpha 2–4 LD Plus Christ freeze dryer (Biotech International, Germany), and the resultant dry samples were stored at 4 °C for subsequent analysis.

3.2.4. Cooking of Fermented Sorghum Flour

To obtain fermented cooked sorghum samples, a combination of the methods by Correia et al. (2010) [38] and Proietti et al. (2013) [37] was used. As mentioned, defatted flour samples were fermented for 48 h at room temperature (25 °C). Following lyophilisation, 10 g of fermented, dry samples was mixed with 20 mL of sterile water, and the slurry was added to 80 mL of boiling water. The samples were lyophilised at −80 °C in a Model Alpha 2–4 LD Plus Christ freeze dryer (Biotech International, Germany), and the resultant dry samples were stored at 4 °C for subsequent analysis. For each sorghum variety, four samples were obtained: R (raw), C (cooked), F (fermented), and FC (fermented cooked). All sample preparations were performed in triplicate.

3.2.5. Polyphenol Extraction

The extraction technique was adopted from earlier studies conducted by our research group [39]. An extraction solvent of acetone, water, and acetic acid solution (70:29.5:0.5 v/v/v) was added at a ratio of 1:10 (w/v) to the defatted R, C, F, and FC flour samples. The mixture was stirred for 1 h at room temperature (25 °C), and the mixtures were centrifuged at 4000 rpm for 10 min at room temperature and pooled to collect the supernatants. This step was repeated three times to a total volume of 30 mL per gram of sample. Acetone was removed via rotary vacuum evaporation (Rotavapor R-210 BUCHI Labortechnik, Flawil, Switzerland) at 50 °C. The remaining liquid in the samples was then frozen at −80 °C then freeze-dried (Christ-Alpha 2–4 LD Plus freeze dryer, Biotech International, Germany) and stored at −20 °C until further analysis. For analysis, dried sorghum extracts were reconstituted in 50% methanol and later stored at −20 °C. The extraction procedure was performed in triplicate for all samples.

3.2.6. Total Phenolic Content

Total phenolic content was determined via the method described by Noreen et al. (2017) [40] with slight modifications. Briefly, 125 μL of reconstituted sorghum extract was mixed with 125 μL Folin–Ciocalteu reagent and 500 μL of deionised water and incubated in the dark for 6 min. Following incubation, 1.5 mL of 7% sodium carbonate and 1 mL of deionised water were added to neutralise the reaction. After a 90 min incubation period at room temperature in the dark, samples were transferred to 96-well plates and the absorbance was measured at 760 nm using a microplate reader (BMG Labtech Fluostar Omega, Offenburg, Germany). A gallic acid standard curve (Figure 1) was used for the quantification of phenolic content of the samples, and the data were expressed as mg/g gallic acid equivalents (GAE). Analyses were conducted in triplicate for each replicate.

3.2.7. Total Proanthocyanidin Content (TPAC)

The vanillin assay was used for this study as adapted from Min et al. (2011) [41] to quantify proanthocyanidins. A 200 μL aliquot of reconstituted sorghum extract was combined with 500 μL of 1% (w/v) vanillin in methanol and 500 μL of 25% sulphuric acid in methanol. The mixture was then incubated at 37 °C for 15 min. After incubation, absorbance was measured at 500 nm on a microplate reader (BMG Labtech Fluostar Omega, Offenburg, Germany). Total proanthocyanidins content was quantified using a (+)-catechin standard curve (Figure 1) and the content in the samples was expressed as mg/g (+)-catechin equivalents (CE). Analyses were conducted in triplicate for each replicate.

3.2.8. DPPH Radical Scavenging Activity

The DPPH (1,1-diphenyl-2-picrylhydrazyl, Sigma-Aldrich, Burlington, MA, USA) radical scavenging activity was determined using the method adapted from [42] with slight modifications. Briefly, 200 μL of reconstituted sorghum samples were mixed with 800 mL of 0.2 mM DPPH solution dissolved in 99.9% methanol, left to react for 30 min, and the absorbance was measured at 520 nm (Thermo Scientific Co. Ltd., Waltham, MA, USA). DPPH scavenging activity was expressed in mg of TE per g. A Trolox standard curve was used to quantify DPPH antioxidant activity, and the data were expressed as mg/g Trolox equivalents (TE). Analyses were conducted in triplicate for each replicate.

3.2.9. Ferric Reducing Ability of Plasma (FRAP) Assay

The FRAP assay method described by Sompong et al. (2011) [43] was used with minor modifications. Freshly prepared FRAP reagent consisting of 100 mL acetate buffer (300 mM, pH 3.6), 10 mL FeCl3·6H2O (20 mM), and 10 mL TPTZ solution (10 mM TPTZ in 40 mM HCl) in a ratio of 10:1:1 was used. A 1.8 mL aliquot of FRAP reagent was combined with 180 μL of deionised water, and 60 μL of reconstituted sorghum extract was then gently vortexed. The mixture was incubated for 40 min at 37 °C. Following incubation, absorbance was recorded at 593 nm using a microplate reader (FLUOstar Omega microplate reader, BMG Labtech, Offenburg, Germany). A Trolox standard curve was used to quantify FRAP antioxidant activity, and the data were expressed as mg/g Trolox equivalents (TE). Analyses were conducted in triplicate for each replicate.

3.2.10. ABTS Radical Scavenging Activity

The antioxidant activity of the sample was measured by ABTS (2,20-azino-bis-3-ethylbenzo-thiazoline-6-sulphonic acid, Sigma-Aldrich) radical scavenging activity according to Woo et al. (2014) [44]. The assay was designed to quantify the antioxidant activity of the collective phenolic compounds in crude sorghum extracts. Briefly, 50 µL of the sample was mixed with 1 mL of a diluted ABTS solution, left to react for 30 min at room temperature, and then the absorbance was measured at 734 nm wavelength (Thermo Scientific Co., Ltd., USA). ABTS scavenging activity was expressed in mg 100 g−1 TE (Trolox equivalent). A Trolox standard curve was used to quantify ABTS radical scavenging activity, and the data were expressed as mg 100 g−1 Trolox equivalents (TE). Analyses were conducted in triplicate for each replicate.

3.2.11. UHPLC with Online ABTS

Polyphenol characterisation was conducted using the method by García-Villal et al. (2016) [45] using an Agilent UHPLC (Agilent Technologies, Santa Clara, CA, USA) system with a Zorbax Eclipse Plus C18 column (2.1 mm × 50 mm, 1.8 μm) (Agilent Technologies, CA, USA). The UHPLC system was connected to an autosampler and UV-vis photodiode array detector (PDA). The system was equipped with an exterior binary pump, coil column, and UV-vis detector injecting ABTS solution at a flow rate of 0.6 mL min−1. Mobile phase A consisted of deionised water and 0.01% formic acid. Mobile phase B consisted of acetonitrile with 0.01% formic acid. Reconstituted sorghum extracts (20 μL) were injected into the system at an elution gradient of 0–34.98 min, 0–50% A and B; 34.98–37.21 min, 100% B; and 37.31–39.65 min, 100% B. The absorbance was measured at 280 nm for polyphenols, and antioxidant activity of individual polyphenols was determined at 414 nm after passing through the UHPLC system. Trolox was used to quantify the ABTS radical scavenging activity and was expressed as mg 100 g−1 Trolox equivalents (TE). Peaks were identified using retention time, peak spectra, and standards. Identified peaks were quantified with their respective standards, and unidentified peaks were quantified as mg 100 g−1 GAE [46,47].

3.2.12. Compound Identification Using QTOF LC-MS

Mass spectra of the unknown peaks were determined using the aforementioned UHPLC System connected to an Agilent 6530 Accurate-Mass Q-TOF LC/MS (Agilent Technologies, CA, USA). Peak identification was performed in negative mode; capillary and nozzle voltage was set at 3.5 kV and 500 V, respectively. A complete mass scan ranging from m/z 50 to 1500 was conducted. Agilent Mass Hunter Qualitative Analysis software version B.07.00 was used to extract time of flight mass spectra, and compounds of the unknown peaks were tentatively identified using the standards listed in 2.1.2 and databases such as ChemSpider (2024) [48], PubChem (2024) [49], Massbank (MassBank, 2006) [50], and Metlin (2006) [51].

3.2.13. Statistical Analysis

Statistical analysis was performed using one-way analysis of variance (ANOVA), followed by post hoc Tukey’s multiple comparisons test using GraphPad Prism 9 software (GraphPad Software Inc., San Diego, CA, USA). The results are reported as mean ± standard deviation. Statistical significance was determined at a level of p < 0.05.

4. Conclusions

This study demonstrated that processing by cooking with prior fermentation increases the accessibility of bound polyphenols, resulting in an increase in TPC, antioxidant, and radical scavenging activity across the eight varieties investigated. Additionally, the cultivation location (Bellata, NSW) of the white and red pericarp varieties showed a higher number of detectable phenolic compounds. The use of these processing techniques could provide a great number of polyphenols that are readily accessible for human consumption and contain a more diverse range of flavonoids. Despite the many identified phenolic compounds, further investigations are required to determine their bioaccessibility and bioavailability. Furthermore, since some of the compounds identified are yet to be studied for their bioactivity, in vivo dietary intervention studies are warranted to determine the health-promoting effect of processed sorghum foods.

Author Contributions

Conceptualization, A.C., A.S., N.F. and C.B.; Data curation, A.C. and A.S.; Investigation, A.C.; Methodology, A.C., A.S., S.L. and C.B.; Supervision, A.S., K.C., N.F. and C.B.; Writing—original draft, A.C.; Writing—review and editing, A.C., A.S., S.L., K.C., N.F. and C.B. All authors have read and agreed to the published version of the manuscript.

Funding

This work was supported by funding provided by the Gulbali Accelerated Publication Scheme (GAPS).

Data Availability Statement

The original contributions presented in the study are included in the article, further inquiries can be directed to the corresponding authors.

Acknowledgments

The authors thank David Jordan and Alan Cruickshank from the Hermitage Research Facility, QLD, for their assistance in sourcing the black sorghum samples. We also would like to thank Michael Laughlin for his invaluable technical assistance.

Conflicts of Interest

The authors declare no conflicts of interest.

Abbreviations

ABTS: 2:2′-azino-bis (3-ethylbenzothiazoline-6-sulfonic acid); C: cooked; F: fermented; FRAP: ferric reducing antioxidant power; FC: fermented cooked; GAE: gallic acid equivalent; QTOF LC-MS: quadrupole time of flight liquid chromatography mass spectra; R: raw; TE: Trolox equivalent; TPC: total phenolic content; TPTZ: tris(2-pyridyl)-s-triazine; UHPLC: ultra-high-performance liquid chromatography.

References

  1. Li, Z.; Zhao, X.; Zhang, X.; Liu, H. Bioactive compounds and biological activities of sorghum grains. Foods 2021, 10, 2868. [Google Scholar] [CrossRef] [PubMed]
  2. Salih, S.A.; Ahmed, K.E.; Ezzdeen, L.T.; Hamza, A.A. Effect of fermentation and processing of Sorghum bicolor grains to produce traditional Sudanese hulu-muron phytochemicals and their biological activities. GSC Biol. Pharm. Sci. 2020, 10, 76–84. [Google Scholar] [CrossRef]
  3. Brantsen, J.F.; Herrman, D.A.; Ravisankar, S.; Awika, J.M. Effect of tannins on microwave-assisted extractability and color properties of sorghum 3-deoxyanthocyanins. Food Res. Int. 2021, 148, 963–9969. [Google Scholar] [CrossRef] [PubMed]
  4. Rao, S.; Chinkwo, K.; Santhakumar, A.; Johnson, S.; Blanchard, C. Apoptosis induction pathway in human colorectal cancer cell line SW480 exposed to cereal phenolic extracts. Molecules 2019, 24, 2465. [Google Scholar] [CrossRef] [PubMed]
  5. Francis, N.; Rao, S.; Blanchard, C.; Santhakumar, A. Black sorghum phenolic extract regulates expression of genes associated with oxidative stress and inflammation in human endothelial cells. Molecules 2019, 24, 3321. [Google Scholar] [CrossRef] [PubMed]
  6. Callcott, E.T.; Blanchard, C.L.; Snell, P.; Santhakumar, A.B. The anti-inflammatory and antioxidant effects of pigmented rice consumption in an obese cohort. Food Funct. 2019, 10, 8016–8025. [Google Scholar] [CrossRef]
  7. Collins, A.; Santhakumar, A.B.; Francis, N.; Blanchard, C.; Chinkwo, K. Impact of sorghum (Sorghum bicolor L. Moench) phenolic compounds on cancer development pathways. Food Biosci. 2024, 59, 104177. [Google Scholar] [CrossRef]
  8. Misra, D.; Dutta, W.; Jha, G.; Ray, P. Interactions and regulatory functions of phenolics in soil-plant-climate nexus. Agronomy 2023, 13, 280. [Google Scholar] [CrossRef]
  9. Hithamani, G.; Srinivasan, K. Bioaccessibility of polyphenols from wheat (Triticum aestivum), sorghum (Sorghum bicolor), green gram (Vigna radiata), and chickpea (Cicer arietinum) as influenced by domestic food processing. J. Agric. Food Chem. 2014, 62, 11170–11179. [Google Scholar] [CrossRef]
  10. Khoddami, A.; Mohammadrezaei, M.; Roberts, T.H. Effects of sorghum malting on colour, major classes of phenolics and individual anthocyanins. Molecules 2017, 22, 1713. [Google Scholar] [CrossRef]
  11. Dlamini, N.R.; Taylor, J.R.N.; Rooney, L.W. The effect of sorghum type and processing on the antioxidant properties of African sorghum-based foods. Food Chem. 2007, 105, 1412–1419. [Google Scholar] [CrossRef]
  12. Adebo, O.A. African sorghum-based fermented foods: Past, current and future prospects. Nutrients 2020, 12, 1111. [Google Scholar] [CrossRef] [PubMed]
  13. Mohapatra, D.; Patel, A.S.; Kar, A.; Deshpande, S.S.; Tripathi, M.K. Effect of different processing conditions on proximate composition, anti-oxidants, anti-nutrients and amino acid profile of grain sorghum. Food Chem. 2019, 271, 129–135. [Google Scholar] [CrossRef] [PubMed]
  14. Wang, Y.; Chen, L.; Yang, T.; Ma, Y.; McClements, D.J.; Ren, F.; Tian, Y.; Jin, Z. A review of structural transformations and properties changes in starch during thermal processing of foods. Food Hydrocoll. 2021, 113, 106543. [Google Scholar] [CrossRef]
  15. Martínez, M.M.; Gómez, M. Rheological and microstructural evolution of the most common gluten-free flours and starches during bread fermentation and baking. J. Food Eng. 2017, 197, 78–86. [Google Scholar] [CrossRef]
  16. Li, Z.; Zhao, X.; Zhang, X.; Liu, H. The effects of processing on bioactive compounds and biological activities of sorghum grains. Molecules 2022, 27, 3246. [Google Scholar] [CrossRef] [PubMed]
  17. Susanti, D.Y.; Sediawan, W.B.; Fahrurrozi, M.; Hidayat, M.; Putri, A.Y. Encapsulation of red sorghum extract rich in proanthocyanidins: Process formulation and mechanistic model of foam-mat drying at various temperature. Chem. Eng. Process.-Process Intensif. 2021, 164, 108375. [Google Scholar] [CrossRef]
  18. Adebo, O.A.; Medina-Meza, I.G. Impact of fermentation on the phenolic compounds and antioxidant activity of whole cereal grains: A mini review. Molecules 2020, 25, 927. [Google Scholar] [CrossRef] [PubMed]
  19. Duodu, K.; Taylor, J.; Belton, P.; Hamaker, B. Factors affecting sorghum protein digestibility. J. Cereal Sci. 2003, 38, 117–131. [Google Scholar] [CrossRef]
  20. Shen, S.; Huang, R.; Li, C.; Wu, W.; Chen, H.; Shi, J.; Chen, S.; Ye, X. Phenolic compositions and antioxidant activities differ significantly among sorghum grains with different applications. Molecules 2018, 23, 1203. [Google Scholar] [CrossRef]
  21. Rao, S.; Santhakumar, A.B.; Chinkwo, K.A.; Blanchard, C.L. Investigation of phenolic compounds with antioxidant activity in barley and oats affected by variation in growing location. Cereal Chem. 2020, 97, 772–782. [Google Scholar] [CrossRef]
  22. Ibrahim, D.; Moustafa, A.; Metwally, A.S.; Nassan, M.A.; Abdallah, K.; Eldemery, F.; Tufarelli, V.; Laudadio, V.; Kishawy, A.T.Y. Potential application of cornelian cherry extract on broiler chickens: Growth, expression of antioxidant biomarker and glucose transport genes, and oxidative stability of frozen meat. Animals 2021, 11, 1038. [Google Scholar] [CrossRef] [PubMed]
  23. Dia, V.P.; Pangloli, P.; Jones, L.; McClure, A.; Patel, A. Phytochemical concentrations and biological activities of Sorghum bicolor alcoholic extracts. Food Funct. 2016, 7, 3410–3420. [Google Scholar] [CrossRef] [PubMed]
  24. Wu, G.C.; Johnson, S.K.; Bornman, J.F.; Bennett, S.J.; Fang, Z.X. Changes in whole grain polyphenols and antioxidant activity of six sorghum genotypes under different irrigation treatments. Food Chem. 2017, 214, 199–207. [Google Scholar] [CrossRef]
  25. Awika, J.; Taylor, J.R.N. Gluten-Free Ancient Grains; Woodhead Publishing: Sawston, UK, 2017; pp. 21–54. [Google Scholar]
  26. Xiong, Y.; Zhang, P.; Warner, R.D.; Fang, Z. Sorghum grain: From genotype, nutrition, and phenolic profile to its health benefits and food applications. Compr. Rev. Food Sci. Food Saf. 2019, 18, 2025–2046. [Google Scholar] [CrossRef] [PubMed]
  27. Punia, H.; Tokas, J.; Malik, A.; Sangwan, S.; Sangwan, S. Characterization of phenolic compounds and antioxidant activity in sorghum [Sorghum bicolor (L.) Moench] grains. Cereal Res. Commun. 2021, 49, 343–353. [Google Scholar] [CrossRef]
  28. D‘Almeida, C.; Mameri, H.; Menezes, N.; dos Santos Menezes, N.; de Carvalho, C.W.; Queiroz, C.; Morel, M.; Takeiti, C.; Ferreira, M. Effect of extrusion and turmeric addition on phenolic compounds and kafirin properties in tannin and tannin-free sorghum. Food Res. Int. 2021, 149, 110663. [Google Scholar] [CrossRef] [PubMed]
  29. Udachan, I.S.; Sahu, A.K.; Hend, F.M. Extraction and characterization of sorghum (Sorghum Bicolor L. Moench) starch. Int. Food Res. J. 2012, 19, 315–319. [Google Scholar]
  30. Syeunda, C.; Awika, J.M. Mechanisms of flavonoid inhibition of Maillard reaction product formation in relation to whole grains processing. Food Chem. 2024, 449, 139237. [Google Scholar] [CrossRef]
  31. Bianco-Gomes, A.C.; Nogueira, L.D.S.; Bono-Lopes, N.V.M.; Gouvêa-Souza, C.P.; Boldrini-França, J.; Gomes, V.M.; Cherene, M.B.; Alves, N.E.G.; Vasconcelos, C.M. Dry heat and pressure favor bioactive compounds preservation and peptides formation in sorghum [Sorghum bicolor (L.) Moench]. Curr. Res. Food Sci. 2022, 5, 117–124. [Google Scholar] [CrossRef]
  32. Adebo, O.A.; Njobeh, P.B.; Adebiyi, J.A.; Kayitesi, E. Co-influence of fermentation time and temperature on physicochemical properties, bioactive components and microstructure of ting (a Southern African food) from whole grain sorghum. Food Biosci. 2018, 25, 118–127. [Google Scholar] [CrossRef]
  33. Zaroug, M.; Orhan, I.E.; Senol, F.S.; Yagi, S. Comparative antioxidant activity appraisal of traditional Sudanese kisra prepared from two sorghum cultivars. Food Chem. 2014, 156, 110–116. [Google Scholar] [CrossRef] [PubMed]
  34. Moreno, C.R.; Fernández, P.C.R.; Rodríguez, E.O.C.; Carrillo, J.M.; Rochín, S.M. Extrusion of Metals, Polymers and Food Products; IntechOpen: London, UK, 2018; pp. 104–124. [Google Scholar]
  35. Alazzouni, A.; Dkhil, M.; Gadelmawla, M.; Gabri, M.; Farag, A.; Hassan, B. Ferulic acid as anticarcinogenic agent against 1,2-dimethylhydrazine induced colon cancer in rats. J. King Saud Univ. Sci. 2021, 33, 101354. [Google Scholar] [CrossRef]
  36. Khan, A.; Khan, R.; Qamar, W.; Lateef, M.; Ali, F.; Tahir, M.; Muneeb, U.; Sultana, S. Caffeic acid attenuates 12-O-tetradecanoyl-phorbol-13-acetate (TPA)-induced NF-kB and COX-2 expression in mouse skin: Abrogation of oxidative stress, inflammatory responses and proinflammatory cytokine production. Food Chem. Toxicol. 2012, 50, 175–183. [Google Scholar] [CrossRef] [PubMed]
  37. Proietti, I.; Mantovani, A.; Mouquet-Rivier, C.; Guyot, J.P. Modulation of chelating factors, trace minerals and their estimated bioavailability in Italian and African sorghum (Sorghum bicolor (L.) Moench) porridges. Int. J. Food Sci. Technol. 2013, 48, 1526–1532. [Google Scholar] [CrossRef]
  38. Correia, I.; Nunes, A.; Barros, A.S.; Delgadillo, I. Comparison of the effects induced by different processing methods on sorghum proteins. J. Cereal Sci. 2010, 51, 146–151. [Google Scholar] [CrossRef]
  39. Rao, S.; Santhakumar, A.B.; Chinkwo, K.A.; Wu, G.; Johnson, S.K.; Blanchard, C.L. Characterization of phenolic compounds and antioxidant activity in sorghum grains. J. Cereal Sci. 2018, 84, 103–111. [Google Scholar] [CrossRef]
  40. Noreen, H.; Semmar, N.; Farman, M.; McCullagh, J.S.O. Measurement of total phenolic content and antioxidant activity of aerial parts of medicinal plant Coronopus didymus. Asian Pac. J. Trop. Med. 2017, 10, 792–801. [Google Scholar] [CrossRef] [PubMed]
  41. Min, B.; McClung, A.M.; Chen, M.H. Phytochemicals and antioxidant capacities in rice brans of different color. J. Food Sci. 2011, 76, C117–C126. [Google Scholar] [CrossRef]
  42. Zhu, Y.; Shi, Z.; Yao, Y.; Hao, Y.; Ren, G. Antioxidant and anti-cancer activities of proanthocyanidins-rich extracts from three varieties of sorghum (Sorghum bicolor) bran. Food Agric. Immunol. 2017, 28, 1530–1543. [Google Scholar] [CrossRef]
  43. Sompong, R.; Siebenhandl-Ehn, S.; Linsberger-Martin, G.; Berghofer, E. Physicochemical and antioxidative properties of red and black rice varieties from Thailand, China and Sri Lanka. Food Chem. 2011, 124, 132–140. [Google Scholar] [CrossRef]
  44. Woo, K.S.; Ko, J.Y.; Jeong, H.S. Effect of milling time on antioxidant compounds and activities of methanol extracts of sorghum [Sorghum bicolor (L.) Moench]. Food Sci. Biotechnol. 2014, 23, 1741–1746. [Google Scholar] [CrossRef]
  45. García-Villalba, R.; Espín, J.C.; Tomás-Barberán, F.A. Chromatographic and spectroscopic characterization of urolithins for their determination in biological samples after the intake of foods containing ellagitannins and ellagic acid. J. Chromatogr. A 2016, 1428, 162–175. [Google Scholar] [CrossRef] [PubMed]
  46. Ed Nignpense, B.; Chinkwo, K.A.; Blanchard, C.L.; Santhakumar, A.B. Black sorghum phenolic extract modulates platelet activation and platelet microparticle release. Nutrients 2020, 12, 1760. [Google Scholar] [CrossRef]
  47. Rao, S.; Santhakumar, A.B.; Chinkwo, K.A.; Blanchard, C.L. Q-TOF LC/MS identification and UHPLC-Online ABTS antioxidant activity guided mapping of barley polyphenols. Food Chem. 2018, 266, 323–328. [Google Scholar] [CrossRef]
  48. ChemSpider. In Royal Society of Chemistry. 2024. Available online: https://www.chemspider.com/Search.aspx (accessed on 3 February 2023).
  49. PubChem. In National Center for Biotechnology Information. 2024. Available online: https://pubchem.ncbi.nlm.nih.gov/search/#collection=compounds (accessed on 3 February 2023).
  50. MassBank. MassBank Project. 2006. Available online: https://massbank.eu/MassBank/Search (accessed on 3 February 2023).
  51. Metlin. 10550 North Torrey Pines Road BCC-007, La Jolla, CA 92037 USA, 2006. Available online: https://metlin.scripps.edu (accessed on 3 February 2023).
Figure 1. Standard calibration curves for the determination of (A) total phenolic content and (B) total proanthocyanidin content (TPAC).
Molecules 29 03626 g001
Figure 2. UHPLC—Online ABTS overlaid changes in phenolic compounds after processing from black pericarp sorghum variety Shawaya short black 1 (BlackSs). * Compound detected in multiple processes. The numbers represent compounds identified in each process for BlackSs.
Molecules 29 03626 g002
Figure 3. UHPLC—Online ABTS overlaid changes in phenolic compounds after processing from red pericarp sorghum variety Buster (RedBu1). * Compound detected in multiple processes. The numbers represent compounds identified in each process for RedBu1.
Molecules 29 03626 g003
Figure 4. UHPLC—Online ABTS overlaid changes in phenolic compounds after processing from white pericarp sorghum variety Liberty (WhiteLi1). * Compound detected in multiple processes. The numbers represent compounds identified in each process for WhiteLi1.
Molecules 29 03626 g004
Figure 5. Variations in the phenolic composition (determined by a gallic acid standard curve in a UHPLC—Online ABTS system) of the significant phenolic compounds identified before and after processing of sorghum samples. Data are expressed as mg 100−1 GAE and presented as mean ± SD; n = 3. Two—way ANOVA with multiple comparisons was performed, and statistical significance was set at p ≤ 0.05. * Statistically significant difference within processed sorghum samples. BlackSs, Shawaya short black 1; BlackSb, Shawaya black; RedBa1 and RedBa2, Bazley; RedBu1 and RedBu2, Buster; WhiteLi1 and WhiteLi2, Liberty; R, raw; C, cooked, F, fermented; FC, fermented and cooked.
Molecules 29 03626 g005
Figure 6. Changes to the ABTS antioxidant activity (determined by a Trolox standard curve in a UHPLC—Online ABTS system) of the significant phenolic compounds identified before and after processing of sorghum samples. Data are expressed as mg 100−1 TE and presented as mean ± SD; n = 3. Two—way ANOVA with multiple comparisons was performed, and statistical significance was set at p ≤ 0.05. * Statistically significant difference within processed sorghum samples. BlackSs, Shawaya short black 1; BlackSb, Shawaya black; RedBa1 and RedBa2, Bazley; RedBu1 and RedBu2, Buster; WhiteLi1 and WhiteLi2, Liberty; R, raw; C, cooked, F, fermented; FC, fermented and cooked.
Molecules 29 03626 g006
Table 1. Impact of processing on the antioxidant activity of sorghum polyphenols.
VarietyProcessing TechniqueTPC mg/g GAETPAC mg/g CEABTS mg 100 g−1 TEDPPH mg/g TEFRAP mg/g TE
BlackSs (Shawaya short black-1)Raw9.66 ± 1.66 a8.38 ± 0.44 a2.07 ± 0.22 a11.10 ± 0.06 a23.27 ± 3.50 a
Cooked7.38 ± 0.53 b4.88 ± 0.67 b1.47 ± 0.25 b10.8 ± 0.09 b28.57 ± 2.22 b
Fermented7.93 ± 1.67 c6.44 ± 0.30 c1.52 ± 0.08 bc10.70 ± 0.25 bc15.80 ± 1.24 c
Fermented Cooked10.93 ± 0.85 d7.05 ± 0.58 c2.25 ± 0.09 a11.30 ± 0.06 a26.81 ± 3.63 ab
BlackSb (Shawaya black)Raw6.67 ± 0.64 a2.01 ± 0.08 a0.92 ± 0.04 a2.56 ± 0.14 ab7.29 ± 1.26 a
Cooked5.97 ± 0.61 ab2.46 ± 0.21 a1.04 ± 0.12 b2.76 ± 0.04 c9.13 ± 1.55 a
Fermented6.73 ± 0.77 a2.45 ± 0.14 a1.14 ± 0.07 bc2.61 ± 0.07 ad11.98 ± 2.00 b
Fermented Cooked6.86 ± 0.73 ac2.65 ± 0.19 b1.36 ± 0.07 d2.75 ± 0.08 ce12.37 ± 1.98 bc
RedBu1 (Buster.B)Raw0.67 ± 0.08 a1.31 ± 0.25 a0.87 ± 0.24 a2.40 ± 0.19 a5.09 ± 0.62 a
Cooked0.57 ± 0.06 b1.18 ± 0.18 a0.91 ± 0.17 a2.40 ± 0.18 a5.81 ± 1.18 a
Fermented0.52 ± 0.06 bc1.40 ± 0.33 a0.86 ± 0.04 a1.99 ± 0.17 b9.88 ± 1.08 b
Fermented Cooked0.58 ± 0.06 bd1.44 ± 0.25 a1.00 ± 0.09 a2.33 ± 0.12 ac10.49 ± 0.94 bc
RedBa1 (Bazley.B)Raw0.50 ± 0.13 a1.27 ± 0.07 a0.89 ± 0.06 a2.29 ± 0.18 a6.69 ± 0.66 a
Cooked0.67 ± 0.25 ac1.31 ± 0.30 a1.07 ± 0.20 a2.61 ± 0.13 b8.24 ± 1.46 b
Fermented0.59 ± 0.05 a1.24 ± 0.23 a0.89 ± 0.22 a1.80 ± 0.17 c9.72 ± 0.64 c
Fermented Cooked0.47 ± 0.10 ab1.43 ± 0.26 a0.94 ± 0.11 a2.15 ± 0.15 a7.71 ± 1.49 ab
WhiteLi1 (Liberty.B)Raw0.33 ± 0.01 a0.05 ± 0.01 a0.25 ± 0.05 a0.83 ± 0.19 a1.55 ± 0.22 a
Cooked0.30 ± 0.03 ab0.12 ± 0.05 b0.42 ± 0.08 b1.32 ± 0.21 b2.40 ± 0.23 bc
Fermented0.40 ± 0.04 ac0.14 ± 0.03 bc0.46 ± 0.19 bc0.88 ± 0.21 a2.79 ± 0.55 bc
Fermented Cooked0.34 ± 0.11 a0.13 ± 0.03 bd0.54 ± 0.07 b1.08 ± 0.20 a2.70 ± 0.50 c
RedBu2 (Buster.CC)Raw0.58 ± 0.09 ab0.78 ± 0.05 ab0.69 ± 0.15 a1.58 ± 0.18 a3.74 ± 0.42 a
Cooked0.49 ± 0.04 a0.94 ± 0.10 a0.84 ± 0.11 a2.39 ± 0.16 b6.82 ± 0.57 b
Fermented0.42 ± 0.05 ac1.02 ± 0.16 a0.73 ± 0.05 a1.90 ± 0.19 c5.11 ± 0.91 c
Fermented Cooked0.55 ± 0.18 a1.21 ± 0.46 ac0.92 ± 0.14 b1.85 ± 0.19 cd4.58 ± 0.63 acd
RedBa2 (Bazley.CC)Raw0.56 ± 0.04 a1.08 ± 0.28 a0.84 ± 0.16 a1.98 ± 0.17 a5.56 ± 0.40 a
Cooked0.45 ± 0.03 b1.15 ± 0.23 a0.87 ± 0.10 ab2.47 ± 0.13 b7.68 ± 1.22 b
Fermented0.43 ± 0.06 a1.03 ± 0.23 a0.68 ± 0.08 ac1.70 ± 0.19 c4.55 ± 0.72 a
Fermented Cooked0.55 ± 0.12 bc1.52 ± 0.37 b0.95 ± 0.18 abd2.08 ± 0.16 a5.53 ± 0.65 a
WhiteLi2 (Liberty.CC)Raw0.43 ± 0.02 a0.04 ± 0.01 a0.41 ± 0.19 a0.78 ± 0.22 a1.07 ± 0.35 a
Cooked0.30 ± 0.02 b0.08 ± 0.02 b0.47 ± 0.16 a0.99 ± 0.21 a1.69 ± 0.32 a
Fermented0.29 ± 0.06 bc0.11 ± 0.02 c0.46 ± 0.17 a0.78 ± 0.21 a2.45 ± 0.77 b
Fermented Cooked0.38 ± 0.03 d0.21 ± 0.04 d0.46 ± 0.21 a0.97 ± 0.23 a2.89 ± 0.65 b
Data are presented as mean ± SD (n = 9). Different letters in the different columns represent significant differences at p < 0.05. 1, Bellata; 2, Croppa Creek; GAE, gallic acid equivalent; CE, catechin equivalent; TE, Trolox equivalent; TPC, total phenolic content); TPAC, total proanthocyanidins content; ABTS, 2,2′-azino-bis (3-ethylbenzothiazoline-6-sulfonic acid); DPPH, 2,2-diphenyl-1-picrylhydrazyl; FRAP, ferric reducing ability of plasma assay.
Table 2. Identification of antioxidant active peaks in sorghum phenolic acetone extracts using QTOF LC-MS.
PeakTentative IDLevel of IDm/zRetention TimeSorghum VarietySorghum Processing Technique
RawCookedFermentedFermented Cooked
1trans-Piceid2251.07971.06WhiteLi1, RedBa1, RedBu1, RedBu2
2trans cinnamic acid2147.03101.07BlackSs
36-methoxy-7-hydroxycoumarin3193.03601.09RedBu1, BlackSb
4Methyl trans-cinnamic acid4161.04791.10WhiteLi1, RedBa2
5Malic acid2133.04911.11RedBa2, RedBu2
66,8-dimethyl-4-hydroxycoumarin3191.09001.32RedBu1, RedBu2, BlackSb
76-prenylnaringenin4341.11121.70RedBa2, RedBu1, RedBu2, BlackSs, BlackSb
8Apigenin-7-O-glucoside3413.16862.16WhiteLi2
9Coumarin1145.05102.47RedBa1, RedBa2, RedBu2, BlackSs
10Protocatechuic acid1153.01983.00BlackSs
11Gallic acid1170.12003.14WhiteLi1
12Vanillin1153.01884.03BlackSs
13Apigenin-7-O-glucoside3413.16804.39RedBa1
14Quercetin-3,4’-O-di-beta-glucopyranoside4625.19854.50WhiteLi1, WhiteLi2, RedBa1, RedBa2, RedBu1, RedBu2, BlackSs, BlackSb
15Linoleic acid3279.11104.91RedBa1
16Catechin1289.07265.14BlackSs
17Malvin5655.21125.47WhiteLi1, WhiteLi2, RedBa1, RedBa2, BlackSs
184-methyl-7-aminocoumarin3175.06306.35WhiteLi1, WhiteLi2
19Hippuric acid1179.03887.30WhiteLi1, WhiteLi2, RedBa1, RedBa2
204-Acetylbutyric acid2131.07217.55WhiteLi1, RedBa1, RedBa2, RedBu1, RedBu2, BlackSs, BlackSb
21Caffeic acid1181.05127.75WhiteLi1, WhiteLi2, RedBa2, RedBu1, RedBu2, BlackSs, BlackSb
223-aminobenzoic acid2137.06228.55RedBa2, BlackSb
23Procyanidin b1 isomer4577.13868.97BlackSs
24Malic acid2135.04559.03WhiteLi1, WhiteLi2, RedBa1, RedBa2, RedBu1, RedBu2, BlackSs, BlackSb
252-Isopropylmalic acid3177.02019.20WhiteLi1, WhiteLi2, RedBa1, RedBa2, RedBu1, RedBu2, BlackSs
26Hippuric acid1179.03589.05WhiteLi2, RedBu1, RedBu2, BlackSb
27Catechin1289.07339.08BlackSs
28Caffeic acid1181.05169.51WhiteLi2, BlackSs, BlackSb
29Kaempferol-3-O-xyloside3417.10579.66WhiteLi2, RedBa1, RedBa2, BlackSb
30Luteolin derivative3415.126210.05WhiteLi1, WhiteLi2, RedBa1, RedBu2
31Apigeninidin2253.073710.43WhiteLi1, WhiteLi2, RedBa1, RedBa2, RedBu1, RedBu2, BlackSs, BlackSb
322-Isopropylmalic acid2177.019210.91WhiteLi2
33Procyanidin C14865.197810.45BlackSs
34Epigallocatechin2307.140911.42BlackSs
35Catechin1289.073911.46BlackSs
36trans cinnamic acid2147.045311.79RedBa1, RedBu2, BlackSs
37trans-Resveratroloside3371.100012.08WhiteLi1, RedBa1, RedBa2, RedBu1, RedBu2, BlackSs, BlackSb
38Isoferulic acid2195.066812.09BlackSb
392-Hydroxyhippuric acid2253.072912.11WhiteLi2
40trans-Resveratroloside3371.100112.16WhiteLi2, BlackSs, BlackSb
41Catechin derivative3720.157212.73BlackSs
42N’.n’-dicafferoylspermidine2468.213013.21WhiteLi1, WhiteLi2, RedBa1, RedBa2, RedBu1, RedBu2, BlackSs, BlackSb
43Ferulic acid1468.215613.56WhiteLi1, WhiteLi2, RedBa1, RedBa2, RedBu1, RedBu2, BlackSs, BlackSb
44Luteolin1285.073613.93BlackSs
45Catechin derivative3289.075814.21BlackSs, BlackSb
46Malic acid2135.045814.53WhiteLi1, WhiteLi2, RedBa1, RedBa2, RedBu1, RedBu2, BlackSb
47Catechin1289.073814.60BlackSs
482-Isopropylmalic acid2177.019214.63RedBa2
49Apigenin1269.047514.85BlackSs, BlackSb
50Taxifolin-O-pentoside3399.168114.89RedBa1
51Pentahydroxyflavanone-(3 → 4)-catechin-7-O-glucoside4883.229315.00RedBa1, RedBa2, RedBu1, RedBu2, BlackSs, BlackSb
52Eriodictyol deoxyhexoside3433.118115.12RedBa1, RedBa2, RedBu1, RedBu2
53Eriodictyol deoxyhexoside3433.116915.45RedBu1, RedBu2, BlackSs
54Glucomalcomiin2482.233415.39RedBa1, RedBu1, BlackSs, BlackSb
55Procyanidin C14865.217115.43RedBa2, RedBu2, BlackSs
563-aminobenzoic acid2137.061315.45WhiteLi1, RedBu1
57Kaempferol2187.098015.67WhiteLi1, WhiteLi2, RedBa1, RedBa2, RedBu2, BlackSs, BlackSb
58Epicat-(4beta → 6)-epicatechin-(2beta- > 7,4beta → 8)-epicatechin2867.237716.36RedBu1
59Procyanidin C14867.238216.37RedBa1, RedBa2, RedBu1, RedBu2, BlackSs
60Procyanidin b1 isomer4577.159016.79WhiteLi1, WhiteLi2
61Luteolin-7-O-glucoside2447.095416.81RedBa1, RedBa2, RedBu1, RedBu2
62Pyrano-eriodictyol-(3 → 4)-catechin-7-O-glucoside4867.236216.99RedBa1, RedBa2, RedBu1, BlackSs
63Apigenin1271.063217.05RedBa1, BlackSs, BlackSb
64Taxifolin2303.052717.69RedBa1, RedBu1, BlackSs, BlackSb
65Malvidin-3-O-glucoside2329.213317.91RedBa1
66Procyanidin2429.213317.98RedBa1, RedBa2, RedBu1, RedBu2, BlackSb
67Pyrano-naringenin-(3 → 4)-catechin-7-O-glucoside isomer3851.241518.55RedBa1, RedBa2, RedBu1, RedBu2, BlackSs
68Taxifolin2303.087919.23WhiteLi1, WhiteLi2, RedBa1, RedBa2, RedBu1, RedBu2, BlackSs, BlackSb
69Kaempferol2187.098419.32WhiteLi2
70Luteolin derivative3415.106119.35BlackSb
71Taxifolin-O-pentoside2399.110219.75BlackSb
72Quercetin-3-O-glucuronide2478.922319.84WhiteLi1, WhiteLi2
73Eriodictyol deoxyhexoside3721.182619.98RedBa1
74Pentahydroxyflavanone-(3 → 4)-catechin-7-O-glucoside isomer 4721.178019.99RedBa1, RedBa2, RedBu1, RedBu2
75Eriodictyol deoxyhexoside3433.112120.61RedBa2
76Luteolin1285.076621.45RedBa1, RedBa2, RedBu1, RedBu2, BlackSs, BlackSb
777-O-methyl-luteolinidin5395.213521.49WhiteLi1, WhiteLi2, RedBa1, RedBa2, RedBu1, RedBu2, BlackSs
78Voacamine2705.187121.83RedBa1, RedBa2, RedBu2
79Procyanidin2429.121622.12BlackSb
80Luteolin derivative3415.107022.41WhiteLi1, WhiteLi2, RedBa1, RedBa2, RedBu1, RedBu2, BlackSs, BlackSb
81Taxifolin-O-pentoside3399.110424.36WhiteLi1, WhiteLi2, RedBa1, RedBa2, RedBu1, RedBu2, BlackSs, BlackSb
82Apigenin1271.062724.43RedBu1
83Procyanidin2429.121224.91WhiteLi1, WhiteLi2, RedBa1, RedBa2, RedBu1, RedBu2, BlackSs, BlackSb
84Apigenin1269.047125.17RedBa1
85Gallic acid hexoside3331.249825.92RedBa2, RedBu1, RedBu2, BlackSs
86Malvidin-3-O-glucoside5329.253925.93RedBa1, RedBu1
87Apigenin-7-O-glucoside2413.127627.05BlackSb
Disclaimer/Publisher’s Note: The statements, opinions and data contained in all publications are solely those of the individual author(s) and contributor(s) and not of MDPI and/or the editor(s). MDPI and/or the editor(s) disclaim responsibility for any injury to people or property resulting from any ideas, methods, instructions or products referred to in the content.

