
Degradation Efficiency and Mechanism of Tetracycline in Water by Activated Persulfate Using Biochar-Loaded Nano Zero-Valent Iron

Abstract
:1. Introduction
2. Results and Discussion
2.1. Analytical Testing and Micro-Characterization Methods
2.1.1. Analytical Test Methods
- (1)
- Detection of TC concentration
- (2)
- Electron paramagnetic resonance (EPR)
- (3)
- Liquid chromatography–mass spectrometry (LC–MS) analysis
- (4)
- Free radical quenching method
2.1.2. Micro-Characterization Methods
- (1)
- X-ray photoelectron spectroscopy (XPS)
- (2)
- X-ray diffraction (XRD)
- (3)
- Fourier transform infrared spectroscopy (FT-IR)
- (4)
- Scanning electron microscope-energy scattering spectroscopy (SEM-EDS)
- (5)
- Specific surface area and porosity analyzer (BET)
2.2. Material Properties and Functional Characterization of Activated Systems
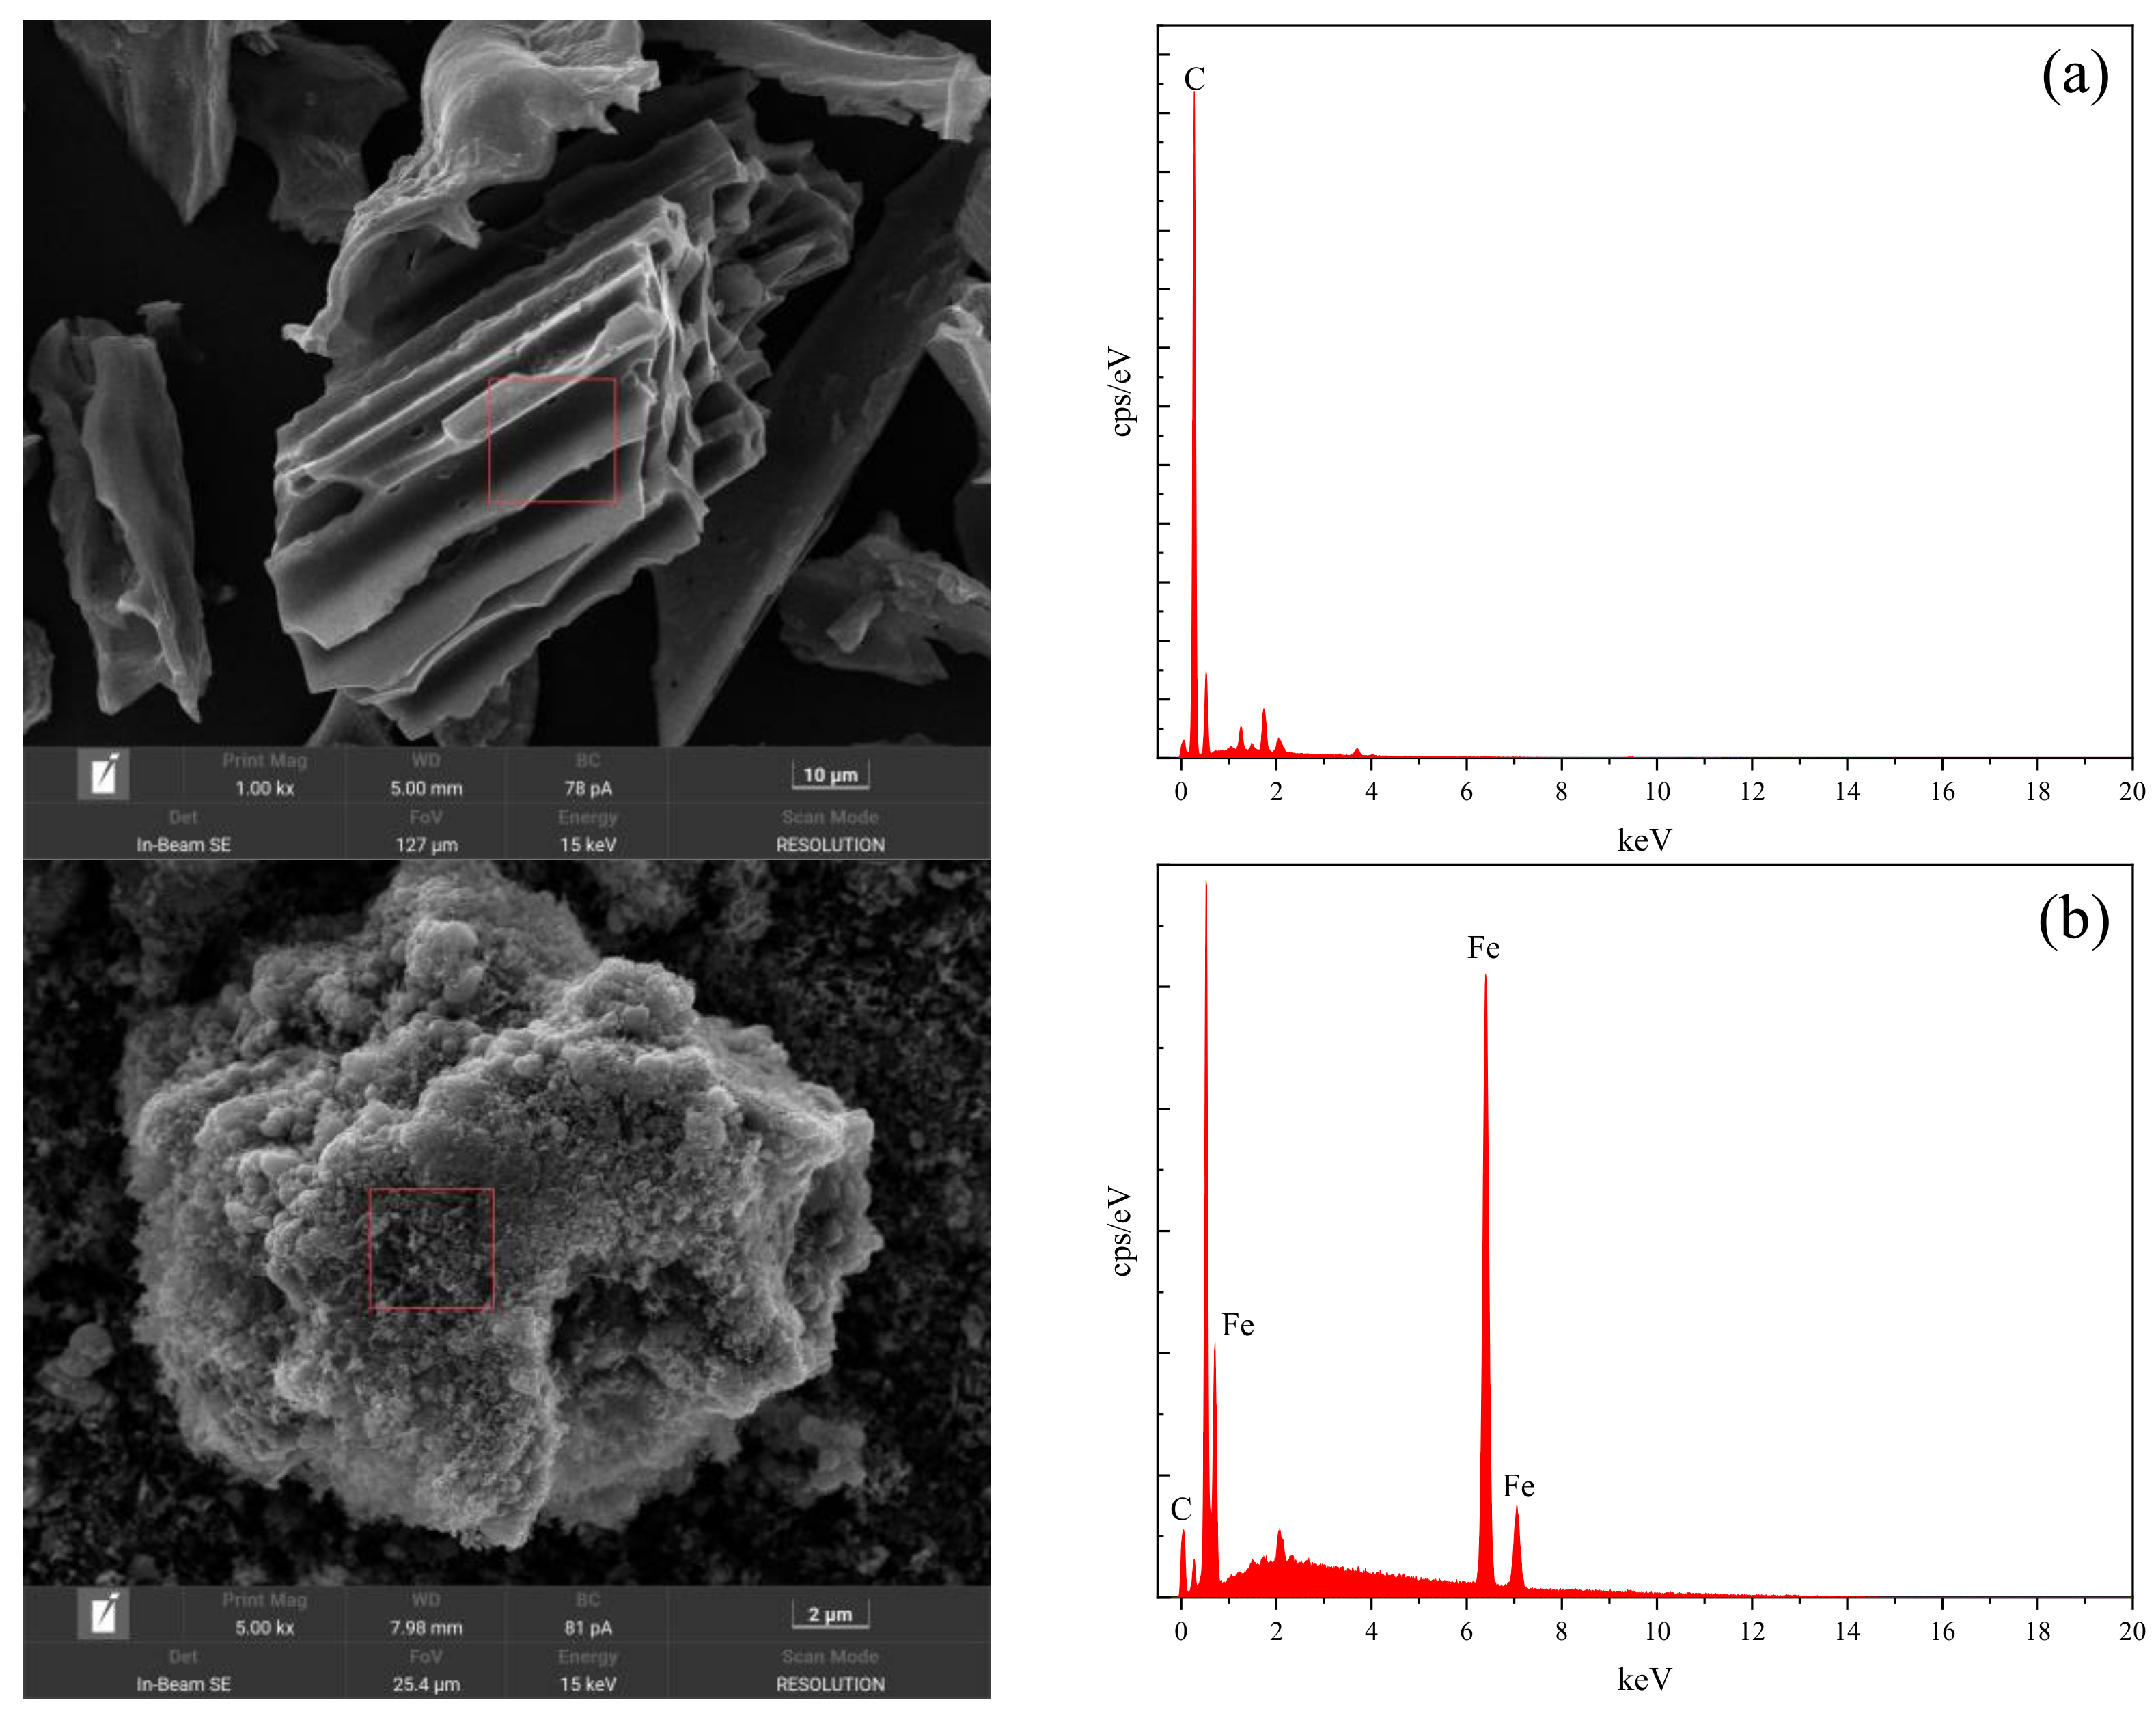
2.2.1. Characterization and Analysis of Microscopic Morphology and Characteristic Elements
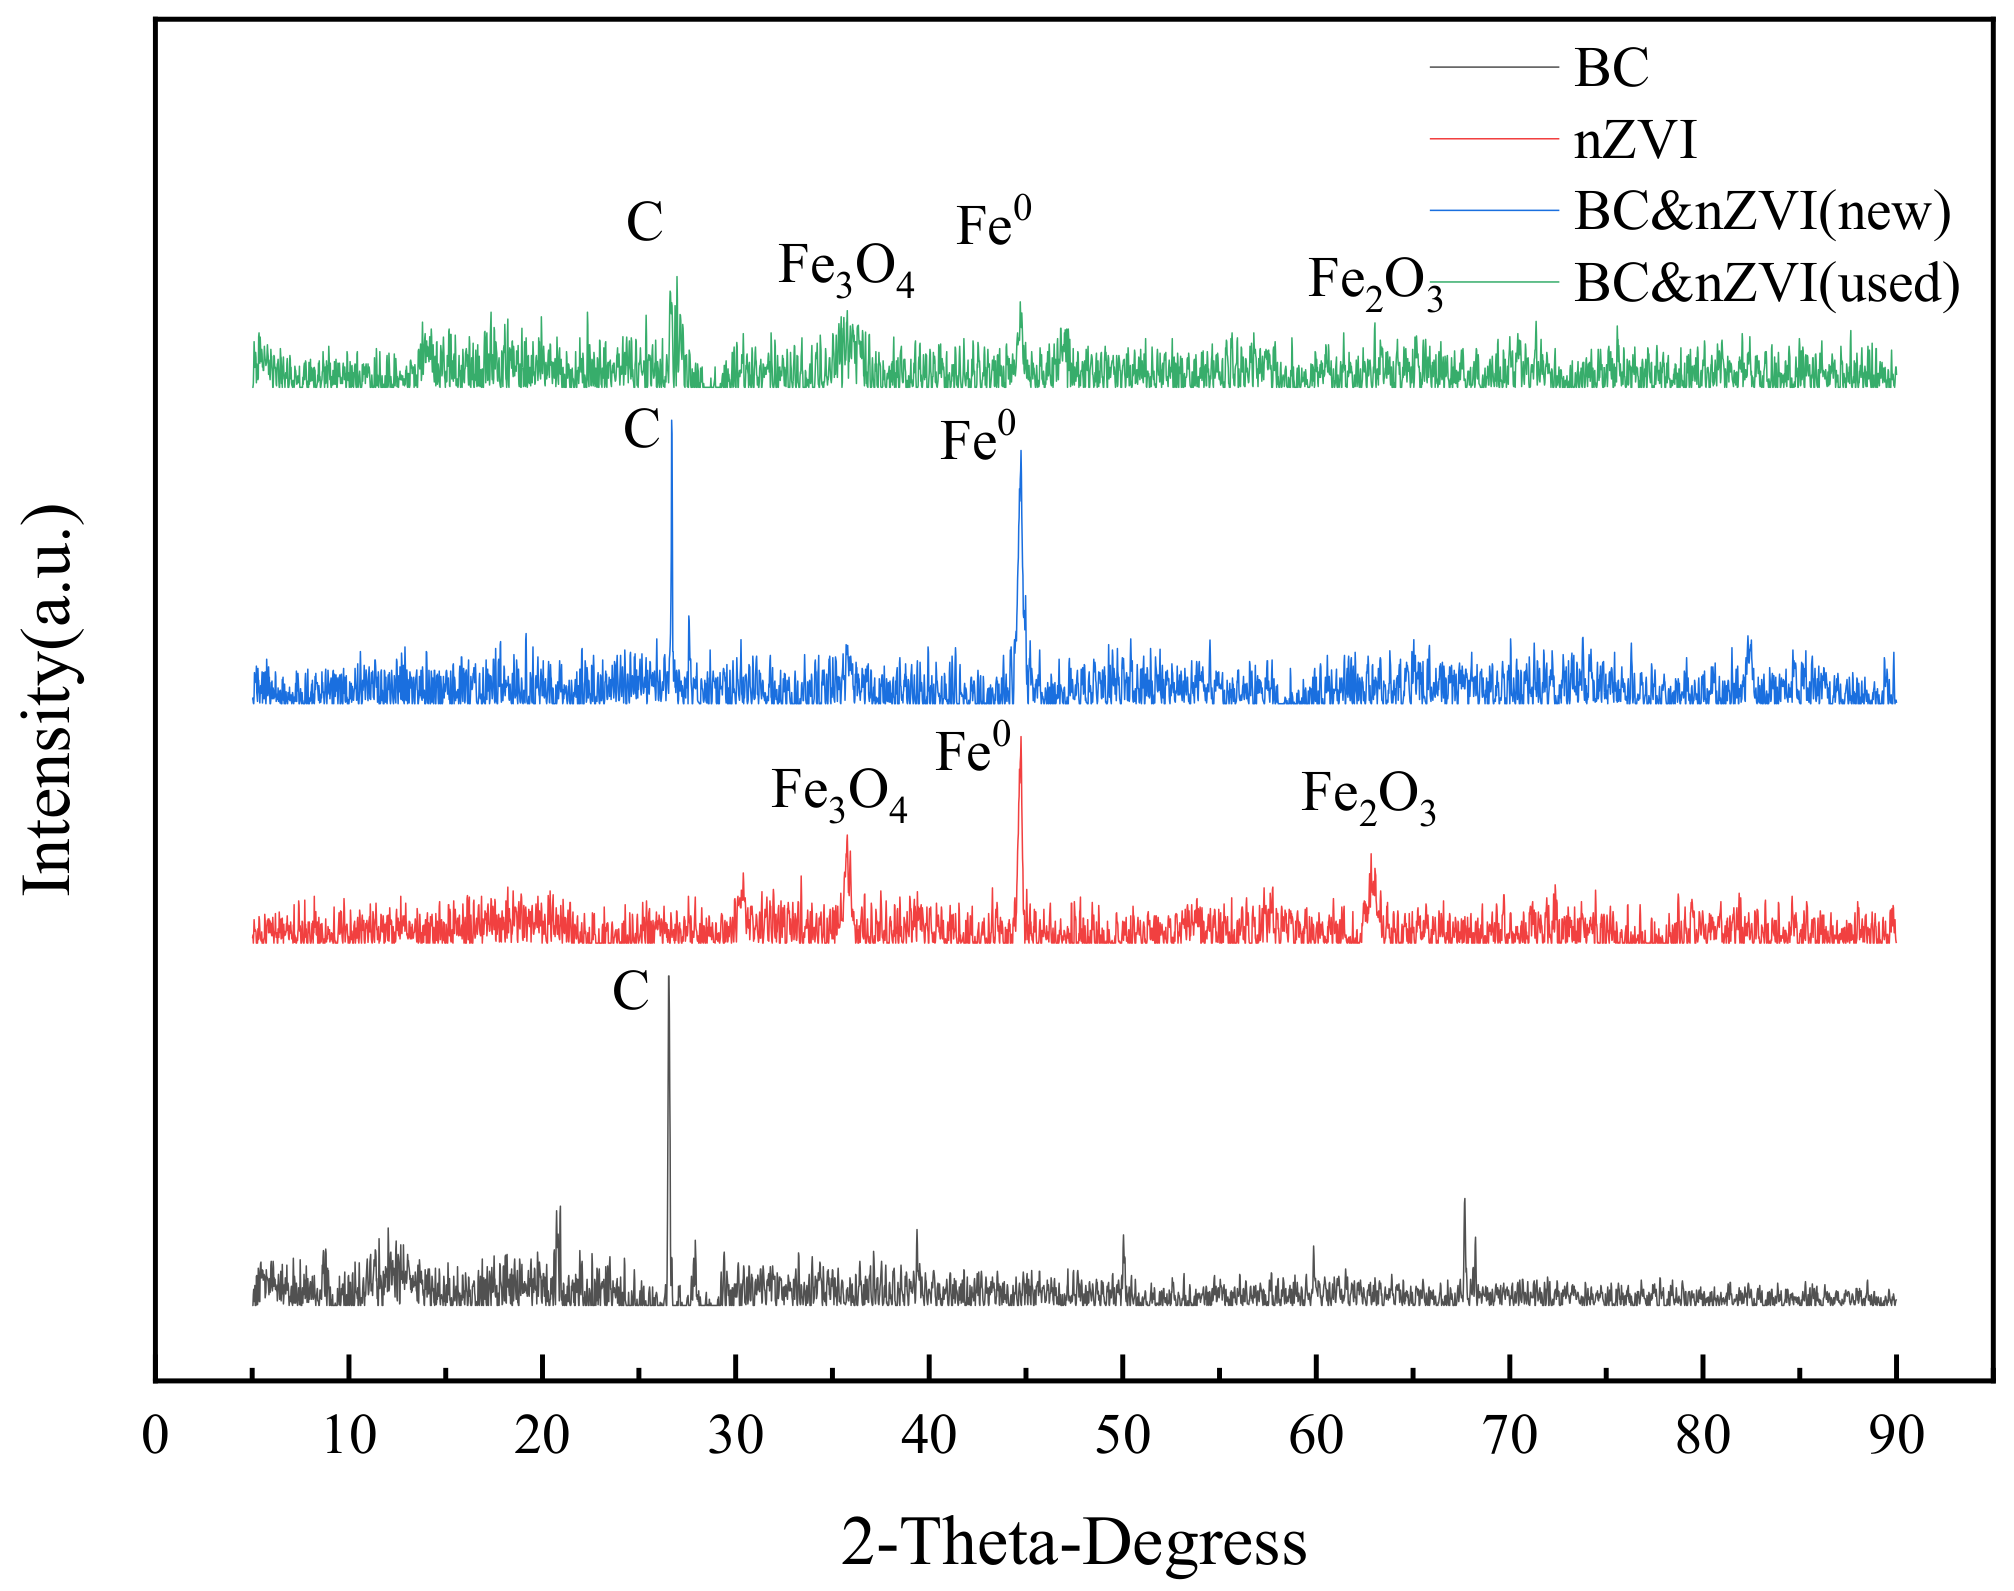
2.2.2. Characterization and Analysis of Crystal Structure and Phase Composition
2.2.3. Characterization and Analysis of Specific Surface Area and Pore Properties
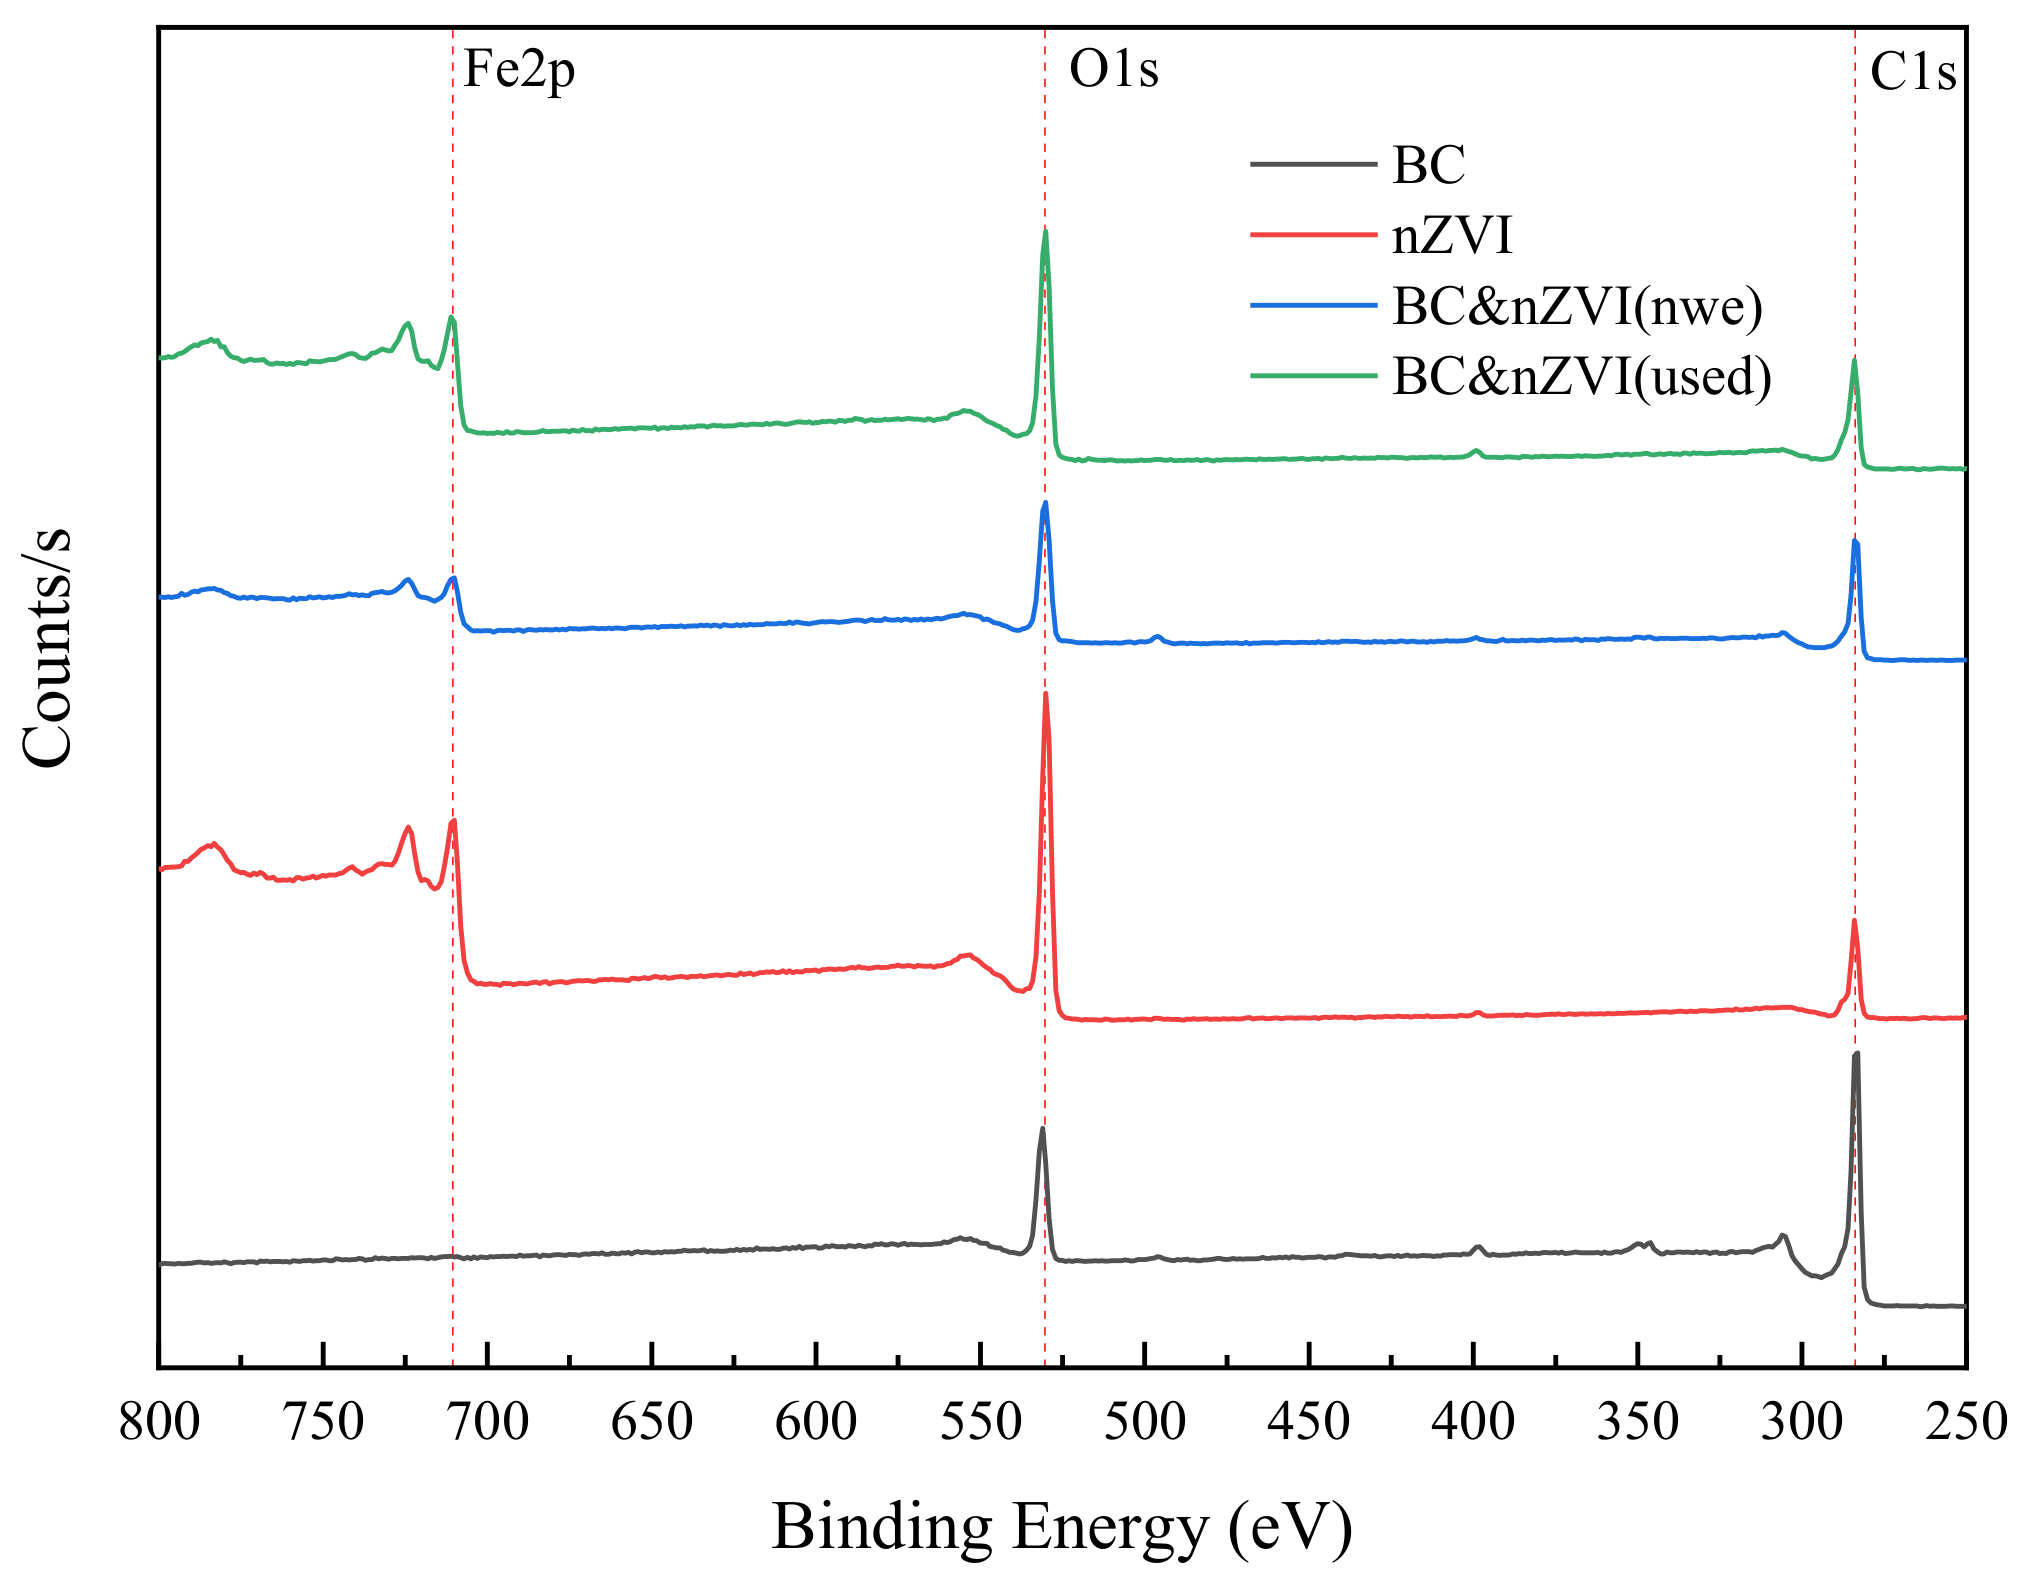
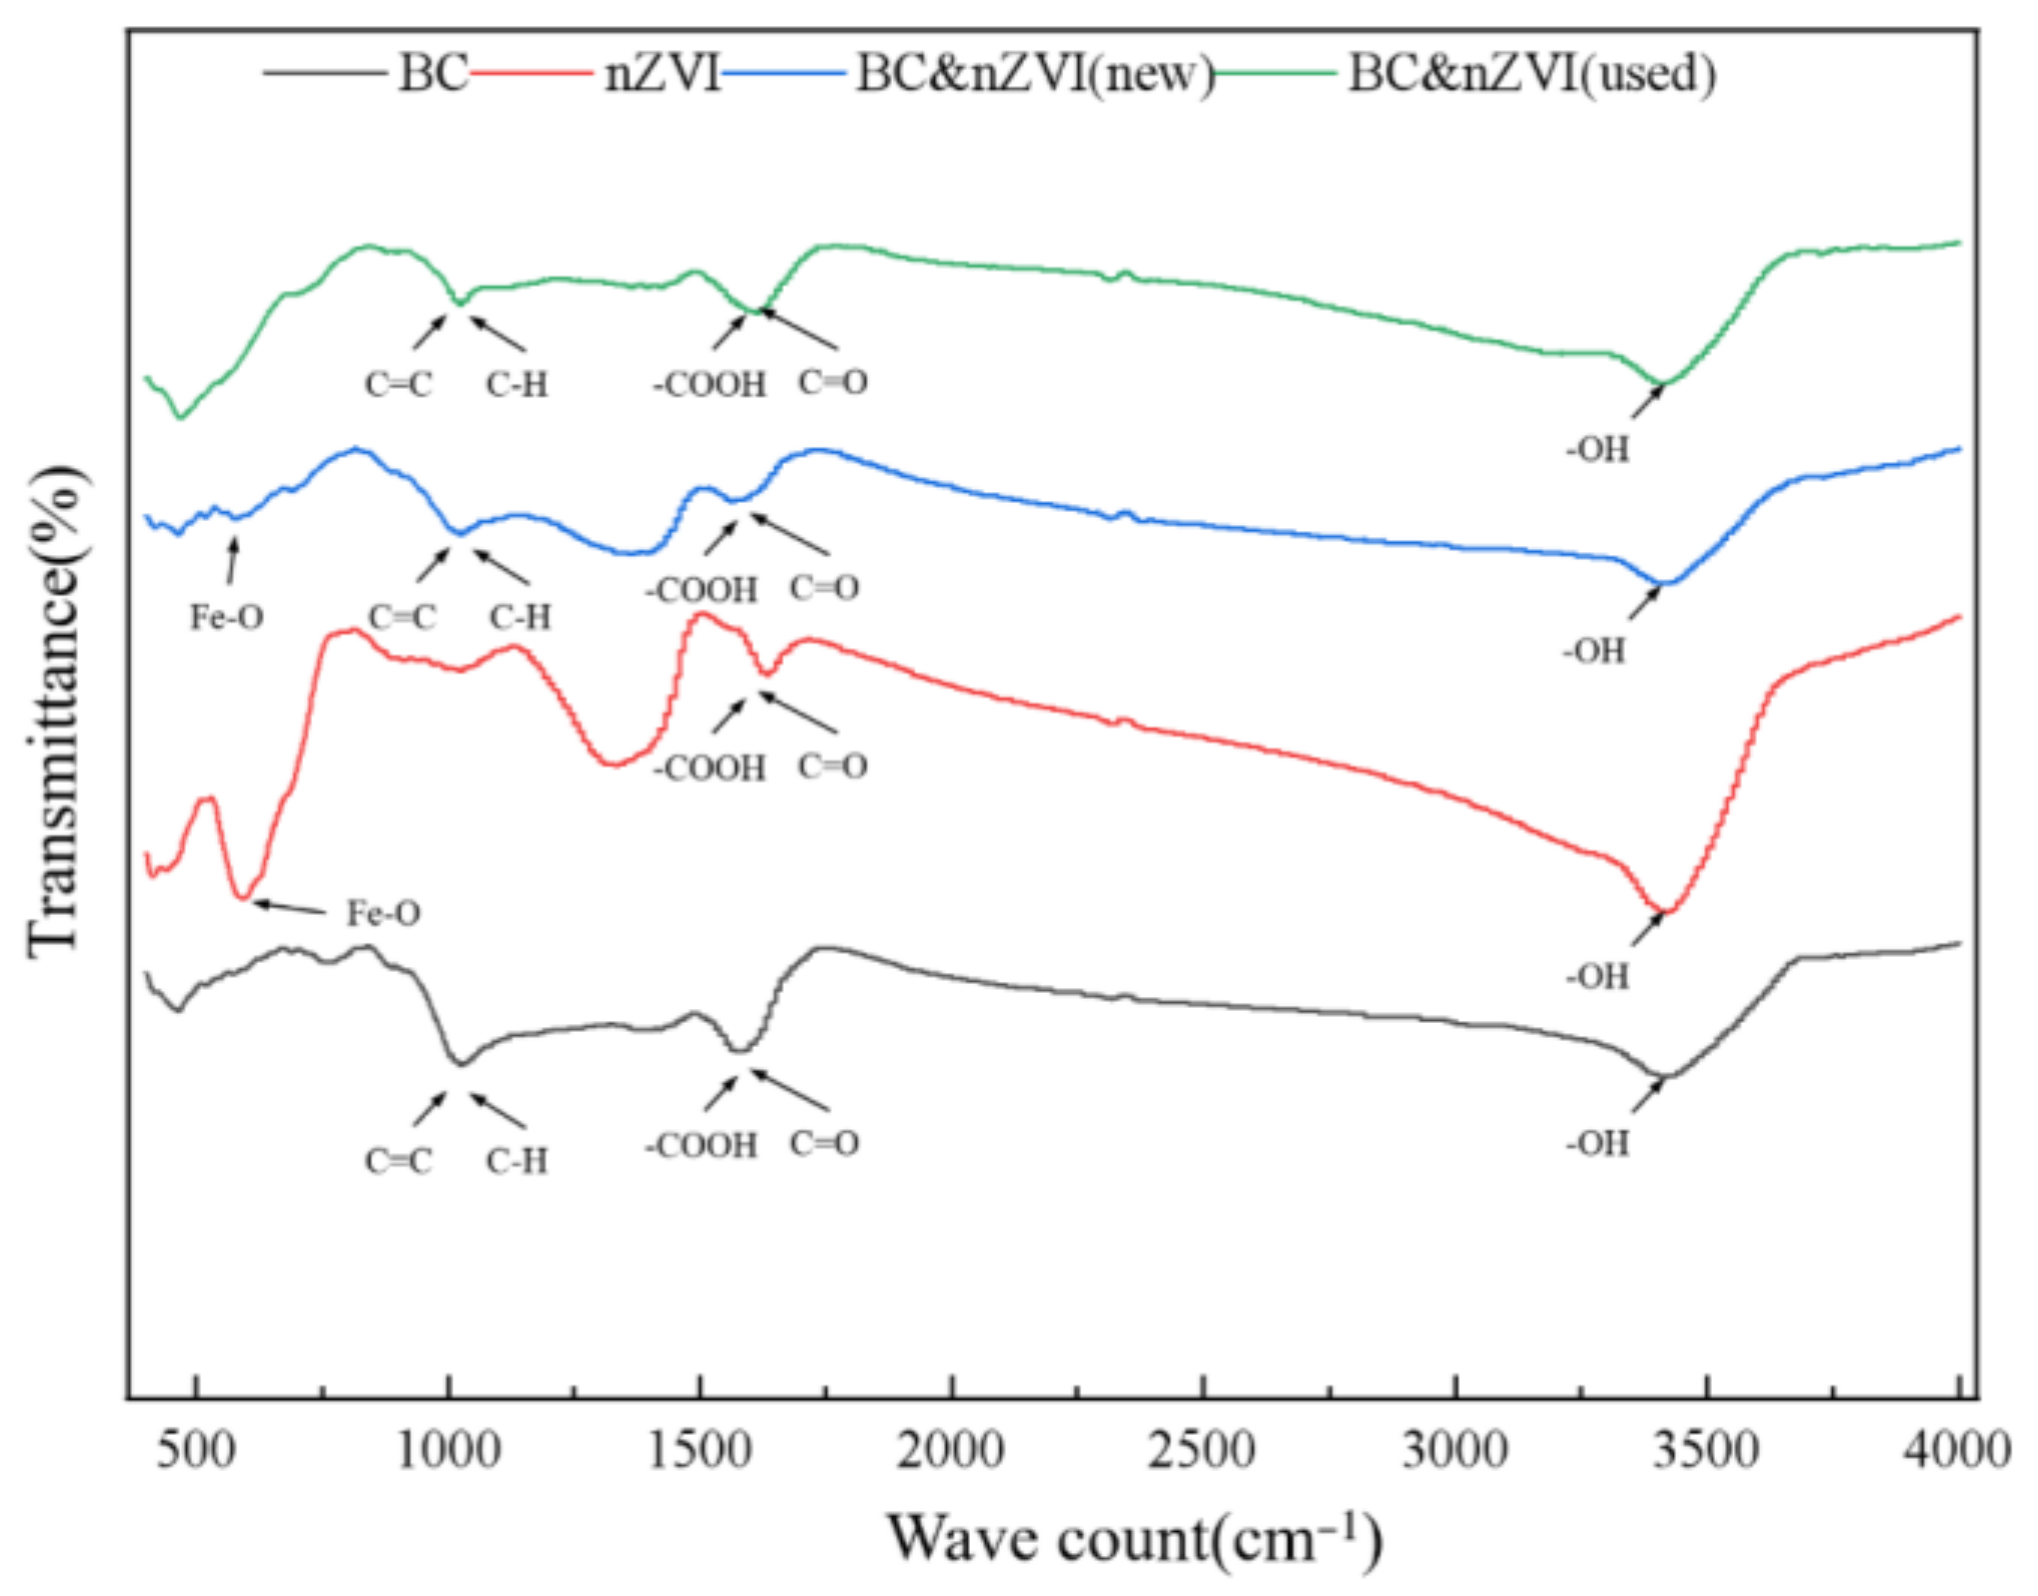
2.2.4. Chemical Composition and Functional Group Characterization and Analysis
2.3. Laws and Control Factors of TC Degradation in Water by BC-nZVI/PS System
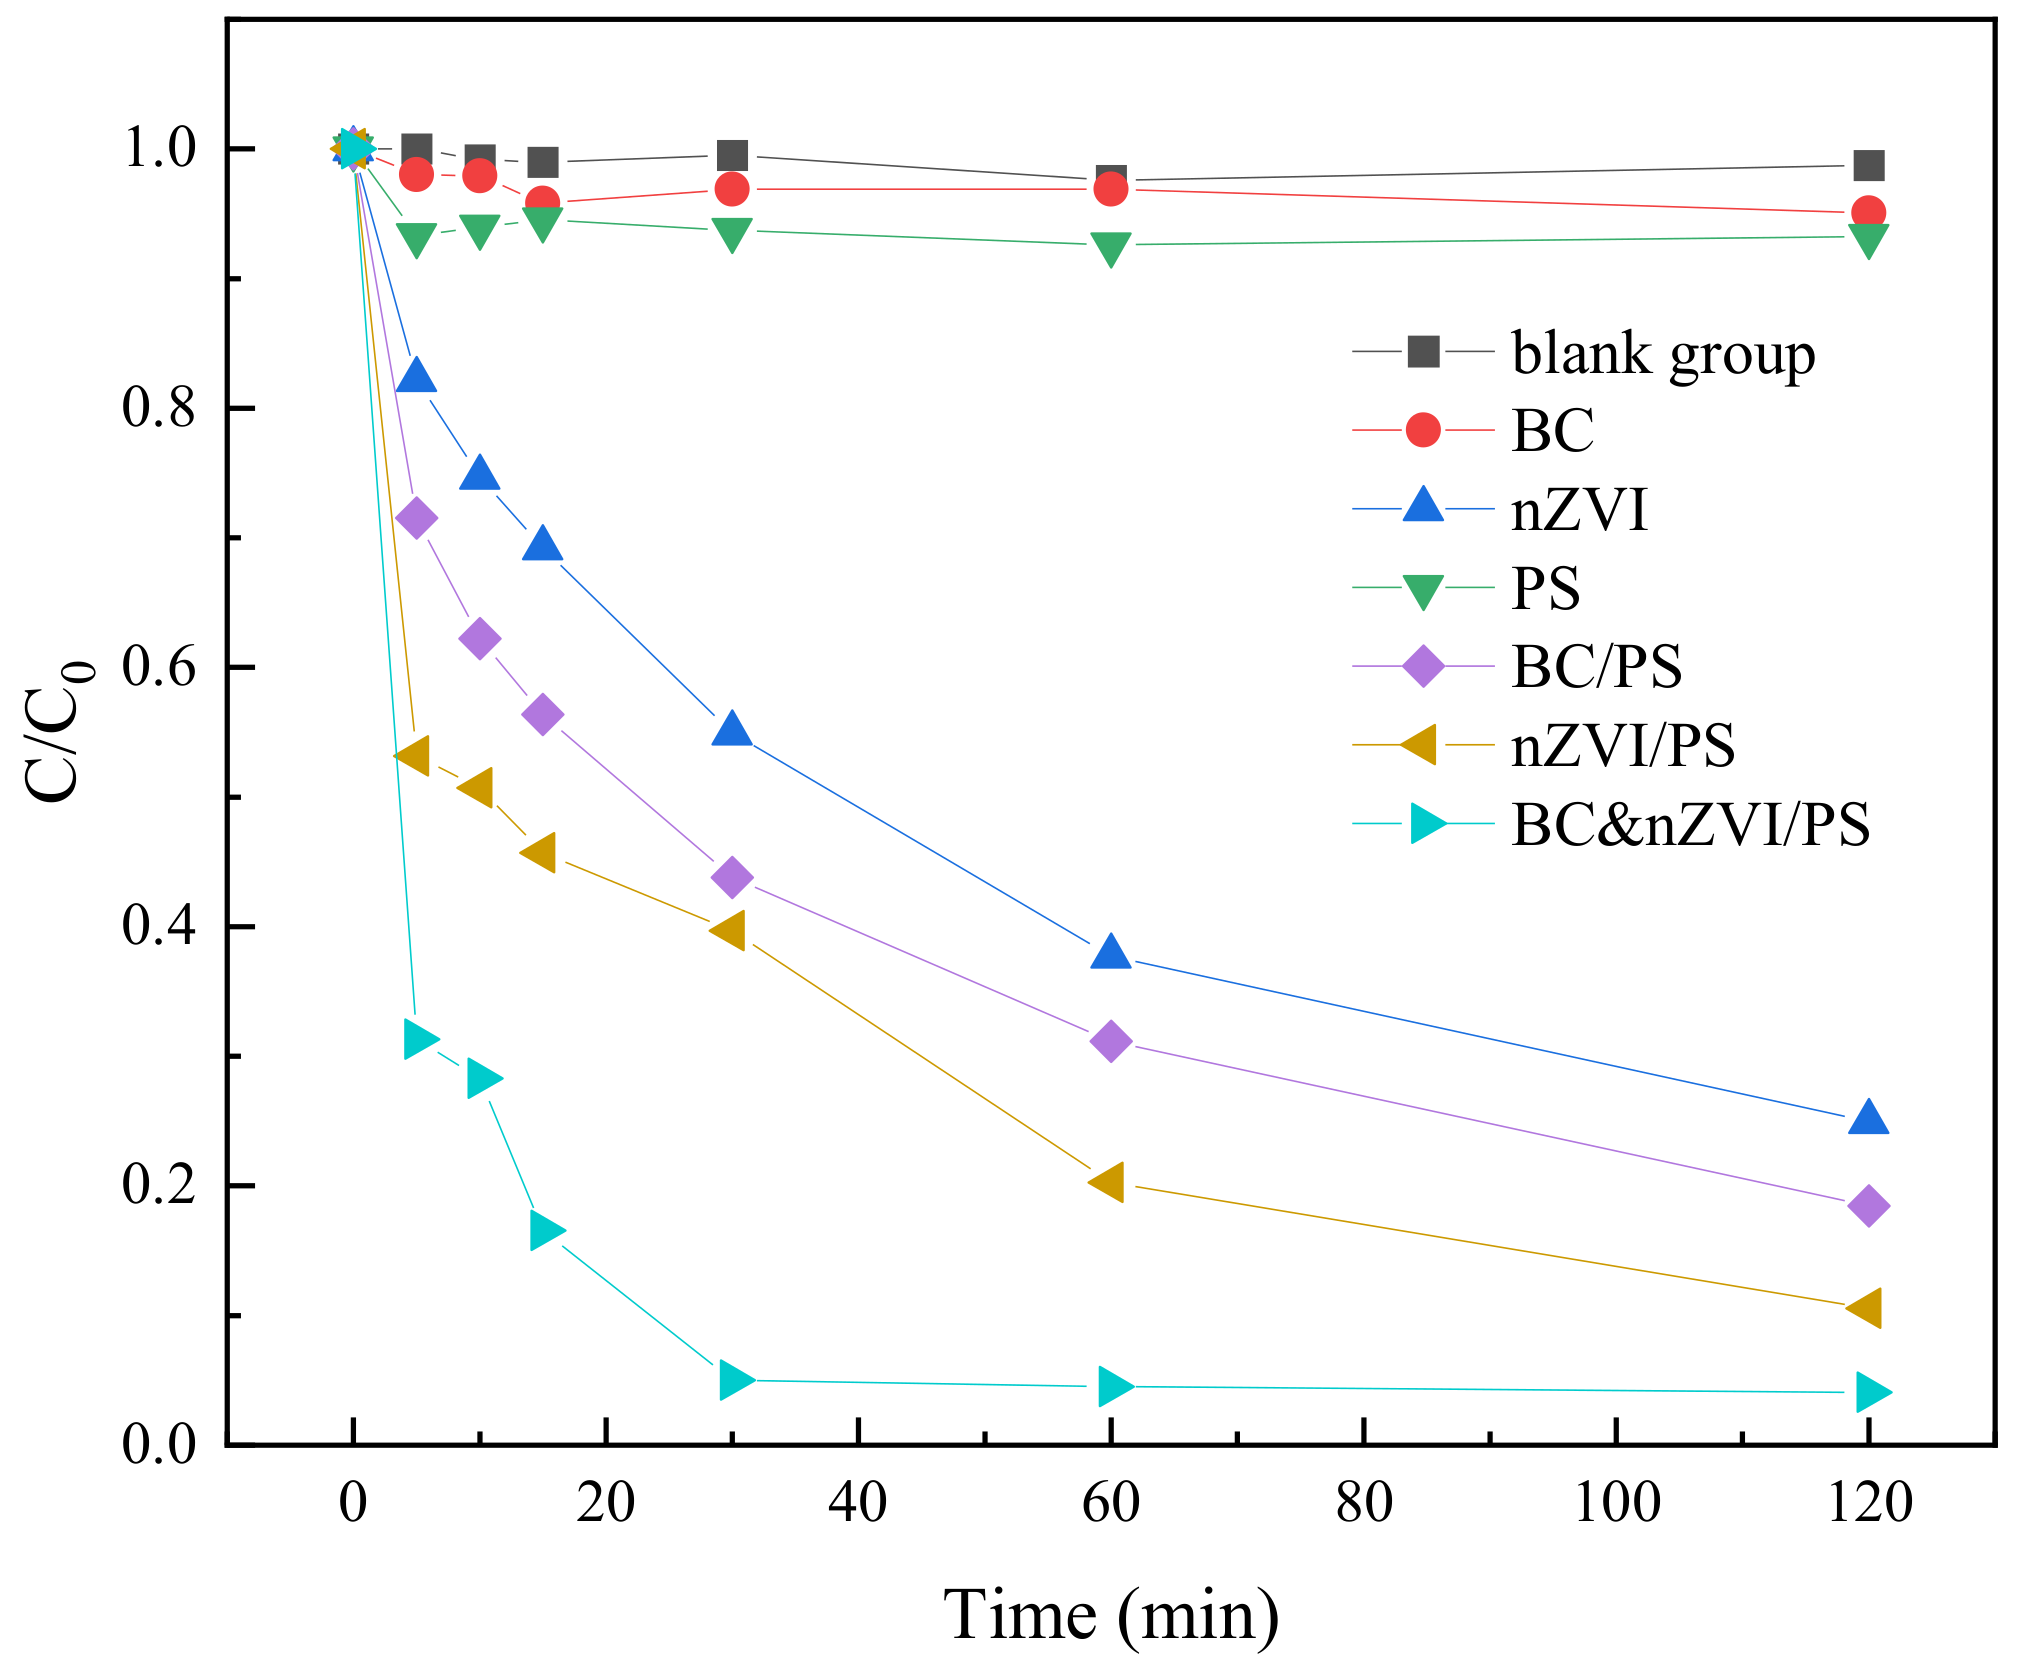
2.3.1. Characterization of the Degradation of TC in Water by Reaction Systems of Different Classes of Activated Materials
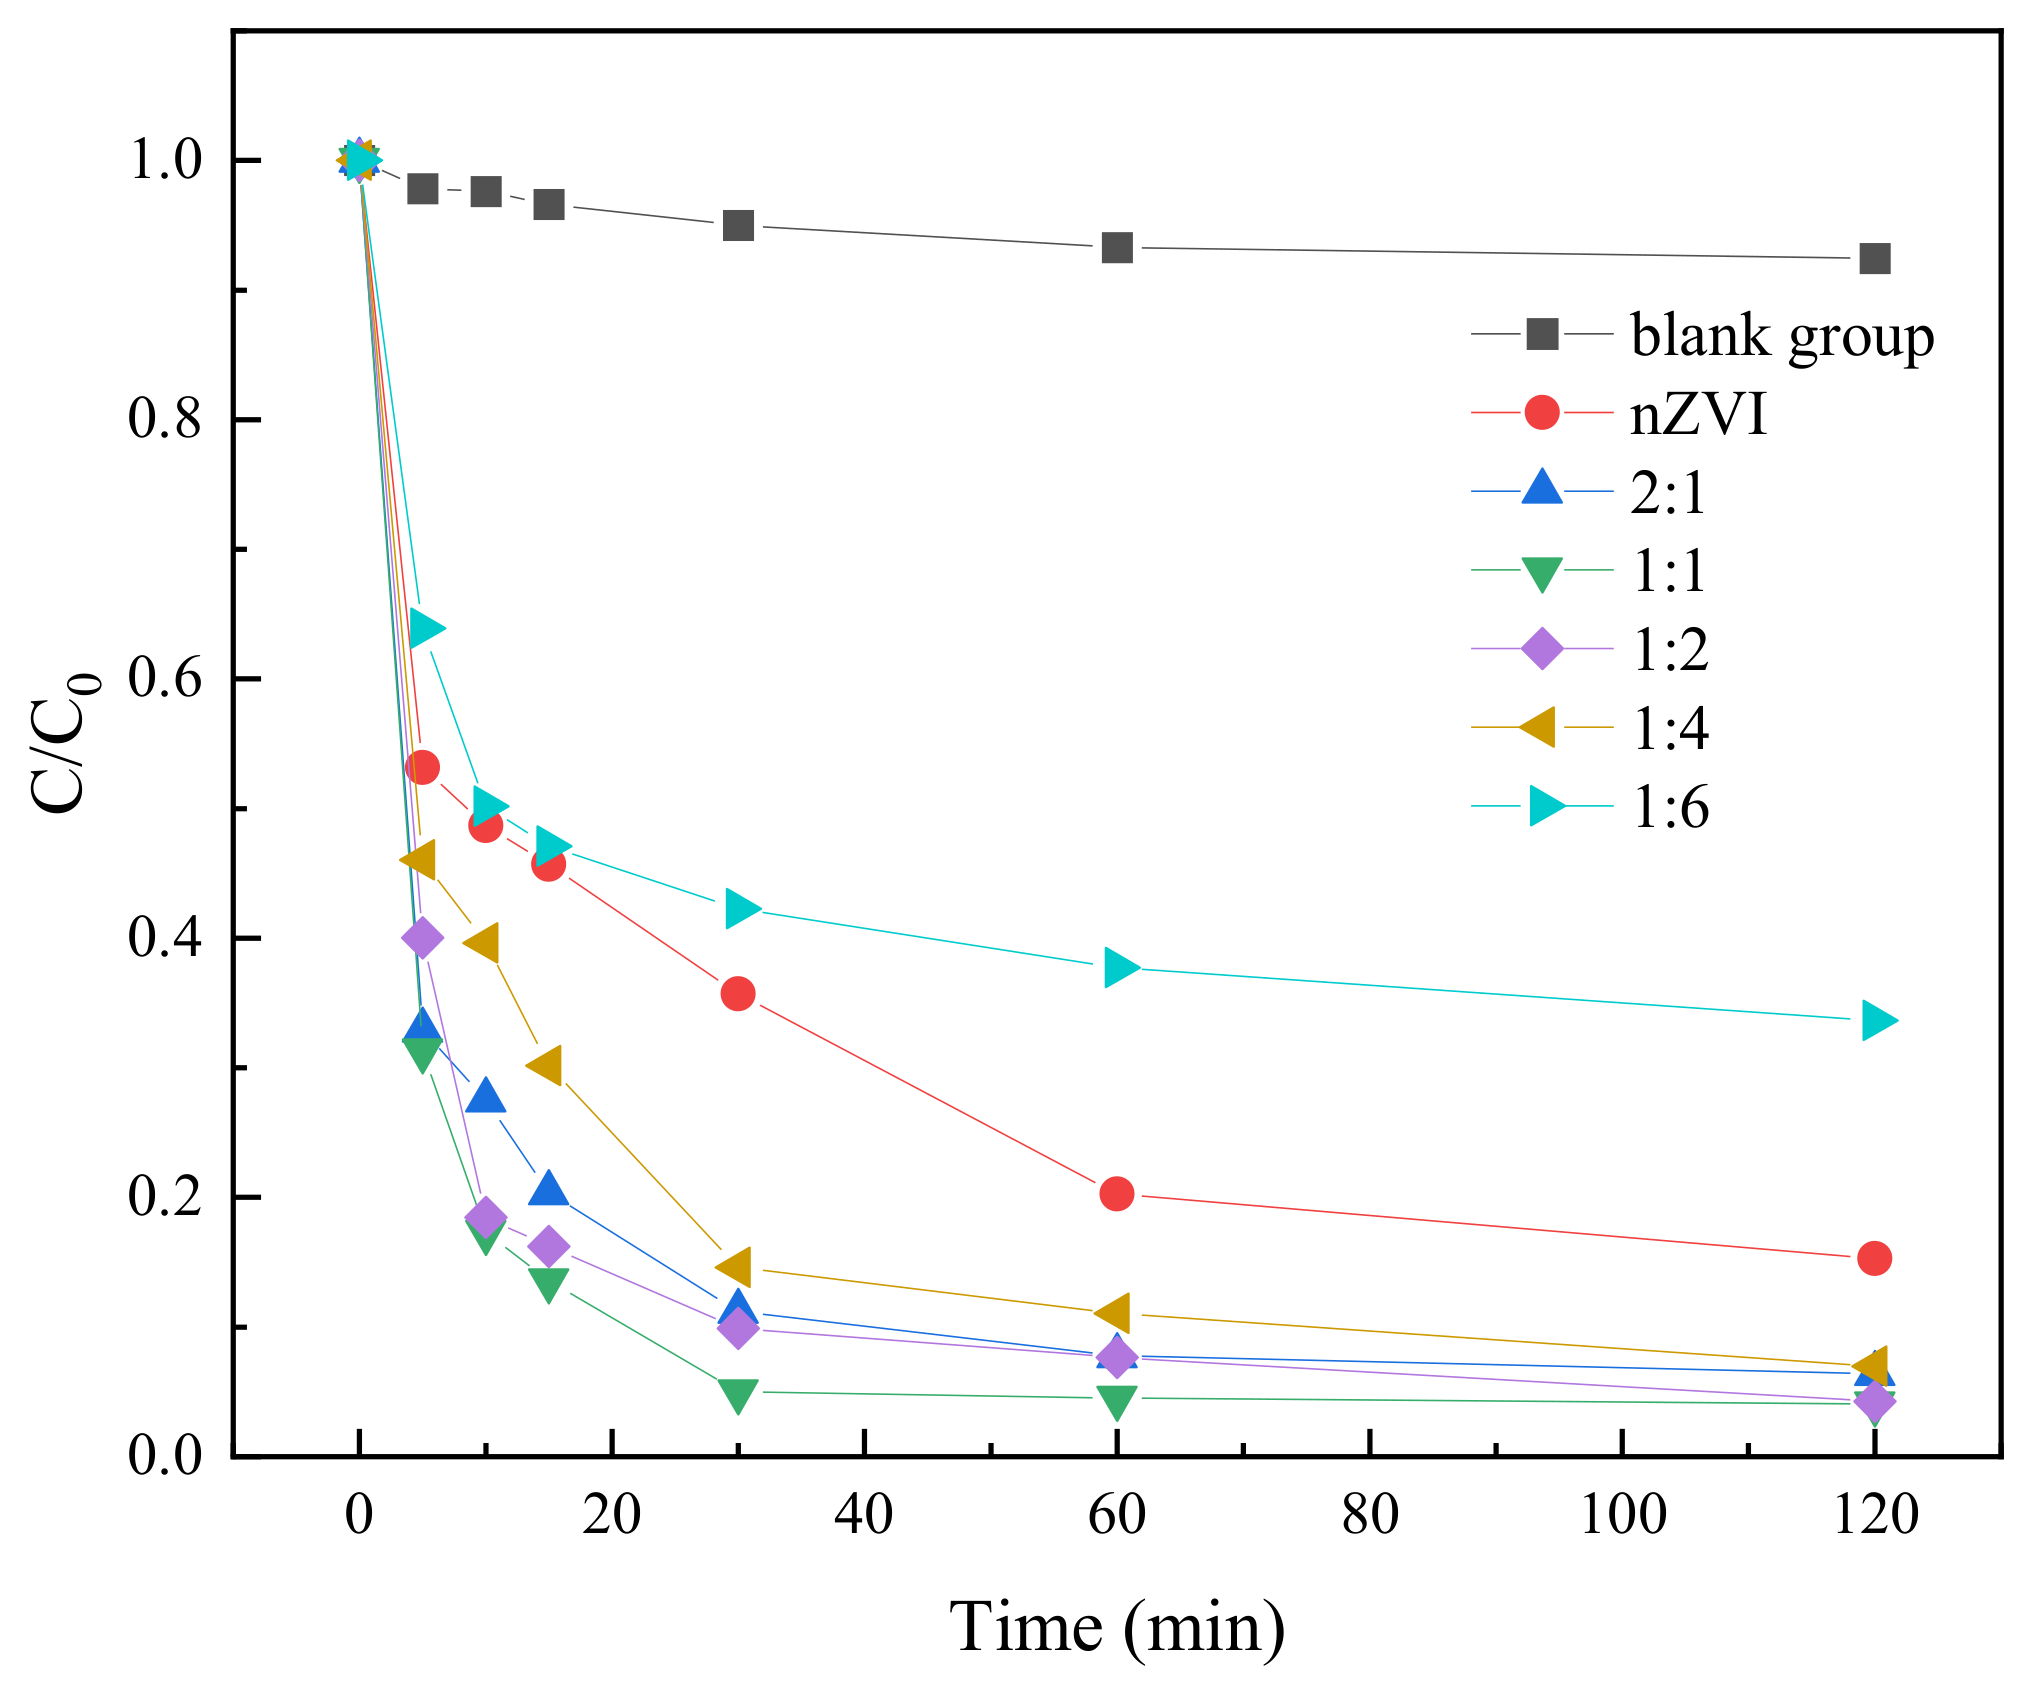
2.3.2. Effect of Different Iron–Carbon Ratios on the Degradation of TC in Water
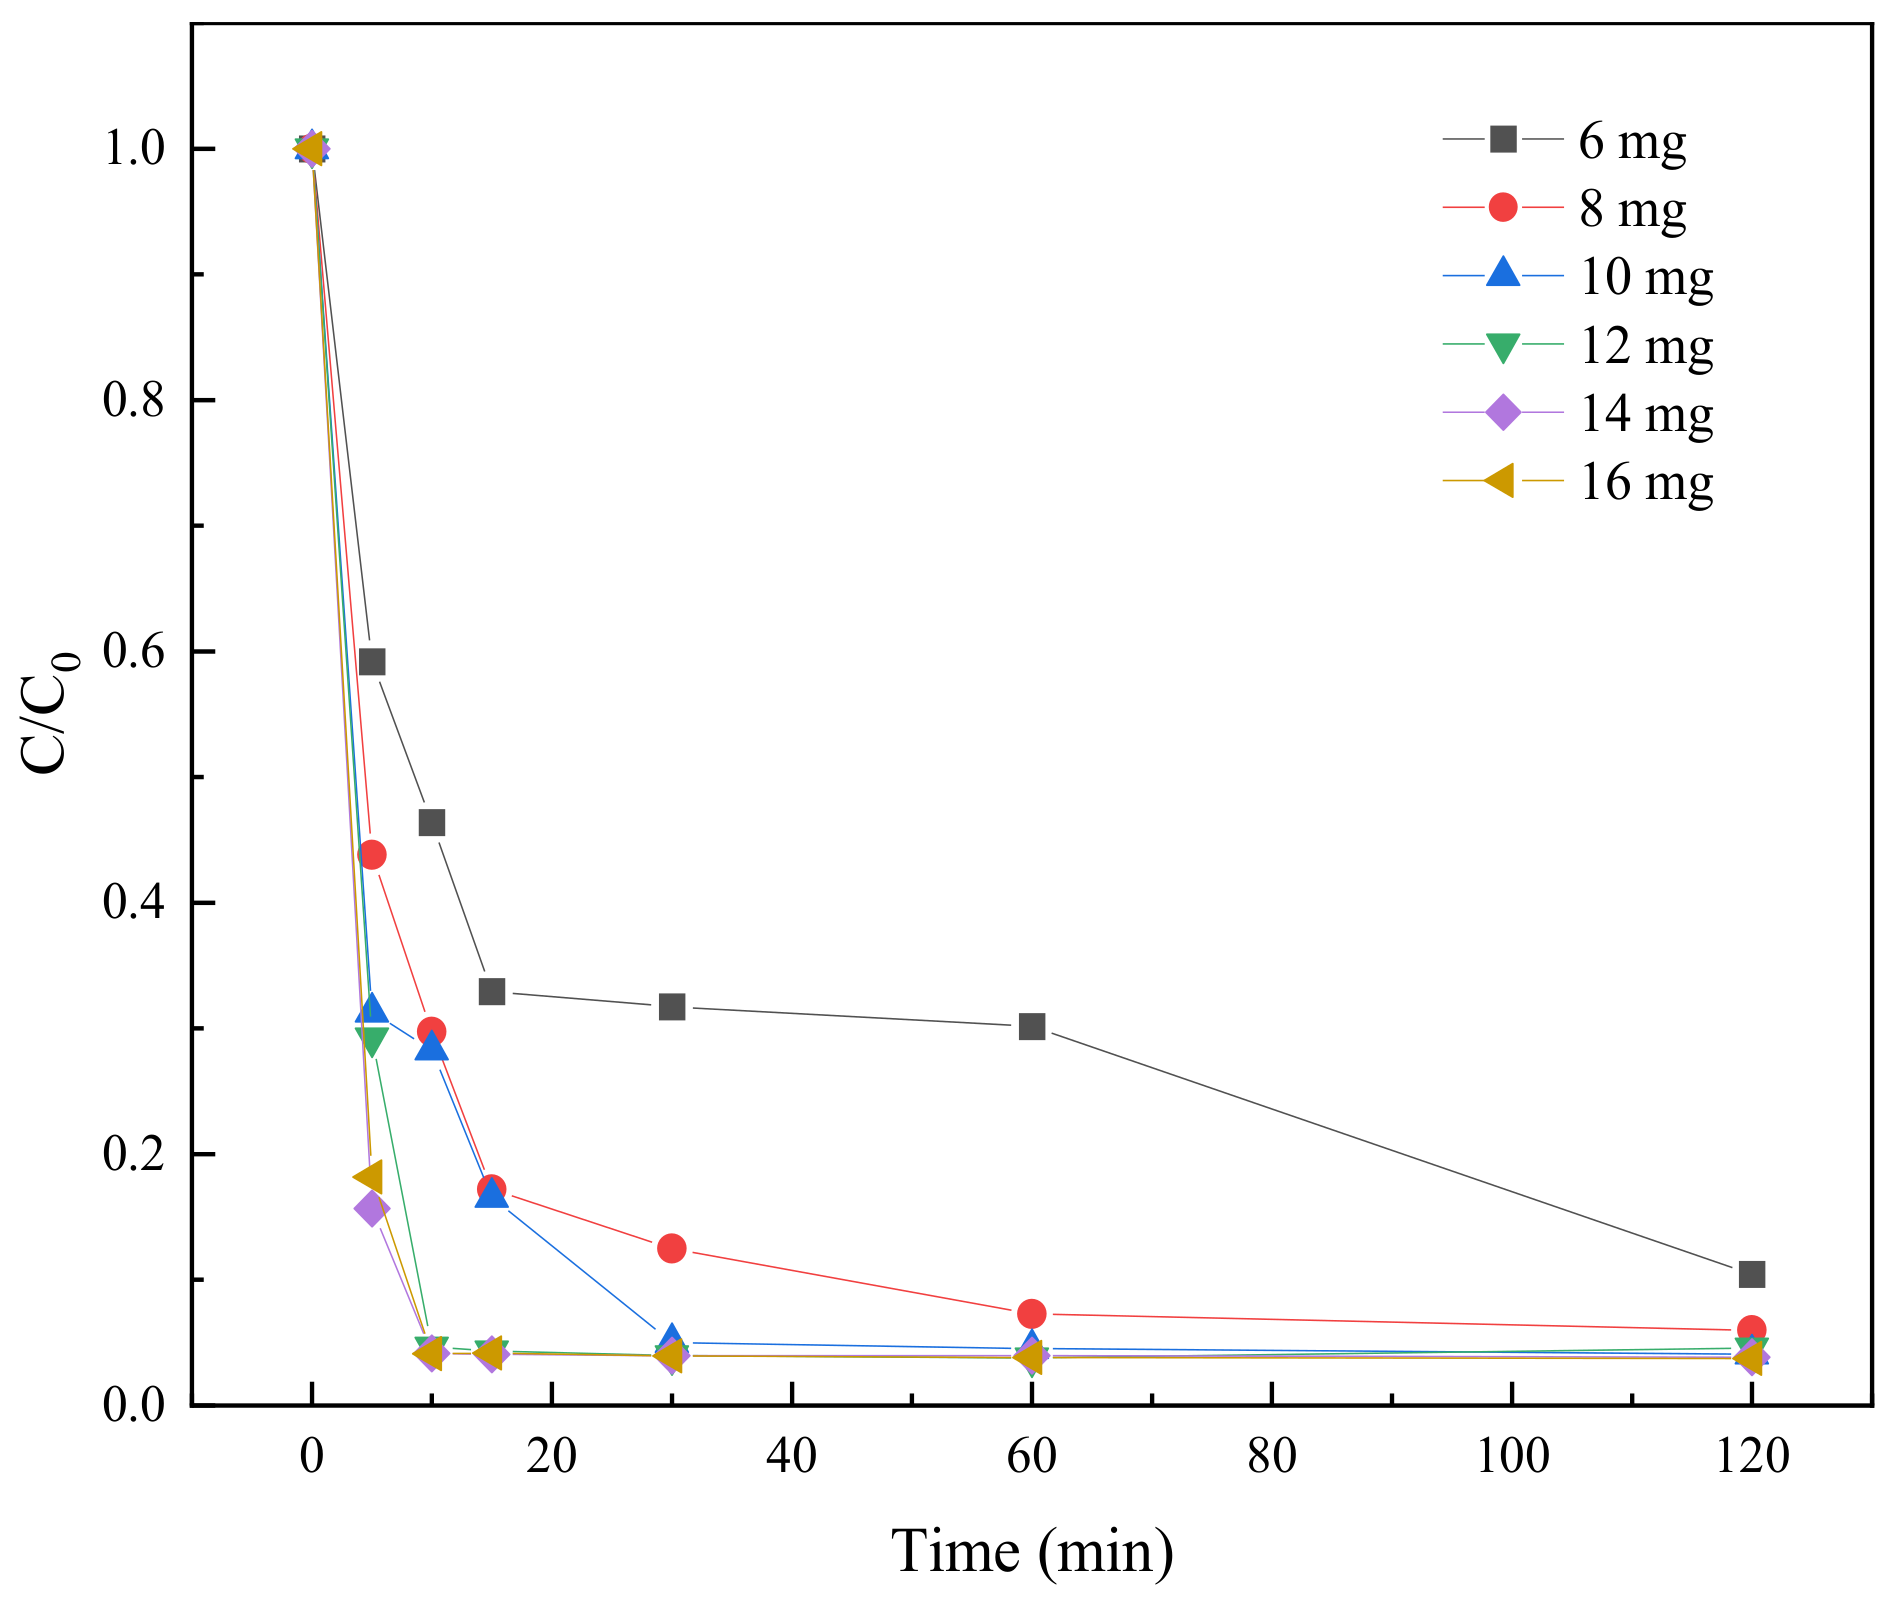
2.3.3. Effect of BC-nZVI Dosage on TC Degradation
2.3.4. Effect of Initial TC Concentration on Degradation
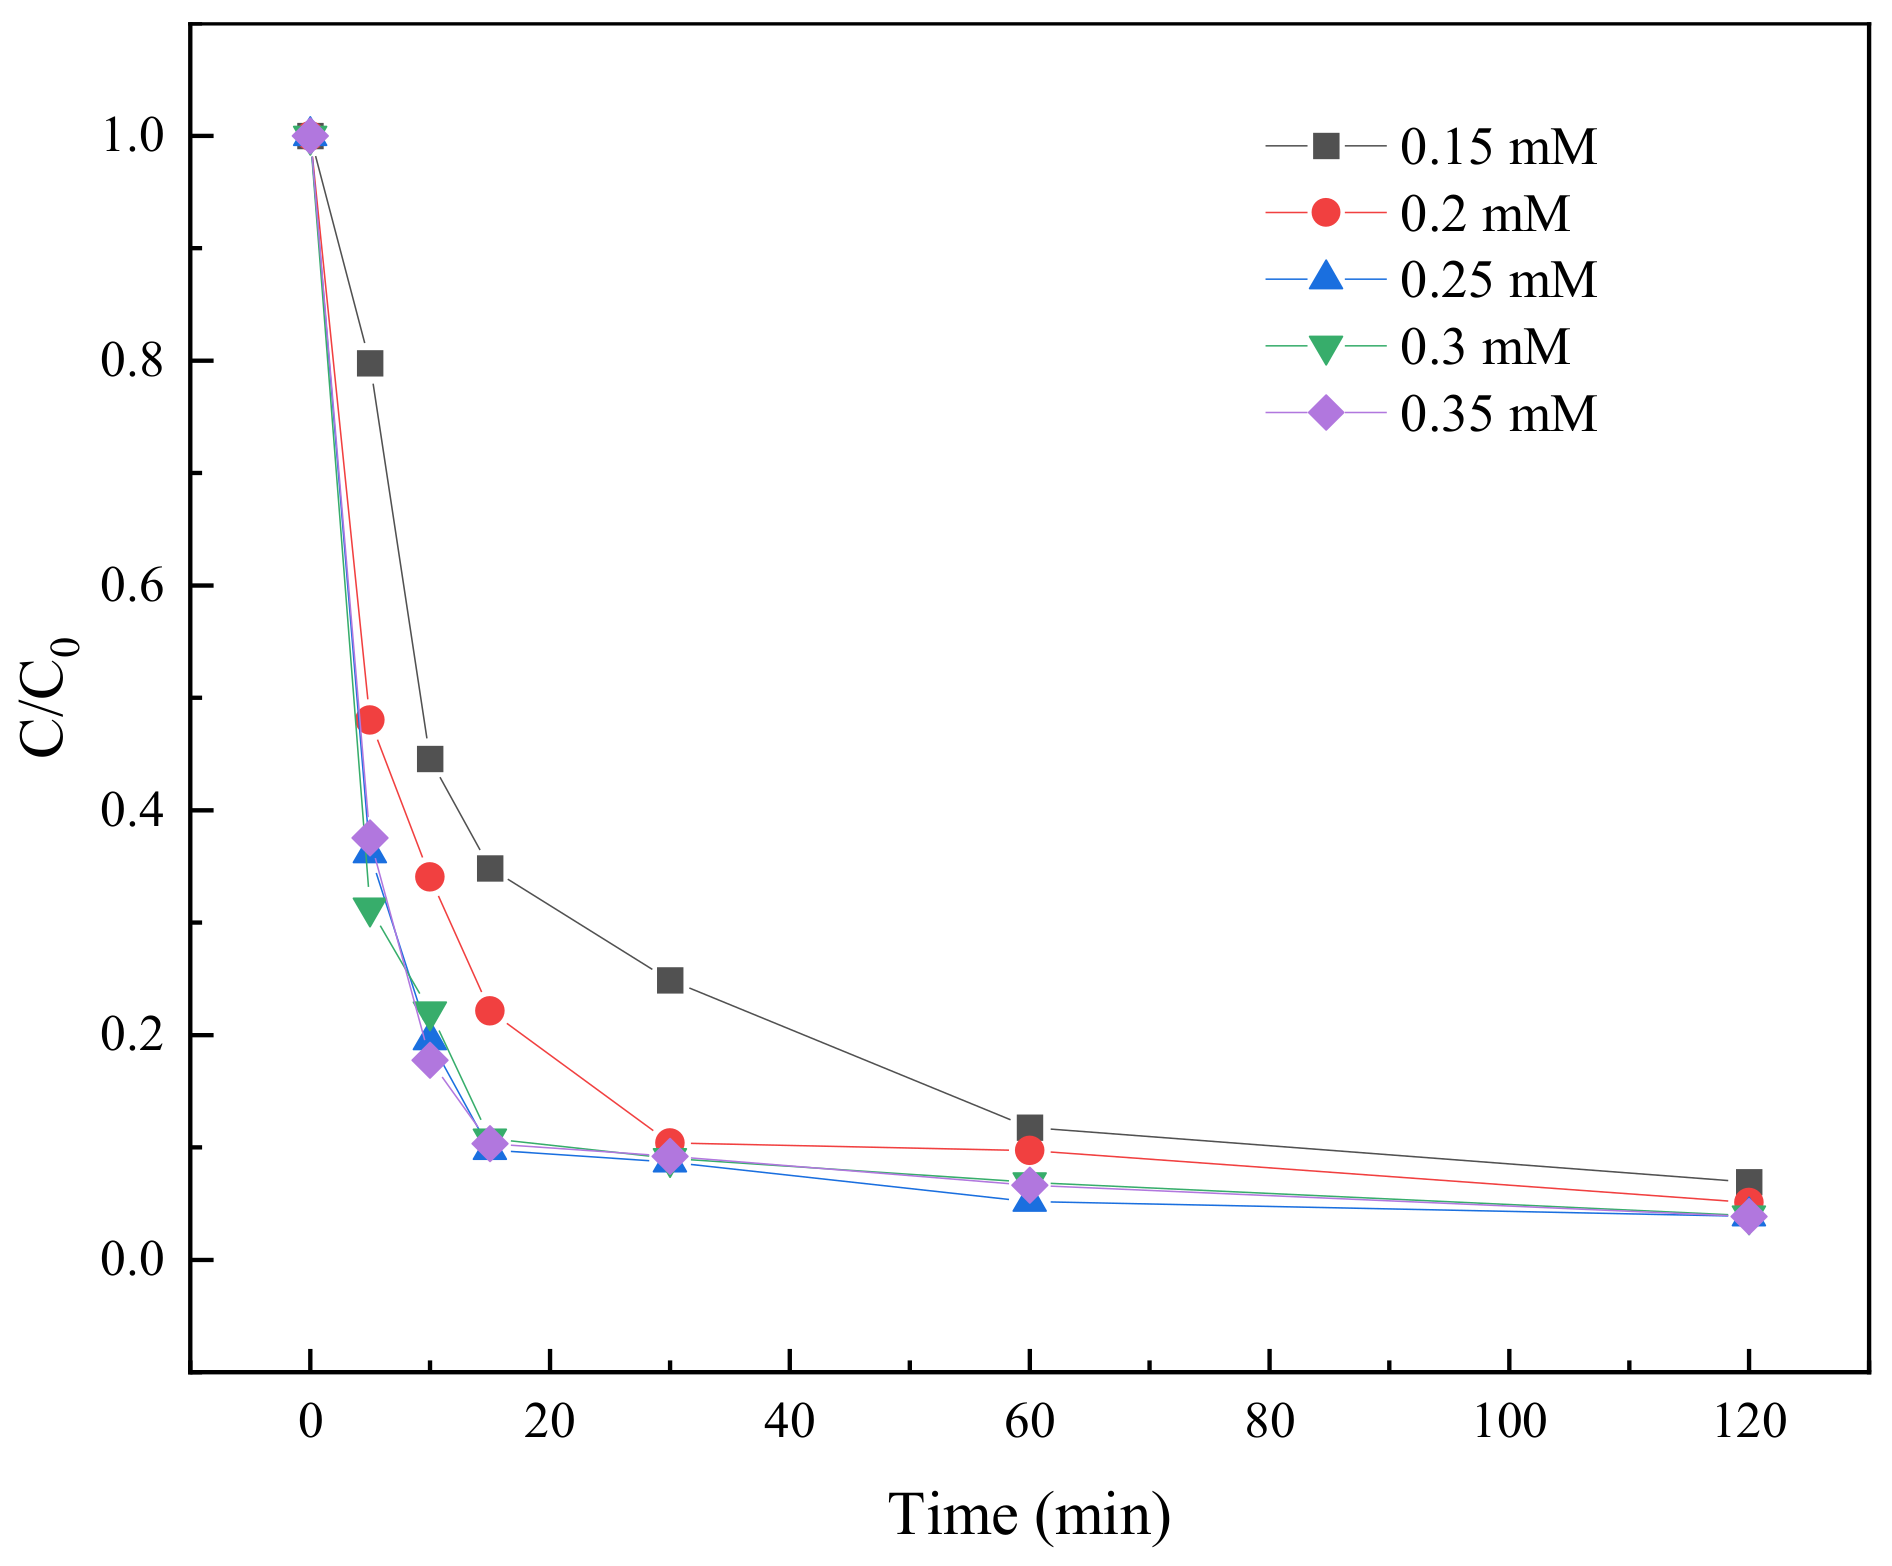
2.3.5. Effect of PS Concentration on TC Degradation
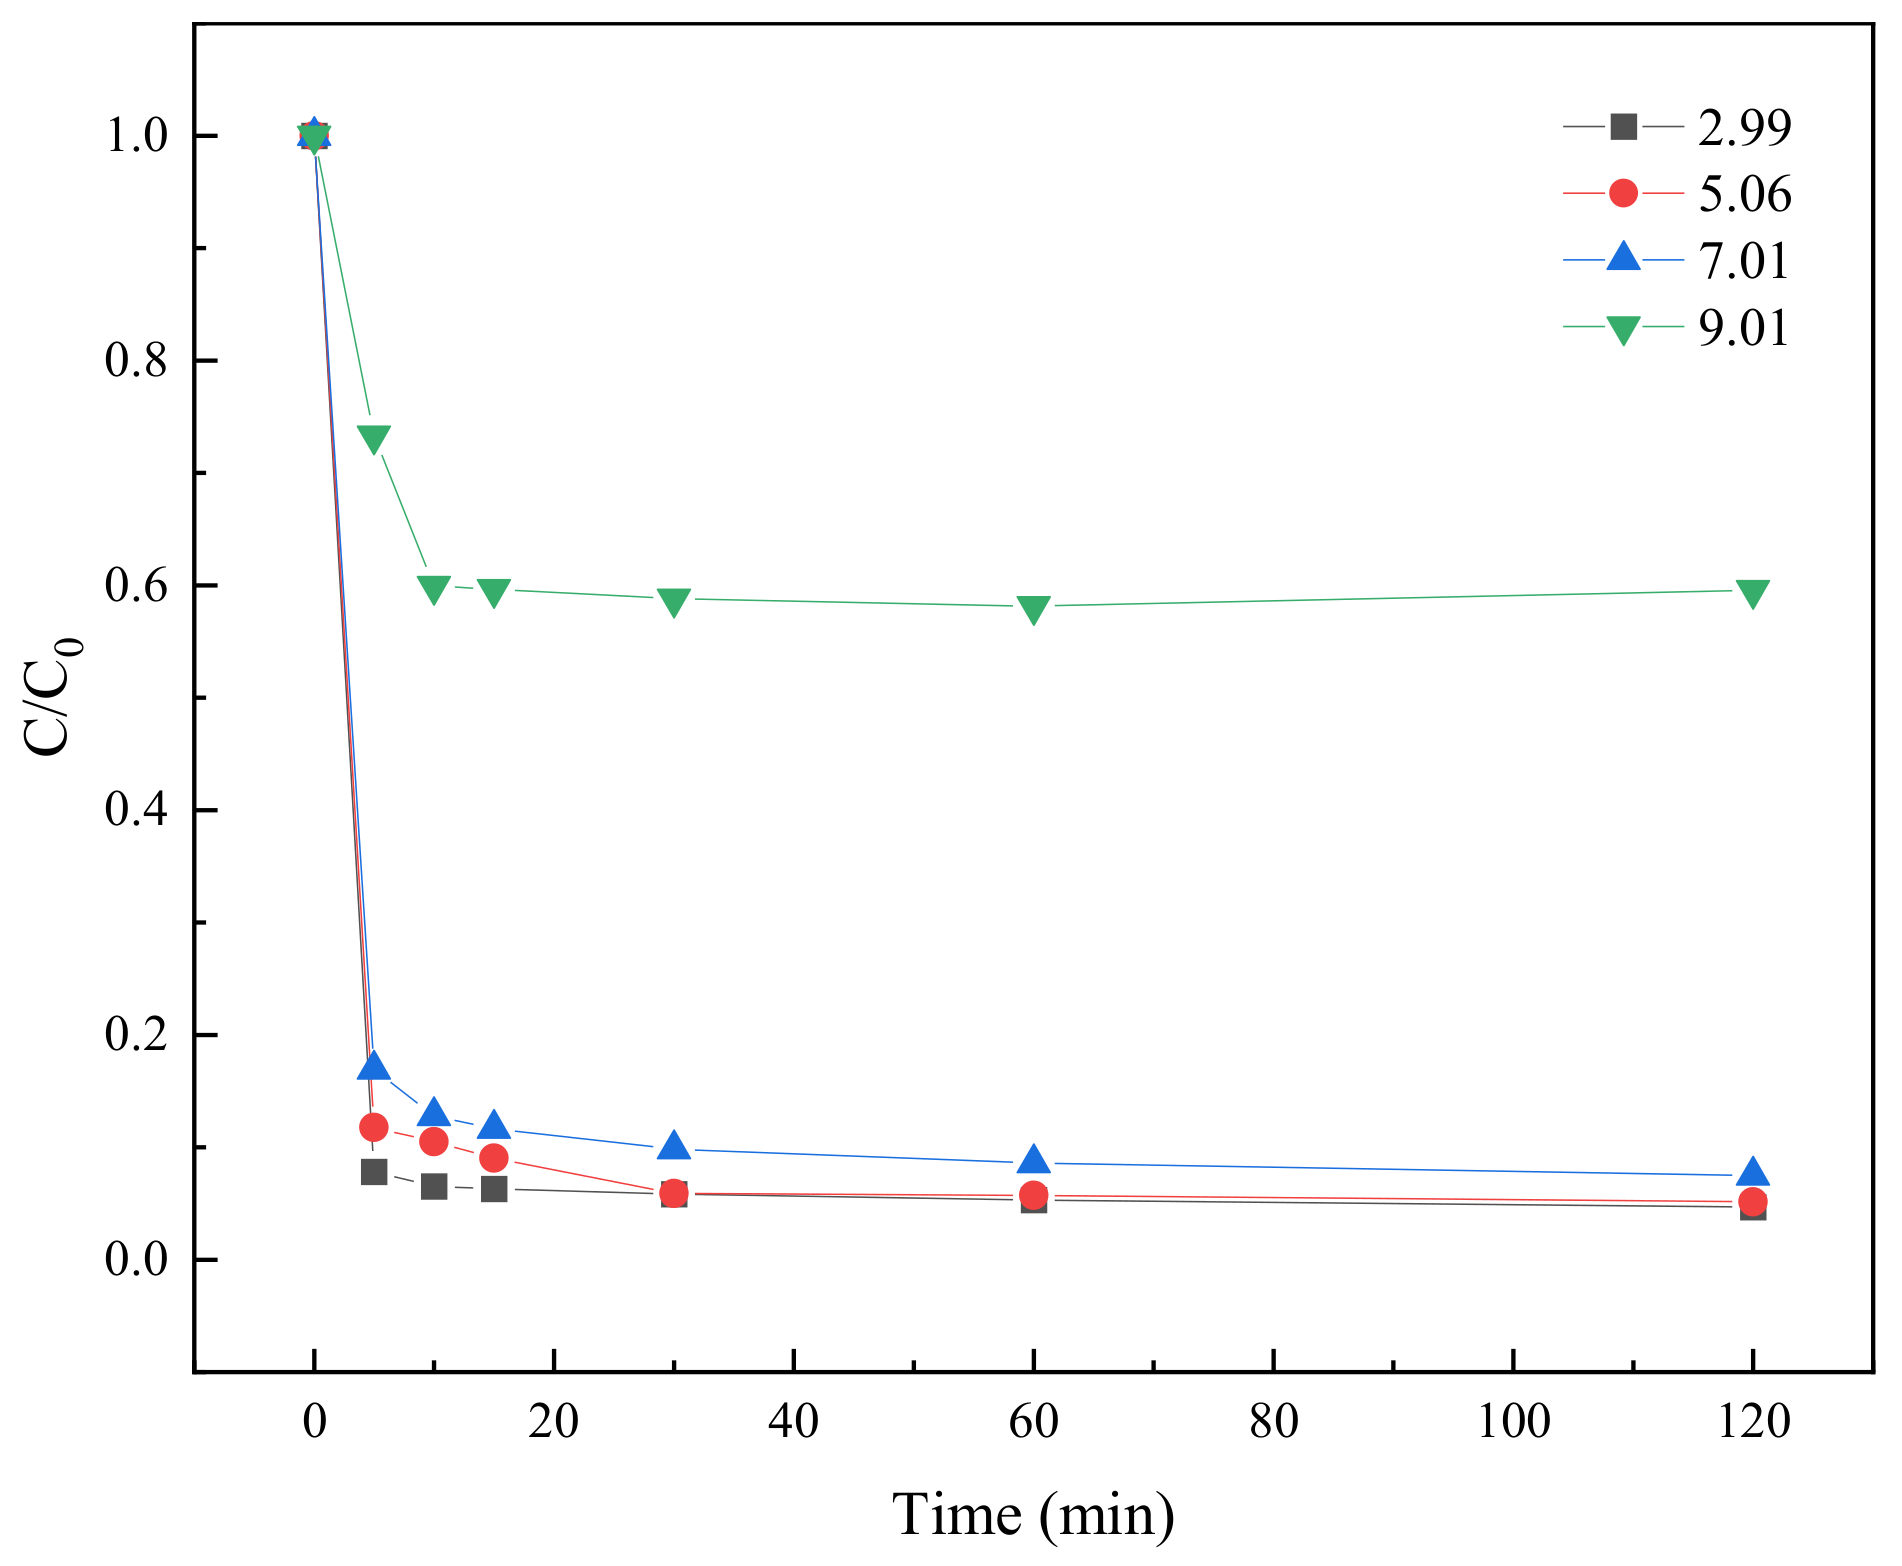
2.3.6. Effect of Different pH Values on TC Degradation
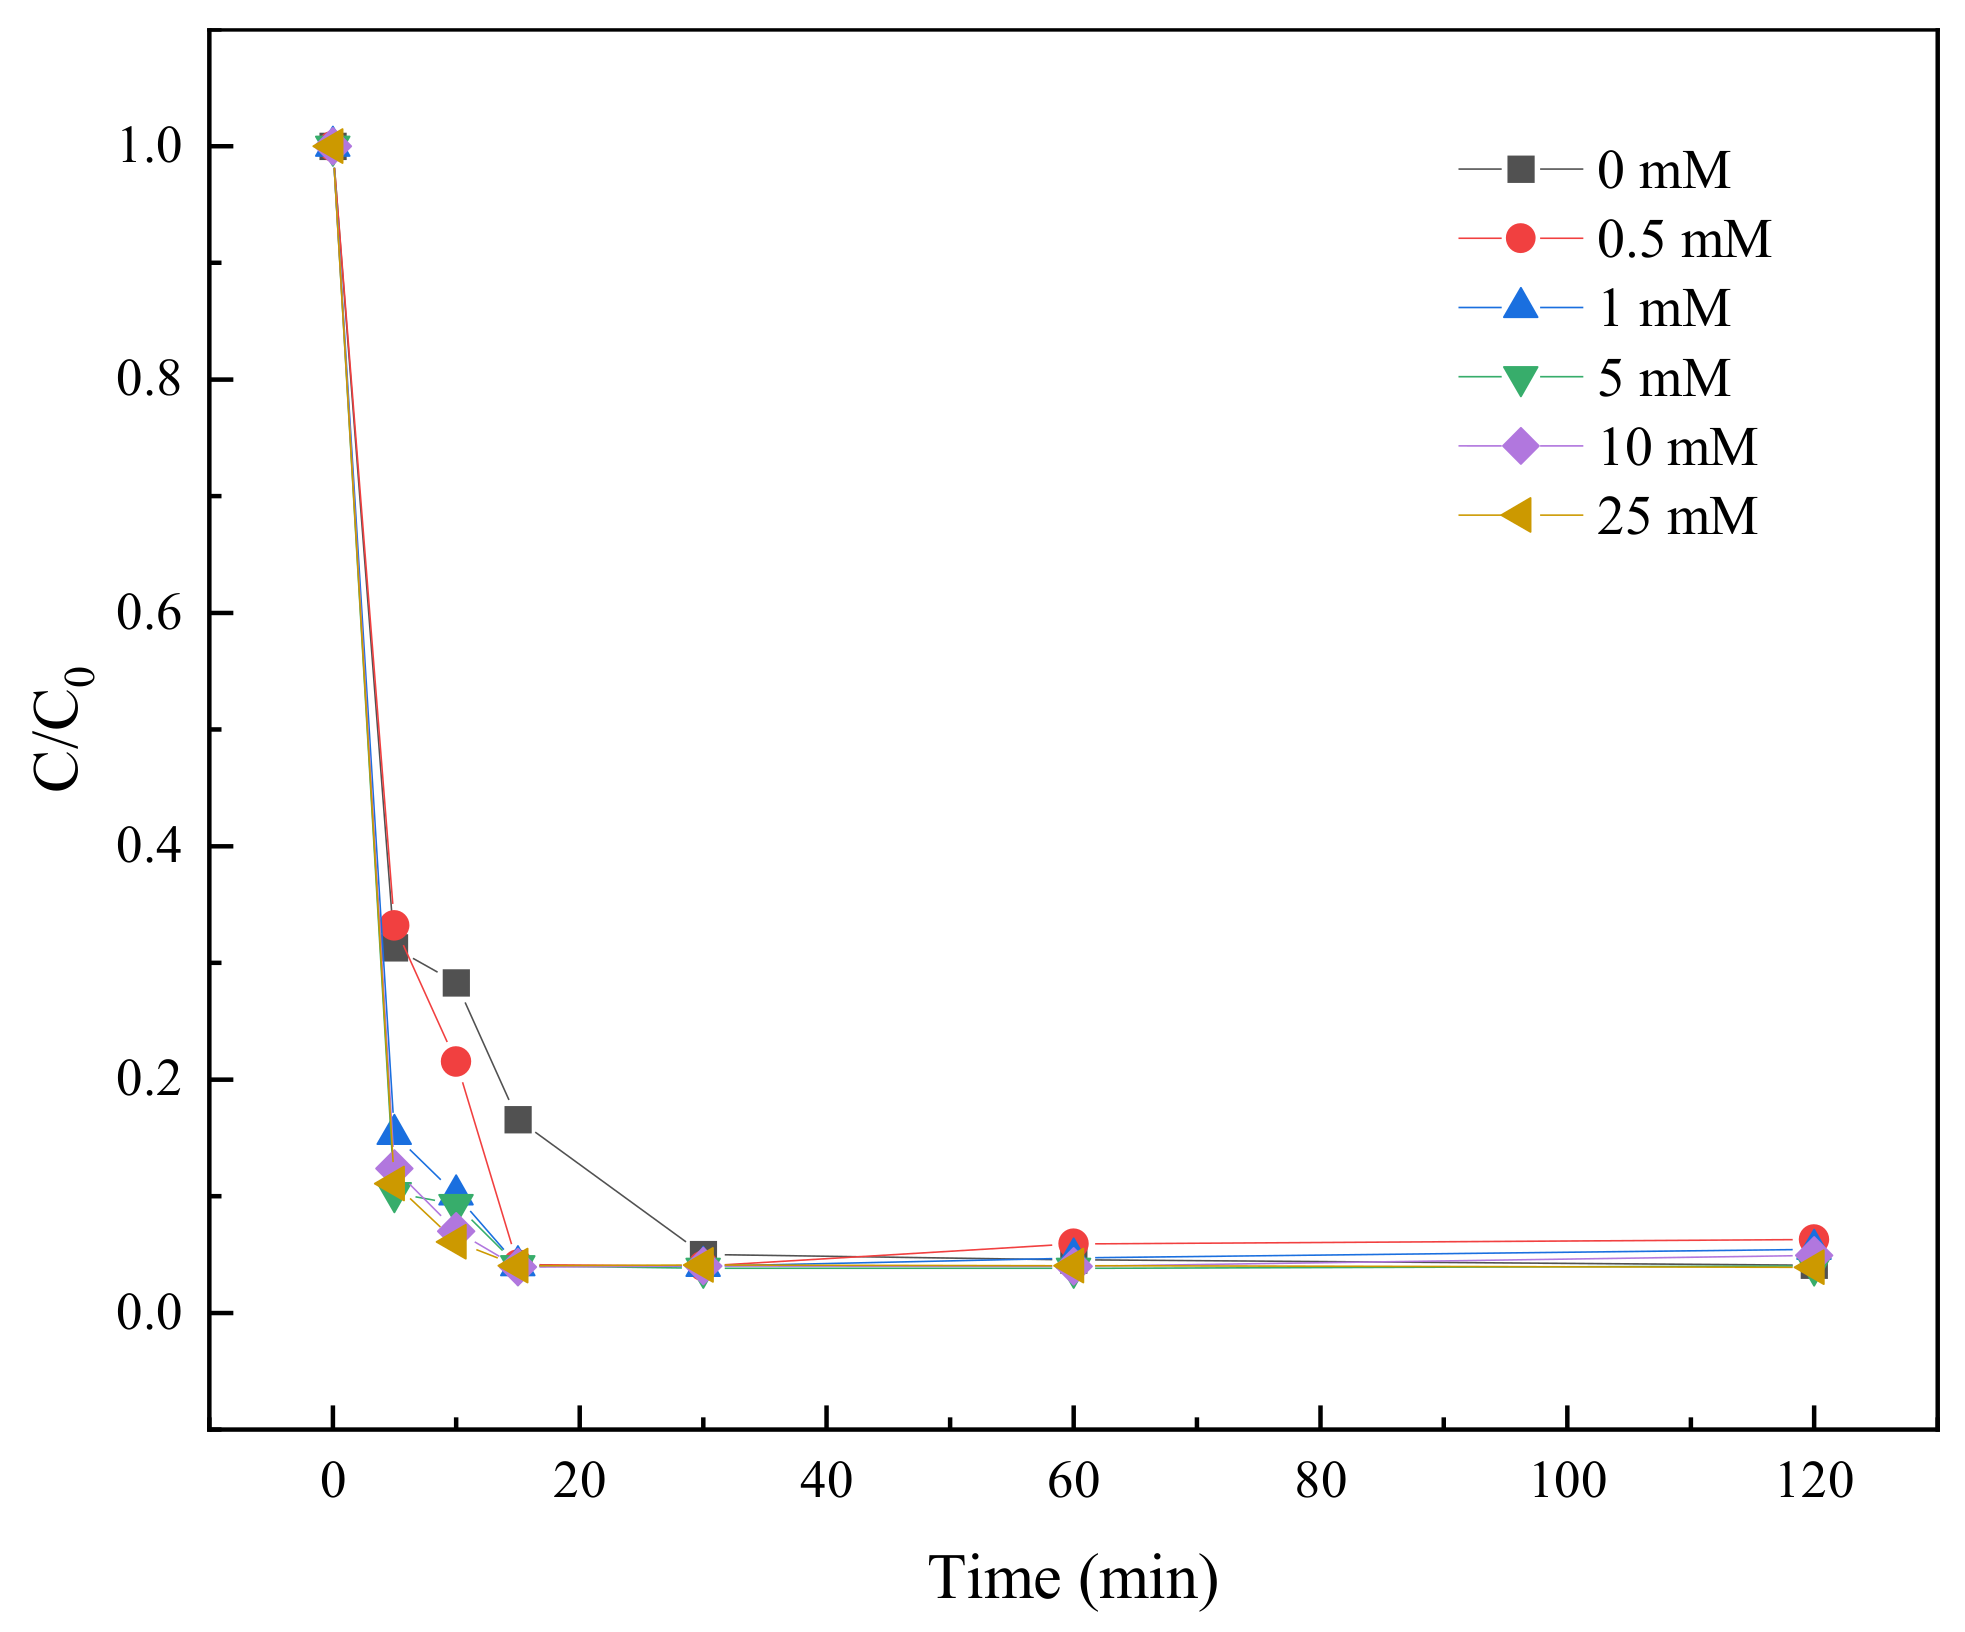
2.3.7. Effect of HCO3− on TC Degradation
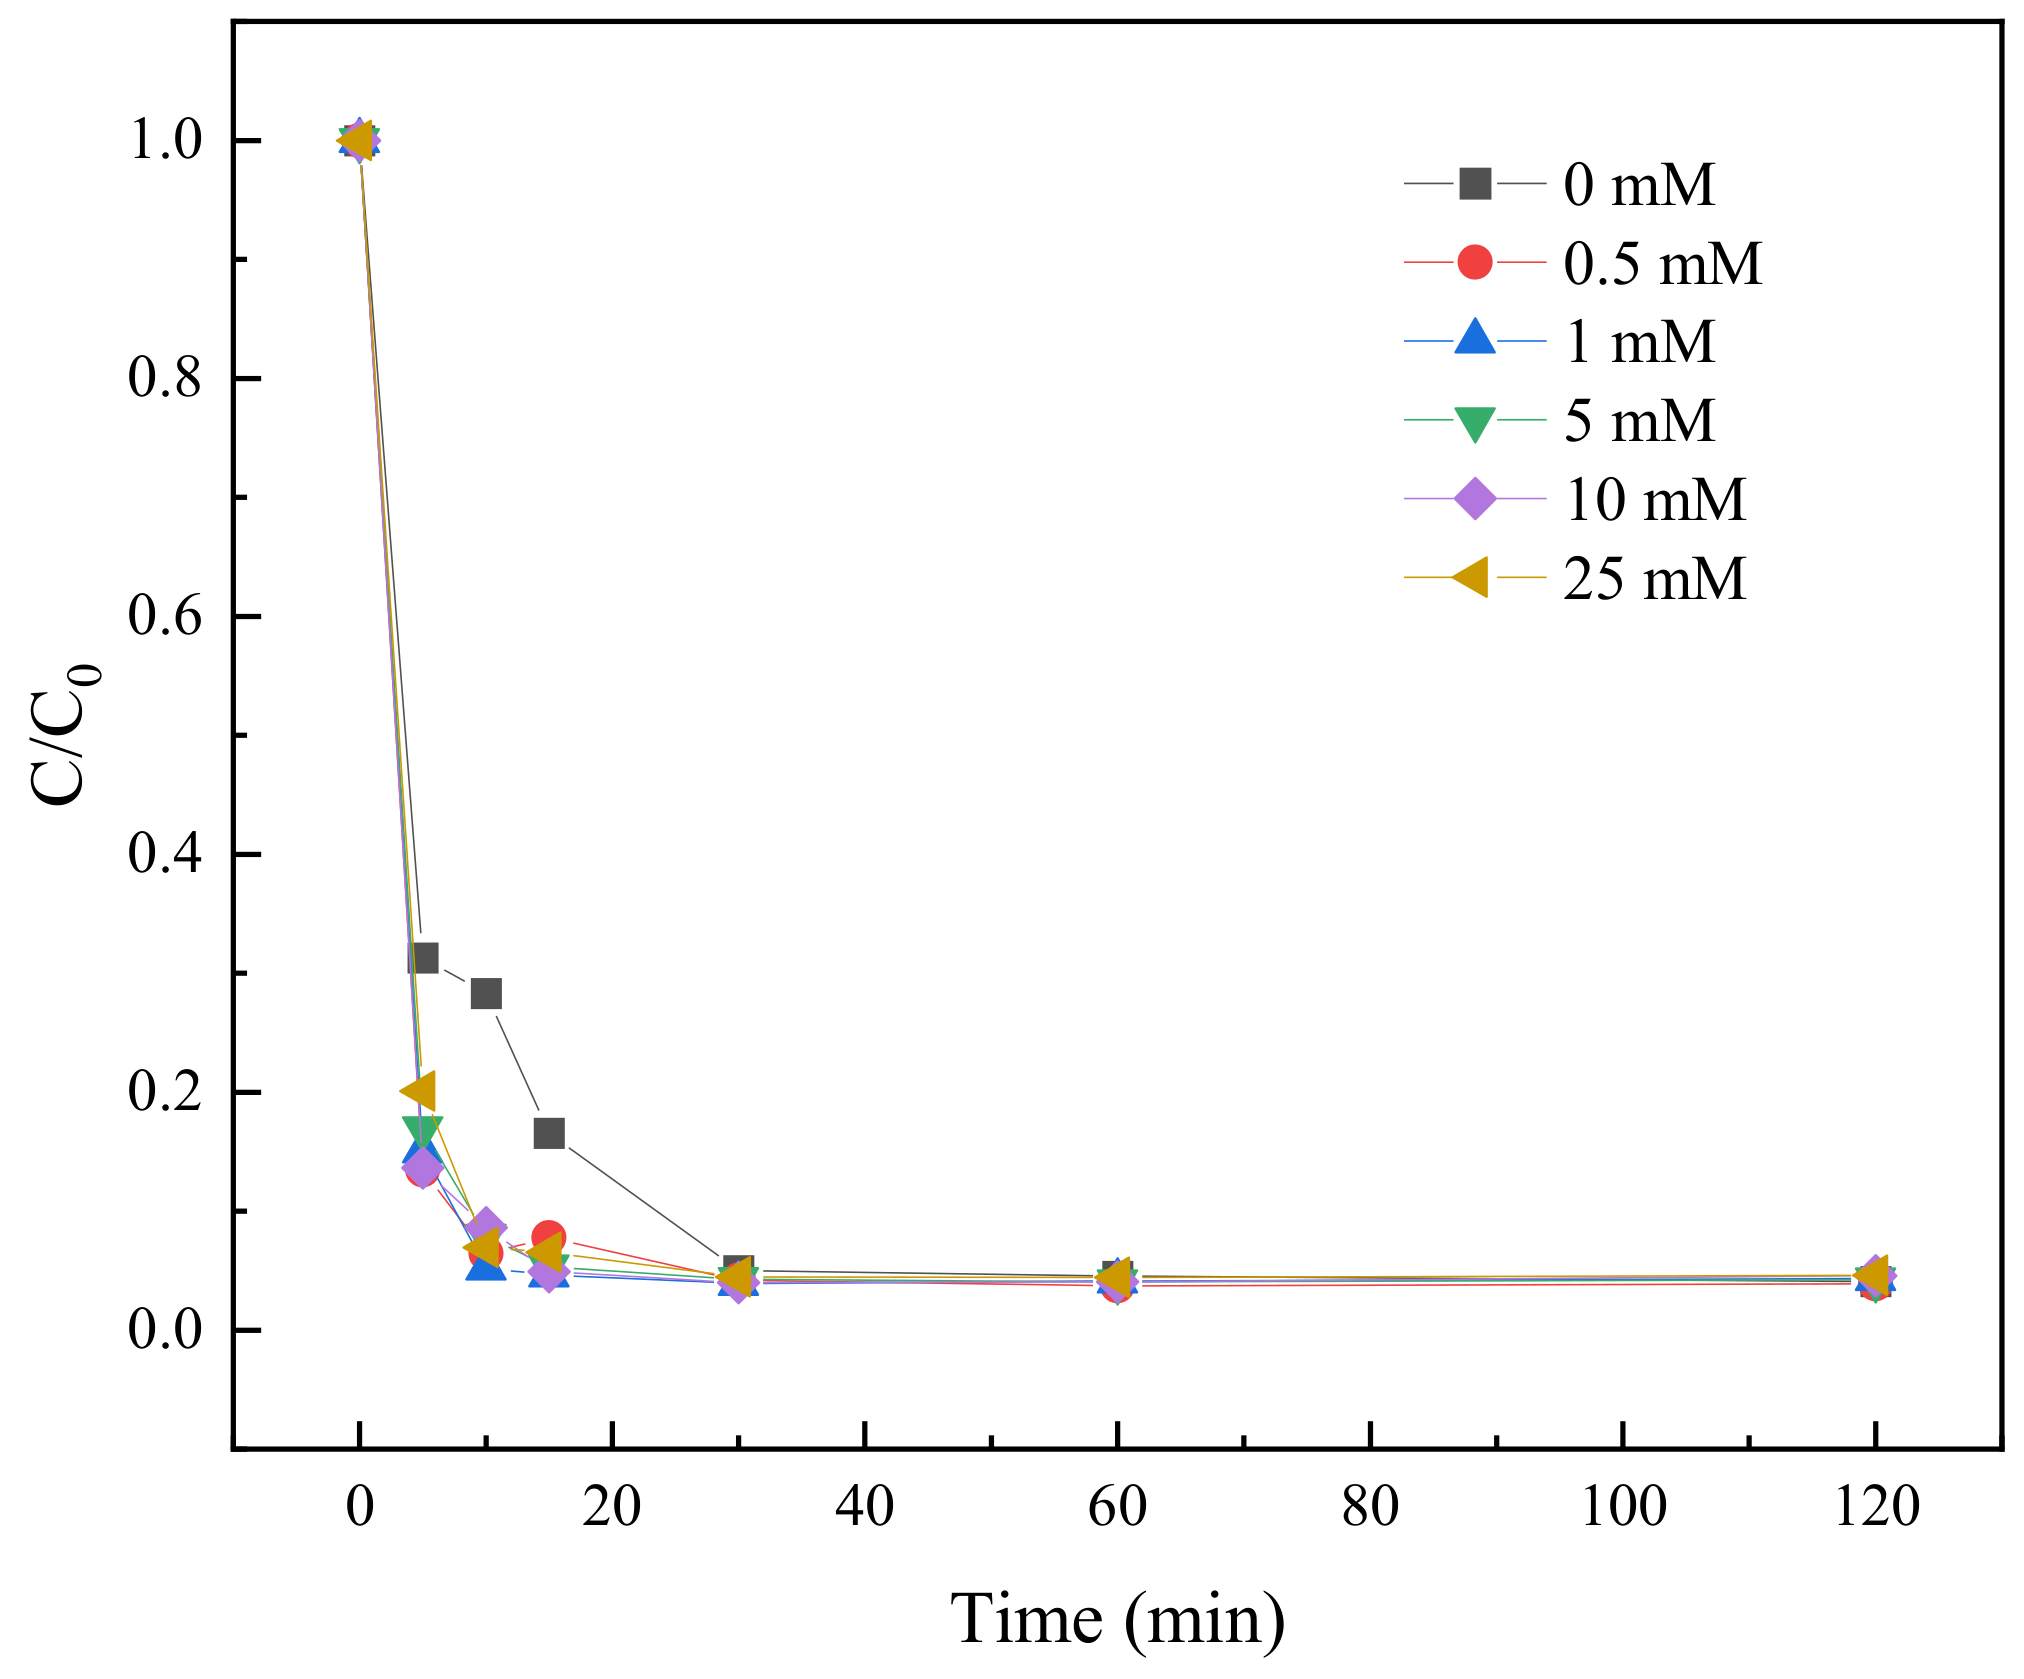
2.3.8. Effect of Cl− on TC Degradation
2.3.9. Effect of SO42− on TC Degradation
2.3.10. Raw Water Test
2.4. Mechanism of TC Degradation in Water by BC-nZVI/PS and Analysis of Degradation Products
2.4.1. Free Radical Quenching Experiment
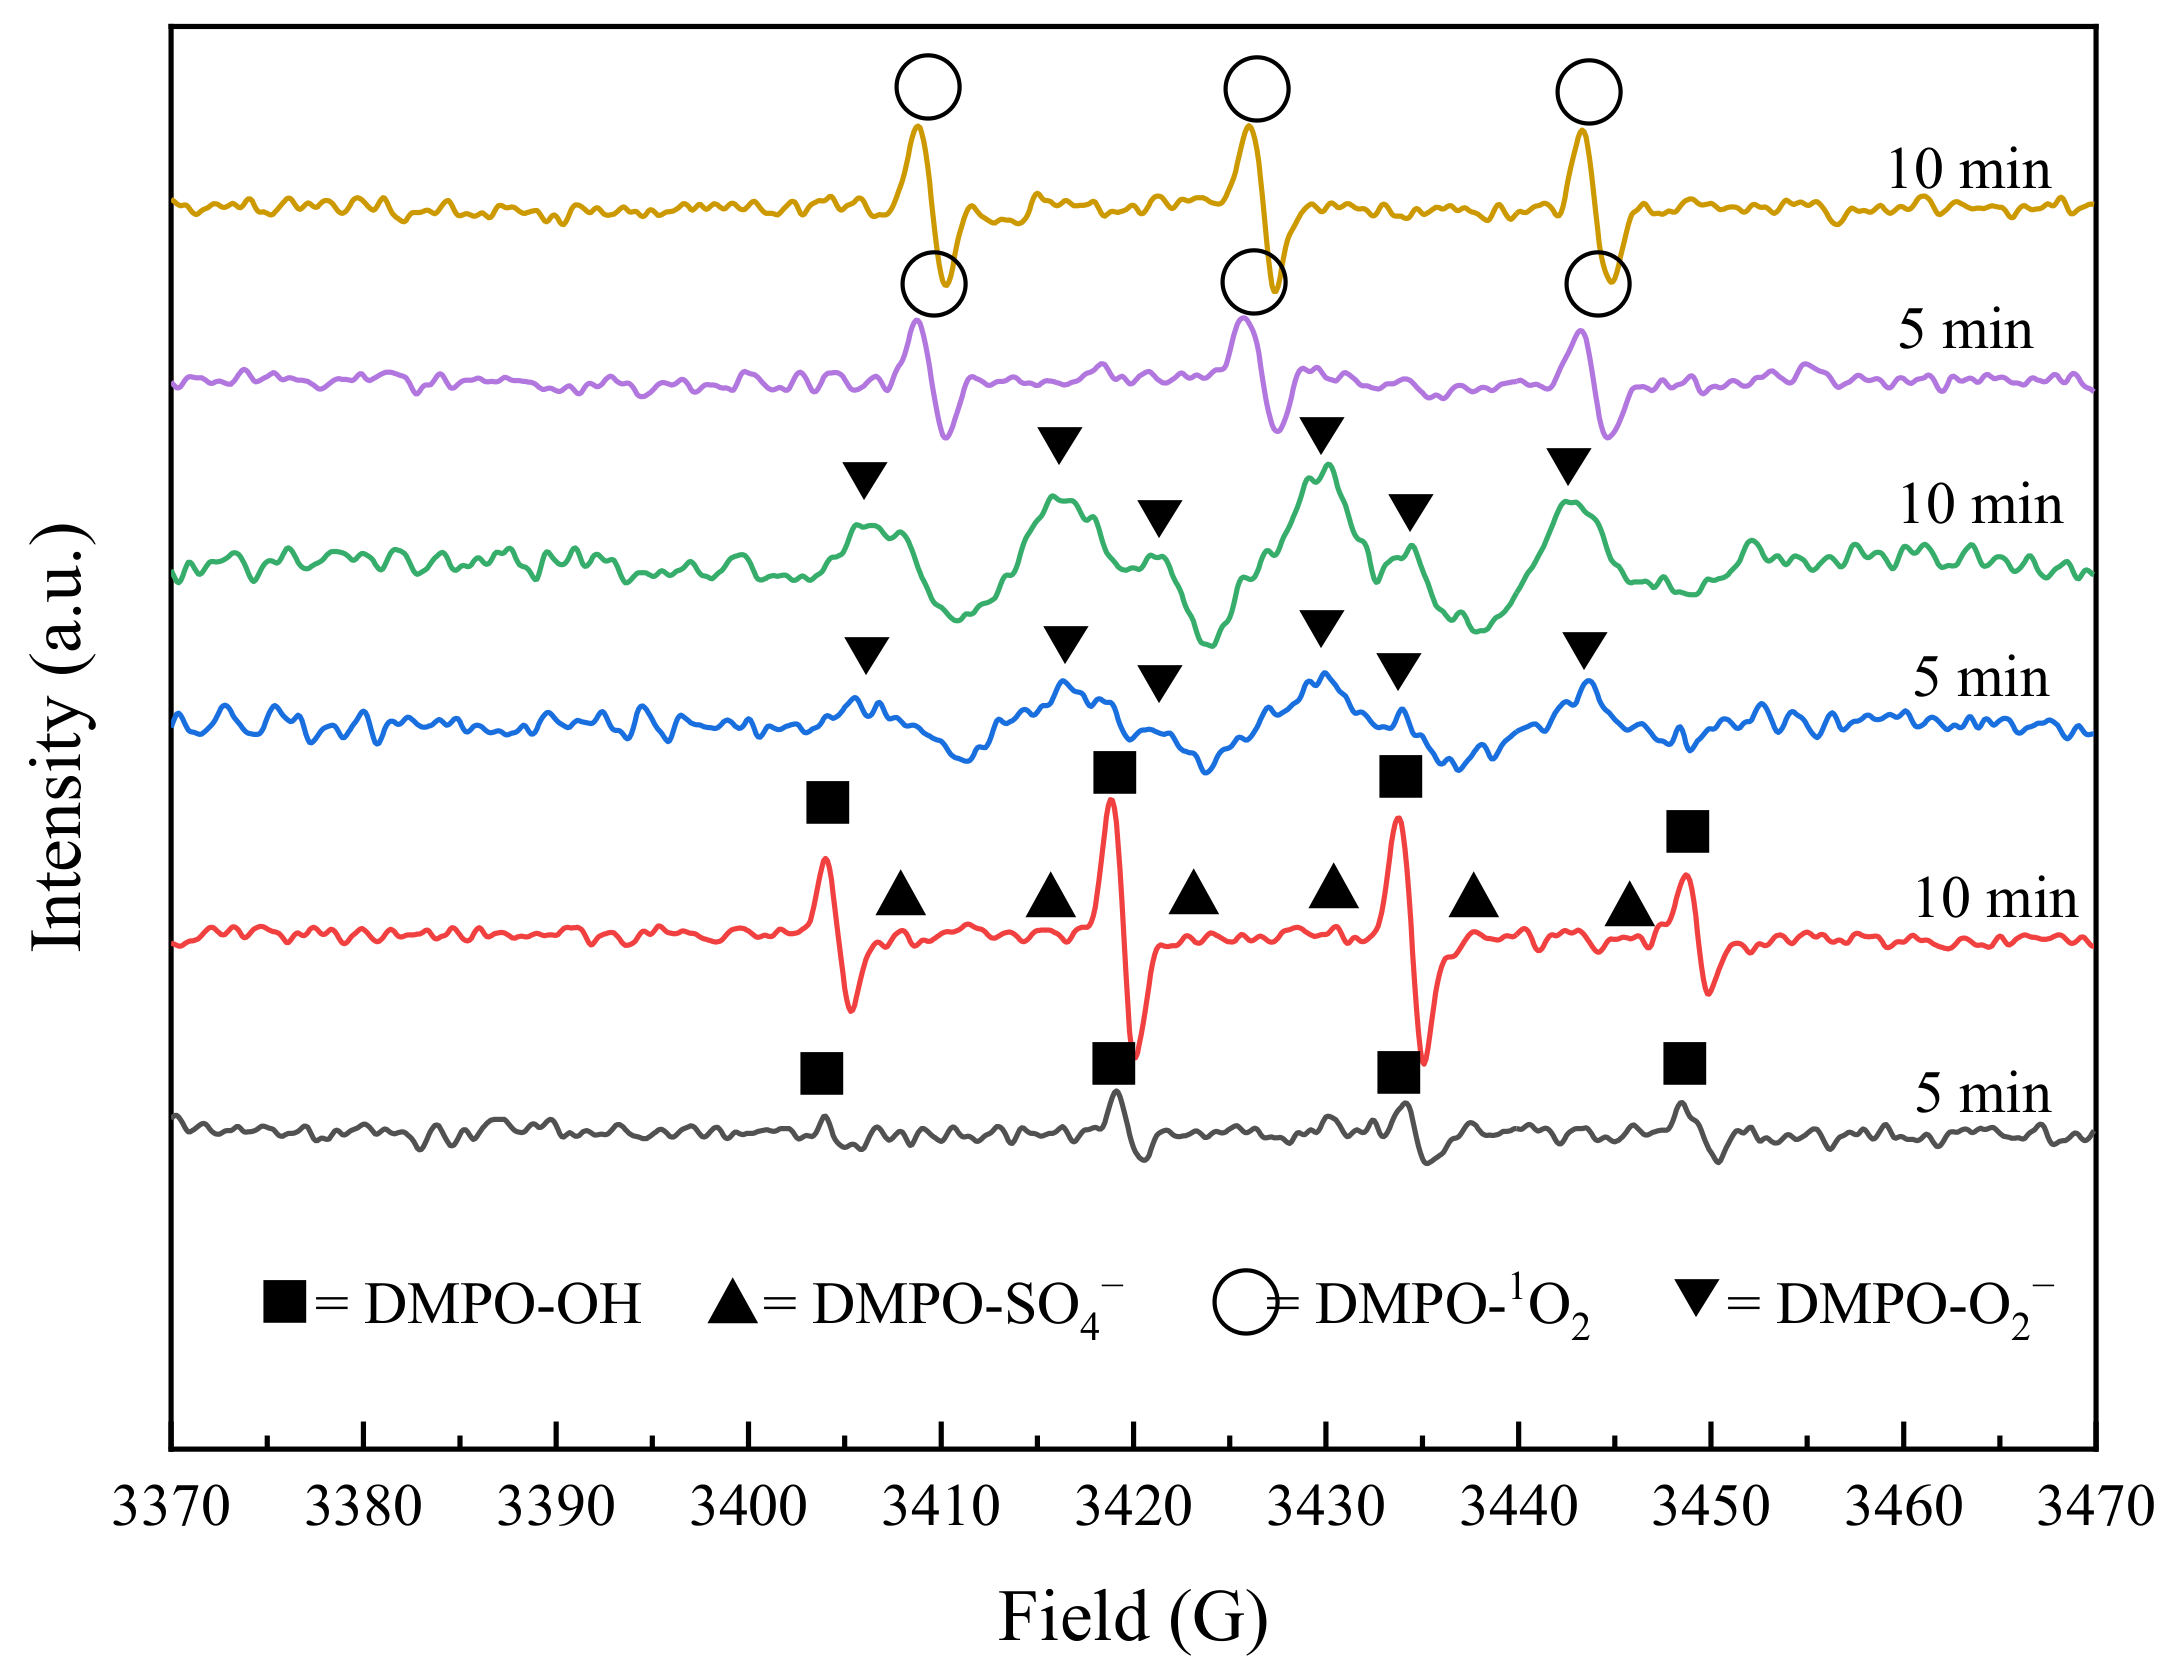
2.4.2. Electron Paramagnetic Resonance (EPR) Experiments
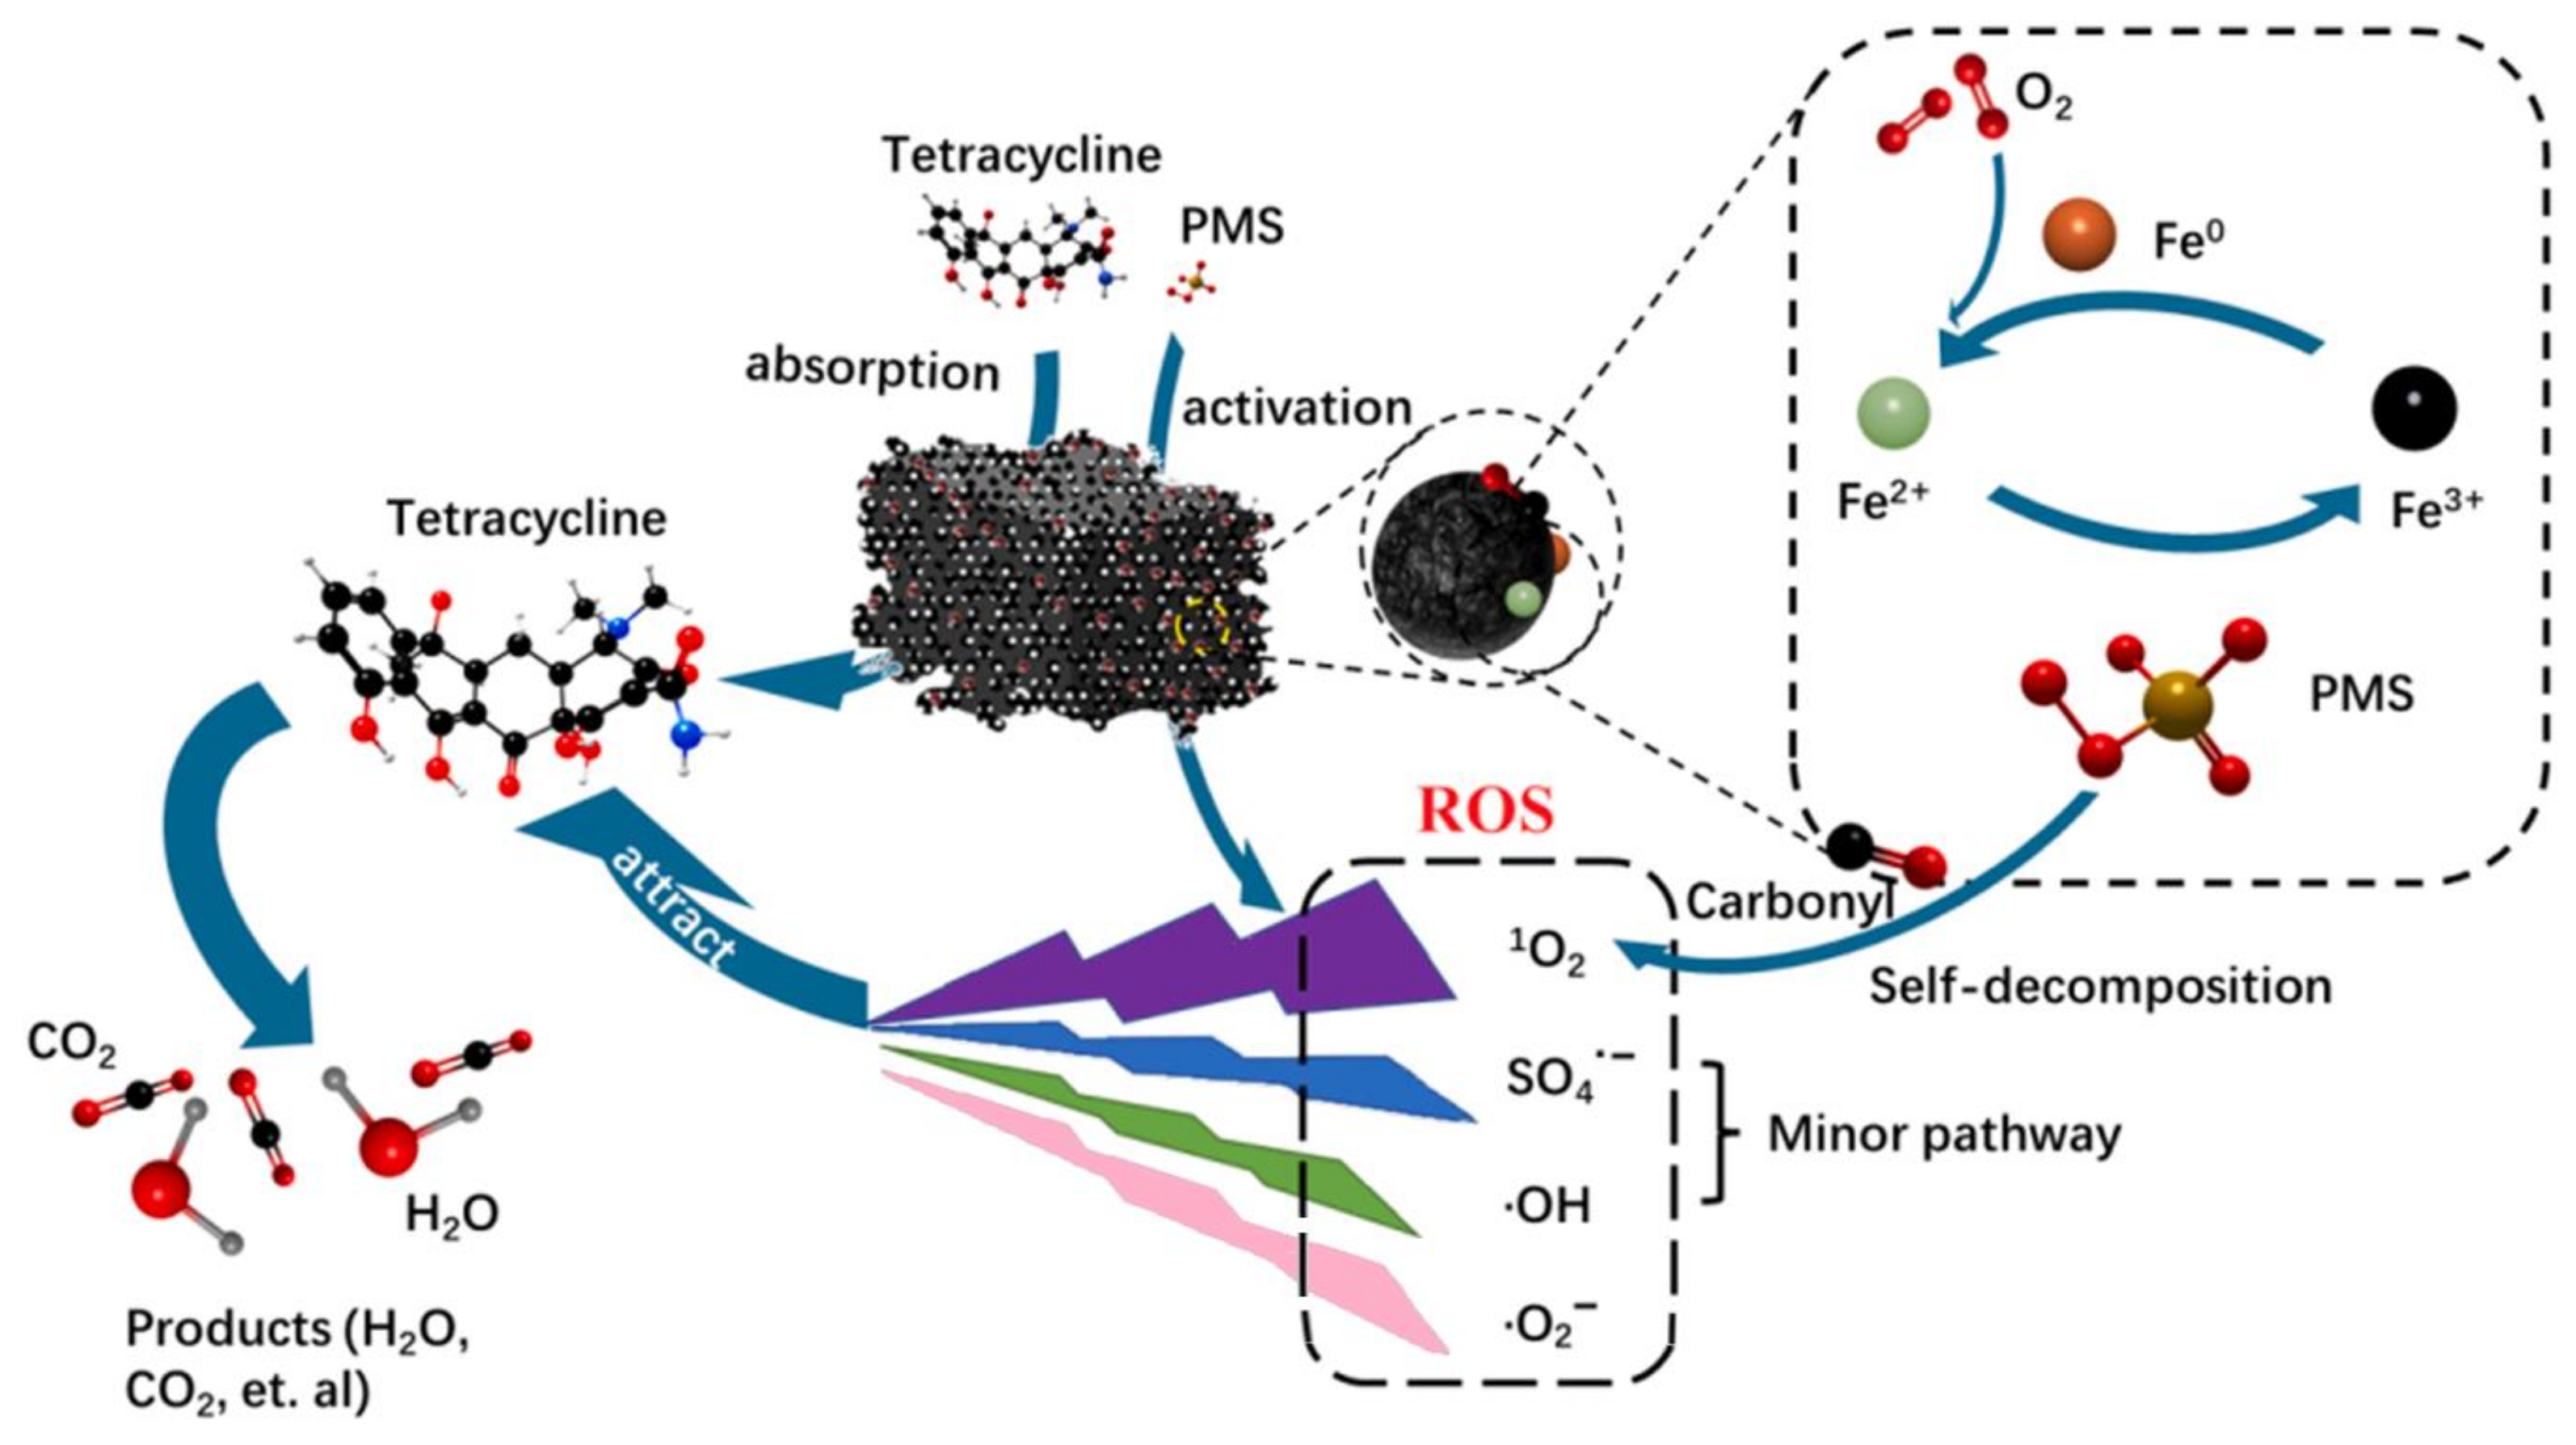
2.4.3. Reaction Mechanism Analysis of BC-nZVI/PS System
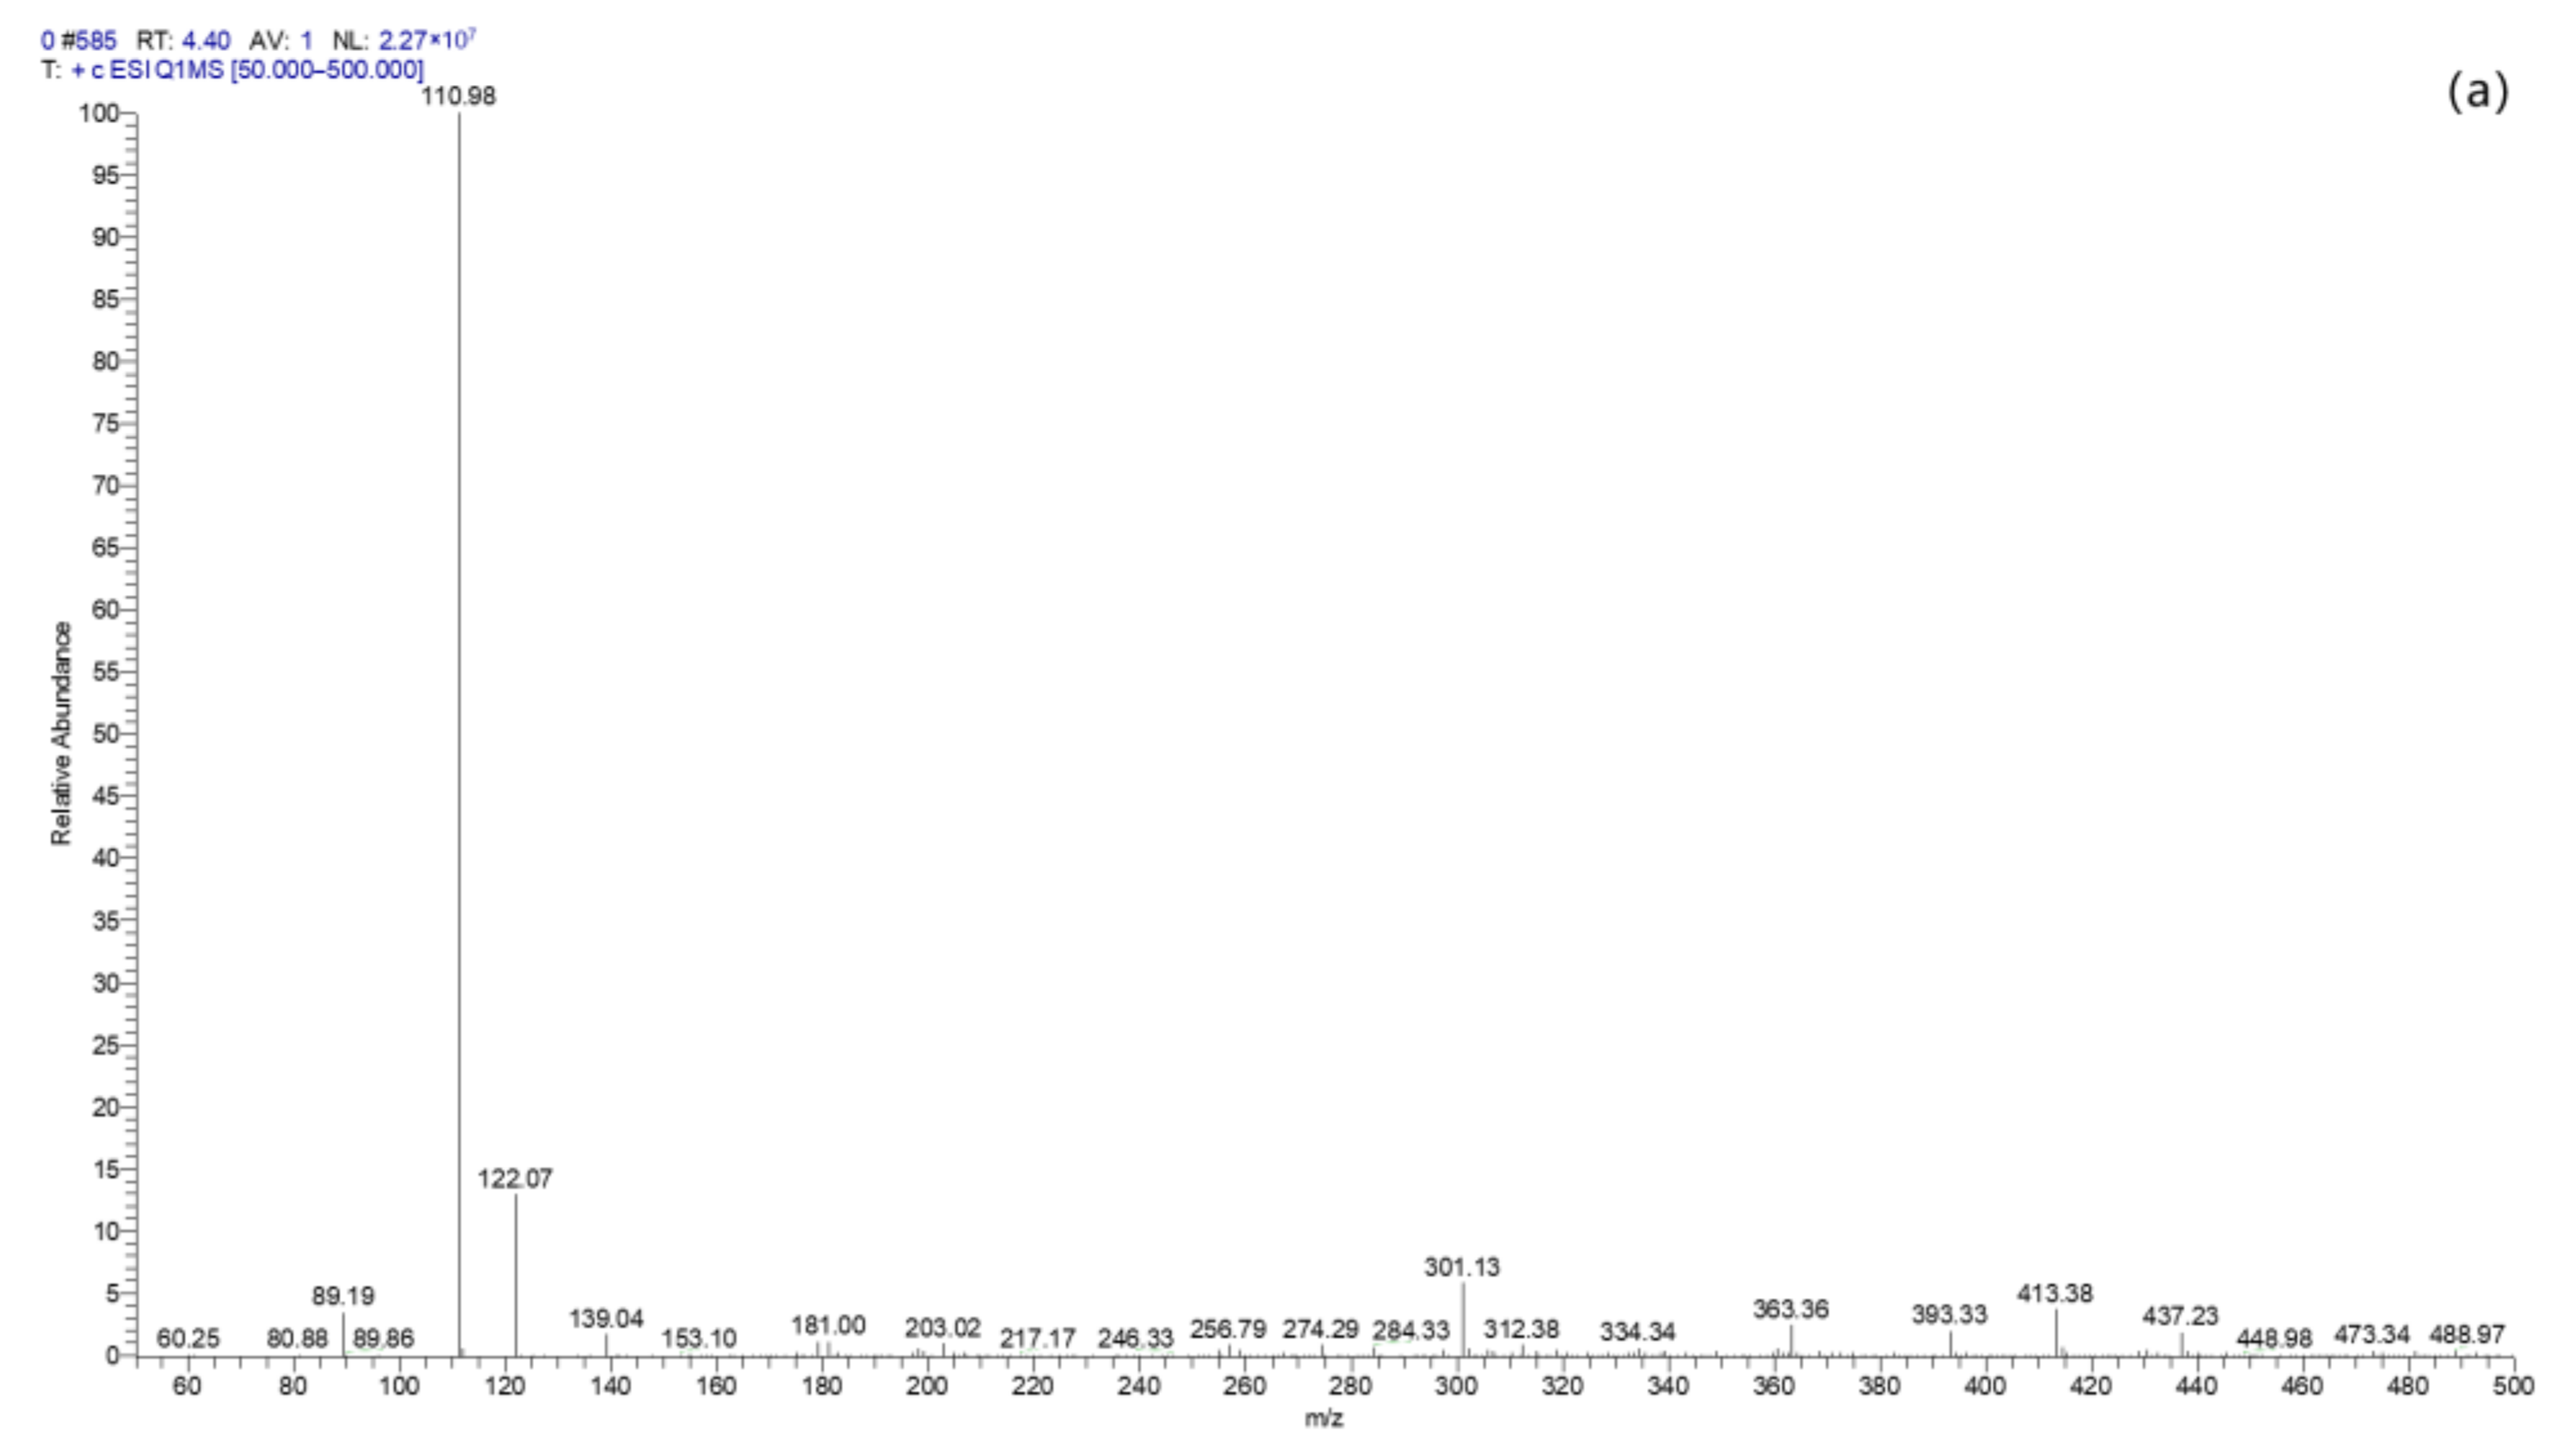
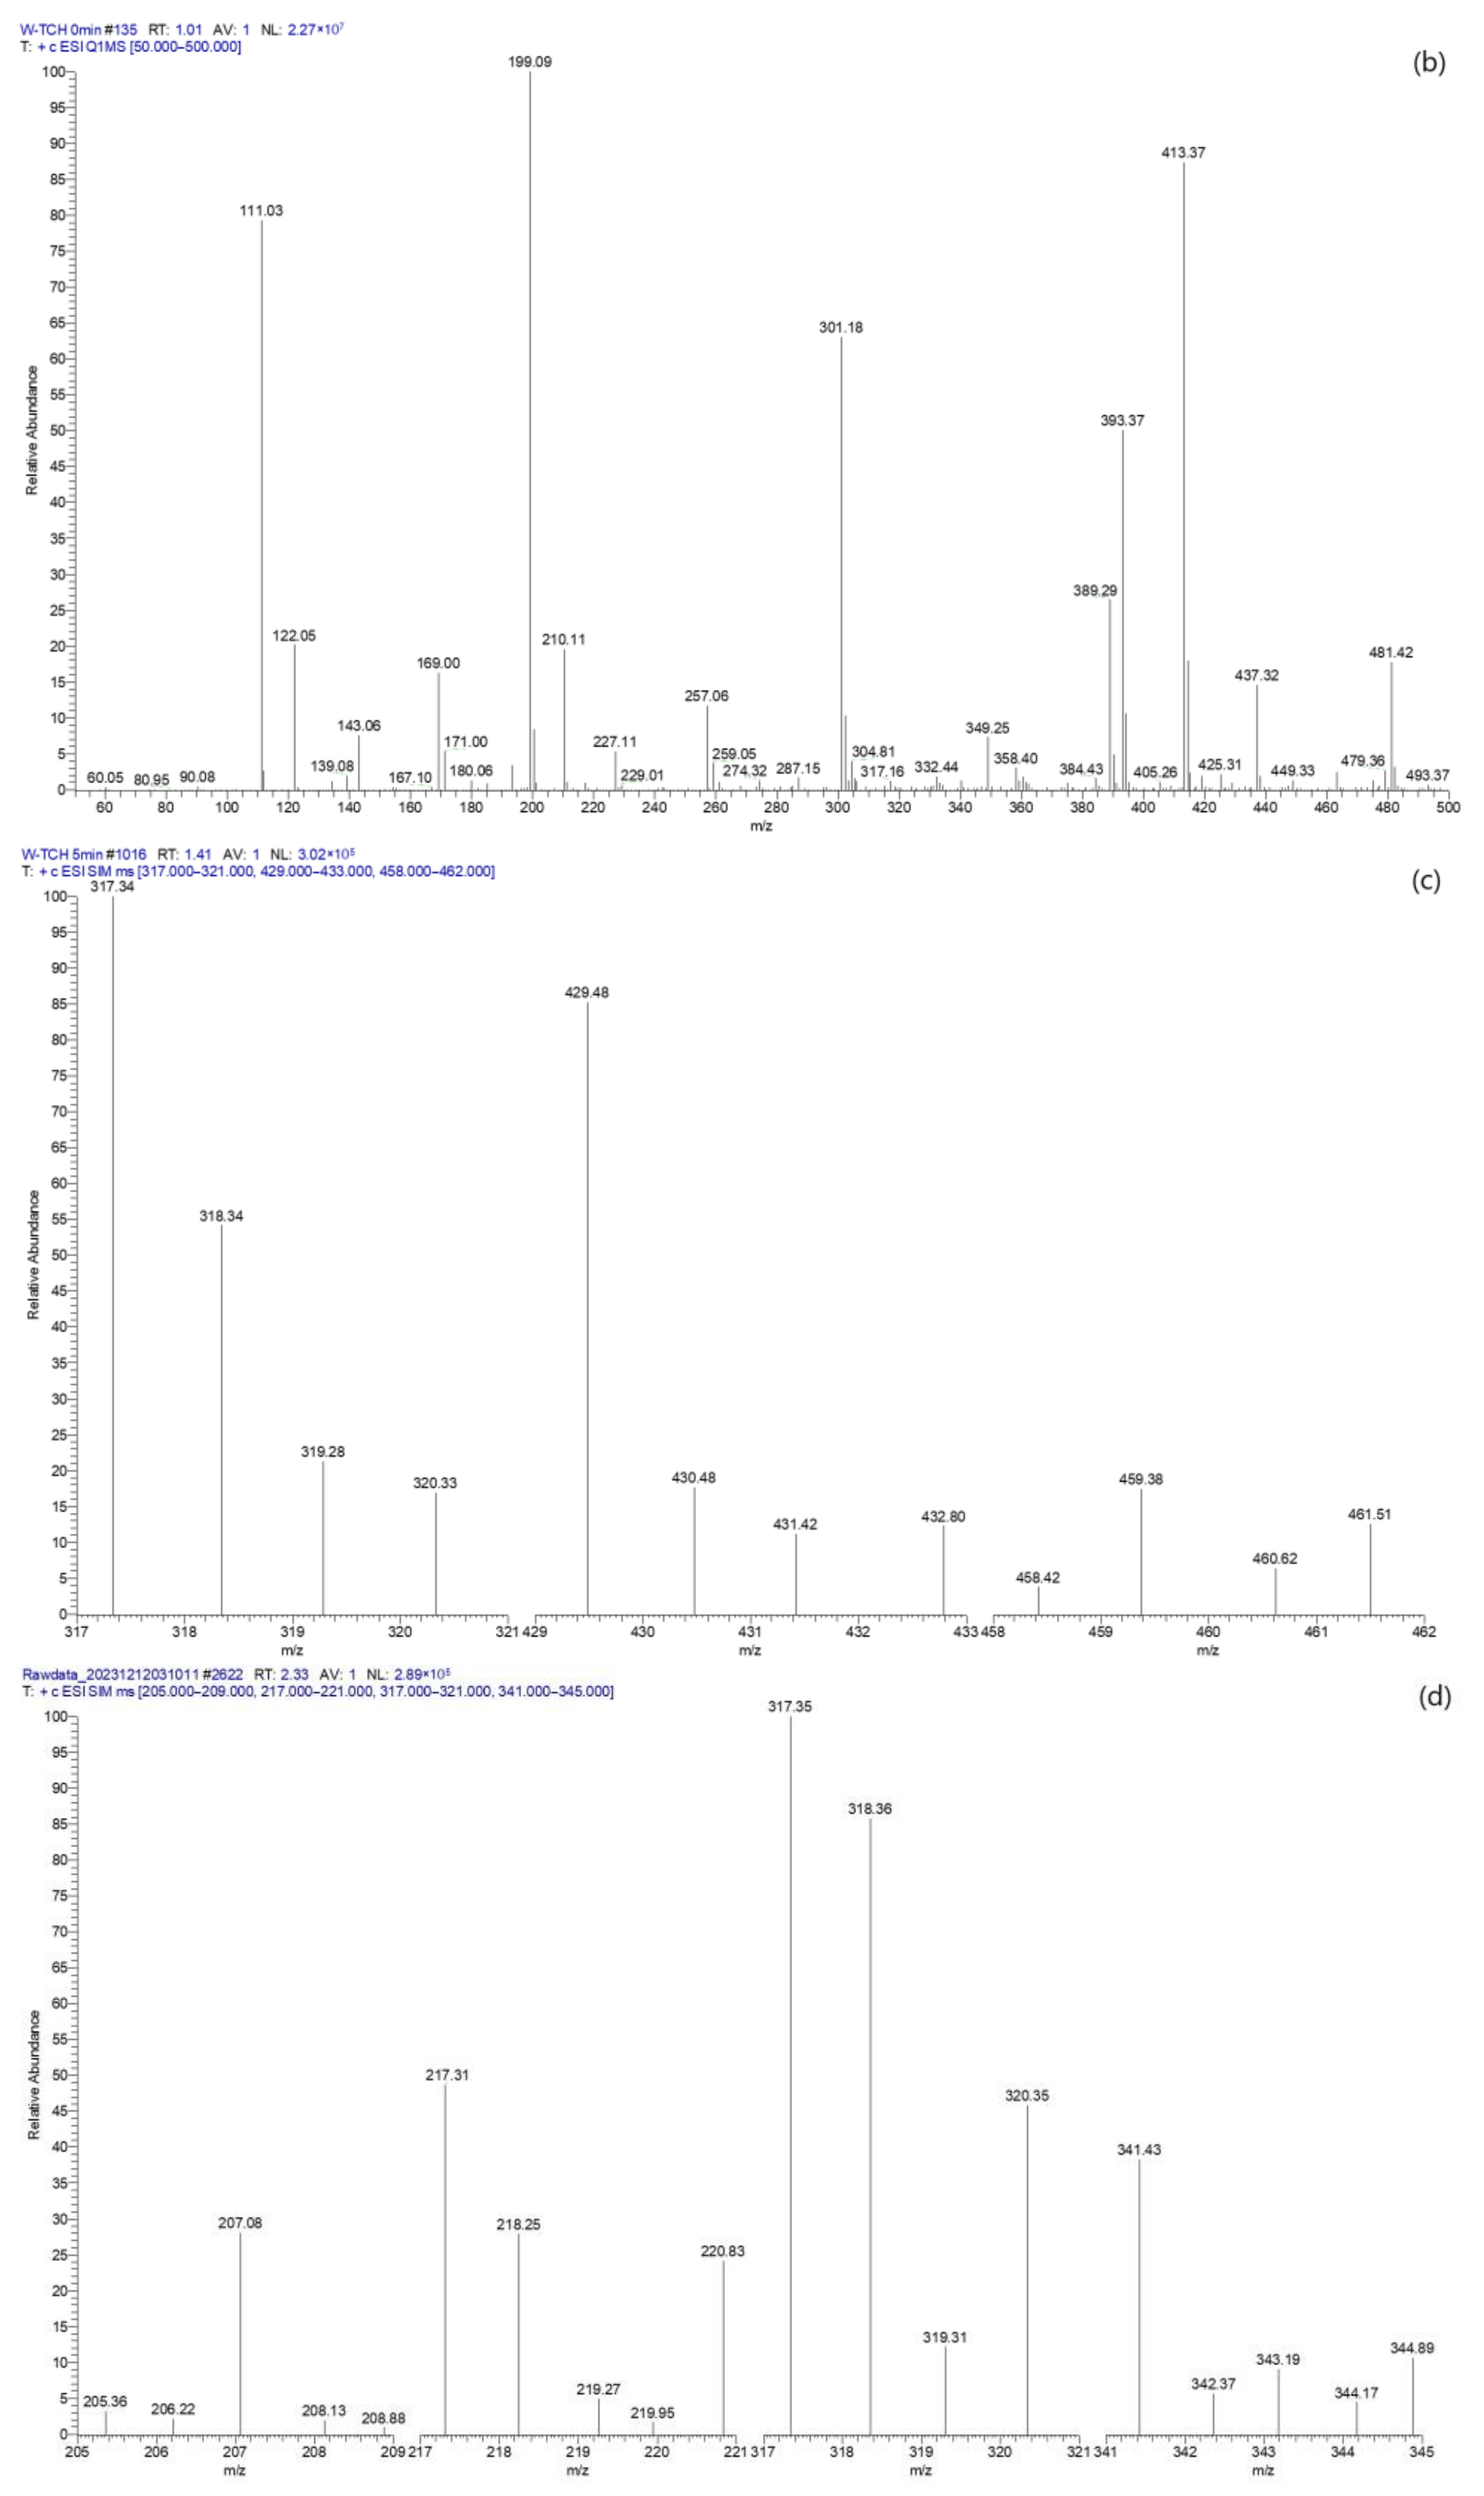
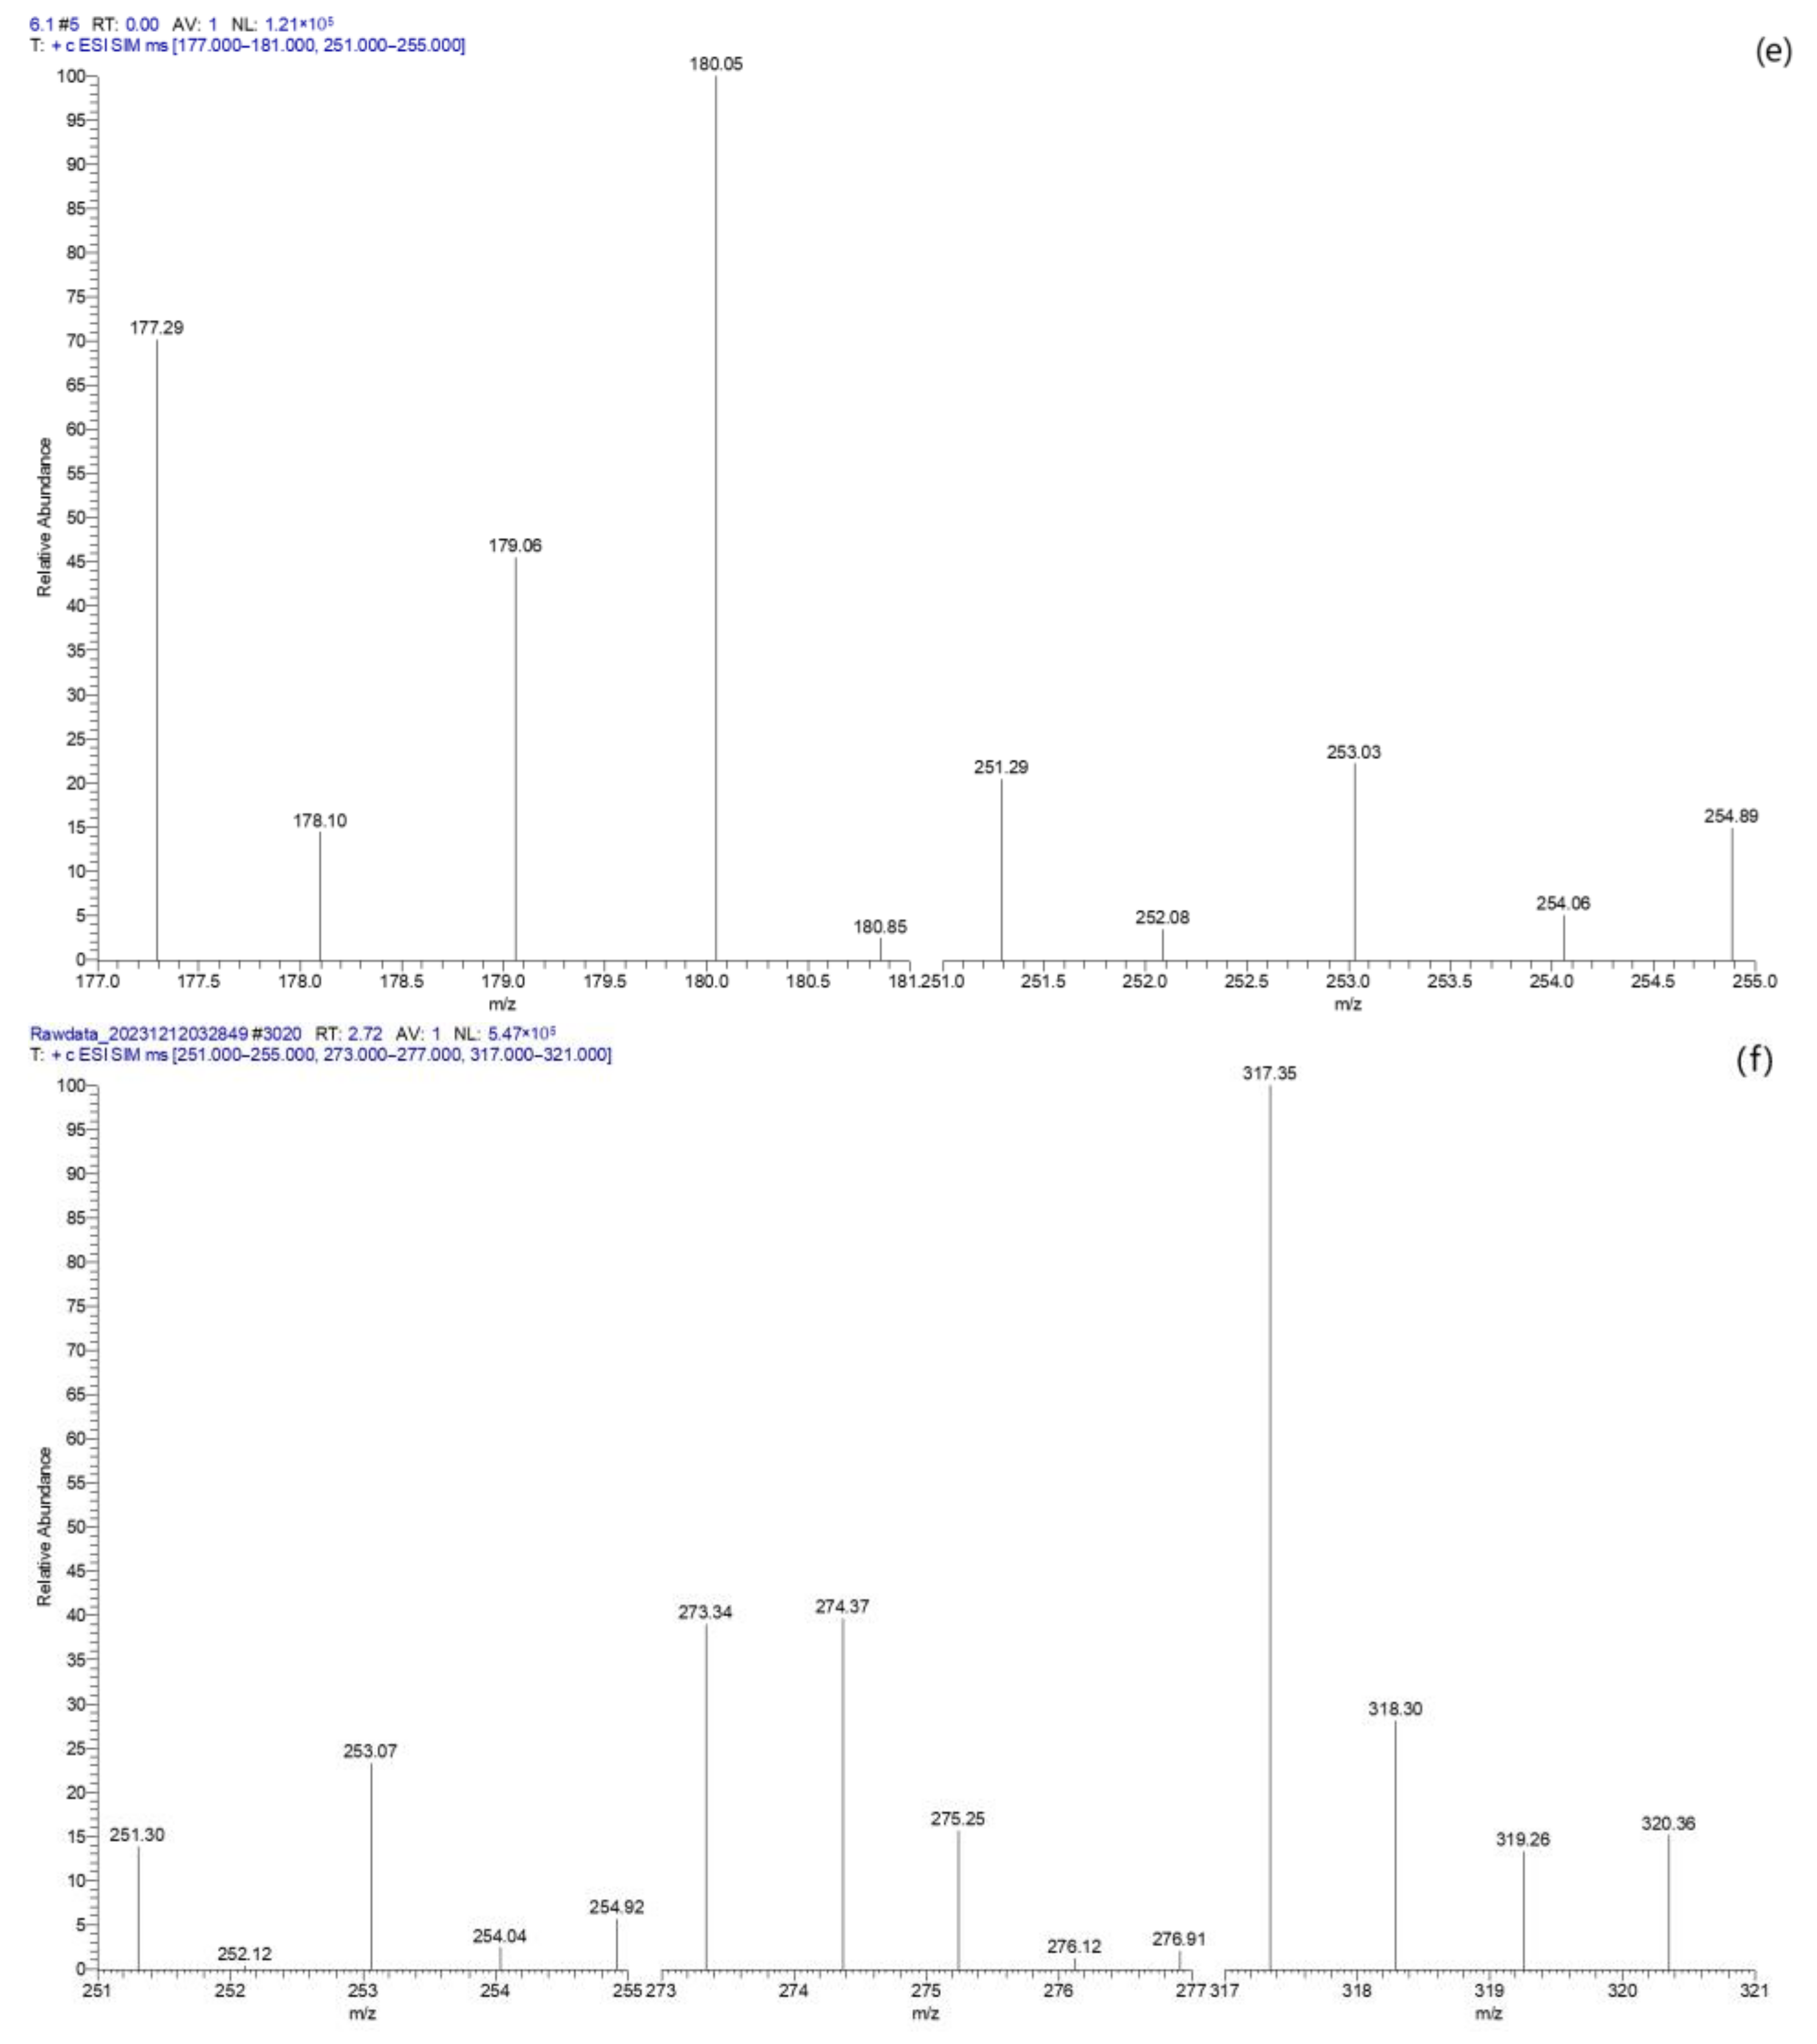
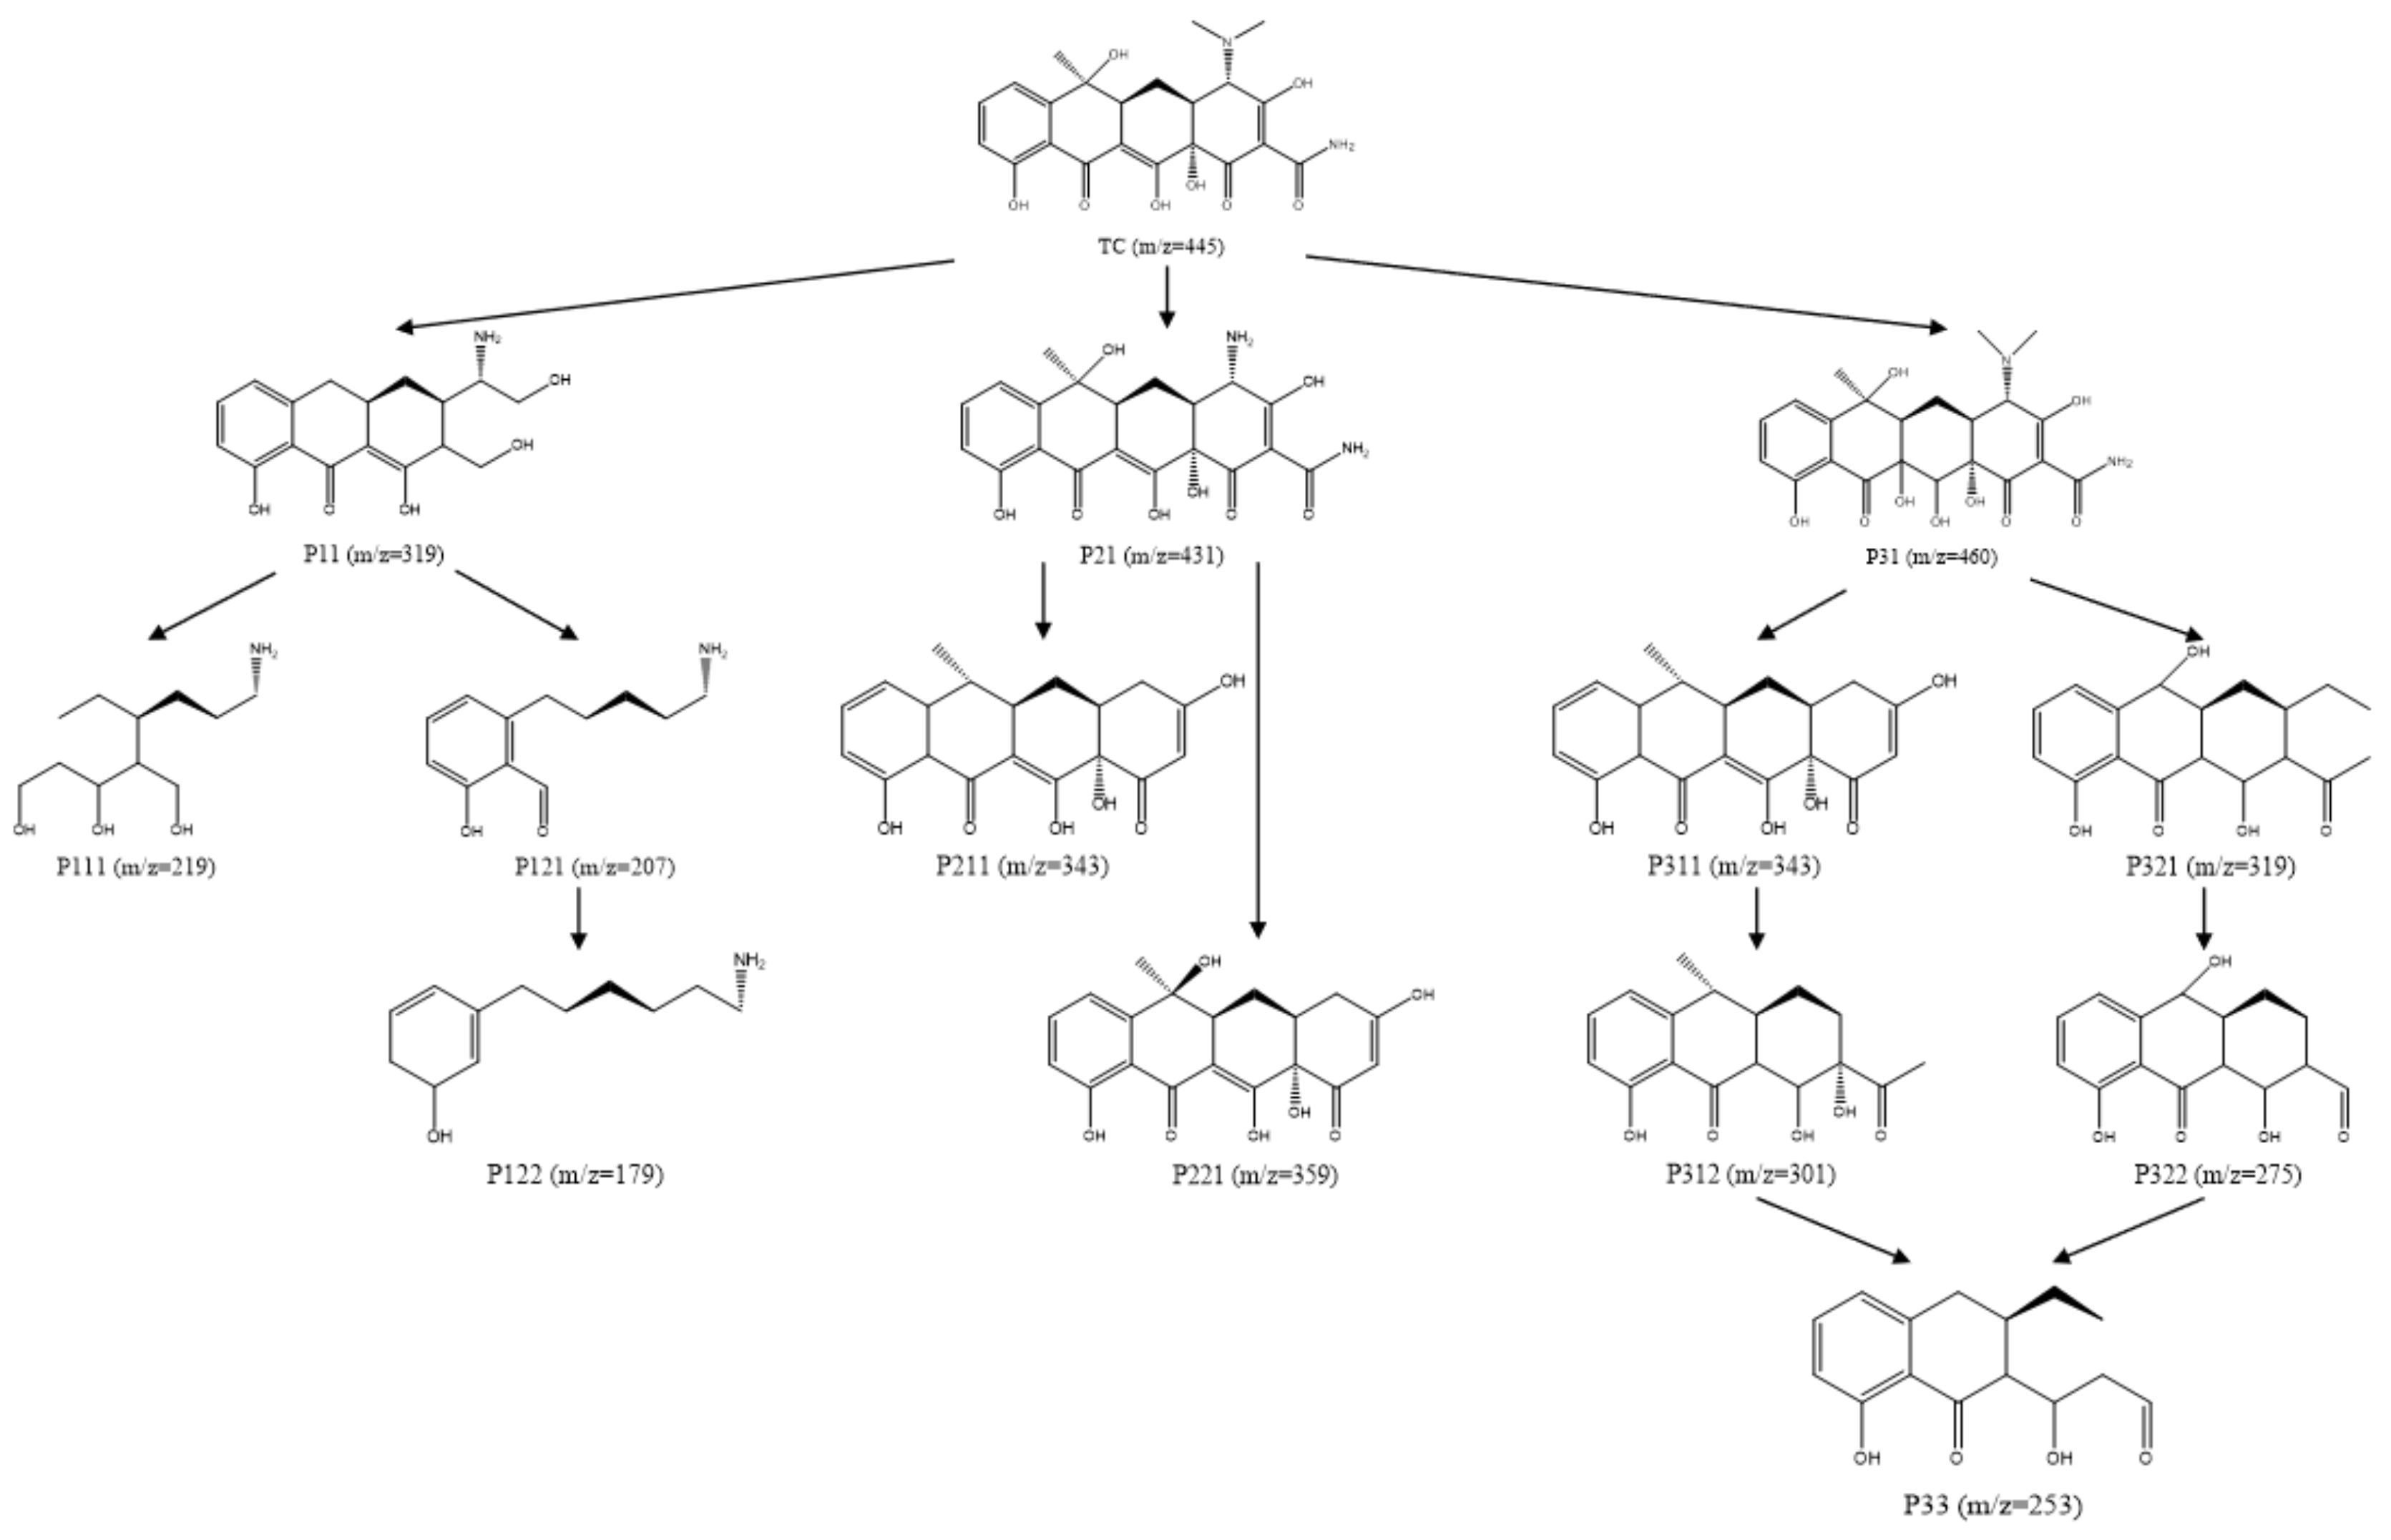
2.4.4. TC Degradation Pathway Analysis
3. Materials and Methods
3.1. Experimental Material
3.1.1. Experimental Water and Reagents
3.1.2. Laboratory Instruments
3.2. Experimental Methods
3.2.1. Conventional Water Quality Testing Methods
3.2.2. Experimental and Detection Methods for PS Activation Patterns
3.2.3. Evaluation Method of TC Degradation Effect
3.3. Preparation of Materials for Activation Systems
3.3.1. Biochar Modified Treatment
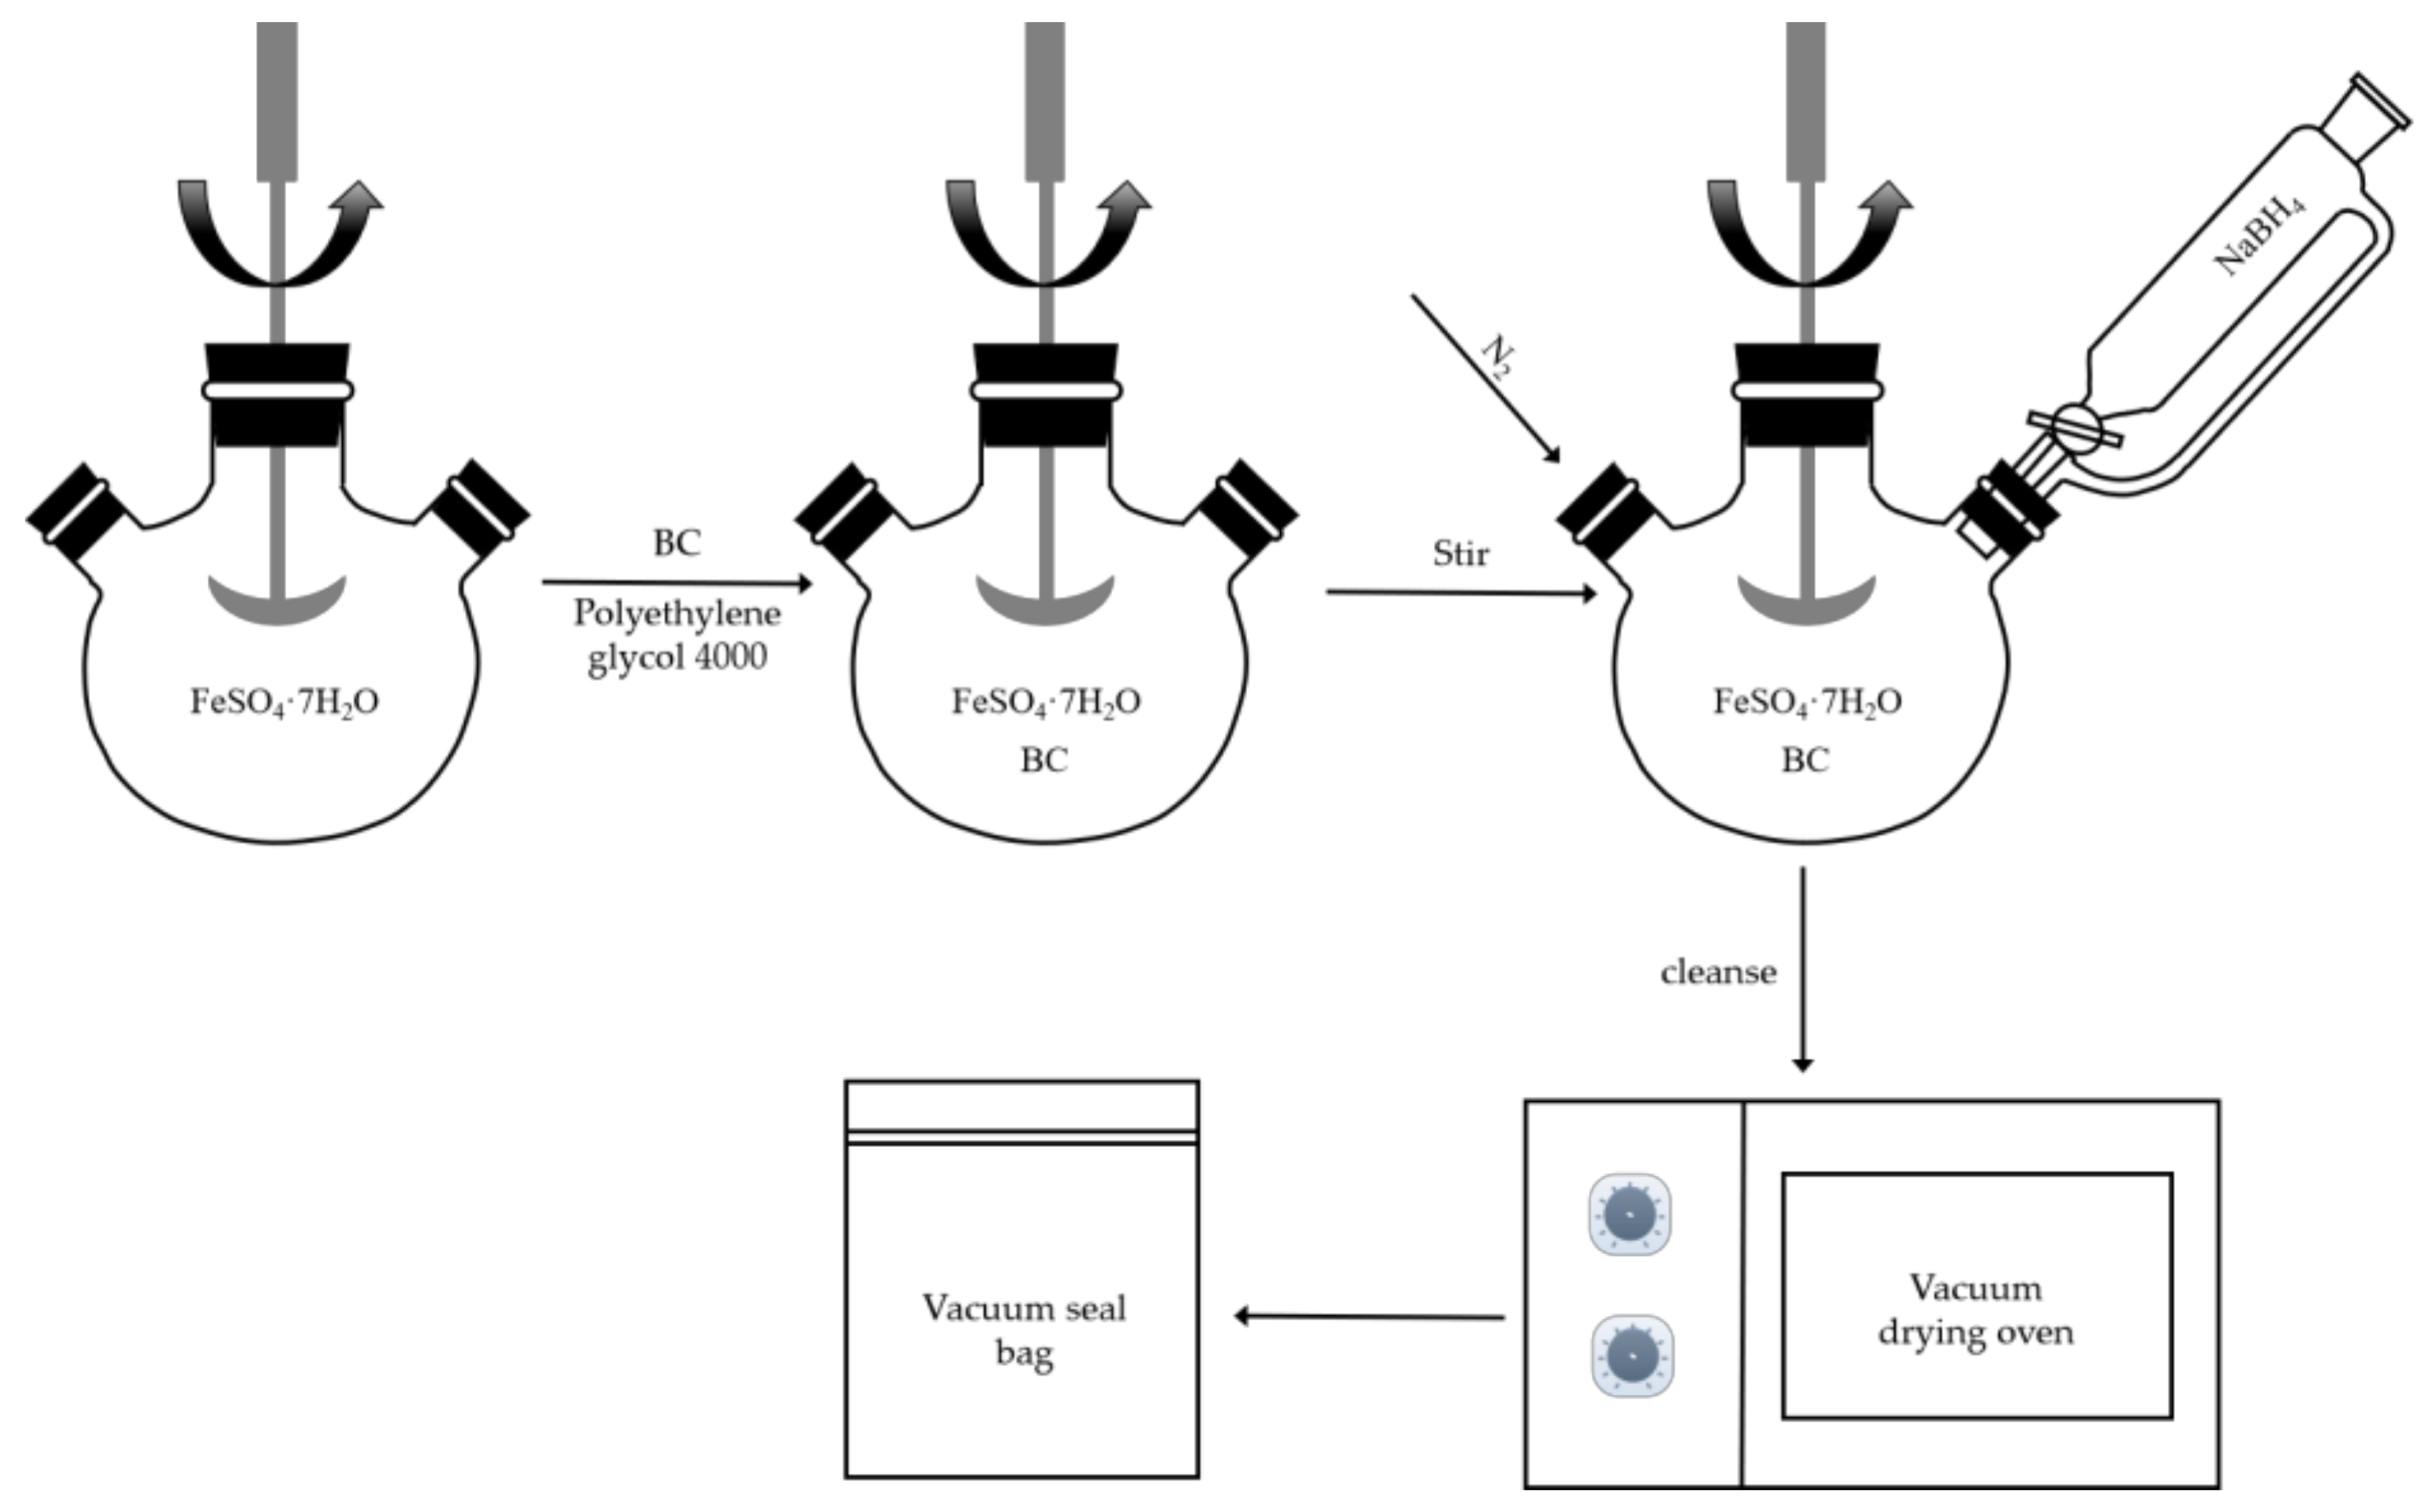
3.3.2. Preparation of Biochar-Loaded Nano Zero-Valent Iron
3.3.3. Preparation of Zero-Valent Iron Nanoparticles
4. Conclusions
Author Contributions
Funding
Institutional Review Board Statement
Informed Consent Statement
Data Availability Statement
Conflicts of Interest
References
- Mala, L.; Lalouckova, K.; Skrivanova, E. Bacterial skin infections in livestock and plant-based alternatives to their antibiotic treatment. Animals 2021, 11, 2473. [Google Scholar] [CrossRef] [PubMed]
- Economou, V.; Gousia, P. Agriculture and food animals as a source of antimicrobial-resistant bacteria. Infect. Drug Resist. 2015, 8, 49–61. [Google Scholar] [CrossRef] [PubMed]
- Klein, E.Y.; Van Boeckel, T.P.; Martinez, E.M.; Pant, S.; Gandra, S.; Levin, S.A.; Goossens, H.; Laxminarayan, R. Global increase and geographic convergence in antibiotic consumption between 2000 and 2015. Proc. Natl. Acad. Sci. USA 2018, 115, E3463–E3470. [Google Scholar] [CrossRef] [PubMed]
- Bai, Y.; Meng, W.; Xu, J.; Zhang, Y.; Guo, C. Occurrence, distribution and bioaccumulation of antibiotics in the Liao River Basin in China. Environ. Sci.-Proc. Imp. 2014, 16, 586–593. [Google Scholar] [CrossRef] [PubMed]
- Chen, H.; Jing, L.; Teng, Y.; Wang, J. Characterization of antibiotics in a large-scale river system of China: Occurrence pattern, spatiotemporal distribution and environmental risks. Sci. Total Environ. 2018, 618, 409–418. [Google Scholar] [CrossRef]
- Qiao, M.; Ying, G.-G.; Singer, A.C.; Zhu, Y.-G. Review of antibiotic resistance in China and its environment. Environ. Int. 2018, 110, 160–172. [Google Scholar] [CrossRef] [PubMed]
- Yang, Q.; Gao, Y.; Ke, J.; Show, P.L.; Ge, Y.; Liu, Y.; Guo, R.; Chen, J. Antibiotics: An overview on the environmental occurrence, toxicity, degradation, and removal methods. Bioengineered 2021, 12, 7376–7416. [Google Scholar] [CrossRef]
- Oberoi, A.S.; Jia, Y.; Zhang, H.; Khanal, S.K.; Lu, H. Insights into the fate and removal of antibiotics in engineered biological treatment systems: A critical review. Environ. Sci. Technol. 2019, 53, 7234–7264. [Google Scholar] [CrossRef] [PubMed]
- Scaria, J.; Anupama, K.; Nidheesh, P. Tetracyclines in the environment: An overview on the occurrence, fate, toxicity, detection, removal methods, and sludge management. Sci. Total Environ. 2021, 771, 145291. [Google Scholar] [CrossRef]
- Wang, D.; Wu, X.; Lin, Z.; Ding, Y. A comparative study on the binary and ternary mixture toxicity of antibiotics towards three bacteria based on QSAR investigation. Environ. Res. 2018, 162, 127–134. [Google Scholar] [CrossRef]
- Samanidou, V.; Nikolaidou, K.; Papadoyannis, I.N. Advances in chromatographic analysis of tetracyclines in foodstuffs of animal origin—A review. Sep. Purif. Rev. 2007, 36, 1–69. [Google Scholar] [CrossRef]
- Dai, Y.; Liu, M.; Li, J.; Yang, S.; Sun, Y.; Sun, Q.; Wang, W.; Lu, L.; Zhang, K.; Xu, J. A review on pollution situation and treatment methods of tetracycline in groundwater. Sep. Sci. Technol. 2020, 55, 1005–1021. [Google Scholar] [CrossRef]
- Liu, X.; Lu, S.; Guo, W.; Xi, B.; Wang, W. Antibiotics in the aquatic environments: A review of lakes, China. Sci. Total Environ. 2018, 627, 1195–1208. [Google Scholar] [CrossRef] [PubMed]
- Hiller, C.; Hübner, U.; Fajnorova, S.; Schwartz, T.; Drewes, J. Antibiotic microbial resistance (AMR) removal efficiencies by conventional and advanced wastewater treatment processes: A review. Sci. Total Environ. 2019, 685, 596–608. [Google Scholar] [CrossRef]
- Singh, R.; Singh, A.P.; Kumar, S.; Giri, B.S.; Kim, K.-H. Antibiotic resistance in major rivers in the world: A systematic review on occurrence, emergence, and management strategies. J. Clean. Prod. 2019, 234, 1484–1505. [Google Scholar] [CrossRef]
- Liao, Q.; Rong, H.; Zhao, M.; Luo, H.; Chu, Z.; Wang, R. Interaction between tetracycline and microorganisms during wastewater treatment: A review. Sci. Total Environ. 2021, 757, 143981. [Google Scholar] [CrossRef] [PubMed]
- Lu, J.; Jin, M.; Nguyen, S.H.; Mao, L.; Li, J.; Coin, L.J.; Yuan, Z.; Guo, J. Non-antibiotic antimicrobial triclosan induces multiple antibiotic resistance through genetic mutation. Environ. Int. 2018, 118, 257–265. [Google Scholar] [CrossRef] [PubMed]
- Carey, D.E.; McNamara, P.J. The impact of triclosan on the spread of antibiotic resistance in the environment. Front. Microbiol. 2015, 5, 780. [Google Scholar] [CrossRef]
- Dong, H.; Zeng, G.; Tang, L.; Fan, C.; Zhang, C.; He, X.; He, Y. An overview on limitations of TiO2-based particles for photocatalytic degradation of organic pollutants and the corresponding countermeasures. Water Res. 2015, 79, 128–146. [Google Scholar] [CrossRef] [PubMed]
- Wang, J.; Wang, S. Reactive species in advanced oxidation processes: Formation, identification and reaction mechanism. Chem. Eng. J. 2020, 401, 126158. [Google Scholar] [CrossRef]
- Liu, Y.; Liu, L.; Wang, Y. A critical review on removal of gaseous pollutants using sulfate radical-based advanced oxidation technologies. Environ. Sci. Technol. 2021, 55, 9691–9710. [Google Scholar] [CrossRef] [PubMed]
- Li, X.; Jie, B.; Lin, H.; Deng, Z.; Qian, J.; Yang, Y.; Zhang, X. Application of sulfate radicals-based advanced oxidation technology in degradation of trace organic contaminants (TrOCs): Recent advances and prospects. J. Environ. Manag. 2022, 308, 114664. [Google Scholar] [CrossRef]
- Zhang, B.-T.; Zhang, Y.; Teng, Y.; Fan, M. Sulfate radical and its application in decontamination technologies. Crit. Rev. Environ. Sci. Technol. 2015, 45, 1756–1800. [Google Scholar] [CrossRef]
- Ushani, U.; Lu, X.; Wang, J.; Zhang, Z.; Dai, J.; Tan, Y.; Wang, S.; Li, W.; Niu, C.; Cai, T.; et al. Sulfate radicals-based advanced oxidation technology in various environmental remediation: A state-of-the—Art review. Chem. Eng. J. 2020, 402, 126232. [Google Scholar] [CrossRef]
- Saien, J.; Abbas, H.K.; Jafari, F. Mild and economy homogeneous UV-LED/persulfate process for degradation of fluoxetine model drug. Arab. J. Chem. 2023, 16, 105237. [Google Scholar] [CrossRef]
- Li, Z.; Sun, Y.; Yang, Y.; Han, Y.; Wang, T.; Chen, J.; Tsang, D.C. Biochar-supported nanoscale zero-valent iron as an efficient catalyst for organic degradation in groundwater. J. Hazard. Mater. 2020, 383, 121240. [Google Scholar] [CrossRef]
- Huang, H.; Guo, T.; Wang, K.; Li, Y.; Zhang, G. Efficient activation of persulfate by a magnetic recyclable rape straw biochar catalyst for the degradation of tetracycline hydrochloride in water. Sci. Total Environ. 2021, 758, 143957. [Google Scholar] [CrossRef] [PubMed]
- Liu, W.-J.; Jiang, H.; Yu, H.-Q. Development of biochar-based functional materials: Toward a sustainable platform carbon material. Chem. Rev. 2015, 115, 12251–12285. [Google Scholar] [CrossRef]
- Ahmed, N.; Vione, D.; Rivoira, L.; Carena, L.; Castiglioni, M.; Bruzzoniti, M.C. A review on the degradation of pollutants by fenton-like systems based on zero-valent iron and persulfate: Effects of reduction potentials, pH, and anions occurring in waste waters. Molecules 2021, 26, 4584. [Google Scholar] [CrossRef]
- Tang, H.; Wang, J.; Zhang, S.; Pang, H.; Wang, X.; Chen, Z.; Li, M.; Song, G.; Qiu, M.; Yu, S. Recent advances in nanoscale zero-valent iron-based materials: Characteristics, environmental remediation and challenges. J. Clean. Prod. 2021, 319, 128641. [Google Scholar] [CrossRef]
- Chen, Y.-P.; Zheng, C.-H.; Huang, Y.-Y.; Chen, Y.-R. Removal of chlortetracycline from water using spent tea leaves-based biochar as adsorption-enhanced persulfate activator. Chemosphere 2022, 286, 131770. [Google Scholar] [CrossRef] [PubMed]
- Luo, J.; Gong, G.; Cui, C.; Sun, S.; Lin, J.; Ma, R.; Sun, J. Microwave-induced one-pot preparation of bifunctional N-Fe/BC catalysts and oriented production of phenol-enriched bio-oil from biomass pyrolysis: Catalyst synthesis, performance evaluation, and mechanism insight via theoretical calculations. ACS Catal. 2022, 12, 11318–11339. [Google Scholar] [CrossRef]
- Yin, L.; Liu, L.; Lin, S.; Owens, G.; Chen, Z. Synthesis and characterization of Nanoscale Zero-Valent Iron (nZVI) as an adsorbent for the simultaneous removal of As (III) and As (V) from groundwater. J. Water Process Eng. 2022, 47, 102677. [Google Scholar] [CrossRef]
- Stefaniuk, M.; Oleszczuk, P.; Ok, Y.S. Review on nano zerovalent iron (nZVI): From synthesis to environmental applications. Chem. Eng. J. 2016, 287, 618–632. [Google Scholar] [CrossRef]
- Tian, Y.; Chen, Q.; Yan, C.; Deng, H.; He, Y. Classification of adsorption isotherm curves for shale based on pore structure. Petrophysics 2020, 61, 417–433. [Google Scholar] [CrossRef]
- Yumitori, S. Correlation of C1s chemical state intensities with the O1s intensity in the XPS analysis of anodically oxidized glass-like carbon samples. J. Mater. Sci. 2000, 35, 139–146. [Google Scholar] [CrossRef]
- Sun, Z.; Zhu, M.; Lv, X.; Liu, Y.; Shi, C.; Dai, Y.; Wang, A.; Majima, T. Insight into iron group transition metal phosphides (Fe2P, Co2P, Ni2P) for improving photocatalytic hydrogen generation. Appl. Catal. B Environ. Energy 2019, 246, 330–336. [Google Scholar] [CrossRef]
- Qu, X.; Fu, H.; Mao, J.; Ran, Y.; Zhang, D.; Zhu, D. Chemical and structural properties of dissolved black carbon released from biochars. Carbon 2016, 96, 759–767. [Google Scholar] [CrossRef]
- Guo, Y.; Li, X.; Liang, L.; Lin, Z.; Su, X.; Zhang, W. Immobilization of cadmium in contaminated soils using sulfidated nanoscale zero-valent iron: Effectiveness and remediation mechanism. J. Hazard. Mater. 2021, 420, 126605. [Google Scholar] [CrossRef]
- Luo, H.; Lin, Q.; Zhang, X.; Huang, Z.; Liu, S.; Jiang, J.; Xiao, R.; Liao, X. New insights into the formation and transformation of active species in nZVI/BC activated persulfate in alkaline solutions. Chem. Eng. J. 2019, 359, 1215–1223. [Google Scholar] [CrossRef]
- Chen, L.; Zhang, J.; Li, Q.; Zhang, Y.; Huangpu, J.; Shen, J.; Gu, M.; Yang, J. Removal of p-nitrophenols by BC@ nZVI activated persulfate: A study of key factors and mechanisms. J. Environ. Chem. Eng. 2023, 11, 111483. [Google Scholar] [CrossRef]
- Li, N.; Li, R.; Duan, X.; Yan, B.; Liu, W.; Cheng, Z.; Chen, G.; Hou, L.A.; Wang, S. Correlation of active sites to generated reactive species and degradation routes of organics in peroxymonosulfate activation by Co-loaded carbon. Environ. Sci. Technol. 2021, 55, 16163–16174. [Google Scholar] [CrossRef]
- Li, J.; Lin, Q.; Luo, H.; Fu, H.; Wu, L.; Chen, Y.; Ma, Y. The effect of nanoscale zero-valent iron-loaded N-doped biochar on the generation of free radicals and nonradicals by peroxydisulfate activation. J. Water Process Eng. 2022, 47, 102681. [Google Scholar] [CrossRef]
- Wang, J.; Wang, S. Activation of persulfate (PS) and peroxymonosulfate (PMS) and application for the degradation of emerging contaminants. Chem. Eng. J. 2018, 334, 1502–1517. [Google Scholar] [CrossRef]
- Dong, H.; Li, L.; Wang, Y.; Ning, Q.; Wang, B.; Zeng, G. Aging of zero-valent iron-based nanoparticles in aqueous environment and the consequent effects on their reactivity and toxicity. Water Environ. Res. 2020, 92, 646–661. [Google Scholar] [CrossRef]
- Kang, Z.; Jia, X.; Zhang, Y.; Kang, X.; Ge, M.; Liu, D.; Wang, C.; He, Z. A review on application of biochar in the removal of pharmaceutical pollutants through adsorption and persulfate-based AOPs. Sustainability 2022, 14, 10128. [Google Scholar] [CrossRef]
- Chen, C.; Sun, H.; Zhang, S.; Su, X. Non-metal activated peroxydisulfate by straw biochar for tetracycline hydrochloride oxidative degradation: Catalytic activity and mechanism. Environ. Sci. Pollut. R. 2023, 30, 50815–50828. [Google Scholar] [CrossRef] [PubMed]
- Hawkins, C.L.; Davies, M.J. Detection and characterisation of radicals in biological materials using EPR methodology. BBA-Gen. Subj. 2014, 1840, 708–721. [Google Scholar] [CrossRef] [PubMed]
- Leichtweis, J.; Vieira, Y.; Carissimi, E.; Ulbricht, M.; Fischer, L. Photocatalytic and persulfate-facilitated tetracycline degradation using NiFe2O4/carbon/polymer membranes: Activity and stability during flow-through. Appl. Surf. Sci. 2024, 669, 160603. [Google Scholar] [CrossRef]
- Pi, Z.; Li, X.; Wang, D.; Xu, Q.; Tao, Z.; Huang, X.; Yao, F.; Wu, Y.; He, L.; Yang, Q. Persulfate activation by oxidation biochar supported magnetite particles for tetracycline removal: Performance and degradation pathway. J. Clean. Prod. 2019, 235, 1103–1115. [Google Scholar] [CrossRef]
- Liang, L.; Xi, F.; Tan, W.; Meng, X.; Hu, B.; Wang, X. Review of organic and inorganic pollutants removal by biochar and biochar-based composites. Biochar 2021, 3, 255–281. [Google Scholar] [CrossRef]
- Chen, Z.; Cao, W.; Bai, H.; Zhang, R.; Liu, Y.; Li, Y.; Song, J.; Liu, J.; Ren, G. Review on the degradation of chlorinated hydrocarbons by persulfate activated with zero-valent iron-based materials. Water Sci. Technol. 2023, 87, 761–782. [Google Scholar] [CrossRef]
- Shen, H.; Thomas, T.; Rasaki, S.A.; Saad, A.; Hu, C.; Wang, J.; Yang, M. Oxygen reduction reactions of Fe-NC catalysts: Current status and the way forward. Electrochem. Energy R. 2019, 2, 252–276. [Google Scholar] [CrossRef]
- Wu, S.; Liu, H.; Yang, C.; Li, X.; Lin, Y.; Yin, K.; Sun, J.; Teng, Q.; Du, C.; Zhong, Y. High-performance porous carbon catalysts doped by iron and nitrogen for degradation of bisphenol F via peroxymonosulfate activation. Chem. Eng. J. 2020, 392, 123683. [Google Scholar] [CrossRef]
- Sun, H.; Zhang, B.; Wang, N.; Zhang, N.; Ma, Y.; Zang, L.; Li, Z.; Xue, R. Refractory organics removal in PMS and H2O2/PMS oxidation system activated by biochar/nZVI/MoS2 composite: Synthesis, performance, mechanism and dosing methods. J. Environ. Chem. Eng. 2023, 11, 109134. [Google Scholar] [CrossRef]
- Safari, G.H.; Nasseri, S.; Mahvi, A.H.; Yaghmaeian, K.; Nabizadeh, R.; Alimohammadi, M. Optimization of sonochemical degradation of tetracycline in aqueous solution using sono-activated persulfate process. J. Environ. Health Sci. 2015, 13, 76. [Google Scholar] [CrossRef]
- Ji, Y.; Shi, Y.; Dong, W.; Wen, X.; Jiang, M.; Lu, J. Thermo-activated persulfate oxidation system for tetracycline antibiotics degradation in aqueous solution. Chem. Eng. J. 2016, 298, 225–233. [Google Scholar] [CrossRef]
- Tang, S.; Zhao, M.; Yuan, D.; Li, X.; Zhang, X.; Wang, Z.; Jiao, T.; Wang, K. MnFe2O4 nanoparticles promoted electrochemical oxidation coupling with persulfate activation for tetracycline degradation. Sep. Purif. Technol. 2021, 255, 117690. [Google Scholar] [CrossRef]
- Wang, J.; Yang, Z.; Li, Y.; Fan, X.; Zhang, F.; Zhang, G.; Peng, W.; Wang, S. Synthesis of porous nitrogen doped carbon cage from carbide for catalytic oxidation. Carbon 2020, 163, 43–55. [Google Scholar] [CrossRef]
- Peng, X.; Wu, J.; Zhao, Z.; Wang, X.; Dai, H.; Li, Y.; Wei, Y.; Xu, G.; Hu, F. High efficiency degradation of tetracycline by peroxymonosulfate activated with Fe/NC catalysts: Performance, intermediates, stability and mechanism. Environ. Res. 2022, 205, 112538. [Google Scholar] [CrossRef]
- Liu, S.-S.; Xing, Q.-J.; Chen, Y.; Zhu, M.; Jiang, X.-H.; Wu, S.-H.; Dai, W.; Zou, J.-P. Photoelectrochemical degradation of organic pollutants using BiOBr anode coupled with simultaneous CO2 reduction to liquid fuels via CuO cathode. ACS Sustain. Chem. Eng. 2018, 7, 1250–1259. [Google Scholar] [CrossRef]
- Zhang, Y.; Zhou, J.; Chen, X.; Wang, L.; Cai, W. Coupling of heterogeneous advanced oxidation processes and photocatalysis in efficient degradation of tetracycline hydrochloride by Fe-based MOFs: Synergistic effect and degradation pathway. Chem. Eng. J. 2019, 369, 745–757. [Google Scholar] [CrossRef]


| Material Type | Specific Surface Area (m2/g) | Average Pore Size (m2/g) | Total Hole Capacity (m2/g) |
|---|---|---|---|
| BC | 36.419 | 5.7531 | 0.05356 |
| nZVI | 43.928 | 23.8637 | 0.27467 |
| BC-nZVI (new) | 32.9537 | 23.4526 | 0.118673 |
| BC-nZVI (used) | 91.3207 | 12.8578 | 0.311817 |
| No. | Fe:C | Activation Systems | TC Concentration (mM) | PS Concentration (mM) | Dosage of Activation Materials PS Concentration (mg) |
|---|---|---|---|---|---|
| 1 | / | blank group | 0.05 | 0 | 0 |
| 2 | / | BC | 0.05 | 0 | 10 |
| 3 | / | nZVI | 0.05 | 0 | 10 |
| 4 | / | PS | 0.05 | 0.25 | 0 |
| 5 | / | BC/PS | 0.05 | 0.25 | 10 |
| 6 | / | nZVI/PS | 0.05 | 0.25 | 10 |
| 7 | 1:1 | BC-nZVI/PS | 0.05 | 0.25 | 10 |
| pH | TC Degradation Rate (%) | ||||
|---|---|---|---|---|---|
| Blank Group | TBA | MeOH | PBQ | His | |
| 3 | 97.03 | 73.76 | 35.69 | 88.95 | 87.48 |
| 5 | 94.22 | 65.64 | 32.36 | 86.87 | 87.4 |
| 7 | 91.51 | 45.38 | 31.87 | 80.63 | 79.24 |
| 9 | 42.11 | 22.33 | 20.26 | 39.39 | 36.69 |
| Water Quality Indicators | Water Samples at Fine Grids | Water Samples at the Anaerobic Pond |
|---|---|---|
| Concentration/Value | Concentration/Value | |
| COD (mg·L−1) | 207.08 | 99.56 |
| NH4+-N (mg·L−1) | 46.36 | 34.93 |
| TP (mg·L−1) | 5.56 | 13.66 |
| TN (mg·L−1) | 38.498 | 30.697 |
| pH | 7.23 | 7.20 |
| Reagent | Molecular Formula | Purity | Manufacturer |
|---|---|---|---|
| Tetracycline hydrochloride | C22H24N2O8·HCl | 98% | Maclean’s (Toronto, ON, Canada) |
| Ferrous sulfate heptahydrate | FeSO4·7H2O | AR | Tianjin Xinbute (Tianjin, China) |
| Sodium Borohydride | NaBH4 | AR | Tianjin Xinbute |
| Anhydrous ethanol | CH3CH2OH | AR | Tianjin Xintong (Tainjin, China) |
| Polyethylene glycol (4000) | H(OCH2CH2)nOH | AR | Sinopharm Reagent (Shanghai, China) |
| Sodium hydroxide | NaOH | AR | Aladdin (Los Angeles, CA, USA) |
| Methanol solution | CH3OH | AR | Thermo Fisher (Waltham, MA, USA) |
| Formic acid solution (0.1%) | HCOOH | AR | Thermo Fisher (Waltham, MA, USA) |
| Potassium persulfate | K2S2O8 | - | Maclean’s (Toronto, ON, Canada) |
| Biochar | - | - | - |
| Instruments | Instrument Model | Manufacturer |
|---|---|---|
| Vacuum Glove Box | AGB-4B | TONGLONG (Changshu, China) |
| Vacuum drying oven | DZF-6020A | Powerstar Technology (Shenzhen, China) |
| Electric Stirrer | LC-ES-60SH | Li-Chen Technology (Shanghai, China) |
| Water Bath Oscillator | SHZ-92A | Shaying Scientific Instrument (Shanghai, China) |
| Magnetic Stirrer | 90-2 | Changzhou Jintan Kexing Instrument (Changzhou, China) |
| Electronic Balance | BSA223S | Jena (Shanghai, China) |
| Numerical control ultrasonic cleaner | KQ3200DE | Linshang Technology (Shenzhen, China) |
| Constant temperature water bath | SHHW21.600ALL | Tianjin Guanze (Tianjin, China) |
| Negative pressure vacuum pump | SCJ-10 | Changchun Jida-Swan (Changchun, China) |
| pH meter | PHS-3E | Leimagnet (Shanghai, China) |
| Liquid Chromatography–Mass Spectrometry | Thermo Scientific TSQ Fortis Plus | Thermo Fisher (Waltham, MA, USA) |
| LC–MS | Agilent1260 | Agilent (Santa Clara, CA, USA) |
| Indicator | Measurement Methodology |
|---|---|
| NH4+-N | Nano Reagent Spectrophotometry |
| TP | Ammonium Molybdate Spectrophotometry |
| TN | Alkaline Potassium Persulfate Elimination UV Spectrophotometry |
| COD | Rapid Elimination Method |
| pH | Portable pH meter |
| Iron–Carbon Mass Ratio | BC (g) | FeSO4 (g) |
|---|---|---|
| 2:1 | 0.5 | 5 |
| 1:1 | 1 | 5 |
| 1:2 | 2 | 5 |
| 1:4 | 4 | 5 |
| 1:6 | 6 | 5 |
Disclaimer/Publisher’s Note: The statements, opinions and data contained in all publications are solely those of the individual author(s) and contributor(s) and not of MDPI and/or the editor(s). MDPI and/or the editor(s) disclaim responsibility for any injury to people or property resulting from any ideas, methods, instructions or products referred to in the content. |
© 2024 by the authors. Licensee MDPI, Basel, Switzerland. This article is an open access article distributed under the terms and conditions of the Creative Commons Attribution (CC BY) license (https://creativecommons.org/licenses/by/4.0/).
Share and Cite
Yan, B.; Li, X.; Wang, X.; Yang, P.; Lu, H.; Zhang, X. Degradation Efficiency and Mechanism of Tetracycline in Water by Activated Persulfate Using Biochar-Loaded Nano Zero-Valent Iron. Molecules 2024, 29, 3875. https://doi.org/10.3390/molecules29163875
Yan B, Li X, Wang X, Yang P, Lu H, Zhang X. Degradation Efficiency and Mechanism of Tetracycline in Water by Activated Persulfate Using Biochar-Loaded Nano Zero-Valent Iron. Molecules. 2024; 29(16):3875. https://doi.org/10.3390/molecules29163875
Chicago/Turabian StyleYan, Bojiao, Xueqi Li, Xiaoyan Wang, Ping Yang, Hai Lu, and Xiaoyu Zhang. 2024. "Degradation Efficiency and Mechanism of Tetracycline in Water by Activated Persulfate Using Biochar-Loaded Nano Zero-Valent Iron" Molecules 29, no. 16: 3875. https://doi.org/10.3390/molecules29163875