
Enhancing Insight into Photochemical Weathering of Flax and Miscanthus: Exploring Diverse Chemical Compositions and Composite Materials
 , ,
, ,
Abstract
:1. Introduction
2. Results
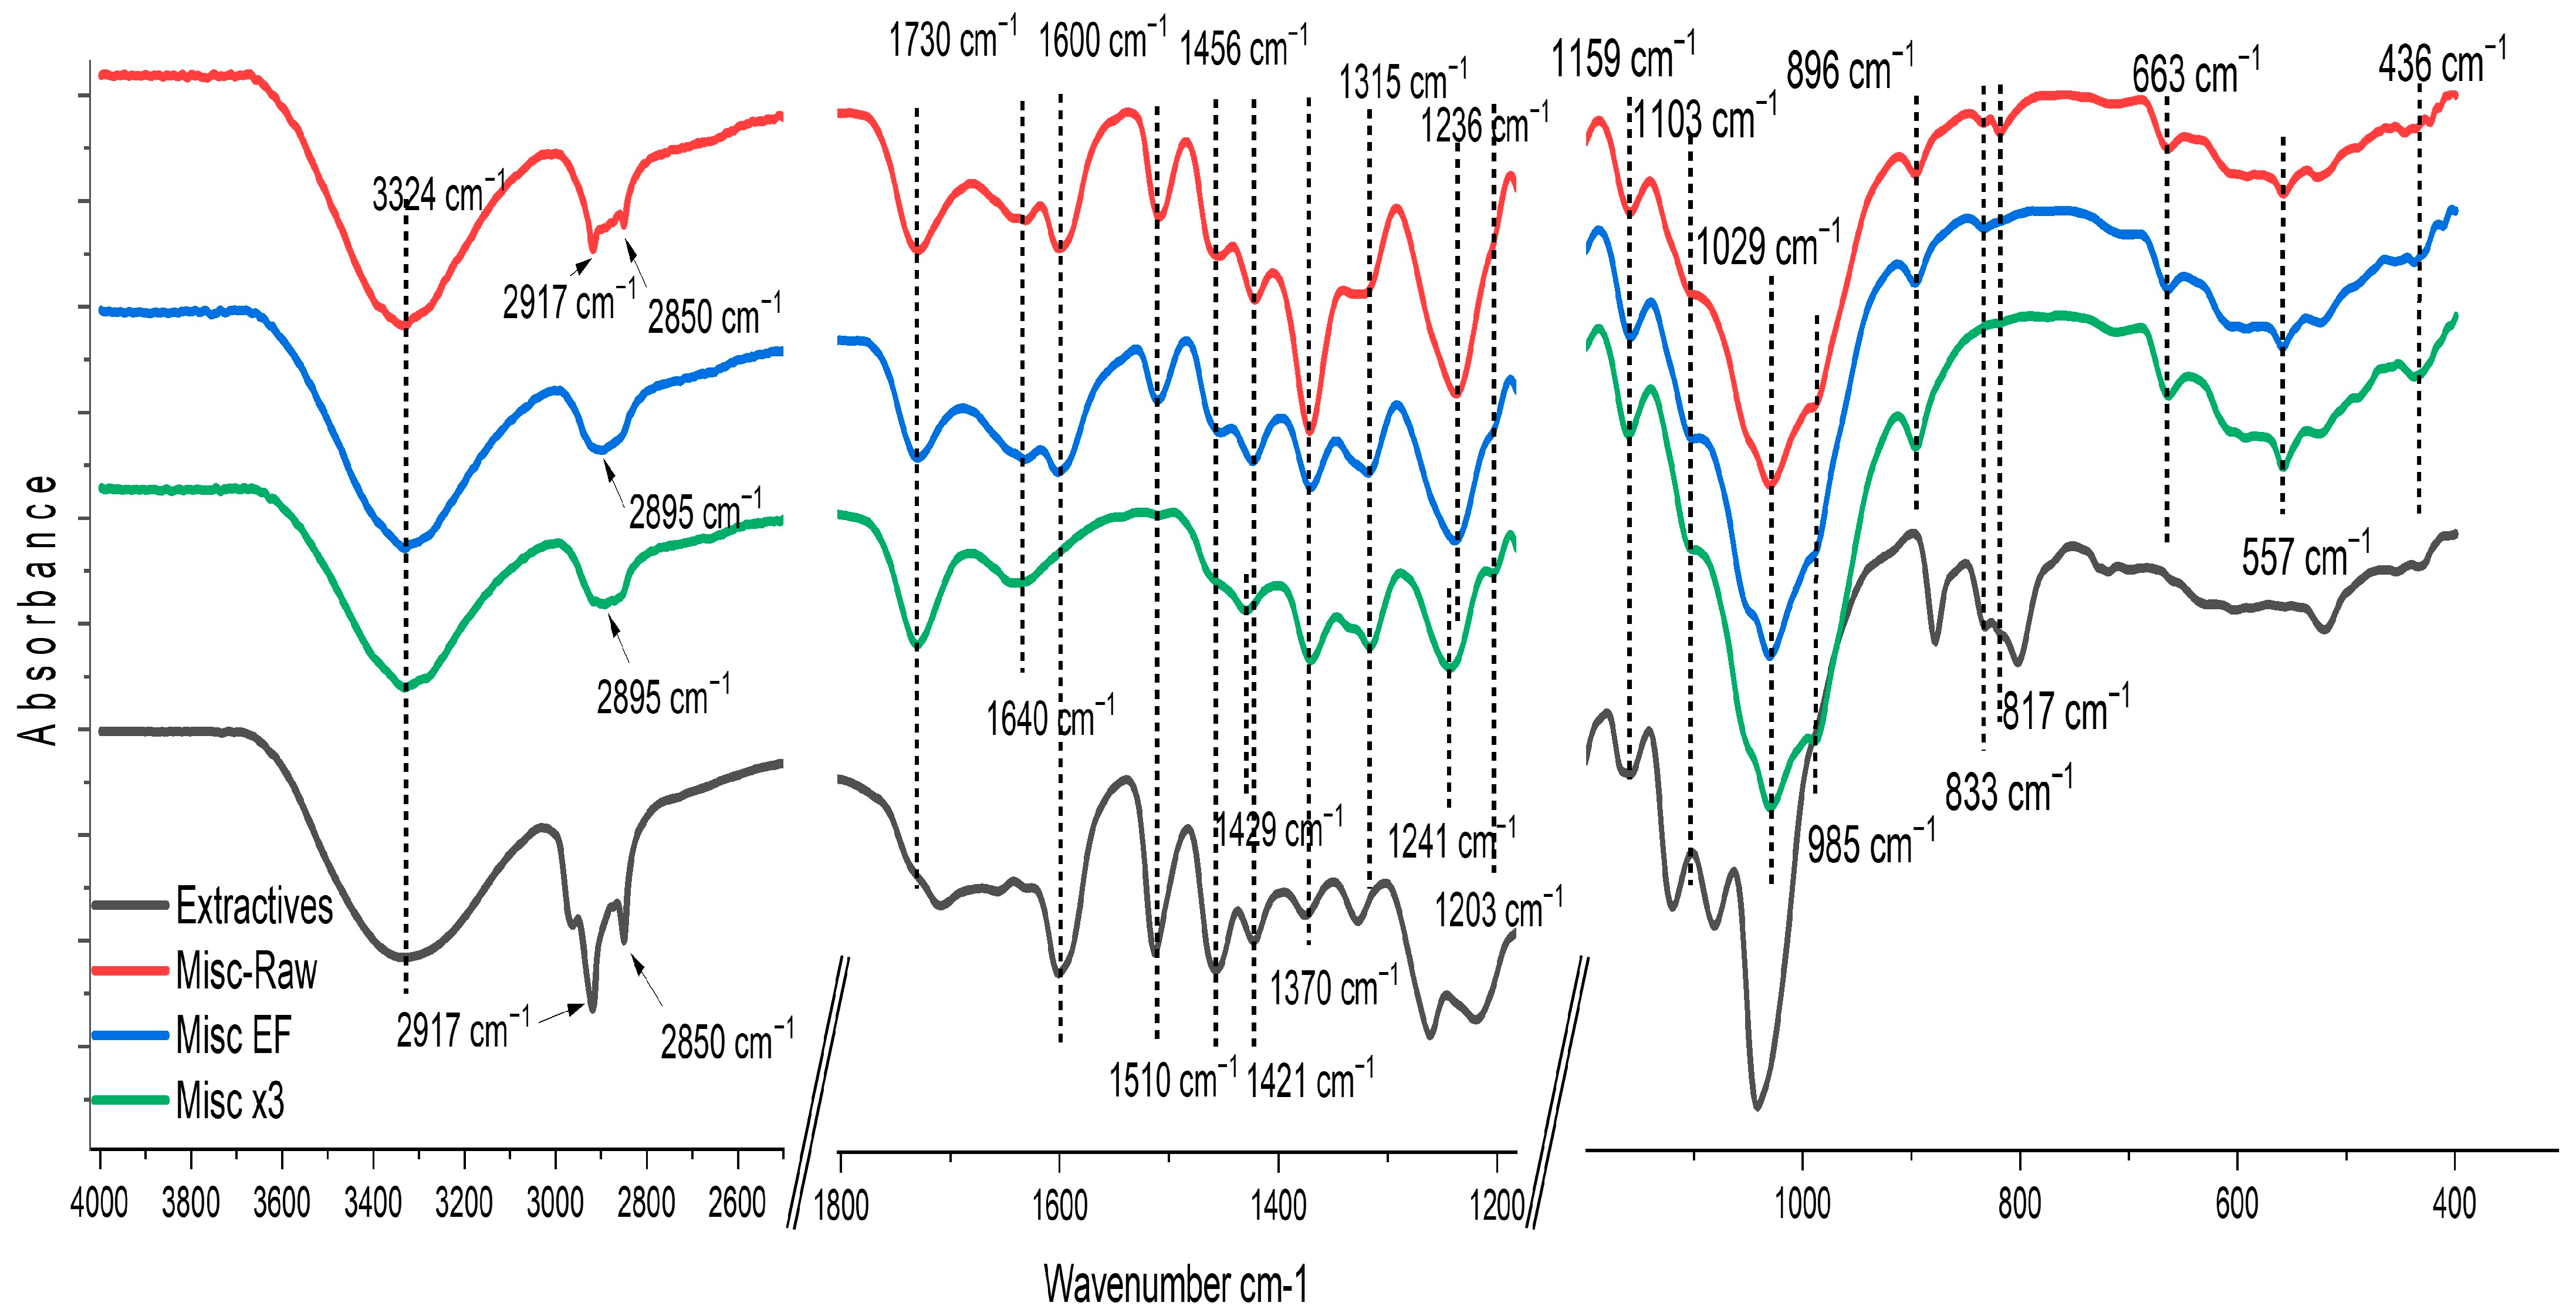
2.1. Fiber Analysis
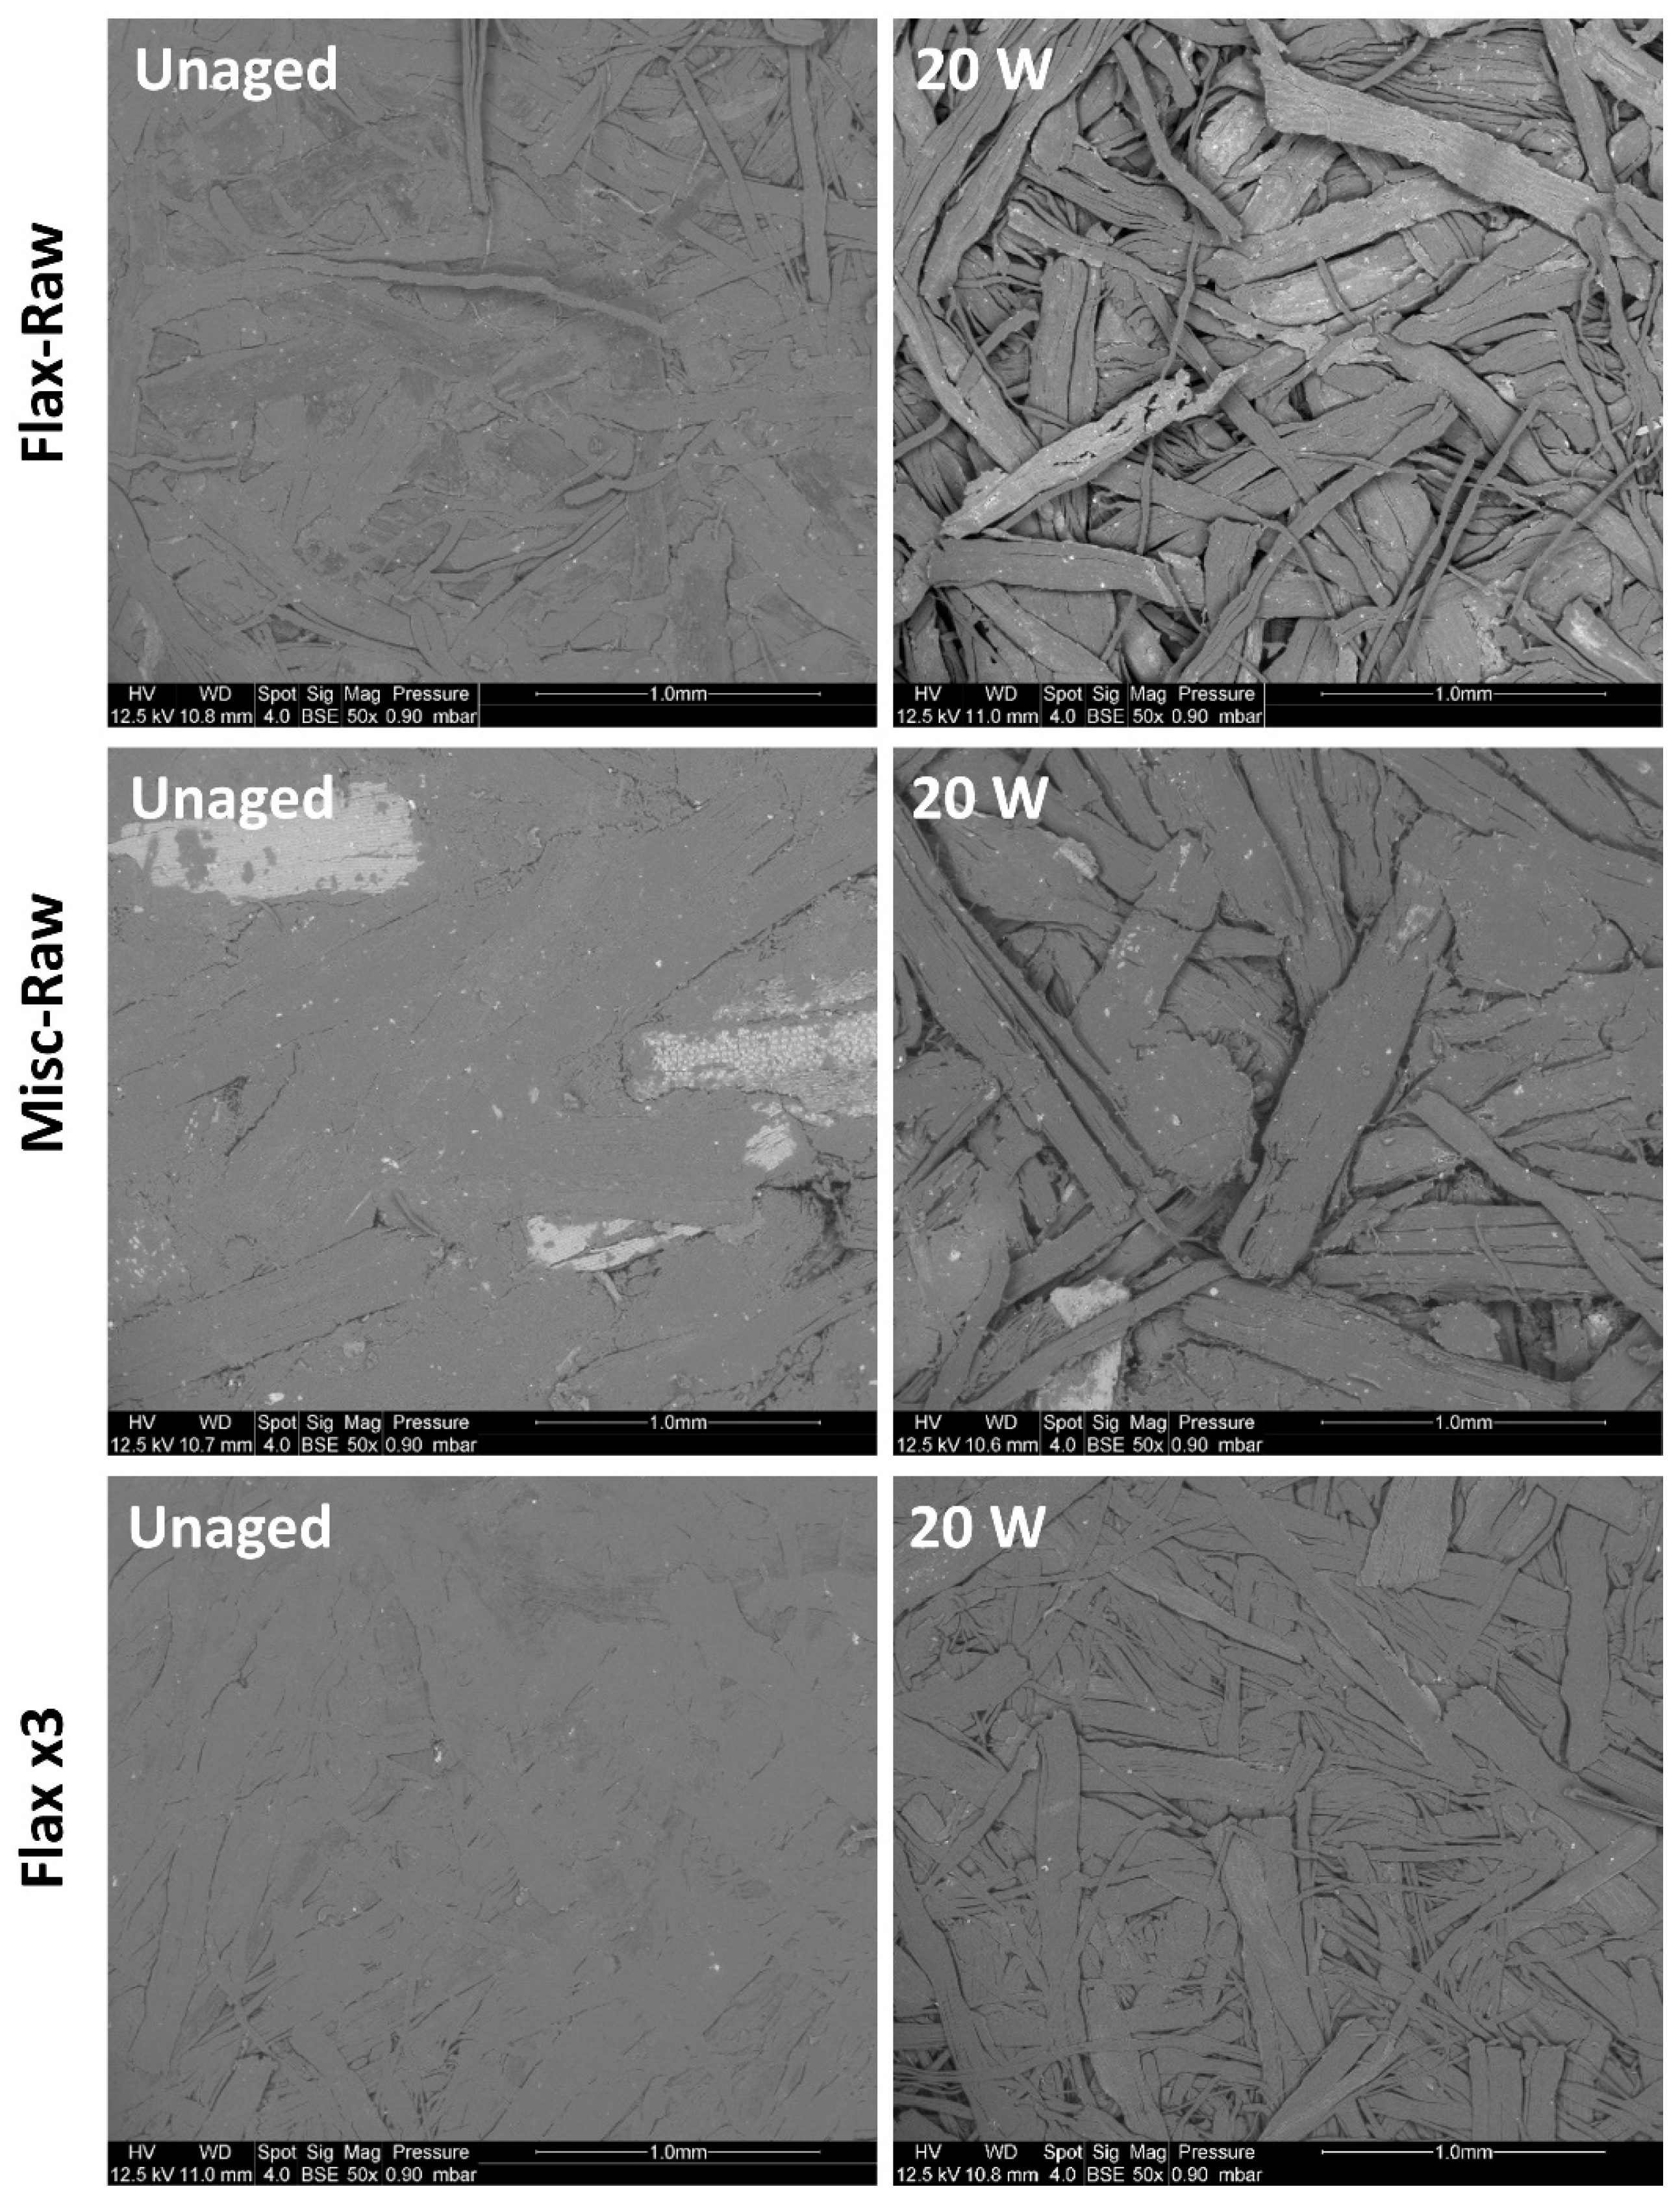
2.2. Compressed Fiber Disc Weathering
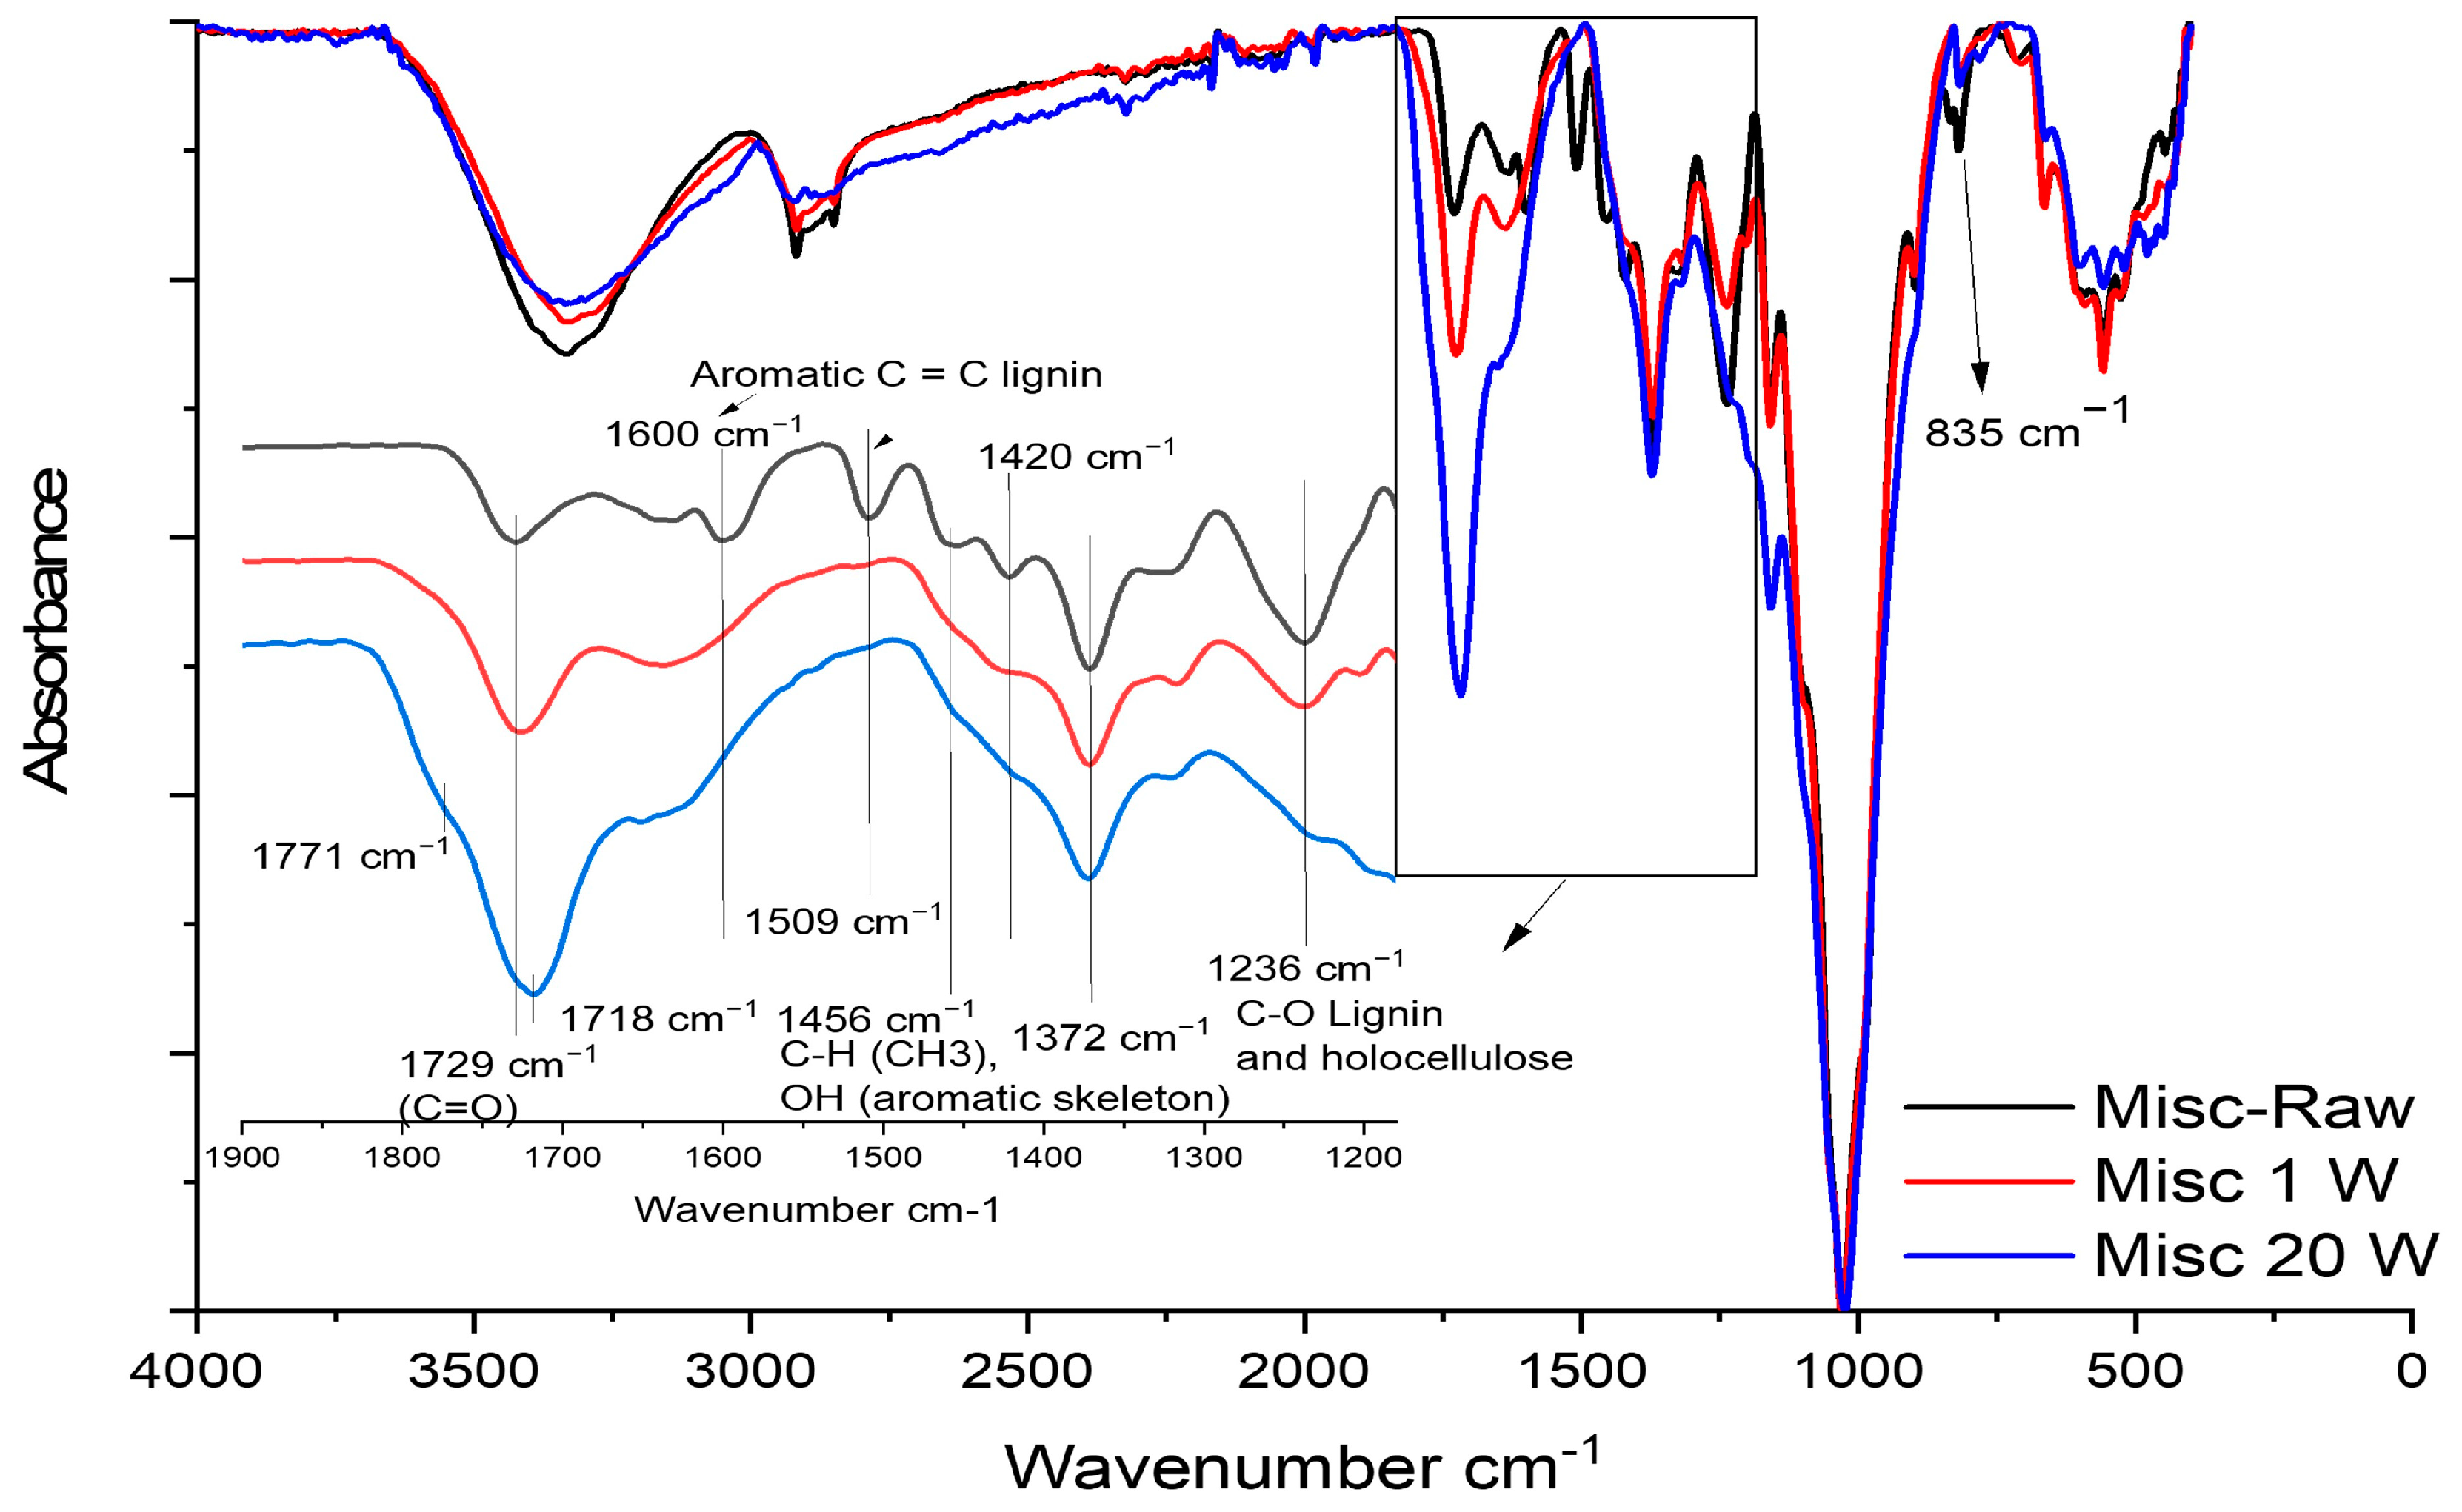
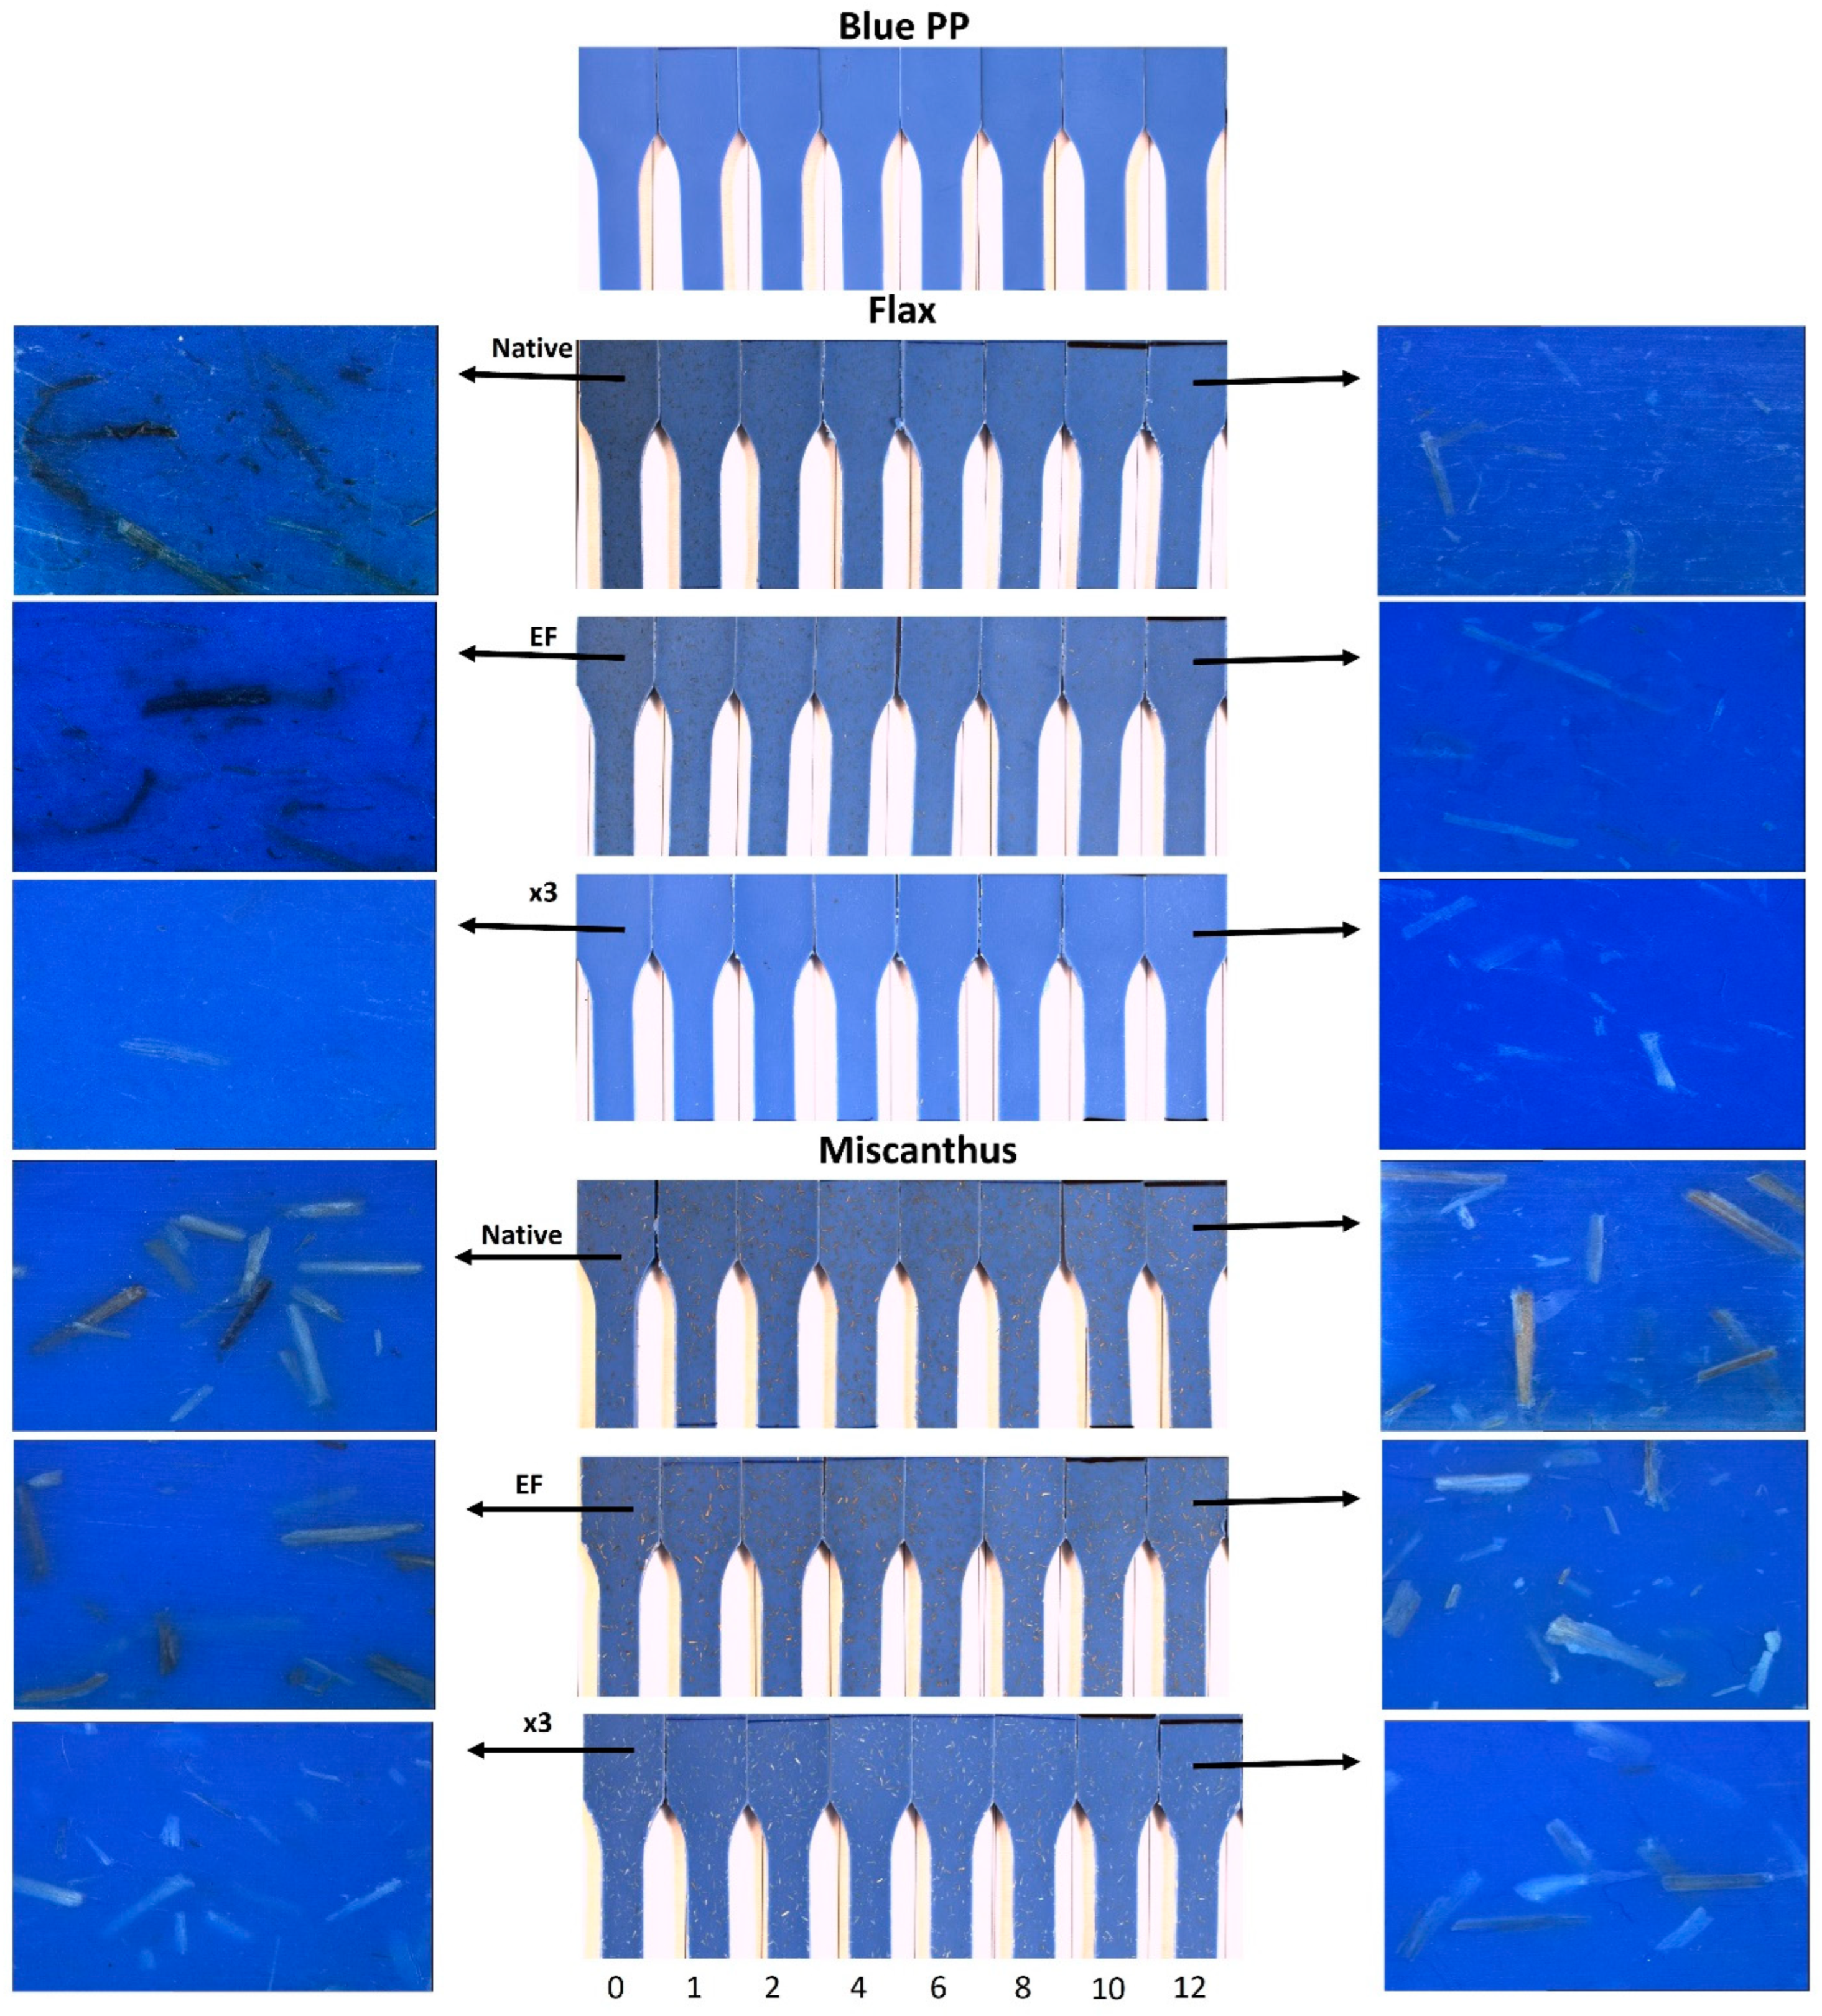
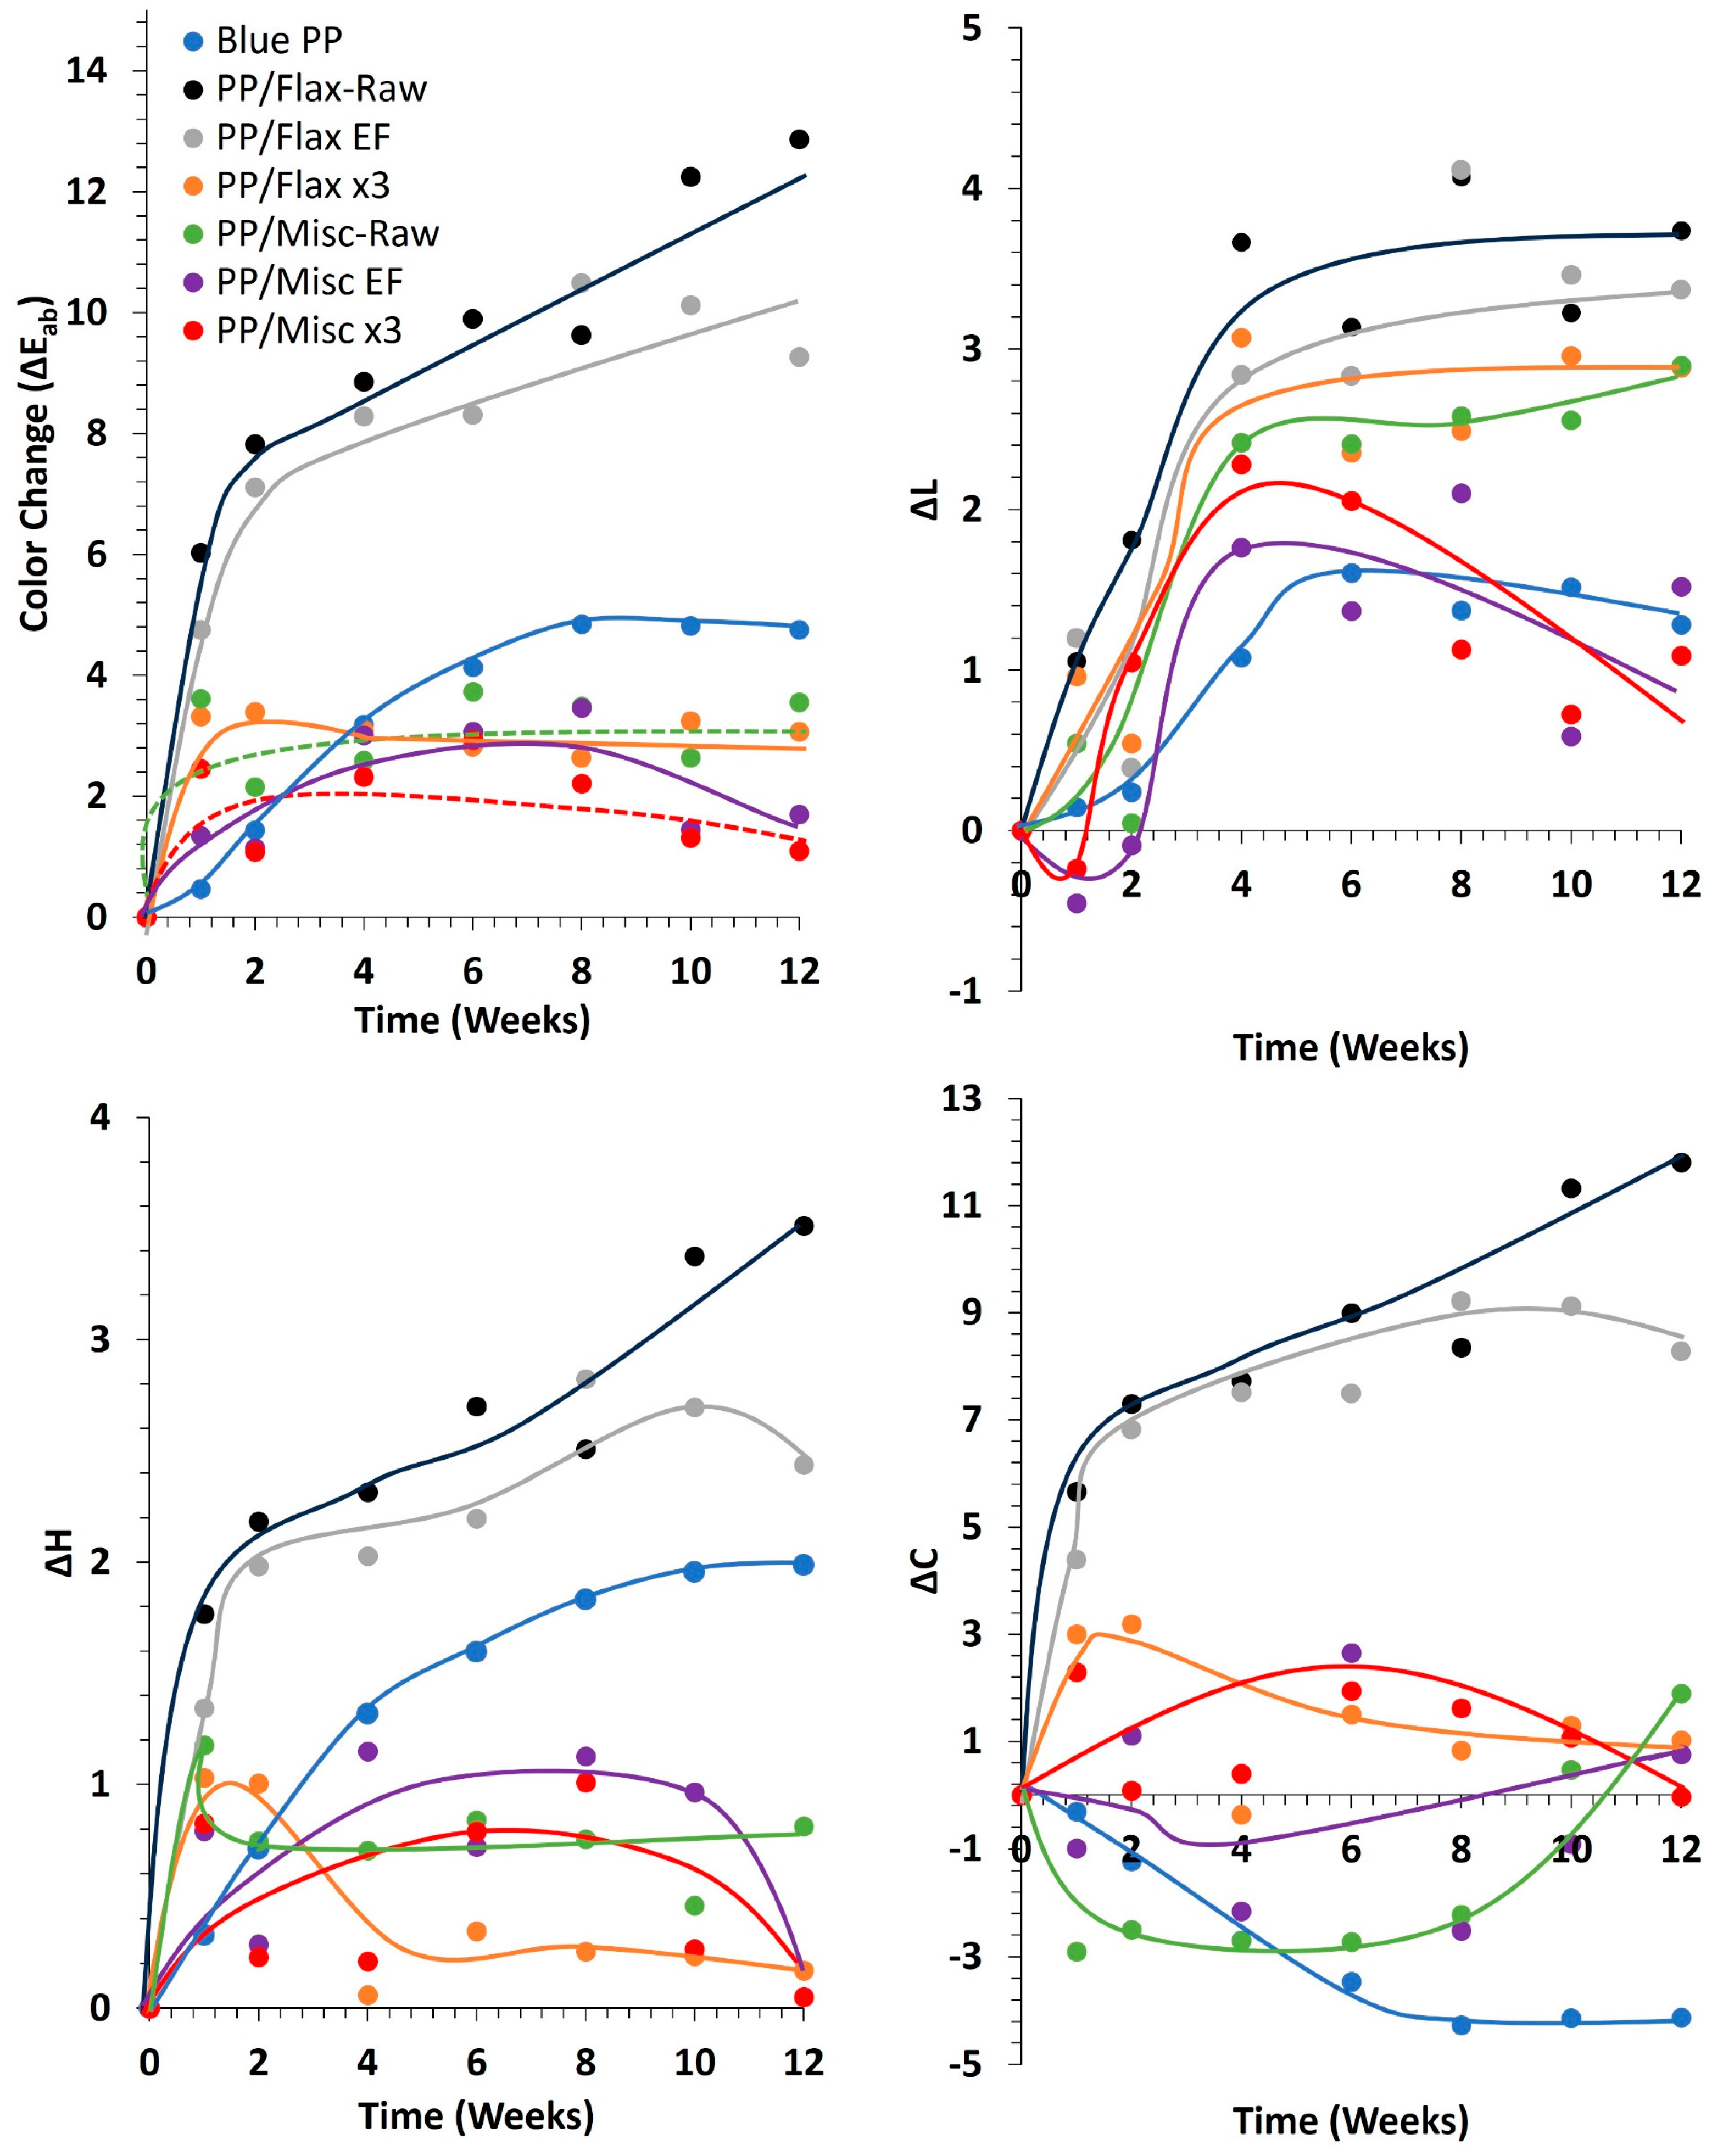
2.3. Weathering of Composites
3. Materials and Methods
3.1. Materials
3.2. Methods
3.2.1. Elemental Nitrogen, Sulfur, Carbon and Hydrogen Contents
3.2.2. Ash Content
3.2.3. Determination of Soluble Extractive Content
3.2.4. Determination of Holocellulose Content
3.2.5. Determination of Cellulose Content
3.2.6. Determination of Klason Lignin Content
3.2.7. Fiber and Disc Preparation
3.2.8. Composite Preparation
3.2.9. Accelerated UV Weathering
3.2.10. Spectrophotometer Analysis
3.2.11. Scanning Electron Microscope (SEM) Observation
3.2.12. Attenuated Total Reflectance-Fourier-Transform Infrared Spectroscopy (ATR-FTIR)
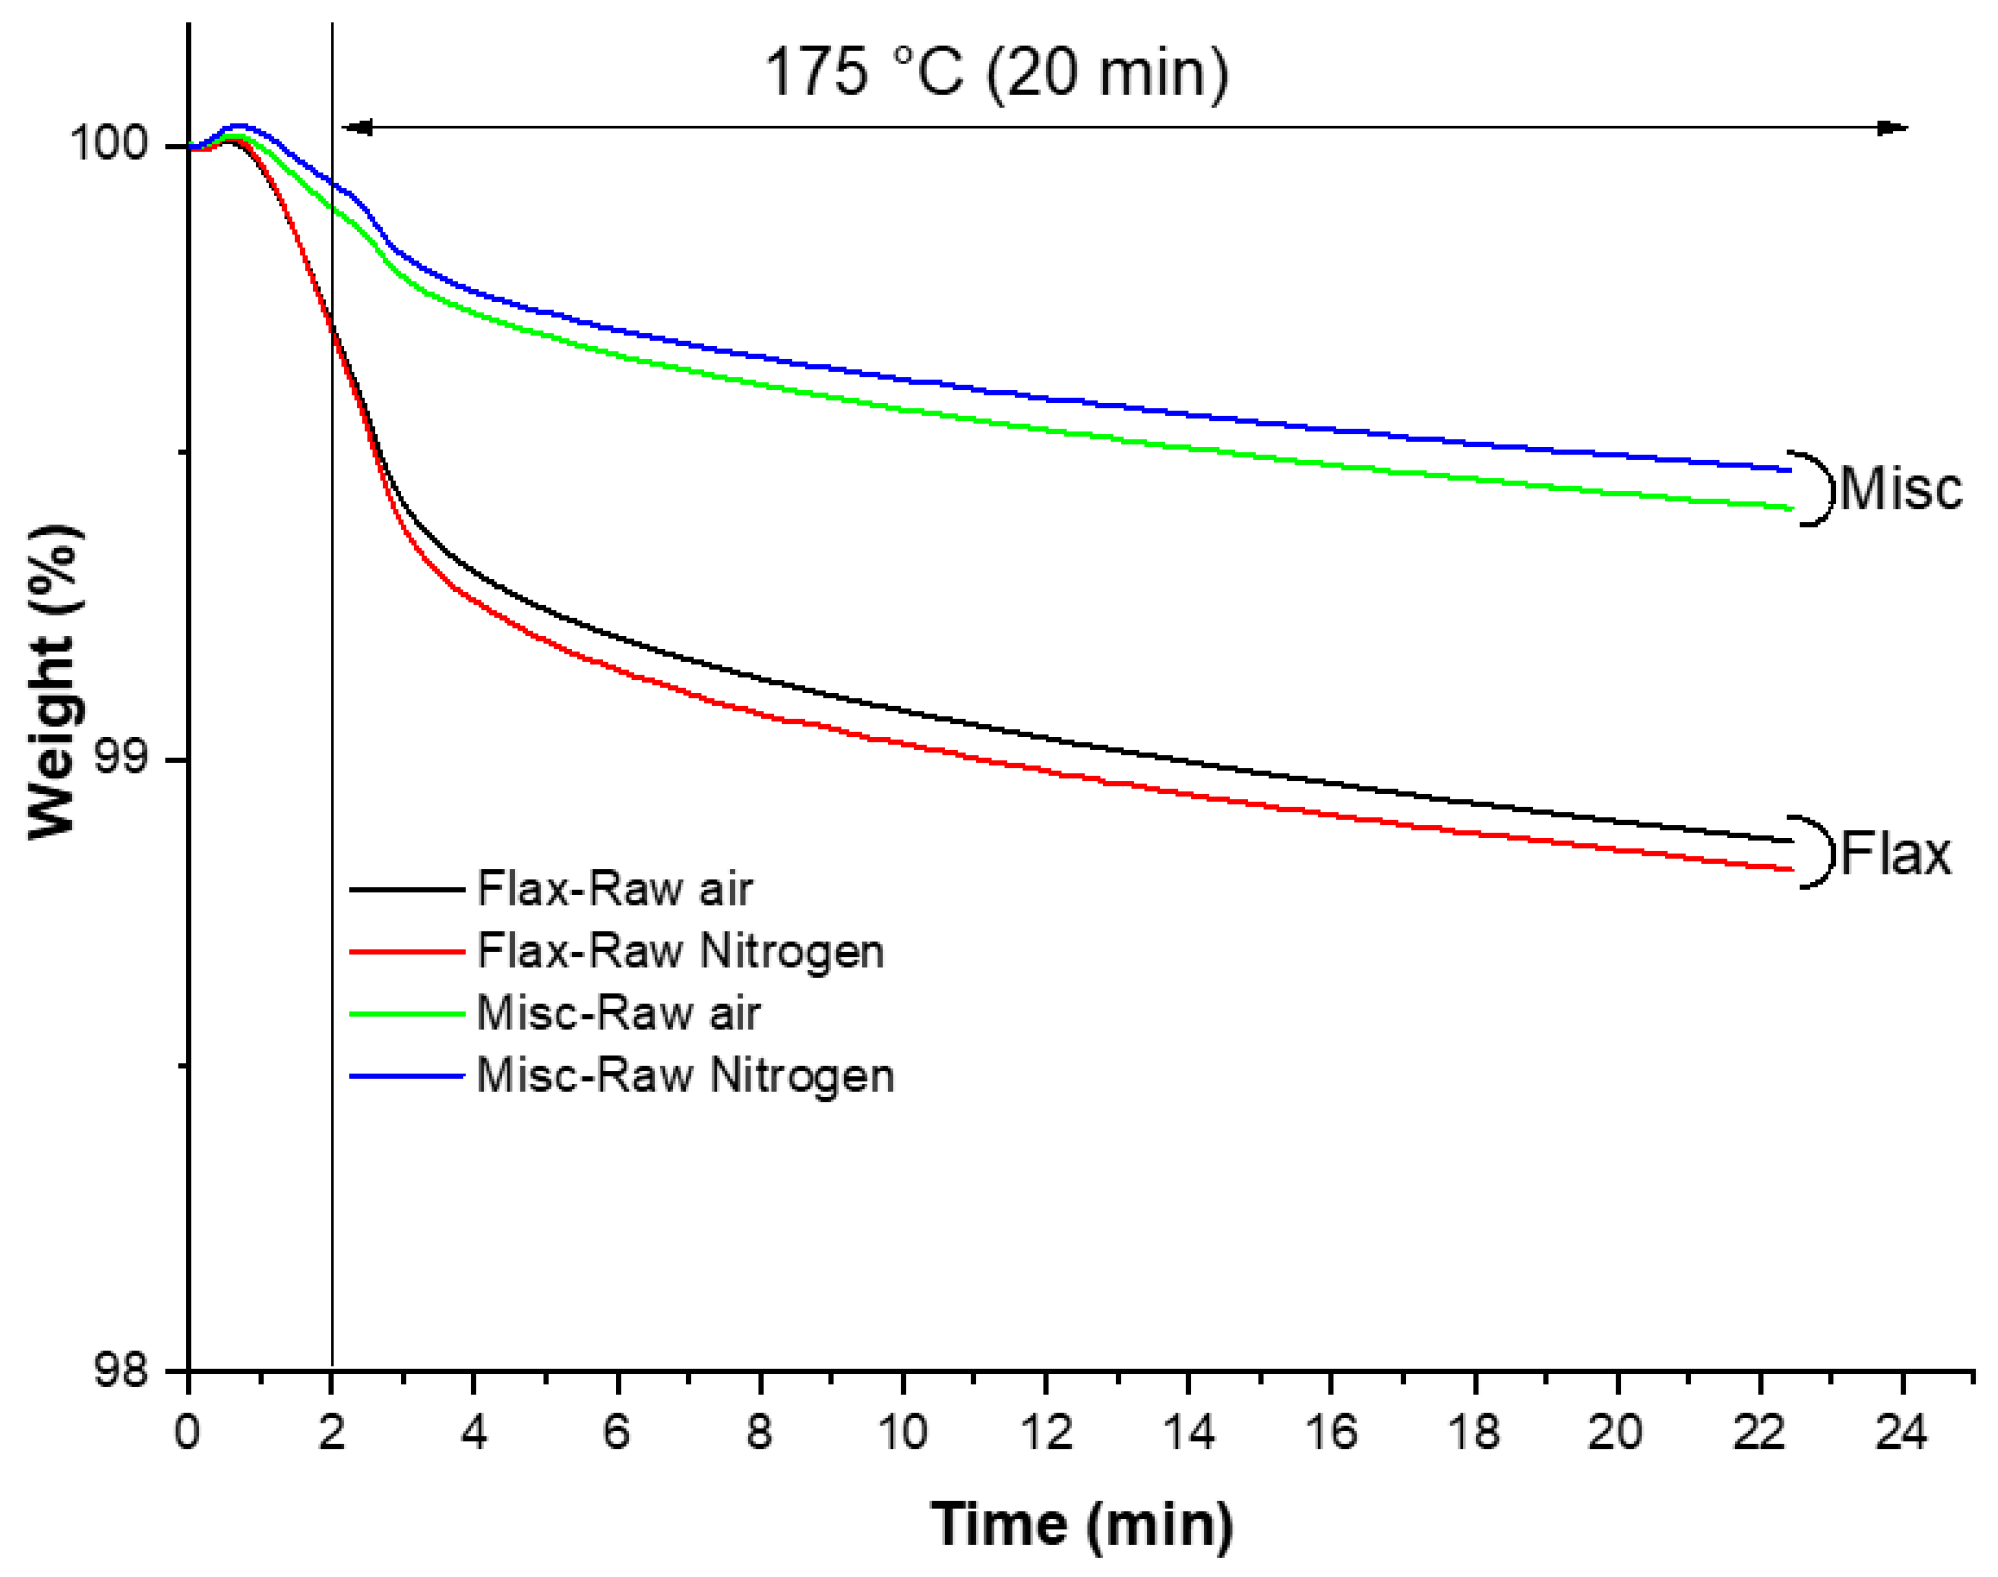
3.2.13. Thermogravimetric Analysis (TGA)
- Heating from room temperature to 105 °C;
- Isothermal heating at 105 °C for 10 min to remove residual moisture;
- Fast heating from 105 °C to 175 °C for 2 min;
- Isothermal heating at 175 °C for 20 min.
4. Conclusions
- The weathering of fibers was found to be influenced not only by the presence of lignin, but also by their type, composition and initial color. Lignin presence and content in miscanthus significantly influenced color variation, while extractive presence showed a limiting effect on color variation for both fibers.
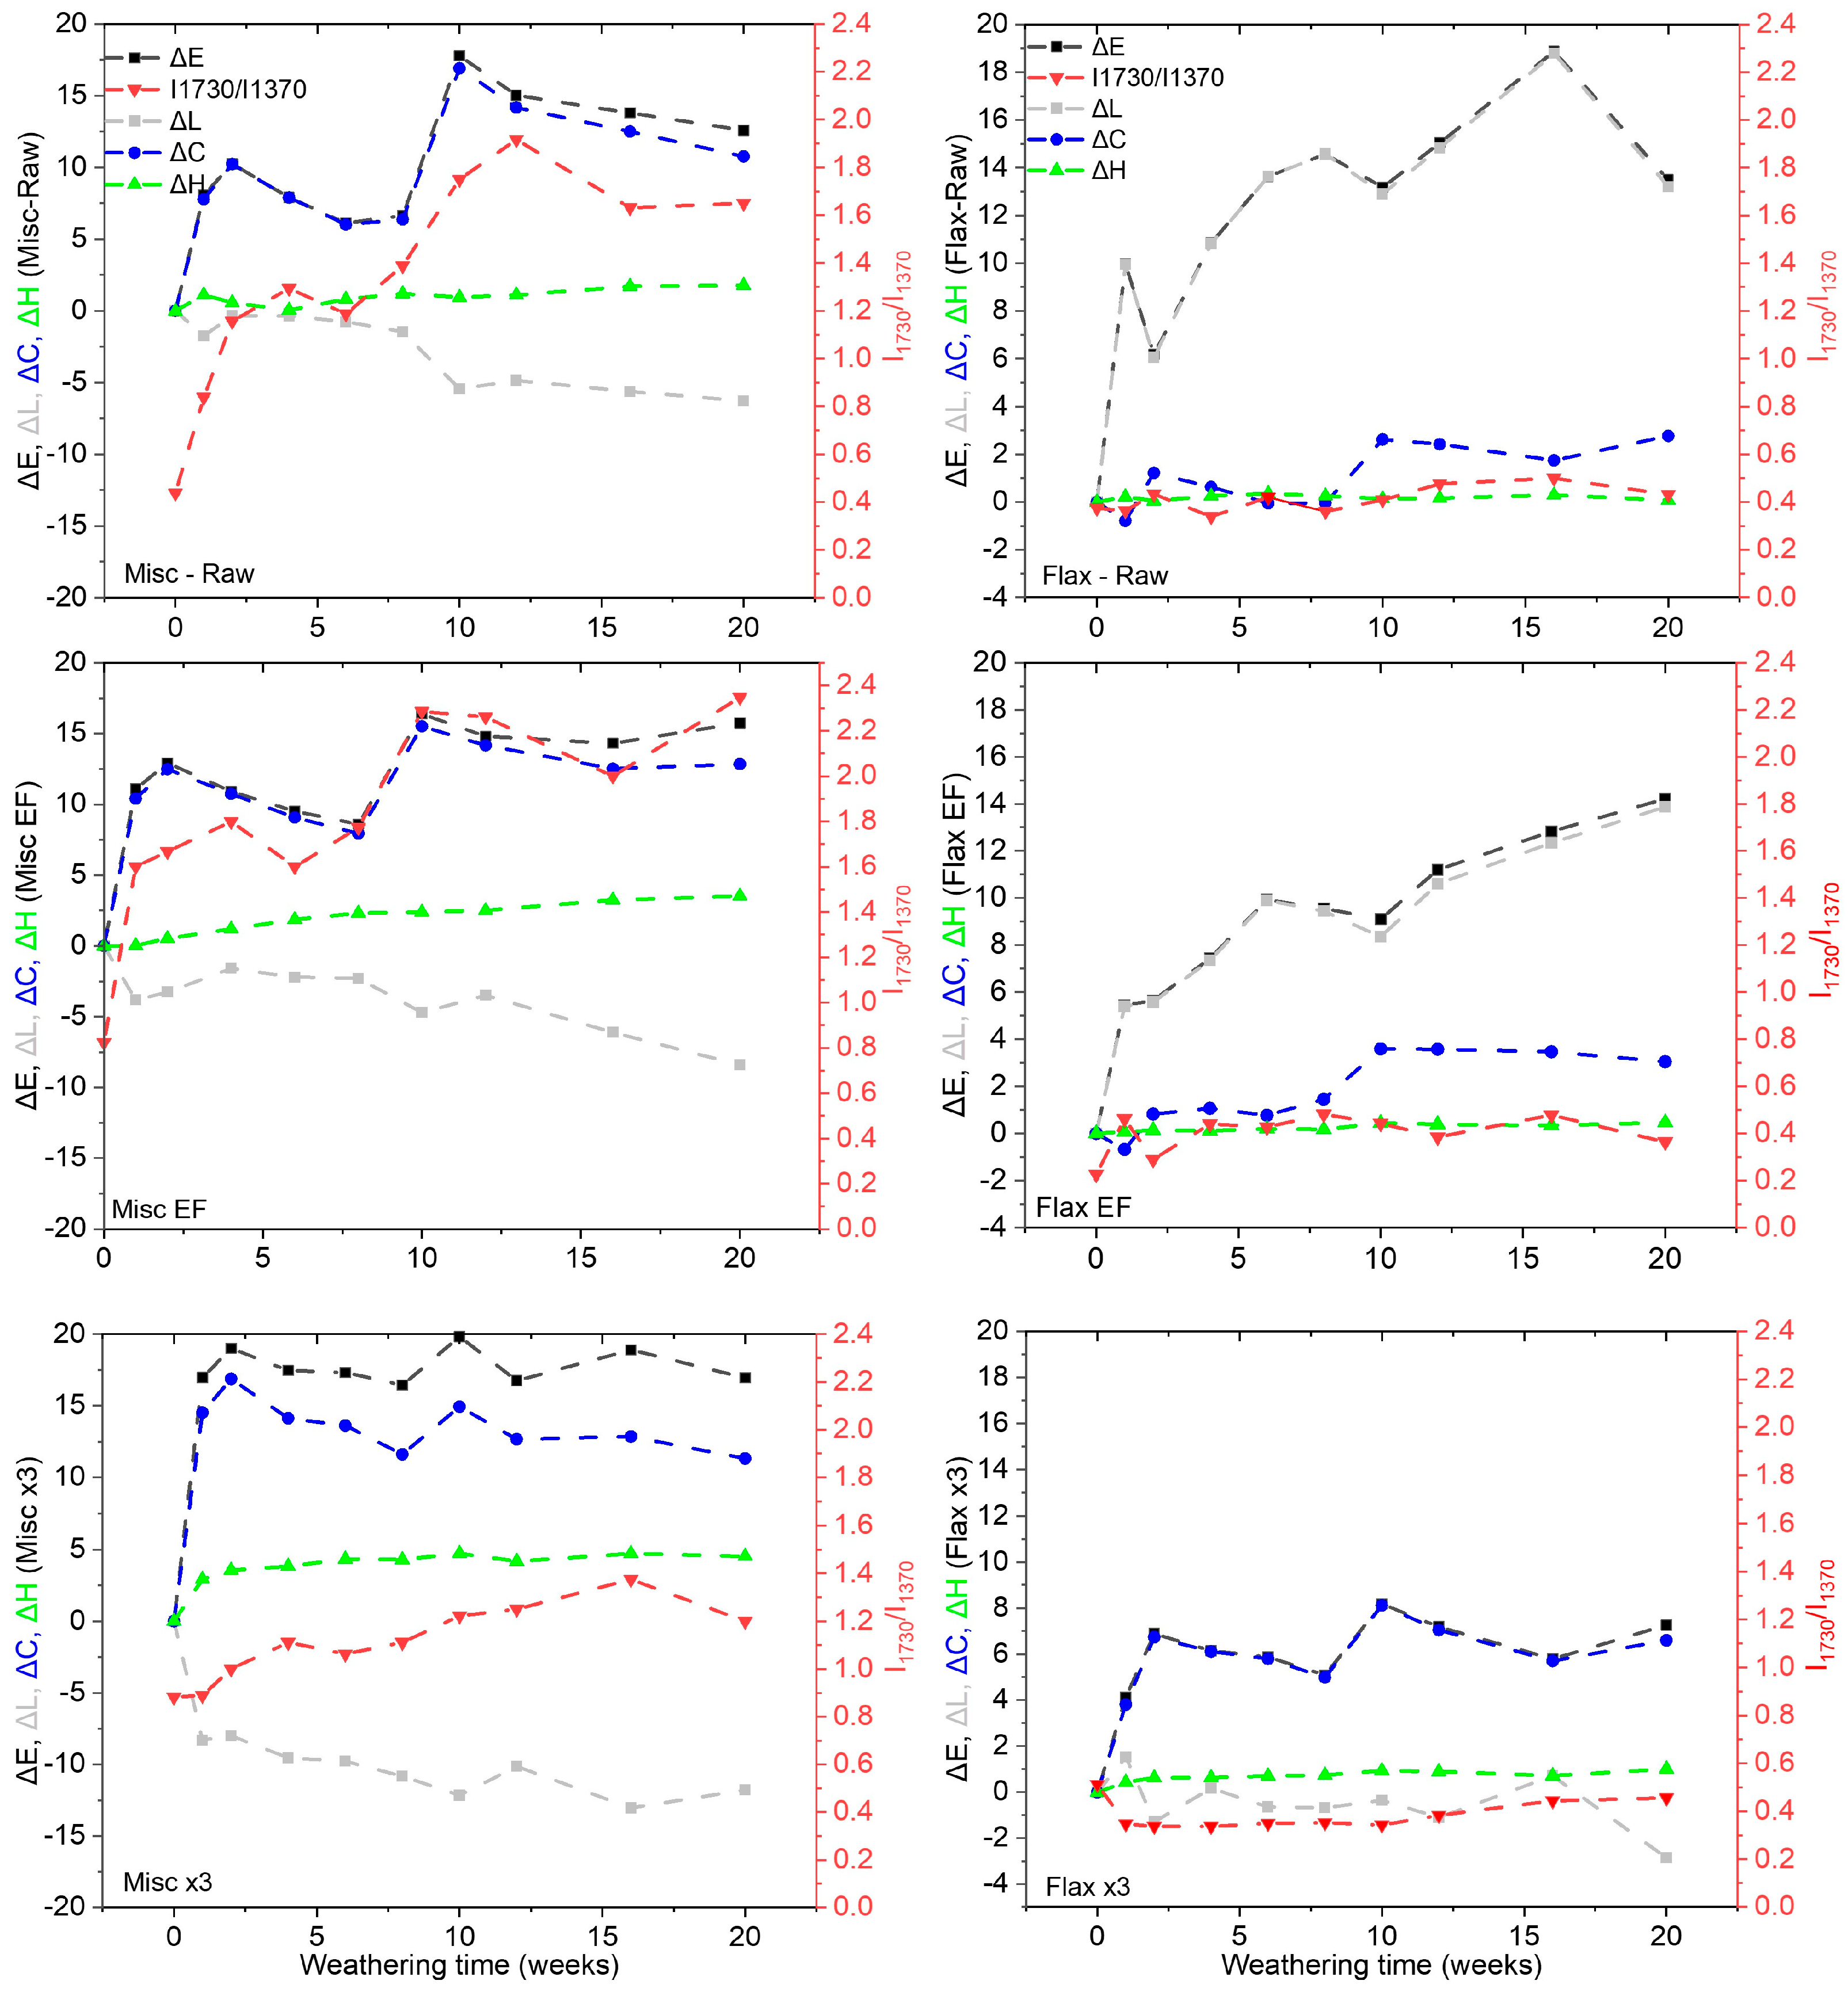
- Both raw and EF flax and miscanthus exhibited color changes, reaching the same value for total color variation () of 12–13 after 20 weeks of weathering. variation is linked to for miscanthus and to for flax.
- Miscanthus raw and EF fibers darkened over time, whereas Flax-Raw and EF fibers lightened. This behavior correlated with higher lignin content and lignin type in miscanthus, along with significant differences in carbonyl (C=O) formation and increase.
- Delignified fibers, particularly flax x3, demonstrated better color stability.
- The preparation process of composites significantly influenced fiber color before weathering, thereby affecting the color evolution during weathering. Composites demonstrated better color stability when incorporating miscanthus (Raw, EF and x3) and delignified flax fibers. This stability was attributed not to the type of lignin present but to the thermal stability of the fibers, as suggested by the TGA results. The thermal stability of the fibers during processing plays a crucial role in color variation by producing darker degradable products. However, no direct correlation was found between the weathering of fibers alone and their behavior after being integrated into the PP blue matrix. The color variation trends of standalone fibers differed from those observed after their integration into the matrix, indicating that the extrusion and injection processes contributed to pre-weathering color changes likely due to the thermal modification of the fibers.
- Another hypothesis that could explain this behavior involves the chemical interactions between the PP matrix and the fibers, possibly due to the disruption of the PP stabilizer by the presence of the fibers. Additionally, the color variation might be attributed to an interference phenomenon related to the blue color of the matrix. Further investigation into these hypotheses is recommended to fully understand the underlying mechanisms.
- By analyzing the results of this study, we aim to develop strategies to enhance fiber stability during composite preparation and aging. Efforts are underway to improve the stability of these fibers.
Supplementary Materials
Author Contributions
Funding
Institutional Review Board Statement
Informed Consent Statement
Data Availability Statement
Acknowledgments
Conflicts of Interest
References
- Candela, A.; Sandrini, G.; Gadola, M.; Chindamo, D.; Magri, P. Lightweighting in the Automotive Industry as a Measure for Energy Efficiency: Review of the Main Materials and Methods. Heliyon 2024, 10, e29728. [Google Scholar] [CrossRef] [PubMed]
- Elfaleh, I.; Abbassi, F.; Habibi, M.; Ahmad, F.; Guedri, M.; Nasri, M.; Garnier, C. A Comprehensive Review of Natural Fibers and Their Composites: An Eco-Friendly Alternative to Conventional Materials. Results Eng. 2023, 19, 101271. [Google Scholar] [CrossRef]
- Badji, C.; Beigbeder, J.; Garay, H.; Bergeret, A.; Benezet, J.-C.; Desauziers, V.; Beigbeder, J.; Bénézet, J.-C. Correlation between Artificial and Natural Weathering of Hemp Fibers Reinforced Polypropylene Biocomposites. Polym. Degrad. Stab. 2018, 148, 117–131. [Google Scholar] [CrossRef]
- Chang, T.C.; Chang, H.T.; Wu, C.L.; Lin, H.Y.; Chang, S.T. Stabilizing Effect of Extractives on the Photo-Oxidation of Acacia Confusa Wood. Polym. Degrad. Stab. 2010, 95, 1518–1522. [Google Scholar] [CrossRef]
- Shen, H.; Cao, J.; Sun, W.; Peng, Y. Influence of Post-Extraction on Photostability of Thermally Modified Scots Pine Wood during Artificial Weathering. Bioresources 2016, 11, 4512–4525. [Google Scholar]
- Chang, S.-T.; Wang, S.-Y.; Su, Y.-C.; Huang, S.-L.; Kuo, Y.-H. Chemical Constituents and Mechanisms of Discoloration of Taiwania (Taiwania Cryptomerioides Hayata) Heartwood. Holzforschung 1999, 53, 142–146. [Google Scholar]
- Kačík, F.; Vel’Ková, V.; Šmíra, P.; Nasswettrová, A.; Kačíková, D.; Reinprecht, L. Release of Terpenes from Fir Wood during Its Long-Term Use and in Thermal Treatment. Molecules 2012, 17, 9990–9999. [Google Scholar] [CrossRef]
- Nolan, P.; Van Den Akker, J.A.; Wink, W.A. The Fading of Groundwood by Light. Pap. Trade 1945, 121, 101–105. [Google Scholar]
- Jaeger, C.; Nourmamode, A.; Castellan, A. Photodegradation of Lignin: A Photochemical Study of Phenolic Coniferyl Alcohol Lignin Model Molecules. Holzforschung 1993, 375, 375–390. [Google Scholar]
- Heitner, C.; Schmidt, J. Light-Induced Yellowing of Wood Containing Papers. A Review of Fifty Years of Research. In Proceedings of the 6th International Symposium of Wood and Pulp Chemistry, Melbourne, Australia, 15–18 February 1991; pp. 131–149. [Google Scholar]
- Vanucci, C.; De Violet Fornier, P.; Bouas-Laurent, H.; Castellan, A. Photodegradation of Lignin: A Photophysical and a Photochemical Study of a Non-Phenolic -Carbonyl β-O-4 Lignin Model Dimer, 3,4-Dimethoxy-a-(2′-Methoxyphenoxy)Acetophenone. J. Photochem. Photobiol. A Chem. 1988, 41, 251–265. [Google Scholar]
- Kuo, M.-L.; Hu, N. Ultrastructural Changes of Photodegradation of Wood Surfaces Exposed to UV*. Holzforschung 1991, 45, 347–353. [Google Scholar]
- Kačík, F.; Šmíra, P.; Kačíková, D.; Reinprecht, L.; Nasswettrová, A. Chemical Changes in Fir Wood from Old Buildings Due to Ageing. Cellul. Chem. Technol. 2014, 48, 79–88. [Google Scholar]
- McBurney, L.F. Cellulose and Cellulose Derivatives, Part I; Ott, K., Spurlin, H.M., Eds.; Inter-Science Publishers: New York, NY, USA, 1954. [Google Scholar]
- Egerton, G.s.; Attle, E.; Rathor, M.A. Photochemistry of Cellulose in the Far Ultra-Violet. Nat. Radiat. Chem. 1962, 194, 968–969. [Google Scholar]
- Pandey, K.K. Study of the Effect of Photo-Irradiation on the Surface Chemistry of Wood. Polym. Degrad. Stab. 2005, 90, 9–20. [Google Scholar] [CrossRef]
- Allen, N.S.; Chirinos-Padron, A.; Henman, T.J. Photoinitiated Oxidation of Polypropylene: A Review. Prog. Org. Coat. 1985, 13, 97–122. [Google Scholar]
- Carlsson, D.J.; Wiles, D.M. The Photooxidative Degradation of Polypropylene. Part I. Photooxidation and Photoinitiation Processes. J. Macromol. Sci. Part. C 1976, 14, 65–106. [Google Scholar] [CrossRef]
- Lemaire, J.; Arnaud, R.; Gardette, J.-L. The Role of Hydroperoxides in Photooxidation of Polyolefins, Polyamides and Polyurethane Elastomers. Pure Appi. Chem. 1983, 55, 1603–1614. [Google Scholar]
- Carlsson, D.J.; Wiles, D.M. The Photooxidative Degradation of Polypropylene. Part II. Photostabilization Mechanisms. J. Macromol. Sci. Part. C 1976, 14, 155–192. [Google Scholar] [CrossRef]
- Brostow, W.; Lu, X.; Gencel, O.; Osmanson, A.T. Effects of UV Stabilizers on Polypropylene Outdoors. Materials 2020, 13, 1626. [Google Scholar] [CrossRef]
- Azwa, Z.N.; Yousif, B.F.; Manalo, A.C.; Karunasena, W. A Review on the Degradability of Polymeric Composites Based on Natural Fibres. Mater. Des. 2013, 47, 424–442. [Google Scholar] [CrossRef]
- Badji, C.; Beigbeder, J.; Garay, H.; Bergeret, A.; Bénézet, J.C.; Desauziers, V. Exterior and under Glass Natural Weathering of Hemp Fibers Reinforced Polypropylene Biocomposites: Impact on Mechanical, Chemical, Microstructural and Visual Aspect Properties. Polym. Degrad. Stab. 2018, 148, 104–116. [Google Scholar] [CrossRef]
- Nasri, K.; Toubal, L.; Loranger, É.; Koffi, D. Influence of UV Irradiation on Mechanical Properties and Drop-Weight Impact Performance of Polypropylene Biocomposites Reinforced with Short Flax and Pine Fibers. Compos. Part. C Open Access 2022, 9, 100296. [Google Scholar] [CrossRef]
- Matuana, L.M.; Jin, S.; Stark, N.M. Ultraviolet Weathering of HDPE/Wood-Flour Composites Coextruded with a Clear HDPE Cap Layer. Polym. Degrad. Stab. 2011, 96, 97–106. [Google Scholar] [CrossRef]
- Beg, M.D.H.; Pickering, K.L. Accelerated Weathering of Unbleached and Bleached Kraft Wood Fibre Reinforced Polypropylene Composites. Polym. Degrad. Stab. 2008, 93, 1939–1946. [Google Scholar] [CrossRef]
- Peng, Y.; Liu, R.; Cao, J. Characterization of Surface Chemistry and Crystallization Behavior of Polypropylene Composites Reinforced with Wood Flour, Cellulose, and Lignin during Accelerated Weathering. Appl. Surf. Sci. 2015, 332, 253–259. [Google Scholar] [CrossRef]
- Peng, Y.; Liu, R.; Cao, J.; Chen, Y. Effects of UV Weathering on Surface Properties of Polypropylene Composites Reinforced with Wood Flour, Lignin, and Cellulose. Appl. Surf. Sci. 2014, 317, 385–392. [Google Scholar] [CrossRef]
- Alam, L.; Van-Schoors, L.; Sicot, O.; Piezel, P.; Aivazzadeh, S. Accelerated Ageing of Unidirectional Flax Fibers Reinforced Recycled Polypropylene Composites. Int. J. Chem. Mater. Eng. 2022, 16, 51–55. [Google Scholar]
- Alam, L.; Piezel, B.; Sicot, O.; Aivazzadeh, S.; Moscardelli, S.; Van-Schoors, L. UV Accelerated Aging of Unidirectional Flax Composites: Comparative Study between Recycled and Virgin Polypropylene Matrix. Polym. Degrad. Stab. 2023, 208, 110268. [Google Scholar] [CrossRef]
- Ragoubi, M.; George, B.; Molina, S.; Bienaimé, D.; Merlin, A.; Hiver, J.M.; Dahoun, A. Effect of Corona Discharge Treatment on Mechanical and Thermal Properties of Composites Based on Miscanthus Fibres and Polylactic Acid or Polypropylene Matrix. Compos. Part. A Appl. Sci. Manuf. 2012, 43, 675–685. [Google Scholar] [CrossRef]
- Girones, J.; Vo, L.; Arnoult, S.; Brancourt-Hulmel, M.; Navard, P. Miscanthus Stem Fragment—Reinforced Polypropylene Composites: Development of an Optimized Preparation Procedure at Small Scale and Its Validation for Differentiating Genotypes. Polym. Test. 2016, 55, 166–172. [Google Scholar] [CrossRef]
- El-Ghazali, S.; Khatri, M.; Mehdi, M.; Kharaghani, D.; Tamada, Y.; Katagiri, A.; Kobayashi, S.; Kim, I.S. Fabrication of -Glycol 1,4-Cyclohexane Dimethylene-Isosorbide-Terephthalate) Electrospun Nanofiber Mats for Potential Infiltration of Fibroblast Cells. Polymers 2021, 13, 1245. [Google Scholar] [CrossRef]
- Zhang, H.; Zheng, H. Artificial and Natural Aging of Polypropylene Used in Passenger Vehicle Bumpers. Mater. Plast. 1964, 58, 201. [Google Scholar] [CrossRef]
- Ma, S.; He, F.; Tian, D.; Zou, D.; Yan, Z.; Yang, Y.; Zhou, T.; Huang, K.; Shen, H.; Fang, J. Variations and Determinants of Carbon Content in Plants: A Global Synthesis. Biogeosciences 2018, 15, 693–702. [Google Scholar] [CrossRef]
- Villaverde, J.J.; Domingues, R.M.A.; Freire, C.S.R.; Silvestre, A.J.D.; Neto, C.P.; Ligero, P.; Vega, A. Miscanthus x giganteus Extractives: A Source of Valuable Phenolic Compounds and Sterols. J. Agric. Food Chem. 2009, 57, 3626–3631. [Google Scholar] [CrossRef] [PubMed]
- Marques, G.; del Río, J.C.; Gutiérrez, A. Lipophilic Extractives from Several Nonwoody Lignocellulosic Crops (Flax, Hemp, Sisal, Abaca) and Their Fate during Alkaline Pulping and TCF/ECF Bleaching. Bioresour. Technol. 2010, 101, 260–267. [Google Scholar] [CrossRef]
- Marques, G.; Rencoret, J.; Gutiérrez, A.; Del Río, J.C. Evaluation of the Chemical Composition of Different Non-Woody Plant Fibers Used for Pulp and Paper Manufacturing. Open Agric. J. 2010, 4, 93–101. [Google Scholar]
- Banerjee, S.; Singh, R.; Eilts, K.; Sacks, E.J.; Singh, V. Valorization of Miscanthus x giganteus for Sustainable Recovery of Anthocyanins and Enhanced Production of Sugars. J. Clean. Prod. 2022, 369, 133508. [Google Scholar] [CrossRef]
- Gutiérrez, A.; Del Río, J.C. Lipids from Flax Fibers and Their Fate in Alkaline Pulping. J. Agric. Food Chem. 2003, 51, 4965–4971. [Google Scholar] [CrossRef]
- Czemplik, M.; Mierziak, J.; Szopa, J.; Kulma, A. Flavonoid C-Glucosides Derived from Flax Straw Extracts Reduce Human Breast Cancer Cell Growth in Vitro and Induce Apoptosis. Front. Pharmacol. 2016, 7, 282. [Google Scholar] [CrossRef]
- El Hage, R.; Brosse, N.; Sannigrahi, P.; Ragauskas, A. Effects of Process Severity on the Chemical Structure of Miscanthus Ethanol Organosolv Lignin. Polym. Degrad. Stab. 2010, 95, 997–1003. [Google Scholar] [CrossRef]
- Yan, L.; Chouw, N.; Jayaraman, K. Flax Fibre and Its Composites—A Review. Compos. B Eng. 2014, 56, 296–317. [Google Scholar] [CrossRef]
- Le Moigne, N.; Sonnier, R.; El Hage, R.; Rouif, S. Radiation-Induced Modifications in Natural Fibres and Their Biocomposites: Opportunities for Controlled Physico-Chemical Modification Pathways? Ind. Crops Prod. 2017, 109, 199–213. [Google Scholar] [CrossRef]
- Nuez, L.; Magueresse, A.; Lu, P.; Day, A.; Boursat, T.; D’Arras, P.; Perré, P.; Bourmaud, A.; Baley, C. Flax Xylem as Composite Material Reinforcement: Microstructure and Mechanical Properties. Compos. Part. A Appl. Sci. Manuf. 2021, 149, 106550. [Google Scholar] [CrossRef]
- Bergs, M.; Völkering, G.; Kraska, T.; Pude, R.; Do, X.T.; Kusch, P.; Monakhova, Y.; Konow, C.; Schulze, M. Miscanthus x giganteus Stem versus Leaf-Derived Lignins Differing in Monolignol Ratio and Linkage. Int. J. Mol. Sci. 2019, 20, 1200. [Google Scholar] [CrossRef]
- Khatri, M.; Ahmed, F.E.; Al-Juboori, R.A.; Khanzada, N.K.; Hilal, N. Reusable Environmentally Friendly Electrospun Cellulose Acetate/Cellulose Nanocrystals Nanofibers for Methylene Blue Removal. J. Environ. Chem. Eng. 2024, 12, 111788. [Google Scholar] [CrossRef]
- Emmanuel, V.; Odile, B.; Céline, R. FTIR Spectroscopy of Woods: A New Approach to Study the Weathering of the Carving Face of a Sculpture. Spectrochim. Acta A Mol. Biomol. Spectrosc. 2015, 136, 1255–1259. [Google Scholar] [CrossRef]
- Lazić, B.D.; Pejić, B.M.; Kramar, A.D.; Vukčević, M.M.; Mihajlovski, K.R.; Rusmirović, J.D.; Kostić, M.M. Influence of Hemicelluloses and Lignin Content on Structure and Sorption Properties of Flax Fibers (Linum Usitatissimum L.). Cellulose 2018, 25, 697–709. [Google Scholar] [CrossRef]
- Shi, J.; Xing, D.; Li, J. FTIR Studies of the Changes in Wood Chemistry from Wood Forming Tissue under Inclined Treatment. Energy Procedia 2012, 16, 758–762. [Google Scholar] [CrossRef]
- El Hage, R.; Brosse, N.; Chrusciel, L.; Sanchez, C.; Sannigrahi, P.; Ragauskas, A. Characterization of Milled Wood Lignin and Ethanol Organosolv Lignin from Miscanthus. Polym. Degrad. Stab. 2009, 94, 1632–1638. [Google Scholar] [CrossRef]
- Cichosz, S.; Masek, A. Cellulose Fibers Hydrophobization via a Hybrid Chemical Modification. Polymers 2019, 11, 1174. [Google Scholar] [CrossRef] [PubMed]
- Brosse, N.; EL Hage, R.; Sannigrahi, P.; Ragauskas, A. Dilute Sulphuric Acid and Ethanol Organosolv Pretreatment of Miscanthus x giganteus. Cellul. Chem. Technol. 2010, 44, 71–78. [Google Scholar]
- Md Salim, R.; Asik, J.; Sarjadi, M.S. Chemical Functional Groups of Extractives, Cellulose and Lignin Extracted from Native Leucaena Leucocephala Bark. Wood Sci. Technol. 2021, 55, 295–313. [Google Scholar] [CrossRef]
- Liu, C.F.; Xu, F.; Sun, J.X.; Ren, J.L.; Curling, S.; Sun, R.C.; Fowler, P.; Baird, M.S. Physicochemical Characterization of Cellulose from Perennial Ryegrass Leaves (Lolium perenne). Carbohydr. Res. 2006, 341, 2677–2687. [Google Scholar] [CrossRef] [PubMed]
- Saha, P.; Manna, S.; Roy, D.; Kim, M.C.; Chowdhury, S.; De, S.; Sen, R.; Adhikari, B.; Kim, J.K. Effect of Photodegradation of Lignocellulosic Fibers Transesterified with Vegetable Oil. Fibers Polym. 2014, 15, 2345–2354. [Google Scholar] [CrossRef]
- Temiz, A.; Terziev, N.; Eikenes, M.; Hafren, J. Effect of Accelerated Weathering on Surface Chemistry of Modified Wood. Appl. Surf. Sci. 2007, 253, 5355–5362. [Google Scholar] [CrossRef]
- Hon, D.N.-S. Photochemistry of Wood. In Wood and Cellulosic Chemistry; Hon, D.N.-S., Shiraishi, N., Eds.; Marcel Decker: New York, NY, USA, 1991; pp. 525–555. [Google Scholar]
- Sudiyani, Y.; Tsujiyama, S.; Imamura Munezoh Takahashi, Y.; Minato, K.; Kajita, H.; Tsujiyama, S.; Kajita, H.; Imamura Takahashi, Y.M.; Minato, K. Chemical Characteristics of Surfaces of Hardwood and Softwood Deteriorated by Weathering. J. Wood Sci. 1999, 45, 348–353. [Google Scholar]
- Mokrzycki, W.; Tatol, M. Color Difference Delta E-A Survey Colour Difference ∆E-A Survey. Mach. Graph. Vision. 2011, 20, 383–411. [Google Scholar]
- Teacǎ, C.A.; Roşu, D.; Bodîrlǎu, R.; Roşu, L. Structural Changes in Wood under Artificial UV Light Irradiation Determined by FTIR Spectroscopy and Color Measurements-a Brief Review. Bioresources 2013, 8, 1478–1507. [Google Scholar] [CrossRef]
- Chang, T.C.; Chang, H.T.; Wu, C.L.; Chang, S.T. Influences of Extractives on the Photodegradation of Wood. Polym. Degrad. Stab. 2010, 95, 516–521. [Google Scholar] [CrossRef]
- Del Río, J.C.; Rencoret, J.; Gutiérrez, A.; Nieto, L.; Jiménez-Barbero, J.; Martínez, Á.T. Structural Characterization of Guaiacyl-Rich Lignins in Flax (Linum usitatissimum) Fibers and Shives. J. Agric. Food Chem. 2011, 59, 11088–11099. [Google Scholar] [CrossRef]
- Flynn, J.H.; Wilson, W.K.; Morrow, W. 1 Degradation of Cellulose in a Vacuum with Ultraviolet Light. J. Res. Natl. Bur. Stand. 1958, 60, 229. [Google Scholar]
- Forsgren, L.; Noyan, E.C.B.; Vega, A.; Yarahmadi, N.; Boldizar, A. The Thermo-Oxidative Durability of Polyethylene Reinforced with Wood-Based Fibres. Polym. Degrad. Stab. 2020, 181, 109374. [Google Scholar] [CrossRef]
- ASTM D 1102-84; Test Method for Ash in Wood. Annual Book of ASTM Standards. ASTM International: West Conshohocken, PA, USA, 2008; pp. 153–154.
- ASTM D 1107-96; Standard Test Method for Ethanol-Toluene Solubility of Wood. ASTM International: West Conshohocken, PA, USA, 2001.
- Moussa, M.; El Hage, R.; Sonnier, R.; Chrusciel, L.; Ziegler-Devin, I.; Brosse, N. Toward the Cottonization of Hemp Fibers by Steam Explosion. Flame-Retardant Fibers. Ind. Crops Prod. 2020, 151, 112242. [Google Scholar] [CrossRef]
- Sluiter, A.; Hames, B.; Ruiz, R.; Scarlata, C.; Sluiter, J.; Templeton, D.; Crocker, D. Determination of Structural Carbohydrates and Lignin in Biomass: Laboratory Analytical Procedure (LAP). Lab. Anal. Proced. 2008, 1617, 1–16. [Google Scholar]
- ISO 4892-3:2016; Plastics—Methods of Exposure to Laboratory Light Sources—Part 3: Fluorescent UV Lamps. ISO: London, UK, 2016.


| Element, Content (%) | ||
|---|---|---|
| Fibers | C | H |
| Flax-Raw | 42.1 | 6.2 |
| Misc-Raw | 46.0 | 6.0 |
| Fibers | Klason Lignin (%) |
|---|---|
| Misc-Raw | 23.00 ± 0.54 |
| Misc EF | 23.52 ± 0.55 |
| Misc x3 | 2.50 ± 0.40 |
| Flax-Raw | 9.10 ± 0.58 |
| Flax EF | 9.50 ± 0.61 |
| Flax x3 | 0.82 ± 0.23 |
Disclaimer/Publisher’s Note: The statements, opinions and data contained in all publications are solely those of the individual author(s) and contributor(s) and not of MDPI and/or the editor(s). MDPI and/or the editor(s) disclaim responsibility for any injury to people or property resulting from any ideas, methods, instructions or products referred to in the content. |
© 2024 by the authors. Licensee MDPI, Basel, Switzerland. This article is an open access article distributed under the terms and conditions of the Creative Commons Attribution (CC BY) license (https://creativecommons.org/licenses/by/4.0/).
Share and Cite
El Hage, R.; Carvalho Martins, R.; Brendlé, C.; Lafon-Pham, D.; Sonnier, R. Enhancing Insight into Photochemical Weathering of Flax and Miscanthus: Exploring Diverse Chemical Compositions and Composite Materials. Molecules 2024, 29, 3945. https://doi.org/10.3390/molecules29163945
El Hage R, Carvalho Martins R, Brendlé C, Lafon-Pham D, Sonnier R. Enhancing Insight into Photochemical Weathering of Flax and Miscanthus: Exploring Diverse Chemical Compositions and Composite Materials. Molecules. 2024; 29(16):3945. https://doi.org/10.3390/molecules29163945
Chicago/Turabian StyleEl Hage, Roland, Raíssa Carvalho Martins, Clément Brendlé, Dominique Lafon-Pham, and Rodolphe Sonnier. 2024. "Enhancing Insight into Photochemical Weathering of Flax and Miscanthus: Exploring Diverse Chemical Compositions and Composite Materials" Molecules 29, no. 16: 3945. https://doi.org/10.3390/molecules29163945