

The Content of Volatile Organic Compounds in Calypogeia suecica (Calypogeiaceae, Marchantiophyta) Confirms Genetic Differentiation of This Liverwort Species into Two Groups
 , , , and
Abstract
:
1. Introduction
2. Results and Discussion
2.1. Volatiles Present in Calypogeia suecica
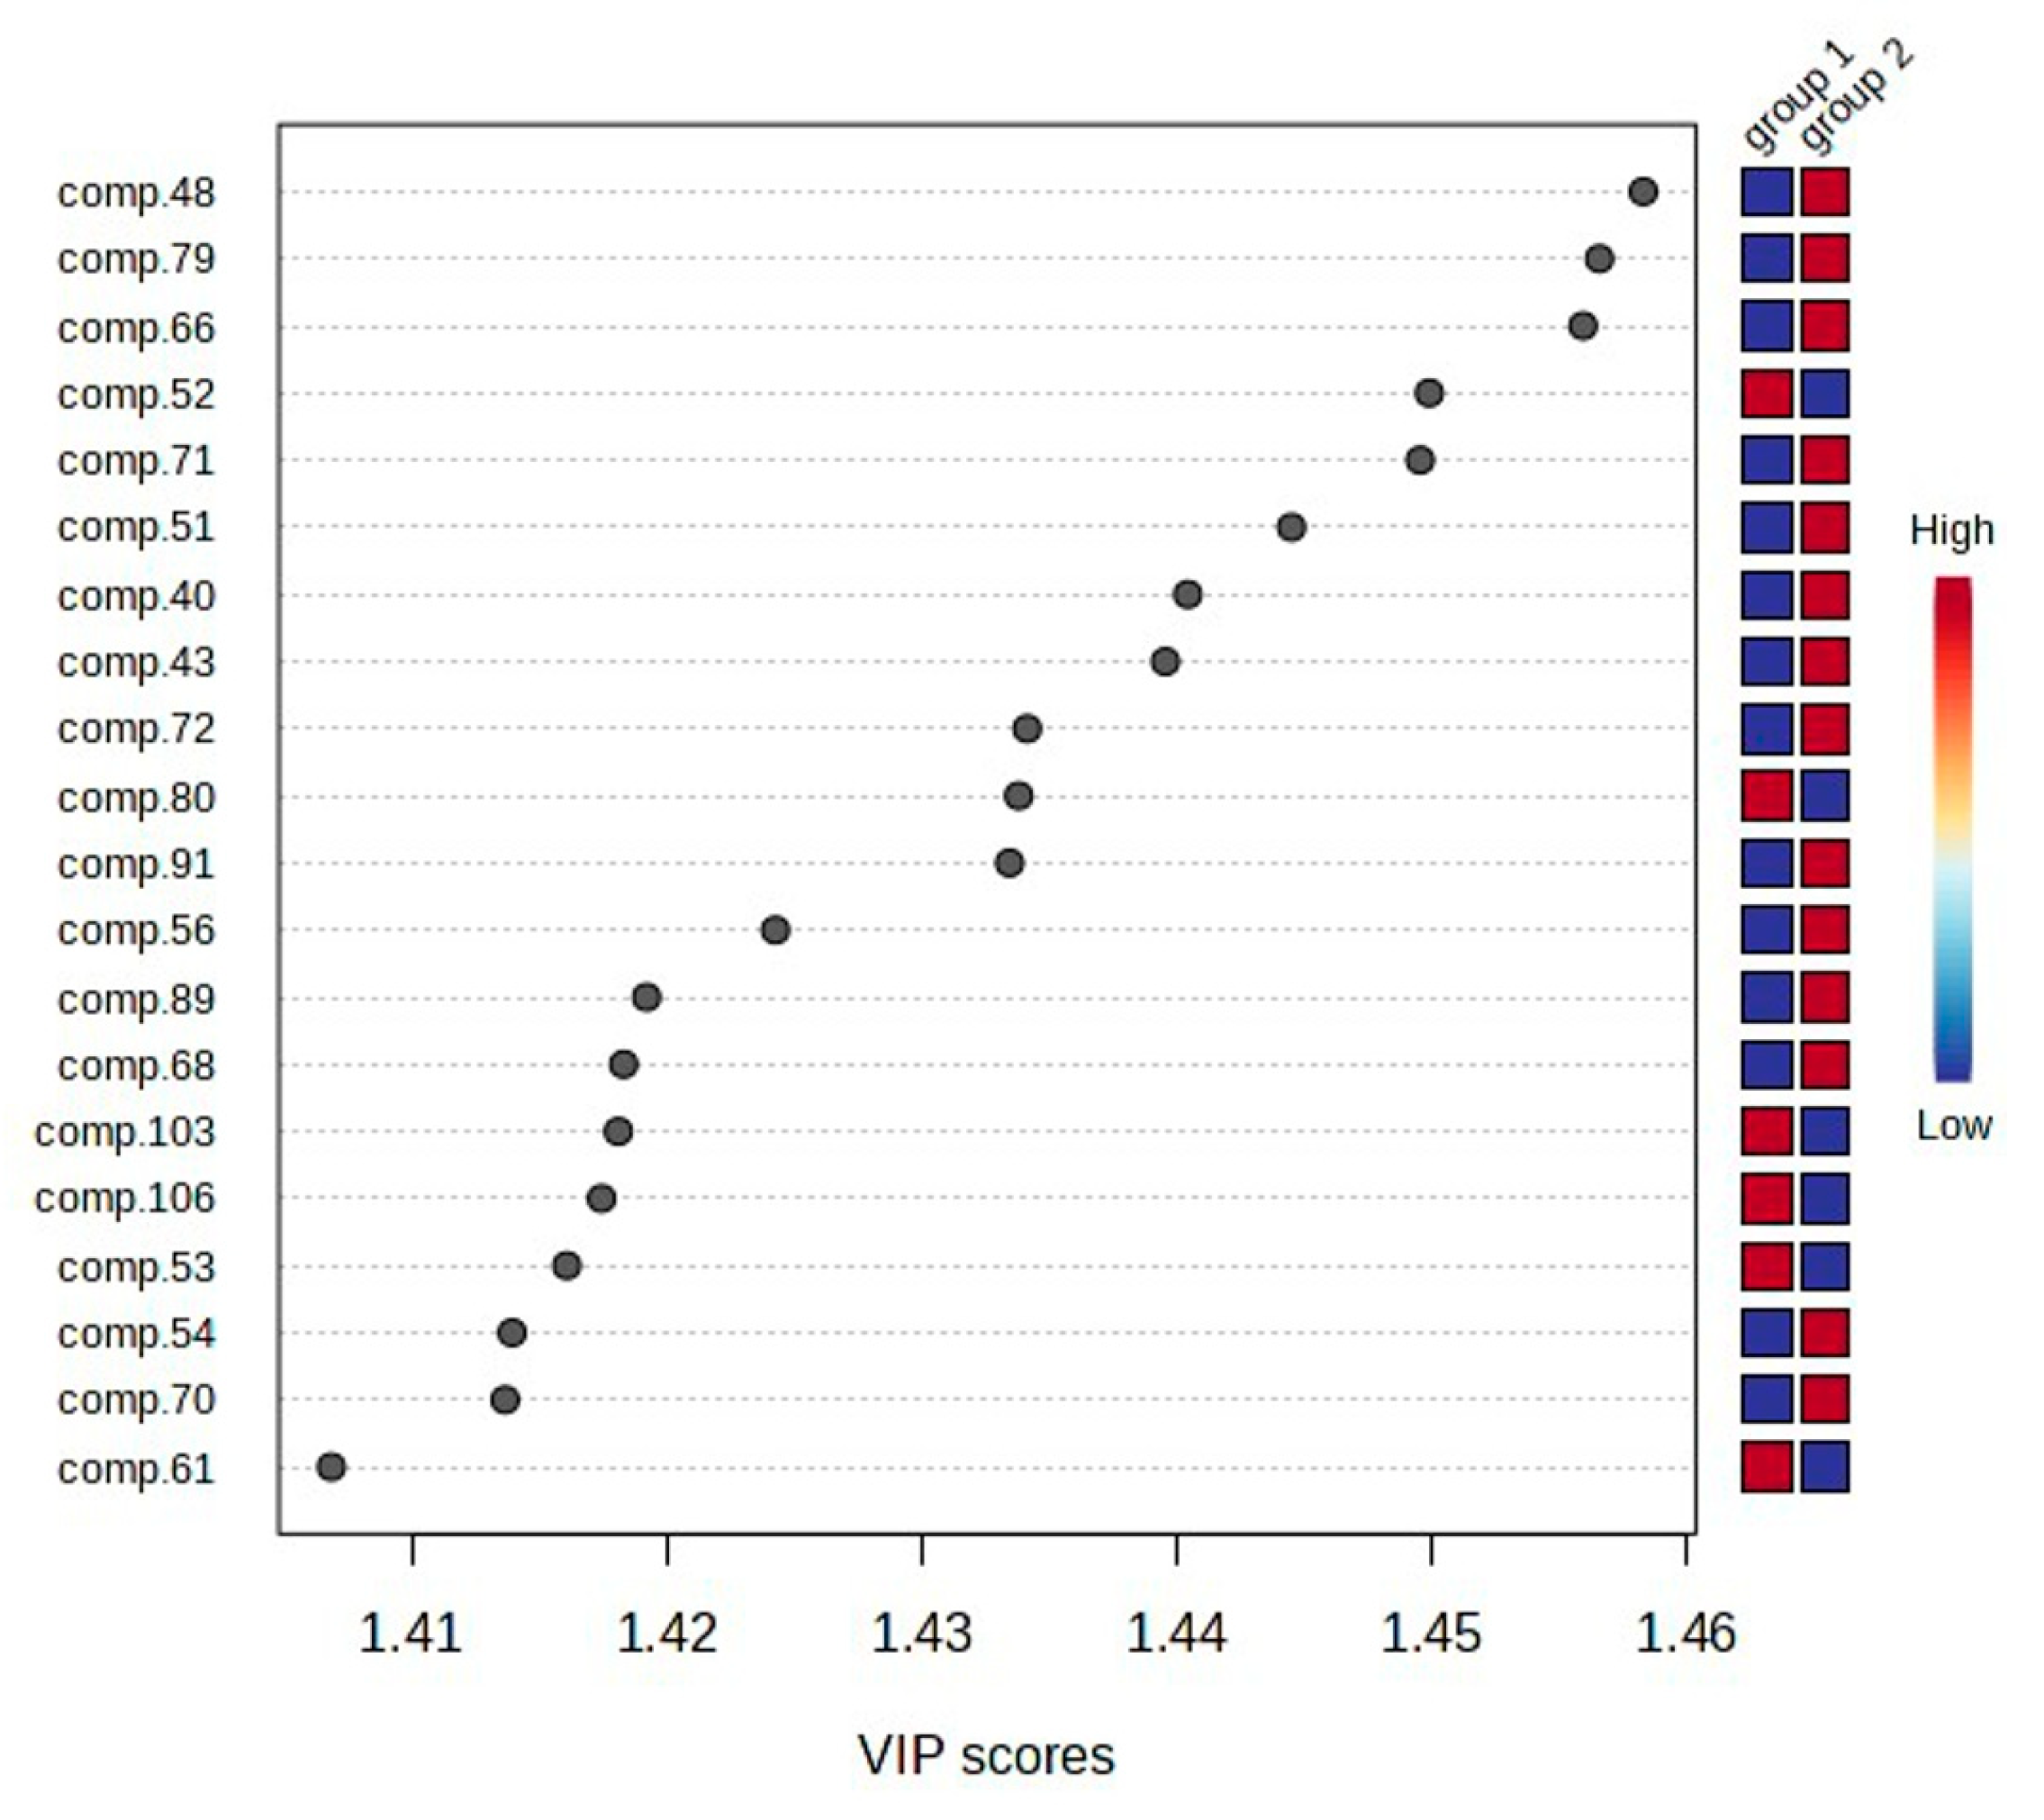
2.2. Statistical Analysis of the Obtained Results
3. Materials and Methods
3.1. Plant Material
3.2. HS-SPME Extraction
3.3. GC-MS Analysis
3.4. Statistical Analysis
4. Conclusions
Supplementary Materials
Author Contributions
Funding
Institutional Review Board Statement
Informed Consent Statement
Data Availability Statement
Acknowledgments
Conflicts of Interest
References
- Schuster, R.M. Hepaticae and Anthocerotae of North America East of the Hundredth Meridian; Columbia University Press: New York, NY, USA, 1969; Volume 2. [Google Scholar]
- Söderström, L.; Hagborg, A.; Konrat, M. World check list of hornworts and liverworts. Phyto Keys 2016, 59, 1–829. [Google Scholar]
- Bischler, H. The Genus Calypogeia Raddi in Central and South America. I–III. Candollea 1963, 18, 19–128. [Google Scholar]
- Schuster, R.M. Phylogenetic and taxonomic studies of Jungermanniidae, III. Calypogeiaceae. Fragm. Flor. Geobot. 1995, 40, 825–888. [Google Scholar]
- Damsholt, K. Illustrated Flora of Nordic Liverworts and Hornworts; Nordic Bryological Society: Lund, Sweden, 2002. [Google Scholar]
- Lorbeer, G. Zytologie der Lebermoose mit besonderer. Berücksichtigung allgemeiner Chromosomenfragen. I. Teil. Jahrb. Wiss. Bot. 1934, 80, 567–818. [Google Scholar]
- Chudzińska, E.; Barczak, H.; Szweykowski, J. Chromosome numbers in some Polish critical or rare liverworts (Hepaticae). Cryptogam. Bryol. 2001, 22, 85–93. [Google Scholar] [CrossRef]
- Paton, J.A. The Liverwort Flora of the British Isles; Brill Academic Pub: Essex, UK, 1999. [Google Scholar]
- Ślipiko, M.; Myszczyński, K.; Buczkowska, K.; Bączkiewicz, A.; Szczecińska, M.; Sawicki, J. Molecular delimitation of European leafy liverworts of the genus Calypogeia based on plastid super-barcodes. BMC Plant Biol. 2020, 20, 243. [Google Scholar] [CrossRef]
- Cai, Z.; Lee, F.; Wang, X.; Yu, W.J. A capsule review of recent studies on the application of mass spectrometry in the analysis of Chinese medicinal herbs. J. Mass. Spectrom. 2002, 37, 1013–1024. [Google Scholar] [CrossRef]
- Ethordević, B.S.; Pljevljakuśić, D.S.; Šavikin, K.P.; Stević, T.R.; Bigović, D.J. Essential oil from blackcurrant buds as chemotaxonomy marker and antimicrobial agent. Chem. Biodiv. 2014, 11, 1228–1240. [Google Scholar]
- Celińnski, K.; Bonikowski, R.; Wojnicka-Półtorak, A.; Chudzińska, E.; Maliński, T. Volatiles as chemosystematic markers for distinguishing closely related species within the Pinus mugo complex. Chem. Biodiv. 2015, 12, 1208–1213. [Google Scholar] [CrossRef]
- Garrido-Fernández, A.; Montaño, A.; Cortés-Delgado, A.; Rodríguez-Gómez, F.; Arroyo-López, F.N. Multi-Statistical Approach for the Study of Volatile Compounds of Industrial Spoiled Manzanilla Spanish-Style Table Olive Fermentations. Foods 2021, 10, 1182. [Google Scholar] [CrossRef]
- Gu, X.; Zhang, X.; Wang, K.; Lv, X.; Li, R.; Ma, W. GC–MS Untargeted Analysis of Volatile Compounds in Four Red Grape Varieties (Vitis vinifera L. cv) at Different Maturity Stages near Harvest. Foods 2022, 11, 2804. [Google Scholar] [CrossRef]
- Hu, S.; Ren, H.; Song, Y.; Liu, F.; Qian, L.; Zuo, F.; Li, M. Analysis of volatile compounds by GCMS reveals their rice cultivars. Sci. Rep. 2023, 13, 7973. [Google Scholar] [CrossRef]
- Asakawa, Y. Chemosystematics of the Hepaticae. Phytochemistry 2004, 65, 623–669. [Google Scholar] [CrossRef]
- Suire, C.; Bouvier, F.; Backhaus, R.A.; Bégu, D.; Bonneu, M.; Camara, B. Cellular Localization of Isoprenoid Biosynthetic Enzymes in Marchantia polymorpha. Uncovering a New Role of Oil Bodies. Plant Physiol. 2000, 124, 971–978. [Google Scholar] [CrossRef]
- He, X.; Sun, Y.; Zhu, R.L. The Oil Bodies of Liverworts: Unique and Important Organelles in Land Plants. Crit. Rev. Plant Sci. 2013, 32, 293–302. [Google Scholar] [CrossRef]
- Mues, R. Chemistry constituents and biochemistry. In Bryophyte Biology; Shaw, J.A., Goffinet, B., Eds.; Cambridge University Press: Cambridge, UK, 2000; pp. 150–181. [Google Scholar]
- Shaw, A.J. Biogeographic patterns and cryptic speciation in bryophytes. J. Biogeog. 2001, 28, 253–261. [Google Scholar] [CrossRef]
- Bischler, H.; Boisselier-Dubayle, M.C. New approaches to the systematics of liverworts. Nova Hedwig. 2000, 70, 37–44. [Google Scholar] [CrossRef]
- Hebert, P.D.N.; Cywinska, A.; Ball, S.L.; de Waard, J.R. Biological identifications through DNA barcodes. Proc. Biol. Sci. 2003, 270, 313–321. [Google Scholar] [CrossRef]
- Ludwiczuk, A.; Asakawa, Y. GC/MS fingerprinting of solvent extracts and essential oils obtained from liverwort species. Nat. Prod. Commun. 2017, 12, 1301–1305. [Google Scholar] [CrossRef]
- Asakawa, Y.; Ludwiczuk, A.; Nagashima, F. Chemical Constituences of Bryophytes. Bio- and Chemical Diversity, Biological Activity, and Chemosystematics; Springer: Berlin/Heidelberg, Germany, 2013; pp. 1–665. [Google Scholar]
- Asakawa, Y.; Ludwiczuk, A.; Nagashima, F. Phytochemical and biological studies of bryophytes. Phytochemistry 2013, 91, 52–80. [Google Scholar] [CrossRef] [PubMed]
- Ludwiczuk, A.; Gradstein, S.R.; Nagashima, F.; Asakawa, Y. Chemosystematics of Porella (Marchantiophyta, Porellaceae). Nat. Prod. Commun. 2011, 6, 315–321. [Google Scholar] [CrossRef]
- Ludwiczuk, A.; Odrzykoski, I.J.; Asakawa, Y. Identification of cryptic species with in liverwort Conocephalum conicum based on the volatile components. Phytochemistry 2013, 95, 234–241. [Google Scholar] [CrossRef]
- Wawrzyniak, R.; Wasiak, W.; Bączkiewicz, A.; Buczkowska, K. Volatile compounds in cryptic species of the Aneura pinguis complex and Aneura maxima (Marchantiophyta, Metzgeriidae). Phytochemistry 2014, 105, 115–122. [Google Scholar] [CrossRef] [PubMed]
- Asakawa, Y. Chemical constituents of the bryophytes. In Progress in the Chemistry of Organic Natural Products; Herz, W., Kirby, W.B., Moore, R.E., Steglich, W., Tamm, C., Eds.; Springer: Vienna, Austria, 1995; Volume 65, pp. 1–618. [Google Scholar]
- Benš, I.; Beizaee, N.; Vanĕk, T.; Vàňa, J.; Herout, V. Campesteryl behenate, a chemical character of the liverwort genus Calypogeia. Phytochemistry 1981, 20, 2438–2439. [Google Scholar] [CrossRef]
- Tazaki, H.; Okihara, T.; Koshino, H.; Kobayashi, K.; Nabeta, K. An aromadendrane-type sesquiterpenoid from the liverwort Calypogeia azurea. Phytochemistry 1998, 48, 147–149. [Google Scholar] [CrossRef]
- Warmers, U.; Wihstutz, K.; Bülow, N.; Fricke, C.; König, W.A. Sesquiterpene constituents of the liverwort Calypogeia muelleriana. Phytochemistry 1998, 49, 1723–1731. [Google Scholar] [CrossRef]
- Warmers, U.; König, W.A. Sesquiterpene constituents of the liverwort Calypogeia fissa. Phytochemistry 1999, 52, 695–704. [Google Scholar] [CrossRef]
- Warmers, U.; Rieck, A.; König, W.A.; Muhle, H. (+)-Bisabola-2,10-diene [1,9]oxide, a constituent of the liverwort Calypogeia suecica. Phytochemistry 1999, 51, 679–682. [Google Scholar] [CrossRef]
- Buczkowska, K.; Bakalin, V.; Bączkiewicz, A.; Aguero, B.; Gonera, P.; Ślipiko, M.; Szczecińska, M.; Sawicki, J. Does Calypogeia azurea (Calypogeiaceae, Marchantiophyta) occur outside Europe? Molecular and morphological evidence. PLoS ONE 2018, 13, e0204561. [Google Scholar] [CrossRef]
- Guzowska, M.; Wawrzyniak, R.; Wasiak, W. Seasonal Variability and Effect of Sample Storage on Volatile Components in Calypogeia azurea. Molecules 2022, 27, 2426. [Google Scholar] [CrossRef]
- Wawrzyniak, R.; Guzowska, M.; Wasiak, W.; Jasiewicz, B.; Bączkiewicz, A.; Buczkowska, K. Seasonal Variability of Volatile Components in Calypogeia integristipula. Molecules 2023, 28, 7276. [Google Scholar] [CrossRef]
- Stein, S.E. NIST/EPA/NIH Mass Spectral Database (NIST 11); National Institute of Standards and Technology: Gaithersburg, MD, USA, 2011. [Google Scholar]
- Stein, S.E. NIST Chemistry WebBook. In NIST Standard Reference Database 69; National Institute of Standards and Technology: Gaithersburg, MD, USA, 2023. Available online: http://webbook.nist.gov/ (accessed on 5 September 2024).
- Adams, R.P. Identification of Essential Oil Components by Gas Chromatography/Mass Spectrometry, 4.1st ed.; Diablo Analytical, Inc.: Antioch, CA, USA, 2017; Available online: https://diabloanalytical.com/ms-software/essentialoilcomponentsbygcms/ (accessed on 5 September 2024).
- El-Sayed, A.M. The Pherobase: Database of Pheromones and Semiochemicals. Available online: http://www.pherobase.com/ (accessed on 5 September 2024).
- Jolliffe, I.T.; Cadima, J. Principal component analysis: A review and recent developments. Phil. Trans. R. Soc. A 2016, 374, 20150202. [Google Scholar] [CrossRef]
- Zhang, Z.; Murtagh, F.; Van Poucke, S.; Lin, S.; Lan, P. Hierarchical cluster analysis in clinical research with heterogeneous study population: Highlighting its visualization with R. Ann. Transl. Med. 2017, 5, 75. [Google Scholar] [CrossRef]
- Ruiz-Perez, D.; Guan, H.; Madhivanan, P.; Mathee, K.; Narasimhan, G. So you think you can PLS-DA? BMC Bioinform. 2020, 21 (Suppl. S1), 2. [Google Scholar] [CrossRef]
- Haarman, B.C.M.; Riemersma-Vander Lek, R.F.; Burger, H.; Nolen, W.A.; Mendes, R.; Drexhage, H.A.; Burger, H. Feature expression heatmaps—A new visual method to explore complex associations between two variable sets. J. Biomed. Inform. 2015, 53, 156–161. [Google Scholar] [CrossRef]
- Pang, Z.; Lu, Y.; Zhou, G.; Hui, F.; Xu, L.; Viau, C.; Spigelman, A.F.; MacDonald, P.E.; Wishart, D.S.; Li, S.; et al. MetaboAnalyst 6.0: Towards a unified platform for metabolomics data processing, analysis and interpretation. NucleifFc Acids Res. 2024, 52, W398–W406. [Google Scholar] [CrossRef]


| No. | Compounds | RI a | Collection Place | Mean of Group 1 | |||
|---|---|---|---|---|---|---|---|
| Bieszczady Mts | Małe Pieniny Mts | Pieniny Mts | Tatry Mts | ||||
| 1 | hexanal | 782 | 0.08 (0.03) | - | 0.01 (0.01) | 0.02 (0.01) | 0.03 (0.03) |
| 2 | 3-methylbutanoic acid | 817 | 0.08 (0.05) | - | - | 0.03 (0.01) | 0.03 (0.04) |
| 3 | 2-methylbutanoic acid | 832 | 0.05 (0.05) | - | - | - | 0.01 (0.03) |
| 4 | 3-hexen-1-ol | 858 | - | 0.02 (0.01) | 0.04 (0.01) | - | 0.01 (0.01) |
| 5 | 1-hexanol | 867 | 0.44 (0.27) | - | - | 0.10 (0.05) | 0.17 (0.21) |
| 6 | tricyclene | 927 | - | 0.02 (0.01) | 0.02 (0.01) | - | 0.01 (0.01) |
| 7 | α-pinene | 936 | 0.02 (0.01) | 0.02 (0.01) | 0.01 (0.00) | 0.01 (0.01) | 0.02 (0.01) |
| 8 | 86[M+](50) 42(100) 86(38) | 957 | 0.09 (0.05) | 0.01 (0.00) | 0.01 (0.00) | 0.02 (0.01) | 0.04 (0.04) |
| 9 | hexanoic acid | 975 | 0.12 (0.05) | 0.02 (0.01) | 0.02 (0.01) | 0.08 (0.03) | 0.08 (0.05) |
| 10 | β-pinene | 975 | 0.01 (0.01) | 0.01 (0.01) | 0.02 (0.01) | 0.02 (0.01) | 0.02 (0.01) |
| 11 | 1-octen-3-ol | 979 | 0.13 (0.07) | 0.06 (0.01) | 0.04 (0.01) | 0.06 (0.02) | 0.08 (0.05) |
| 12 | 3-octanone | 985 | 0.07 (0.02) | 0.07 (0.02) | 0.02 (0.01) | 0.13 (0.17) | 0.10 (0.13) |
| 13 | 3-octanol | 994 | - | 0.01 (0.01) | 0.01 (0.00) | 0.01 (0.01) | 0.01 (0.01) |
| 14 | benzenemethanol | 1033 | 1.13 (0.34) | 0.25 (0.06) | 0.16 (0.01) | 0.08 (0.04) | 0.37 (0.48) |
| 15 | benzeneacetaldehyde | 1043 | 0.32 (0.09) | 0.03 (0.01) | 0.09 (0.01) | 0.17 (0.05) | 0.18 (0.11) |
| 16 | 2-ethylhexanoic acid | 1108 | 0.11 (0.07) | 0.02 (0.01) | 0.03 (0.01) | 0.09 (0.04) | 0.08 (0.05) |
| 17 | benzeneethanol | 1116 | 0.83 (0.31) | 0.42 (0.09) | 0.95 (0.06) | 0.66 (0.35) | 0.69 (0.33) |
| 18 | 126[M+](11) 55(100) 98(84) | 1154 | 0.07 (0.02) | - | - | 0.07 (0.02) | 0.06 (0.03) |
| 19 | 122[M+](20) 91(100) 44(58) | 1164 | - | - | - | - | - |
| 20 | 140[M+](4) 43(100) 57(60) | 1200 | - | 0.04 (0.01) | 0.03 (0.01) | 0.02 (0.01) | 0.02 (0.02) |
| 21 | 128[M+](5) 44(100) 57(63) | 1203 | 0.02 (0.01) | 0.35 (0.05) | 0.40 (0.04) | 0.05 (0.04) | 0.10 (0.13) |
| 22 | 152[M+](92) 67(100) 109(98) | 1217 | 0.16 (0.06) | 0.17 (0.07) | 0.20 (0.06) | 0.35 (0.19) | 0.27 (0.17) |
| 23 | phenoxyethanol | 1223 | 1.52 (0.81) | 0.40 (0.08) | 0.20 (0.01) | 0.33 (0.10) | 0.63 (0.66) |
| 24 | 1-phenoxy-2-propanol | 1247 | 0.04 (0.03) | - | - | 0.05 (0.02) | 0.04 (0.03) |
| 25 | 144[M+](38) 44(100) 129(72) | 1258 | 0.02 (0.01) | - | - | 0.03 (0.01) | 0.02 (0.02) |
| 26 | bornyl acetate | 1285 | 0.02 (0.02) | - | - | - | - |
| 27 | isobornyl acetate | 1290 | 0.02 (0.02) | 0.05 (0.02) | 0.07 (0.01) | - | 0.02 (0.02) |
| 28 | 189(8) 121(100) 93(82) | 1320 | - | 0.02 (0.01) | 0.02 (0.01) | 0.04 (0.02) | 0.03 (0.02) |
| 29 | bicycloelemene | 1341 | 0.21 (0.09) | 0.99 (0.06) | 1.52 (0.04) | 1.14 (0.29) | 0.91 (0.48) |
| 30 | δ-elemene | 1343 | - | 0.04 (0.02) | 0.02 (0.01) | - | 0.01 (0.01) |
| 31 | 204[M+](17) 81(100) 93(83) | 1355 | - | - | - | - | - |
| 32 | anastreptene | 1370 | 6.45 (1.22) | 8.26 (1.44) | 8.68 (0.13) | 7.02 (1.16) | 7.13 (1.31) |
| 33 | α-funebrene | 1385 | 0.40 (0.11) | 0.23 (0.03) | 0.29 (0.04) | 0.53 (0.17) | 0.45 (0.18) |
| 34 | β-elemene | 1394 | 0.08 (0.02) | 0.04 (0.02) | 0.04 (0.02) | 0.14 (0.06) | 0.11 (0.06) |
| 35 | 7-epi-sesquithujene | 1408 | 0.22 (0.13) | 0.10 (0.02) | 0.08 (0.01) | 0.18 (0.12) | 0.17 (0.12) |
| 36 | italicene | 1409 | 0.08 (0.03) | 0.13 (0.03) | 0.14 (0.02) | 0.12 (0.05) | 0.11 (0.04) |
| 37 | 9-aristolene | 1423 | 0.05 (0.02) | 0.06 (0.02) | 0.21 (0.03) | 0.07 (0.02) | 0.07 (0.04) |
| 38 | 1(10),8-aristoladiene | 1429 | 3.64 (1.34) | 5.83 (0.31) | 5.39 (0.11) | 4.44 (1.47) | 4.48 (1.44) |
| 39 | 204[M+](6) 107(100) 79(48) | 1432 | 0.05 (0.03) | 0.26 (0.07) | 0.40 (0.02) | 0.06 (0.02) | 0.10 (0.11) |
| 40 | 202[M+](4) 91(100) 185(89) | 1434 | - | - | - | - | - |
| 41 | 204[M+](24) 91(100) 105(92) | 1436 | 0.11 (0.01) | 0.25 (0.04) | 0.32 (0.04) | 0.17 (0.06) | 0.18 (0.07) |
| 42 | 204[M+](18) 107(100) 161(88) | 1438 | 0.08 (0.03) | 8.07 (0.87) | 8.29 (0.18) | 0.17 (0.05) | 1.64 (3.19) |
| 43 | 204[M+](9) 119(100) 91(64) | 1439 | - | - | - | - | - |
| 44 | 202[M+](30) 131(100) 159(62) | 1440 | 6.51 (0.77) | 0.63 (0.10) | 0.70 (0.01) | 7.04 (0.88) | 5.71 (2.59) |
| 45 | 202[M+](24) 69(100) 41(87) | 1443 | 0.21 (0.08) | 1.23 (0.32) | 1.55 (0.09) | 0.49 (0.24) | 0.58 (0.45) |
| 46 | β-barbatene | 1445 | 0.38 (0.15) | 0.16 (0.03) | 0.10 (0.01) | 0.70 (0.37) | 0.51 (0.37) |
| 47 | 202[M+](19) 91(100) 41(85) | 1450 | 0.19 (0.07) | 0.44 (0.09) | 0.60 (0.06) | 0.24 (0.12) | 0.28 (0.15) |
| 48 | 202[M+](23) 91(100) 159(93) | 1452 | - | - | - | - | - |
| 49 | 202[M+](23) 159(100) 131(74) | 1455 | 2.12 (0.29) | 2.97 (0.84) | 3.16 (0.08) | 2.13 (0.54) | 2.30 (0.62) |
| 50 | 204[M+](7) 159(100) 91(97) | 1457 | 0.12 (0.03) | 7.26 (1.39) | 6.52 (0.08) | 0.26 (0.15) | 1.49 (2.74) |
| 51 | 218[M+](26) 148(100) 133(75) | 1466 | - | - | - | - | - |
| 52 | 204[M+](36) 119(100)93(61) | 1469 | 5.21 (1.06) | 2.87 (0.39) | 6.40 (0.04) | 6.41 (1.00) | 5.66 (1.50) |
| 53 | γ-curcumene | 1475 | 5.31 (0.58) | 1.53 (0.27) | 1.71 (0.04) | 6.48 (1.09) | 5.27 (2.05) |
| 54 | 218[M+](12) 105(100) 91(92) | 1476 | - | - | - | - | - |
| 55 | α-curcumene | 1477 | 1.93 (0.97) | 4.75 (0.39) | 1.50 (0.06) | 2.69 (0.67) | 2.68 (1.12) |
| 56 | 218[M+](25) 105(100) 91(95) | 1477 | - | - | - | - | - |
| 57 | α-zingiberene | 1479 | 0.58 (0.46) | 0.34 (0.06) | 0.33 (0.05) | 0.68 (0.31) | 0.59 (0.34) |
| 58 | bicyclogermacrene | 1481 | 2.05 (0.74) | 5.95 (0.52) | 3.77 (0.08) | 3.35 (0.67) | 3.38 (1.31) |
| 59 | 202[M+](29) 91(100) 133(92) | 1500 | 0.28 (0.05) | 2.20 (0.15) | 1.31 (0.09) | 2.82 (1.49) | 2.01 (1.55) |
| 60 | γ-bisabolene | 1505 | 0.76 (0.21) | 2.70 (0.61) | 3.43 (0.05) | 1.04 (0.31) | 1.33 (0.87) |
| 61 | 202[M+](32) 133(100) 105(69) | 1510 | 1.43 (0.36) | 0.50 (0.04) | 1.67 (0.11) | 1.85 (0.46) | 1.57 (0.59) |
| 62 | 218[M+](29) 91(100) 93(97) | 1513 | - | 0.01 (0.02) | - | 0.08 (0.11) | 0.05 (0.09) |
| 63 | 218[M+](11) 132(100) 105(93) | 1519 | 0.20 (0.04) | 0.67 (0.11) | 1.24 (0.08) | 0.27 (0.13) | 0.36 (0.29) |
| 64 | β-sesquiphellandrene | 1524 | 1.26 (0.29) | 1.67 (0.40) | 1.60 (0.13) | 1.46 (0.24) | 1.45 (0.29) |
| 65 | 218[M+](3) 159(100) 131(76) | 1529 | 2.04 (1.21) | 0.34 (0.07) | 0.28 (0.05) | 1.35 (0.37) | 1.33 (0.86) |
| 66 | 218[M+](24) 148(100) 133(63) | 1532 | - | - | - | - | - |
| 67 | 220[M+](8) 85(100) 135(89) | 1545 | 0.44 (0.18) | 0.09 (0.04) | 0.11 (0.03) | 0.36 (0.10) | 0.33 (0.16) |
| 68 | 218[M+](4) 135(100) 107(42) | 1548 | - | - | - | - | - |
| 69 | 202[M+](85) 131(100) 91(81) | 1551 | 0.16 (0.09) | 0.38 (0.06) | 0.28 (0.08) | 0.24 (0.10) | 0.24 (0.11) |
| 70 | 218[M+](6) 91(100) 157(90) | 1554 | - | - | - | - | - |
| 71 | 218[M+](25) 145(100) 147(97) | 1561 | - | - | - | - | - |
| 72 | 218[M+](4) 93(100) 43(75) | 1568 | - | - | - | - | - |
| 73 | 4,5-dehydroviridiflorol | 1572 | 1.57 (0.77) | 0.09 (0.08) | 0.03 (0.01) | 0.57 (0.19) | 0.73 (0.66) |
| 74 | 222[M+](3) 43(100) 81(53) | 1578 | 0.95 (0.60) | 0.18 (0.08) | 0.41 (0.05) | 0.15 (0.07) | 0.37 (0.45) |
| 75 | 218[M+](6) 43(100) 93(57) | 1579 | 0.25 (0.14) | 0.78 (0.48) | 0.14 (0.03) | 0.16 (0.06) | 0.26 (0.27) |
| 76 | 218[M+](7) 43(100) 91(67) | 1581 | - | - | - | - | - |
| 77 | 220[M+](14) 79(100) 93(93) | 1584 | 0.30 (0.18) | 0.81 (0.24) | 0.79 (0.05) | 0.19 (0.08) | 0.33 (0.27) |
| 78 | 220[M+](1) 94(100) 79(43) | 1589 | 1.01 (0.56) | 0.19 (0.03) | 0.20 (0.03) | 1.48 (0.44) | 1.12 (0.65) |
| 79 | 218[M+](25) 145(100) 147(87) | 1594 | - | - | - | - | - |
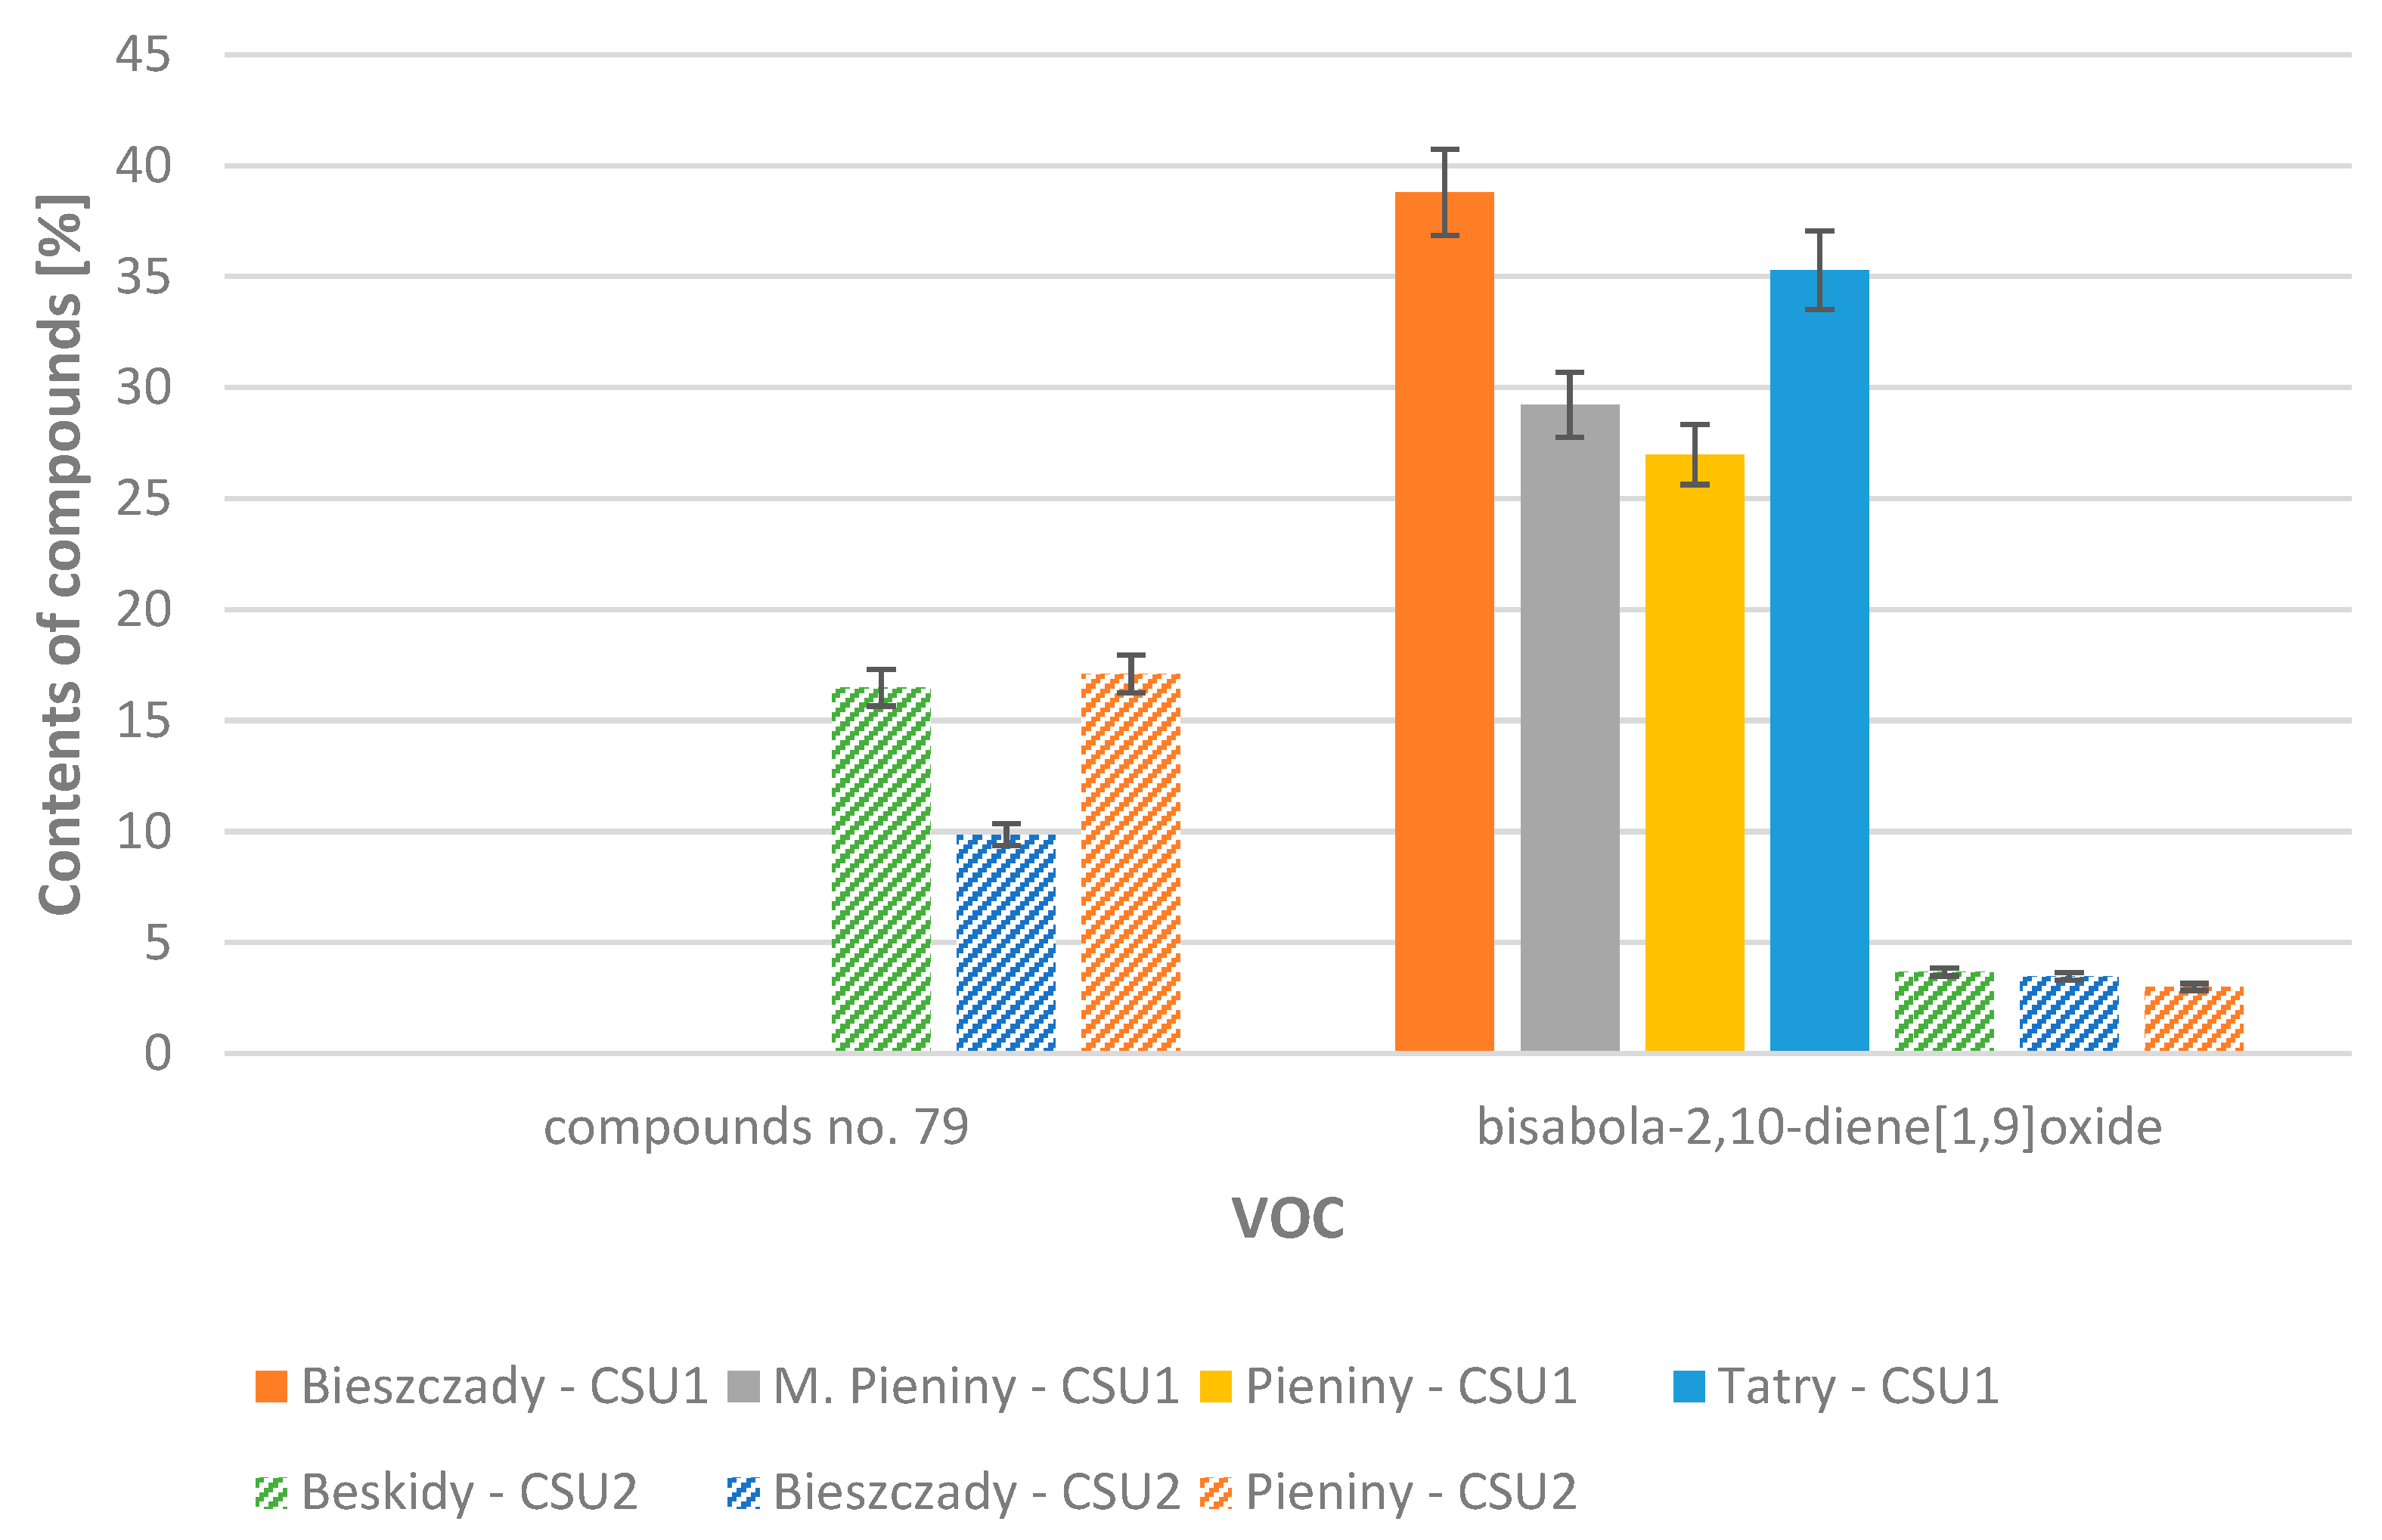
| 80 | bisabola-2,10-diene [1,9]oxide | 1596 | 38.81 (5.47) | 29.23 (3.15) | 26.99 (0.47) | 35.29 (4.35) | 34.89 (5.51) |
| 81 | 218[M+](1) 94(100) 79(52) | 1605 | - | - | - | - | - |
| 82 | 218[M+](26) 145(100) 43(92) | 1613 | - | - | - | - | - |
| 83 | 220[M+](2) 94(100) 79(39) | 1625 | 2.97 (1.01) | 2.43 (0.17) | 2.33 (0.01) | 1.84 (0.83) | 2.23 (0.92) |
| 84 | 218[M+](5) 145(100) 160(48) | 1641 | - | - | - | - | - |
| 85 | 218[M+](18) 105(100) 120(83) | 1646 | 0.32 (0.13) | 0.03 (0.01) | 0.03 (0.01) | 0.09 (0.04) | 0.14 (0.13) |
| 86 | 218[M+](5) 135(100) 107(52) | 1651 | - | - | - | - | - |
| 87 | 220[M+](2) 91(100) 43(91) | 1658 | - | - | - | - | - |
| 88 | 220[M+](8) 159(100) 91(81) | 1668 | 0.35 (0.17) | 0.11 (0.05) | 0.10 (0.04) | 0.22 (0.07) | 0.23 (0.13) |
| 89 | 220[M+](5) 161(100) 91(69) | 1670 | - | - | - | - | - |
| 90 | 218[M+](38) 145(100) 91(51) | 1677 | - | - | - | - | - |
| 91 | 218[M+](2) 179(100) 161(92) | 1686 | - | - | - | - | - |
| 92 | 218[M+](9) 105(100) 119(59) | 1689 | 0.23 (0.18) | 0.14 (0.05) | 0.10 (0.03) | 0.19 (0.02) | 0.19 (0.10) |
| 93 | 218[M+](22) 83(100) 94(92) | 1699 | 0.21 (0.08) | 0.03 (0.01) | 0.04 (0.01) | 0.18 (0.04) | 0.16 (0.08) |
| 94 | 218[M+](28) 135(100) 91(77) | 1701 | 0.03 (0.05) | - | - | 0.05 (0.01) | 0.04 (0.03) |
| 95 | 218[M+](20) 91(100) 133(98) | 1706 | 0.12 (0.06) | 0.10 (0.03) | 0.10 (0.01) | 0.07 (0.03) | 0.09 (0.04) |
| 96 | 220[M+](4) 110(100) 95(62) | 1708 | 0.08 (0.14) | - | - | 0.12 (0.02) | 0.08 (0.08) |
| 97 | 218[M+](11) 123(100) 95(62) | 1712 | 0.06 (0.03) | 0.11 (0.03) | 0.13 (0.01) | - | 0.04 (0.05) |
| 98 | 220[M+](18) 83(100) 125(79) | 1722 | 0.48 (0.63) | 0.05 (0.01) | 0.04 (0.01) | 0.13 (0.04) | 0.20 (0.34) |
| 99 | 218[M+](2) 120(100) 83(34) | 1729 | 0.14 (0.03) | 0.03 (0.02) | 0.03 (0.01) | 0.06 (0.02) | 0.07 (0.05) |
| 100 | 218[M+](1) 121(100) 165(59) | 1739 | 0.10 (0.02) | 0.03 (0.01) | 0.06 (0.02) | 0.06 (0.02) | 0.06 (0.03) |
| 101 | 218[M+](2) 82(100) 41(50) | 1744 | 0.09 (0.04) | 0.05 (0.04) | 0.06 (0.01) | 0.07 (0.02) | 0.07 (0.03) |
| 102 | 218[M+](3) 82(100) 41(49) | 1754 | 0.12 (0.07) | 0.08 (0.02) | 0.10 (0.01) | 0.09 (0.03) | 0.10 (0.04) |
| 103 | 220[M+](9) 137(100) 135(78) | 1759 | 0.17 (0.08) | 0.05 (0.02) | 0.05 (0.02) | 0.12 (0.03) | 0.12 (0.06) |
| 104 | 218[M+](29) 136(100) 121(81) | 1762 | 0.17 (0.11) | 0.09 (0.05) | 0.09 (0.02) | 0.08 (0.03) | 0.11 (0.07) |
| 105 | 218[M+](1) 183(100) 198(61) | 1795 | 0.16 (0.15) | 0.09 (0.03) | 0.08 (0.01) | 0.09 (0.05) | 0.11 (0.08) |
| 106 | 218[M+](17) 82(100) 109(83) | 1800 | 0.15 (0.04) | 0.06 (0.03) | 0.07 (0.03) | 0.12 (0.03) | 0.11 (0.04) |
| 107 | 221[M+](1) 82(100) 67(39) | 1808 | 0.10 (0.03) | - | - | 0.09 (0.03) | 0.07 (0.05) |
| Total | 96.84 (23.84) | 97.70 (13.98) | 95.96 (3.07) | 97.91 (20.59) | 97.47 (37.97) | ||
| % Identified | 68.77 (14.85) | 63.50 (7.83) | 57.52 (1.49) | 67.74 (12.46) | 66.81 (18.49) | ||
| Including: | |||||||
| Aliphatics | 1.08 (0.61) | 0.20 (0.08) | 0.17 (0.06) | 0.52 (0.34) | 0.60 (0.62) | ||
| Aromatics | 3.84 (1.58) | 1.10 (0.24) | 1.40 (0.09) | 1.29 (0.56) | 1.91 (1.60) | ||
| Monoterpene hydrocarbons | 0.03 (0.02) | 0.05 (0.03) | 0.05 (0.02) | 0.03 (0.02) | 0.04 (0.03) | ||
| Monoterpenoide hydrocarbons | 0.04 (0.04) | 0.05 (0.02) | 0.07 (0.01) | - | 0.02 (0.03) | ||
| Sesquiterpene hydrocarbons | 23.40 (6.36) | 32.78 (4.23) | 28.81 (0.83) | 30.04 (7.00) | 28.63 (10.04) | ||
| Sesquiterpenoide hydrocarbons | 40.38 (6.24) | 29.32 (3.23) | 27.02 (0.48) | 35.86 (4.54) | 35.62 (6.17) | ||
| No. | Compounds | RI a | Collection Place | Mean of Group 2 | t-Test for Groups p Value | ||
|---|---|---|---|---|---|---|---|
| Bieszczady Mts | Beskid Sądecki Mts | Pieniny Mts | |||||
| 1 | hexanal | 782 | 0.09 (0.01) | 0.02 (0.01) | 0.02 (0.01) | 0.02 (0.02) | 0.308 |
| 2 | 3-methylbutanoic acid | 817 | - | - | - | - | 0.000 |
| 3 | 2-methylbutanoic acid | 832 | - | - | - | - | 0.115 |
| 4 | 3-hexen-1-ol | 858 | - | - | 0.02 (0.02) | 0.02 (0.02) | 0.015 |
| 5 | 1-hexanol | 867 | 0.29 (0.08) | 0.08 (0.03) | - | 0.05 (0.09) | 0.030 |
| 6 | tricyclene | 927 | 0.03 (0.01) | - | 0.06 (0.02) | 0.04 (0.03) | 0.000 |
| 7 | α-pinene | 936 | 0.06 (0.01) | 0.01 (0.01) | 0.02 (0.01) | 0.02 (0.02) | 0.302 |
| 8 | 86[M+](50) 42(100) 86(38) | 957 | 0.06 (0.01) | 0.02 (0.01) | 0.03 (0.01) | 0.03 (0.02) | 0.451 |
| 9 | hexanoic acid | 975 | 0.02 (0.01) | - | - | - | 0.000 |
| 10 | β-pinene | 975 | 0.05 (0.01) | 0.02 (0.01) | 0.05 (0.02) | 0.04 (0.02) | 0.000 |
| 11 | 1-octen-3-ol | 979 | 0.37 (0.04) | 0.05 (0.02) | 0.02 (0.01) | 0.07 (0.11) | 0.677 |
| 12 | 3-octanone | 985 | 0.14 (0.03) | 0.08 (0.01) | 0.08 (0.02) | 0.08 (0.03) | 0.566 |
| 13 | 3-octanol | 994 | 0.49 (0.05) | 0.12 (0.02) | 0.14 (0.04) | 0.17 (0.12) | 0.000 |
| 14 | benzenemethanol | 1033 | 0.23 (0.03) | 0.18 (0.03) | 0.44 (0.26) | 0.36 (0.24) | 0.928 |
| 15 | benzeneacetaldehyde | 1043 | 0.84 (0.07) | 0.21 (0.10) | 0.06 (0.03) | 0.18 (0.25) | 0.925 |
| 16 | 2-ethylhexanoic acid | 1108 | 0.24 (0.04) | 0.06 (0.01) | 0.05 (0.03) | 0.07 (0.06) | 0.721 |
| 17 | benzeneethanol | 1116 | 1.67 (0.18) | 0.45 (0.11) | 1.38 (0.66) | 1.20 (0.68) | 0.001 |
| 18 | 126[M+](11) 55(100) 98(84) | 1154 | 0.06 (0.01) | - | 0.01 (0.02) | 0.01 (0.02) | 0.000 |
| 19 | 122[M+](20) 91(100) 44(58) | 1164 | 0.04 (0.01) | 0.02 (0.01) | 0.03 (0.02) | 0.03 (0.02) | 0.000 |
| 20 | 140[M+](4) 43(100) 57(60) | 1200 | 0.16 (0.03) | - | 0.01 (0.01) | 0.03 (0.05) | 0.241 |
| 21 | 128[M+](5) 44(100) 57(63) | 1203 | - | - | 0.14 (0.09) | 0.10 (0.10) | 0.924 |
| 22 | 152[M+](92) 67(100) 109(98) | 1217 | 1.21 (0.12) | 0.07 (0.01) | 0.23 (0.14) | 0.30 (0.35) | 0.675 |
| 23 | phenoxyethanol | 1223 | 0.19 (0.01) | 0.03 (0.01) | - | 0.03 (0.06) | 0.000 |
| 24 | 1-phenoxy-2-propanol | 1247 | 0.08 (0.01) | 0.11 (0.01) | 0.01 (0.01) | 0.04 (0.04) | 0.636 |
| 25 | 144[M+](38) 44(100) 129(72) | 1258 | 0.14 (0.04) | 0.02 (0.01) | 0.03 (0.07) | 0.04 (0.06) | 0.205 |
| 26 | bornyl acetate | 1285 | 0.12 (0.02) | - | 0.03 (0.07) | 0.03 (0.07) | 0.022 |
| 27 | isobornyl acetate | 1290 | 0.06 (0.01) | - | 0.05 (0.01) | 0.04 (0.03) | 0.001 |
| 28 | 189(8) 121(100) 93(82) | 1320 | - | 0.04 (0.02) | 0.10 (0.07) | 0.08 (0.07) | 0.000 |
| 29 | bicycloelemene | 1341 | 0.17 (0.03) | 0.85 (0.16) | 0.87 (0.17) | 0.78 (0.27) | 0.313 |
| 30 | δ-elemene | 1343 | 0.03 (0.01) | 0.14 (0.05) | 0.04 (0.02) | 0.06 (0.05) | 0.000 |
| 31 | 204[M+](17) 81(100) 93(83) | 1355 | 0.31 (0.05) | 0.29 (0.12) | 0.18 (0.16) | 0.21 (0.15) | 0.000 |
| 32 | anastreptene | 1370 | 6.33 (0.17) | 5.29 (0.62) | 4.21 (0.52) | 4.69 (0.90) | 0.000 |
| 33 | α-funebrene | 1385 | 0.10 (0.03) | 0.22 (0.07) | 0.81 (0.13) | 0.60 (0.32) | 0.036 |
| 34 | β-elemene | 1394 | 0.49 (0.02) | 0.65 (0.06) | 0.04 (0.02) | 0.23 (0.27) | 0.021 |
| 35 | 7-epi-sesquithujene | 1408 | 0.11 (0.01) | 0.07 (0.02) | 0.12 (0.03) | 0.11 (0.03) | 0.040 |
| 36 | italicene | 1409 | 0.16 (0.05) | 0.14 (0.03) | 0.14 (0.04) | 0.14 (0.03) | 0.004 |
| 37 | 9-aristolene | 1423 | 0.31 (0.02) | 0.14 (0.02) | 0.10 (0.04) | 0.13 (0.07) | 0.001 |
| 38 | 1(10),8-aristoladiene | 1429 | 0.10 (0.02) | 3.15 (0.73) | 3.57 (0.63) | 3.09 (1.25) | 0.001 |
| 39 | 204[M+](6) 107(100) 79(48) | 1432 | 0.11 (0.03) | 0.14 (0.06) | 0.14 (0.04) | 0.14 (0.04) | 0.049 |
| 40 | 202[M+](4) 91(100) 185(89) | 1434 | 0.12 (0.01) | 0.11 (0.03) | 0.15 (0.05) | 0.14 (0.04) | 0.000 |
| 41 | 204[M+](24) 91(100) 105(92) | 1436 | - | 0.22 (0.08) | 0.19 (0.12) | 0.17 (0.12) | 0.951 |
| 42 | 204[M+](18) 107(100) 161(88) | 1438 | - | 0.26 (0.07) | 5.04 (0.37) | 3.41 (2.38) | 0.045 |
| 43 | 204[M+](9) 119(100) 91(64) | 1439 | 0.10 (0.03) | 0.17 (0.06) | 0.12 (0.04) | 0.12 (0.05) | 0.000 |
| 44 | 202[M+](30) 131(100) 159(62) | 1440 | 9.02 (0.31) | 5.84 (0.19) | 0.53 (0.14) | 2.65 (3.22) | 0.001 |
| 45 | 202[M+](24) 69(100) 41(87) | 1443 | 0.03 (0.01) | 0.02 (0.01) | 0.61 (0.22) | 0.41 (0.33) | 0.174 |
| 46 | β-barbatene | 1445 | 0.47 (0.06) | 0.81 (0.11) | 0.22 (0.16) | 0.38 (0.28) | 0.182 |
| 47 | 202[M+](19) 91(100) 41(85) | 1450 | 2.31 (0.10) | - | 1.35 (0.19) | 1.16 (0.72) | 0.000 |
| 48 | 202[M+](23) 91(100) 159(93) | 1452 | 1.99 (0.06) | 1.53 (0.11) | 1.37 (0.09) | 1.47 (0.22) | 0.000 |
| 49 | 202[M+](23) 159(100) 131(74) | 1455 | 0.30 (0.04) | 1.73 (0.11) | 0.26 (0.09) | 0.59 (0.63) | 0.000 |
| 50 | 204[M+](7) 159(100) 91(97) | 1457 | 0.19 (0.02) | 0.36 (0.15) | 0.81 (0.43) | 0.64 (0.43) | 0.201 |
| 51 | 218[M+](26) 148(100) 133(75) | 1466 | 0.20 (0.04) | 0.87 (0.32) | 0.70 (0.37) | 0.68 (0.38) | 0.000 |
| 52 | 204[M+](36) 119(100)93(61) | 1469 | 0.05 (0.02) | - | - | 0.01 (0.02) | 0.000 |
| 53 | γ-curcumene | 1475 | 0.20 (0.01) | 0.04 (0.01) | 0.06 (0.02) | 0.07 (0.05) | 0.000 |
| 54 | 218[M+](12) 105(100) 91(92) | 1476 | 1.42 (0.11) | 0.53 (0.08) | 1.60 (0.59) | 1.34 (0.66) | 0.000 |
| 55 | α-curcumene | 1477 | - | - | 0.14 (0.06) | 0.09 (0.08) | 0.000 |
| 56 | 218[M+](25) 105(100) 91(95) | 1477 | 2.57 (0.17) | 2.43 (0.63) | 4.51 (1.59) | 3.83 (1.64) | 0.000 |
| 57 | α-zingiberene | 1479 | - | - | - | - | 0.000 |
| 58 | bicyclogermacrene | 1481 | 2.09 (0.18) | 5.77 (0.23) | 2.09 (1.84) | 2.91 (2.16) | 0.344 |
| 59 | 202[M+](29) 91(100) 133(92) | 1500 | - | - | - | - | 0.000 |
| 60 | γ-bisabolene | 1505 | 8.63 (0.16) | 5.37 (0.37) | 5.66 (1.10) | 5.93 (1.34) | 0.000 |
| 61 | 202[M+](32) 133(100) 105(69) | 1510 | - | - | - | - | 0.000 |
| 62 | 218[M+](29) 91(100) 93(97) | 1513 | 1.54 (0.09) | 1.99 (0.74) | 1.31 (0.51) | 1.49 (0.59) | 0.000 |
| 63 | 218[M+](11) 132(100) 105(93) | 1519 | 1.51 (0.04) | 1.41 (0.14) | 1.97 (0.30) | 1.80 (0.36) | 0.000 |
| 64 | β-sesquiphellandrene | 1524 | 0.04 (0.01) | 0.33 (0.08) | 0.21 (0.15) | 0.22 (0.15) | 0.000 |
| 65 | 218[M+](3) 159(100) 131(76) | 1529 | - | - | - | - | 0.000 |
| 66 | 218[M+](24) 148(100) 133(63) | 1532 | 17.33 (1.24) | 11.53 (0.43) | 10.73 (0.50) | 11.64 (2.16) | 0.000 |
| 67 | 220[M+](8) 85(100) 135(89) | 1545 | 0.09 (0.03) | 0.67 (0.08) | 0.10 (0.05) | 0.22 (0.25) | 0.045 |
| 68 | 218[M+](4) 135(100) 107(42) | 1548 | 0.10 (0.02) | 0.16 (0.05) | 0.26 (0.10) | 0.22 (0.11) | 0.000 |
| 69 | 202[M+](85) 131(100) 91(81) | 1551 | - | - | - | - | 0.000 |
| 70 | 218[M+](6) 91(100) 157(90) | 1554 | 0.12 (0.01) | 2.35 (0.25) | 2.27 (0.28) | 2.05 (0.75) | 0.000 |
| 71 | 218[M+](25) 145(100) 147(97) | 1561 | 0.22 (0.05) | 0.26 (0.06) | 0.20 (0.05) | 0.22 (0.05) | 0.000 |
| 72 | 218[M+](4) 93(100) 43(75) | 1568 | 0.60 (0.07) | 0.54 (0.28) | 0.63 (0.24) | 0.61 (0.23) | 0.000 |
| 73 | 4,5-dehydroviridiflorol | 1572 | 0.96 (0.08) | 1.17 (0.85) | 0.52 (0.50) | 0.72 (0.61) | 0.940 |
| 74 | 222[M+](3) 43(100) 81(53) | 1578 | 3.21 (0.09) | 0.08 (0.03) | 0.52 (0.14) | 0.72 (0.93) | 0.048 |
| 75 | 218[M+](6) 43(100) 93(57) | 1579 | 0.48 (0.07) | 0.67 (0.16) | 1.25 (0.23) | 1.04 (0.38) | 0.000 |
| 76 | 218[M+](7) 43(100) 91(67) | 1581 | 0.61 (0.02) | 1.49 (0.11) | 0.48 (0.25) | 0.72 (0.47) | 0.000 |
| 77 | 220[M+](14) 79(100) 93(93) | 1584 | 6.41 (0.17) | 0.14 (0.09) | - | 0.74 (2.06) | 0.263 |
| 78 | 220[M+](1) 94(100) 79(43) | 1589 | - | - | - | - | 0.000 |
| 79 | 218[M+](25) 145(100) 147(87) | 1594 | 9.87 (1.50) | 16.49 (0.46) | 17.11 (1.13) | 16.17 (2.51) | 0.000 |
| 80 | bisabola-2,10-diene [1,9]oxide | 1596 | 3.48 (0.22) | 3.69 (1.57) | 3.00 (1.06) | 3.20 (1.12) | 0.000 |
| 81 | 218[M+](1) 94(100) 79(52) | 1605 | 0.11 (0.02) | 5.26 (0.55) | 3.67 (2.11) | 3.63 (2.24) | 0.000 |
| 82 | 218[M+](26) 145(100) 43(92) | 1613 | 3.20 (0.09) | 7.93 (1.04) | 1.82 (0.68) | 3.33 (2.66) | 0.000 |
| 83 | 220[M+](2) 94(100) 79(39) | 1625 | - | - | - | - | 0.000 |
| 84 | 218[M+](5) 145(100) 160(48) | 1641 | 0.16 (0.02) | 0.24 (0.04) | 10.82 (1.13) | 7.29 (5.23) | 0.000 |
| 85 | 218[M+](18) 105(100) 120(83) | 1646 | 0.04 (0.01) | 0.12 (0.03) | 0.17 (0.09) | 0.14 (0.09) | 0.838 |
| 86 | 218[M+](5) 135(100) 107(52) | 1651 | 1.01 (0.15) | 0.05 (0.02) | 0.07 (0.03) | 0.17 (0.31) | 0.000 |
| 87 | 220[M+](2) 91(100) 43(91) | 1658 | 0.14 (0.03) | 0.14 (0.03) | 0.91 (0.34) | 0.65 (0.46) | 0.000 |
| 88 | 220[M+](8) 159(100) 91(81) | 1668 | - | - | - | - | 0.000 |
| 89 | 220[M+](5) 161(100) 91(69) | 1670 | 0.44 (0.03) | 1.00 (0.13) | 0.36 (0.11) | 0.51 (0.29) | 0.000 |
| 90 | 218[M+](38) 145(100) 91(51) | 1677 | 0.02 (0.01) | 0.42 (0.19) | 0.13 (0.06) | 0.18 (0.16) | 0.000 |
| 91 | 218[M+](2) 179(100) 161(92) | 1686 | 0.03 (0.01) | 0.06 (0.02) | 0.11 (0.02) | 0.09 (0.04) | 0.000 |
| 92 | 218[M+](9) 105(100) 119(59) | 1689 | 0.26 (0.04) | 0.20 (0.12) | 0.09 (0.06) | 0.13 (0.10) | 0.037 |
| 93 | 218[M+](22) 83(100) 94(92) | 1699 | 0.07 (0.01) | 0.20 (0.10) | 0.15 (0.04) | 0.15 (0.06) | 0.709 |
| 94 | 218[M+](28) 135(100) 91(77) | 1701 | 0.08 (0.01) | 0.04 (0.01) | 0.06 (0.02) | 0.06 (0.02) | 0.028 |
| 95 | 218[M+](20) 91(100) 133(98) | 1706 | 0.07 (0.01) | 0.11 (0.08) | 0.05 (0.02) | 0.07 (0.04) | 0.048 |
| 96 | 220[M+](4) 110(100) 95(62) | 1708 | 0.08 (0.02) | 0.07 (0.02) | 0.05 (0.03) | 0.06 (0.03) | 0.205 |
| 97 | 218[M+](11) 123(100) 95(62) | 1712 | 0.68 (0.06) | - | 0.07 (0.03) | 0.12 (0.21) | 0.037 |
| 98 | 220[M+](18) 83(100) 125(79) | 1722 | - | 0.10 (0.05) | 0.02 (0.01) | 0.03 (0.04) | 0.045 |
| 99 | 218[M+](2) 120(100) 83(34) | 1729 | - | - | - | - | 0.000 |
| 100 | 218[M+](1) 121(100) 165(59) | 1739 | - | - | 0.07 (0.04) | 0.05 (0.05) | 0.173 |
| 101 | 218[M+](2) 82(100) 41(50) | 1744 | 0.01 (0.01) | - | 0.03 (0.02) | 0.02 (0.02) | 0.000 |
| 102 | 218[M+](3) 82(100) 41(49) | 1754 | 0.09 (0.01) | 0.13 (0.02) | 0.02 (0.01) | 0.05 (0.05) | 0.001 |
| 103 | 220[M+](9) 137(100) 135(78) | 1759 | - | - | - | - | 0.000 |
| 104 | 218[M+](29) 136(100) 121(81) | 1762 | - | - | 0.12 (0.02) | 0.08 (0.06) | 0.221 |
| 105 | 218[M+](1) 183(100) 198(61) | 1795 | 0.47 (0.03) | 0.22 (0.10) | 0.02 (0.01) | 0.11 (0.16) | 0.820 |
| 106 | 218[M+](17) 82(100) 109(83) | 1800 | 0.01 (0.01) | - | - | - | 0.000 |
| 107 | 221[M+](1) 82(100) 67(39) | 1808 | 0.02 (0.01) | - | 0.09 (0.05) | 0.06 (0.06) | 0.414 |
| Total | 98.11 (6.89) | 98.01 (12.87) | 98.10 (21.33) | 98.03 (45.88) | |||
| % Identified | 28.64 (1.70) | 29.25 (5.36) | 24.23 (7.71) | 25.81 (10.91) | |||
| Including: | |||||||
| Aliphatics | 1.64 (0.26) | 0.41 (0.10) | 0.33 (0.13) | 0.48 (0.47) | |||
| Aromatics | 3.01 (0.30) | 0.98 (0.26) | 1.89 (0.96) | 1.81 (1.28) | |||
| Monoterpene hydrocarbons | 0.14 (0.03) | 0.03 (0.02) | 0.13 (0.05) | 0.10 (0.06) | |||
| Monoterpenoide hydrocarbons | 0.18 (0.03) | - | 0.08 (0.08) | 0.08 (0.09) | |||
| Sesquiterpene hydrocarbons | 19.23 (0.78) | 22.97 (2.56) | 18.28 (4.93) | 19.42 (7.28) | |||
| Sesquiterpenoide hydrocarbons | 4.44 (0.30) | 4.86 (2.42) | 3.52 (1.56) | 3.92 (1.73) | |||
Disclaimer/Publisher’s Note: The statements, opinions and data contained in all publications are solely those of the individual author(s) and contributor(s) and not of MDPI and/or the editor(s). MDPI and/or the editor(s) disclaim responsibility for any injury to people or property resulting from any ideas, methods, instructions or products referred to in the content. |
© 2024 by the authors. Licensee MDPI, Basel, Switzerland. This article is an open access article distributed under the terms and conditions of the Creative Commons Attribution (CC BY) license (https://creativecommons.org/licenses/by/4.0/).
Share and Cite
Wawrzyniak, R.; Wasiak, W.; Guzowska, M.; Bączkiewicz, A.; Buczkowska, K. The Content of Volatile Organic Compounds in Calypogeia suecica (Calypogeiaceae, Marchantiophyta) Confirms Genetic Differentiation of This Liverwort Species into Two Groups. Molecules 2024, 29, 4258. https://doi.org/10.3390/molecules29174258
Wawrzyniak R, Wasiak W, Guzowska M, Bączkiewicz A, Buczkowska K. The Content of Volatile Organic Compounds in Calypogeia suecica (Calypogeiaceae, Marchantiophyta) Confirms Genetic Differentiation of This Liverwort Species into Two Groups. Molecules. 2024; 29(17):4258. https://doi.org/10.3390/molecules29174258
Chicago/Turabian StyleWawrzyniak, Rafał, Wiesław Wasiak, Małgorzata Guzowska, Alina Bączkiewicz, and Katarzyna Buczkowska. 2024. "The Content of Volatile Organic Compounds in Calypogeia suecica (Calypogeiaceae, Marchantiophyta) Confirms Genetic Differentiation of This Liverwort Species into Two Groups" Molecules 29, no. 17: 4258. https://doi.org/10.3390/molecules29174258