
MgO Nanoparticles as a Promising Photocatalyst towards Rhodamine B and Rhodamine 6G Degradation


Abstract
:1. Introduction
2. Results
2.1. Characterization of MgO Powder
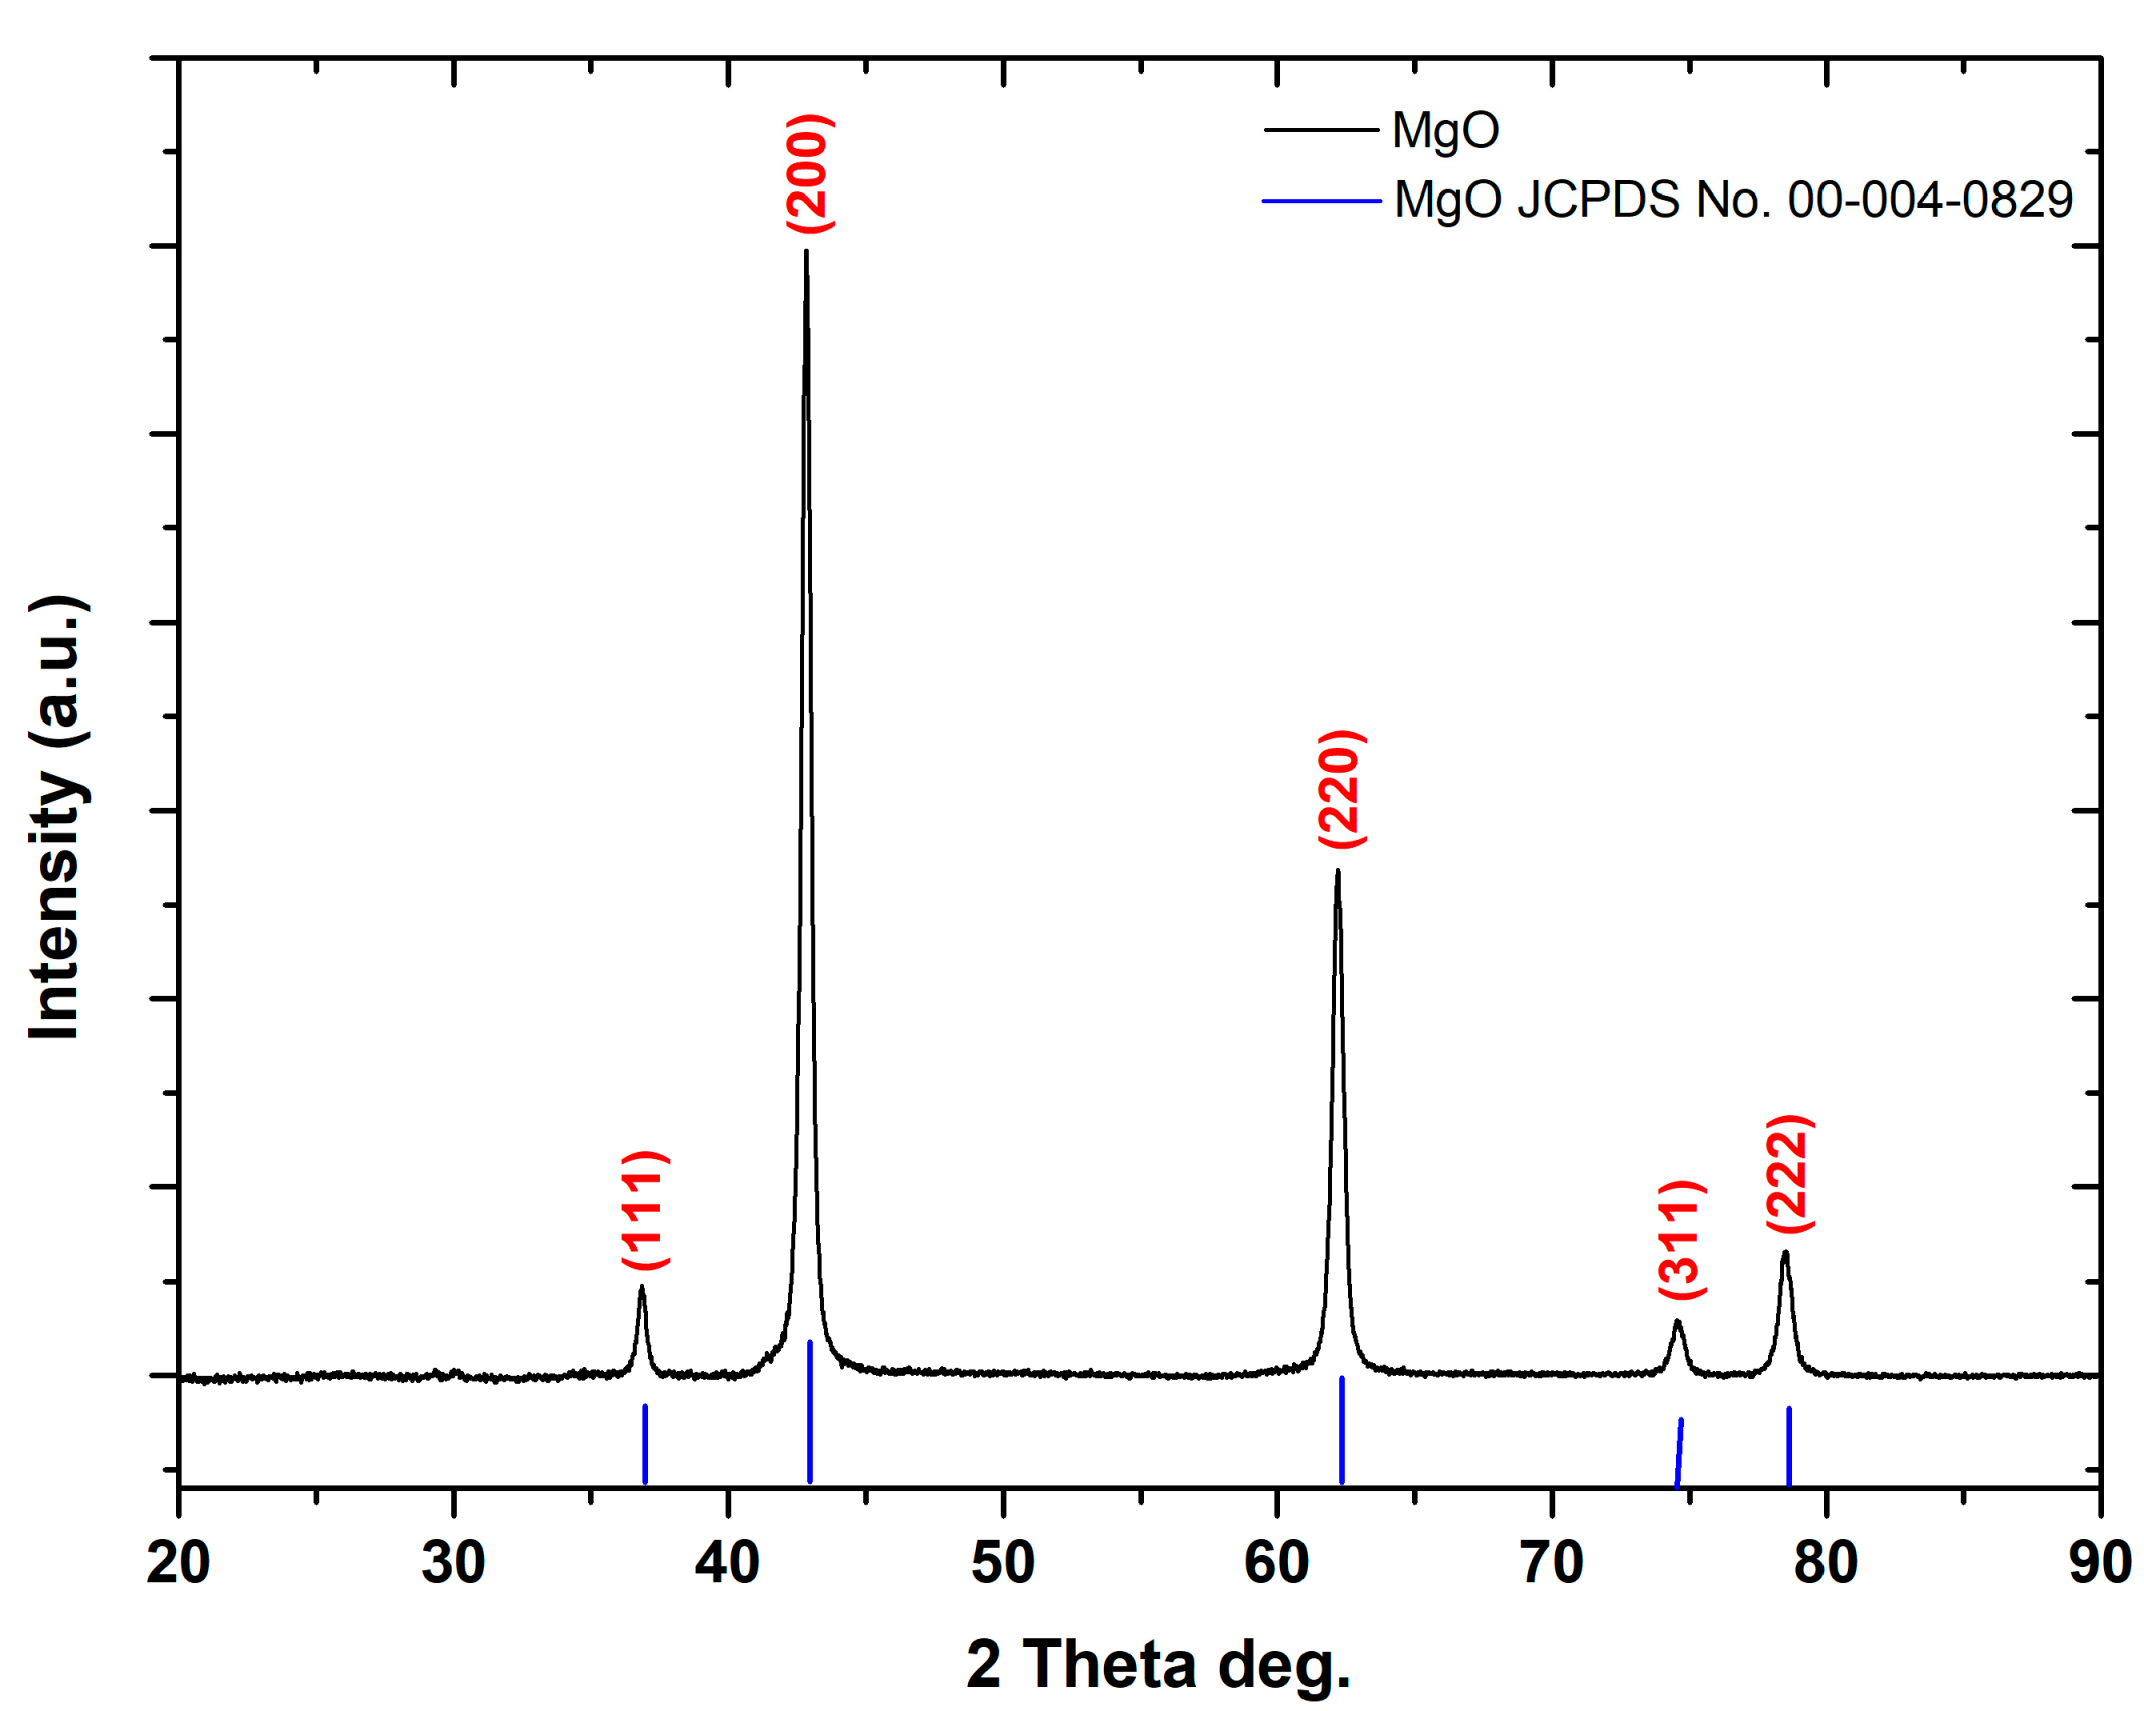
2.1.1. XRD Analysis
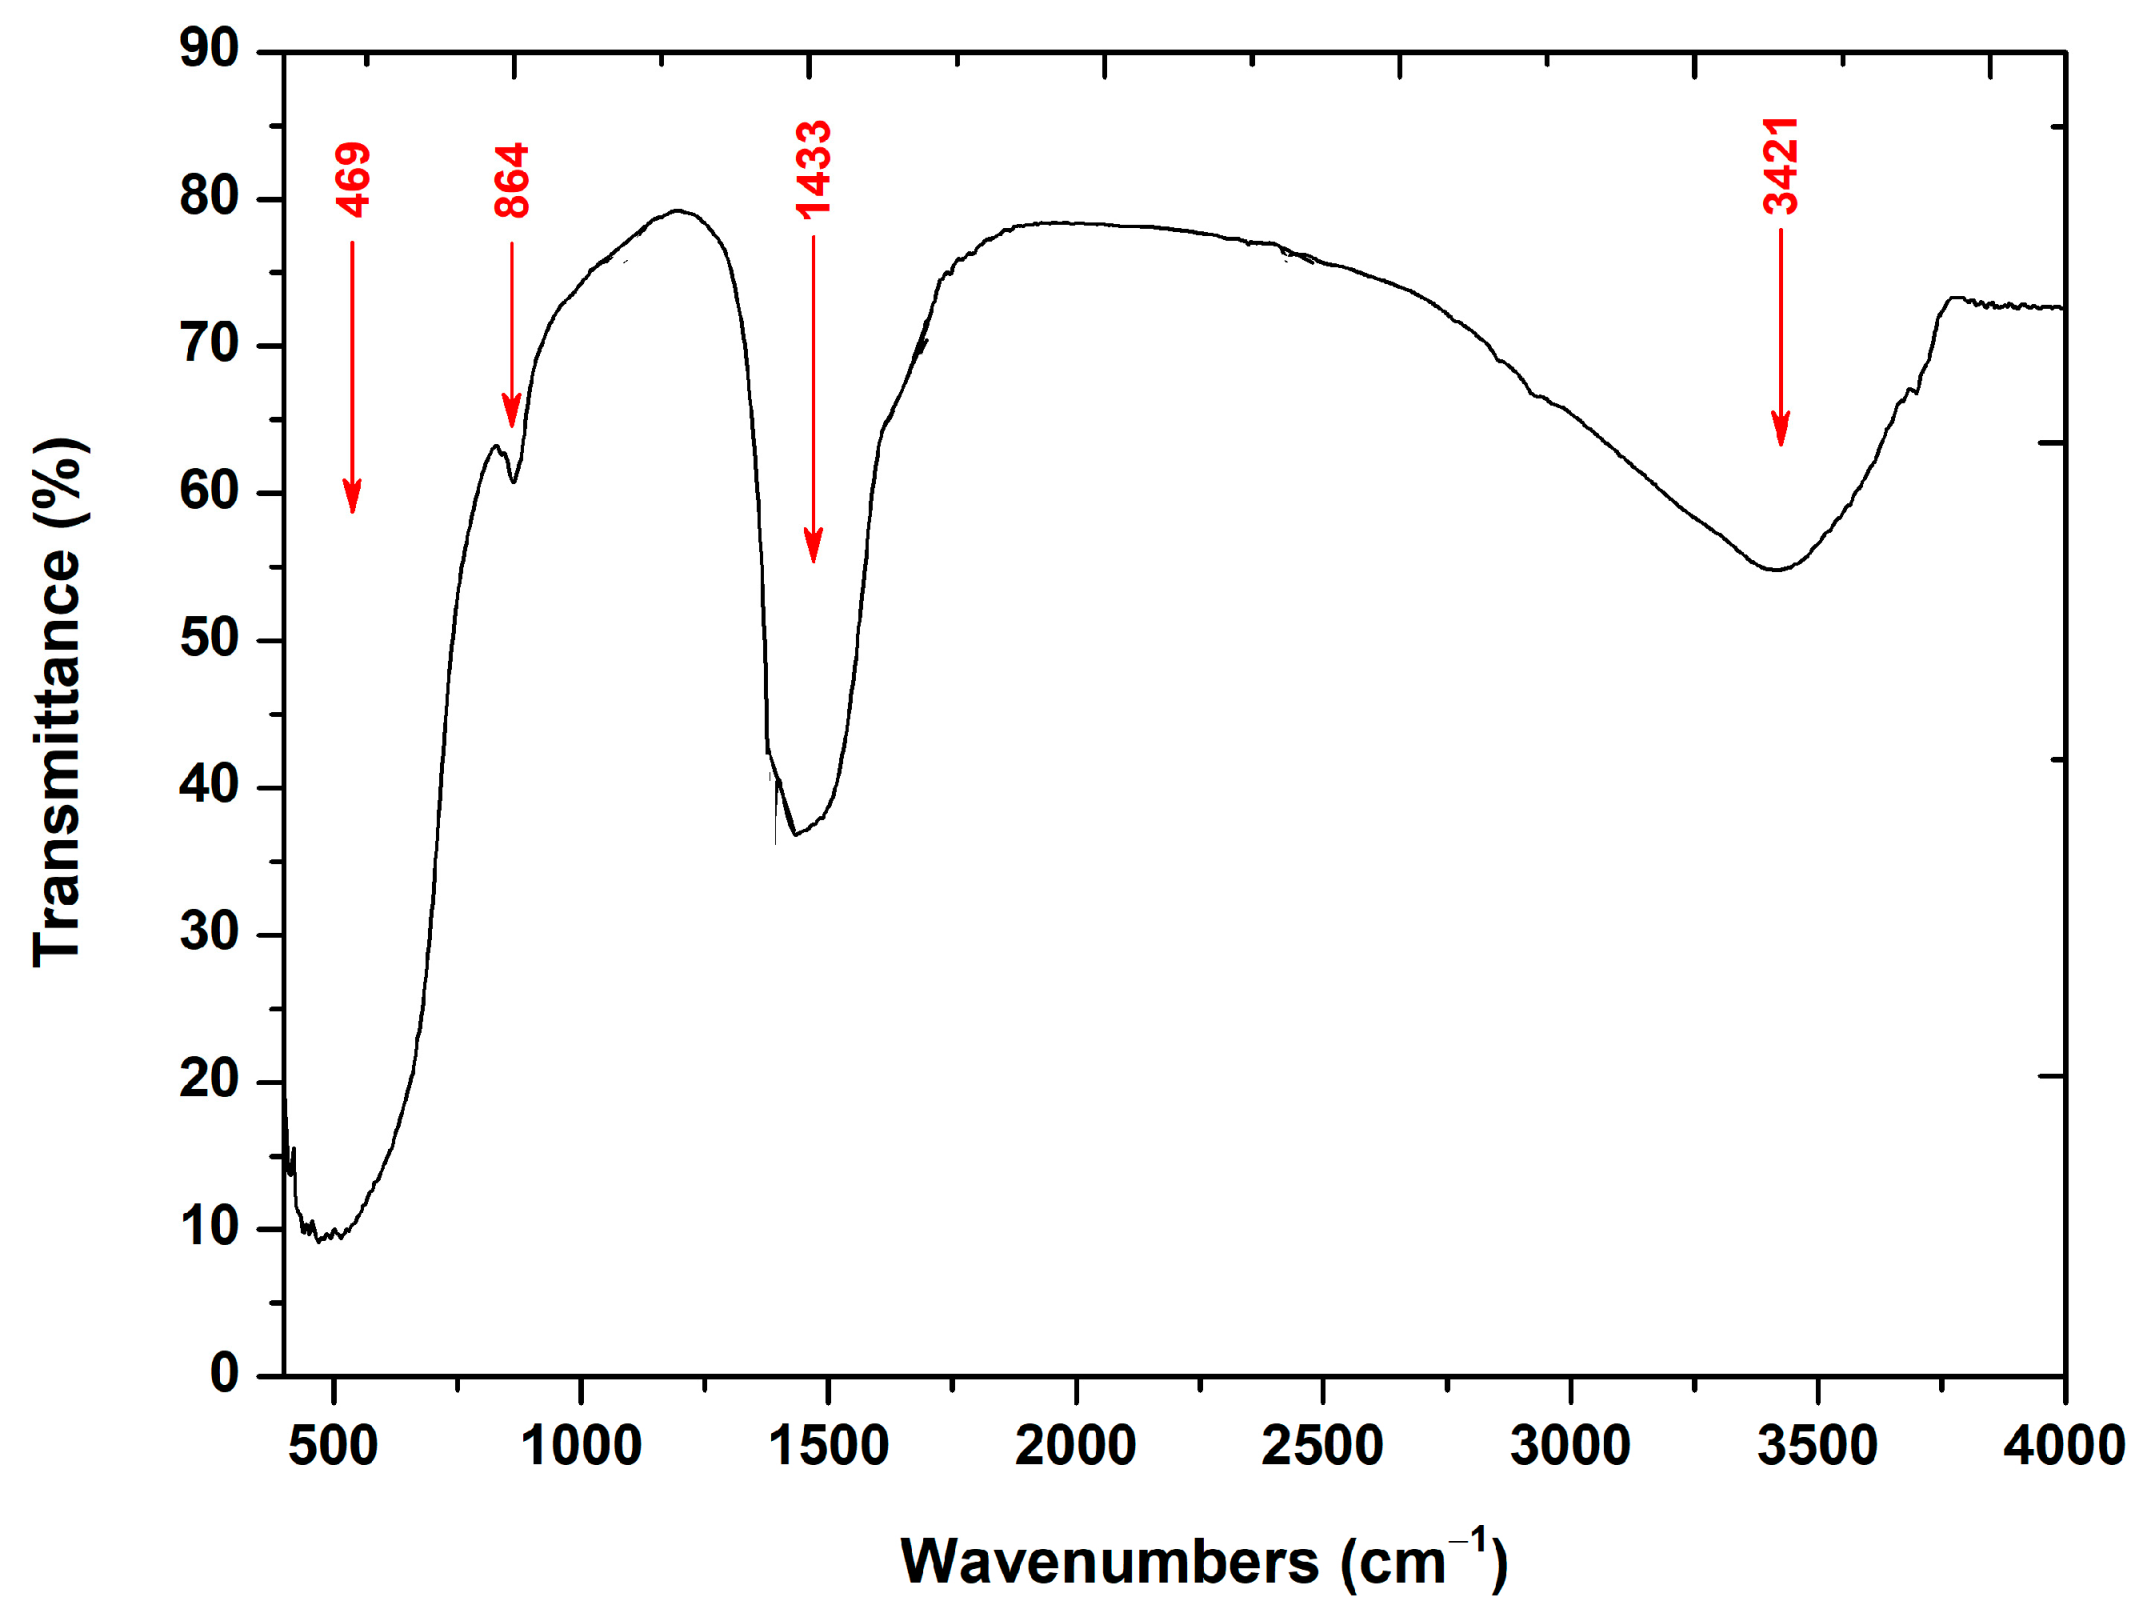
2.1.2. FT-IR Analysis
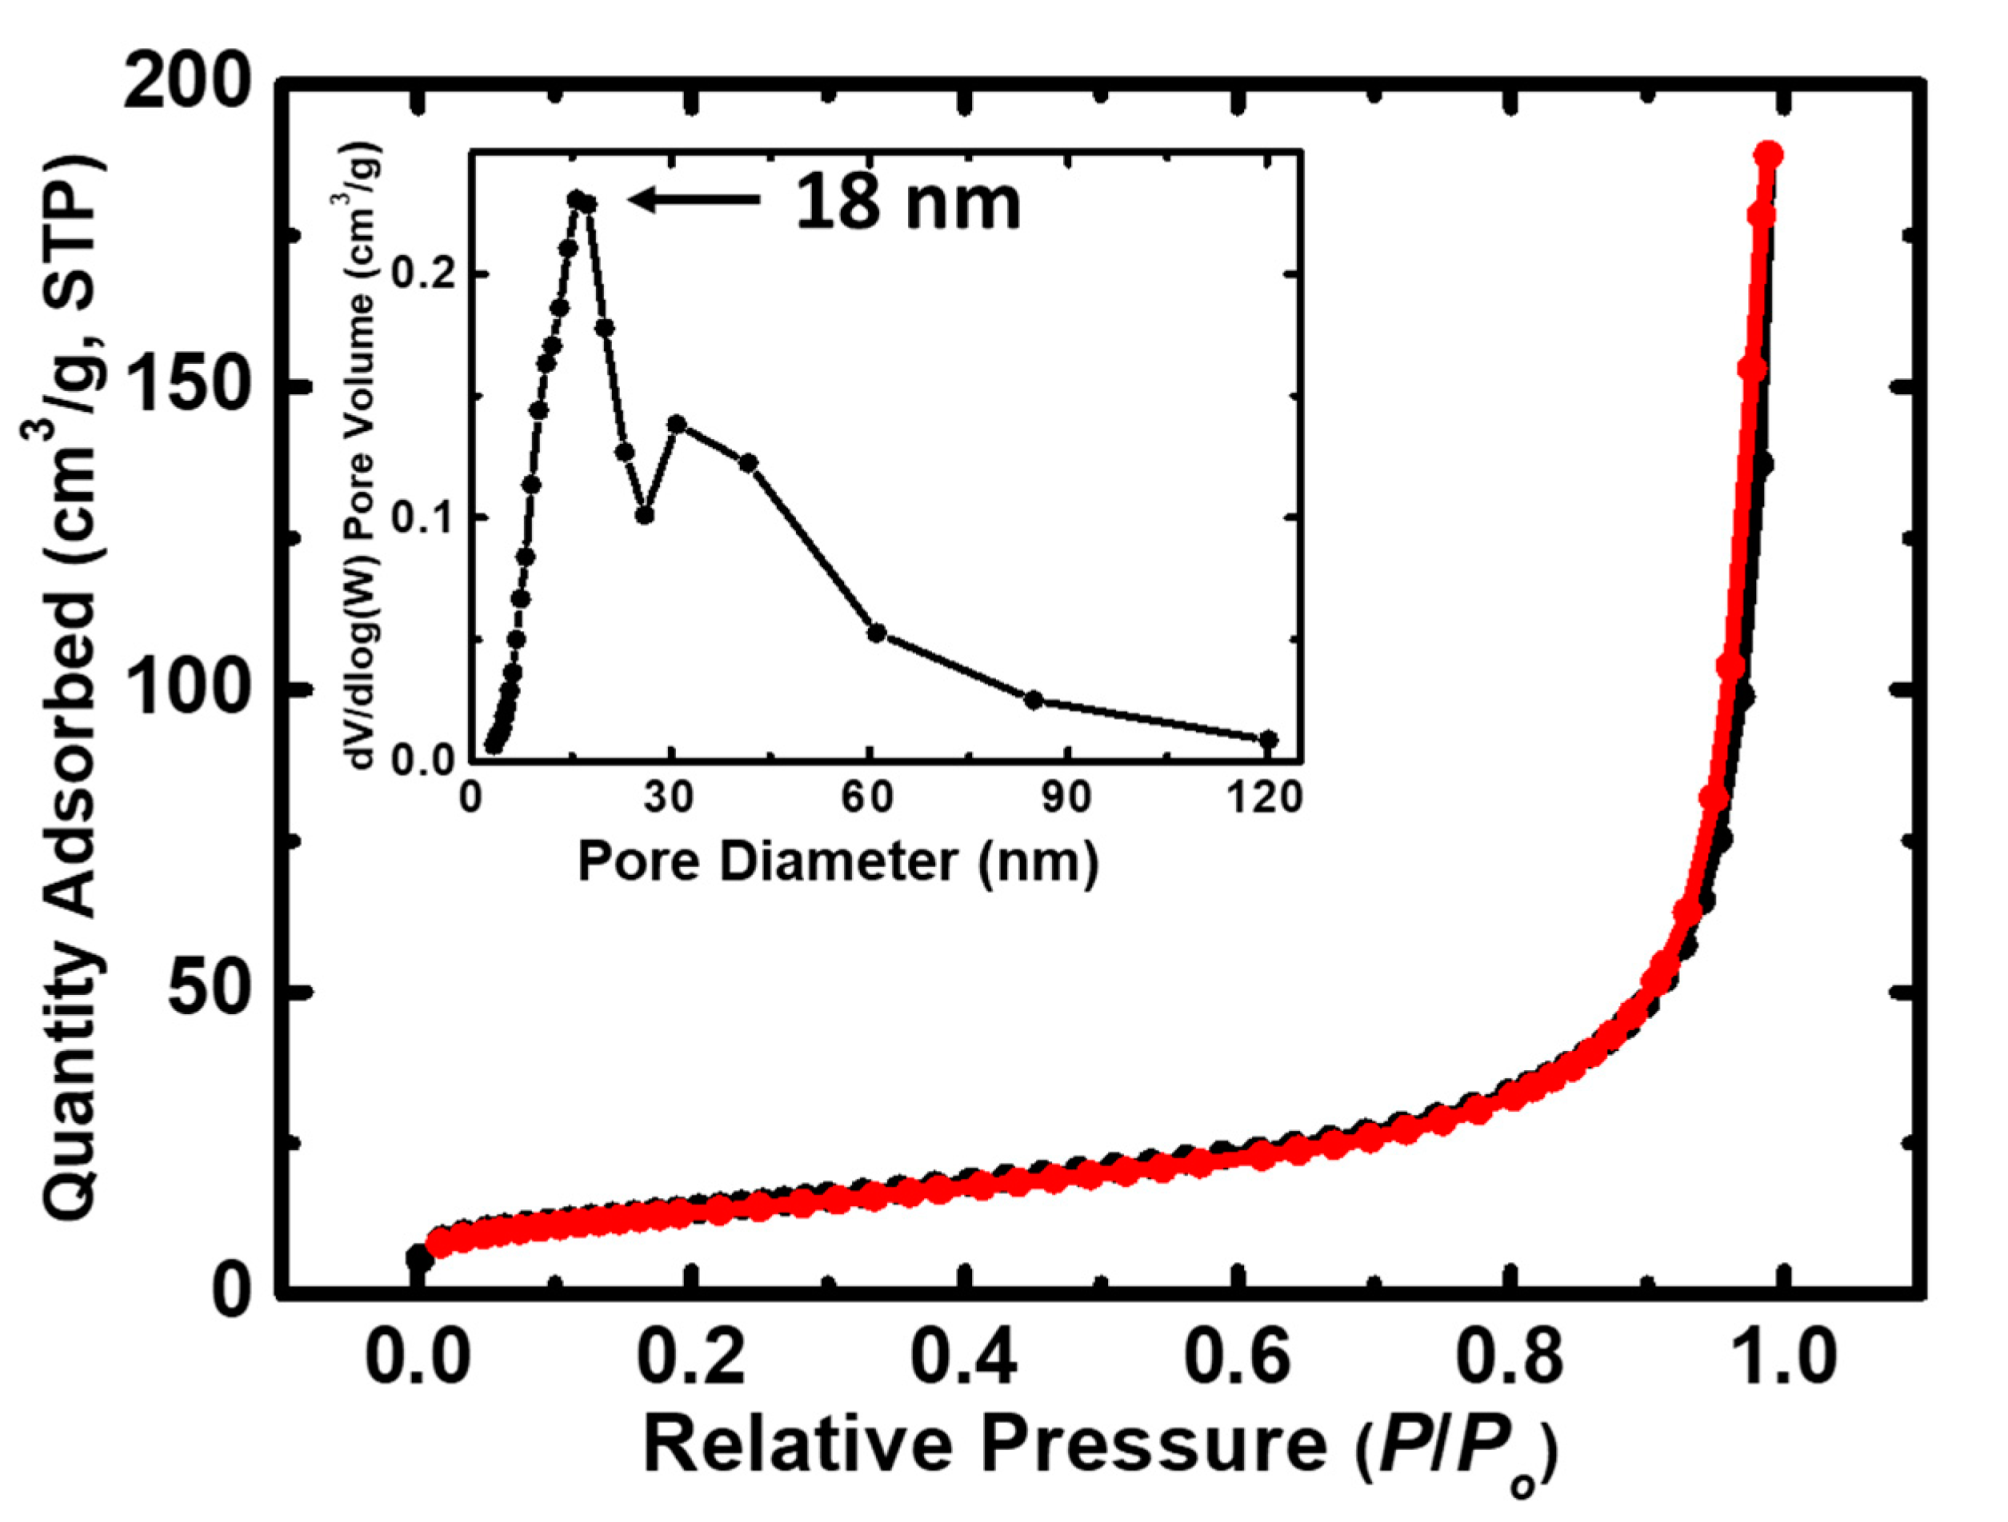
2.1.3. N2-Sorption Analysis
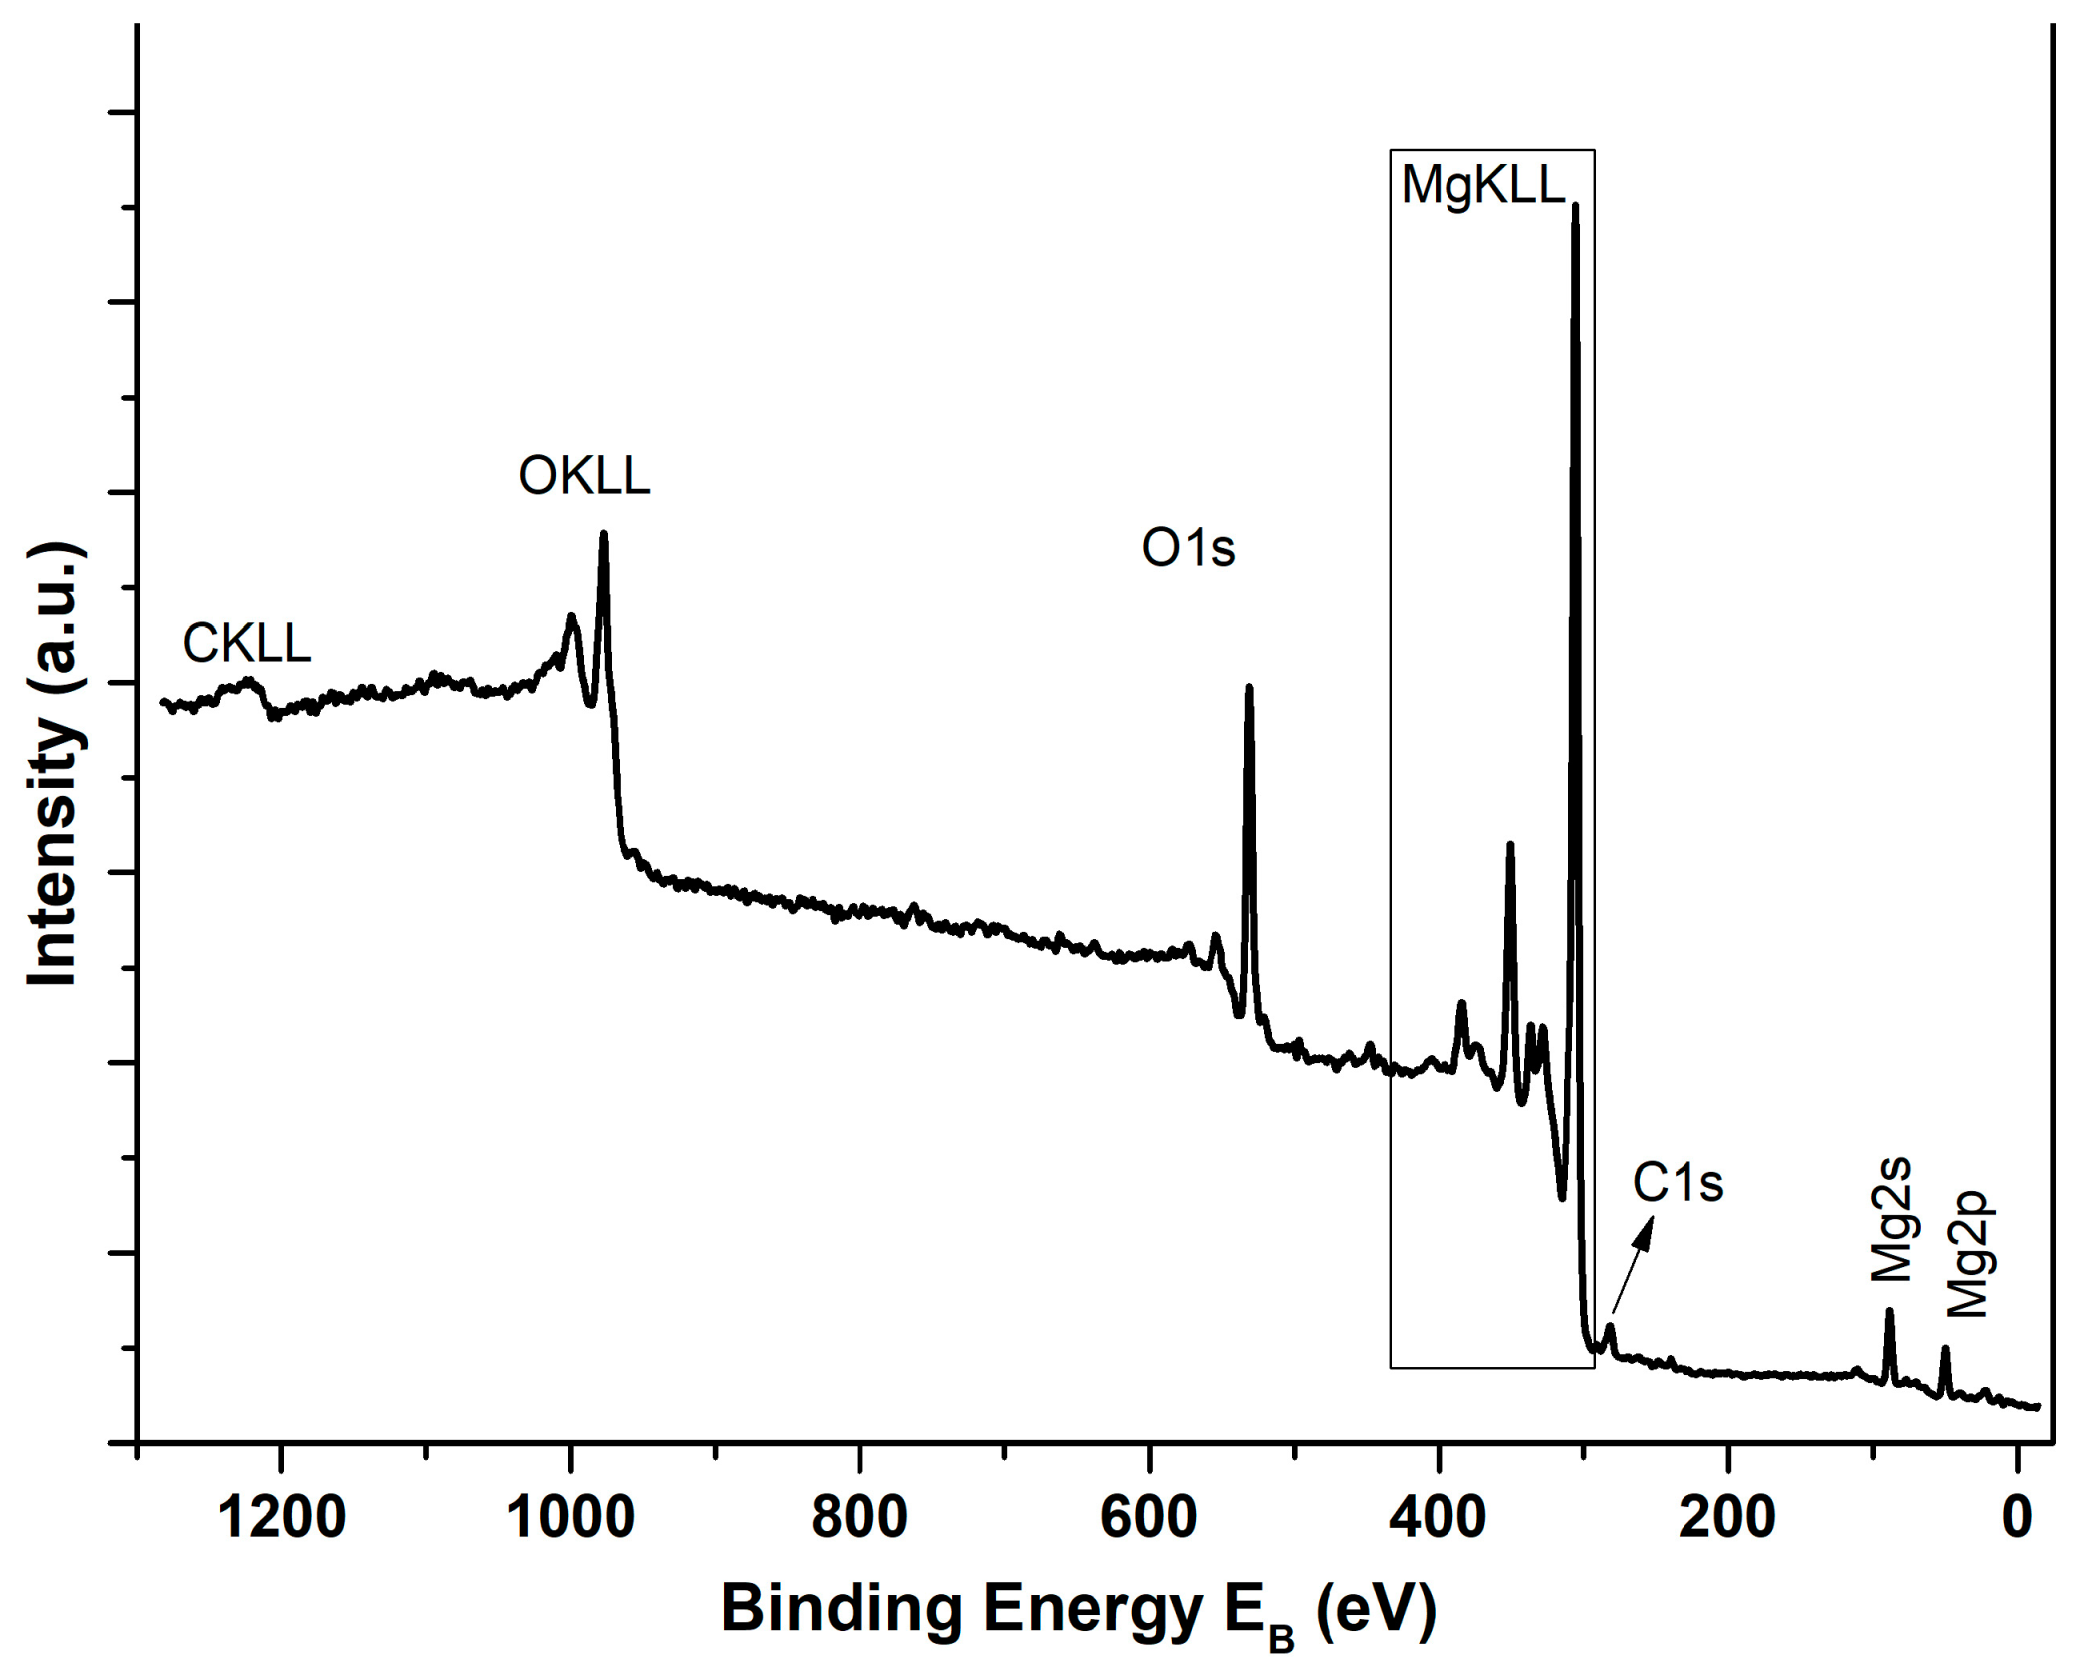
2.1.4. XPS Analysis
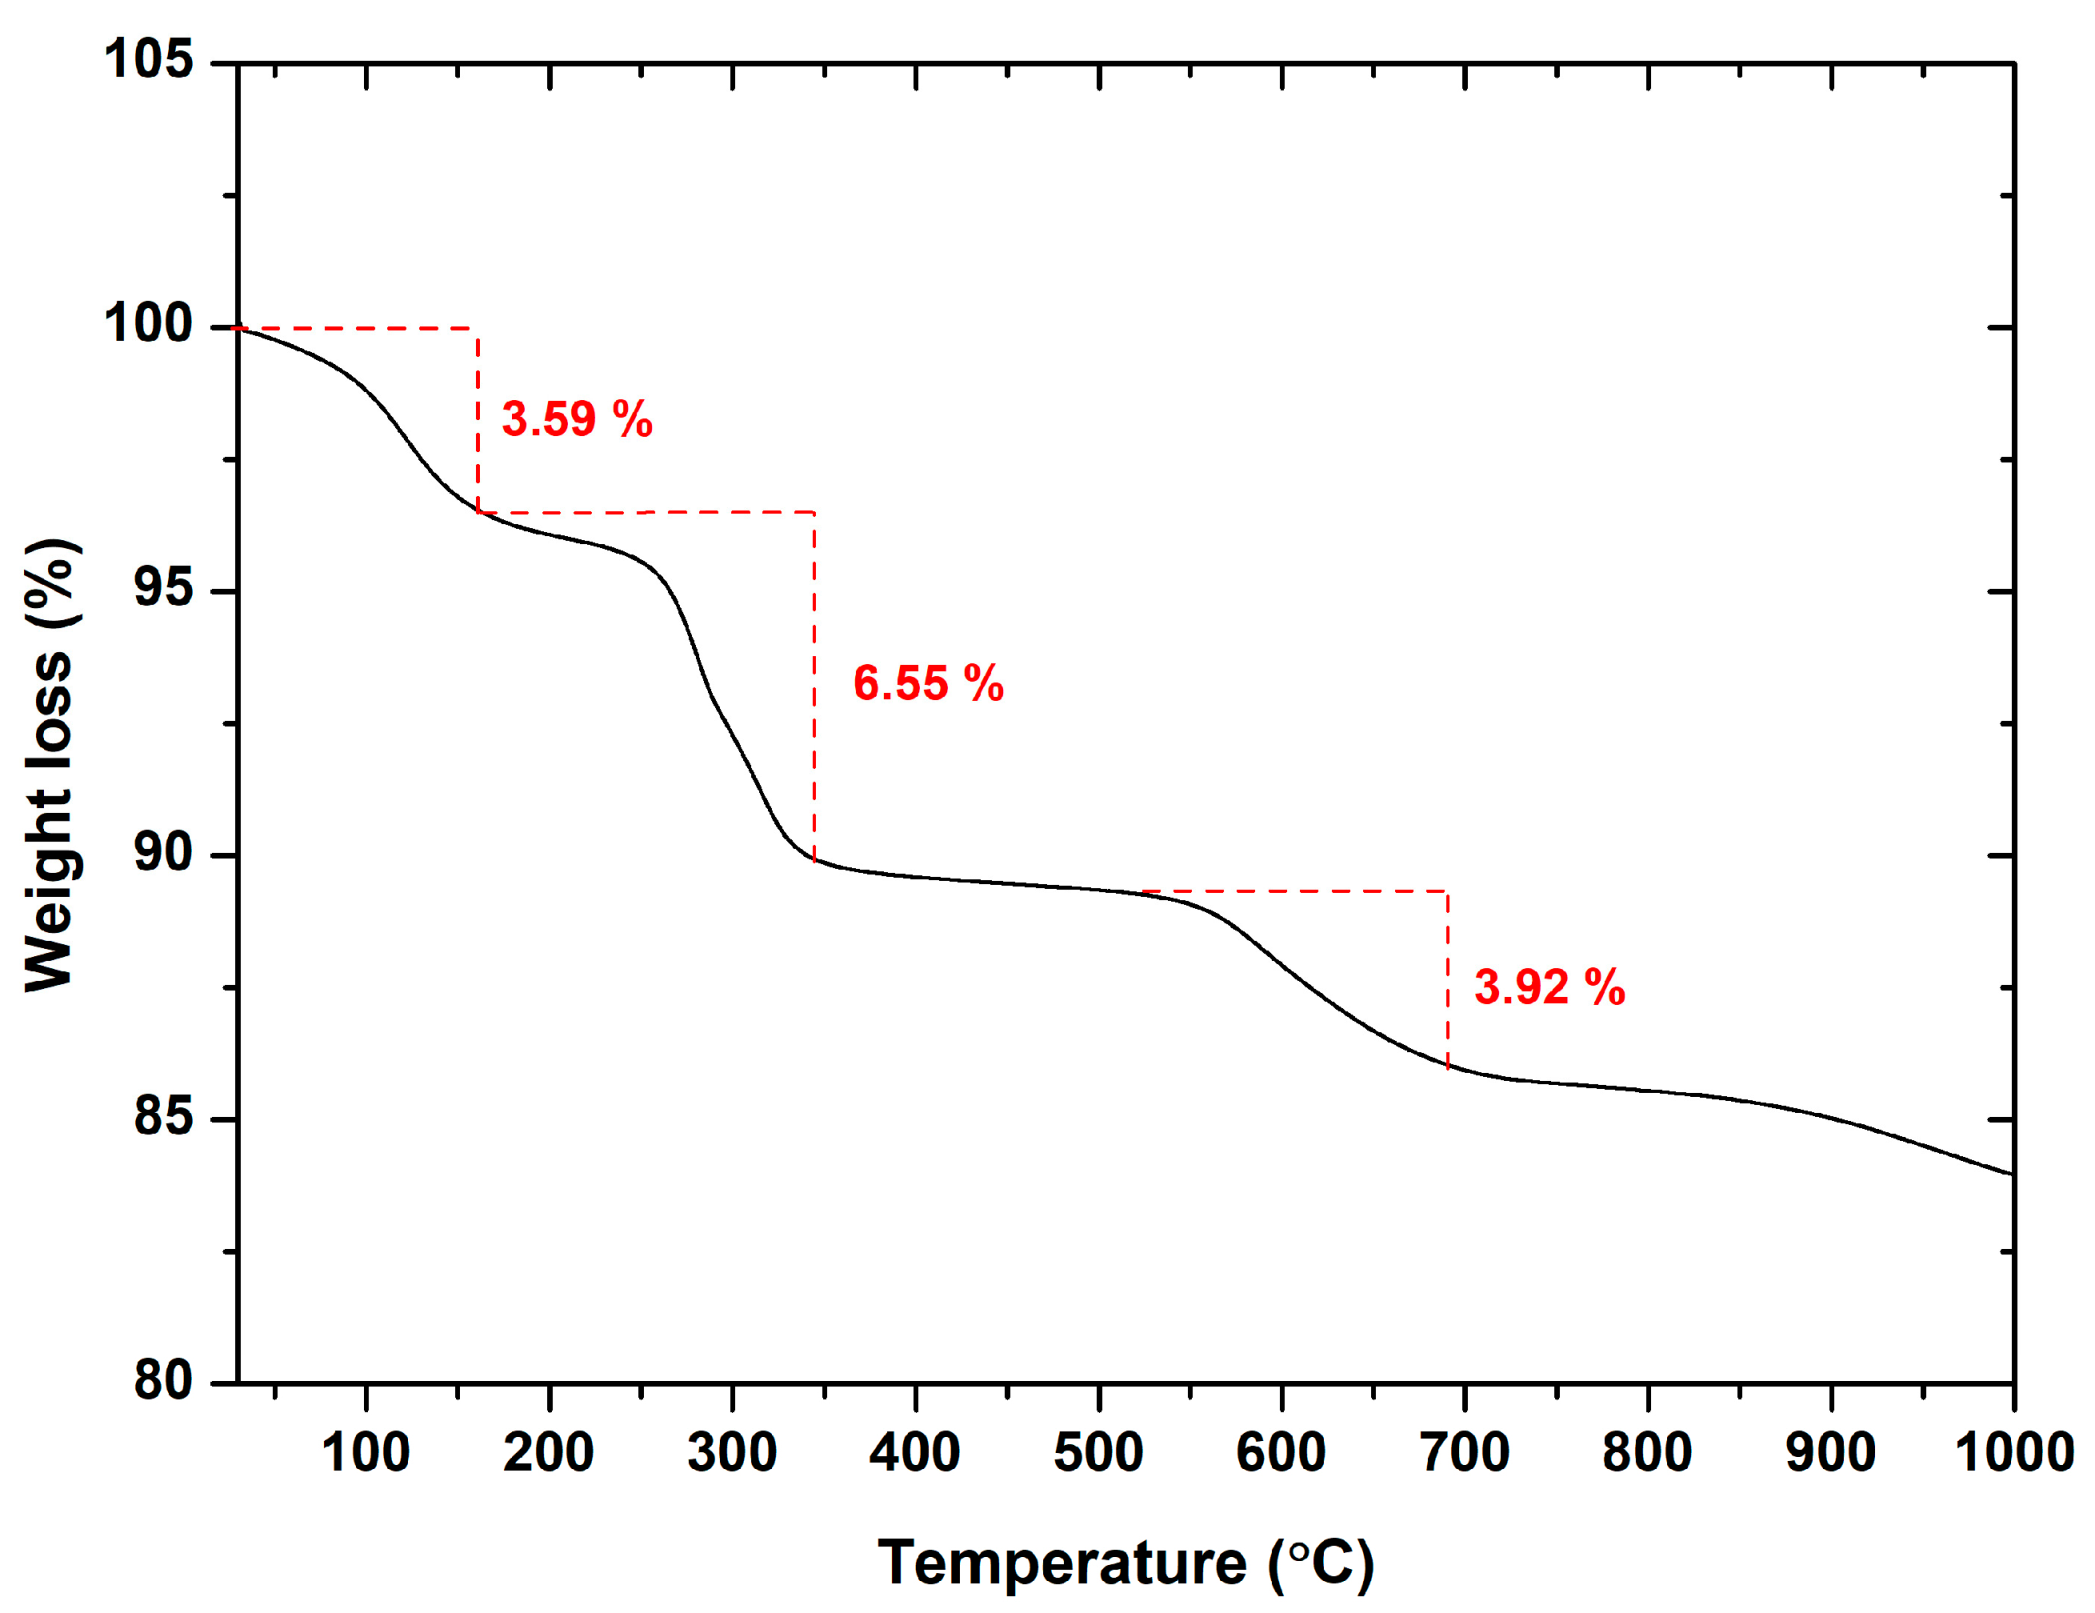
2.1.5. TGA Analysis
2.1.6. Dynamic Light Scattering (DLS) Analysis
2.1.7. Diffuse Reflectance UV–Vis Spectroscopy (DRS) Analysis
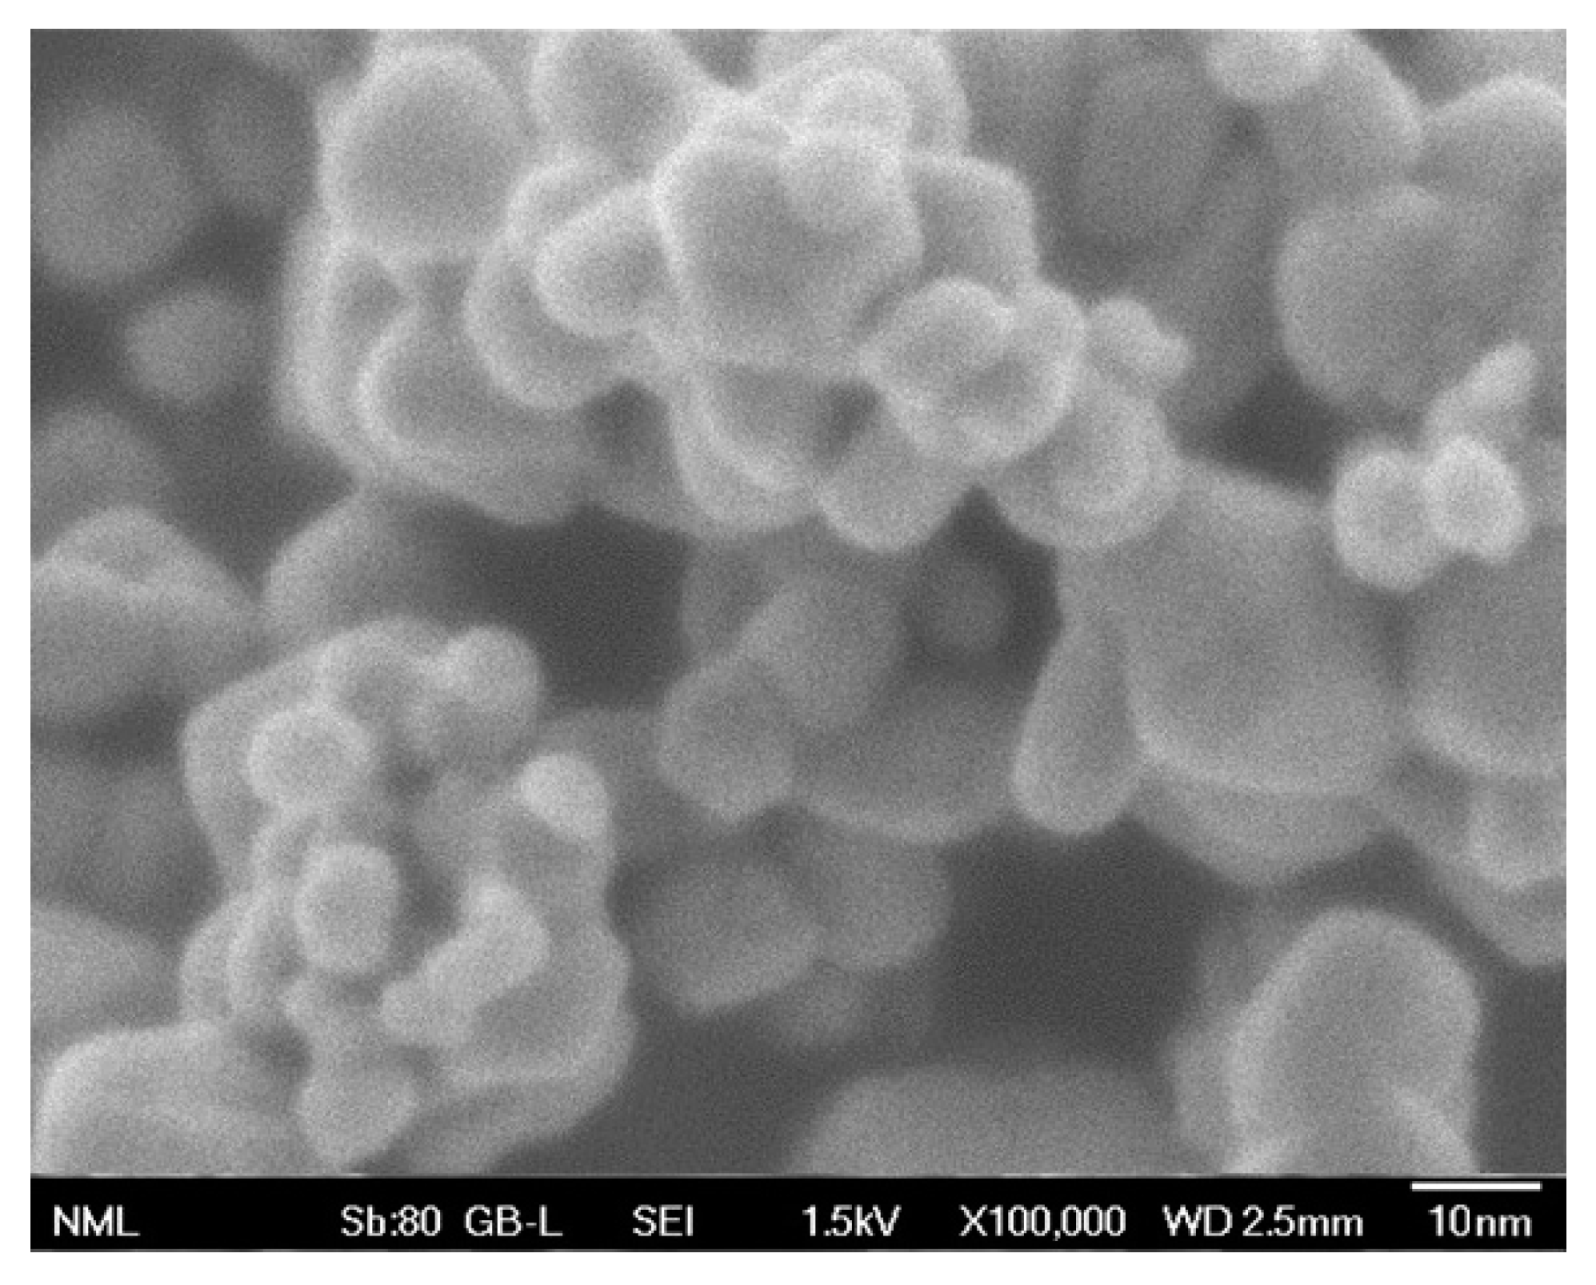
2.1.8. FESEM Analysis
2.2. Photocatalytic Study of MgO Powder
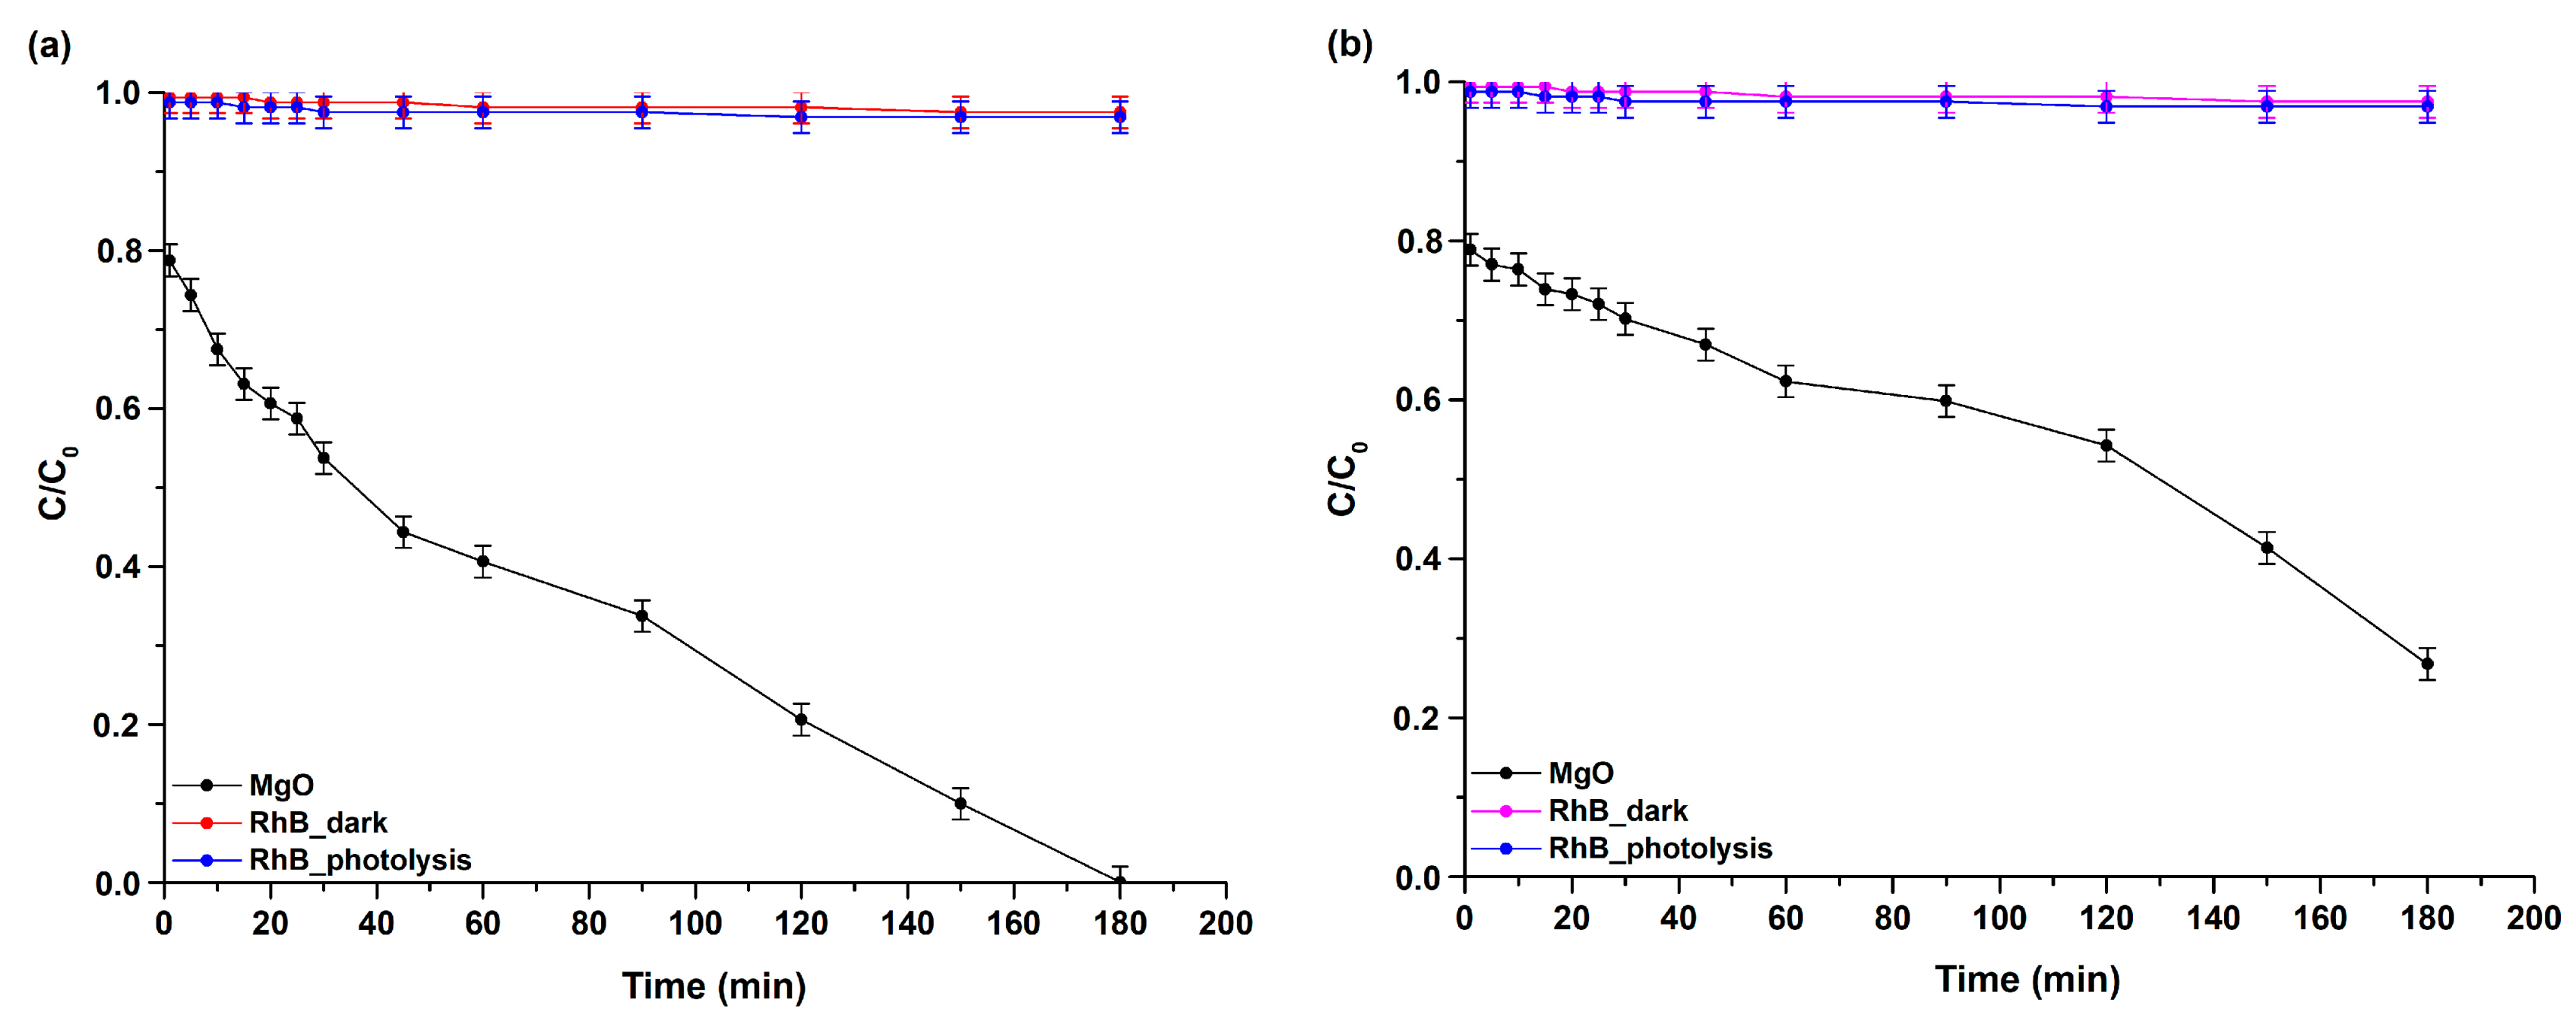
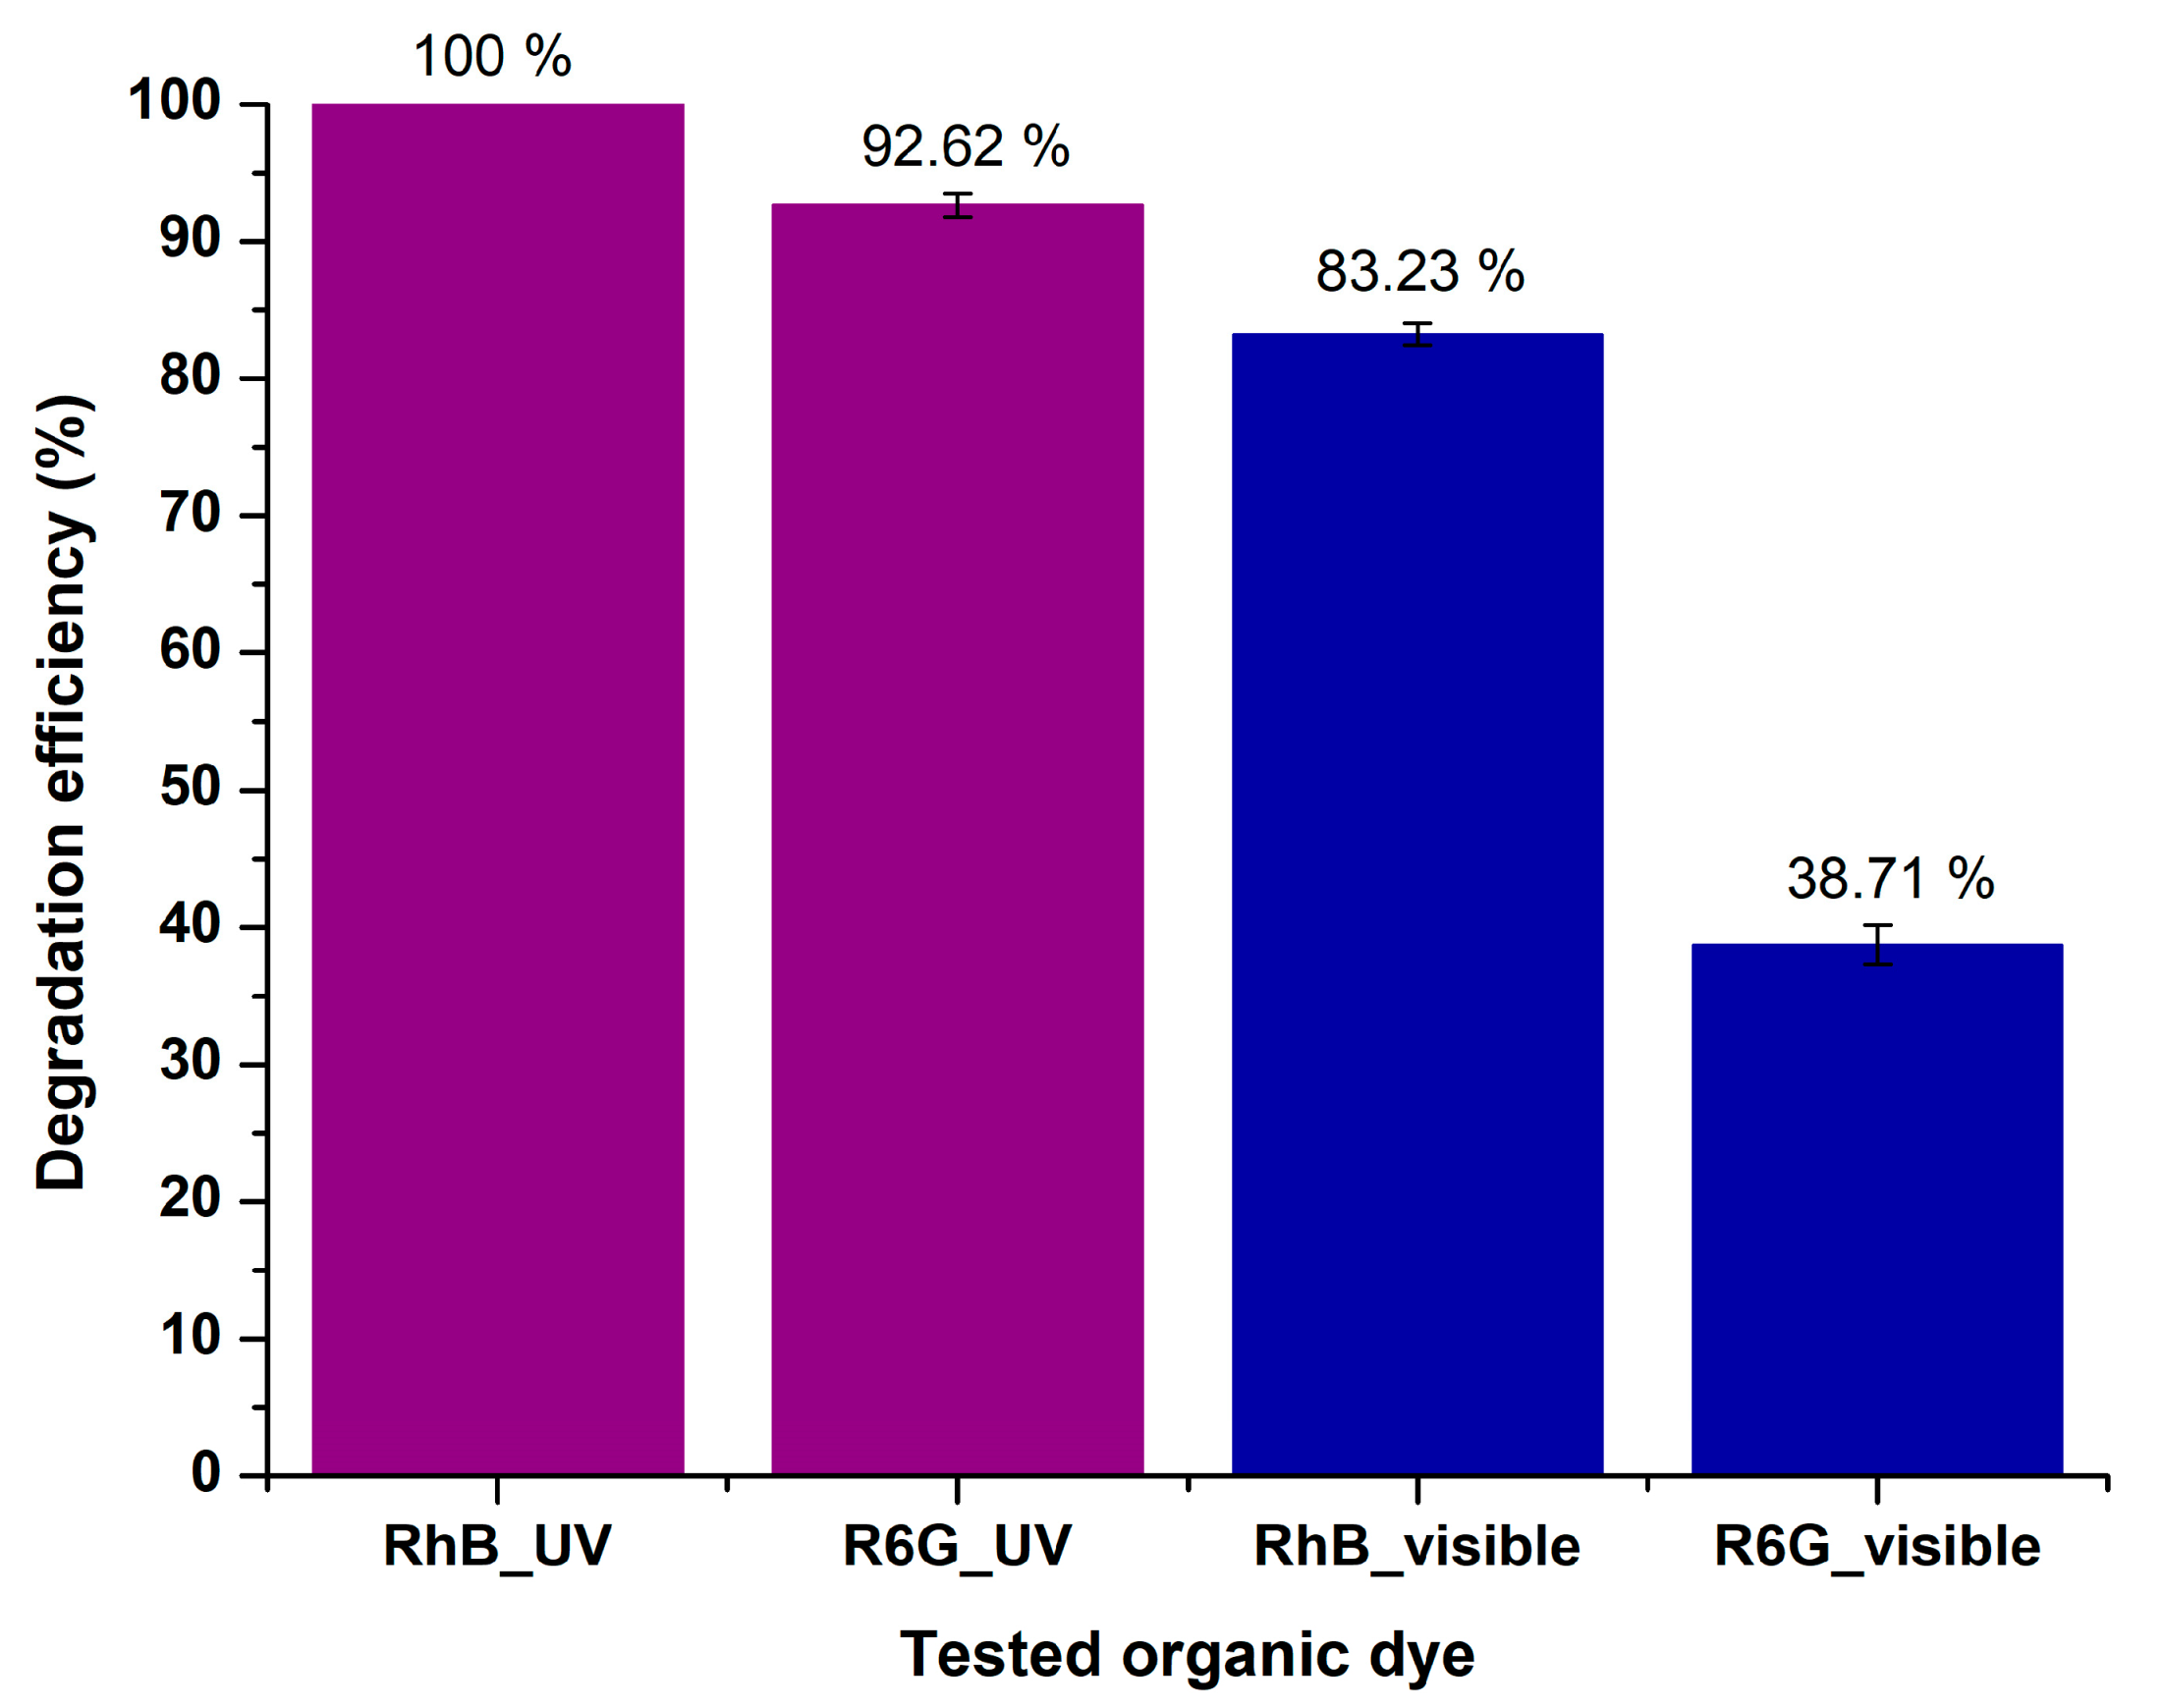
2.2.1. Study of the Photocatalytic Effectiveness towards Rhodamine B (RhB) Degradation
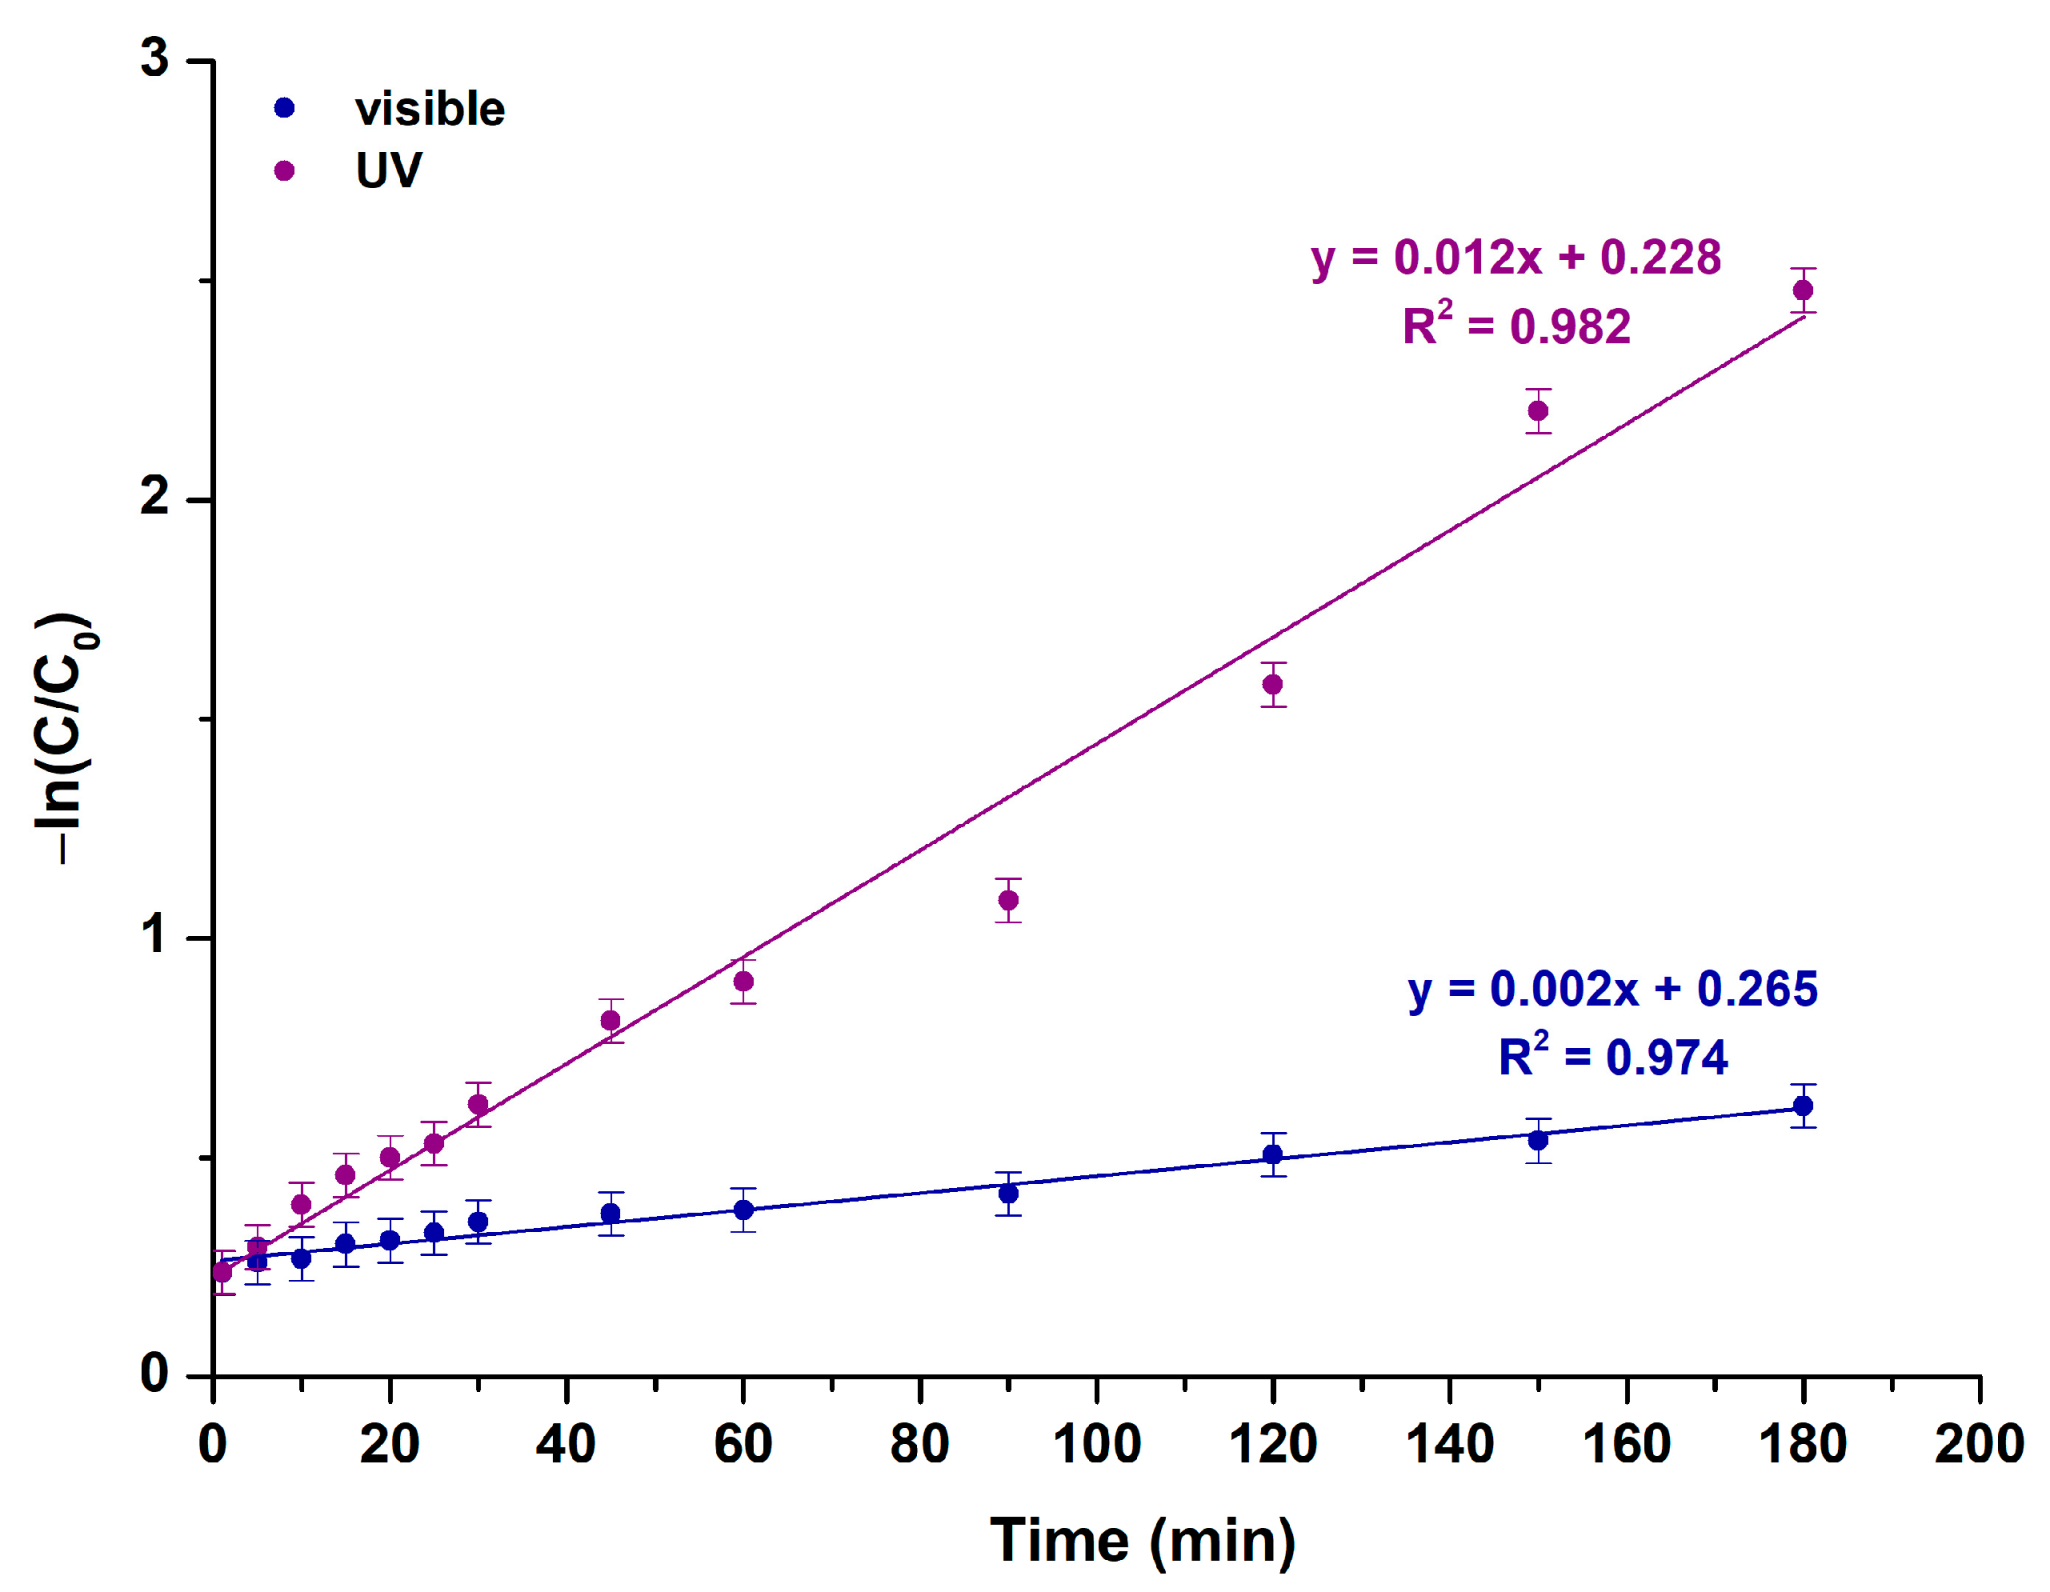
Study of RhB’s Photocatalytic Degradation Kinetics
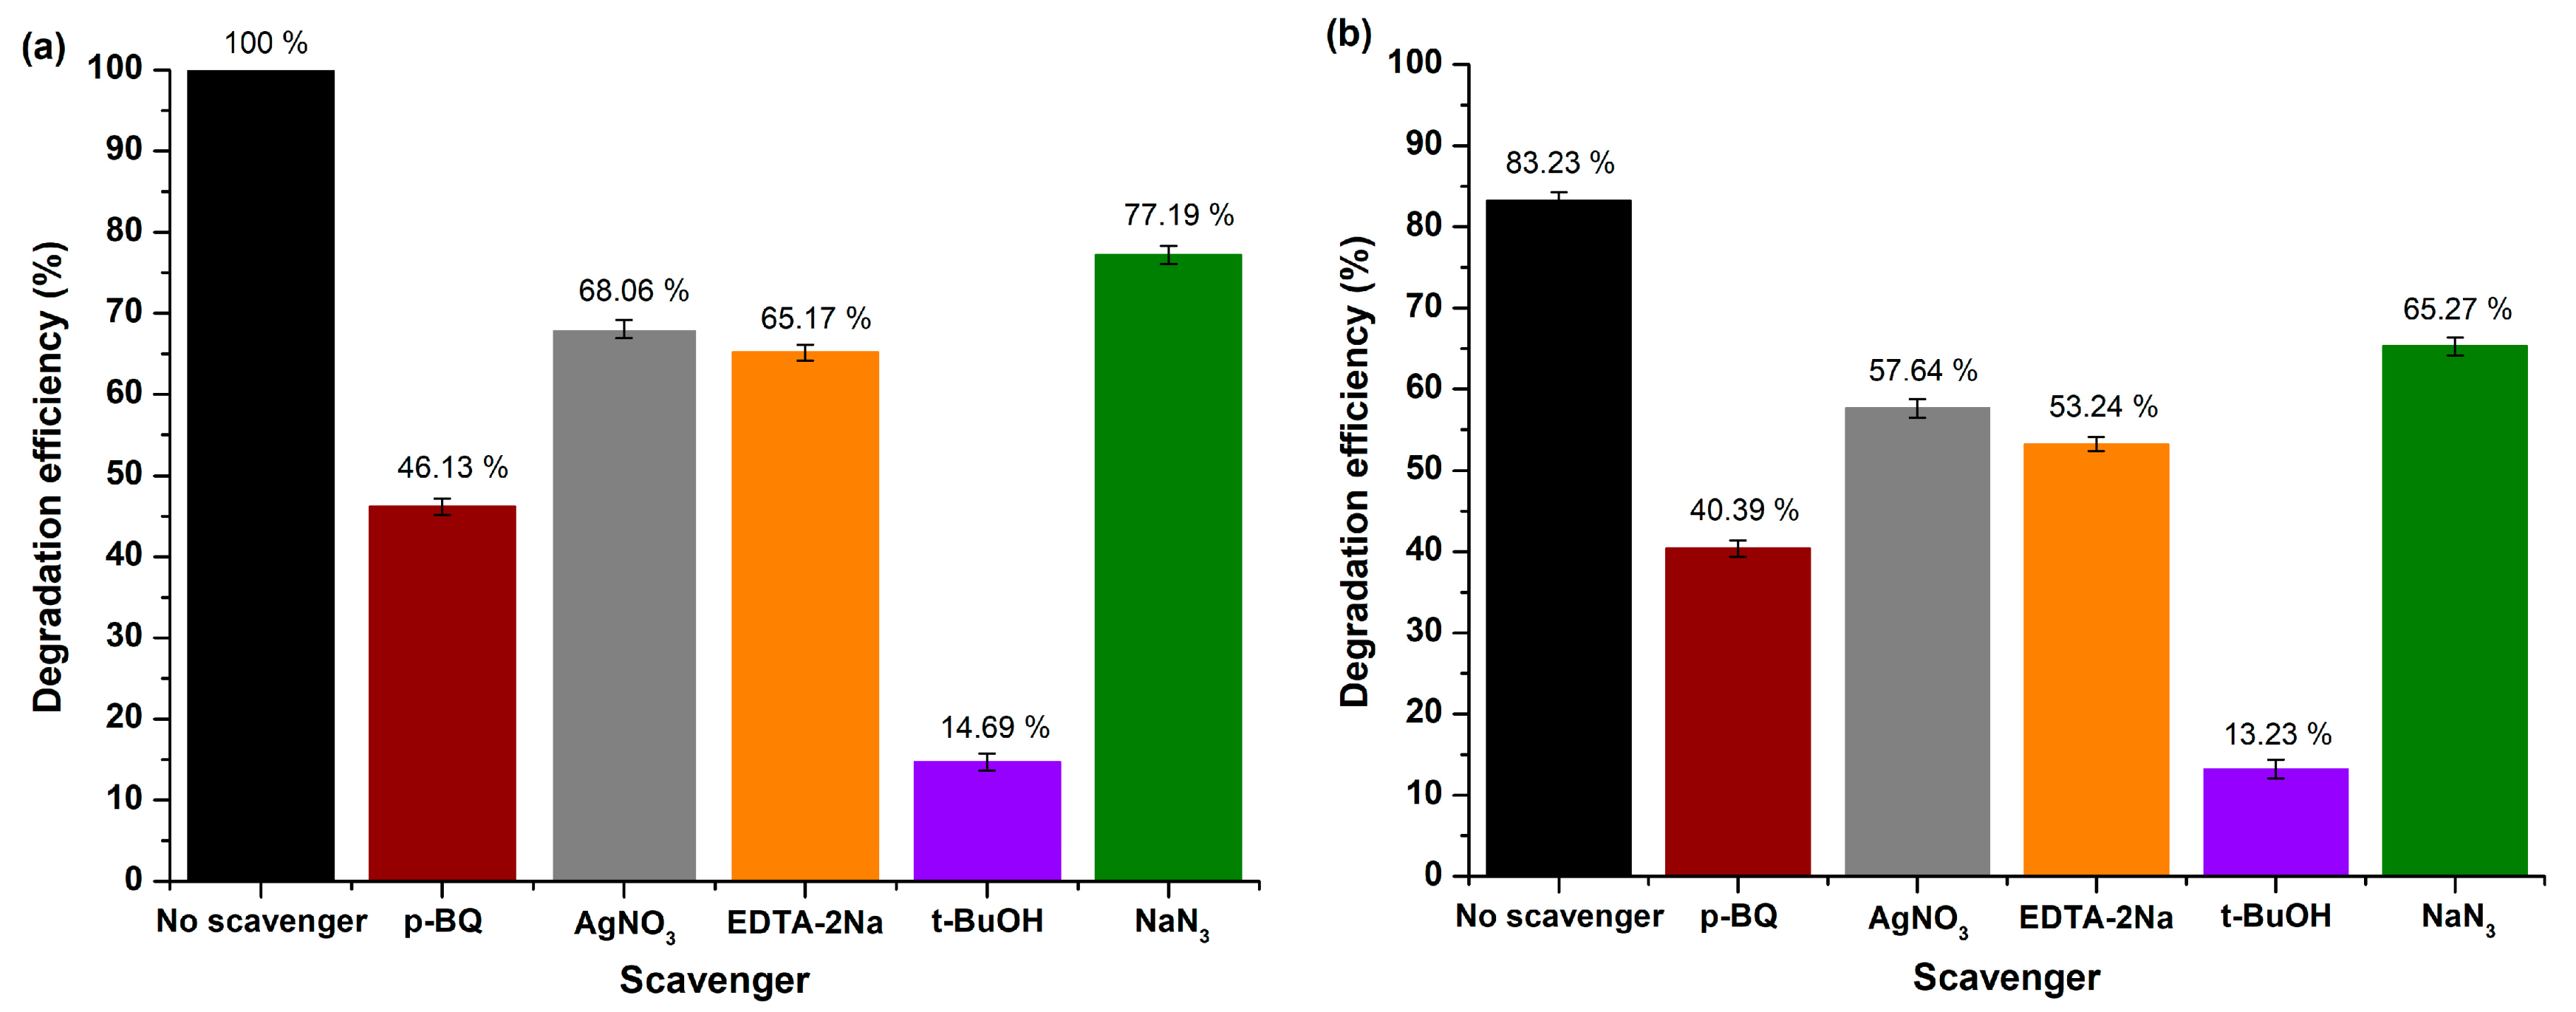
Mechanism Study
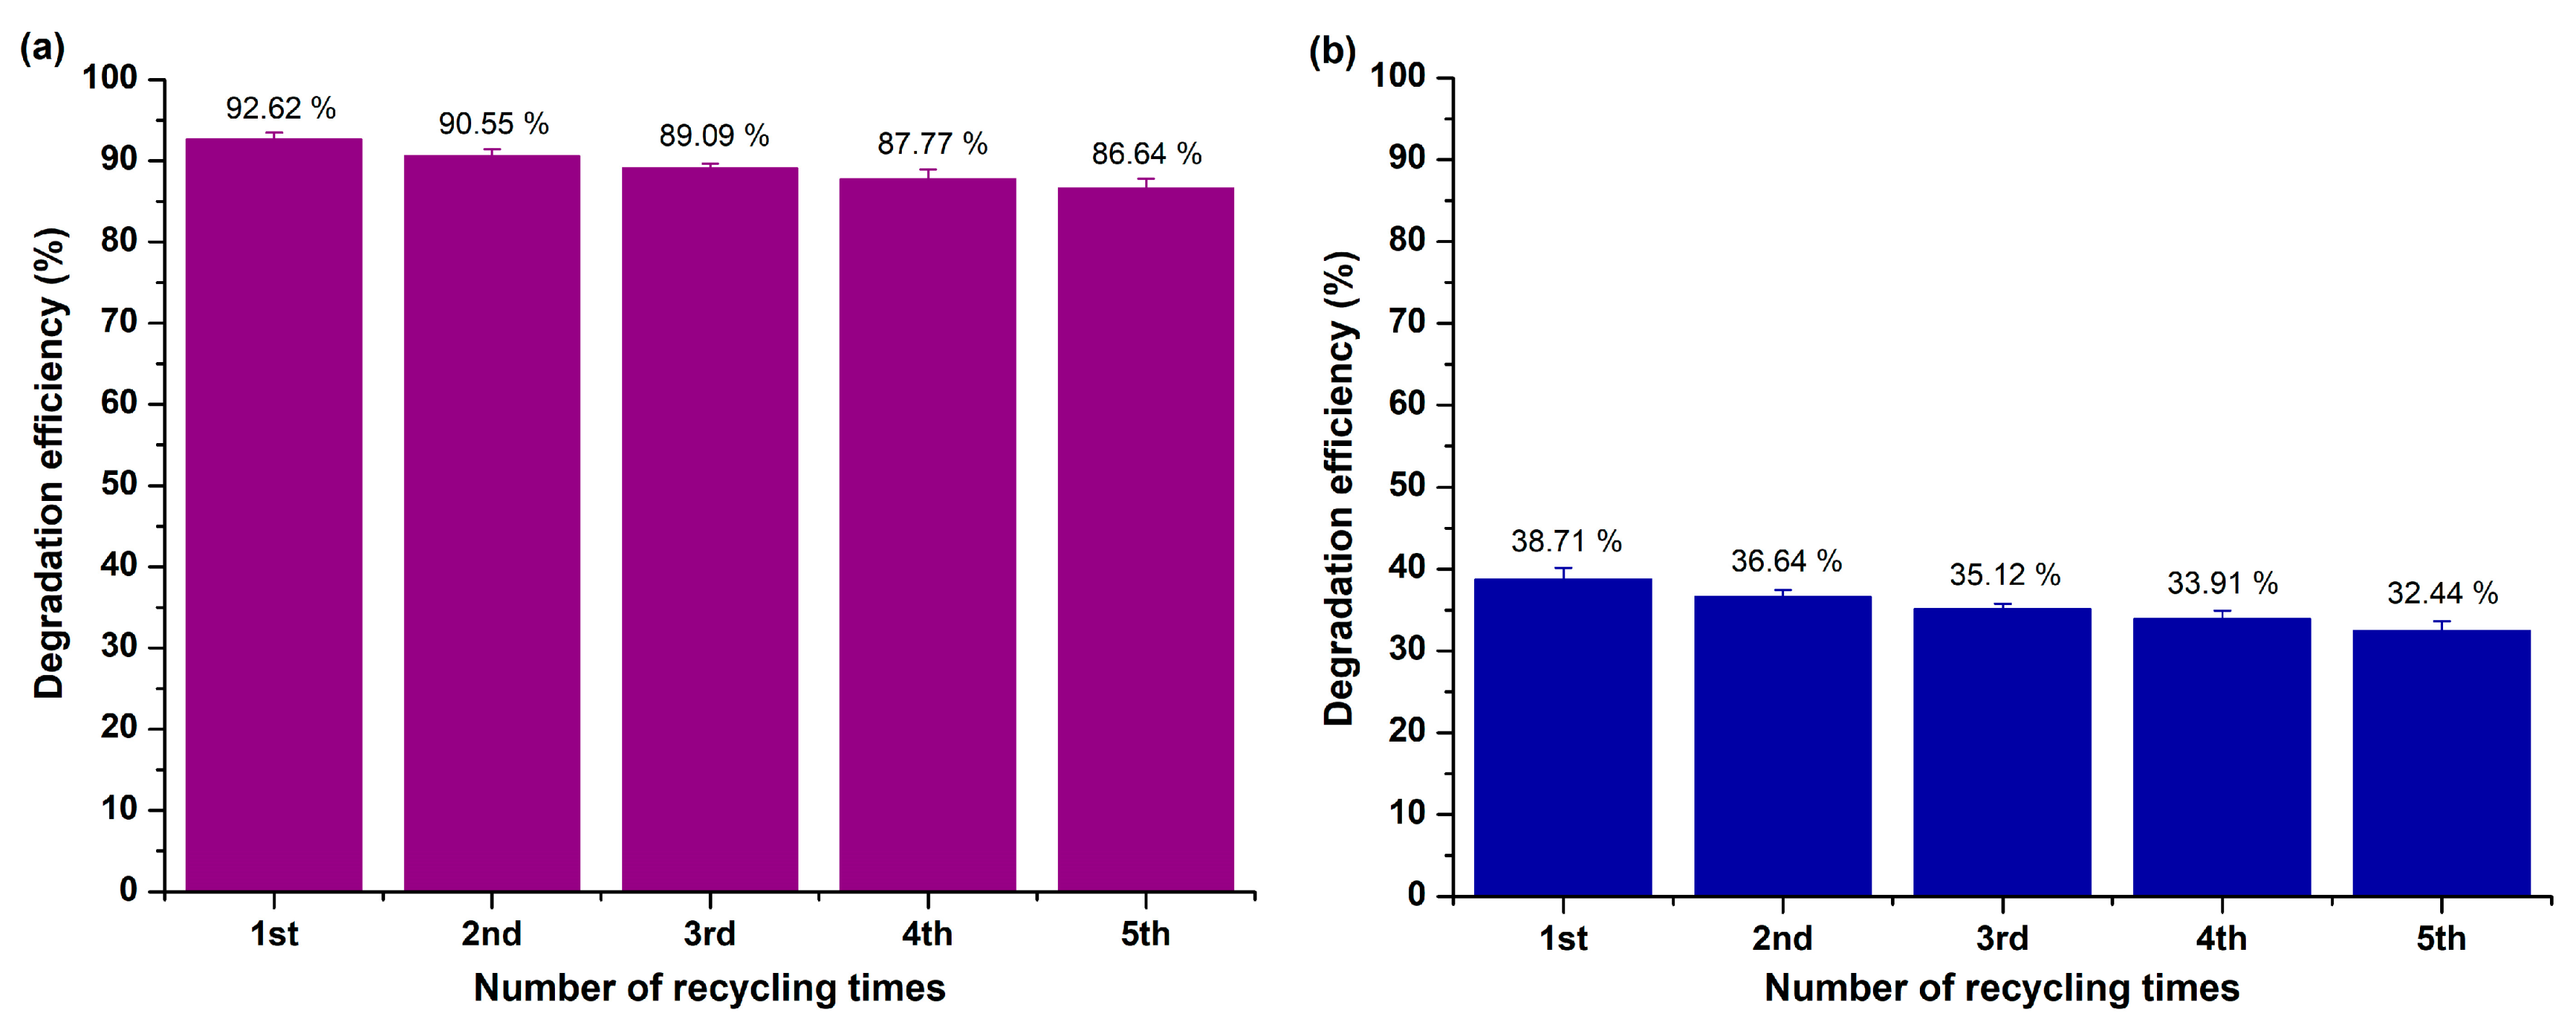
Reusability Study
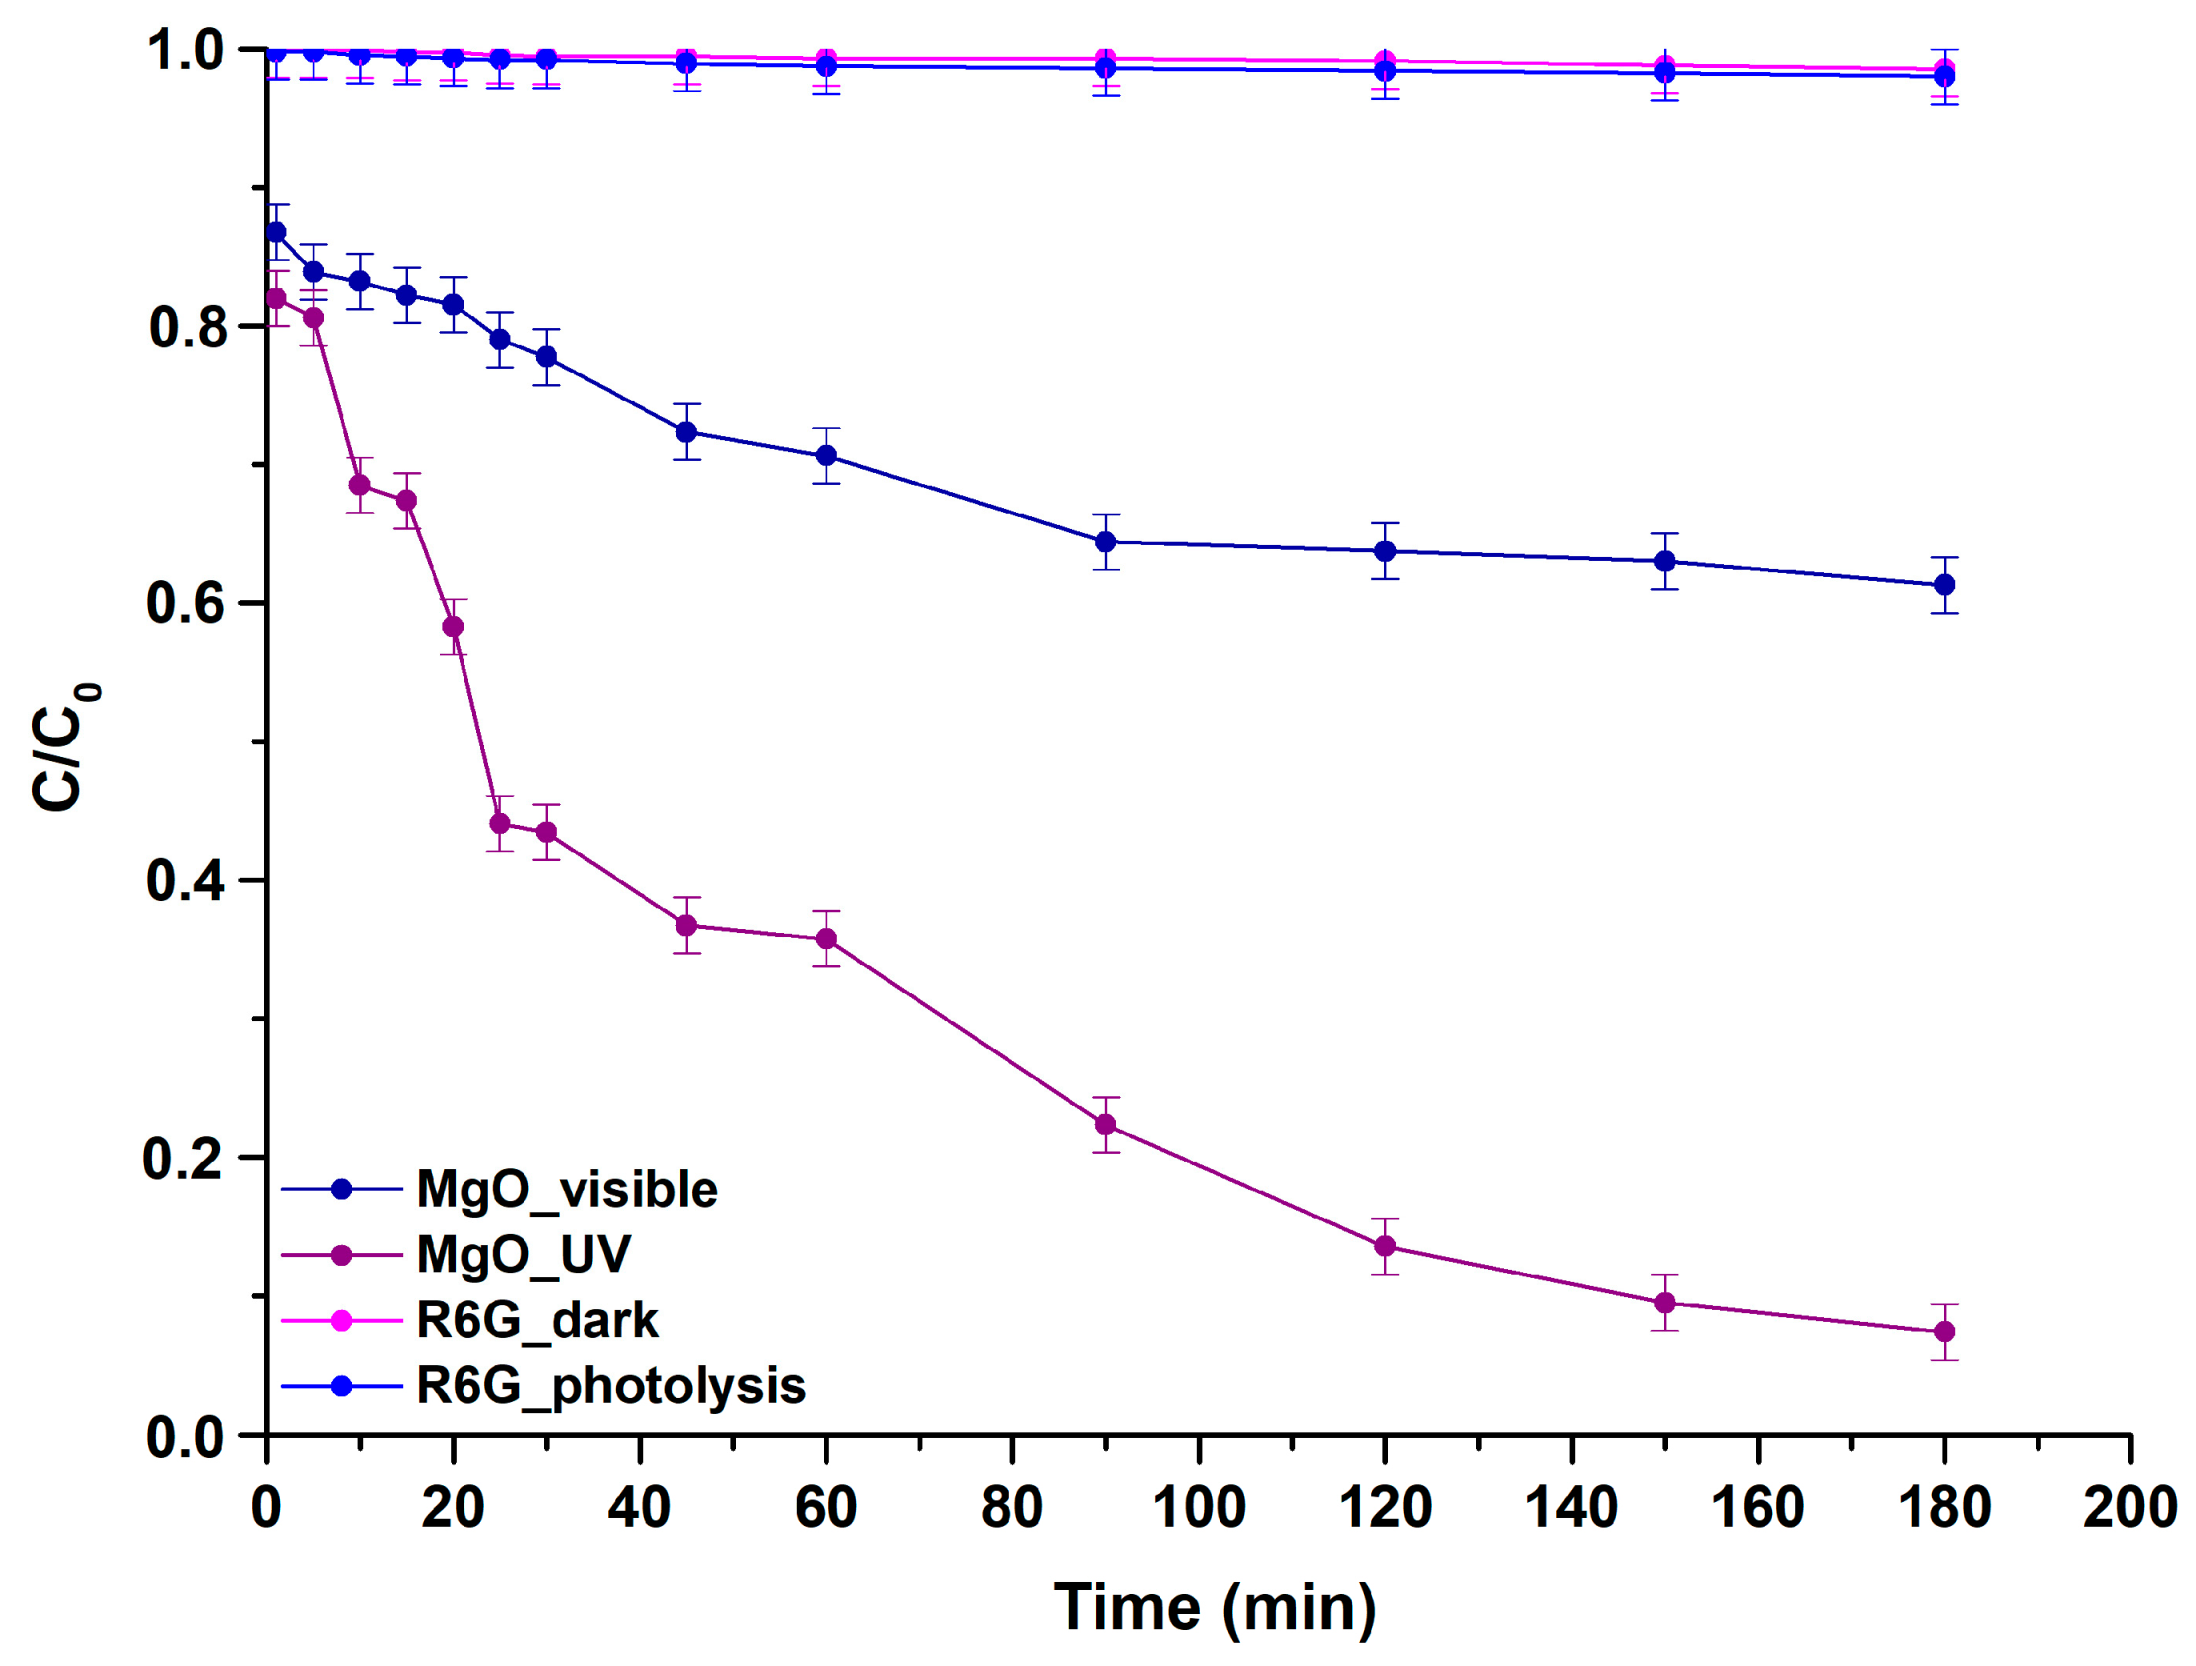
2.2.2. Study of the Photocatalytic Effectiveness towards Rhodamine 6G (R6G) Degradation
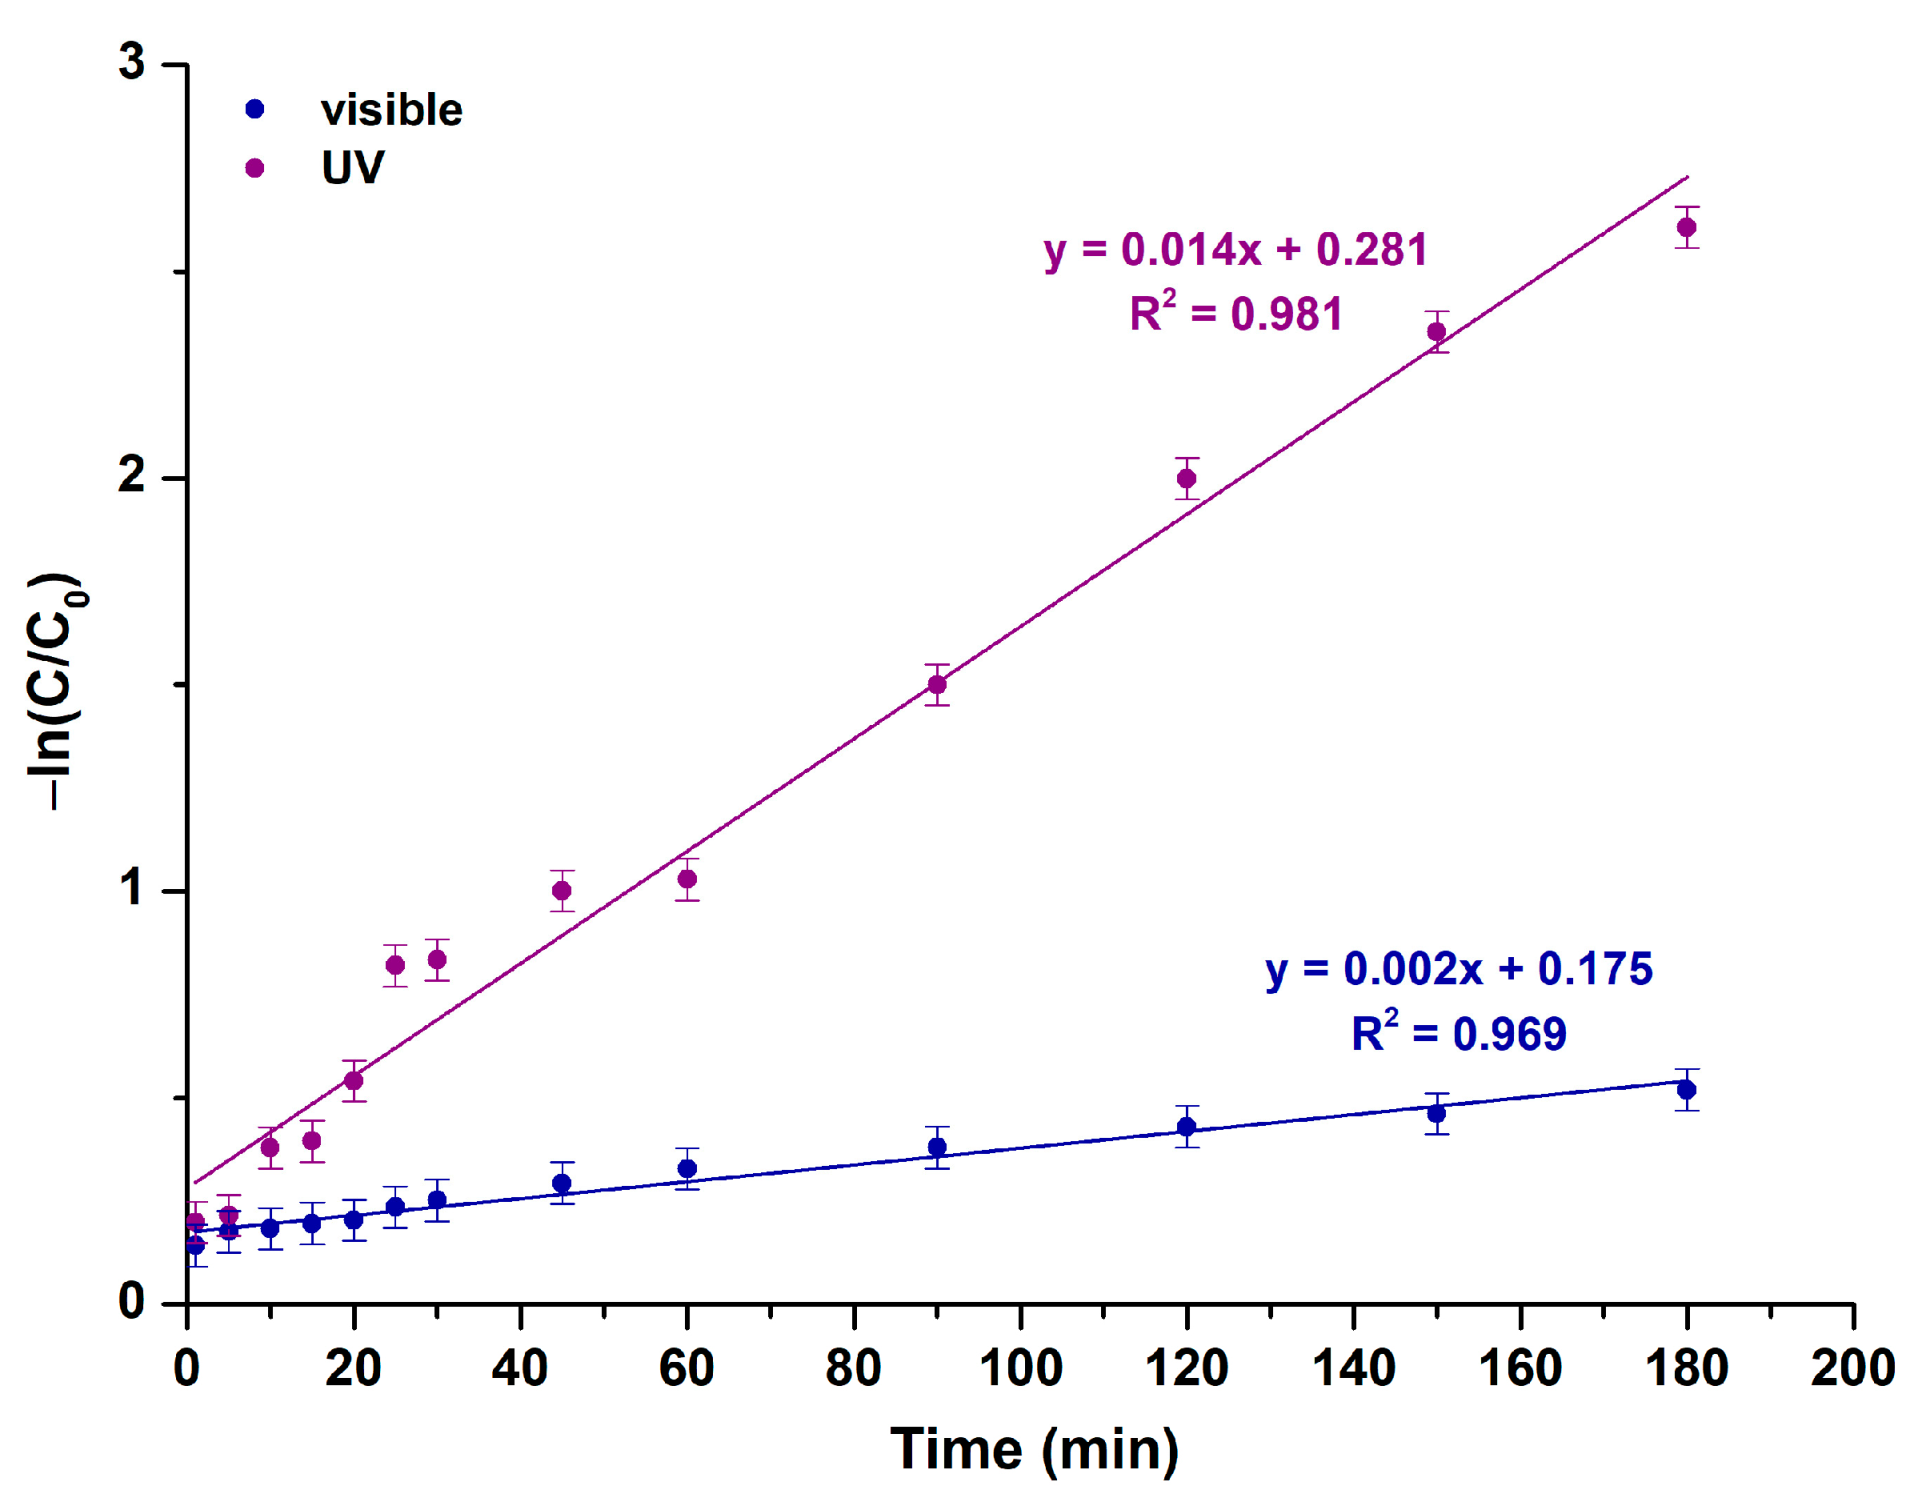
Study of R6G’s Photocatalytic Degradation Kinetics
Mechanism Study
Reusability Study
3. Discussion
4. Materials and Methods
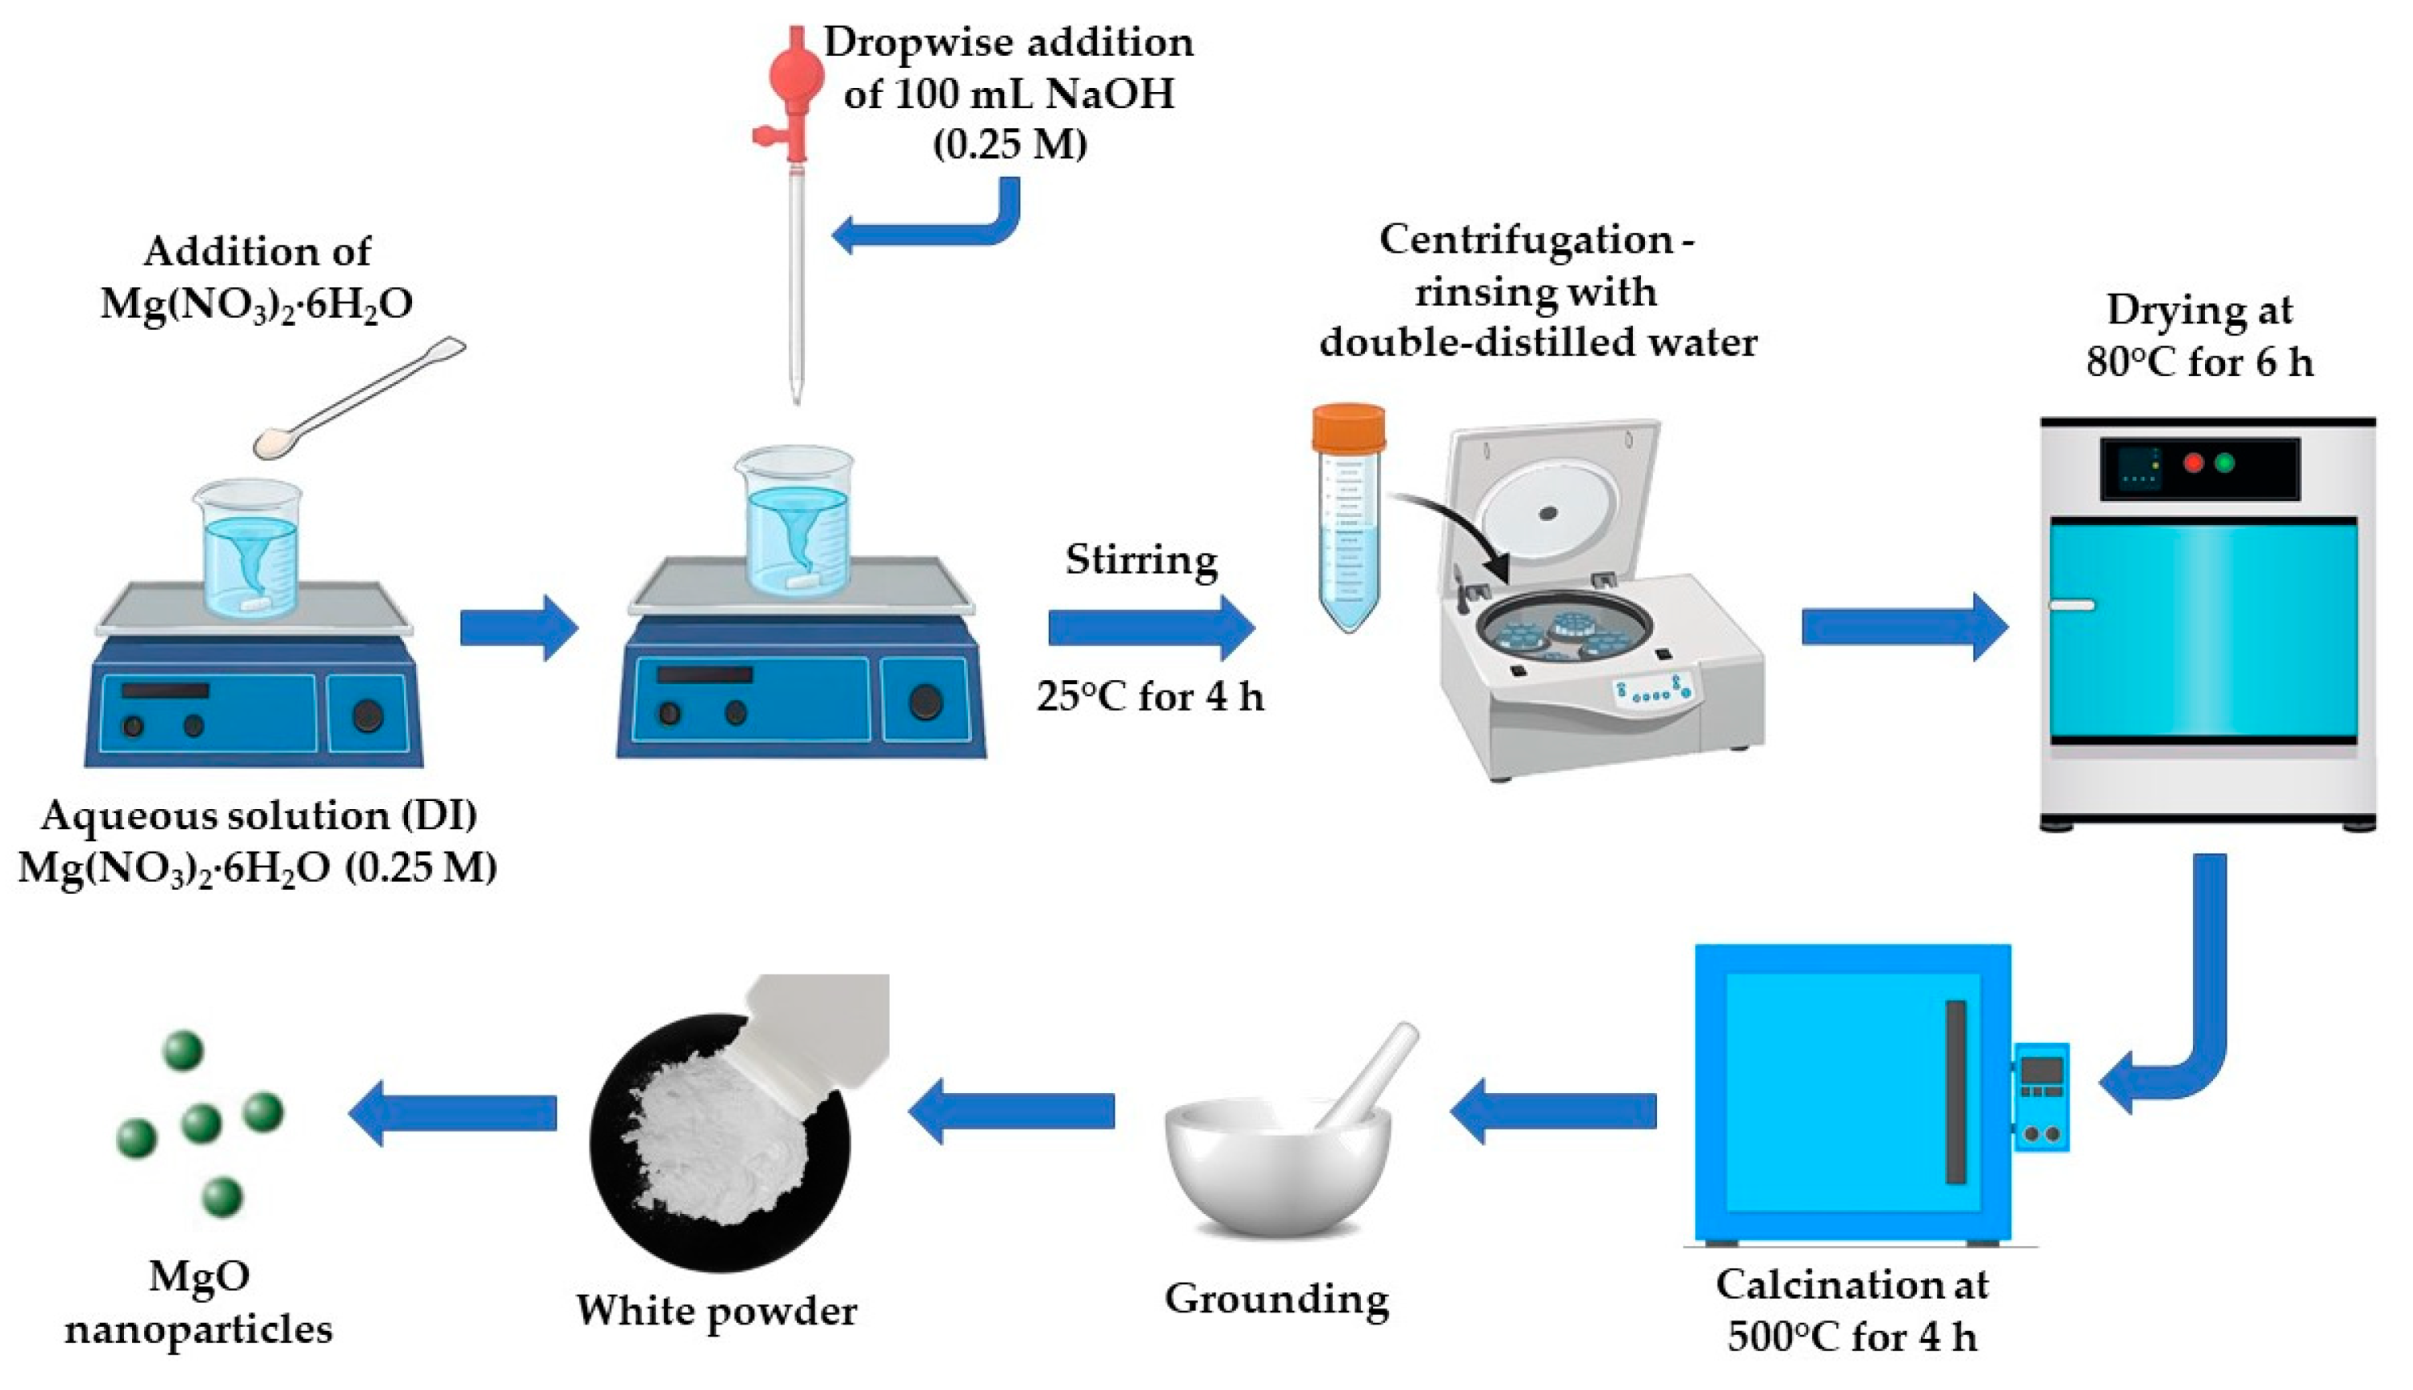
4.1. Synthesis of MgO Powder
4.2. Characterization of MgO Nanopowder
4.3. Photocatalytic Efficiency Study of MgO Nanopowder
5. Conclusions
Supplementary Materials
Author Contributions
Funding
Institutional Review Board Statement
Informed Consent Statement
Data Availability Statement
Acknowledgments
Conflicts of Interest
References
- Jaspal, D.; Malviya, A. Composites for wastewater purification: A review. Chemosphere 2020, 246, 125788. [Google Scholar] [CrossRef] [PubMed]
- Sharma, V.K.; Jinadatha, C.; Lichtfouse, E. Environmental chemistry is most relevant to study coronavirus pandemics. Environ. Chem. Lett. 2020, 18, 993–996. [Google Scholar] [CrossRef]
- Sarkar, S.; Banerjee, A.; Halder, U.; Biswas, R.; Bandopadhyay, R. Degradation of Synthetic Azo Dyes of Textile Industry: A Sustainable Approach Using Microbial Enzymes. Water Conserv. Sci. Eng. 2017, 2, 121–131. [Google Scholar] [CrossRef]
- Zare, E.N.; Motahari, A.; Sillanpää, M. Nanoadsorbents based on conducting polymer nanocomposites with main focus on polyaniline and its derivatives for removal of heavy metal ions/dyes: A review. Environ. Res. 2018, 162, 173–195. [Google Scholar] [CrossRef] [PubMed]
- Tara, N.; Siddiqui, S.; Rathi, G.; Inamuddin, I.; Asiri, A.M. Nano-engineered adsorbent for removal of dyes from water: A review. Curr. Anal. Chem. 2019, 16, 14–40. [Google Scholar] [CrossRef]
- Saeed, M.; Khan, I.; Adeel, M.; Akram, N.; Muneer, M. Synthesis of a CoO–ZnO photocatalyst for enhanced visible-light assisted photodegradation of methylene blue. New J. Chem. 2022, 46, 2224–2231. [Google Scholar] [CrossRef]
- Kocijan, M.; Ćurković, L.; Vengust, D.; Radošević, T.; Shvalya, V.; Gonçalves, G.; Podlogar, M. Synergistic remediation of organic dye by titanium dioxide/reduced graphene oxide nanocomposite. Molecules 2023, 28, 7326. [Google Scholar] [CrossRef]
- Ngoc, P.K.; Mac, T.K.; Nguyen, H.T.; Thanh, T.D.; Van Vinh, P.; Phan, B.T.; Duong, A.T.; Das, R. Superior organic dye removal by CoCr2O4 nanoparticles: Adsorption kinetics and isotherm. J. Sci. Adv. Mater. Devices 2022, 7, 100438. [Google Scholar] [CrossRef]
- Zehentbauer, F.M.; Moretto, C.; Stephen, R.; Thevar, T.; Gilchrist, J.R.; Pokrajac, D.; Richard, K.L.; Kiefer, J. Fluorescence spectroscopy of Rhodamine 6G: Concentration and solvent effects. Spectrochim. Acta Part A 2014, 121, 147–151. [Google Scholar] [CrossRef]
- Tarud, F.; Aybar, M.; Pizarro, G.; Cienfuegos, R.; Pastén, P. Integrating fluorescent dye flow-curve testing and acoustic Doppler velocimetry profiling for in situ hydraulic evaluation and improvement of clarifier performance. Water Environ. Res. 2010, 82, 675–685. [Google Scholar] [CrossRef]
- Wu, T.; Liu, G.; Zhao, J.; Hidaka, H.; Serpone, N. Photoassisted degradation of dye pollutants. v. self-photosensitized oxidative transformation of rhodamine b under visible light irradiation in aqueous TiO2 dispersions. Phys. Chem. B 1998, 102, 5845–5851. [Google Scholar] [CrossRef]
- Vanamudan, A.; Pamidimukkala, P. Chitosan, nanoclay and chitosan-nanoclay composite as adsorbents for Rhodamine-6G and the resulting optical properties. Int. J. Biol. Macromol. 2015, 74, 127–135. [Google Scholar] [CrossRef] [PubMed]
- Barranco, A.; Groening, P. Fluorescent plasma nanocomposite thin films containing nonaggregated rhodamine 6G laser dye molecules. Langmuir 2006, 22, 6719–6722. [Google Scholar] [CrossRef] [PubMed]
- Pino, E.; Calderón, C.; Herrera, F.; Cifuentes, G.; Arteaga, G. Photocatalytic degradation of aqueous rhodamine 6G using supported TiO2 catalysts. a model for the removal of organic contaminants from aqueous samples. Front. Chem. 2020, 8, 365. [Google Scholar] [CrossRef] [PubMed]
- Kassalia, M.-E.; Nikolaou, Z.; Pavlatou, E.A. Photocatalytic testing protocol for N-Doped TiO2 nanostructured particles under visible light irradiation using the statistical Taguchi experimental design. Appl. Sci. 2023, 13, 774. [Google Scholar] [CrossRef]
- Sansenya, T.; Masri, N.; Chankhanittha, T.; Senasu, T.; Piriyanon, J.; Mukdasai, S.; Nanan, S. Hydrothermal synthesis of ZnO photocatalyst for detoxification of anionic azo dyes and antibiotic. J. Phys. Chem. Solids 2022, 160, 110353. [Google Scholar] [CrossRef]
- Crini, G.; Lichtfouse, E. Advantages and disadvantages of techniques used for wastewater treatment. Environ. Chem. Lett. 2019, 17, 145–155. [Google Scholar] [CrossRef]
- Vaez, Z.; Javanbakht, V. Synthesis, characterization and photocatalytic activity of ZSM-5/ZnO nanocomposite modified by Ag nanoparticles for methyl orange degradation. J. Photochem. Photobiol. A 2020, 388, 112064. [Google Scholar] [CrossRef]
- Khataee, A.R.; Pons, M.N.; Zahraa, O. Photocatalytic degradation of three azo dyes using immobilized TiO2 nanoparticles on glass plates activated by UV light irradiation: Influence of dye molecular structure. J. Hazard. Mater. 2009, 168, 451–457. [Google Scholar] [CrossRef]
- John Peter, I.; Praveen, E.; Vignesh, G.; Nithiananthi, P. ZnO nanostructures with different morphology for enhanced photocatalytic activity. Mater. Res. Express 2017, 4, 124003. [Google Scholar] [CrossRef]
- Ameen, S.; Akhtar, M.S.; Seo, H.K.; Shin, H.S. Mineralization of rhodamine 6G dye over rose flower-like ZnO nanomaterials. Mater. Lett. 2013, 113, 20–24. [Google Scholar] [CrossRef]
- Zhang, D.E.; Ren, L.Z.; Hao, X.Y.; Pan, B.B.; Wang, M.Y.; Ma, J.J.; Li, F.; Li, S.A.; Tong, Z.W. Synthesis and photocatalytic property of multilayered Co3O4. Appl. Surf. Sci. 2015, 355, 547–552. [Google Scholar] [CrossRef]
- Ani, I.J.; Akpan, U.G.; Olutoye, M.A.; Hameed, B.H. Photocatalytic degradation of pollutants in petroleum refinery wastewater by TiO2- and ZnO-based photocatalysts: Recent development. J. Clean. Prod. 2018, 205, 930–954. [Google Scholar] [CrossRef]
- Sinar Mashuri, S.I.; Ibrahim, M.L.; Kasim, M.F.; Mastuli, M.S.; Rashid, U.; Abdullah, A.H.; Islam, A.; Asikin Mijan, N.; Tan, Y.H.; Mansir, N.; et al. Photocatalysis for organic wastewater treatment: From the basis to current challenges for society. Catalysts 2020, 10, 1260. [Google Scholar] [CrossRef]
- Kuruthukulangara, N.; Asharani, I.V. Photocatalytic degradation of Rhodamine B, a carcinogenic pollutant, by MgO nanoparticles. Inorg. Chem. Commun. 2024, 160, 111873. [Google Scholar] [CrossRef]
- Abdel-Aziz, M.M.; Emam, T.M.; Elsherbiny, E.A. Bioactivity of magnesium oxide nanoparticles synthesized from cell filtrate of endobacterium Burkholderia rinojensis against Fusarium oxysporum. Mater. Sci. Eng. C Mater. Biol. Appl. 2020, 109, 110617. [Google Scholar] [CrossRef]
- Aničić, N.; Vukomanović, M.; Koklič, T.; Suvorov, D. Fewer defects in the surface slows the hydrolysis rate, decreases the ROS generation potential, and improves the non-ROS antimicrobial activity of MgO. Small 2018, 14, 1800205. [Google Scholar] [CrossRef]
- Anand, K.V.; Anugraga, A.R.; Kannan, M.; Singaravelu, G.; Govindaraju, K. Bio-engineered magnesium oxide nanoparticles as nano-priming agent for enhancing seed germination and seedling vigour of green gram (Vigna radiata L.). Mater. Lett. 2020, 271, 127792. [Google Scholar] [CrossRef]
- Verma, S.K.; Nisha, K.; Panda, P.K.; Patel, P.; Kumari, P.; Mallick, M.A.; Sarkar, B.; Das, B. Green synthesized MgO nanoparticles infer biocompatibility by reducing in vivo molecular nanotoxicity in embryonic zebrafish through arginine interaction elicited apoptosis. Sci. Total Environ. 2020, 713, 136521. [Google Scholar] [CrossRef]
- Baraket, L.; Ghorbel, A. Control preparation of aluminium chromium mixed oxides by sol-gel process. In Studies in Surface Science and Catalysis; Delmon, B., Jacobs, P.A., Maggi, R., Martens, J.A., Grange, P., Poncelet, G., Eds.; Preparation of Catalysts VII; Elsevier: Amsterdam, The Netherlands, 1998; Volume 118, pp. 657–667. [Google Scholar] [CrossRef]
- Heo, Y.J.; Park, S.J. Facile synthesis of MgO-modified carbon adsorbents with microwave-assisted methods: Effect of MgO particles and porosities on CO2 capture. Sci. Rep. 2017, 7, 5653. [Google Scholar] [CrossRef]
- Feng, S.H.; Li, G.H. Chapter 4—Hydrothermal and Solvothermal Syntheses. In Modern Inorganic Synthetic Chemistry, 2nd ed.; Xu, R., Xu, Y., Eds.; Elsevier: Amsterdam, The Netherlands, 2017; pp. 73–104. [Google Scholar] [CrossRef]
- Yeh, C.L. Combustion Synthesis: Principles and Applications. In Reference Module in Materials Science and Materials Engineering; Elsevier: Amsterdam, The Netherlands, 2016. [Google Scholar] [CrossRef]
- Rane, A.V.; Kanny, K.; Abitha, V.K.; Thomas, S. Methods for Synthesis of Nanoparticles and Fabrication of Nanocomposites. In Synthesis of Inorganic Nanomaterials; Mohan Bhagyaraj, S., Oluwafemi, O.S., Kalarikkal, N., Thomas, S., Eds.; Micro and Nano Technologies; Woodhead Publishing: Cambridge, UK, 2018; pp. 121–139. [Google Scholar] [CrossRef]
- Pal, G.; Rai, P.; Pandey, A. Green synthesis of nanoparticles: A greener approach for a cleaner future. In Green Synthesis, Characterization and Applications of Nanoparticles; Shukla, A.K., Iravani, S., Eds.; Micro and Nano Technologies; Elsevier: Amsterdam, The Netherlands, 2019; pp. 1–26. [Google Scholar] [CrossRef]
- Lai, Y.F.; Chaudouët, P.; Charlot, F.; Matko, I.; Dubourdieu, C. Magnesium oxide nanowires synthesized by pulsed liquid-injection metal organic chemical vapor deposition. Appl. Phys. Lett. 2009, 94, 022904. [Google Scholar] [CrossRef]
- Sirota, V.; Selemenev, V.; Kovaleva, M.; Pavlenko, I.; Mamunin, K.; Dokalov, V.; Prozorova, M. Synthesis of magnesium oxide nanopowder by thermal plasma using magnesium nitrate hexahydrate. Phys. Res. Int. 2016, 4, 6853405. [Google Scholar] [CrossRef]
- Gandhi, S.; Abiramipriya, P.; Pooja, N.; Jeyakumari, J.J.L.; Arasi, A.Y.; Dhanalakshmi, V.; Gopinathan, M.R.; Anbarasan, R. Synthesis and characterizations of nano-sized MgO and its nano composite with poly(vinyl alcohol). J. Non-Cryst. Solids 2011, 357, 181–185. [Google Scholar] [CrossRef]
- Bartley, J.K.; Xu, C.; Lloyd, R.; Enache, D.I.; Knight, D.W.; Hutchings, G.J. Simple method to synthesize high surface area magnesium oxide and its use as a heterogeneous base catalyst. Appl. Catal. B 2012, 128, 31–38. [Google Scholar] [CrossRef]
- Zhang, H.; Hu, J.; Xie, J.; Wang, S.; Cao, Y. A solid-state chemical method for synthesizing MgO nanoparticles with superior adsorption properties. RSC Adv. 2019, 9, 2011–2017. [Google Scholar] [CrossRef]
- Gatou, M.-A.; Skylla, E.; Dourou, P.; Pippa, N.; Gazouli, M.; Lagopati, N.; Pavlatou, E.A. Magnesium oxide (MgO) nanoparticles: Synthetic strategies and biomedical applications. Crystals 2024, 14, 215. [Google Scholar] [CrossRef]
- Jeevanandam, J.; Chan, Y.S.; Danquah, M.K. Calcination-dependent morphology transformation of sol-gel-synthesized MgO nanoparticles. ChemistrySelect 2017, 2, 10393–10404. [Google Scholar] [CrossRef]
- Mirzaei, H.; Davoodnia, A. Microwave assisted sol-gel synthesis of MgO nanoparticles and their catalytic activity in the synthesis of hantzsch 1,4-dihydropyridines. Chin. J. Catal. 2012, 33, 1502–1507. [Google Scholar] [CrossRef]
- Wong, C.W.; Chan, Y.S.; Jeevanandam, J.; Pal, K.; Bechelany, M.; Abd Elkodous, M.; El-Sayyad, G.S. Response surface methodology optimization of mono-dispersed MgO nanoparticles fabricated by ultrasonic-assisted sol-gel method for outstanding antimicrobial and antibiofilm activities. J. Clust. Sci. 2020, 31, 367–389. [Google Scholar] [CrossRef]
- Mashayekh-Salehi, A.; Moussavi, G.; Yaghmaeian, K. Preparation, characterization and catalytic activity of a novel mesoporous nanocrystalline MgO nanoparticle for ozonation of acetaminophen as an emerging water contaminant. Chem. Eng. J. 2017, 310, 157–169. [Google Scholar] [CrossRef]
- Gajengi, A.L.; Sasaki, T.; Bhanage, B.M. Mechanistic aspects of formation of MgO nanoparticles under microwave irradiation and its catalytic application. Adv. Powder Technol. 2017, 28, 1185–1192. [Google Scholar] [CrossRef]
- Najafi, A. A novel synthesis method of hierarchical mesoporous MgO nanoflakes employing carbon nanoparticles as the hard templates for photocatalytic degradation. Ceram. Int. 2017, 43, 5813–5818. [Google Scholar] [CrossRef]
- John Sushma, N.; Prathyusha, D.; Swathi, G.; Madhavi, T.; Deva Prasad Raju, B.; Mallikarjuna, K.; Kim, H.S. Facile approach to synthesize magnesium oxide nanoparticles by using Clitoria ternatea-characterization and in vitro antioxidant studies. Appl. Nanosci. 2016, 6, 437–444. [Google Scholar] [CrossRef]
- Aljabali, A.A.A.; Obeid, M.A.; Bakshi, H.A.; Alshaer, W.; Ennab, R.M.; Al-Trad, B.; Al Khateeb, W.; Al-Batayneh, K.M.; Al-Kadash, A.; Alsotari, S.; et al. Synthesis, characterization, and assessment of anti-cancer potential of ZnO nanoparticles in an in vitro model of breast cancer. Molecules 2022, 27, 1827. [Google Scholar] [CrossRef] [PubMed]
- Almontasser, A.; Parveen, A.; Azam, A. Synthesis, Characterization and antibacterial activity of magnesium oxide (MgO) nanoparticles. IOP Conf. Ser. Mater. Sci. Eng. 2019, 577, 012051. [Google Scholar] [CrossRef]
- Limón-Rocha, I.; Guzmán-González, C.A.; Anaya-Esparza, L.M.; Romero-Toledo, R.; Rico, J.L.; González-Vargas, O.A.; Pérez-Larios, A. Effect of the precursor on the synthesis of ZnO and its photocatalytic activity. Inorganics 2022, 10, 16. [Google Scholar] [CrossRef]
- Levin, A.A.; Narykova, M.V.; Lihachev, A.I.; Kardashev, B.K.; Kadomtsev, A.G.; Brunkov, P.N.; Panfilov, A.G.; Prasolov, N.D.; Sultanov, M.M.; Kuryanov, V.N.; et al. Modification of the structural, microstructural, and elastoplastic properties of aluminum wires after operation. Metals 2021, 11, 1955. [Google Scholar] [CrossRef]
- Gatou, M.-A.; Fiorentis, E.; Lagopati, N.; Pavlatou, E.A. Photodegradation of rhodamine B and phenol using TiO2/SiO2 composite nanoparticles: A comparative study. Water 2023, 15, 2773. [Google Scholar] [CrossRef]
- Rani, N.; Chahal, S.; Chauhan, A.S.; Kumar, P.; Shukla, R.; Singh, S.K. X-ray analysis of MgO nanoparticles by modified Scherer’s Williamson-Hall and size-strain method. Mater. Today Proc. 2019, 12, 543–548. [Google Scholar] [CrossRef]
- Rosauer, E.A.; Handy, R.L. Crystallite-size determination of MgO by X-ray diffraction line broadening. Proc. Iowa Acad. Sci. 1961, 68, 357–371. Available online: https://scholarworks.uni.edu/pias/vol68/iss1/53 (accessed on 10 August 2024).
- Savita, S.; Jain, M.; Manju, M.; Vij, A.; Thakur, A. Impact of annealing on the structural properties of MgO nanoparticles by XRD analysis and Rietveld refinement. AIP Conf. Proc. 2019, 2093, 020024. [Google Scholar] [CrossRef]
- Boiocchi, M.; Caucia, F.; Merli, M.; Prella, D.; Ungaretti, L. Crystal-chemical reasons for the immiscibility of periclase and wüstite under lithospheric P, T conditions. Eur. J. Mineral. 2001, 13, 871–881. [Google Scholar] [CrossRef]
- Zak, A.K.; Majid, W.A.; Abrishami, M.E.; Yousefi, R. X-ray analysis of ZnO nanoparticles by Williamson-Hall and size-strain plot methods. Solid State Sci. 2011, 13, 251–256. [Google Scholar] [CrossRef]
- Tripathi, A.K.; Singh, M.K.; Mathpal, M.C.; Mishra, S.K.; Agarwal, A. Study of structural transformation in TiO2 nanoparticles and its optical properties. J. Alloys Compd. 2013, 549, 114–120. [Google Scholar] [CrossRef]
- Prabhu, R.R.; Abdul Khadar, M. Study of optical phonon modes of CdS nanoparticles using Raman spectroscopy. Bull. Mater. Sci. 2008, 31, 511–515. [Google Scholar] [CrossRef]
- Kurian, M.; Kunjachan, C. Investigation of size dependency on lattice strain of nanoceria particles synthesised by wet chemical methods. Int. Nano Lett. 2014, 4, 73–80. [Google Scholar] [CrossRef]
- Khaleel, W.A.; Sadeq, S.A.; Alani, I.A.M.; Ahmed, M.H.M. Magnesium oxide (MgO) thin film as saturable absorber for passively mode locked erbium-doped fiber laser. Opt. Laser Technol. 2019, 115, 331–336. [Google Scholar] [CrossRef]
- Sutradhar, N.; Sinhamahapatra, A.; Pahari, S.K.; Pal, P.; Bajaj, H.C.; Mukhopadhyay, I.; Panda, A.B. Controlled synthesis of different morphologies of MgO and their use as solid base catalysts. J. Phys. Chem. C 2011, 115, 12308–12316. [Google Scholar] [CrossRef]
- Kaningini, G.A.; Azizi, S.; Nyoni, H.; Mudau, F.N.; Mohale, K.C.; Maaza, M. Green synthesis and characterization of zinc oxide nanoparticles using bush tea (Athrixia phylicoides DC) natural extract: Assessment of the synthesis process. F1000Research 2021, 10, 1077. [Google Scholar] [CrossRef]
- Al-Arjan, W.S. Zinc oxide nanoparticles and their application in adsorption of toxic dye from aqueous solution. Polymers 2022, 14, 3086. [Google Scholar] [CrossRef]
- Thommes, M.; Kaneko, K.; Neimark, A.; Olivier, J.; Rodriguez-Reinoso, F.; Rouquerol, J.; Sing, K. Physisorption of gases, with special reference to the evaluation of surface area and pore size distribution (IUPAC Technical Report). Pure Appl. Chem. 2015, 87, 1051–1069. [Google Scholar] [CrossRef]
- Turcu, E.; Coromelci, C.G.; Harabagiu, V.; Ignat, M. Enhancing the photocatalytic activity of TiO2 for the degradation of Congo red dye by adjusting the ultrasonication regime applied in its synthesis procedure. Catalysts 2023, 13, 345. [Google Scholar] [CrossRef]
- Khairallah, F.; Glisenti, A. XPS study of MgO nanopowders obtained by different preparation procedures. Surf. Sci. Spectra 2006, 13, 58–71. [Google Scholar] [CrossRef]
- Ardizzone, S.; Bianchi, C.L.; Fadoni, M.; Vercelli, B. Magnesium salts and oxide: An XPS overview. Appl. Surf. Sci. 1997, 119, 253–259. [Google Scholar] [CrossRef]
- Proniewicz, E.; Vijayan, A.M.; Surma, O.; Szkudlarek, A.; Molenda, M. Plant-assisted green synthesis of MgO nanoparticles as a sustainable material for bone regeneration: Spectroscopic properties. Int. J. Mol. Sci. 2024, 25, 4242. [Google Scholar] [CrossRef] [PubMed]
- Srivastava, V.; Sharma, Y.C.; Sillanpää, M. Green synthesis of magnesium oxide nanoflower and its application for the removal of divalent metallic species from synthetic wastewater. Ceram. Int. 2015, 41, 6702–6709. [Google Scholar] [CrossRef]
- Mourdikoudis, S.; Pallares, R.M.; Thanh, N.T. Characterization techniques for nanoparticles: Comparison and complementarity upon studying nanoparticle properties. Nanoscale 2018, 10, 12871–12934. [Google Scholar] [CrossRef]
- Bélteky, P.; Rónavári, A.; Zakupszky, D.; Boka, E.; Igaz, N.; Szerencsés, B.; Pfeiffer, I.; Vágvölgyi, C.; Kiricsi, M.; Kónya, Z. Are smaller nanoparticles always better? Understanding the biological effect of size-dependent silver nanoparticle aggregation under biorelevant conditions. Int. J. Nanomed. 2021, 16, 3021–3040. [Google Scholar] [CrossRef]
- Ramezani Farani, M.; Farsadrooh, M.; Zare, I.; Gholami, A.; Akhavan, O. Green synthesis of magnesium oxide nanoparticles and nanocomposites for photocatalytic antimicrobial, antibiofilm and antifungal applications. Catalysts 2023, 13, 642. [Google Scholar] [CrossRef]
- Danaei, M.; Dehghankhold, M.; Ataei, S.; Hasanzadeh Davarani, F.; Javanmard, R.; Dokhani, A.; Khorasani, S.; Mozafari, M.R. Impact of particle size and polydispersity index on the clinical applications of lipidic nanocarrier systems. Pharmaceutics 2018, 10, 57. [Google Scholar] [CrossRef]
- Yuan, T.; Gao, L.; Zhan, W.; Dini, D. Effect of particle size and surface charge on nanoparticles diffusion in the brain white matter. Pharm. Res. 2022, 39, 767–781. [Google Scholar] [CrossRef] [PubMed]
- Sharma, S.K.; Gupta, S.M. Preparation and evaluation of stable nanofluids for heat transfer application: A review. Exp. Therm Fluid Sci. 2016, 79, 202–212. [Google Scholar] [CrossRef]
- Gatou, M.-A.; Kontoliou, K.; Volla, E.; Karachalios, K.; Raptopoulos, G.; Paraskevopoulou, P.; Lagopati, N.; Pavlatou, E.A. Optimization of ZnO nanoparticles’ synthesis via precipitation method applying Taguchi robust design. Catalysts 2023, 13, 1367. [Google Scholar] [CrossRef]
- Kumar, A.; Kumar, J. On the synthesis and optical absorption studies of nano-size magnesium oxide powder. J. Phys. Chem. Solids 2008, 69, 2764–2772. [Google Scholar] [CrossRef]
- Kurth, M.; Graat, P.C.J.; Mittemeijer, E.J. The oxidation kinetics of magnesium at low temperatures and low oxygen partial pressures. Thin Solid Films 2006, 500, 61–69. [Google Scholar] [CrossRef]
- Sun, M.; Fang, Y.; Sun, S.; Wang, Y. Surface co-modification of TiO2 with N doping and Ag loading for enhanced visible-light photoactivity. RSC Adv. 2016, 6, 12272–12279. [Google Scholar] [CrossRef]
- Nagappa, B.; Chandrappa, G.T. Mesoporous nanocrystalline magnesium oxide for environmental remediation. Microporous Mesoporous Mater. 2007, 106, 212–218. [Google Scholar] [CrossRef]
- Lagopati, N.; Kitsiou, P.; Kontos, A.; Venieratos, P.; Kotsopoulou, E.; Kontos, A.; Dionysiou, D.; Pispas, S.; Tsilibary, E.; Falaras, P. Photo-induced treatment of breast epithelial cancer cells using nanostructured titanium dioxide solution. J. Photochem. Photobiol. A Chem. 2010, 214, 215–223. [Google Scholar] [CrossRef]
- Fu, H.; Pan, C.; Yao, W.; Zhu, Y. Visible-light-induced degradation of rhodamine B by nanosized Bi2WO6. J. Phys. Chem. B 2005, 109, 22432–22439. [Google Scholar] [CrossRef]
- Uribe-López, M.C.; Hidalgo-López, M.C.; López-González, R.; Frías-Márquez, D.M.; Núñez-Nogueira, G.; Hernández-Castillo, D.; Alvarez-Lemus, M.A. Photocatalytic activity of ZnO nanoparticles and the role of the synthesis method on their physical and chemical properties. J. Photochem. Photobiol. A 2021, 404, 112866. [Google Scholar] [CrossRef]
- Dodoo-Arhin, D.; Asiedu, T.; Agyei-Tuffour, B.; Nyankson, E.; Obada, D.; Mwabora, J.M. Photocatalytic degradation of Rhodamine dyes using zinc oxide nanoparticles. Mater. Today Proc. 2021, 38, 809–815. [Google Scholar] [CrossRef]
- Hu, C.; Lu, T.; Chen, F.; Zhang, R.; Lian, C.; Zheng, S.; Hu, Q.; Duo, S. Enhancement of photocatalytic performance of TiO2 produced by an alcohothermal approach through inclusion of water. Mater. Res. Bull. 2014, 53, 42–48. [Google Scholar] [CrossRef]
- Bhatkhande, D.S.; Pangarkar, V.G.; Beenackers, A.A.C.M. Photocatalytic degradation for environmental applications-a review. J. Chem. Technol. Biotechnol. 2002, 77, 102–116. [Google Scholar] [CrossRef]
- Kader, D.A.; Mohammed, S.J. Emerging developments in dye-sensitized metal oxide photocatalysis: Exploring the design, mechanisms, and organic synthesis applications. RSC Adv. 2023, 13, 26484–26508. [Google Scholar] [CrossRef] [PubMed]
- Trenczek-Zajac, A.; Synowiec, M.; Zakrzewska, K.; Zazakowny, K.; Kowalski, K.; Dziedzic, A.; Radecka, M. Scavenger-supported photocatalytic evidence of an extended type I electronic structure of the TiO2@Fe2O3 interface. ACS Appl. Mater. Interfaces 2022, 14, 38255–38269. [Google Scholar] [CrossRef] [PubMed]
- Algethami, F.K.; Katouah, H.A.; Al-Omar, M.A.; Almehizia, A.A.; Amr, A.E.G.E.; Naglah, A.M.; Al-Shakliah, N.S.; Fetoh, M.E.; Youssef, H.M. Facile synthesis of magnesium oxide nanoparticles for studying their photocatalytic activities against orange G dye and biological activities against some bacterial and fungal strains. J. Inorg. Organomet. Polym. Mater. 2021, 31, 2150–2160. [Google Scholar] [CrossRef]
- Farhadian, N.; Akbarzadeh, R.; Pirsaheb, M.; Jen, T.C.; Fakhri, Y.; Asadi, A. Chitosan modified N, S-doped TiO2 and N, S-doped ZnO for visible light photocatalytic degradation of tetracycline. Int. J. Biol. Macromol. 2019, 132, 360–373. [Google Scholar] [CrossRef]
- Iskandar, F.; Nandiyanto, A.; Yun, K.; Hogan, C., Jr.; Okuyama, K.; Biswas, P. Enhanced photocatalytic performance of brookite TiO2 macroporous particles prepared by spray drying with colloidal templating. Adv. Mater. 2007, 19, 1408–1412. [Google Scholar] [CrossRef]
- Mohod, A.V.; Momotko, M.; Shah, N.S.; Marchel, M.; Imran, M.; Kong, L.; Boczkaj, G. Degradation of Rhodamine dyes by Advanced Oxidation Processes (AOPs)-Focus on caviatation and photocatalysis—A critical review. Water Resour. Ind. 2023, 30, 100220. [Google Scholar] [CrossRef]
- Chen, F.; Zhao, J.; Hidaka, H. Highly selective deethylation of rhodamine B: Adsorption and photooxidation pathways of the dye on the TiO2/SiO2 composite photocatalyst. Int. J. Photoenergy 2003, 5, 674957. [Google Scholar] [CrossRef]
- Taniguchi, M.; Lindsey, J.S. Database of absorption and fluorescence spectra of> 300 common compounds for use in photochem CAD. J. Photochem. Photobiol. 2018, 94, 290–327. [Google Scholar] [CrossRef] [PubMed]
- Sudrajat, H.; Babel, S. Comparison and mechanism of photocatalytic activities of N-ZnO and N-ZrO2 for the degradation of rhodamine 6G. Environ. Sci. Pollut. Res. 2016, 23, 10177–10188. [Google Scholar] [CrossRef] [PubMed]
- Gatou, M.-A.; Lagopati, N.; Vagena, I.-A.; Gazouli, M.; Pavlatou, E.A. ZnO nanoparticles from different precursors and their photocatalytic potential for biomedical use. Nanomaterials 2023, 13, 122. [Google Scholar] [CrossRef] [PubMed]
- Ruíz-Santoyo, V.; Marañon-Ruiz, V.F.; Romero-Toledo, R.; González Vargas, O.A.; Pérez-Larios, A. Photocatalytic degradation of Rhodamine B and methylene orange using TiO2-ZrO2 as nanocomposite. Catalysts 2021, 11, 1035. [Google Scholar] [CrossRef]
- Tsoukleris, D.S.; Gatou, M.-A.; Lagopati, N.; Sygellou, L.; Christodouleas, D.C.; Falaras, P.; Pavlatou, E.A. Chemically modified TiO2 photocatalysts as an alternative disinfection approach for municipal wastewater treatment plant effluents. Water 2023, 15, 2052. [Google Scholar] [CrossRef]
- Yudasari, N.; Anugrahwidya, R.; Tahir, D.; Suliyanti, M.M.; Herbani, Y.; Imawan, C.; Khalil, M.; Djuhana, D. Enhanced photocatalytic degradation of rhodamine 6G (R6G) using ZnO–Ag nanoparticles synthesized by pulsed laser ablation in liquid (PLAL). J. Alloys Compd. 2021, 886, 161291. [Google Scholar] [CrossRef]
- Phindile Khoza, P.; Nyokong, T. Visible light transformation of Rhodamine 6G using tetracarbazole zinc phthalocyanine when embedded in electrospun fibers and in the presence of ZnO and Ag particles. J. Coord. Chem. 2015, 68, 1117–1131. [Google Scholar] [CrossRef]
- Karthikeyan, V.; Dhanapandian, S.; Manoharan, C. Characterization and antibacterial behavior of MgO-PEG nanoparticles synthesized via co-precipitation method. Int. Lett. Chem. Phys. Astron. 2016, 70, 33–41. [Google Scholar] [CrossRef]
- Mehta, M.; Mukhopadhyay, M.; Christian, R.; Mistry, N. Synthesis and characterization of MgO nanocrystals using strong and weak bases. Powder Technol. 2012, 226, 213–221. [Google Scholar] [CrossRef]
- Sugiarto, I.T.; Putri, K.Y. Analysis of dual peak emission from Rhodamine 6G organic dyes using photoluminescence. J. Phys. Conf. Ser. 2017, 817, 012047. [Google Scholar] [CrossRef]


| Synthetic Approach | Average Crystallite Size (nm) | Specific Surface Area (m2/g) | Reference |
|---|---|---|---|
| Sol–gel | 12–13 | - | [42] |
| Microwave-assisted sol–gel | 9.5–10.5 | 243.2 | [43] |
| Ultrasonic-assisted sol–gel | 19.2 | - | [44] |
| Modified thermal/sol–gel | 23.6 | 257.3 | [45] |
| Solid-state chemical | 10.5 | 213 | [40] |
| Microwave irradiation | 16 | 70 | [46] |
| Precipitation | 25 | 216.9 | [47] |
| Sample ID | Crystal Lattice Index (a = b = c) | Average Crystallite Size (D, nm) * | FWHM | CI (%) | ||
|---|---|---|---|---|---|---|
| a | b | c | ||||
| MgO | 4.2194 | 4.2194 | 4.2194 | 3.23 | 0.4562 | 80.49 |
| Bragg’s Angle | dhkl (Å) | dhkl (nm) | hkl | |
|---|---|---|---|---|
| 2θ | θ | |||
| 36.85 | 18.43 | 2.4372 | 0.2437 | 111 |
| 42.83 | 21.42 | 2.1097 | 0.2110 | 200 |
| 61.20 | 30.60 | 1.5132 | 0.1513 | 220 |
| 74.58 | 37.29 | 1.2714 | 0.1271 | 311 |
| 78.51 | 39.26 | 1.2173 | 0.1217 | 222 |
| Sample ID | BET Surface Area (m2/g) | Micropore Surface Area (m2/g) | Cumulative Pore Volume (cm3/g) | Average Pore Diameter (nm) |
|---|---|---|---|---|
| MgO | 52 | 2 | 0.3 | 21 |
| Sample ID | Hydrodynamic Diameter (Dh) (nm) | Zeta Potential (mV) | PDI |
|---|---|---|---|
| MgO | 27.11 ± 0.93 | −50.8 ± 0.6 | 0.197 ± 0.093 |
| Sample ID | Pseudo-First-Order Kinetic Model | Pseudo-Second-Order Kinetic Model | ||
|---|---|---|---|---|
| k1 (min−1) | R2 | k2 (g/mg·min) | R2 | |
| MgO (visible) | 0.002 | 0.974 | 10.747 | 0.778 |
| MgO (UV) | 0.012 | 0.982 | 5.545 | 0.906 |
| Sample ID | Pseudo-First-Order Kinetic Model | Pseudo-Second-Order Kinetic Model | ||
|---|---|---|---|---|
| k1 (min−1) | R2 | k2 (g/mg·min) | R2 | |
| MgO (visible) | 0.002 | 0.969 | 1.772 | 0.911 |
| MgO (UV) | 0.014 | 0.981 | 0.756 | 0.907 |
Disclaimer/Publisher’s Note: The statements, opinions and data contained in all publications are solely those of the individual author(s) and contributor(s) and not of MDPI and/or the editor(s). MDPI and/or the editor(s) disclaim responsibility for any injury to people or property resulting from any ideas, methods, instructions or products referred to in the content. |
© 2024 by the authors. Licensee MDPI, Basel, Switzerland. This article is an open access article distributed under the terms and conditions of the Creative Commons Attribution (CC BY) license (https://creativecommons.org/licenses/by/4.0/).
Share and Cite
Gatou, M.-A.; Bovali, N.; Lagopati, N.; Pavlatou, E.A. MgO Nanoparticles as a Promising Photocatalyst towards Rhodamine B and Rhodamine 6G Degradation. Molecules 2024, 29, 4299. https://doi.org/10.3390/molecules29184299
Gatou M-A, Bovali N, Lagopati N, Pavlatou EA. MgO Nanoparticles as a Promising Photocatalyst towards Rhodamine B and Rhodamine 6G Degradation. Molecules. 2024; 29(18):4299. https://doi.org/10.3390/molecules29184299
Chicago/Turabian StyleGatou, Maria-Anna, Natalia Bovali, Nefeli Lagopati, and Evangelia A. Pavlatou. 2024. "MgO Nanoparticles as a Promising Photocatalyst towards Rhodamine B and Rhodamine 6G Degradation" Molecules 29, no. 18: 4299. https://doi.org/10.3390/molecules29184299