

Structural and Magnetic Properties of Dimeric Capsule Assemblies Formed by Cyclic Trinuclear Complexes


Abstract
:
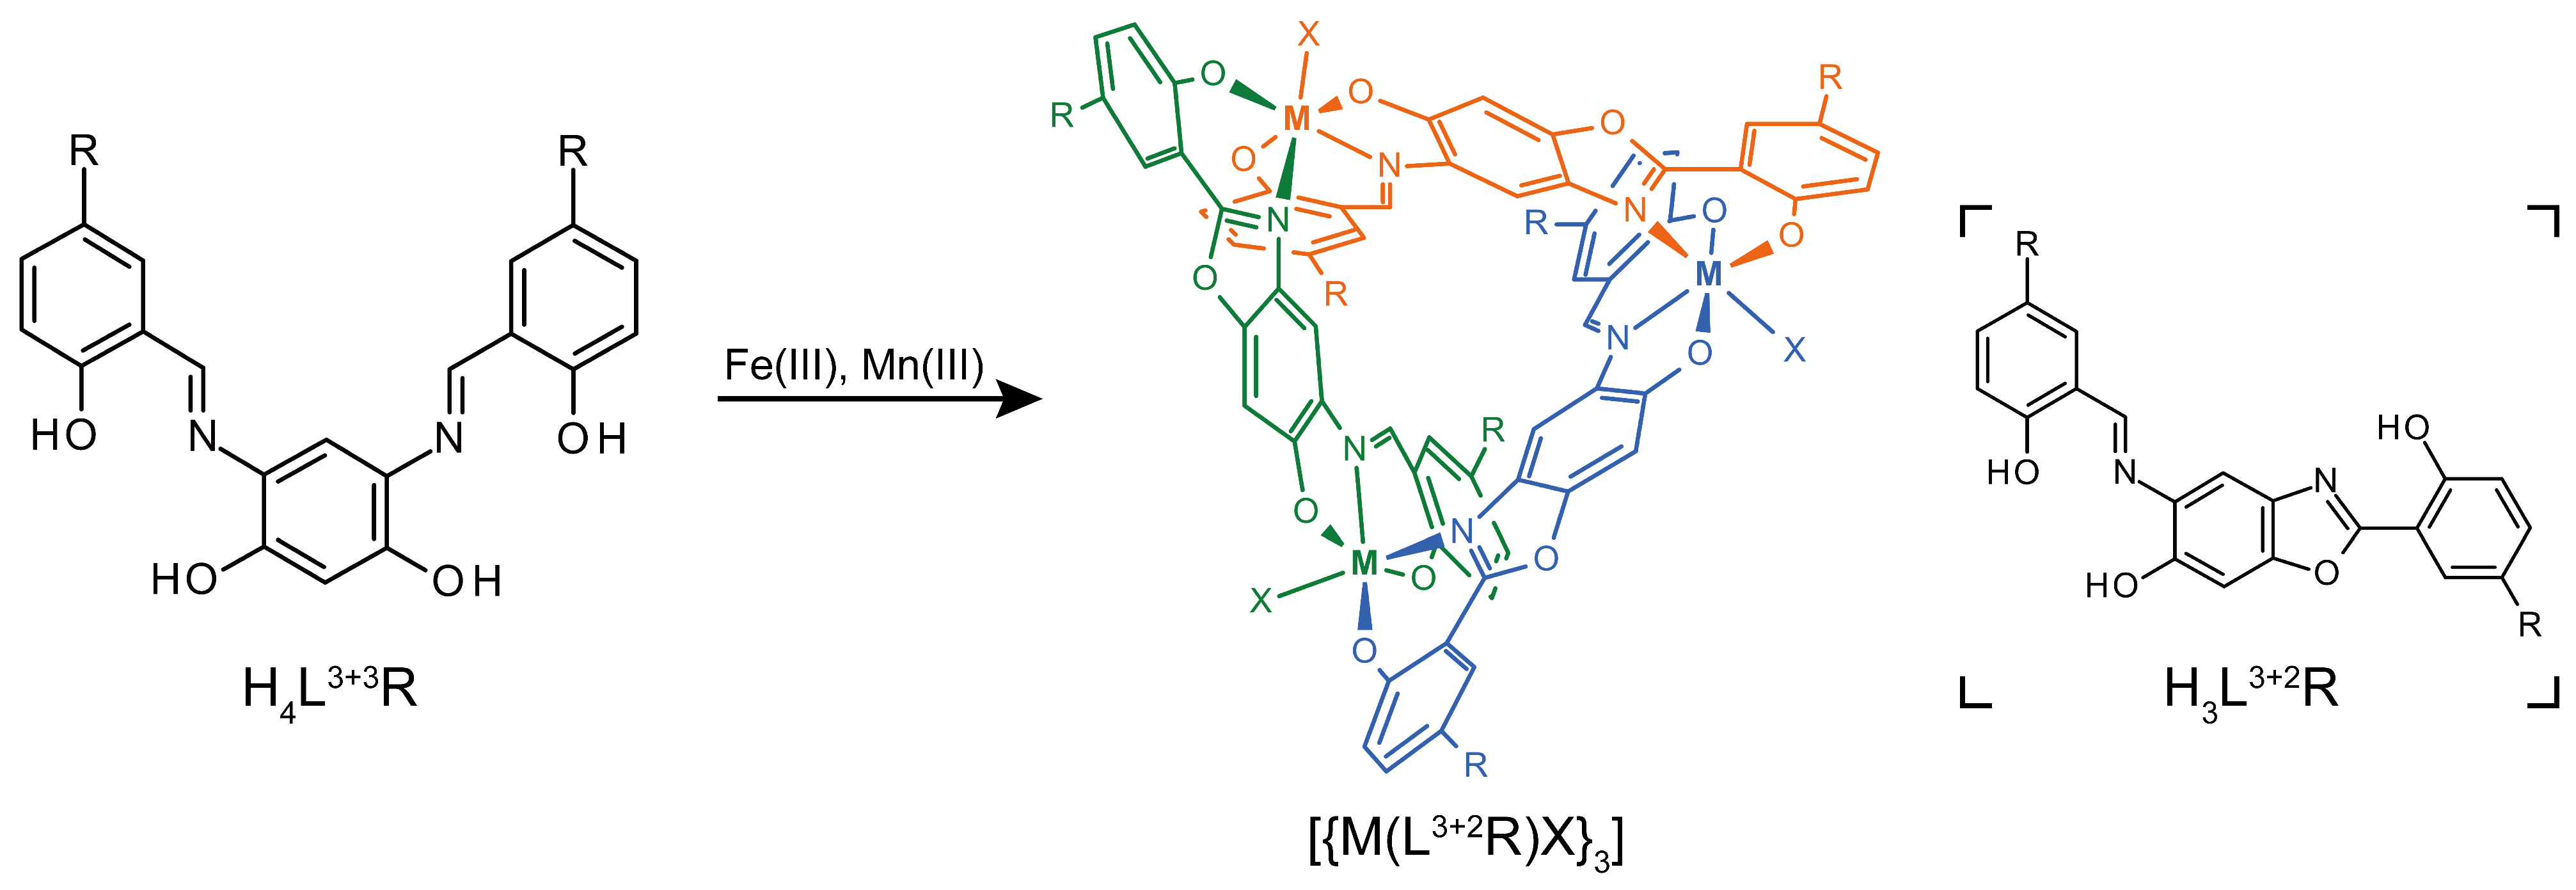
1. Introduction
2. Results and Discussion
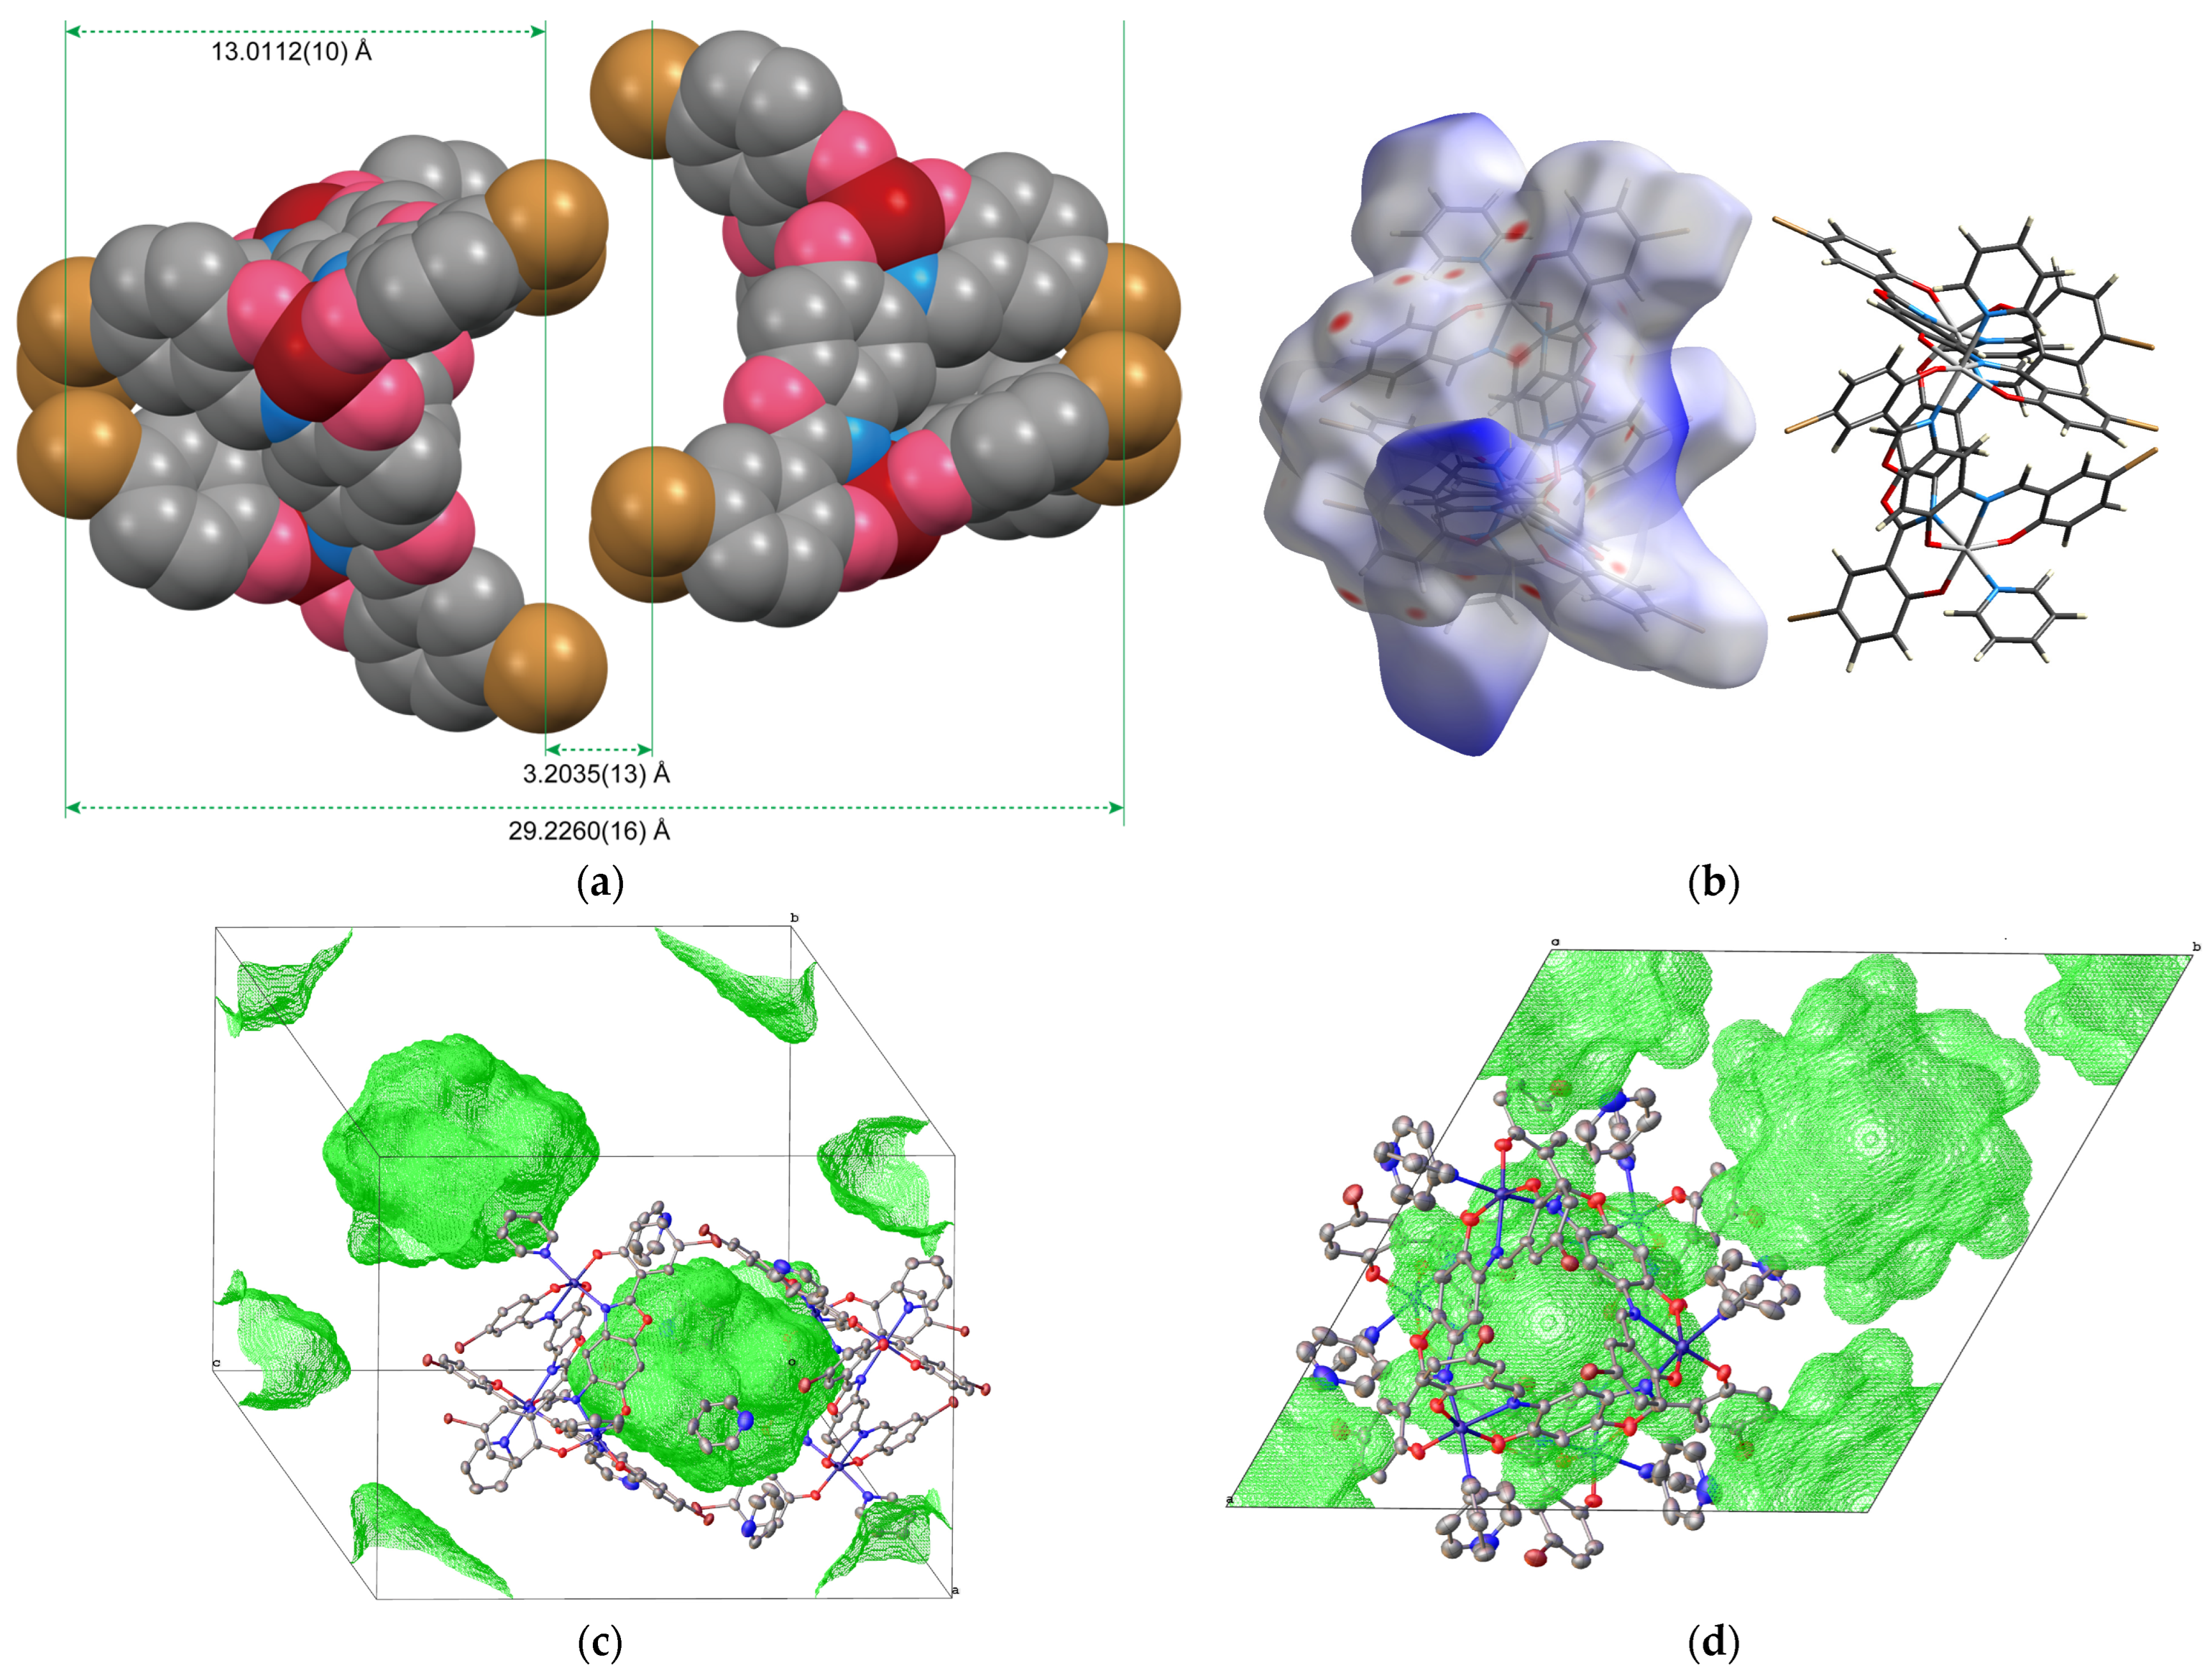
2.1. Crystal Structures
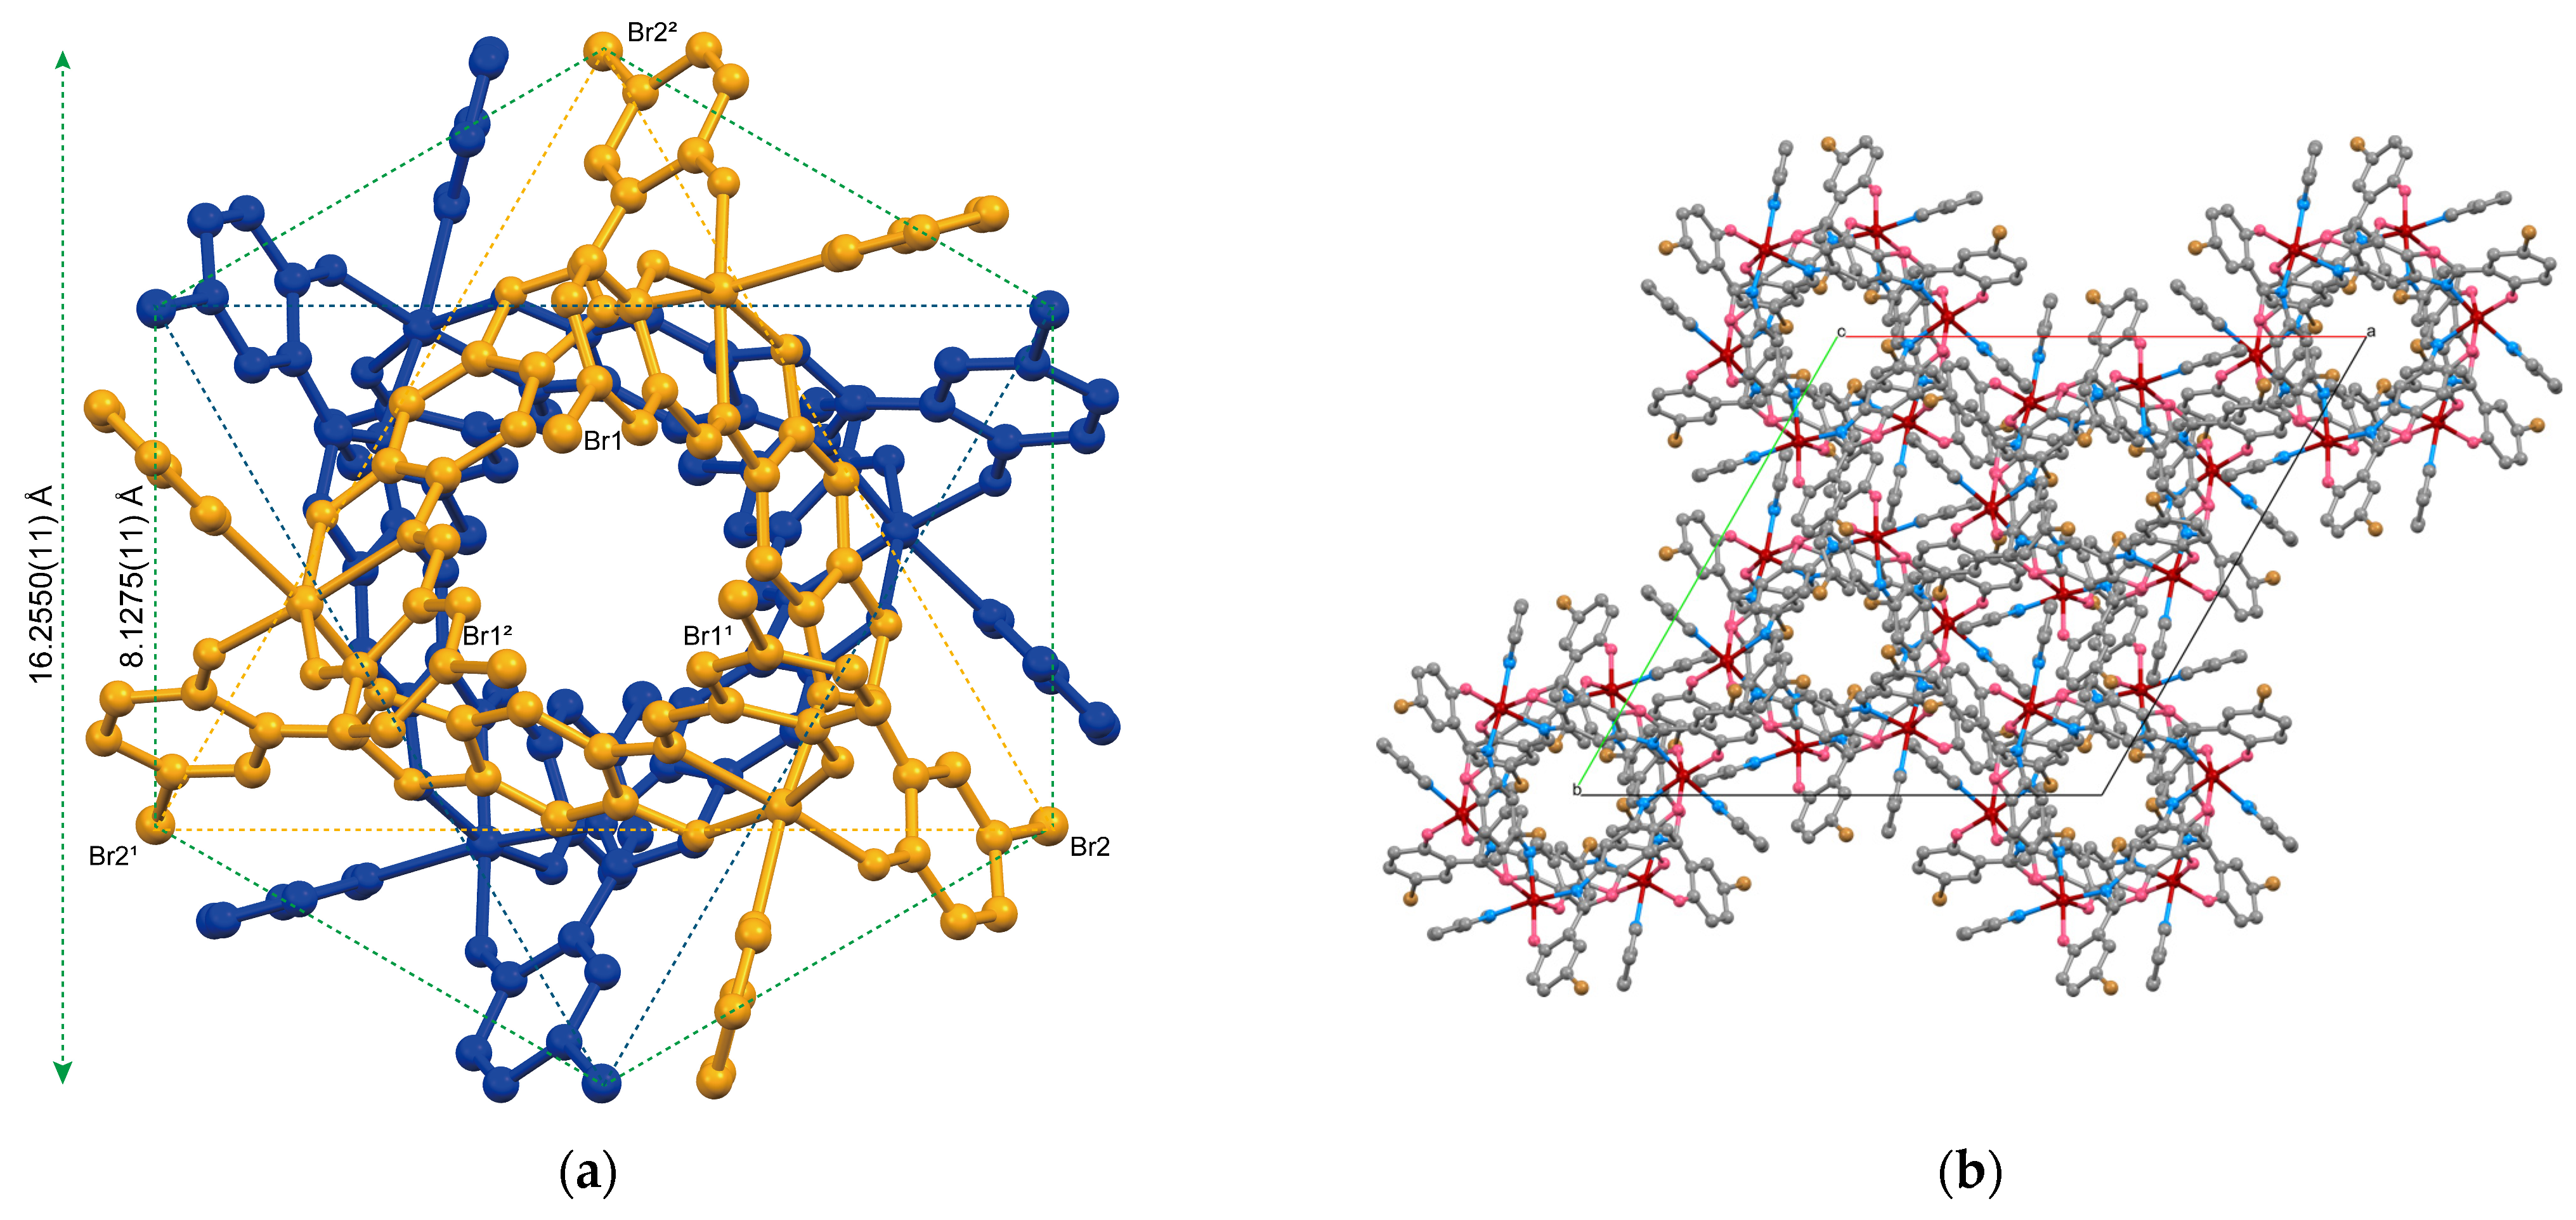
2.1.1. Structure of Complex 1
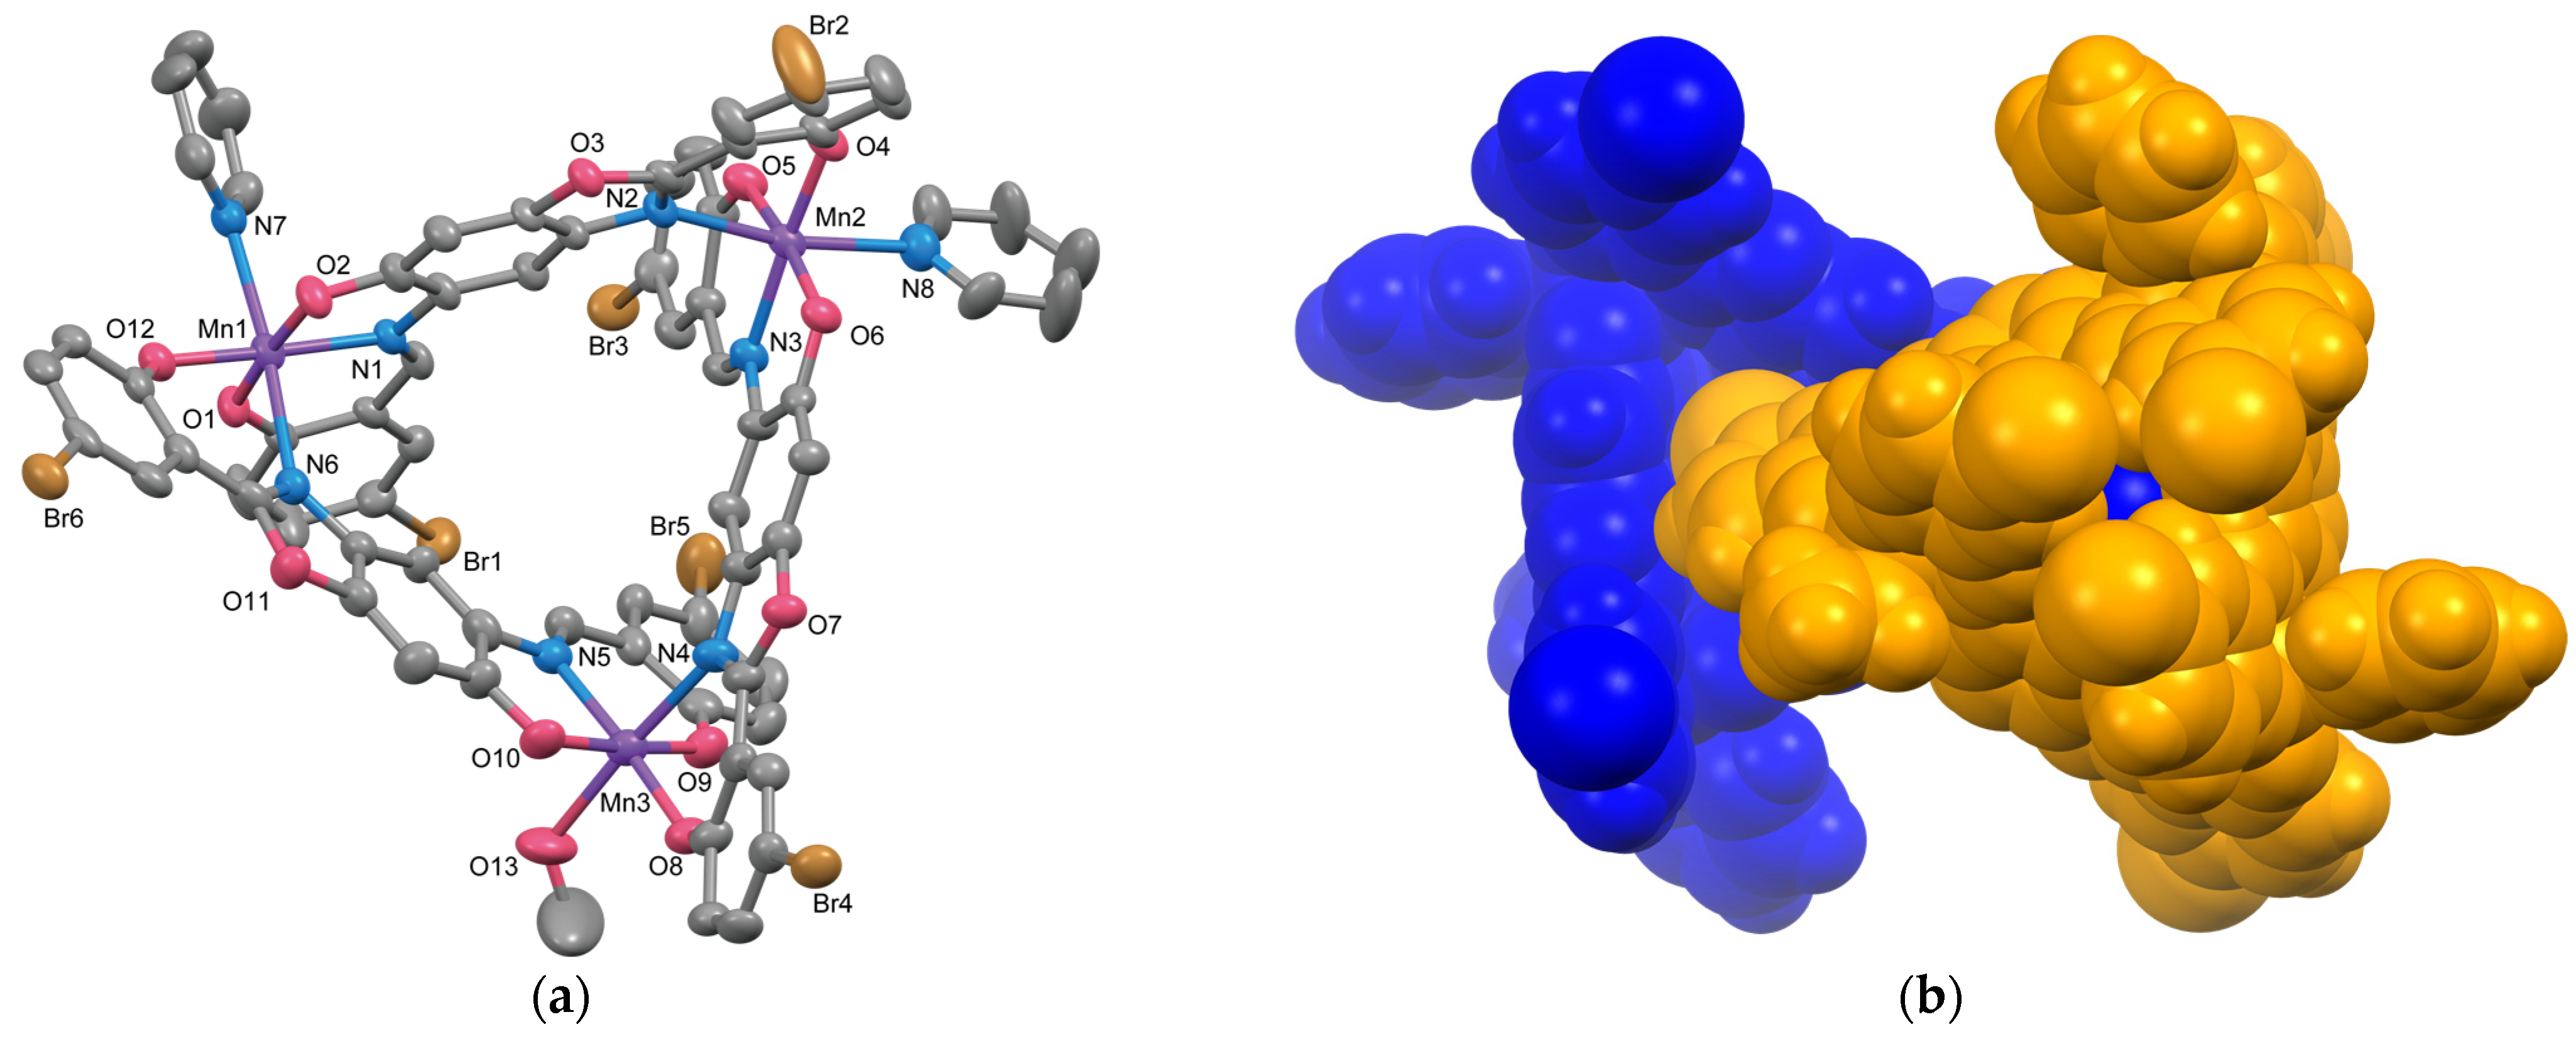
2.1.2. Structure of Complex 2
2.1.3. Structure of Complex 3
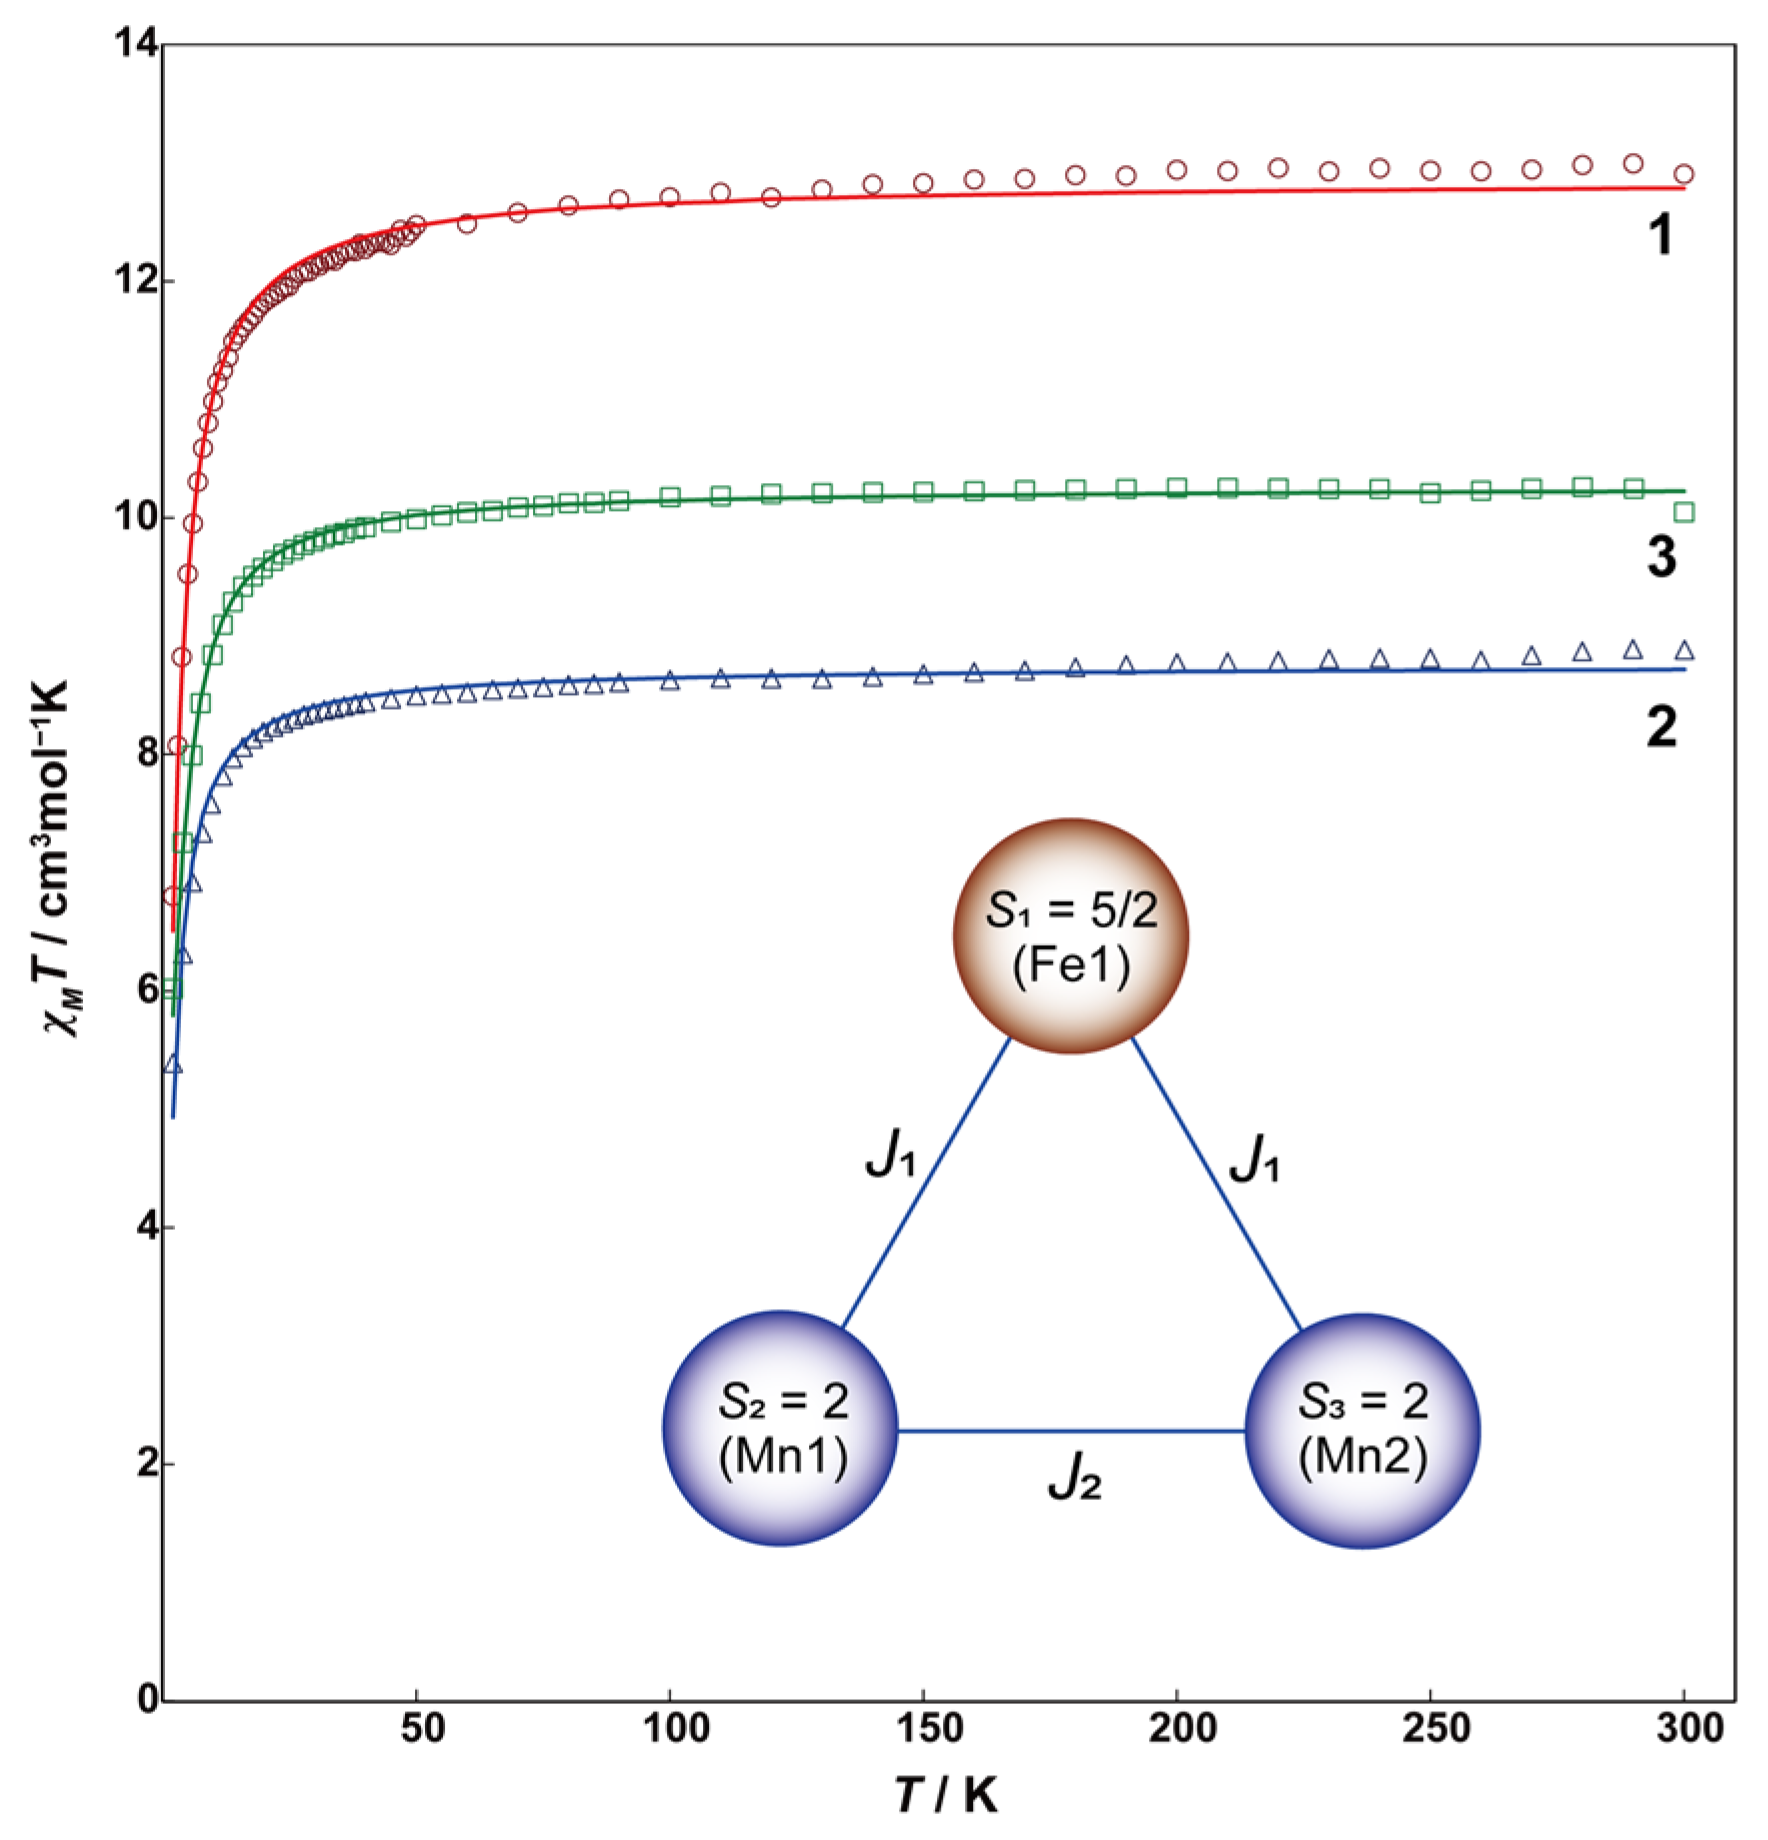
2.2. Magnetic Properties
3. Materials and Methods
3.1. Materials
3.2. Preparation
3.2.1. [{Fe(L3+2Br)py}3] (1)
3.2.2. [Mn3(L3+2Br)3(py)2CH3OH] (2)
3.2.3. [FeMn2(L3+2H)3(DMF)3] (3)
3.3. Physical Measurements
3.4. X-ray Crystallography
4. Conclusions
Supplementary Materials
Author Contributions
Funding
Institutional Review Board Statement
Informed Consent Statement
Data Availability Statement
Acknowledgments
Conflicts of Interest
References
- Soto, M.A.; MacLachlan, M.J. Responsive macrocyclic and supramolecular structures powered by platinum. Chem. Sci. 2024, 15, 431–441. [Google Scholar] [CrossRef] [PubMed]
- Domoto, Y.; Fujita, M. Self-assembly of nanostructures with high complexity based on metal···unsaturated-bond coordination. Coord. Chem. Rev. 2022, 466, 214605. [Google Scholar] [CrossRef]
- Yin, C.; Du, J.; Olenyuk, B.; Stang, P.J.; Sun, Y. The applications of metallacycles and metallacages. Inorganics 2023, 11, 54. [Google Scholar] [CrossRef]
- Wu, D.-Y.; Sato, O.; Einaga, Y.; Duan, C.-Y. A spin-crossover cluster of iron(II) exhibiting a mixed-spin structure and synergy between spin transition and magnetic interaction. Angew. Chem. 2009, 121, 1503–1506. [Google Scholar] [CrossRef]
- Hristova, Y.R.; Smulders, M.M.J.; Clegg, J.K.; Breiner, B.; Nitschke, J.R. Selective anion binding by a “Chameleon” capsule with a dynamically reconfigurable exterior. Chem. Sci. 2011, 2, 638–641. [Google Scholar] [CrossRef]
- Li, X.; Wu, J.; Chen, L.; Zhong, X.; He, C.; Zhang, R.; Duan, C. Engineering an iridium-containing metal–organic molecular capsule for induced-fit geometrical conversion and dual catalysis. Chem. Commun. 2016, 62, 9628–9631. [Google Scholar] [CrossRef]
- Johnson, S.L.; Gerasimchuk, N.N.; Mebi, C.A. Cyclic tetranuclear iron-carbonyl complex containing thiobisbenzenethiolate ligands: Synthesis and structural characterization. Inorg. Chim. Acta 2018, 477, 306–311. [Google Scholar] [CrossRef]
- Zarra, S.; Wood, D.M.; Roberts, D.A.; Nitschke, J.R. Molecular containers in complex chemical systems. Chem. Soc. Rev. 2015, 44, 419–432. [Google Scholar] [CrossRef]
- Altmann, P.J.; Pöthig, A. Capsoplexes: Encapsulating complexes via guest recognition. Chem. Commun. 2016, 52, 9089–9092. [Google Scholar] [CrossRef]
- Chen, N.; Gao, X.; Liu, M.; Cui, C.; Zhang, Q. A metal-organic capsule self-assembled by hydrogen bonds for adsorption of methylene blue. Supramol. Chem. 2023, 34, 148–157. [Google Scholar] [CrossRef]
- Muto, M.; Hatae, N.; Tamekuni, Y.; Yamada, Y.; Koikawa, M.; Tokii, T. Tripodal trimanganese(III) complexes of new un-symmetrical pentadentate ligands derived from 2-(salicylideneamino)phenol: Syntheses, crystal structures and properties. Eur. J. Inorg. Chem. 2007, 2007, 3701–3709. [Google Scholar] [CrossRef]
- Hasegawa, K.; Muto, M.; Hamada, M.; Yamada, Y.; Tokii, T.; Koikawa, M. Syntheses, Structures, and Electrochemical Properties of Metallacyclic Oxidovanadium(V) Complexes with Asymmetric Multidentate Linking Ligands. Molecules 2024, 29, 1700. [Google Scholar] [CrossRef] [PubMed]
- Chen, X.; Femia, F.J.; Babich, J.W.; Zubieta, J. The syntheses and structures of ‘3+2’ and ‘2+2+1’ oxorhenium mixed-ligand complexes employing 8-hydroxy-5-nitroquinoline as the bidentate N,O donor ligand. Inorg. Chim. Acta 2000, 308, 80–90. [Google Scholar] [CrossRef] [PubMed]
- Modak, R.; Sikdar, Y.; Thuijs, A.E.; Christou, G.; Goswami, S. CoII4, CoII7, and a series of CoII2LnIII (LnIII = NdIII, SmIII, GdIII, TbIII, DyIII) coordination clusters: Search for single molecule magnets. Inorg. Chem. 2016, 55, 10192–10202. [Google Scholar] [CrossRef] [PubMed]
- Spackman, M.A.; Jayatilaka, D. Hirshfeld surface analysis. CrystEngComm 2009, 11, 19–32. [Google Scholar] [CrossRef]
- Rees, B.; Jenner, L.; Yusupov, M. Bulk-solvent correction in large macromolecular structures. Acta Crystallogr. 2005, D61, 1299–1301. [Google Scholar] [CrossRef]
- Chilton, N.F.; Anderson, R.P.; Turner, L.D.; Soncini, A.; Murray, K.S. PHI: A powerful new program for the analysis of anisotropic monomeric and exchange-coupled polynuclear d- and f-block complexes. J. Comput. Chem. 2013, 34, 1164–1175. [Google Scholar] [CrossRef]
- Dziobkowski, C.T.; Wrobleski, J.T.; Brown, D.B. Magnetic and spectroscopic properties of FeIIFeIII2(CH3CO2)6L3, L = water or pyridine. Direct observation of the thermal barrier to electron transfer in a mixed-valance complex. Inorg. Chem. 1981, 20, 679–684. [Google Scholar] [CrossRef]
- Selwood, P.W. Magnetochemistry; Interscience Publishers: New York, NY, USA, 1956; pp. 78–91. [Google Scholar]
- Rigaku Corporation. CrystalClear: Data Collection and Processing Software; Rigaku Corporation: Tokyo, Japan, 1998. [Google Scholar]
- Rigaku Oxford Diffraction. CrysAlis Pro; Rigaku Oxford Diffraction: Tokyo, Japan, 2022. [Google Scholar]
- Sheldrick, G.M. SHELXT—Integrated space-group and crystal-structure determination. Acta Crystallogr. A 2015, 71, 3–8. [Google Scholar] [CrossRef]
- Dolomano, V.; Bourhis, L.J.; Gildea, R.J.; Howard, J.A.K.; Puschmann, H. OLEX2: A complete structure solution, refinement and analysis program. J. Appl. Cryst. 2009, 42, 339–341. [Google Scholar] [CrossRef]
- Jiang, J.-S.; Brünger, A.T. Protein hydration observed by X-ray diffraction: Solvation properties of penicillopepsin and neuraminidase crystal structures. J. Mol. Biol. 1994, 243, 100–115. [Google Scholar] [CrossRef] [PubMed]
- Sheldrick, G.M. Crystal structure refinement with SHELXL. Acta Crystallogr. C 2015, 71, 3–8. [Google Scholar] [CrossRef] [PubMed]
- Macrae, C.F.; Sovago, I.; Cottrell, S.J.; Galek, P.T.A.; McCabe, P.; Pidcock, E.; Platings, M.; Shields, G.P.; Stevens, J.S.; Towler, M.; et al. Mercury 4.0: From visualization to analysis, design and prediction. J. Appl. Crystllogr. 2020, 53, 226–235. [Google Scholar] [CrossRef] [PubMed]


| 1 | 2 | 3 | |
|---|---|---|---|
| Empirical formula | C100H67Br6Fe3N14O12 | C86H56Br6Mn3N11O13 | C76.5H71.5FeMn2N11.5O17.5 |
| Formula weight | 2303.68 | 2095.69 | 1597.68 |
| Temperature/K | 113.15 | 113.15 | 293.15 |
| Crystal system | trigonal | triclinic | triclinic |
| Space group | |||
| a/Å | 22.3202(8) | 15.995(3) | 14.417(3) |
| b/Å | 22.3202(8) | 16.278(3) | 15.001(3) |
| c/Å | 32.1552(10) | 17.829(4) | 20.820(5) |
| α/° | 90 | 78.264(9) | 102.622(3) |
| β/° | 90 | 83.109(9) | 97.115(2) |
| γ/° | 120 | 70.544(7) | 94.088(3) |
| V/Å3 | 13,873.2(11) | 4278.8(15) | 2495.7(8) |
| Z | 6 | 2 | 2 |
| Dcalc/g cm−3 | 1.654 | 1.627 | 1.223 |
| m(MoKa)/mm−1 | 3.128 | 3.306 | 0.519 |
| F(0 0 0) | 6894.0 | 2076.0 | 1654.0 |
| Crystal dimensions/mm3 | 0.1 × 0.074 × 0.062 | 0.21 × 0.17 × 0.12 | 0.47 × 0.39 × 0.34 |
| Radiation | MoKα (λ = 0.71073) | MoKα (λ = 0.71075) | MoKα (λ = 0.71075) |
| 2q range for data collection/° | 3.3 to 61.906 | 6.014 to 54.954 | 6.078 to 54.918 |
| Reflections collected | 43,139 | 35,546 | 35,454 |
| Independent reflections | 9022 | 18,867 | 19,007 |
| Data/Restraints/Params | 9022/0/370 | 18,867/126/1014 | 19,007/30/918 |
| Goodness of fit indicator | 0.990 | 0.983 | 1.032 |
| R indices [I > 2.00s(I)] | R1 = 0.0785 | R1 = 0.0602 | R1 = 0.0624 |
| wR2 = 0.1278 | wR2 = 0.1461 | wR2 = 0.1842 | |
| R indices (all data) | R1 = 0.1852 | R1 = 0.0982 | R1 = 0.0704 |
| wR2 = 0.1593 | wR2 = 0.1647 | wR2 = 0.1947 | |
| Largest diff. peak, hole/e Å−3 | 1.03, −0.76 | 1.74, −0.90 | 0.43, −0.65 |
| CCDC deposition number | 2379560 | 2379559 | 2379558 |
| Bond | Distance/Å | Angle | Angle/° |
|---|---|---|---|
| Fe1–O1 | 1.934(4) | O1–Fe1–O2 | 162.70(15) |
| Fe1–O2 | 1.955(4) | O41–Fe1–N1 | 172.92(16) |
| Fe1–O41 | 1.914(3) | N21–Fe1–N3 | 173.32(17) |
| Fe1–N1 | 2.172(4) | O1–Fe1–N1 | 84.56(15) |
| Fe1–N2′ | 2.166(4) | O2–Fe1–N1 | 78.14(15) |
| Fe1–N3 | 2.198(5) | O41–Fe1–N21 | 85.49(16) |
| Fe1···Fe11 | 8.1881(13) |
| Bond | Distance/Å | Angle | Angle/° |
|---|---|---|---|
| Mn1–O1 | 1.894(3) | O1–Mn1–O2 | 173.96(15) |
| Mn1–O2 | 1.895(3) | O12–Mn1–N1 | 175.10(15) |
| Mn1–O12 | 1.886(3) | N6–Mn1–N7 | 173.84(15) |
| Mn1–N1 | 2.014(4) | O1–Mn1–N1 | 90.22(15) |
| Mn1–N6 | 2.302(4) | O2–Mn1–N1 | 83.75(15) |
| Mn1–N7 | 2.300(4) | O12–Mn1–N6 | 83.91(15) |
| Mn2–O4 | 1.896(3) | O5–Mn2–O6 | 172.45(14) |
| Mn2–O5 | 1.899(3) | O4–Mn2–N3 | 173.33(15) |
| Mn2–O6 | 1.905(3) | N2–Mn2–N8 | 169.49(16) |
| Mn2–N2 | 2.254(4) | O5–Mn2–N3 | 89.97(15) |
| Mn2–N3 | 2.002(4) | O6–Mn2–N3 | 82.51(15) |
| Mn2–N8 | 2.296(5) | O4–Mn2–N2 | 83.00(15) |
| Mn3–O8 | 1.883(4) | O9–Mn3–O10 | 174.40(16) |
| Mn3–O9 | 1.903(4) | O8–Mn3–N5 | 174.92(18) |
| Mn3–O10 | 1.892(4) | O13–Mn3–N4 | 175.88(17) |
| Mn3–O13 | 2.229(4) | O9–Mn3–N5 | 91.08(17) |
| Mn3–N4 | 2.255(4) | O10–Mn3–N5 | 83.31(17) |
| Mn3–N5 | 2.011(4) | O8–Mn3–N4 | 84.70(15) |
| Mn1···Mn2 | 8.1311(16) | Mn1···Mn2···Mn3 | 60.478(16) |
| Mn1···Mn3 | 8.1870(19) | Mn1···Mn3···Mn2 | 59.794(12) |
| Mn2···Mn3 | 8.1255(17) | Mn2···Mn1···Mn3 | 59.727(14) |
| Fe Position | R Value | Ueq/Å2 | ||
|---|---|---|---|---|
| A | B | C | ||
| Site A | 0.0624 | 0.053 (Fe) | 0.069 (Mn) | 0.055 (Mn) |
| Site B | 0.0632 | 0.050 (Mn) | 0.073 (Fe) | 0.056 (Mn) |
| Site C | 0.0635 | 0.049 (Mn) | 0.069 (Mn) | 0.059 (Fe) |
| Bond | Distance/Å | Angle | Angle/° |
|---|---|---|---|
| Fe1–O1 | 1.9290(18) | O1–Fe1–O2 | 166.28(7) |
| Fe1–O2 | 1.9438(18) | O12–Fe1–N1 | 173.56(8) |
| Fe1–O12 | 1.9035(17) | O13–Fe1–N6 | 173.57(8) |
| Fe1–O13 | 2.1065(19) | O1–Fe1–N1 | 87.05(7) |
| Fe1–N1 | 2.0927(19) | O2–Fe1–N1 | 80.09(7) |
| Fe1–N6 | 2.1958(19) | O12–Fe1–N6 | 84.21(7) |
| Mn1–O4 | 1.898(2) | O5–Mn1–O6 | 169.68(9) |
| Mn1–O5 | 1.906(2) | O4–Mn1–N3 | 172.99(10) |
| Mn1–O6 | 1.910(2) | O14–Mn1–N2 | 171.52(13) |
| Mn1–O14 | 2.208(4) | O5–Mn1–N3 | 88.43(10) |
| Mn1–N2 | 2.215(2) | O6–Mn1–N3 | 81.27(9) |
| Mn1–N3 | 2.066(2) | O4–Mn1–N2 | 84.98(9) |
| Mn2–O8 | 1.9024(19) | O9–Mn2–O10 | 168.70(8) |
| Mn2–O9 | 1.916(2) | O8–Mn2–N5 | 173.32(8) |
| Mn2–O10 | 1.9322(19) | O15–Mn2–N4 | 173.58(8) |
| Mn2–O15 | 2.168(2) | O9–Mn2–N5 | 87.88(8) |
| Mn2–N4 | 2.222(2) | O10–Mn2–N5 | 80.85(7) |
| Mn2–N5 | 2.074(2) | O8–Mn2–N4 | 83.90(8) |
| Fe1···Mn1 | 8.1506(14) | Fe1···Mn1···Mn2 | 59.473(14) |
| Fe1···Mn2 | 8.0924(14) | Fe1···Mn2···Mn1 | 60.180(8) |
| Mn1···Mn2 | 8.1642(14) | Mn1···Fe1···Mn2 | 60.347(9) |
| Fe1···Fe1 * | 6.0599(12) |
Disclaimer/Publisher’s Note: The statements, opinions and data contained in all publications are solely those of the individual author(s) and contributor(s) and not of MDPI and/or the editor(s). MDPI and/or the editor(s) disclaim responsibility for any injury to people or property resulting from any ideas, methods, instructions or products referred to in the content. |
© 2024 by the authors. Licensee MDPI, Basel, Switzerland. This article is an open access article distributed under the terms and conditions of the Creative Commons Attribution (CC BY) license (https://creativecommons.org/licenses/by/4.0/).
Share and Cite
Muto, M.; Morinaga, K.; Nishihashi, M.; Yamada, Y.; Koikawa, M. Structural and Magnetic Properties of Dimeric Capsule Assemblies Formed by Cyclic Trinuclear Complexes. Molecules 2024, 29, 4307. https://doi.org/10.3390/molecules29184307
Muto M, Morinaga K, Nishihashi M, Yamada Y, Koikawa M. Structural and Magnetic Properties of Dimeric Capsule Assemblies Formed by Cyclic Trinuclear Complexes. Molecules. 2024; 29(18):4307. https://doi.org/10.3390/molecules29184307
Chicago/Turabian StyleMuto, Masahiro, Kousuke Morinaga, Momoko Nishihashi, Yasunori Yamada, and Masayuki Koikawa. 2024. "Structural and Magnetic Properties of Dimeric Capsule Assemblies Formed by Cyclic Trinuclear Complexes" Molecules 29, no. 18: 4307. https://doi.org/10.3390/molecules29184307