
Self-Healable, Transparent, Biodegradable, and Shape Memorable Polyurethanes Derived from Carbon Dioxide-Based Diols

 , , , and
Abstract
1. Introduction
2. Results and Discussion
2.1. Structure of CO2-Based PPCDL
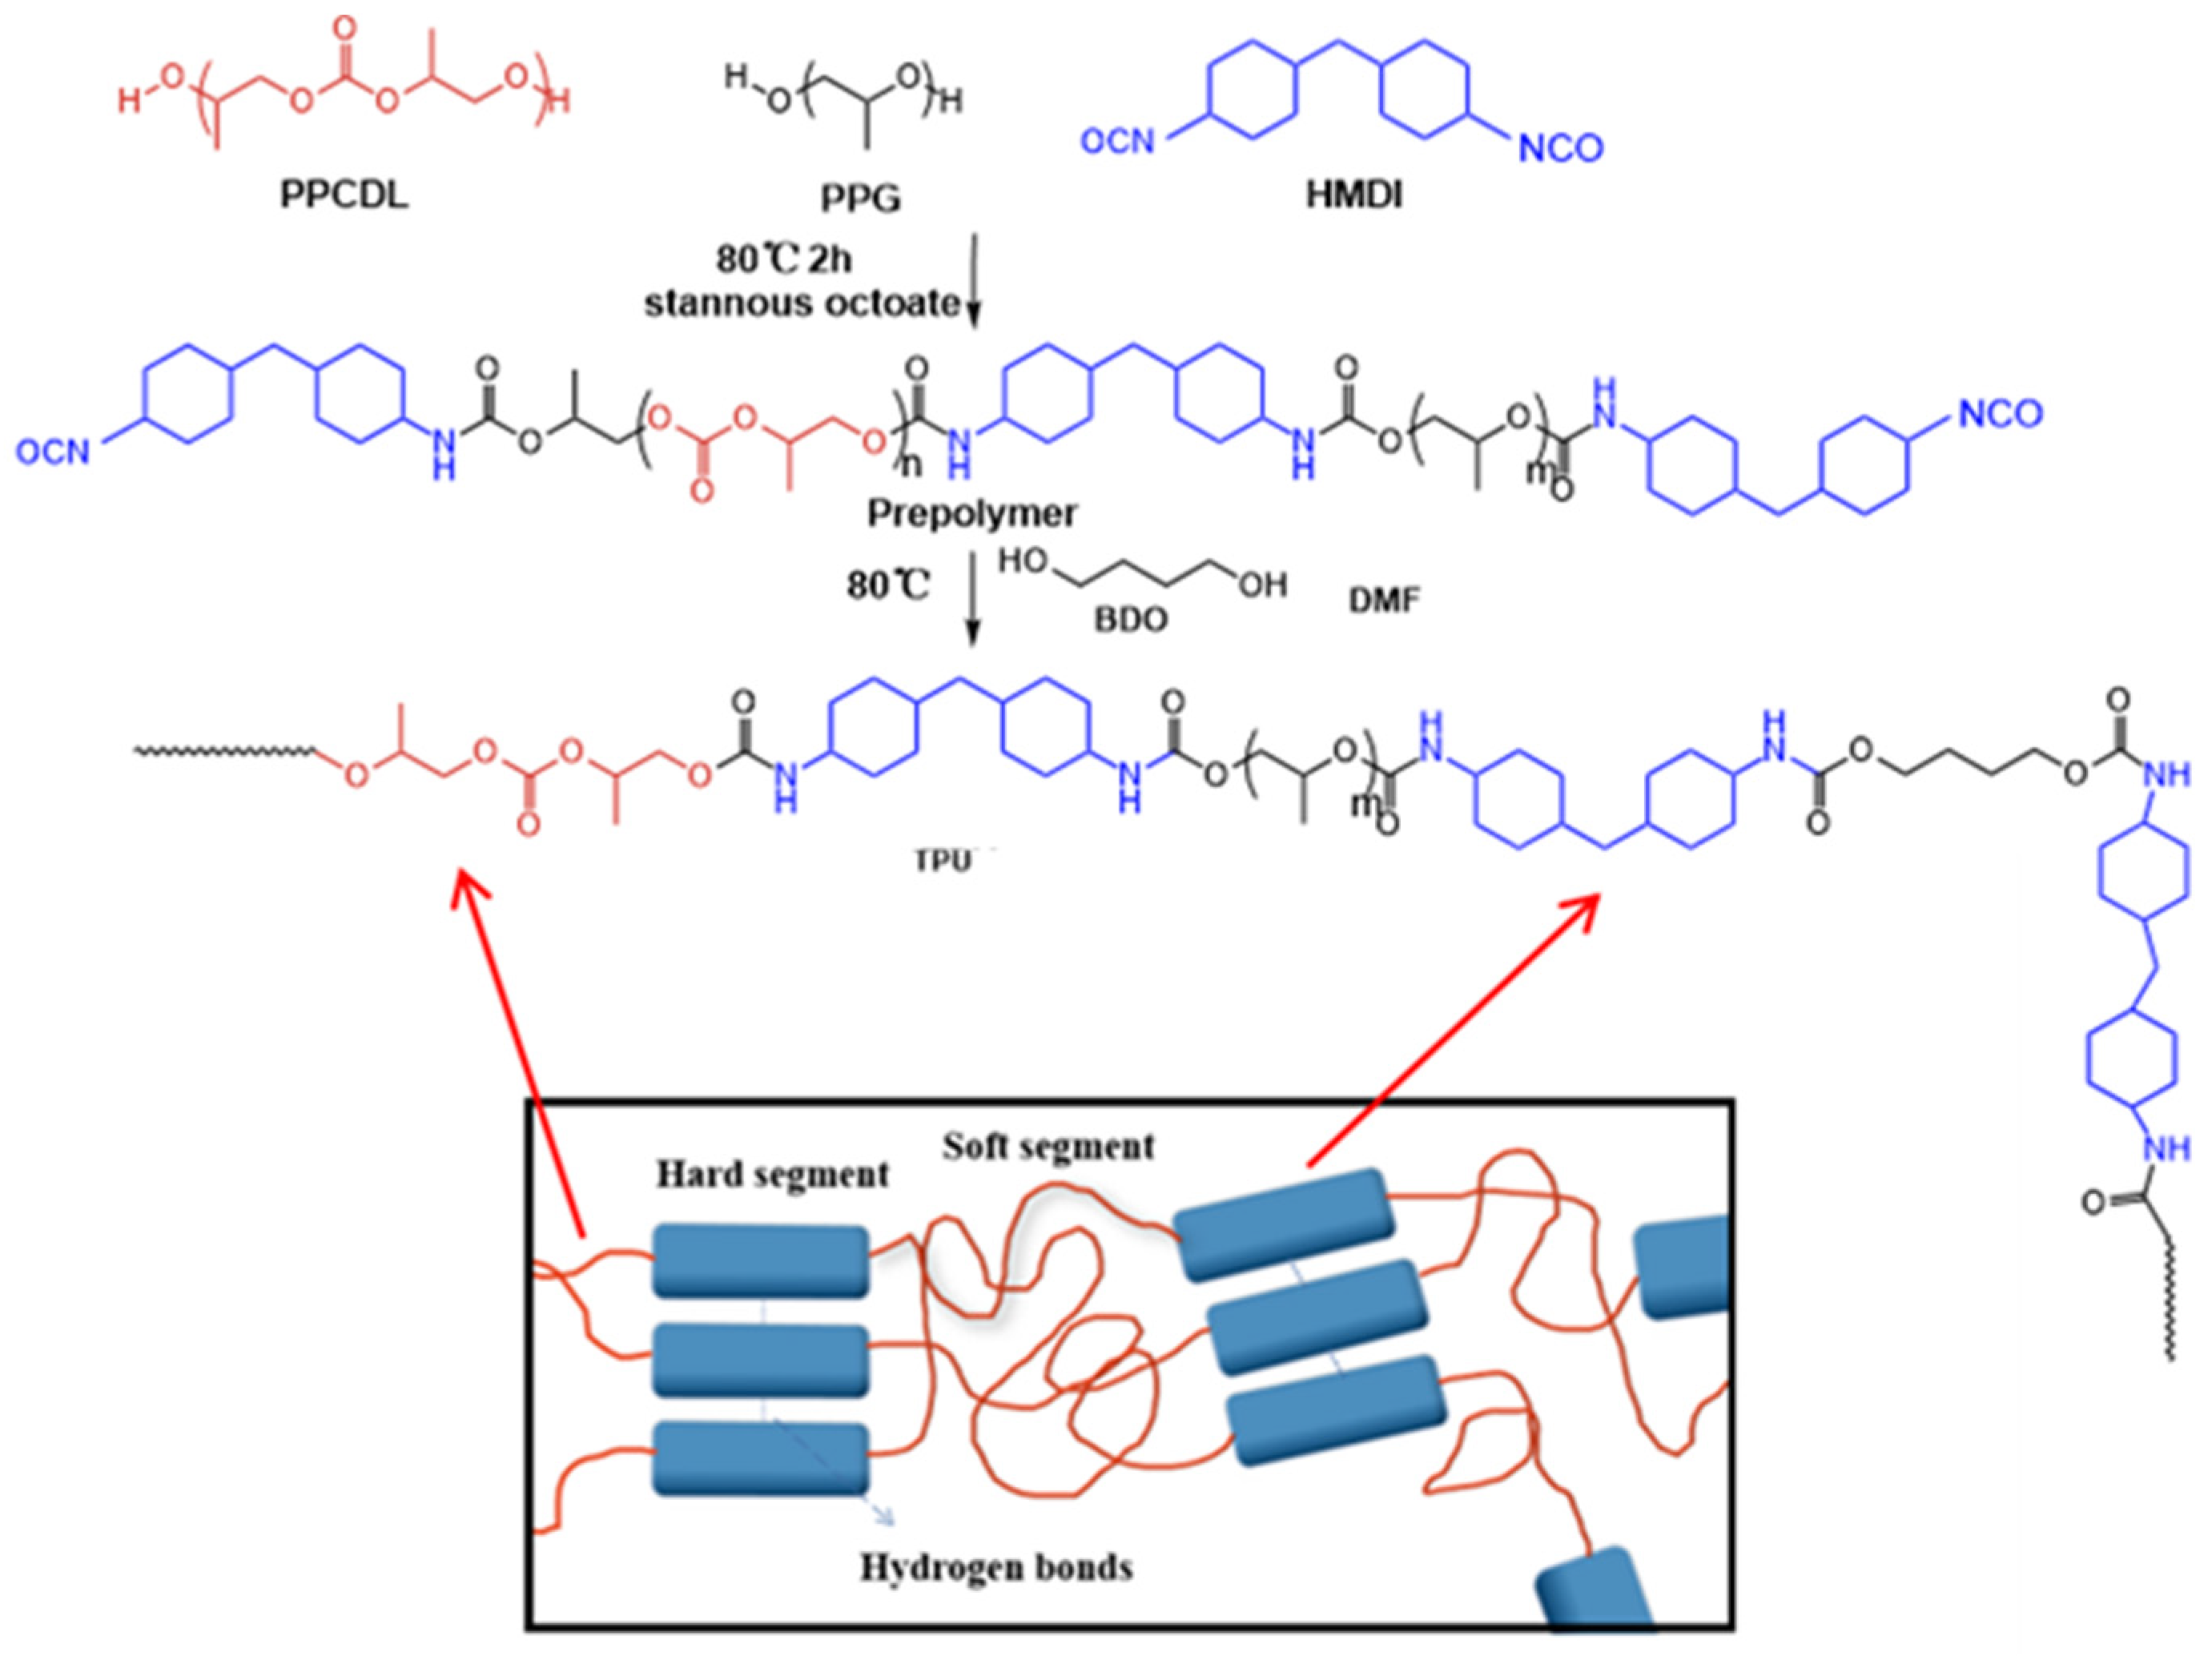
2.2. Structure of CO2-Based TPU
2.3. Properties of Synthesized TPU
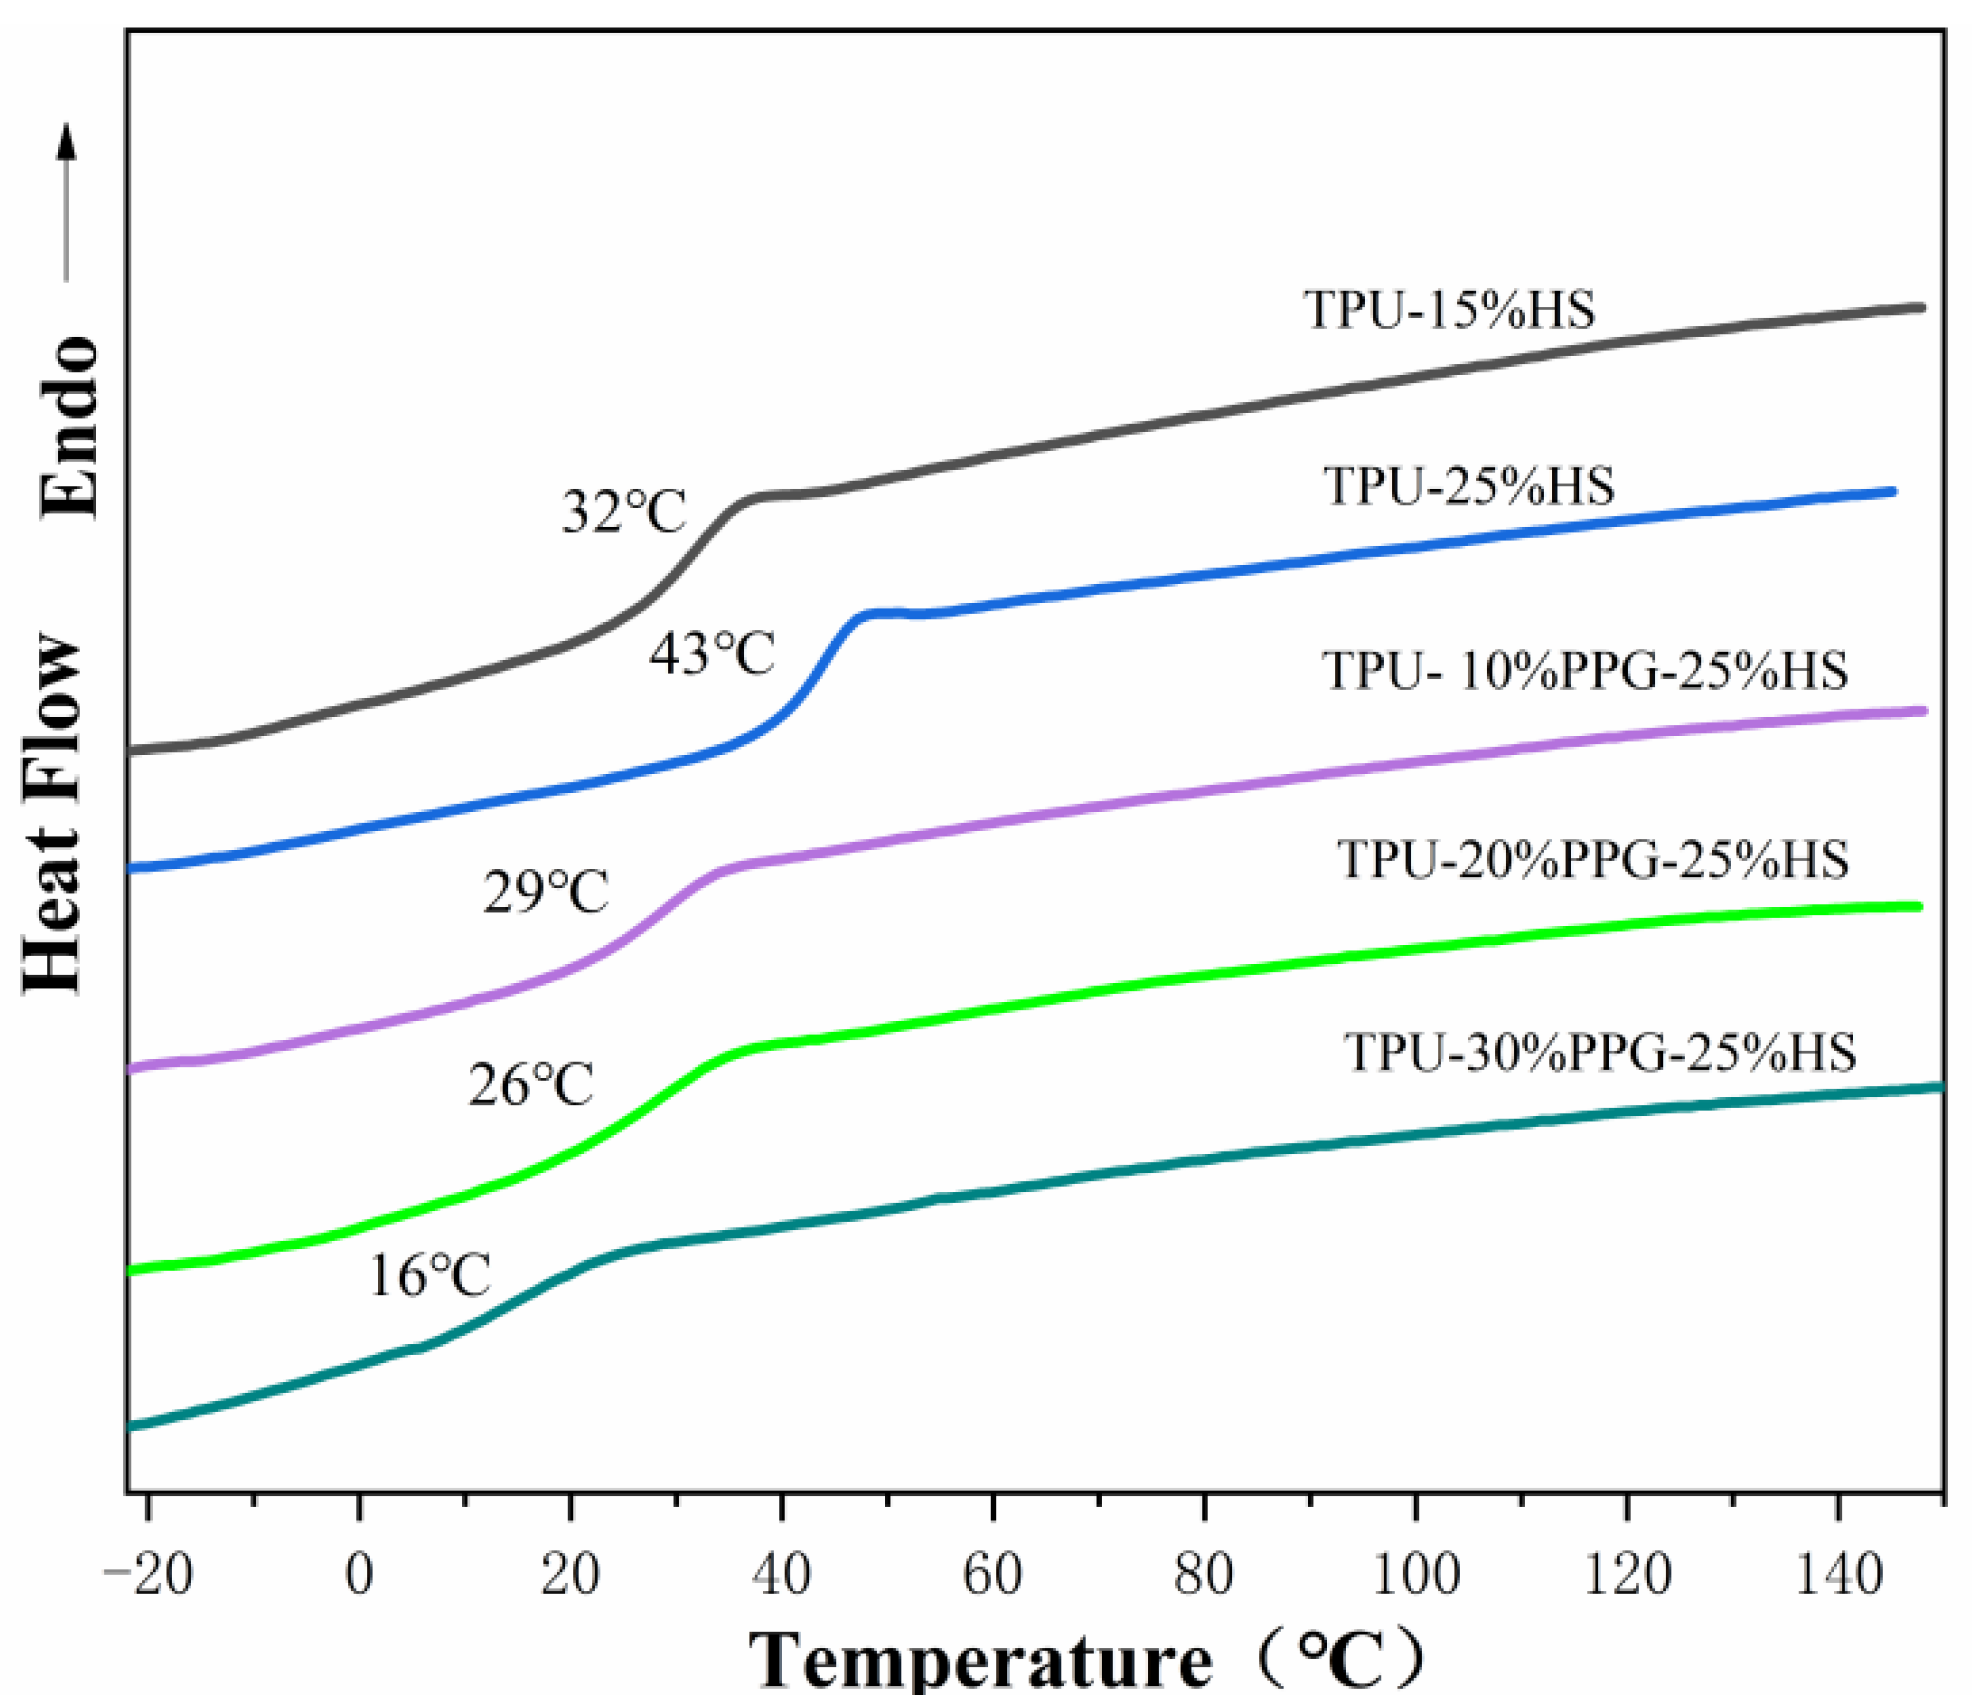
2.3.1. Thermal Properties
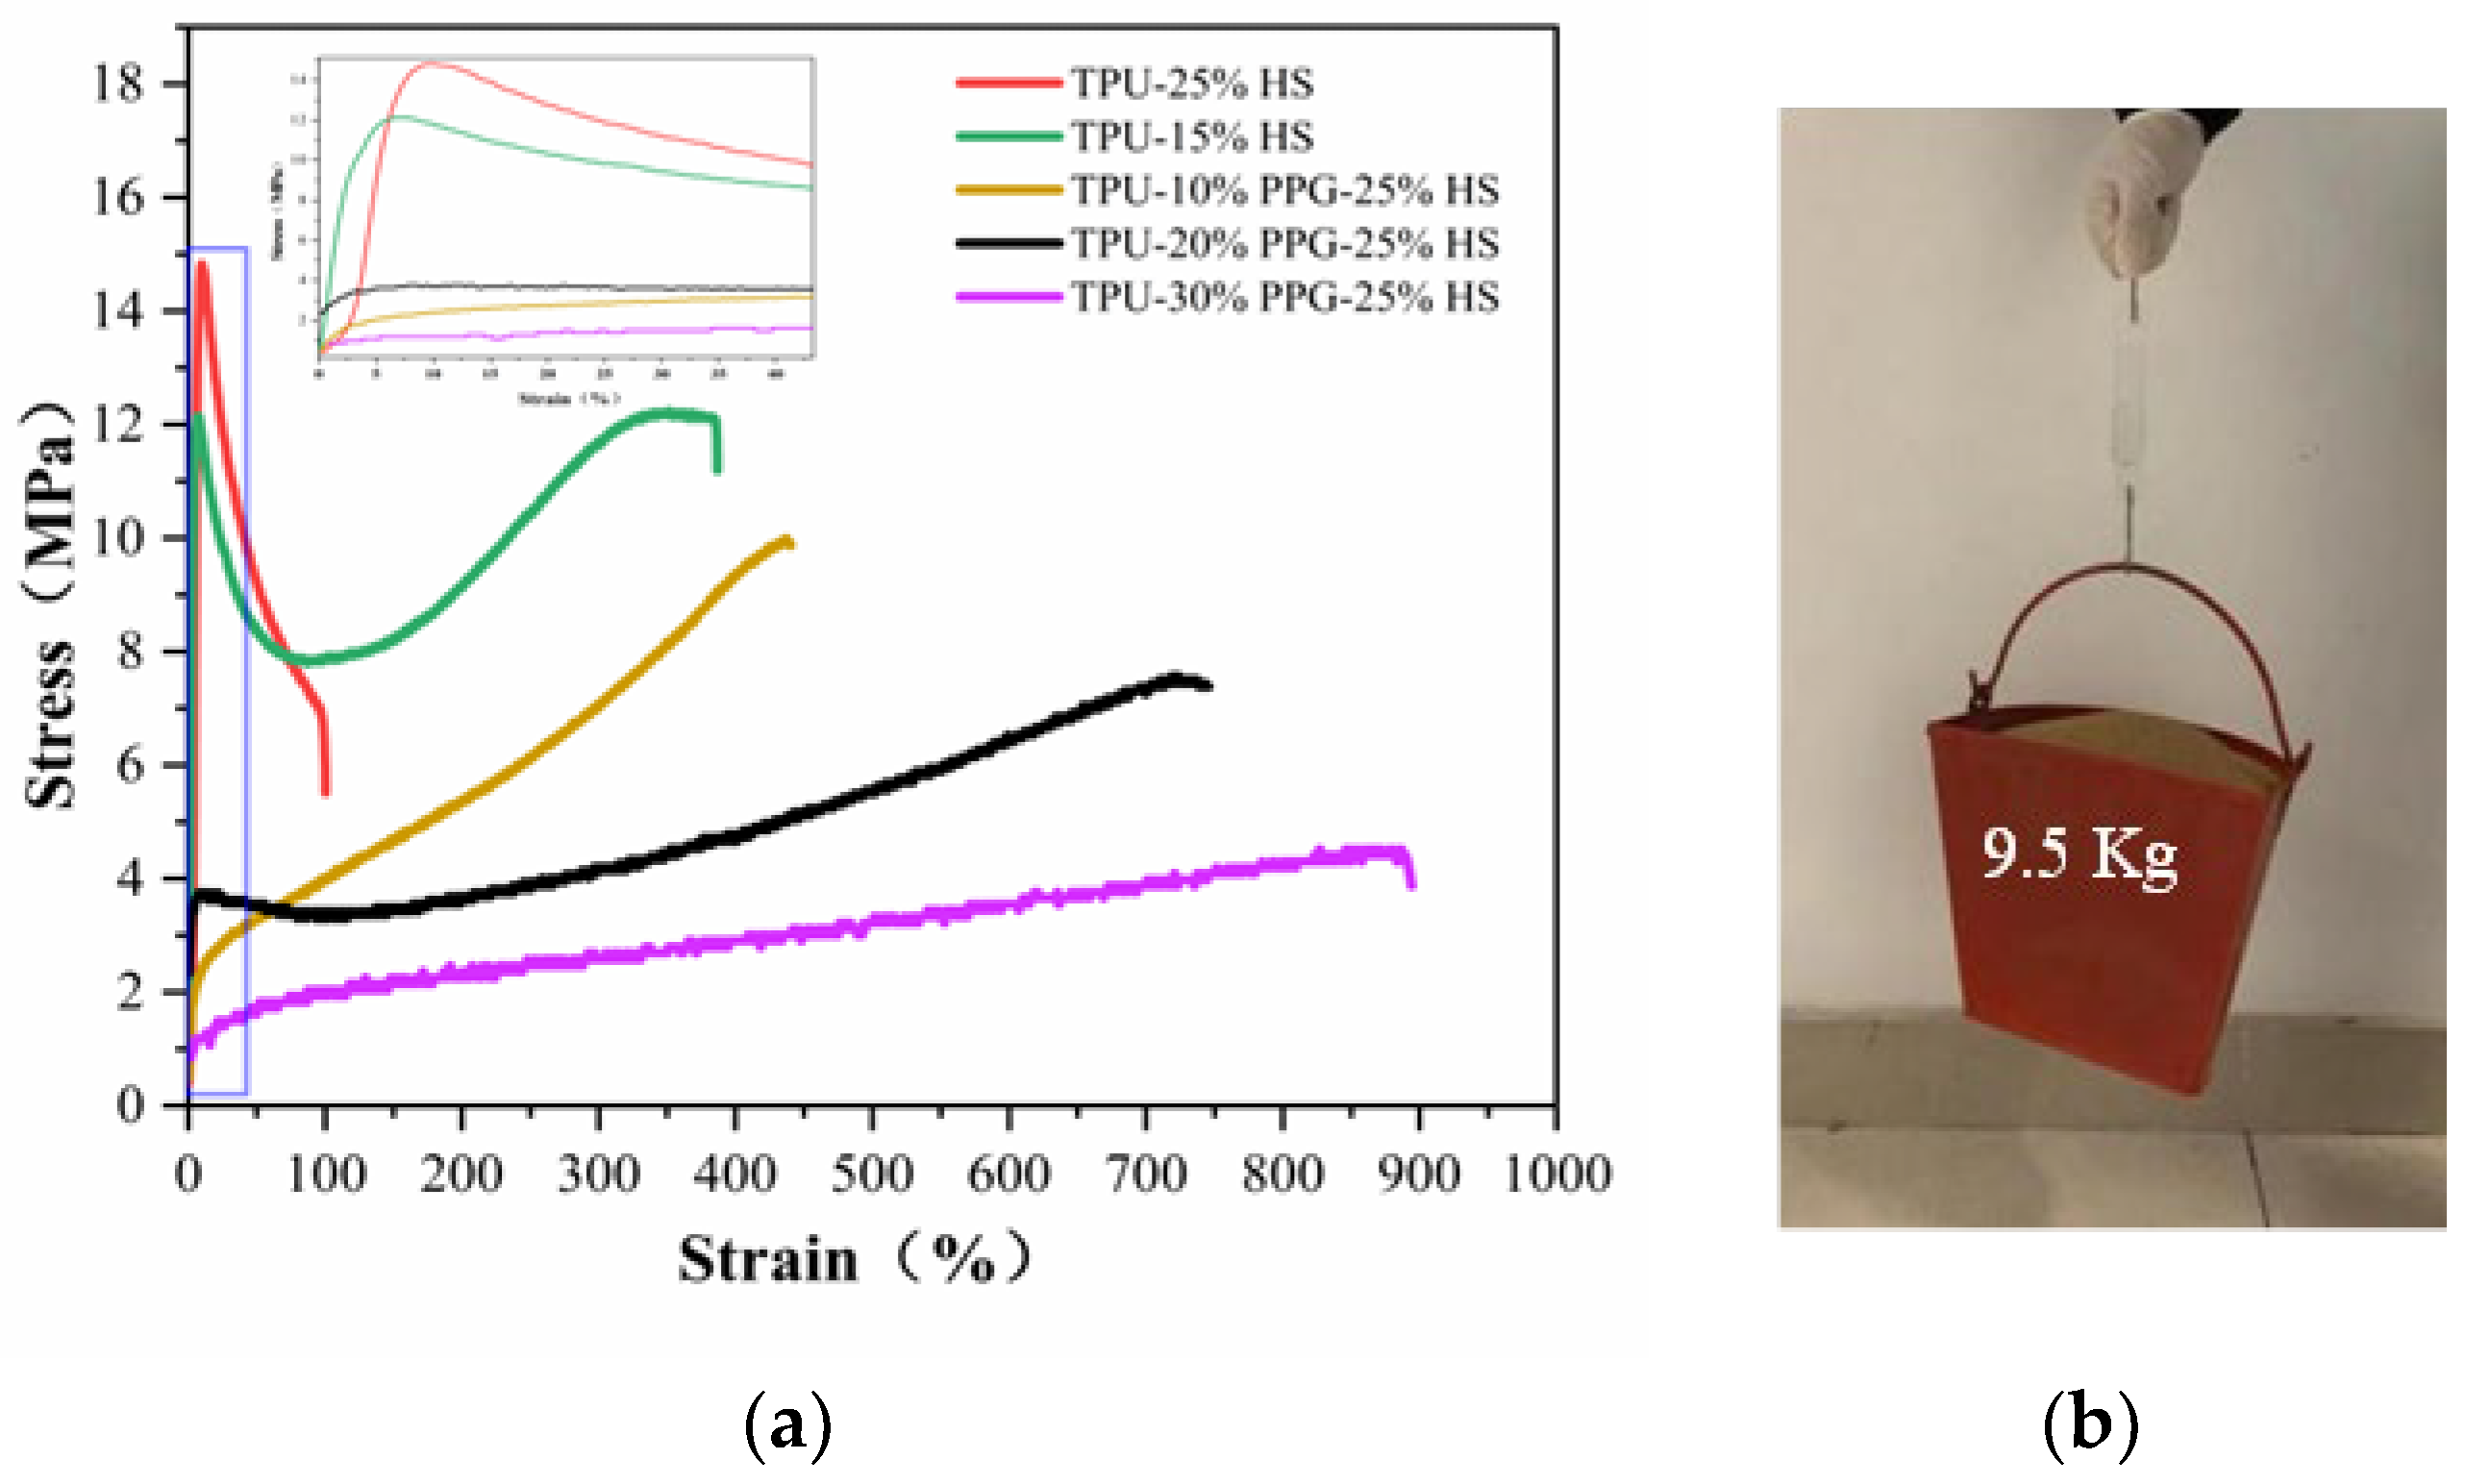
2.3.2. Mechanical and Adhesive Properties
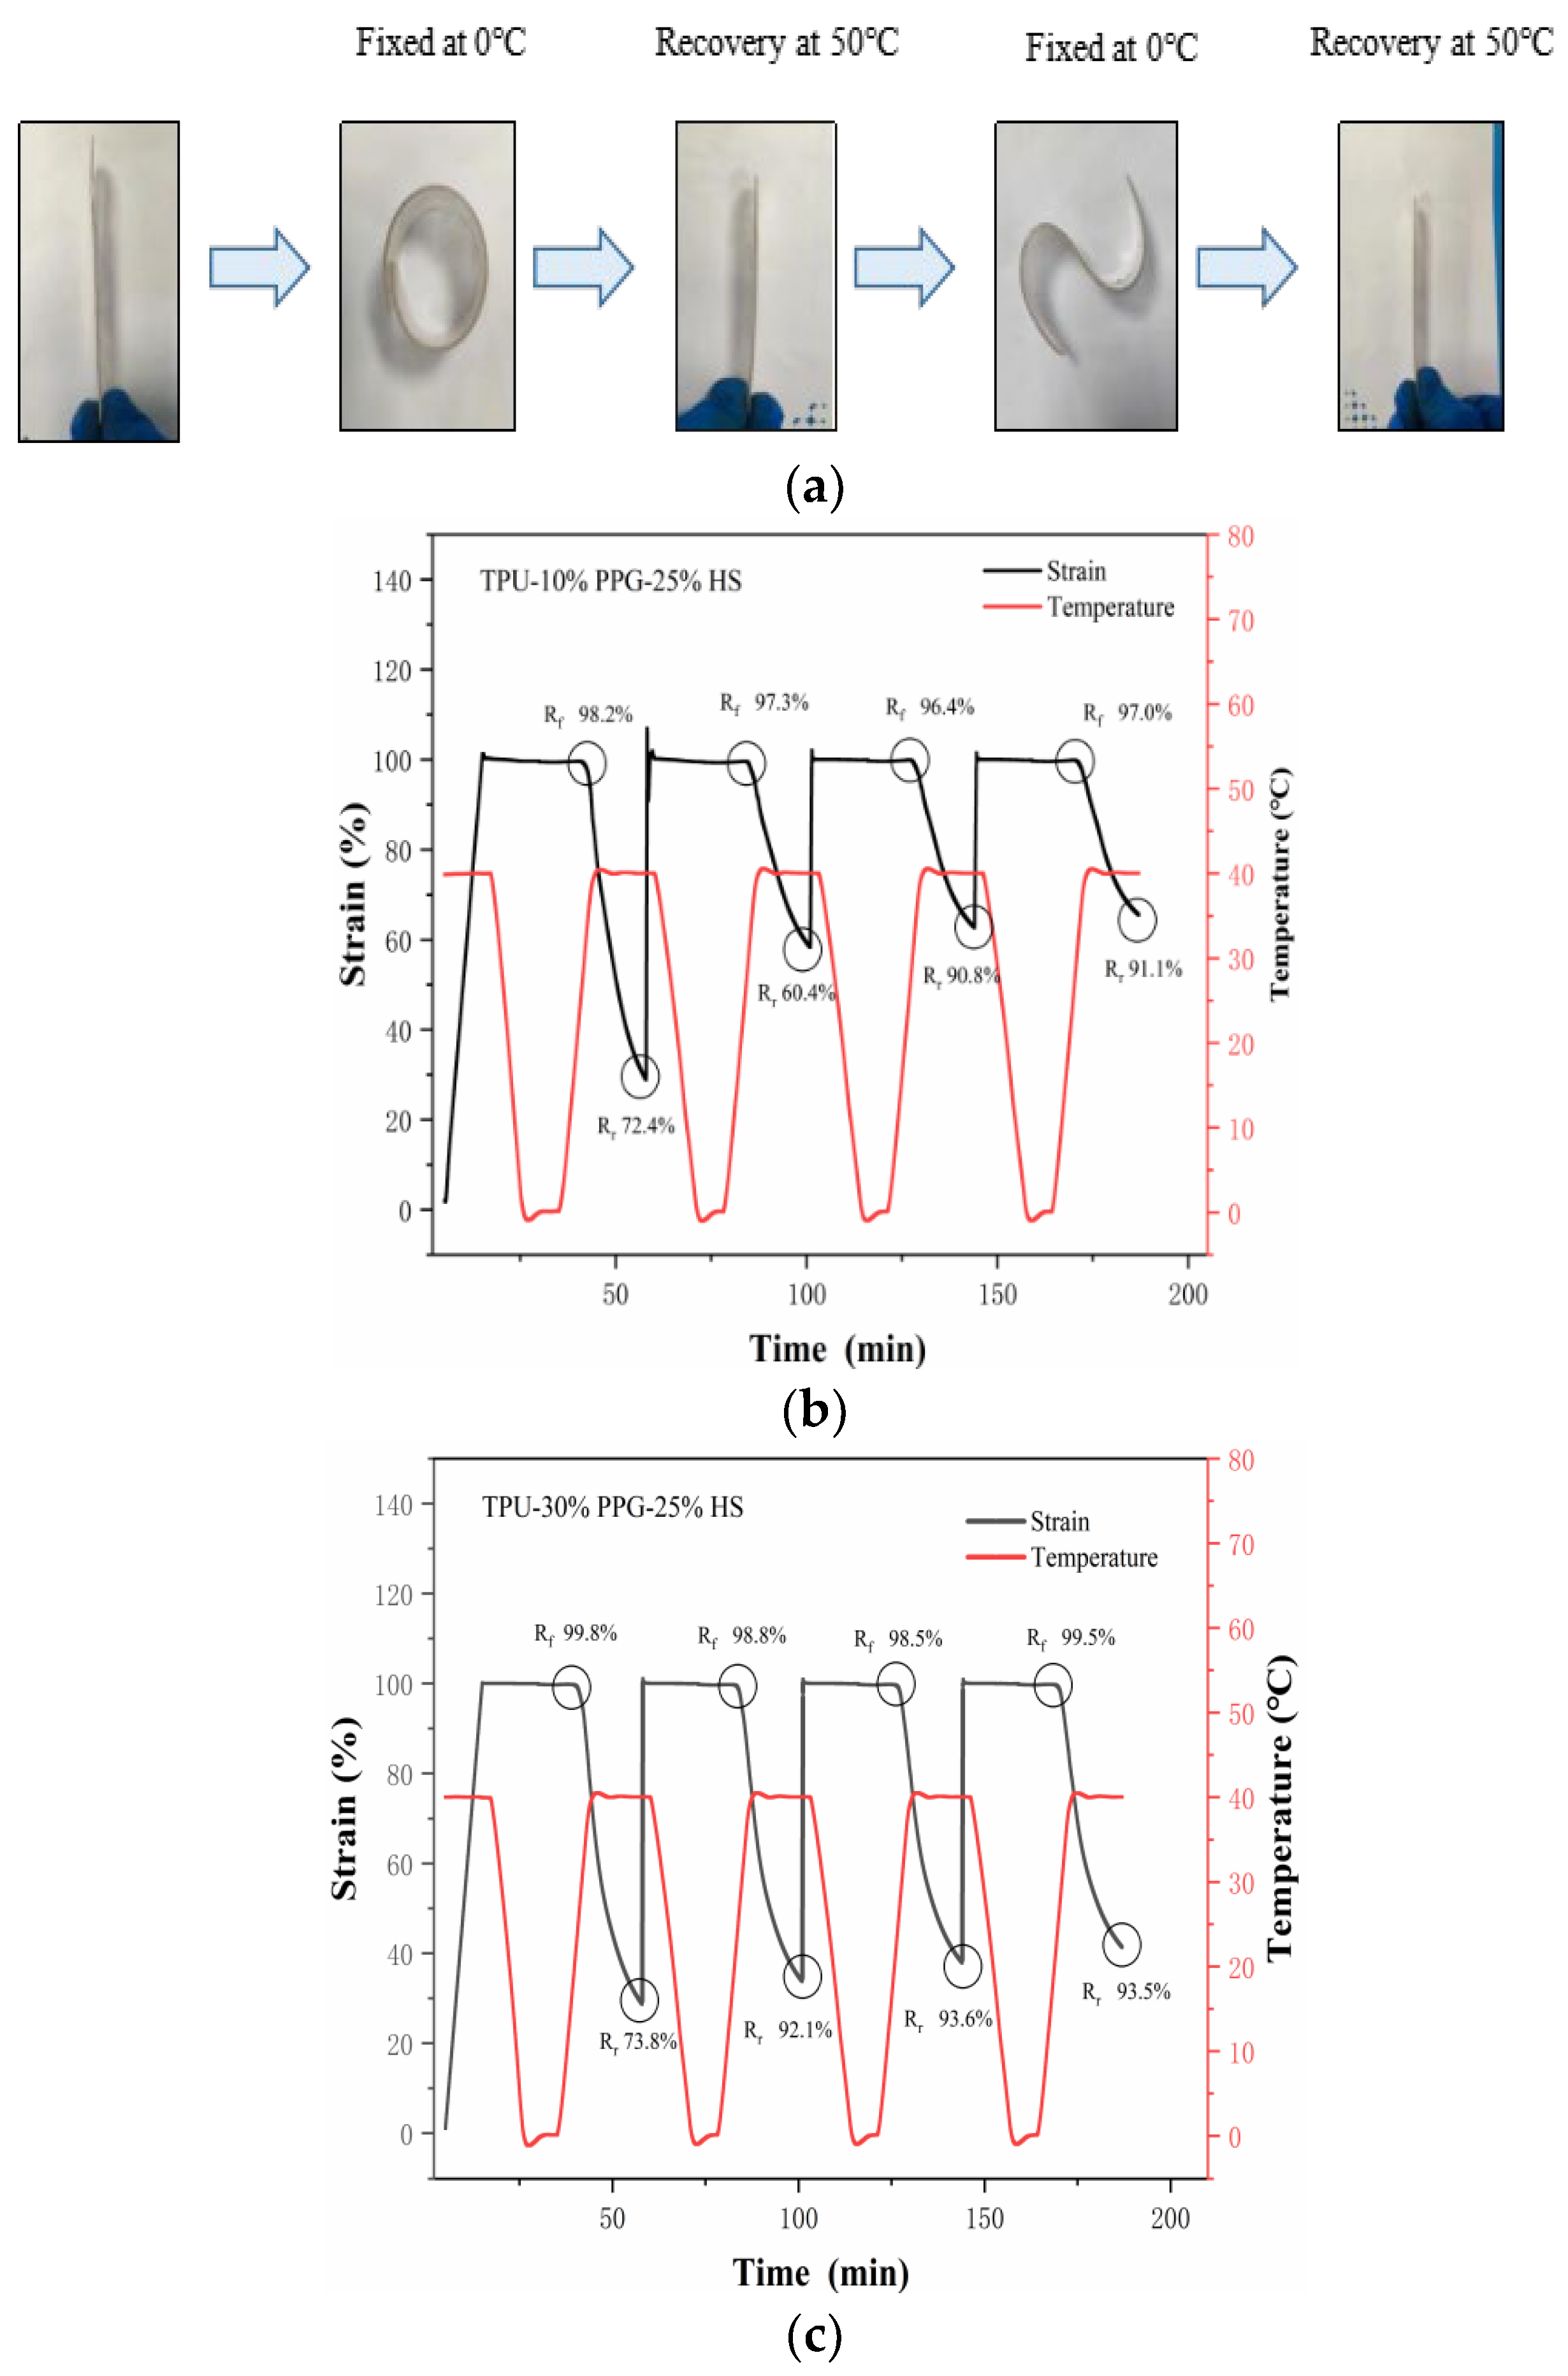
2.3.3. Shape Memorable and Self-Healable Properties
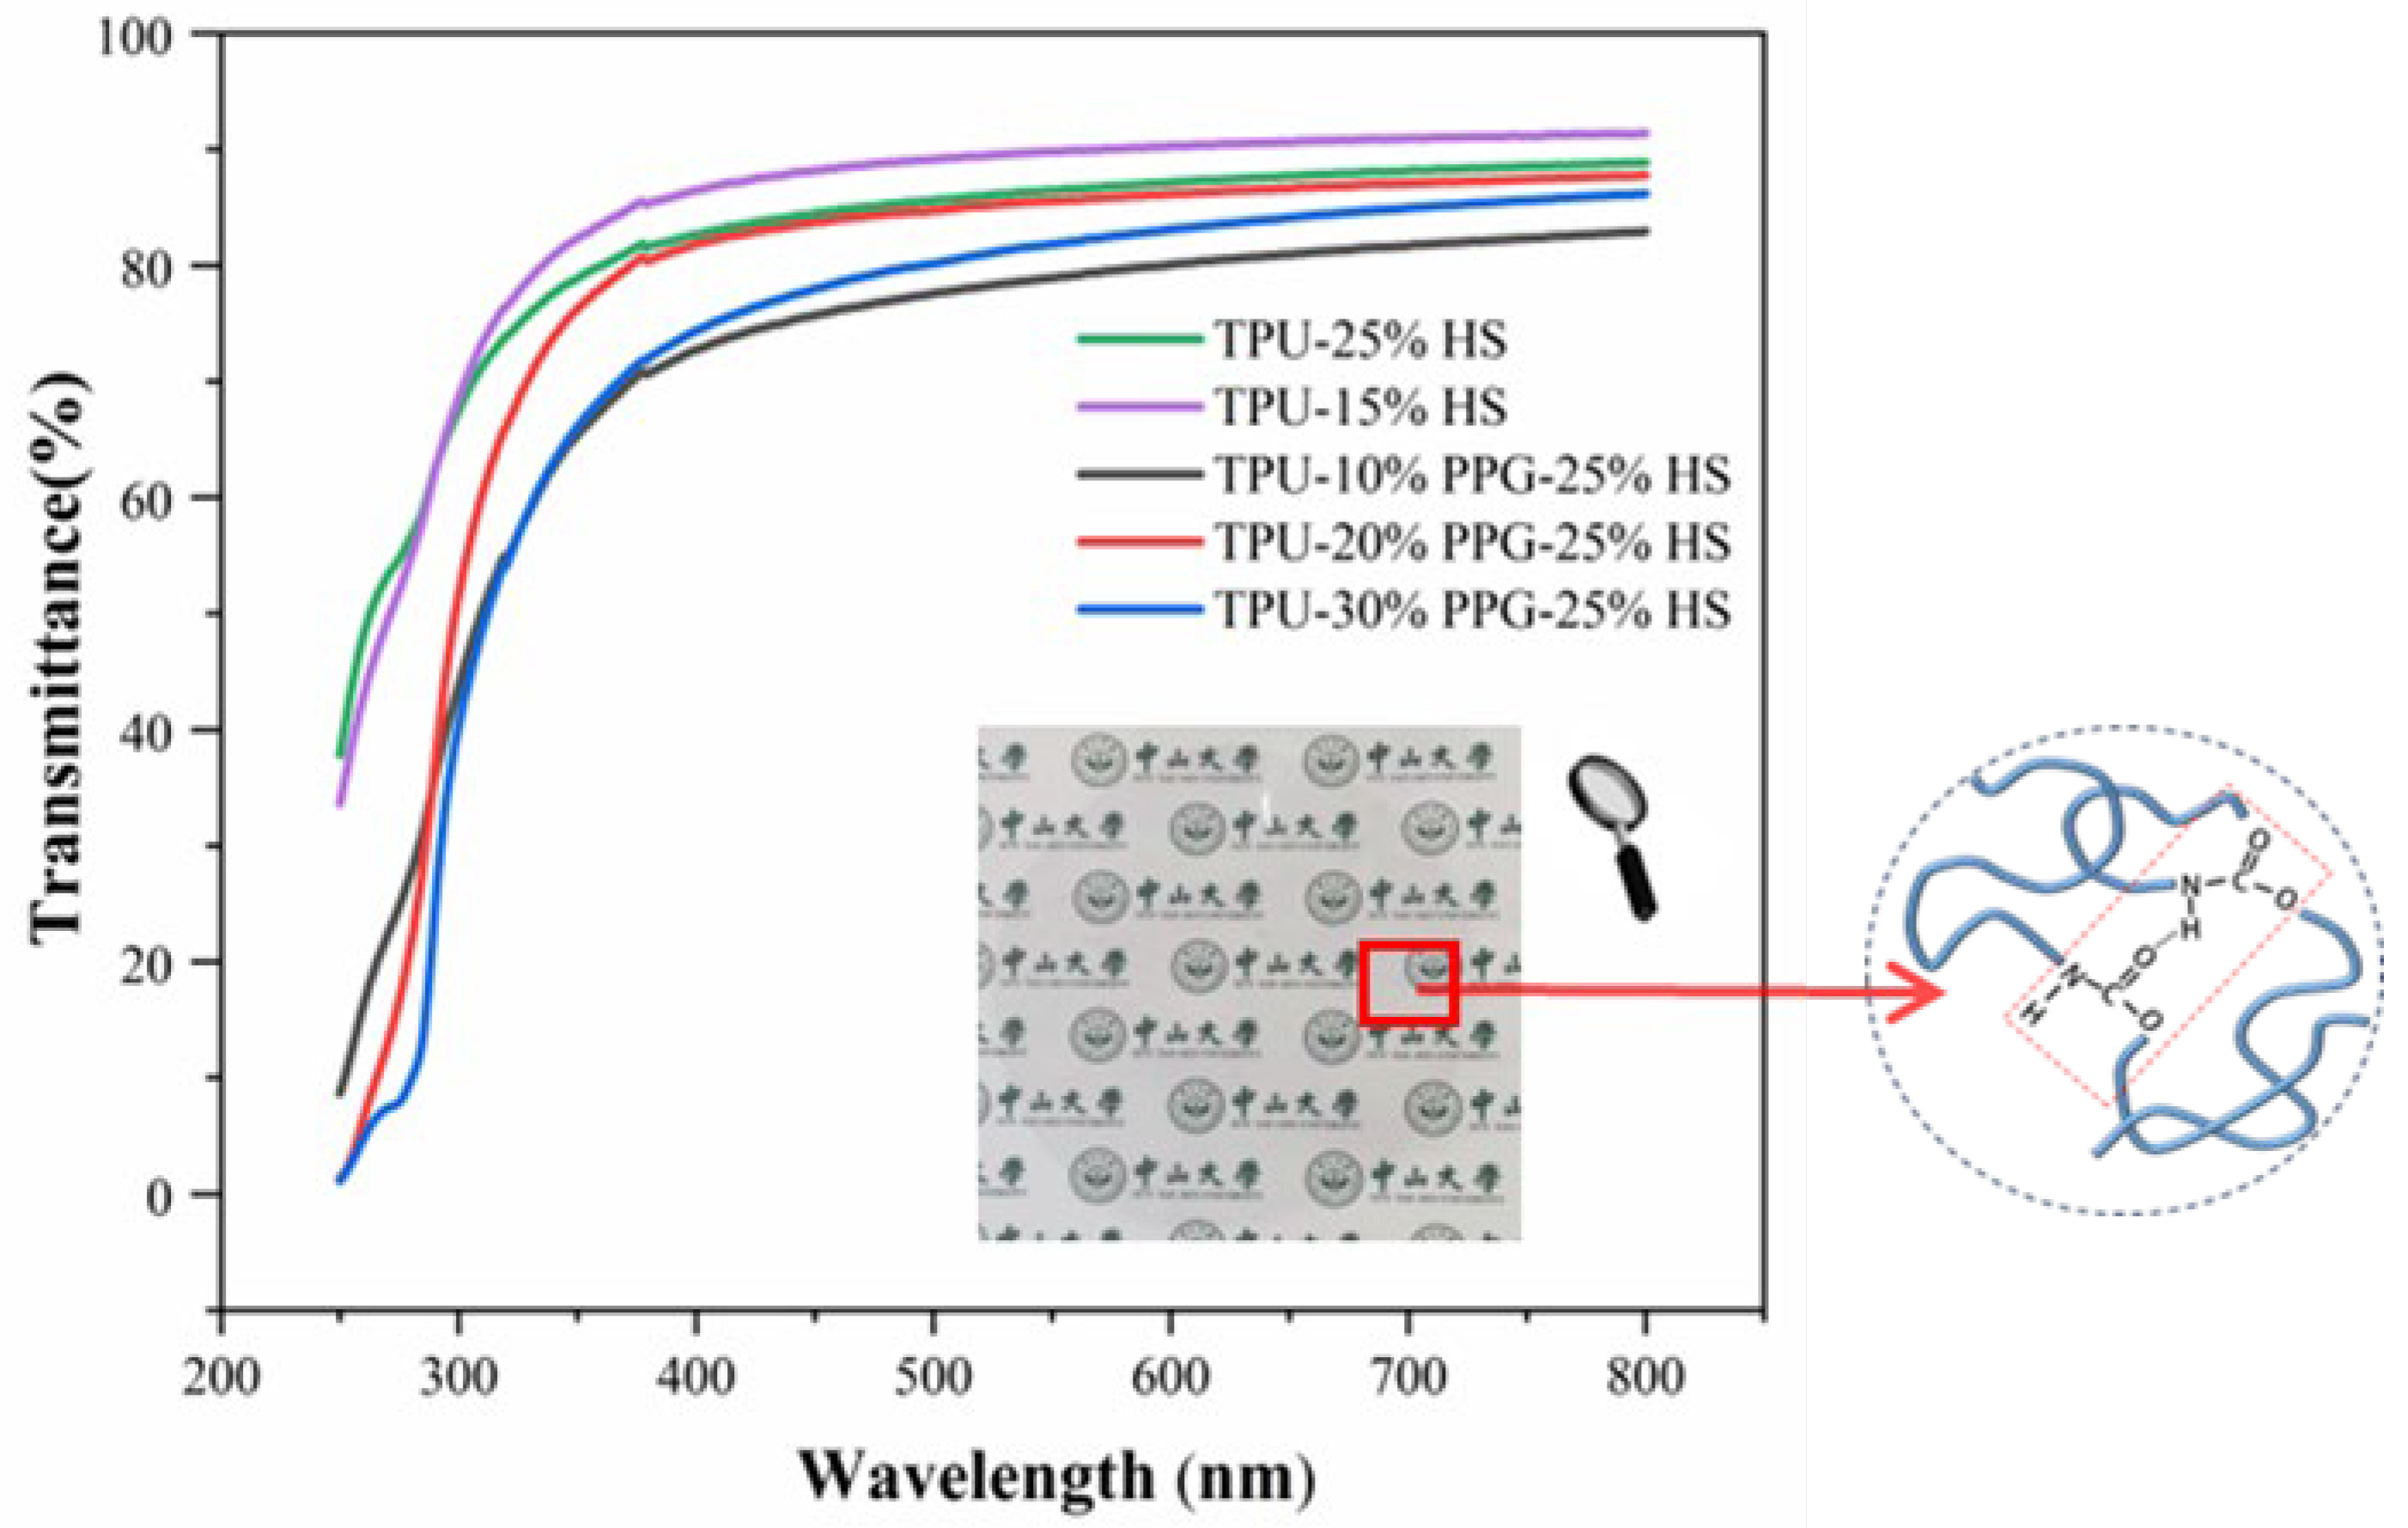
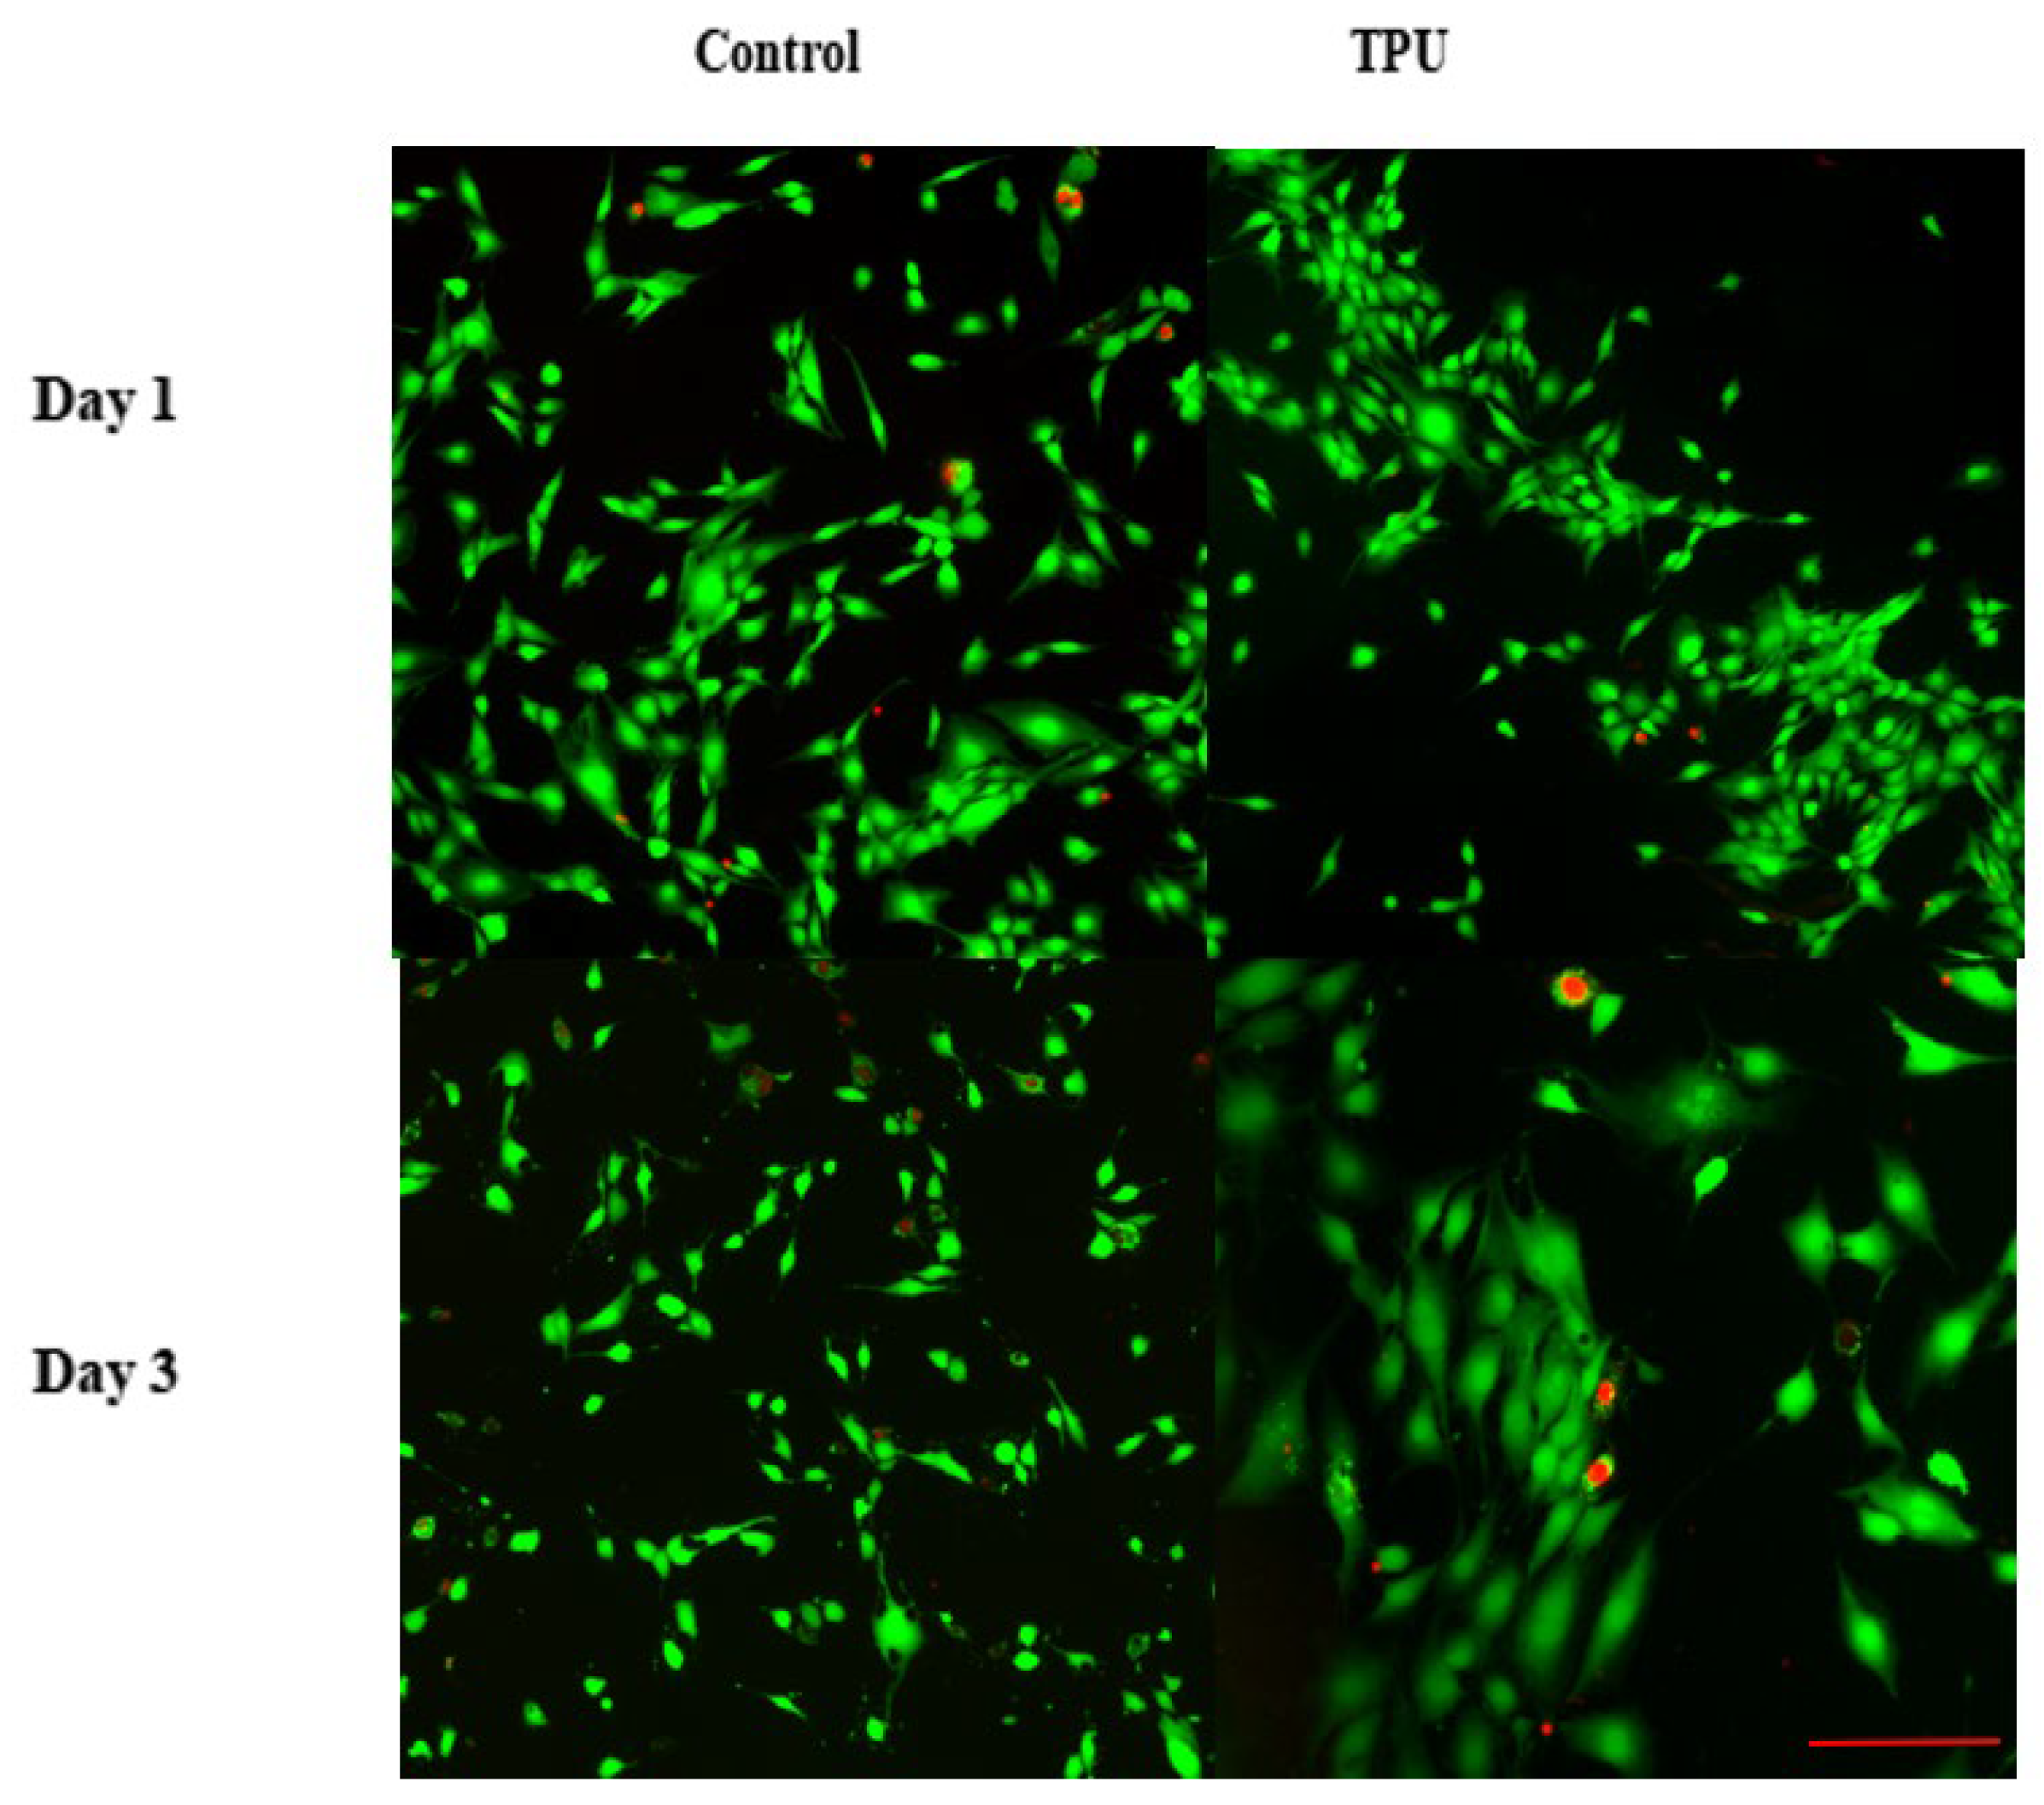
2.3.4. Water Vapor Permeability Resistance and Biocompatibility
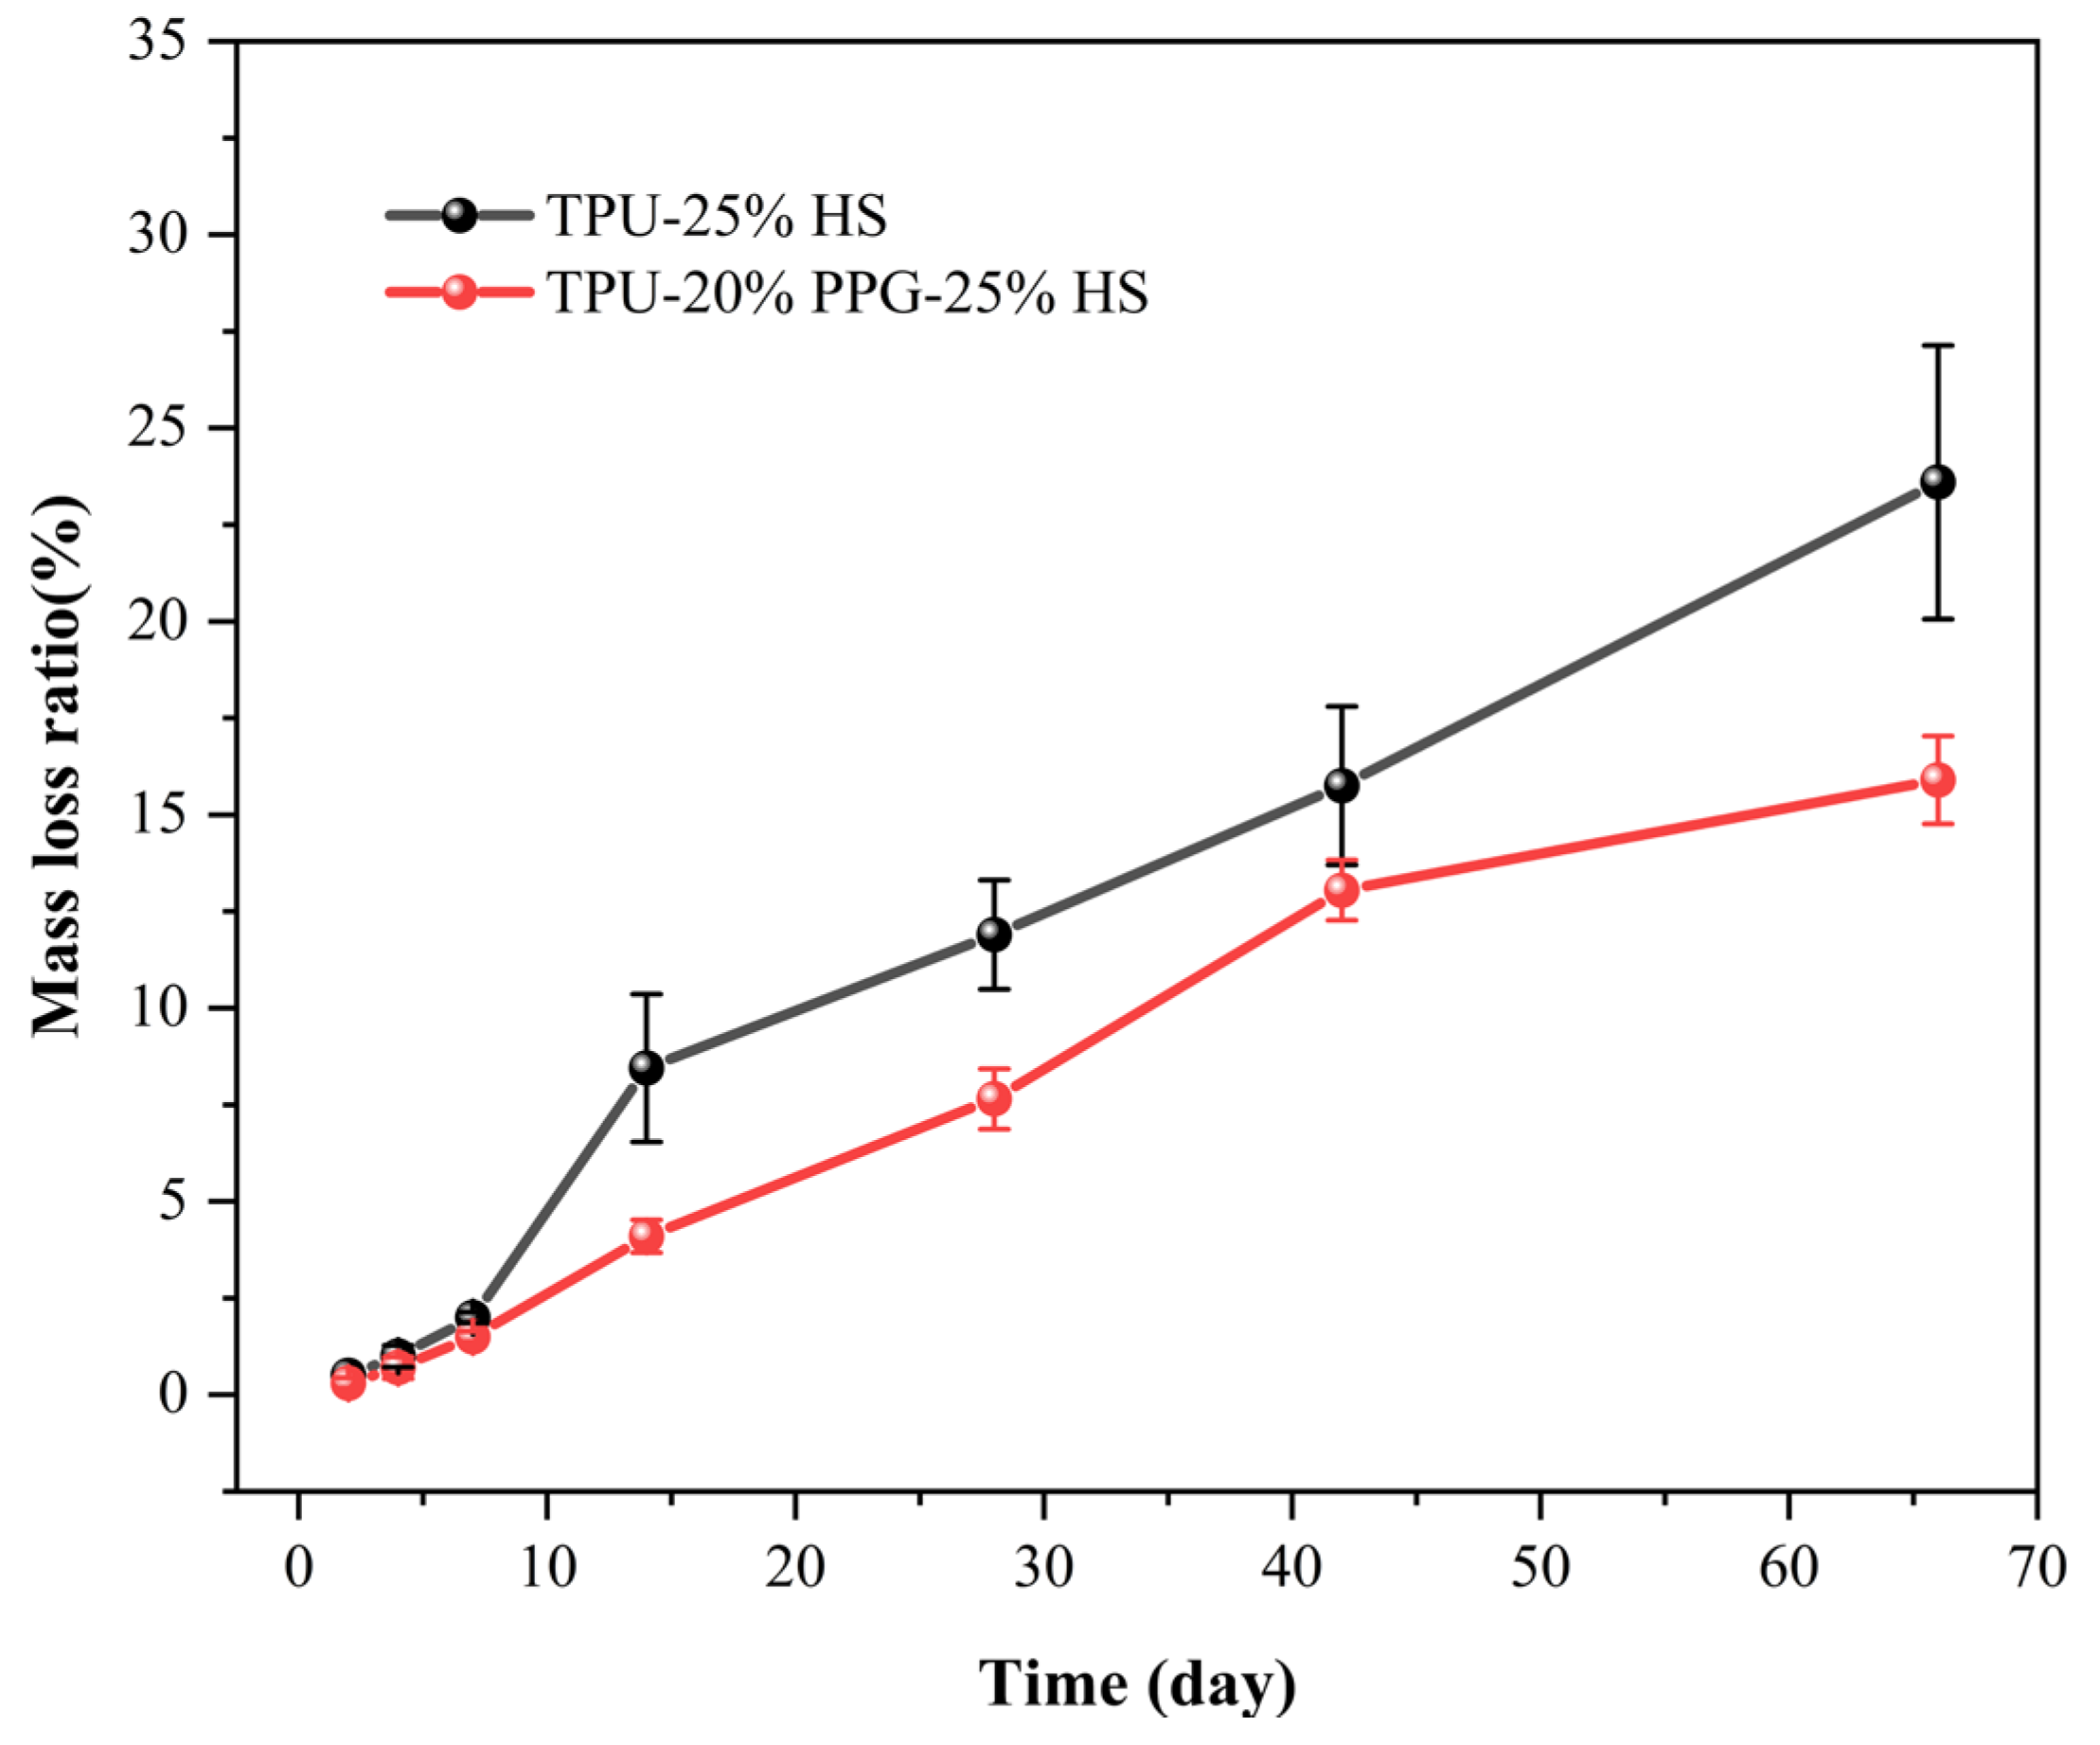
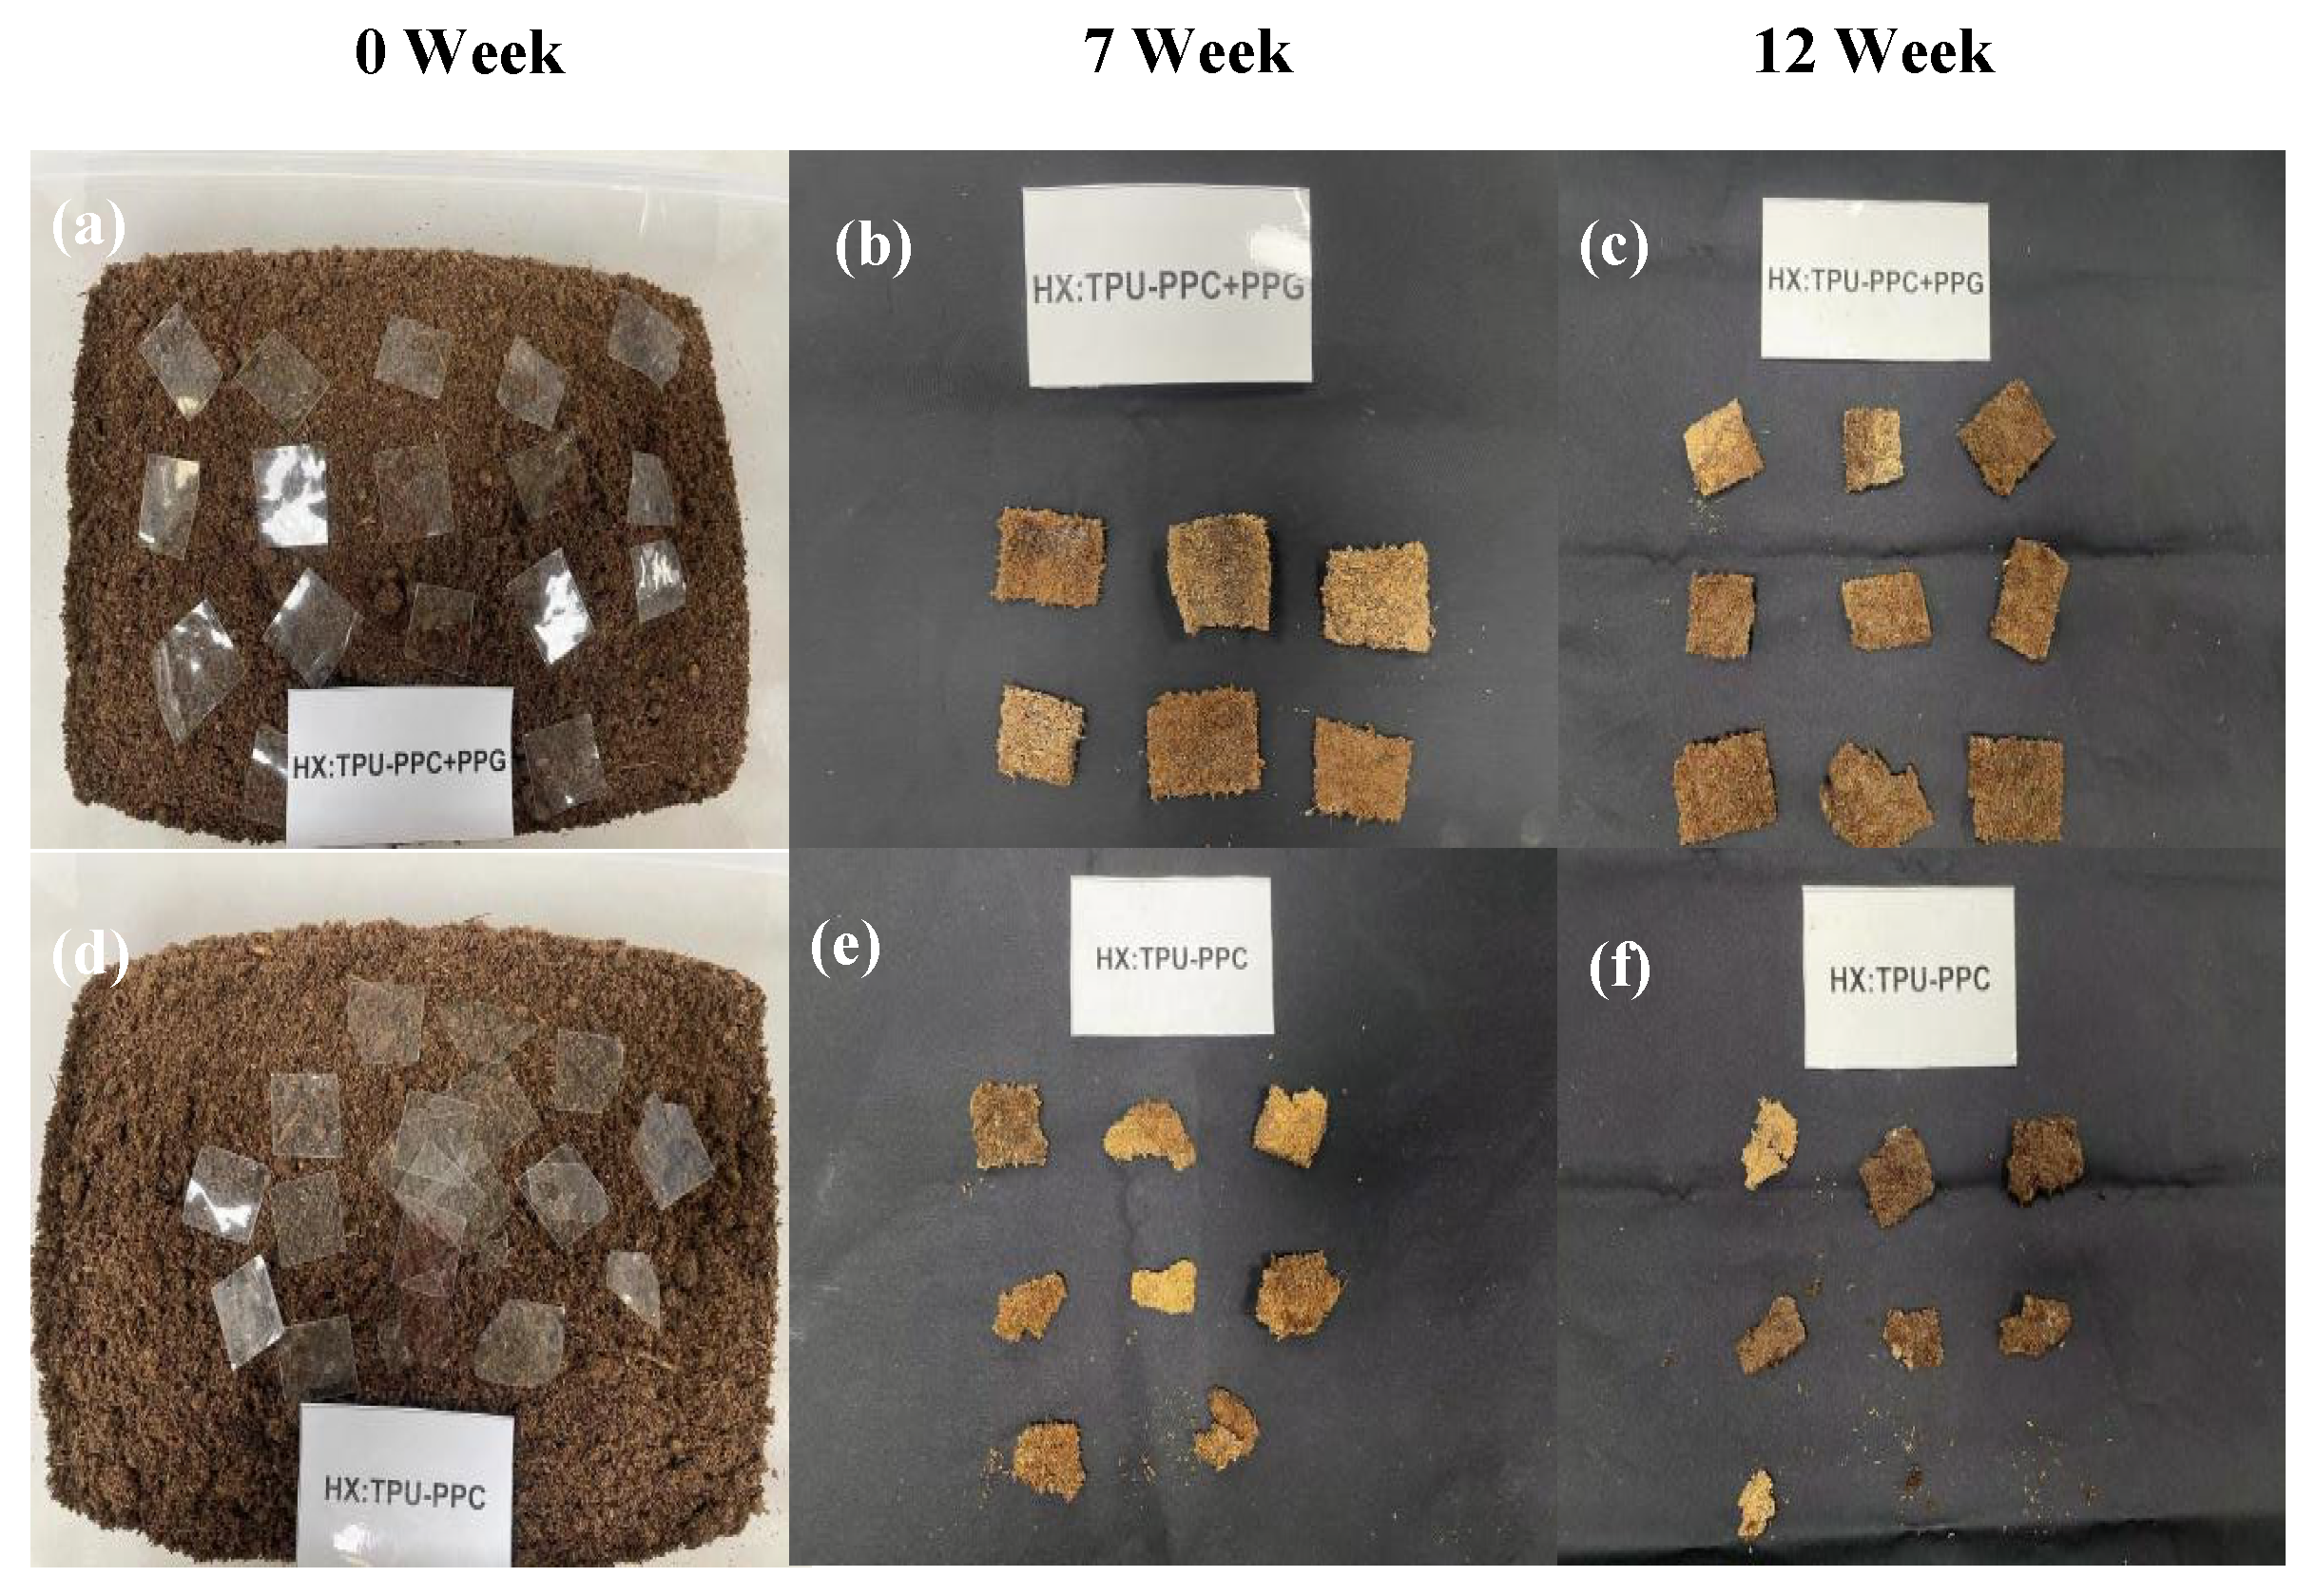
2.3.5. Biodegradability
3. Materials and Methods
3.1. Material
3.2. Preparation of PPCDLs
3.3. Preparation of PPCDL and PPG-Based Thermoplastic Polyurethanes
3.4. Measurement
4. Conclusions
Supplementary Materials
Author Contributions
Funding
Institutional Review Board Statement
Informed Consent Statement
Data Availability Statement
Conflicts of Interest
References
- Maisonneuve, L.; Lebarbé, T.; Grau, E.; Cramail, H. Structure–Properties Relationship of Fatty Acid-Based Thermoplastics as Synthetic Polymer Mimics. Polym. Chem. 2013, 4, 5472. [Google Scholar] [CrossRef]
- Chang, Z.; Zhang, M.; Hudson, A.G.; Orler, E.B.; Moore, R.B.; Wilkes, G.L.; Turner, S.R. Synthesis and Properties of Segmented Polyurethanes with Triptycene Units in the Hard Segment. Polymer 2013, 54, 6910–6917. [Google Scholar] [CrossRef]
- Yilgör, I.; Yilgör, E.; Wilkes, G.L. Critical Parameters in Designing Segmented Polyurethanes and Their Effect on Morphology and Properties: A Comprehensive Review. Polymer 2015, 58, A1–A36. [Google Scholar] [CrossRef]
- Oh, J.; Kim, Y.K.; Hwang, S.-H.; Kim, H.-C.; Jung, J.-H.; Jeon, C.-H.; Kim, J.; Lim, S.K. Synthesis of Thermoplastic Polyurethanes Containing Bio-Based Polyester Polyol and Their Fiber Property. Polymers 2022, 14, 2033. [Google Scholar] [CrossRef] [PubMed]
- Chang, C.-C.; Chen, K.-S.; Yu, T.L.; Chen, Y.-S.; Tsai, C.-L.; Tseng, Y.-H. Phase Segregation of Polyester Based-Polyurethanes. Polym. J. 1999, 31, 1205–1210. [Google Scholar] [CrossRef]
- Zdrahala, R.J.; Gerkin, R.M.; Hager, S.L.; Critchfield, F.E. Polyether-Based Thermoplastic Polyurethanes. I. Effect of the Hard-Segment Content. J. Appl. Polym. Sci. 1979, 24, 2041–2050. [Google Scholar] [CrossRef]
- Quan, H.; Wei, Z.; Li, Q.; Li, S.; Ni, L. Effects of Heterogeneous Linear Polyether Segments on the Membrane Breathability of Nonionic Polyurethane. J. Macromol. Sci. Part B 2021, 60, 914–927. [Google Scholar] [CrossRef]
- Peng, F.; Yang, X.; Zhu, Y.; Wang, G. Effect of the Symmetry of Polyether Glycols on Structure-Morphology-Property Behavior of Polyurethane Elastomers. Polymer 2022, 239, 124429. [Google Scholar] [CrossRef]
- Wang, J.; Zhang, H.; Miao, Y.; Qiao, L.; Wang, X.; Wang, F. Waterborne Polyurethanes from CO2 Based Polyols with Comprehensive Hydrolysis/Oxidation Resistance. Green Chem. 2016, 18, 524–530. [Google Scholar] [CrossRef]
- Subhani, M.A.; Köhler, B.; Gürtler, C.; Leitner, W.; Müller, T.E. Transparent Films from CO2-Based Polyunsaturated Poly(Ether Carbonate)s: A Novel Synthesis Strategy and Fast Curing. Angew. Chem. Int. Ed. 2016, 55, 5591–5596. [Google Scholar] [CrossRef]
- Phung Hai, T.A.; Tessman, M.; Neelakantan, N.; Samoylov, A.A.; Ito, Y.; Rajput, B.S.; Pourahmady, N.; Burkart, M.D. Renewable Polyurethanes from Sustainable Biological Precursors. Biomacromolecules 2021, 22, 1770–1794. [Google Scholar] [CrossRef] [PubMed]
- Lei, L.; Zhang, Y.; Ou, C.; Xia, Z.; Zhong, L. Synthesis and Characterization of Waterborne Polyurethanes with Alkoxy Silane Groups in the Side Chains for Potential Application in Waterborne Ink. Prog. Org. Coat. 2016, 92, 85–94. [Google Scholar] [CrossRef]
- Gao, Y.; Qin, Y.; Zhao, X.; Wang, F.; Wang, X. Selective Synthesis of Oligo (Carbonate-Ether) Diols from Copolymerization of CO2 and Propylene Oxide under Zinc-Cobalt Double Metal Cyanide Complex. J. Polym. Res. 2012, 19, 9878. [Google Scholar] [CrossRef]
- Ma, K.; Bai, Q.; Zhang, L.; Liu, B. Synthesis of Flame-Retarding Oligo (Carbonate-Ether) Diols via Double Metal Cyanide Complex-Catalyzed Copolymerization of PO and CO2 Using Bisphenol A as a Chain Transfer Agent. RSC Adv. 2016, 6, 48405–48410. [Google Scholar] [CrossRef]
- Rokicki, G.; Kowalczyk, T. Synthesis of Oligocarbonate Diols and Their Characterization by MALDI-TOF Spectrometry. Polymer 2000, 41, 9013–9031. [Google Scholar] [CrossRef]
- Luo, W.; Qin, J.; Xiao, M.; Han, D.; Wang, S.; Meng, Y. Synthesis of Aliphatic Carbonate Macrodiols and Their Application as Sustainable Feedstock for Polyurethane. ACS Omega 2017, 2, 3205–3213. [Google Scholar] [CrossRef]
- Sakakura, T.; Choi, J.-C.; Yasuda, H. Transformation of Carbon Dioxide. Chem. Rev. 2007, 107, 2365–2387. [Google Scholar] [CrossRef]
- Mikkelsen, M.; Jørgensen, M.; Krebs, F.C. The Teraton Challenge. A Review of Fixation and Transformation of Carbon Dioxide. Energy Environ. Sci. 2010, 3, 43–81. [Google Scholar] [CrossRef]
- Liu, Q.; Wu, L.; Jackstell, R.; Beller, M. ChemInform Abstract: Using Carbon Dioxide as a Building Block in Organic Synthesis. ChemInform 2016, 47, 5933. [Google Scholar] [CrossRef]
- Liu, S.; Zhao, X.; Guo, H.; Qin, Y.; Wang, X.; Wang, F. Construction of Well-Defined Redox-Responsive CO2-Based Polycarbonates: Combination of Immortal Copolymerization and Prereaction Approach. Macromol. Rapid Commun. 2017, 38, 1600754. [Google Scholar] [CrossRef]
- Cyriac, A.; Lee, S.H.; Varghese, J.K.; Park, E.S.; Park, J.H.; Lee, B.Y. Immortal CO2/Propylene Oxide Copolymerization: Precise Control of Molecular Weight and Architecture of Various Block Copolymers. Macromolecules 2010, 43, 7398–7401. [Google Scholar] [CrossRef]
- Cyriac, A.; Lee, S.H.; Varghese, J.K.; Park, J.H.; Jeon, J.Y.; Kim, S.J.; Lee, B.Y. Preparation of Flame-Retarding Poly (Propylene Carbonate). Green Chem. 2011, 13, 3469–3475. [Google Scholar] [CrossRef]
- Ye, S.; Xiang, X.; Wang, S.; Han, D.; Xiao, M.; Meng, Y. Nonisocyanate CO2-Based Poly(Ester-Co.-Urethane)s with Tunable Performances: A Potential Alternative to Improve the Biodegradability of PBAT. ACS Sustain. Chem. Eng. 2020, 8, 1923–1932. [Google Scholar] [CrossRef]
- Darensbourg, D.J.; Wilson, S.J. What’s New with CO2? Recent Advances in Its Copolymerization with Oxiranes. Green Chem. 2012, 14, 2665. [Google Scholar] [CrossRef]
- Alagi, P.; Ghorpade, R.; Choi, Y.J.; Patil, U.; Kim, I.; Baik, J.H.; Hong, S.C. Carbon Dioxide-Based Polyols as Sustainable Feedstock of Thermoplastic Polyurethane for Corrosion-Resistant Metal Coating. ACS Sustain. Chem. Eng. 2017, 5, 3871–3881. [Google Scholar] [CrossRef]
- Lee, S.H.; Cyriac, A.; Jeon, J.Y.; Lee, B.Y. Preparation of Thermoplastic Polyurethanes Using in Situ Generated Poly(Propylene Carbonate)-Diols. Polym. Chem. 2012, 3, 1215. [Google Scholar] [CrossRef]
- Huang, X.; Alferov, K.; Zhao, T.; Yin, J.; Wang, S.; Han, D.; Huang, S.; Huang, Z.; Xiao, M.; Meng, Y. Facile and Direct Synthesis of Oligocarbonate Diols from Carbon Dioxide and Their Application as Sustainable Feedstock for Polyurethane. J. CO2 Util. 2023, 75, 102571. [Google Scholar] [CrossRef]
- Zhao, T.; Chen, S.; Huang, X.; Yin, J.; Wang, S.; Han, D.; Huang, S.; Huang, Z.; Xiao, M.; Meng, Y. Metal-Free Synthesis of Biodegradable CO2-Based Oligo(Carbonate-Ester) Diols as Building Blocks for Thermoplastic Polyurethanes. ACS Appl. Polym. Mater. 2024, 6, 1813–1822. [Google Scholar] [CrossRef]
- von der Assen, N.; Bardow, A. Life Cycle Assessment of Polyols for Polyurethane Production Using CO2 as Feedstock: Insights from an Industrial Case Study. Green Chem. 2014, 16, 3272–3280. [Google Scholar] [CrossRef]
- Wu, C.-H.; Chen, C.-W.; Chen, P.-H.; Chen, Y.-S.; Chuan, F.-S.; Rwei, S.-P. Characteristics of Polycarbonate Soft Segment-Based Thermoplastic Polyurethane. Appl. Sci. 2021, 11, 5359. [Google Scholar] [CrossRef]
- Wu, Y.-H.; Wang, C.-C.; Chen, C.-Y. Effect of the Cyclic Structure Content on Aliphatic Polycarbonate-Based Polyurethane. Polym. J. 2021, 53, 695–702. [Google Scholar] [CrossRef]
- Gu, G.; Dong, J.; Duan, Z.; Liu, B. Construction of Mechanically Reinforced Thermoplastic Polyurethane from Carbon Dioxide-Based Poly(Ether Carbonate) Polyols via Coordination Cross-Linking. Polymers 2021, 13, 2765. [Google Scholar] [CrossRef]
- Luinstra, G.A.; Haas, G.R.; Molnar, F.; Bernhart, V.; Eberhardt, R.; Rieger, B. On the Formation of Aliphatic Polycarbonates from Epoxides with Chromium(III) and Aluminum(III) Metal-Salen Complexes. Chem. Eur. J. 2005, 11, 6298–6314. [Google Scholar] [CrossRef] [PubMed]
- Chattopadhyay, D.K.; Raju, K.V.S.N. Structural Engineering of Polyurethane Coatings for High Performance Applications. Prog. Polym. Sci. 2007, 32, 352–418. [Google Scholar] [CrossRef]
- Mattia, J.; Painter, P. A Comparison of Hydrogen Bonding and Order in a Polyurethane and Poly(Urethane–urea) and Their Blends with Poly(Ethylene Glycol). Macromolecules 2007, 40, 1546–1554. [Google Scholar] [CrossRef]
- Zhang, Q.; Lin, X.; Chen, W.; Jiang, K.; Han, D. Applications of Characterization Methods in Polyurethane Materials: Analysis of Microphase-Separated Structures. Appl. Spectrosc. Rev. 2022, 57, 153–176. [Google Scholar] [CrossRef]
- Langanke, J.; Wolf, A.; Hofmann, J.; Böhm, K.; Subhani, M.A.; Müller, T.E.; Leitner, W.; Gürtler, C. Carbon Dioxide (CO2) as Sustainable Feedstock for Polyurethane Production. Green Chem. 2014, 16, 1865–1870. [Google Scholar] [CrossRef]
- Ma, L.; Song, L.; Wang, H.; Fan, L.; Liu, B. Synthesis and Characterization of Poly(Propylene Carbonate) Glycol-Based Waterborne Polyurethane with a High Solid Content. Prog. Org. Coat. 2018, 122, 38–44. [Google Scholar] [CrossRef]
- Kim, S.; Jeon, H.; Shin, S.; Park, S.; Jegal, J.; Hwang, S.Y.; Oh, D.X.; Park, J. Superior Toughness and Fast Self-Healing at Room Temperature Engineered by Transparent Elastomers. Adv. Mater. 2018, 30, 1705145. [Google Scholar] [CrossRef]
- Lai, Y.; Kuang, X.; Zhu, P.; Huang, M.; Dong, X.; Wang, D. Colorless, Transparent, Robust, and Fast Scratch-Self-Healing Elastomers via a Phase-Locked Dynamic Bonds Design. Adv. Mater. 2018, 30, 1802556. [Google Scholar] [CrossRef]
- Qin, J.; Lin, L.; Wang, S.; Ye, S.; Luo, W.; Xiao, M.; Han, D.; Meng, Y. Multiblock Copolymers of PPC with Oligomeric PBS: With Low Brittle—Toughness Transition Temperature. RSC Adv. 2018, 8, 14722–14731. [Google Scholar] [CrossRef] [PubMed]
- Zhai, L.; Li, G.; Xu, Y.; Xiao, M.; Wang, S.; Meng, Y. Poly(Propylene Carbonate)/Aluminum Flake Composite Films with Enhanced Gas Barrier Properties. J. Appl. Polym. Sci. 2015, 132, app.41663. [Google Scholar] [CrossRef]
- Liu, X.; Xu, W.; Li, W.; Chen, Y.; Rao, J. Mechanical and Water Vapor Transport Properties of Polyurethane/Superfine down Powder Composite Membranes. Polym. Eng. Sci. 2010, 50, 2400–2407. [Google Scholar] [CrossRef]
- GB/T 12008.3; Plastics-Polyether Polyols-Part 3: Determination of Hydroxyl Number. Standards Press of China: Beijing, China, 2009.
- GB/T 1040.2; Plastics-Determination of Tensile Properties-Part 2: Test Conditions for Moulding and Extrusion Plastics. Standards Press of China: Beijing, China, 2006.
- ISO 15106-2; Film and Sheeting-Determination of Water Vapour Transmission Rate-Part 2: Infrared Detection Sensor Method. International Standard Published: Geneva, Switzerland, 2003.
- ISO 20200; Determination of the degree of disintegration of plastic materials under simulated composting conditions in a laboratory-scale test. International Standard Published: Geneva, Switzerland, 2023.


| Samples | Ingredient | Mn c (kg/mol) | |||
|---|---|---|---|---|---|
| PPCDL a (g) | PPG b (g) | HMDI (g) | BDO (g) | ||
| TPU-15%HS | 7.3 | 0 | 1.2 | 0.057 | 34 |
| TPU-25%HS | 7.5 | 0 | 2.1 | 0.36 | 38 |
| TPU-10%PPG-25%HS | 6.4 | 0.64 | 2.0 | 0.32 | 39 |
| TPU-20%PPG-25%HS | 7.6 | 1.5 | 2.6 | 0.39 | 36 |
| TPU-30%PPG-25%HS | 7.8 | 2.3 | 2.9 | 0.41 | 41 |
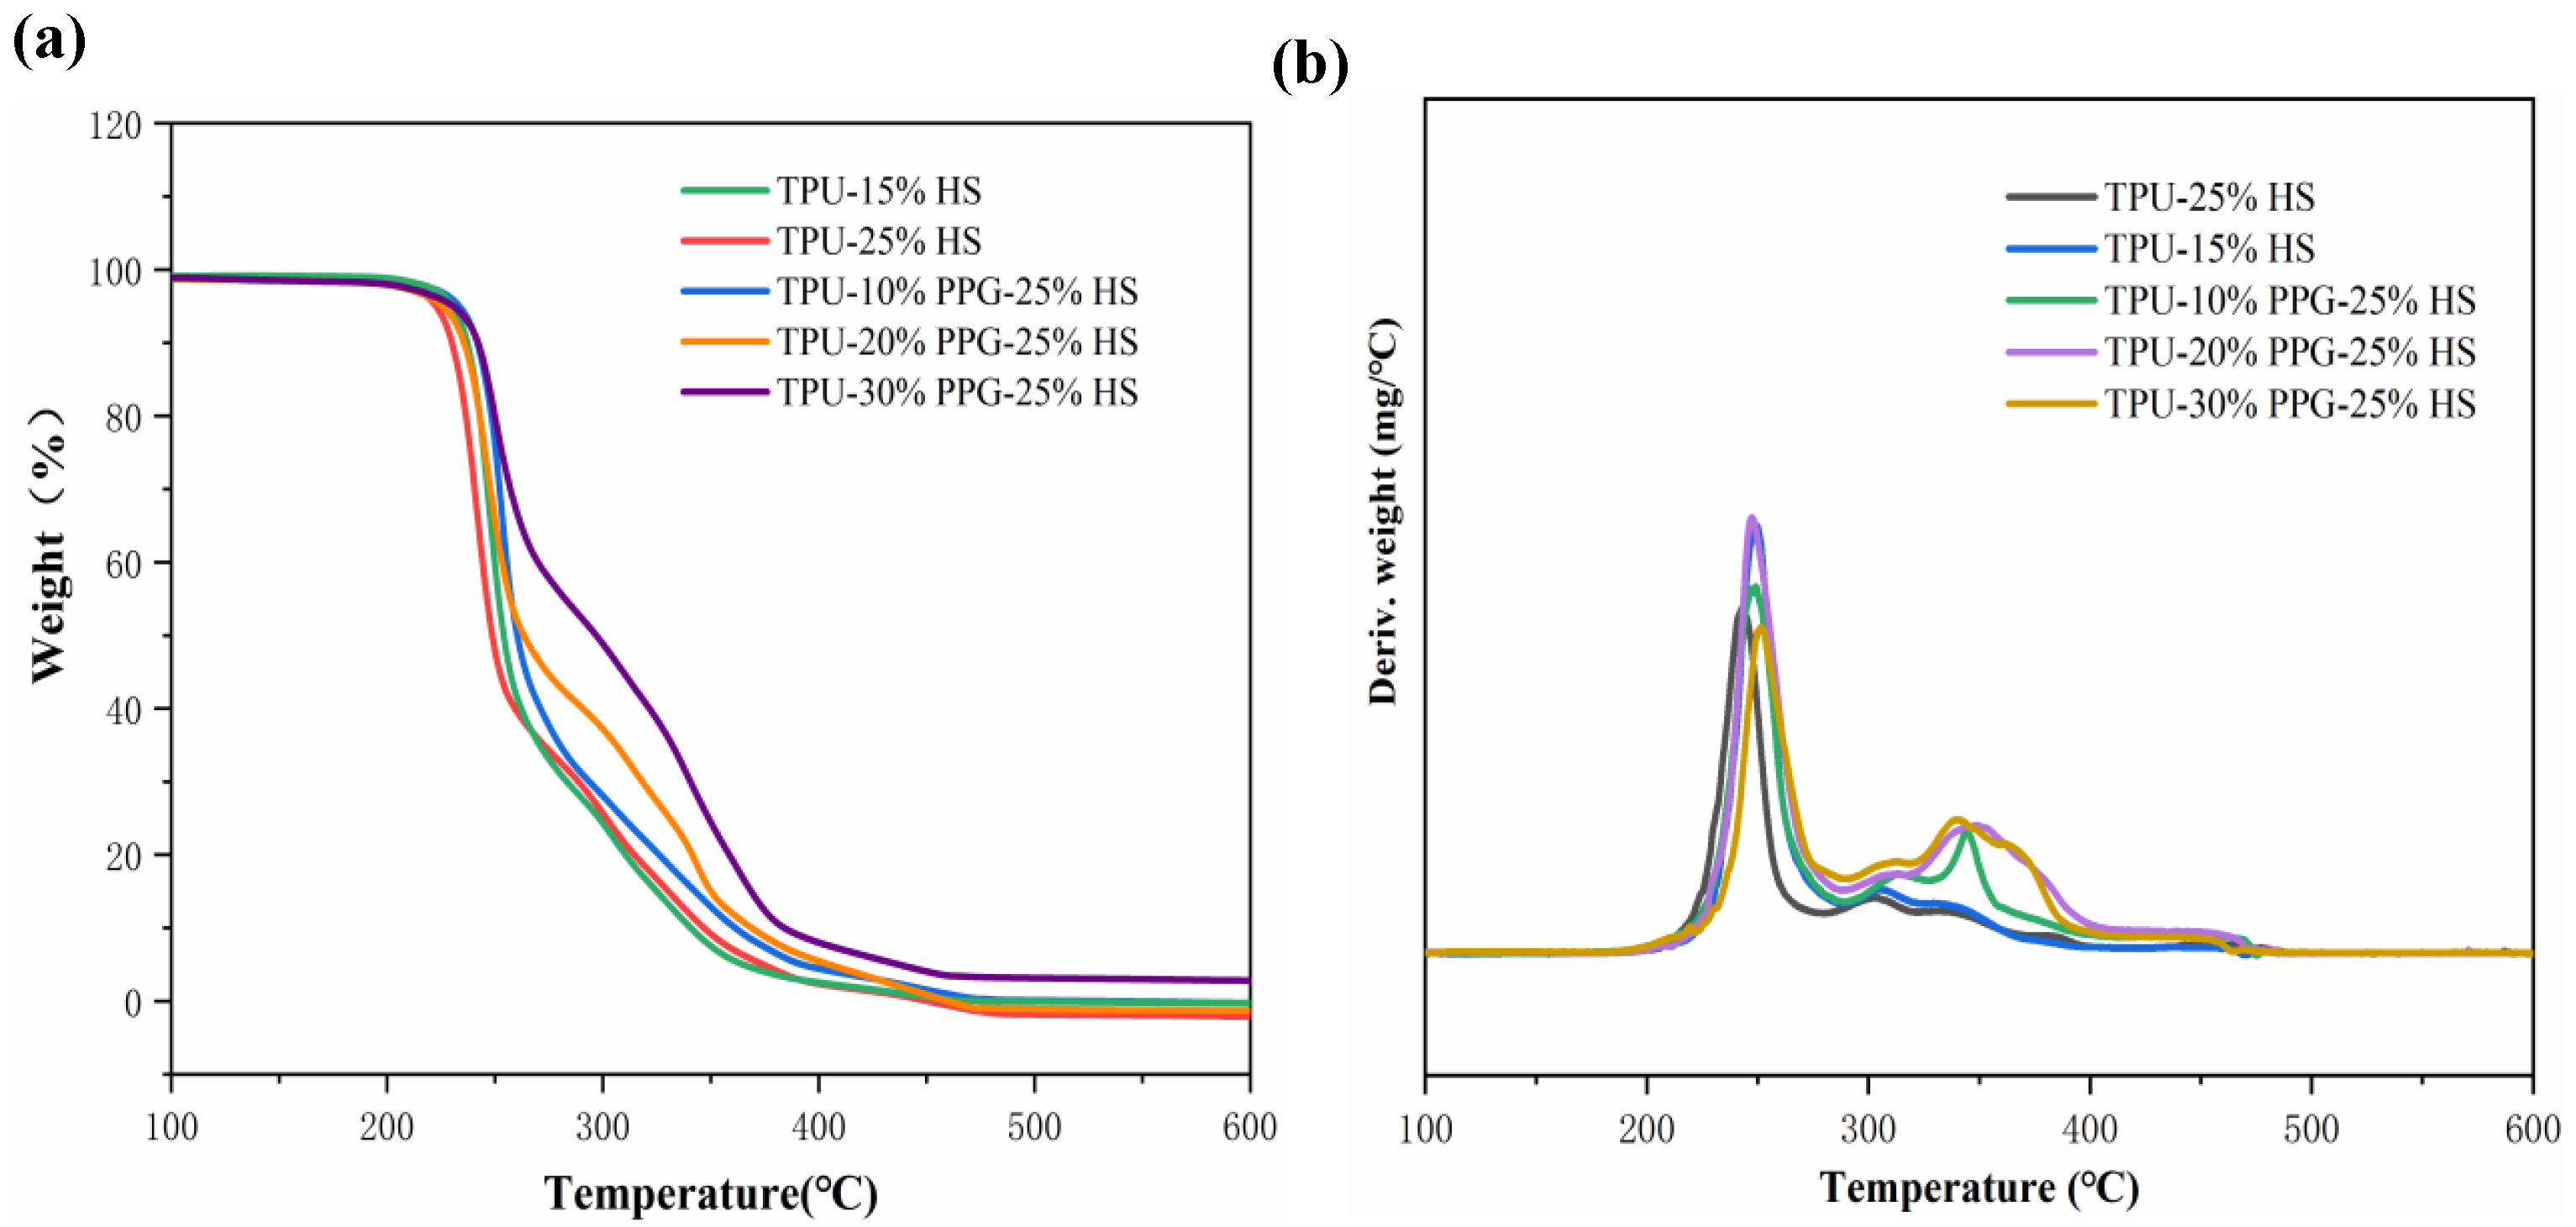
| Sample | Tg a (°C) | Td5 b (°C) | Td50 b (°C) | σ (MPa) | ε (%) | Hardness (Shore A) |
|---|---|---|---|---|---|---|
| TPU-15%HS | 43 | 226 | 254 | 12.1 ± 0.6 | 384 ± 15 | 68 |
| TPU-25%HS | 32 | 222 | 248 | 14.7 ± 1.0 | 98.5 ± 12 | 75 |
| TPU-10% PPG-25%HS | 29 | 231 | 263 | 10.1 ± 0.5 | 438 ± 40 | 60 |
| TPU-20% PPG-25%HS | 26 | 225 | 265 | 7.5 ± 0.5 | 730 ± 35 | 55 |
| TPU-30% PPG-25%HS | 16 | 230 | 296 | 4.5 ± 0.4 | 886 ± 40 | 48 |
| Samples | 1st Cycle | 2nd Cycle | 3nd Cycle | 4th Cycle | ||||
|---|---|---|---|---|---|---|---|---|
| Rf | Rr | Rf | Rr | Rf | Rr | Rf | Rr | |
| TPU-10% PPG-25%HS | 98.2 | 72.4 | 97.3 | 60.4 | 96.4 | 90.8 | 97.0 | 91.1 |
| TPU-30% PPG-25%HS | 99.8 | 73.8 | 98.8 | 92.1 | 98.5 | 93.6 | 99.5 | 93.5 |
| Sample | Weight Loss (wt%) | Mn (g/mol) | Mw (g/mol) | PDI |
|---|---|---|---|---|
| TPU-25%HS | original | 38,000 | 67,000 | 1.76 |
| 23.6 | 8500 | 15,000 | 1.76 | |
| TPU-20%PPG-25%HS | original | 36,000 | 71,000 | 1.82 |
| 15.9 | 10,300 | 20,000 | 1.94 |
Disclaimer/Publisher’s Note: The statements, opinions and data contained in all publications are solely those of the individual author(s) and contributor(s) and not of MDPI and/or the editor(s). MDPI and/or the editor(s) disclaim responsibility for any injury to people or property resulting from any ideas, methods, instructions or products referred to in the content. |
© 2024 by the authors. Licensee MDPI, Basel, Switzerland. This article is an open access article distributed under the terms and conditions of the Creative Commons Attribution (CC BY) license (https://creativecommons.org/licenses/by/4.0/).
Share and Cite
Huang, X.; Zhao, T.; Wang, S.; Han, D.; Huang, S.; Guo, H.; Xiao, M.; Meng, Y. Self-Healable, Transparent, Biodegradable, and Shape Memorable Polyurethanes Derived from Carbon Dioxide-Based Diols. Molecules 2024, 29, 4364. https://doi.org/10.3390/molecules29184364
Huang X, Zhao T, Wang S, Han D, Huang S, Guo H, Xiao M, Meng Y. Self-Healable, Transparent, Biodegradable, and Shape Memorable Polyurethanes Derived from Carbon Dioxide-Based Diols. Molecules. 2024; 29(18):4364. https://doi.org/10.3390/molecules29184364
Chicago/Turabian StyleHuang, Xin, Tingting Zhao, Shuanjin Wang, Dongmei Han, Sheng Huang, Hui Guo, Min Xiao, and Yuezhong Meng. 2024. "Self-Healable, Transparent, Biodegradable, and Shape Memorable Polyurethanes Derived from Carbon Dioxide-Based Diols" Molecules 29, no. 18: 4364. https://doi.org/10.3390/molecules29184364
APA StyleHuang, X., Zhao, T., Wang, S., Han, D., Huang, S., Guo, H., Xiao, M., & Meng, Y. (2024). Self-Healable, Transparent, Biodegradable, and Shape Memorable Polyurethanes Derived from Carbon Dioxide-Based Diols. Molecules, 29(18), 4364. https://doi.org/10.3390/molecules29184364