
Moderate Signal Enhancement in Electrospray Ionization Mass Spectrometry by Focusing Electrospray Plume with a Dielectric Layer around the Mass Spectrometer’s Orifice

 , ,
, ,
Abstract
1. Introduction
2. Experimental Section
2.1. Chemicals
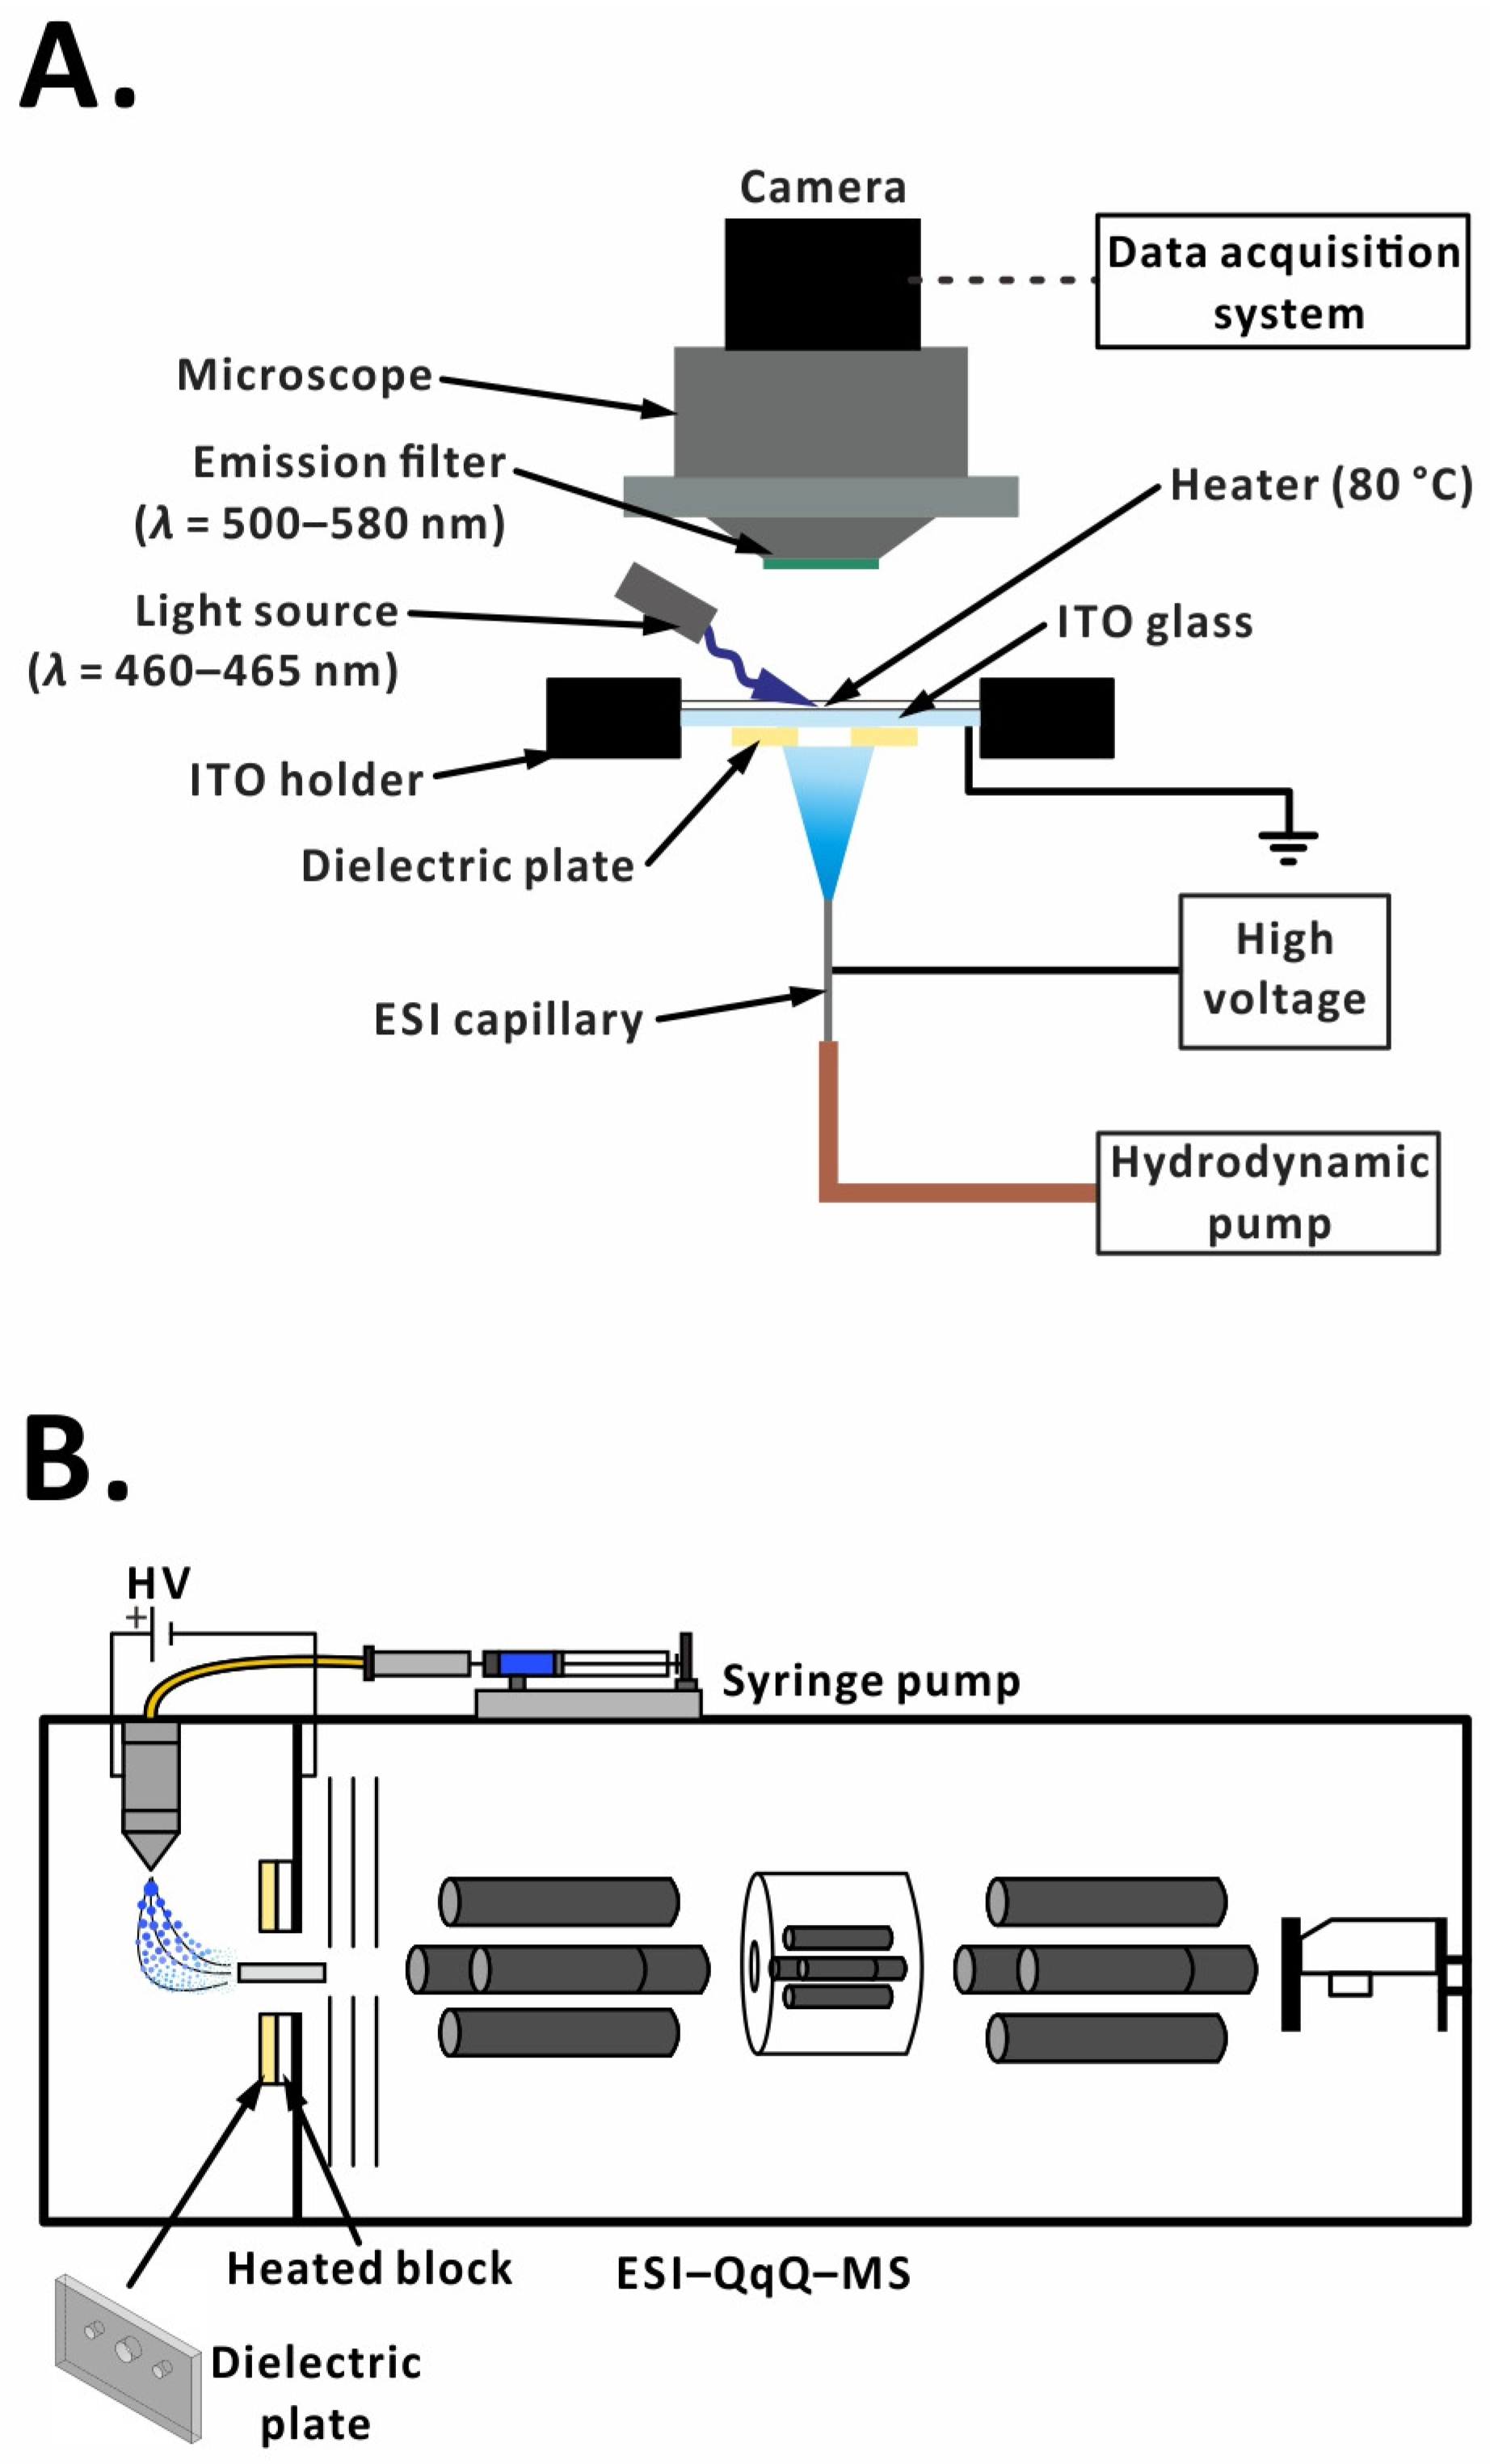
2.2. Offline Setup
2.3. Computational Simulation of Electric Field
2.4. Measurement of Surface Charge Density
2.5. Offline Experiment Data Analysis
- The raw image sequence was imported into ImageJ software (version 1.53k; National Institutes of Health, Bethesda, MD, USA; see the Supporting Information for the code to execute points 1–4).
- The frameset was subjected to background subtraction. The first frame was subtracted from all the consecutive images.
- A median filter (radius: 2 pixels) was applied to all the images to lower the noise. Then, the images were converted to 8-bit mode.
- The processed images were transformed into binary images using the threshold function (lower threshold level: 7; upper threshold level: 255).
- The “Analyze Particles” function was applied to the processed images for droplet detection (size: 0.0005–Infinity; circularity: 0.70–1.00). The droplet information for each frame was then displayed.
2.6. Online Setup
2.7. Online Experiment Data Analysis
3. Results and Discussion
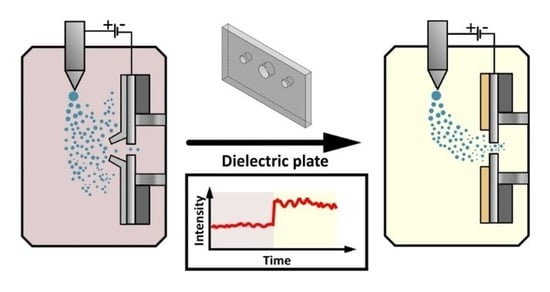
3.1. Proof-of-Concept
3.2. Offline Experiment
3.3. Online Experiment
3.4. Final Considerations
4. Conclusions
Supplementary Materials
Author Contributions
Funding
Data Availability Statement
Conflicts of Interest
References
- Yamashita, M.; Fenn, J.B. Electrospray ion source. Another variation on the free-jet theme. J. Phys. Chem. 1984, 88, 4451–4459. [Google Scholar] [CrossRef]
- Alexandrov, M.L.; Gall, L.N.; Krasnov, N.V.; Nikolaev, V.I.; Pavlenko, V.A.; Shkurov, V.A. Extraction of ions from solutions under atmospheric pressure: A method of mass spectrometric analysis of bioorganic compounds. Dokl. Akad. Nauk. SSSR 1984, 277, 379–383. [Google Scholar] [CrossRef]
- Verenchikov, A.N.; Krasnov, N.V.; Shkurov, V.A. Electrospray ionization developed by Lidija Gall’s group. Int. J. Mass Spectrom. 2023, 490, 117067. [Google Scholar]
- Manisali, I.; Chen, D.D.; Schneider, B.B. Electrospray ionization source geometry for mass spectrometry: Past, present, and future. TrAC Trends Anal. Chem. 2006, 25, 243–256. [Google Scholar] [CrossRef]
- Wilm, M. Principles of electrospray ionization. Mol. Cell. Proteom. 2011, 10, M111.009407. [Google Scholar] [CrossRef] [PubMed]
- Prabhu, G.R.D.; Williams, E.R.; Wilm, M.; Urban, P.L. Mass spectrometry using electrospray ionization. Nat. Rev. Methods Primers 2023, 3, 23. [Google Scholar]
- Kebarle, P.; Verkerk, U.H. Electrospray: From ions in solution to ions in the gas phase, what we know now. Mass Spectrom. Rev. 2009, 28, 898–917. [Google Scholar] [CrossRef]
- Crotti, S.; Seraglia, R.; Traldi, P. Some thoughts on electrospray ionization mechanisms. Eur. J. Mass Spectrom. 2011, 17, 85–99. [Google Scholar] [CrossRef]
- Banerjee, S.; Mazumdar, S. Electrospray ionization mass spectrometry: A technique to access the information beyond the molecular weight of the analyte. Int. J. Anal. Chem. 2012, 2012, 282574. [Google Scholar]
- Cañas, B.; López-Ferrer, D.; Ramos-Fernández, A.; Camafeita, E.; Calvo, E. Mass spectrometry technologies for proteomics. Brief. Funct. Genom. 2006, 4, 295–320. [Google Scholar] [CrossRef]
- Desiderio, D.C. Mass Spectrometry: Clinical and Biomedical Applications; Plenum Press: New York, NY, USA, 1994. [Google Scholar]
- Smith, R.D. Future directions for electrospray ionization for biological analysis using mass spectrometry. Biotechniques 2006, 41, 147–148. [Google Scholar] [CrossRef] [PubMed]
- Page, J.S.; Kelly, R.T.; Tang, K.; Smith, R.D. Ionization and transmission efficiency in an electrospray ionization—Mass spectrometry interface. J. Am. Soc. Mass Spectrom. 2007, 18, 1582–1590. [Google Scholar] [CrossRef] [PubMed]
- Oss, M.; Kruve, A.; Herodes, K.; Leito, I. Electrospray ionization efficiency scale of organic compounds. Anal. Chem. 2010, 82, 2865–2872. [Google Scholar] [CrossRef]
- Liigand, P.; Liigand, J.; Kaupmees, K.; Kruve, A. 30 Years of research on ESI/MS response: Trends, contradictions and applications. Anal. Chim. Acta 2021, 1152, 238117. [Google Scholar] [CrossRef] [PubMed]
- Chalcraft, K.R.; Lee, R.; Mills, C.; Britz-McKibbin, P. Virtual quantification of metabolites by capillary electrophoresis-electrospray ionization-mass spectrometry: Predicting ionization efficiency without chemical standards. Anal. Chem. 2009, 81, 2506–2515. [Google Scholar] [CrossRef] [PubMed]
- Kamel, A.M.; Brown, P.R.; Munson, B. Effects of mobile-phase additives, solution pH, ionization constant, and analyte concentration on the sensitivities and electrospray ionization mass spectra of nucleoside antiviral agents. Anal. Chem. 1999, 71, 5481–5492. [Google Scholar] [CrossRef] [PubMed]
- Zhou, S.; Hamburger, M. Effects of solvent composition on molecular ion response in electrospray mass spectrometry: Investigation of the ionization processes. Rapid Commun. Mass Spectrom. 1995, 9, 1516–1521. [Google Scholar] [CrossRef]
- Liigand, J.; Kruve, A.; Leito, I.; Girod, M.; Antoine, R. Effect of mobile phase on electrospray ionization efficiency. J. Am. Soc. Mass Spectrom. 2014, 25, 1853–1861. [Google Scholar] [CrossRef]
- Schmidt, A.; Karas, M.; Dülcks, T. Effect of different solution flow rates on analyte ion signals in nano-ESI MS, or: When does ESI turn into nano-ESI? J. Am. Soc. Mass Spectrom. 2003, 14, 492–500. [Google Scholar] [CrossRef]
- El-Faramawy, A.; Siu, K.W.M.; Thomson, B.A. Efficiency of nano-electrospray ionization. J. Am. Soc. Mass Spectrom. 2005, 16, 1702–1707. [Google Scholar] [CrossRef]
- Prabhu, G.R.D.; Witek, H.A.; Urban, P.L. Programmable flow rate scanner for evaluating detector sensitivity regime. Sens. Actuators B Chem. 2019, 282, 992–998. [Google Scholar] [CrossRef]
- Prabhu, G.R.D.; Ponnusamy, V.K.; Witek, H.A.; Urban, P.L. Sample flow rate scan in electrospray ionization mass spectrometry reveals alterations in protein charge state distribution. Anal. Chem. 2020, 92, 13042–13049. [Google Scholar] [CrossRef]
- Cox, J.T.; Marginean, I.; Smith, R.D.; Tang, K. On the ionization and ion transmission efficiencies of different ESI-MS interfaces. J. Am. Soc. Mass Spectrom. 2015, 26, 55–62. [Google Scholar] [CrossRef]
- Thompson, J.W.; Eschelbach, J.W.; Wilburn, R.T.; Jorgenson, J.W. Investigation of electrospray ionization and electrostatic focusing devices using a three-dimensional electrospray current density profiler. J. Am. Soc. Mass Spectrom. 2005, 16, 312–323. [Google Scholar] [CrossRef]
- Wilm, M.; Mann, M. Analytical properties of the nanoelectrospray ion source. Anal. Chem. 1996, 68, 1–8. [Google Scholar] [CrossRef]
- Wang, Y.W.; Prabhu, G.R.D.; Hsu, C.Y.; Urban, P.L. Tuning electrospray ionization with low-frequency sound. J. Am. Soc. Mass Spectrom. 2022, 33, 1883–1890. [Google Scholar] [CrossRef]
- Lee, J.Y.; Kottke, P.A.; Fedorov, A.G. Electrohydrodynamics of gas-assisted electrospray ionization mass spectrometry. J. Am. Soc. Mass Spectrom. 2020, 31, 2073–2085. [Google Scholar] [CrossRef]
- Smith, R.D.; Loo, J.A.; Edmonds, C.G.; Barinaga, C.J.; Udseth, H.R. New developments in biochemical mass spectrometry: Electrospray ionization. Anal. Chem. 1990, 62, 882–899. [Google Scholar] [CrossRef]
- Shaffer, S.A.; Tang, K.; Anderson, G.A.; Prior, D.C.; Udseth, H.R.; Smith, R.D. A novel ion funnel for focusing ions at elevated pressure using electrospray ionization mass spectrometry. Rapid Commun. Mass Spectrom. 1997, 11, 1813–1817. [Google Scholar] [CrossRef]
- Zhou, L.; Zhai, L.; Yue, B.; Lee, E.D.; Lee, M.L. New interface plate for microspray ionization mass spectrometry. Anal. Bioanal. Chem. 2006, 385, 1087–1091. [Google Scholar] [CrossRef]
- Bruins, A. Mass spectrometry with ion sources operating at atmospheric pressure. Mass Spectrom. Rev. 1991, 10, 53–77. [Google Scholar] [CrossRef]
- Kim, T.; Udseth, H.R.; Smith, R.D. Improved ion transmission from atmospheric pressure to high vacuum using a multicapillary inlet and electrodynamic ion funnel interface. Anal. Chem. 2000, 72, 5014–5019. [Google Scholar] [CrossRef]
- Schneider, B.B.; Javaheri, H.; Covey, T.R. Ion sampling effects under conditions of total solvent consumption. Rapid Commun. Mass Spectrom. 2006, 20, 1538–1544. [Google Scholar] [CrossRef]
- Chen, S.; Zeng, J.; Zhang, Z.; Xu, B.; Zhang, B. Recent advancements in nanoelectrospray ionization interface and coupled devices. J. Chromatogr. Open 2022, 2, 100064. [Google Scholar] [CrossRef]
- Smith, R.D.; Shen, Y.; Tang, K. Ultrasensitive and quantitative analyses from combined separations−mass spectrometry for the characterization of proteomes. Acc. Chem. Res. 2004, 37, 269–278. [Google Scholar] [CrossRef]
- Krutchinsky, A.N.; Padovan, J.C.; Cohen, H.; Chait, B.T. Maximizing ion transmission from atmospheric pressure into the vacuum of mass spectrometers with a novel electrospray interface. J. Am. Soc. Mass Spectrom. 2015, 26, 649–658. [Google Scholar] [CrossRef]
- Susa, A.C.; Xia, Z.; Williams, E.R. Native mass spectrometry from common buffers with salts that mimic the extracellular environment. Angew. Chem. Int. Ed. 2017, 56, 7912–7915. [Google Scholar] [CrossRef]
- Iavarone, A.T.; Jurchen, J.C.; Williams, E.R. Supercharged protein and peptide ions formed by electrospray ionization. Anal. Chem. 2001, 73, 1455–1460. [Google Scholar] [CrossRef]
- Iavarone, A.T.; Williams, E.R. Mechanism of charging and supercharging molecules in electrospray ionization. J. Am. Chem. Soc. 2003, 125, 2319–2327. [Google Scholar] [CrossRef]
- Monnin, C.; Ramrup, P.; Daigle-Young, C.; Vuckovic, D. Improving negative liquid chromatography/electrospray ionization mass spectrometry lipidomic analysis of human plasma using acetic acid as a mobile-phase additive. Rapid Commun. Mass Spectrom. 2018, 32, 201–211. [Google Scholar] [CrossRef]
- Pauly, M.; Sroka, M.; Reiss, J.; Rinke, G.; Albarghash, A.; Vogelgesang, R.; Rauschenbach, S. A hydrodynamically optimized nano-electrospray ionization source and vacuum interface. Analyst 2014, 139, 1856–1867. [Google Scholar] [CrossRef]
- Kelly, R.T.; Tolmachev, A.V.; Page, J.S.; Tang, K.; Smith, R.D. The ion funnel: Theory, implementations, and applications. Mass Spectrom. Rev. 2010, 29, 294–312. [Google Scholar] [CrossRef]
- Ahmed, E.; Xiao, D.; Kabir, K.M.; Fletcher, J.; Donald, W.A. Ambient pressure ion funnel: Concepts, simulations, and analytical performance. Anal. Chem. 2020, 92, 15811–15817. [Google Scholar] [CrossRef]
- Lynn, E.C.; Chung, M.C.; Han, C.C. Characterizing the transmission properties of an ion funnel. Rapid Commun. Mass Spectrom. 2000, 14, 2129–2134. [Google Scholar] [CrossRef]
- Schlottmann, F.; Allers, M.; Kirk, A.T.; Bohnhorst, A.; Zimmermann, S. A simple printed circuit board–based ion funnel for focusing low m/z ratio ions with high kinetic energies at elevated pressure. J. Am. Soc. Mass Spectrom. 2019, 30, 1813–1823. [Google Scholar] [CrossRef]
- Zou, H.; Li, J.; Jurčíček, P.; Wang, G. Microfabrication of a multilayer nano-ESI focusing electrode based on SU-8 material. Microelectron. Eng. 2013, 103, 150–155. [Google Scholar] [CrossRef]
- Iyer, K.; Marsh, B.M.; Capek, G.O.; Schrader, R.L.; Tichy, S.; Cooks, R.G. Ion manipulation in open air using 3D-printed electrodes. J. Am. Soc. Mass Spectrom. 2019, 30, 2584–2593. [Google Scholar] [CrossRef]
- Smith, B.L.; Boisdon, C.; Romero-Perez, D.; Sham, T.T.; Bastani, B.; Zhou, Y.; Maher, S. Ambient ion focusing for paper spray ionisation. Int. J. Mass Spectrom. 2022, 471, 116737. [Google Scholar] [CrossRef]
- Tang, K.; Lin, Y.; Matson, D.W.; Kim, T.; Smith, R.D. Generation of multiple electrosprays using microfabricated emitter arrays for improved mass spectrometric sensitivity. Anal. Chem. 2001, 73, 1658–1663. [Google Scholar] [CrossRef]
- Gibson, G.T.; Wright, R.D.; Oleschuk, R.D. Multiple electrosprays generated from a single polycarbonate microstructured fibre. J. Mass Spectrom. 2012, 47, 271–276. [Google Scholar] [CrossRef]
- Fu, Y.; Gibson, G.T.; Proulx, A.; Croteau, A.; Schneider, B.B.; Covey, T.R.; Oleschuk, R.D. Polymer micronozzle array for multiple electrosprays produced by templated synthesis and etching of microstructured fibers. Anal. Chem. 2015, 87, 747–753. [Google Scholar] [CrossRef]
- Mao, P.; Gomez-Sjoberg, R.; Wang, D. Multinozzle emitter array chips for small-volume proteomics. Anal. Chem. 2013, 85, 816–819. [Google Scholar] [CrossRef]
- Kelly, R.T.; Page, J.S.; Marginean, I.; Tang, K.; Smith, R.D. Nanoelectrospray emitter arrays providing interemitter electric field uniformity. Anal. Chem. 2008, 80, 5660–5665. [Google Scholar] [CrossRef]
- Su, P.; Chen, X.; Smith, A.J.; Espenship, M.F.; Samayoa Oviedo, H.Y.; Wilson, S.M.; Laskin, J. Multiplexing of electrospray ionization sources using orthogonal injection into an electrodynamic ion funnel. Anal. Chem. 2021, 93, 11576–11584. [Google Scholar] [CrossRef]
- Kottke, P.A.; Lee, J.Y.; Jonke, A.P.; Seneviratne, C.A.; Hecht, E.S.; Muddiman, D.C.; Fedorov, A.G. DRILL: An electrospray ionization-mass spectrometry interface for improved sensitivity via inertial droplet sorting and electrohydrodynamic focusing in a swirling flow. Anal. Chem. 2017, 89, 8981–8987. [Google Scholar] [CrossRef]
- Kim, J.W.; Yamagata, Y.; Kim, B.J.; Higuchi, T. Direct and dry micro-patterning of nano-particles by electrospray deposition through a micro-stencil mask. J. Micromech. Microeng. 2009, 19, 025021. [Google Scholar] [CrossRef]
- Lee, H.; You, S.; Pikhitsa, P.V.; Kim, J.; Kwon, S.; Woo, C.G.; Choi, M. Three-dimensional assembly of nanoparticles from charged aerosols. Nano Lett. 2011, 11, 119–124. [Google Scholar] [CrossRef]
- Kingsley, B.J.; Pawliczak, E.E.; Hurley, T.R.; Chiarot, P.R. Electrospray printing of polyimide films using passive material focusing. ACS Appl. Polym. Mater. 2021, 3, 6274–6284. [Google Scholar] [CrossRef]
- Kovacevich, D.A.; Lei, L.; Han, D.; Kuznetsova, C.; Kooi, S.E.; Lee, H.; Singer, J.P. Self-limiting electrospray deposition for the surface modification of additively manufactured parts. ACS Appl. Mater. Interfaces 2020, 12, 20901–20911. [Google Scholar] [CrossRef]
- Tycova, A.; Prikryl, J.; Kotzianova, A.; Datinska, V.; Velebny, V.; Foret, F. Electrospray: More than just an ionization source. Electrophoresis 2021, 42, 103–121. [Google Scholar] [CrossRef]
- Prisaznuk, J.M.; Huang, P.; Yong, X.; Chiarot, P.R. Probing colloidal assembly on non-axisymmetric droplet surfaces via electrospray. Langmuir 2023, 39, 469–477. [Google Scholar] [CrossRef]
- Morozov, V.N.; Morozova, T.Y. Electrospray deposition as a method for mass fabrication of mono-and multicomponent microarrays of biological and biologically active substances. Anal. Chem. 1999, 71, 3110–3117. [Google Scholar] [CrossRef]
- Strong, F.C. Faraday’s laws in one equation. J. Chem. Educ. 1961, 38, 98. [Google Scholar] [CrossRef]
- Wei, W.; Gu, Z.; Wang, S.; Fukuda, T.; Kase, K.; Ju, J.; Tajima, Y. Numerical simulation of nanoparticle pattern fabricated by electrostatic spray deposition. Particuology 2013, 11, 20–24. [Google Scholar] [CrossRef]
- Schneider, B.B.; Douglas, D.J.; Chen, D.D. An atmospheric pressure ion lens to improve electrospray ionization at low solution flow-rates. Rapid Commun. Mass Spectrom. 2001, 15, 2168–2175. [Google Scholar] [CrossRef]
- Wang, R.; Allmendinger, P.; Zhu, L.; Gröhn, A.J.; Wegner, K.; Frankevich, V.; Zenobi, R. The role of nebulizer gas flow in electrosonic spray ionization (ESSI). J. Am. Soc. Mass Spectrom. 2011, 22, 1234–1241. [Google Scholar] [CrossRef]
- De Hoffmann, E.; Stroobant, V. Analytical Information. In Mass Spectrometry: Principles and Applications, 3rd ed.; John Wiley & Sons: Hoboken, NJ, USA, 2007; pp. 243–268. [Google Scholar]
- Urban, P.L.; Chen, Y.-C.; Wang, Y.-S. Time-Resolved Mass Spectrometry: From Concept to Applications; John Wiley & Sons: Hoboken, NJ, USA, 2016. [Google Scholar]
- Kiontke, A.; Oliveira-Birkmeier, A.; Opitz, A.; Birkemeyer, C. Electrospray ionization efficiency is dependent on different molecular descriptors with respect to solvent pH and instrumental configuration. PLoS ONE 2016, 11, e0167502. [Google Scholar] [CrossRef]
- Markert, C.; Thinius, M.; Lehmann, L.; Heintz, C.; Stappert, F.; Wissdorf, W.; Covey, T.R. Observation of charged droplets from electrospray ionization (ESI) plumes in API mass spectrometers. Anal. Bioanal. Chem. 2021, 413, 5587–5600. [Google Scholar] [CrossRef]
- Lin, B.; Sunner, J. Ion transport by viscous gas flow through capillaries. J. Am. Soc. Mass Spectrom. 1994, 5, 873–885. [Google Scholar] [CrossRef]
- Garimella, S.; Xu, W.; Huang, G.; Harper, J.D.; Cooks, R.G.; Ouyang, Z. Gas-flow assisted ion transfer for mass spectrometry. J. Mass Spectrom. 2012, 47, 201–207. [Google Scholar] [CrossRef]
- Wei, A.A.J.; Joshi, A.; Chen, Y.; McIndoe, J.S. Strategies for avoiding saturation effects in ESI-MS. Int. J. Mass Spectrom. 2020, 450, 116306. [Google Scholar] [CrossRef]


| Compound | MRM Transition | Horizontal Offset = 1.5 mm | Horizontal Offset = 7 mm | ||||
|---|---|---|---|---|---|---|---|
| Plate A | Plate B | Plate C | Plate A | Plate B | Plate C | ||
| Acetaminophen | 152→110 | 1.24 ± 0.06 | 1.82 ± 0.19 | 1.62 ± 0.08 | 4.35 ± 0.77 | 1.31 ± 0.29 | 12.18 ± 1.48 |
| Alanine | 90→44 | 1.17 ± 0.03 | 1.14 ± 0.06 | 1.27 ± 0.06 | 0.04 ± 0.00 | 1.86 ± 0.60 | 4.40 ± 0.46 |
| Angiotensin II (singly charged) | 1047→110 | 1.86 ± 0.12 | 1.36 ± 0.13 | 1.47 ± 0.18 | 0.05 ± 0.01 | 10.52 ± 0.90 | 30.70 ± 2.98 |
| Angiotensin II (doubly charged) | 524→70 | 1.83 ± 0.16 | 1.39 ± 0.11 | 1.65 ± 0.20 | 0.09 ± 0.02 | 3.80 ± 0.40 | 10.19 ± 0.72 |
| Citrulline | 176→159 | 1.33 ± 0.09 | 1.35 ± 0.06 | 1.26 ± 0.04 | 1.08 ± 0.17 | 4.85 ± 0.56 | 10.10 ± 1.97 |
| Cloxacillin | 458→182 | 1.21 ± 0.02 | 1.39 ± 0.09 | 1.50 ± 0.09 | 0.54 ± 0.08 | 103.91 ± 23.75 | 325.69 ± 42.40 |
| Glutathione | 308→179 | 1.47 ± 0.06 | 1.16 ± 0.01 | 1.29 ± 0.03 | 0.27 ± 0.05 | 6.99 ± 0.55 | 13.36 ± 0.69 |
| Glycine | 76→30 | 0.81 ± 0.06 | 1.14 ± 0.06 | 1.32 ± 0.05 | 0.15 ± 0.02 | 2.26 ± 0.61 | 4.16 ± 0.33 |
| Glycine-Histidine peptide | 213→156 | 1.52 ± 0.06 | 1.40 ± 0.06 | 1.28 ± 0.05 | 0.61 ± 0.14 | 6.88 ± 0.79 | 24.94 ± 3.70 |
| HPF1 | 400→263 | 1.34 ± 0.05 | 1.42 ± 0.08 | 1.48 ± 0.09 | 0.17 ± 0.04 | 10.03 ± 0.56 | 21.62 ± 0.37 |
| HPF2 (singly charged) | 781→364 | 1.12 ± 0.01 | 1.27 ± 0.01 | 1.02 ± 0.01 | 2.19 ± 0.53 | 113.68 ± 21.56 | 294.69 ± 96.95 |
| HPF2 (doubly charged) | 391→110 | 1.16 ± 0.02 | 1.32 ± 0.03 | 0.90 ± 0.04 | 0.05 ± 0.00 | 7.43 ± 0.47 | 12.30 ± 1.91 |
| HPF3 * (singly charged) | 1163→110 | 0.86 ± 0.03 | 0.96 ± 0.03 | 1.02 ± 0.05 | 0.00 ± 0.00 ** | 201.49 ± 196.22 | 622.28 ± 677.48 |
| HPF3 (doubly charged) | 582→110 | 1.00 ± 0.05 | 0.94 ± 0.05 | 0.94 ± 0.01 | 0.15 ± 0.01 | 4.23 ± 0.47 | 7.50 ± 0.11 |
| HPF3 (triply charged) | 388→110 | 1.11 ± 0.14 | 1.01 ± 0.14 | 1.17 ± 0.12 | 0.28 ± 0.03 | 5.64 ± 0.83 | 8.29 ± 0.85 |
| Lysine | 147→84 | 1.65 ± 0.18 | 1.75 ± 0.02 | 1.48 ± 0.07 | 0.18 ± 0.04 | 2.24 ± 0.40 | 6.11 ± 0.24 |
| Tryptophan | 205→146 | 1.12 ± 0.06 | 1.15 ± 0.08 | 1.09 ± 0.06 | 0.76 ± 0.02 | 0.05 ± 0.05 | 15.42 ± 1.00 |
Disclaimer/Publisher’s Note: The statements, opinions and data contained in all publications are solely those of the individual author(s) and contributor(s) and not of MDPI and/or the editor(s). MDPI and/or the editor(s) disclaim responsibility for any injury to people or property resulting from any ideas, methods, instructions or products referred to in the content. |
© 2024 by the authors. Licensee MDPI, Basel, Switzerland. This article is an open access article distributed under the terms and conditions of the Creative Commons Attribution (CC BY) license (https://creativecommons.org/licenses/by/4.0/).
Share and Cite
Chua, Z.Q.; Prabhu, G.R.D.; Wang, Y.-W.; Raju, C.M.; Buchowiecki, K.; Ochirov, O.; Elpa, D.P.; Urban, P.L. Moderate Signal Enhancement in Electrospray Ionization Mass Spectrometry by Focusing Electrospray Plume with a Dielectric Layer around the Mass Spectrometer’s Orifice. Molecules 2024, 29, 316. https://doi.org/10.3390/molecules29020316
Chua ZQ, Prabhu GRD, Wang Y-W, Raju CM, Buchowiecki K, Ochirov O, Elpa DP, Urban PL. Moderate Signal Enhancement in Electrospray Ionization Mass Spectrometry by Focusing Electrospray Plume with a Dielectric Layer around the Mass Spectrometer’s Orifice. Molecules. 2024; 29(2):316. https://doi.org/10.3390/molecules29020316
Chicago/Turabian StyleChua, Zi Qing, Gurpur Rakesh D. Prabhu, Yi-Wun Wang, Chamarthi Maheswar Raju, Krzysztof Buchowiecki, Ochir Ochirov, Decibel P. Elpa, and Pawel L. Urban. 2024. "Moderate Signal Enhancement in Electrospray Ionization Mass Spectrometry by Focusing Electrospray Plume with a Dielectric Layer around the Mass Spectrometer’s Orifice" Molecules 29, no. 2: 316. https://doi.org/10.3390/molecules29020316
APA StyleChua, Z. Q., Prabhu, G. R. D., Wang, Y.-W., Raju, C. M., Buchowiecki, K., Ochirov, O., Elpa, D. P., & Urban, P. L. (2024). Moderate Signal Enhancement in Electrospray Ionization Mass Spectrometry by Focusing Electrospray Plume with a Dielectric Layer around the Mass Spectrometer’s Orifice. Molecules, 29(2), 316. https://doi.org/10.3390/molecules29020316