Article

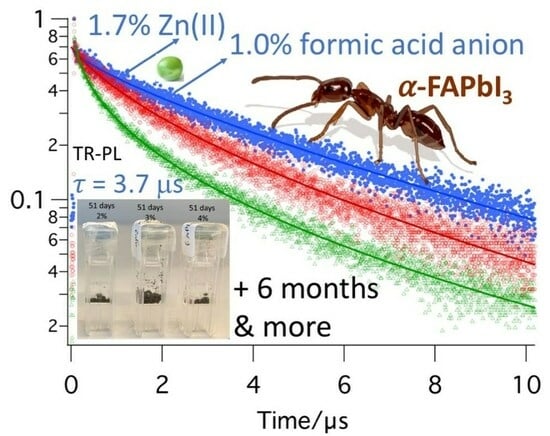
Synergistic Zinc(II) and Formate Doping of Perovskites: Thermal Phase Stabilization of α-FAPbI3 and Enhanced Photoluminescence Lifetime of FA0.8MA0.2PbI3 up to 3.7 µs

Molecular Photonics Group, van ’t Hoff Institute for Molecular Sciences (HIMS), Universiteit van Amsterdam, Science Park 904, 1098 XH Amsterdam, The Netherlands
*
Author to whom correspondence should be addressed.
Molecules 2024, 29(2), 516; https://doi.org/10.3390/molecules29020516
Submission received: 9 November 2023 / Revised: 16 January 2024 / Accepted: 18 January 2024 / Published: 20 January 2024
(This article belongs to the Topic Thin-Film Photovoltaics: Constituents and Devices)

Abstract

:
Adding zinc (II) cations and formate anions improves the thermal phase stability of α-FAPbI3 materials, and the spin-coated thin films of such doped FAPbI3 (produced using MACl) show an increased emission lifetime of up to 3.7 μs on quartz (for FA0.8MA0.2PbI3). This work investigates the effects of zinc and formate on the phase stability and time-resolved photoluminescence of FAPbI3 perovskites for solar cell applications. Perovskite samples with varying concentrations of zinc and formate were made by incorporating different amounts of zinc formate and zinc iodide and were characterized with XRD. Doping levels of 1.7% Zn(II) and 1.0% formate (relative to Pb) seem optimal. The thermal phase stability of the doped perovskite powders (FAPbI3) and thin films (FA0.8MA0.2PbI3) was assessed. XRD of the thin films after 6 months shows only the alpha-phase. The time-resolved photoluminescence spectroscopy of the doped spin-coated perovskite samples (FA0.8MA0.2PbI3 produced using MACl) is reported. The results show that synergy between an anionic and a cationic dopant can take place, making the perovskite thermally more phase-stable (not converting to the yellow delta-phase) with a longer charge carrier lifetime. In order to produce good thin films by spin coating, the use of MACl was essential.

Graphical Abstract

1. Introduction

Combatting the climate change that started since the industrial revolution is one of today’s most significant challenges [1]. To succeed in this challenge, greenhouse gas emissions must be drastically reduced, and electrification of society and industry is the target. In 2021, there was only a 13% contribution of solar energy to the total energy generated in a renewable way [2]. Improving the cost, efficiency, and availability of solar panels can significantly increase the global amount of electricity obtained from solar energy.
The past two decades have seen a significant increase in research into new materials for solar cells, and one of the most promising candidates is the metal halide perovskite. Since the first report describing the use of these perovskites as light-absorbing material in solar cells in 2009, the power conversion efficiency of the perovskite solar cells has been improved from 3.8% [3] to over 26% in 2023 [4]. Two factors that have significantly contributed to the rise of perovskites in solar cell research are the cheap materials and the relative ease at which devices can be produced. With the focus on performance over the past decade, the challenge now lies in understanding and improving the stability and longevity of perovskite solar cells. A similar operating lifetime as obtained for silicon solar cells should be achieved for market adaptation.
In our previous work, the effect of Zn(II) on the stability [5] and performance [6] of perovskite materials was investigated. It was found that incorporating Zn(II) into the perovskite structure results in improved stability and an increased power conversion efficiency. Zinc is a good dopant for B-site substitution, with 2.5% seeming close to the optimum. It should be noted that interface engineering has been recently reported with Zn(II) materials, giving 23.25% PCE [7].
Regarding X-site doping, formate anions are an excellent option. One of the highest recently published performances was by Jeong et al. [8], who used formate (2%) as an additive and produced a cell with a certified efficiency of 25.2%.
The primary objective of the study presented here is to explore the influence of simultaneous doping with zinc(II) cations and formate anions on the stability and performance of FAPbI3-based perovskites. We combine B and X-site doping in formamidinium lead triiodide. Experiments were conducted involving the fabrication of perovskite samples with varying concentrations of zinc and formate. These samples were fabricated by incorporating different amounts of zinc formate and zinc iodide into the precursor solutions and making powdered perovskites (FAPbI3) and thin films (FA0.8MA0.2PbI3), the latter characterized with XRD. The performance of the perovskite thin films was evaluated using time-resolved photoluminescence (TR-PL) spectroscopy. TR-PL spectroscopy enables the characterization of the decay dynamics of excited states in materials. By measuring the decay time of the excited states in the perovskite samples, information is gathered about the potential performance of the perovskite in solar cells, focused on radiative charge recombination.

2. Results and Discussion

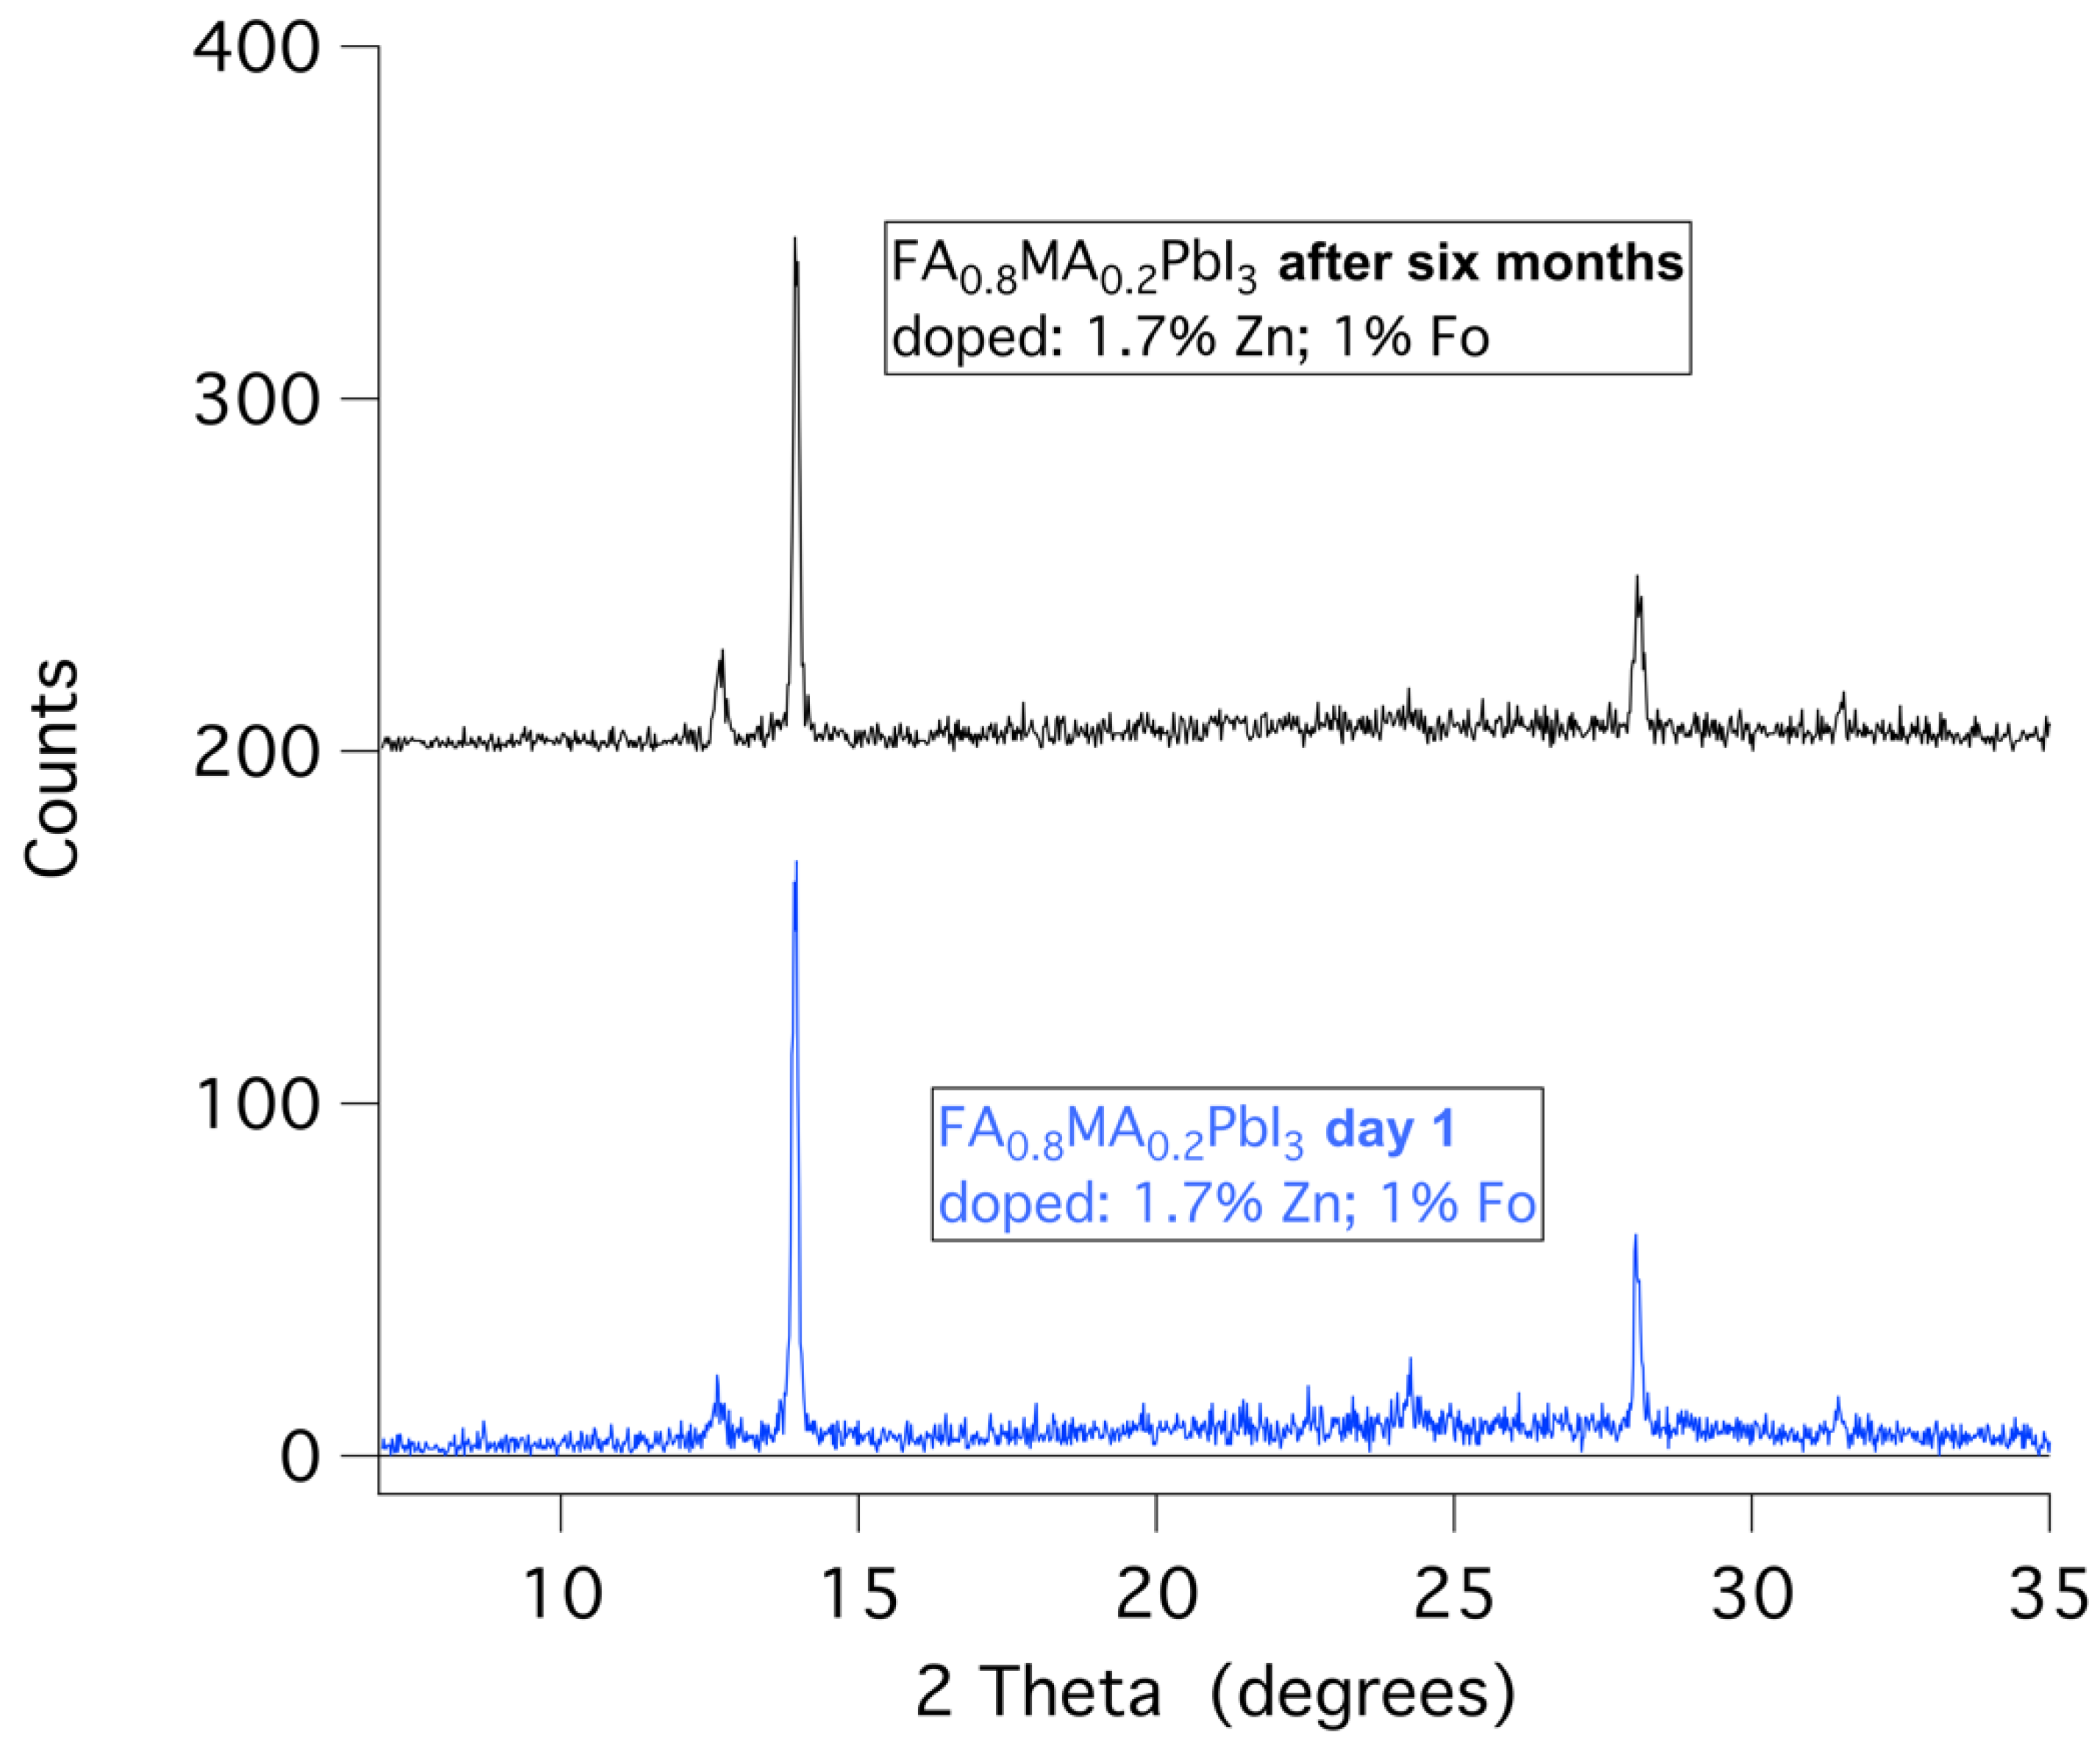
2.1. X-ray Diffraction

X-ray diffraction (XRD) measurements were performed on thin-layer samples on quartz substrates to obtain a better insight into the composition of the perovskite thin films. These samples were prepared from precursor solutions with zinc formate and zinc iodide. In Figure 1 and Figure 2, the results can be seen. The data are also presented in Table 1. The perovskites display an oriented cubic structure as this is in accordance with the diffractions at 13.9° and 28.1° [5,8,9,10]. The signal at ~24° is also an indication of the perovskite α-phase but indicates some disorder in the crystal packing of the perovskite. The layers that contain more doping have a much higher diffraction at ~12.7° corresponding to PbI2 [11,12].

2.2. Optical Properties of Doped FA0.8MA0.2PbI3 Thin Films

A first indication of good film quality can be obtained by visual inspection. Based on our previous work in which films were characterized by electron microscopy, confocal laser scanning microscopy, and optical microscopy, the following can be noted. Figure 3 represents photographs of good films in different lighting conditions using reflective and transmissive observation. The visual appearance of the spin-coated films (FA0.8MA0.2PbI3), as exemplified in Figure 3, changes from a homogeneous dark mirror-like black (as viewed in reflective mode) to a clear conformal shiny brown (when viewed in transmission mode at a bright light, like a fluorescent tube). Such appearance cannot be obtained without using MACl. Inhomogeneous films with swirls, stripes, or large pinholes were discarded.
Optical microscopy can result in a clear view of multiple-phase domains, containing PbI2 (Figure 4) as obtained for high doping (right image). Low doping results in the correct morphology, as compared with earlier studies. The (black and white) optical microscopy images directly correspond to the TR-PL samples (see later). The sample with the lowest doping has a homogeneous phase with ‘worm-like’ features, indicating strands of linked crystals with similar optical properties, as also observed in our earlier work with confocal microscopy (Figure 4 of ref. [6]). This low-doping material shows the longest PL lifetime. The optical microscopy is in agreement with the XRD (showing clear PbI2 at higher doping) and shows that a homogeneous phase displays a longer PL lifetime (see later).
UV–Vis absorption and steady-state emission spectra (with 810 nm maximum) of good films displayed in Figure 5 show correct features [5,8,13]. Emission spectra of the doped powders show a clear red shift (to 850 nm), in agreement with their constituents (FAPbI3).
Time-resolved photoluminescence (TR-PL) spectroscopic techniques have been widely used to study charge separation and extraction in perovskites [14,15,16]. Two advantages of using TR-PL are as follows: (1) it can be performed without making direct contact to the material; and (2) it allows measurements in which the presence of an HTL and an ETL can be varied [17]. In general, it can be stated that perovskites with longer emission lifetimes on quartz can, in principle, have higher performance [8,14,16].
In Figure 6, the results of the TR-PL measurements of three doped samples (FA0.8MA0.2PbI3) are displayed. The details of the fits are combined in Table 2. For each sample, optimal areas of the sample were measured. The dots represent the measurement data, and the lines represent the fits. When comparing the lifetime of the three different samples, 3.7 μs, 0.6 μs, and 1.4 μs for the light, medium, and heavily doped samples, respectively, it can be noted that there is no linear correlation with the doping level. However, clearly, low zinc doping and low formate doping positively affect the emission lifetime of these samples, to levels that have not been reached so far with single component doping (see Table 3).
Comparing lifetimes obtained from literature can be challenging due to the varying models, measuring devices, parameters used, and sample composition, which may include perovskite layers and interface layers. A lifetime of 0.588 μs has been reported [5] for a mixed (FA0.85MA0.15)Pb(I2.85Br0.15) film on a quartz substrate using a stretched exponential fit. This is a typical lifetime for undoped FAPbI3-based thin-film materials. When Zn(II) was added, this increased to 0.634 μs. Samples in which the crystals were aligned using 3-CPACl had an emission lifetime of 1.547 μs. In the paper by Jeong et al. [8], a specific lifetime is not provided, but in previous work by the same group on Cs0.05FA0.85MA0.10Pb(I0.97Br0.03)3 perovskites with a passivation layer of 4-tert-butyl-benzylammonium iodide (BBAI), an emission lifetime of 2.6 μs was reported [18]. Chen et al. found a lifetime of 16 μs, which is the longest reported [19]. This lifetime was measured for a (FAPbI3)0.9(MAPbBr3)0.05(CsPbBr3)0.05 single crystal perovskite. However, single crystals are not directly comparable with thin films. They are hard to compare because recombination at the perovskite crystal edges usually occurs much faster [17]. The longest lifetime of 3.7 μs reported in this work (FA0.8MA0.2PbI3) is long compared with the thin-film measurements, indicating that a cell with a small amount of zinc and formate doping can, in principle, perform very well. Furthermore, it was found that without the addition of (MABr or) MACl, it was impossible to create good perovskite thin films with spin coating.
To expand on our previous TR-PL overview [6], Table 3 shows photoluminescence lifetimes of perovskite materials from the literature, together with dopant or additive information.
Table 3. Overview of long photoluminescence lifetimes reported in the literature for perovskite materials (thin films on quartz, unless indicated differently).
Sample
Composition
τ (ns)Additives/
Specialties
Ref.
Cs0.05FA0.9MA0.05Pb(I0.9Br0.1)316,000Single crystal[19]
MAPbI38830TOPO[20]
FA0.8MA0.2PbI33700Zn(II), FoThis work
FA0.92MA0.08PbI32835PEAI, Cl[6]
Cs0.05FA0.85MA0.10Pb(I0.97Br0.03)32600BBAI[18]
FA0.85MA0.15Pb(I0.95Br0.05)31547Zn(II), CPACl[5]
FA0.95MA0.05Pb(I0.95Br0.05)31105(I3)[6]
FAPbI3439HI[16]
MAPbI3920 [20]
Note that TOPO (tri-octyl phosphine oxide), in our view, is not suitable for large-scale production.

2.3. Thermal Stability of Doped Perovskites

Considering the fact that the pure black α-phase of FAPbI3 perovskite converts to the yellow δ-phase within 24 h, or a few days, a simple straightforward approach to stability is visual color observation. Figure 7 and Figure 8 show examples of typical observations that can be made. Clearly, samples with 0, 0.5, and 1% ZnFo2 doping have become yellow (or yellow-brown) over the course of 2 weeks, 7 weeks, or 6 months. However, doping with higher levels of ZnFo2 (1.3, 2, 3, and 4%) results in the observation of black powders (Figure 7 and Figure 8) even after half a year. To determine the deterioration of perovskite samples doped with various amounts of zinc formate, first, visual observation was used. The samples were made by drop-casting solutions with varying concentrations of zinc formate added to the FAPbI3 precursor solution (see Section 3). The powdered samples are shown in plastic cuvettes (Figure 7) or in regular sample vials (Figure 8). These simple visual observations are corroborated by XRD measurement of the thin film (FA0.8MA0.2PbI3) that shows the longest emission lifetime. Figure 9 displays that the XRD pattern of an aged spin-coated film shows the same results as the visual observations (see also Table 4, for XRD data). The doped perovskite α-phase of FA0.8MA0.2PbI3 is thermally stable after six months (black trace) of storage under ambient conditions in a desiccator with regular indoor artificial light (humidity free, no sunlight).

3. Experimental

3.1. FAPbI3 Synthesis

The synthesis of FAPbI3 was performed using the method published by Tong et al. [21]. Formamidinium acetate (1.05 g) was dissolved in 1.5 mL of HI in H2O solution (57 wt.%). While stirring, PbI2 (4.61 g) was added to the solution. Not everything dissolved, and then 5 mL of GBL (gamma butyrolactone) was added. When everything had dissolved, the solution was heated at 95 °C for 1 h. The yellow-orange crystals were filtered using a frit filter and reduced pressure and then transferred to a round-bottom flask and heated at 150 °C for 2 h. The black spikey crystals were then thoroughly washed using diethyl ether, and the diethyl ether was removed using vacuum filtration. The washing was performed by transferring the crystals to the frit filter and then submerging them in diethyl ether. Using a spatula, the larger crystals were broken up. The crystals were transferred to another round-bottom flask and heated for another three hours at 150 °C. Black crystals were collected. In general, these black α-FAPbI3 crystals will turn yellow within 24 h, even in the dark. If not properly washed with diethyl ether, traces of acetate can remain in the FAPbI3 product.
It can be noted that lead acetate is used in methyl ammonium-based perovskites as an additive to slow down the crystallization in thin films, for example, leading to larger grains and fewer pinholes in the crystal structure [22]. More recently, lead acetate was used as a starting material for making perovskite layers with a mix of formamidinium and cesium. In this example, the crystallization is also controlled by the acetate by evaporating the acetate as ammonium acetate (the ammonium is added as a salt with the X anion) [23].

3.2. Precursor Solution Preparation for Spin Coating

A general procedure for the preparation of precursor solutions for spin coating is as follows. An amount of FAPbI3 was added to a sample flask. According to this amount, the amount of ZnFo2 and ZnI2 that should be added for the desired doping percentages is calculated and subsequently added, as well as other additives. The additives are calculated in molar percentages compared with the amount of lead in the base FAPbI3. Subsequently, solvent is added, and the solution is mixed with a small magnetic stirring rod until dissolved. To make sure all solids have dissolved, the solution is also sonicated.
The typical compositions (see Table 5) and procedures for the precursor solutions used in the experiments are given below. Note that MACl is added to aid the formation of thin films (FA0.8MA0.2PbI3). Without MACl, we were unable to produce films of good quality. In the literature, MACl is also often added in quantities up to 35 mol% [8]. An alternative that was also tested is MABr, but this induces Br incorporation.

3.3. Perovskite Powders

The precursor solutions for the preparation of the perovskite powders were made by dissolving the amounts of ZnFo2 and FAPbI3 that can be seen in Table 6 in 0.15 mL of DMSO. To fully dissolve the solids, the mixture was sonicated for up to 40 min at 35 °C. The goal was to obtain the highest concentration possible.

3.4. Thin Films for XRD and TR-PL (FA0.8MA0.2PbI3)

Three different precursor solutions were made for the spin coating, with a low, medium, and high amount of doping. The different precursor solutions were made by dissolving the specified amounts of FAPbI3, ZnFo2, ZnI2, and MACl in 1.1 mL of a 1:4 mixture of DMSO:DMF.
The solutions were stirred using a small magnetic stirring rod for 25 min and also sonicated for 25 min until everything had dissolved. To make sure no particulates would be present in the spin-coating process, the solutions were filtered using PTFE-syringe filters.
Similar to what has been reported in the literature, precursor solutions that have aged (e.g., for 30 days) produce layers of lower quality [24].

3.5. Doped Powder Preparation (FAPbI3)

The preparation of the precursor solutions for the doped perovskite powders can be found in the previous section. The solutions were drop-cast into Petri dishes in tiny drops using a syringe and a needle. The Petri dishes were heated at 180 °C directly on a hotplate. The small drops turned black, and some vapor escaped; using a spatula, the drops were then scraped off and made into a powder. The minimum time was 20–25 min for the drops to dry enough to scrape them off. Using smaller drops helps in drying properly.

3.6. Substrate Cleaning

All substrates were cleaned by sonicating in a beaker with milli-Q water with Helmanex III soap for 15 min. The substrates were then rinsed with milli-Q water and placed back in a rinsed Teflon sample holder. After this, the samples were sonicated for 15 min in acetone and subsequently in 2-propanol also for 15 min. After sonication, the substrates were dried with compressed air and lastly treated with ozone in a UV-ozone oven for at least a half hour.
For all of the cleaning steps, it is best if the slides are placed in the sample holder in a way that there is the least amount of contact possible between the sample holder and the substrates. This is carried out because, sometimes, especially when using thicker substrates, the substrates sit tight in the slots and will not get properly cleaned. This can later show up during spin coating, leading to uncoated edges on the substrates. To ensure that the sample holders do not affect the cleaning in the UV-ozone oven, the substrates can be laid on a clean glass plate in the UV-ozone oven with the side where the perovskite will be deposited facing up. Quartz substrates were obtained from Osilla. Glass plates from Menzel were also used.

3.7. Spin Coating

The thin-film samples were produced by spin coating. The techniques and parameters used during spin coating were varied and experimented with. A very useful resource used was the Osilla spin-coating guide [25]. The procedure that was ultimately found to reliably produce good quality films is as follows. For spin coating, the substrates are taken out of the UV-ozone oven one by one, and the oven is switched on again for the remaining substrates. The substrate is centered on the table by eye, and the suction is switched on. Then, on the spin coater, a gentle stream of N2 is blown over the substrate for about three seconds to remove any possible dust particles. At 3000 rpm, with no ramp, the sample was spun for 30 s; then, after 3–4 s of spinning, 0.06 mL of precursor solution was put on the center of the spinning substrate as close as possible but without touching the surface; this can be performed using a micropipette or a syringe and needle, but when using a needle, extra care has to be taken that the solution is not applied too fast. The micropipette was found to create less dripping. After spinning for 30 s, the sample is spun for another 30 s at 2500 rpm. After a few seconds, 0.7–0.8 mL of diethyl ether (DEE) is applied to the surface using a syringe and a needle. The syringe’s needle is held as close to the surface as possible and in the center of the spinning sample. The plunger is pushed down in a couple of seconds, with the goal of the DEE stream not being so hard that it ‘blasts’ the perovskite layer away but also not so slow that it drips. After this anti-solvent step, the sample is taken from the spin coater and put onto a hotplate to anneal for 20 min at 150 °C.
If a little MABr (or MACL) is added, this makes a large difference in the crystallization properties of the thin films. Without it, the films would not turn dark-brown/black when put on the hotplate for annealing but stay yellow and become a bit darker yellow over time. With MABr or MACl, the thin films would turn from light yellow to brown within a second. It was found that you need more MACl than MABr to obtain a similar effect in crystallization.

3.8. Time-Resolved Photoluminescence

Time-correlated single-photon counting measurements of the perovskite thin films on quartz were carried out on an in-house built setup, PicoQuant PDL 828 “Sepia II” and a PicoQuant HydraHarp 400 multichannel picosecond event timer and TCSPC module. A laser (PicoQuant LDH-D-C-485, PicoQuant, Berlin, Germany) with a wavelength of 485 nm was used for excitation with a repetition rate of 0.1 MHz. The emission was measured with a single-photon avalanche diode (SPAD) detector (Micro Photon Devices, MPD-5CTD, Micro Photon Devices S.R.L., Bolzano, Italy), and to remove the laser light, a long-pass filter (Thorlabs FEL-488, Thorlabs Inc., Newton, NJ, USA) was used. The laser power at 100% was around 15 mW. Also, an ND4 filter was used to decrease the intensity. This setup was used as it was possible to record up to 10 μs, which was necessary for the long lifetimes on quartz substrates.
The photoluminescence (PL) lifetime of perovskite layers is determined by fitting the TR-PL data to a mono-exponential, bi-exponential, or stretched-exponential model [17]. The model used to fit the data depends on the measured sample, energy levels, and electron transfer process in a ‘standard’ perovskite solar cell [26].
A bi-exponential model is often used when measuring samples containing an HTL or an ETL [27]. In case no charge extraction layers are present on the sample, a stretched exponential was chosen to fit the data to the function f t = y 0 + A   e t / τ β , where A is the amplitude, τ is the lifetime, and β is the stretch factor (0 < β < 1). The stretch factor signifies the heterogeneity of the system. If β is equal to 1, the function converts to a mono-exponential function. All photophysical data reported here have an estimated error of 5 to 10%.

3.9. XRD Measurements of Thin Films

XRD measurements were performed on thin films on quartz. These were the same samples that were used in the time-resolved photoluminescence measurements. The measurements were performed using a Bruker D2 phase diffractometer operated at 30 kV and 10 mA using a Cu source. The substrates were scanned between 2θ = 5° and 2θ = 60° with a step size of 0.202°. Data analysis was performed using Python (version 3.10.8) and Excel (version 16.16.27).

3.10. Software Used

For the analysis of the data, fitting, and plotting of the data, Python programming language was used (version 3.10.8) [28]. For fitting the TCSPC data, the curve fit function from the SciPy library was used. The raw and modified data and the Python code used to make the figures can be found in the accompanying Supporting Materials.

4. Conclusions and Future Outlook

Simultaneous zinc formate and zinc iodide doping of perovskite precursor solutions influences the thermal phase stability and the PL lifetime of FAPbI3-based perovskites in a positive way.
TR-PL measurements of FA0.8MA0.2PbI3 materials show that the samples with low doping levels (with 1.7% zinc and 1% formate) have the longest lifetimes, 3.7 μs, using a stretched exponential fit.
The effect of zinc and formate on the phase stability of perovskite powders and thin films was investigated. For the powders (FAPbI3), it was found that between 1.3% and 4% ZnFo2 doping is where the phase stability is affected: the black α-phase does not convert to the yellow δ-phase. In the thin films (FA0.8MA0.2PbI3) with low doping (1.7% Zn and 1% Fo), no phase change was observed: XRD after 6 months shows a stable α-phase.
Increasing the dopant concentration led to the presence of PbI2 in the films. To be able to tune the ratio of zinc and formate added to the precursor solution, Zn(CHOO)2 and ZnI2 are added. Zinc iodide is added to be able to make ratios other than 1:2 = zinc:formate. In the XRD measurements (Figure 1 and Figure 2), the increase in PbI2 is identifiable with an increase in the dopant concentration in the precursor solution. The observation that the presence of PbI2 is detrimental to the performance is not new, as it is known to be one of the degradation products [12].
Overall, it was found that zinc and formate positively affect the thermal phase stability of the perovskite α-phase and PL lifetime of FAPbI3-based materials. In the grand scheme of events, we note that optimal individual doping contents for perovskites (e.g., 2.5% Zn(II) and 2% Fo) do not correspond to optimal contents for synergistic doping agents (1.7% Zn and 1% Fo). Our work indicates that the sum of added doping components should be ~3% (or less). Fine-tuning the ratio of Zn(II) to Fo within this 0.1 to 3% total doping window may lead to further improvements of the material properties of perovskites for single junction or tandem cells [29,30].

Supplementary Materials

Data files, analysis files, and all files related to this research (RDM) are available here: https://doi.org/10.21942/uva.24757407.v1 (accessed on 19 January 2024).

Author Contributions

Conceptualization by R.M.W.; all sample preparation as well as the analysis and visualization of the output data by M.M.H.; XRD and time-resolved emission measurements: M.M.H. and R.M.W.; writing—original draft preparation based on the report of MSc internship of M.M.H. at the Molecular Photonics group at UvA within the MSc program Molecular Sciences at UvA; final writing, review, and editing by R.M.W.; supervision by R.M.W. All authors have read and agreed to the published version of the manuscript.

Funding

This research received no external funding.

Data Availability Statement

Data are contained within the article and Supplementary Materials.

Acknowledgments

We thank Imme Schuringa of AMOLF for her help with XRD and TR-PL. We thank the Universiteit van Amsterdam for structural support.

Conflicts of Interest

The authors declare no conflict of interest.

Abbreviations

CPACl3-chloropropylamine hydrochloride
DEEdiethyl ether
PLphotoluminescence
PTFEpolytetrafluoroethylene
DMF dimethylformamide
DMSOdimethylsulfoxide
GBL gamma butyrolactone
τ lifetime of an excited state
MABrmethylammonium bromide
MAClmethylammonium chloride
TR-PLtime-resolved photoluminescence
Foformate anion (HCO2)-
FAPbI3formamidinium lead tri-iodide
TOPOtri-n-octylphosphine oxide
XRDX-ray diffraction

References

  1. IPCC. Climate Change 2021: The Physical Science Basis. Contribution of Working Group I to the Sixth Assessment Report of the Intergovernmental Panel on Climate Change; Masson-Delmotte, V., Zhai, P., Pirani, A., Connors, S.L., Péan, C., Berger, S., Caud, N., Chen, Y., Goldfarb, L., Gomis, M.I., et al., Eds.; Cambridge University Press: Cambridge, UK; New York, NY, USA, 2021. [Google Scholar] [CrossRef]
  2. Ritchie, H.; Roser, M.; Rosado, P. “Energy”. Published Online at OurWorldInData.org. 2022. Available online: https://ourworldindata.org/energy (accessed on 13 April 2023).
  3. Kojima, A.; Teshima, K.; Shirai, Y.; Miyasaka, T. Organometal Halide Perovskites as Visible-Light Sensitizers for Photovoltaic Cells. J. Am. Chem. Soc. 2009, 131, 6050–6051. [Google Scholar] [CrossRef] [PubMed]
  4. NREL. Best Research-Cell Efficiency Chart. Available online: https://www.nrel.gov/pv/cell-efficiency.html (accessed on 13 April 2023).
  5. Muscarella, L.A.; Petrova, D.; Jorge Cervasio, R.; Farawar, A.; Lugier, O.; McLure, C.; Slaman, M.J.; Wang, J.; Ehrler, B.; von Hauff, E.; et al. Air-Stable and Oriented Mixed Lead Halide Perovskite (FA/MA) by the One-Step Deposition Method Using Zinc Iodide and an Alkylammonium Additive. ACS Appl. Mater. Interfaces 2019, 11, 17555–17562. [Google Scholar] [CrossRef] [PubMed]
  6. Kooijman, A.; Muscarella, L.A.; Williams, R.M. Perovskite Thin Film Materials Stabilized and Enhanced by Zinc(II) Doping. Appl. Sci. 2019, 9, 1678. [Google Scholar] [CrossRef]
  7. Ye, S.; Rao, H.; Feng, M.; Xi, L.; Yen, Z.; Seng, D.H.L.; Xu, Q.; Boothroyd, C.; Chen, B.; Guo, Y.; et al. Expanding the low-dimensional interface engineering toolbox for efficient perovskite solar cells. Nat. Energy 2023, 8, 284–293. [Google Scholar] [CrossRef]
  8. Jeong, J.; Kim, M.; Seo, J.; Lu, H.; Ahlawat, P.; Mishra, A.; Yang, Y.; Hope, M.A.; Eickemeyer, F.T.; Kim, M.; et al. Pseudo-Halide Anion Engineering for α-FAPbI3 Perovskite Solar Cells. Nature 2021, 592, 381–385. [Google Scholar] [CrossRef] [PubMed]
  9. Li, M.; Yeh, H.; Chiang, Y.; Jeng, U.; Su, C.; Shiu, H.; Hsu, Y.; Kosugi, N.; Ohigashi, T.; Chen, Y.; et al. Highly Efficient 2D/3D Hybrid Perovskite Solar Cells via Low-Pressure Vapor-Assisted Solution Process. Adv. Mater. 2018, 30, 1801401. [Google Scholar] [CrossRef]
  10. Zhou, T.; Lai, H.; Liu, T.; Lu, D.; Wan, X.; Zhang, X.; Liu, Y.; Chen, Y. Highly Efficient and Stable Solar Cells Based on Crystalline Oriented 2D/3D Hybrid Perovskite. Adv. Mater. 2019, 31, 1901242. [Google Scholar] [CrossRef]
  11. Nie, W.; Tsai, H.; Asadpour, R.; Blancon, J.-C.; Neukirch, A.J.; Gupta, G.; Crochet, J.J.; Chhowalla, M.; Tretiak, S.; Alam, M.A.; et al. High-Efficiency Solution-Processed Perovskite Solar Cells with Millimeter-Scale Grains. Science 2015, 347, 522–525. [Google Scholar] [CrossRef]
  12. Huang, J.; Tan, S.; Lund, P.D.; Zhou, H. Impact of H2O on Organic-Inorganic Hybrid Perovskite Solar Cells. Energy Environ. Sci. 2017, 10, 2284–2311. [Google Scholar] [CrossRef]
  13. Muscarella, L.A.; Petrova, D.; Cervasio, R.J.; Farawar, A.; Lugier, O.; McLure, C.; Slaman, M.J.; Wang, J.; von Hauff, E.; Williams, R.M. Enhanced Grain-Boundary Emission Lifetime and Additive Induced Crystal Orientation in One-Step Spin-Coated Mixed Cationic (FA/MA) Lead Perovskite Thin Films Stabilized by Zinc Iodide Doping. ChemRxiv 2017. [Google Scholar] [CrossRef]
  14. Bi, D.; El-Zohry, A.M.; Hagfeldt, A.; Boschloo, G. Unraveling the Effect of PbI2 Concentration on Charge Recombination Kinetics in Perovskite Solar Cells. ACS Photonics 2015, 2, 589–594. [Google Scholar] [CrossRef]
  15. Handa, T.; Tex, D.M.; Shimazaki, A.; Wakamiya, A.; Kanemitsu, Y. Charge Injection Mechanism at Heterointerfaces in CH3NH3PbI3 Perovskite Solar Cells Revealed by Simultaneous Time-Resolved Photoluminescence and Photocurrent Measurements. J. Phys. Chem. Lett. 2017, 8, 954–960. [Google Scholar] [CrossRef] [PubMed]
  16. Fang, H.-H.; Wang, F.; Adjokatse, S.; Zhao, N.; Even, J.; Loi, M.A. Photoexcitation Dynamics in Solution-Processed Formamidinium Lead Iodide Perovskite Thin Films for Solar Cell Applications. Light. Sci. Appl. 2016, 5, e16056. [Google Scholar] [CrossRef] [PubMed]
  17. Baloch, A.A.B.; Alharbi, F.H.; Grancini, G.; Hossain, M.I.; Nazeeruddin, K.; Tabet, N. Analysis of Photocarrier Dynamics at Interfaces in Perovskite Solar Cells by Time-Resolved Photoluminescence. J. Phys. Chem. C 2018, 122, 26805–26815. [Google Scholar] [CrossRef]
  18. Zhu, H.; Liu, Y.; Eickemeyer, F.T.; Pan, L.; Ren, D.; Ruiz-Preciado, M.A.; Carlsen, B.; Yang, B.; Dong, X.; Wang, Z.; et al. Tailored Amphiphilic Molecular Mitigators for Stable Perovskite Solar Cells with 23.5% Efficiency. Adv. Mater. 2020, 32, 1907757. [Google Scholar] [CrossRef] [PubMed]
  19. Chen, L.; Tan, Y.-Y.; Chen, Z.-X.; Wang, T.; Hu, S.; Nan, Z.-A.; Xie, L.-Q.; Hui, Y.; Huang, J.-X.; Zhan, C.; et al. Toward Long-Term Stability: Single-Crystal Alloys of Cesium-Containing Mixed Cation and Mixed Halide Perovskite. J. Am. Chem. Soc. 2019, 141, 1665–1671. [Google Scholar] [CrossRef] [PubMed]
  20. De Quilettes, D.W.; Koch, S.; Burke, S.; Paranji, R.K.; Shropshire, A.J.; Ziffer, M.E.; Ginger, D.S. Photoluminescence Lifetimes Exceeding 8 μs and Quantum Yields Exceeding 30% in Hybrid Perovskite Thin Films by Ligand Passivation. ACS Energy Lett. 2016, 1, 438–444. [Google Scholar] [CrossRef]
  21. Tong, G.; Son, D.-Y.; Ono, L.K.; Kang, H.-B.; He, S.; Qiu, L.; Zhang, H.; Liu, Y.; Hieulle, J.; Qi, Y. Removal of Residual Compositions by Powder Engineering for High Efficiency Formamidinium-Based Perovskite Solar Cells with Operation Lifetime over 2000 h. Nano Energy 2021, 87, 106152. [Google Scholar] [CrossRef]
  22. Tang, G.; You, P.; Tai, Q.; Wu, R.; Yan, F. Performance Enhancement of Perovskite Solar Cells Induced by Lead Acetate as an Additive. Sol. RRL 2018, 2, 1800066. [Google Scholar] [CrossRef]
  23. Zhao, J.; Fürer, S.O.; McMeekin, D.P.; Lin, Q.; Lv, P.; Ma, J.; Tan, W.L.; Wang, C.; Tan, B.; Chesman, A.S.R.; et al. Efficient and Stable Formamidinium–Caesium Perovskite Solar Cells and Modules from Lead Acetate-Based Precursors. Energy Environ. Sci. 2023, 16, 138–147. [Google Scholar] [CrossRef]
  24. Li, M.; Li, H.; Zhuang, Q.; He, D.; Liu, B.; Chen, C.; Zhang, B.; Pauporté, T.; Zang, Z.; Chen, J. Stabilizing Perovskite Precursor by Synergy of Functional Groups for NiOx-Based Inverted Solar Cells with 23.5 % Efficiency. Angew. Chem. Int. Ed. 2022, 61, e202206914. [Google Scholar] [CrossRef] [PubMed]
  25. Griffin, J.; Hassan, H.; Spooner, E. Spin Coating: Complete Guide to Theory and Techniques. Ossila. Available online: https://www.ossila.com/en-eu/pages/spin-coating (accessed on 15 September 2022).
  26. Marchioro, A.; Teuscher, J.; Friedrich, D.; Kunst, M.; van de Krol, R.; Moehl, T.; Grätzel, M.; Moser, J.-E. Unravelling the Mechanism of Photoinduced Charge Transfer Processes in Lead Iodide Perovskite Solar Cells. Nat. Photonics 2014, 8, 250–255. [Google Scholar] [CrossRef]
  27. Stranks, S.D.; Eperon, G.E.; Grancini, G.; Menelaou, C.; Alcocer, M.J.P.; Leijtens, T.; Herz, L.M.; Petrozza, A.; Snaith, H.J. Electron-Hole Diffusion Lengths Exceeding 1 Micrometer in an Organometal Trihalide Perovskite Absorber. Science 2013, 342, 341–344. [Google Scholar] [CrossRef] [PubMed]
  28. Welcome to Python.org. Available online: https://www.python.org/ (accessed on 25 November 2022).
  29. Marchant, C.; Williams, R.M. Perovskite/Silicon Tandem Solar Cells—Compositions for Improved Stability and Power Conversion Efficiency. Photochem. Photobiol. Sci. 2023. [Google Scholar] [CrossRef]
  30. Aydin, E.; Allen, T.G.; De Bastiani, M.; Razzaq, A.; Xu, L.; Ugur, E.; Liu, J.; De Wolf, S. Pathways toward Commercial Perovskite/Silicon Tandem Photovoltaics. Science 2024, 383, eadh3849. [Google Scholar] [CrossRef]
Figure 1. XRD measurements of perovskite thin films (FA0.8MA0.2PbI3) on quartz with varying concentrations of zinc and formate, as indicated. The diffraction peaks of the cubic α-phase at 13.9° and 28.1° are clearly visible. The larger diffraction at 12.7° corresponds to the presence of PbI2.
Molecules 29 00516 g001
Figure 2. XRD measurements of perovskite thin films on quartz with varying concentrations of zinc and formate. The larger diffraction on the left, at 12.7°, corresponds to the presence of PbI2. (Zoomed in relative from Figure 1).
Molecules 29 00516 g002
Figure 3. Photographs of representative spin-coated doped perovskite thin films (FA0.8MA0.2PbI3 with 1.7% Zn and 1% Fo) showing their typical appearance: (black) mirror-like in reflective view; transparent brown upon transmissive view at a strong light. The beak of the pincer is 4 mm wide. The substrates are 25 × 25 mm.
Molecules 29 00516 g003
Figure 4. Optical micrographs of two doped films. (Top left): Doping with 1.7% Zn and 1% Fo. (Top right): Doping with 3.8% Zn and 3% Fo. Scale bar is 28 µm. Note PbI2 regions in the right picture (larger white regions). The brown (lower right) picture shows the yellow PbI2 domains more clearly (same scale as above). The red (lower left) micrograph is for comparison, from earlier work [13] on similar films doped with Zn(II) only (with a 10 µm scale bar). This last (red) micrograph is typical for samples of our previous work [5,6,13] that were also studied with SEM and confocal laser scanning microscopy.
Molecules 29 00516 g004
Figure 5. UV–Vis absorption spectrum (blue) as well as photoluminescence spectrum of doped perovskite thin films (FA0.8MA0.2PbI3) with optimal doping (1.7% Zn and 1% Fo, in green) and photoluminescence spectrum of a perovskite powder (FAPbI3, with 1.3% Zn and 2.6% Fo, in red).
Molecules 29 00516 g005
Figure 6. Photoluminescence decays (with stretched exponential fit) of differently doped perovskite thin films (FA0.8MA0.2PbI3). In blue, optimal doping with 1.7% Zn and 1% Fo. In red, non-optimal doping with 3.8% Zn and 3% Fo. In green, non-optimal doping with 2.6% Zn and 2% Fo.
Molecules 29 00516 g006
Figure 7. Visual of the discoloration of the black perovskite samples as a function of time. It can be clearly observed that 2% ZnFo2, or more, induces thermal stabilization of the black α-phase.
Molecules 29 00516 g007aMolecules 29 00516 g007b
Figure 8. Visual of the discoloration of the black perovskite samples after 6 months. It can be clearly observed that 1.3% ZnFo2 doping, or more, induces thermal stabilization of the α-phase. Samples with 0 or 1% doping are yellow after 6 months. Samples with 1.3, 2, 3, and 4% ZnFo2 doping remain black. The sample with 1.3% doping was made for extra precision in determining the limit.
Molecules 29 00516 g008
Figure 9. The XRD of spin-coated FA0.8MA0.2PbI3 thin films optimally doped with zinc (1.7%) and formate (1%) direct after preparation (blue) and six months later (black). The XRD pattern proves that the black α-phase is thermally stable.
Molecules 29 00516 g009
Table 1. The results corresponding to the XRD measurements of the three doped samples (FA0.8MA0.2PbI3). The corresponding graphs can be seen in Figure 1 and Figure 2. The diffraction angles are indicated, the percentage is the normalized height of the spectra, and all spectra are normalized relative to the highest peak. The peak amplitude is the value as measured (not normalized). The FWHM is the full width at half maximum of the peaks; for the very small peaks, it was not possible to calculate this.
Sample
Code
Peak
(°)
%Peak AmplitudeFWHM (°)Designation
112.713.623-PbI2
13.91001690.1263α-phase
24.316.628-α-phase
28.137630.1273α-phase
212.739520.1415PbI2
13.941001330.1425α-phase
24.31419-α-phase
28.131.5420.1727α-phase
312.367.720-PbI2
12.7852210.153PbI2
13.961002600.118α-phase
~247.720-α-phase
28.1391020.0809α-phase
Table 2. The details of doping and the results of the fitting of the TR-PL data with a stretched exponential (FA0.8MA0.2PbI3).
Sample Code% Zn% Fo% Totalτ (ns)β
11.71.02.737000.77
22.62.04.66100.46
33.83.06.814200.58
Table 4. The results corresponding to the XRD measurements of the sample of Figure 8, (FA0.8MA0.2PbI3) doped with zinc (1.7%) and formate (1%). The diffraction angles are indicated, the percentage is the normalized height of the spectra, and all spectra are normalized relative to the highest peak. The peak amplitude is the value as measured (not normalized). The FWHM is the full width at half maximum of the peaks; for the very small peaks, it was not possible to calculate.
Sample
Code
Peak
(°)
%Peak AmplitudeFWHM (°)Designation
112.713.623-PbI2
13.91001690.1263α-phase
24.316.628-α-phase
28.137630.1273α-phase
1 (aged)12.720290.1783PbI2
13.91001460.1356α-phase
24.31218-α-phase
28.134500.1941α-phase
Table 5. The contents of the precursor solutions for the preparation of the spin-coated perovskite films (FA0.8MA0.2PbI3) with increasing concentrations of zinc formate. On the left side of the table are the amounts that were added to the precursor solution. On the right side of the table, the calculated mol% compared with the amount of Pb is displayed as well as the sum of Zn and Fo doping.
Sample CodeFAPbI3 (mg)ZnFo2 (mg)ZnI2 (mg)MACl
mg (mol%)
% Zn% Fo% Total
1800.20.95.218.5 (21.7)1.71.02.7
2806.52.06.921.2 (24.6)2.62.04.6
3806.13.09.319.9 (23.1)3.83.06.8
Table 6. The contents of the precursor solutions for the preparation of the FAPbI3 perovskite powders with increasing concentrations of zinc formate.
Sample CodeFAPbI3 (mg)ZnFo2 (mg)% Zn% Fo% Total
0.0%295.60.00.000.000.00
0.5%299.00.30.410.821.23
1.0%297.80.70.961.922.88
2.0%297.31.72.334.666.99
3.0%297.02.23.026.049.06
4.0%298.22.93.967.9211.88
Disclaimer/Publisher’s Note: The statements, opinions and data contained in all publications are solely those of the individual author(s) and contributor(s) and not of MDPI and/or the editor(s). MDPI and/or the editor(s) disclaim responsibility for any injury to people or property resulting from any ideas, methods, instructions or products referred to in the content.

