
Impact of Formalin- and Cryofixation on Raman Spectra of Human Tissues and Strategies for Tumor Bank Inclusion
 , , ,
, , ,
Abstract
:1. Introduction
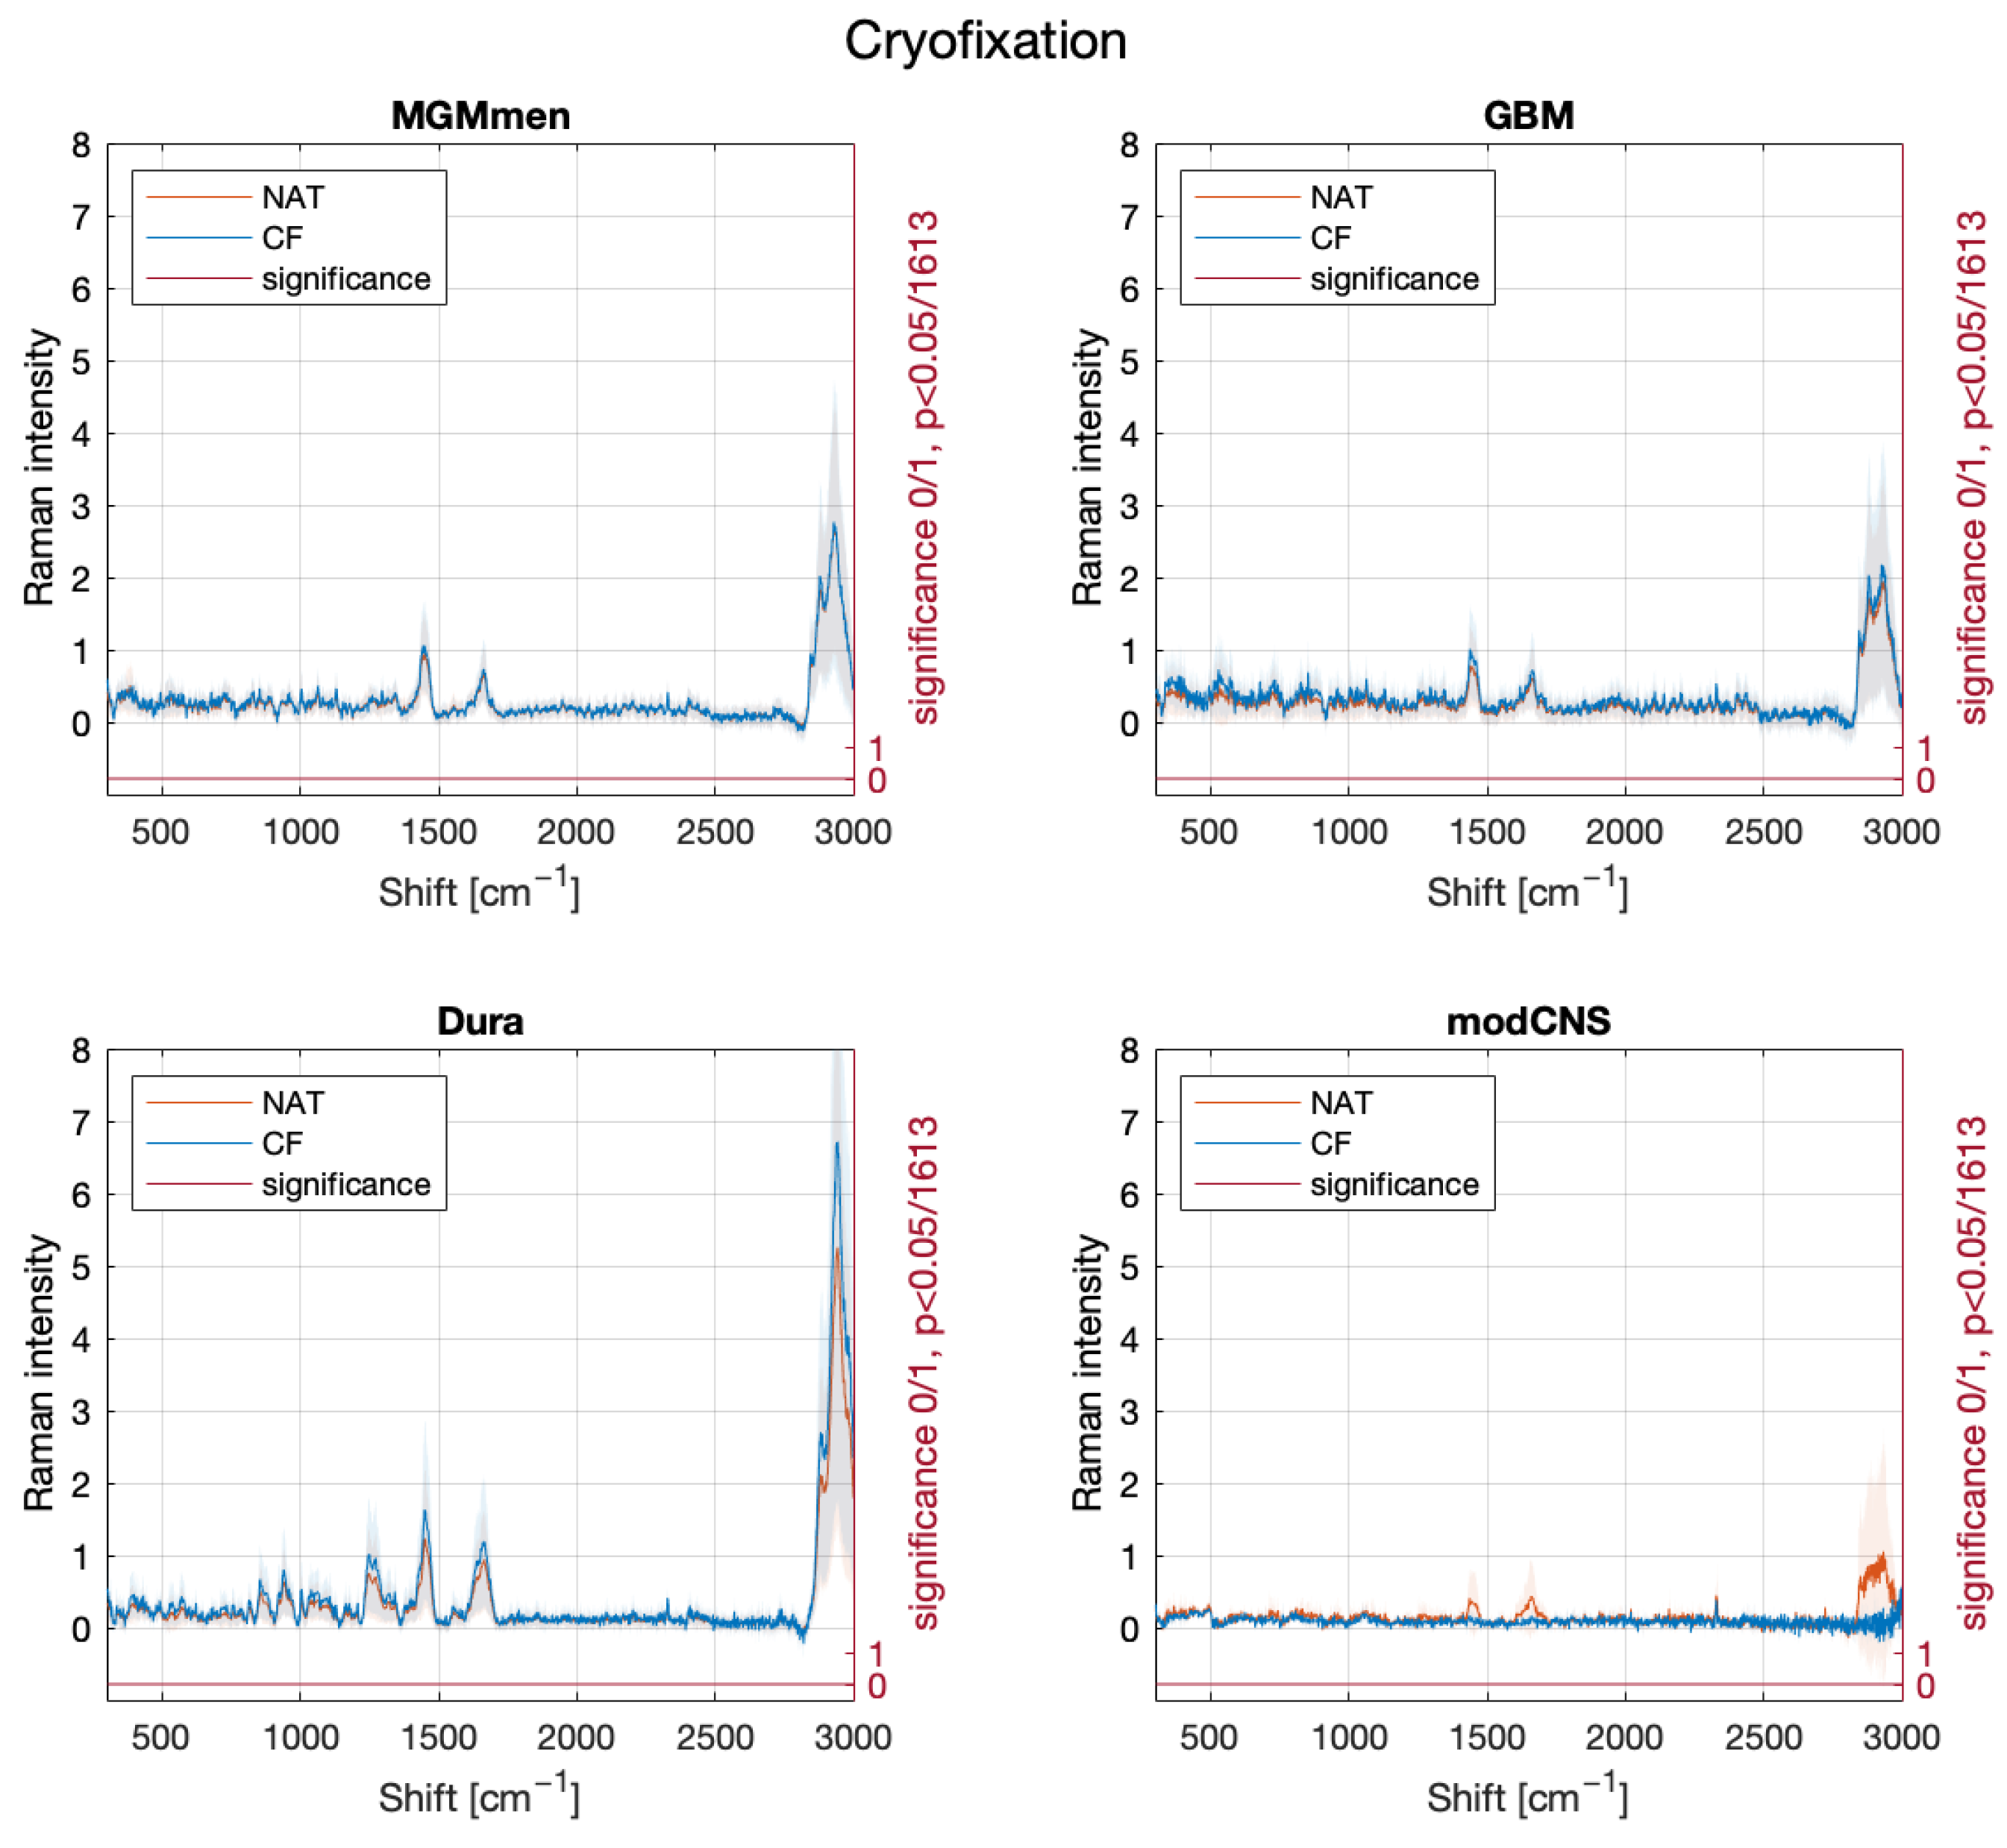
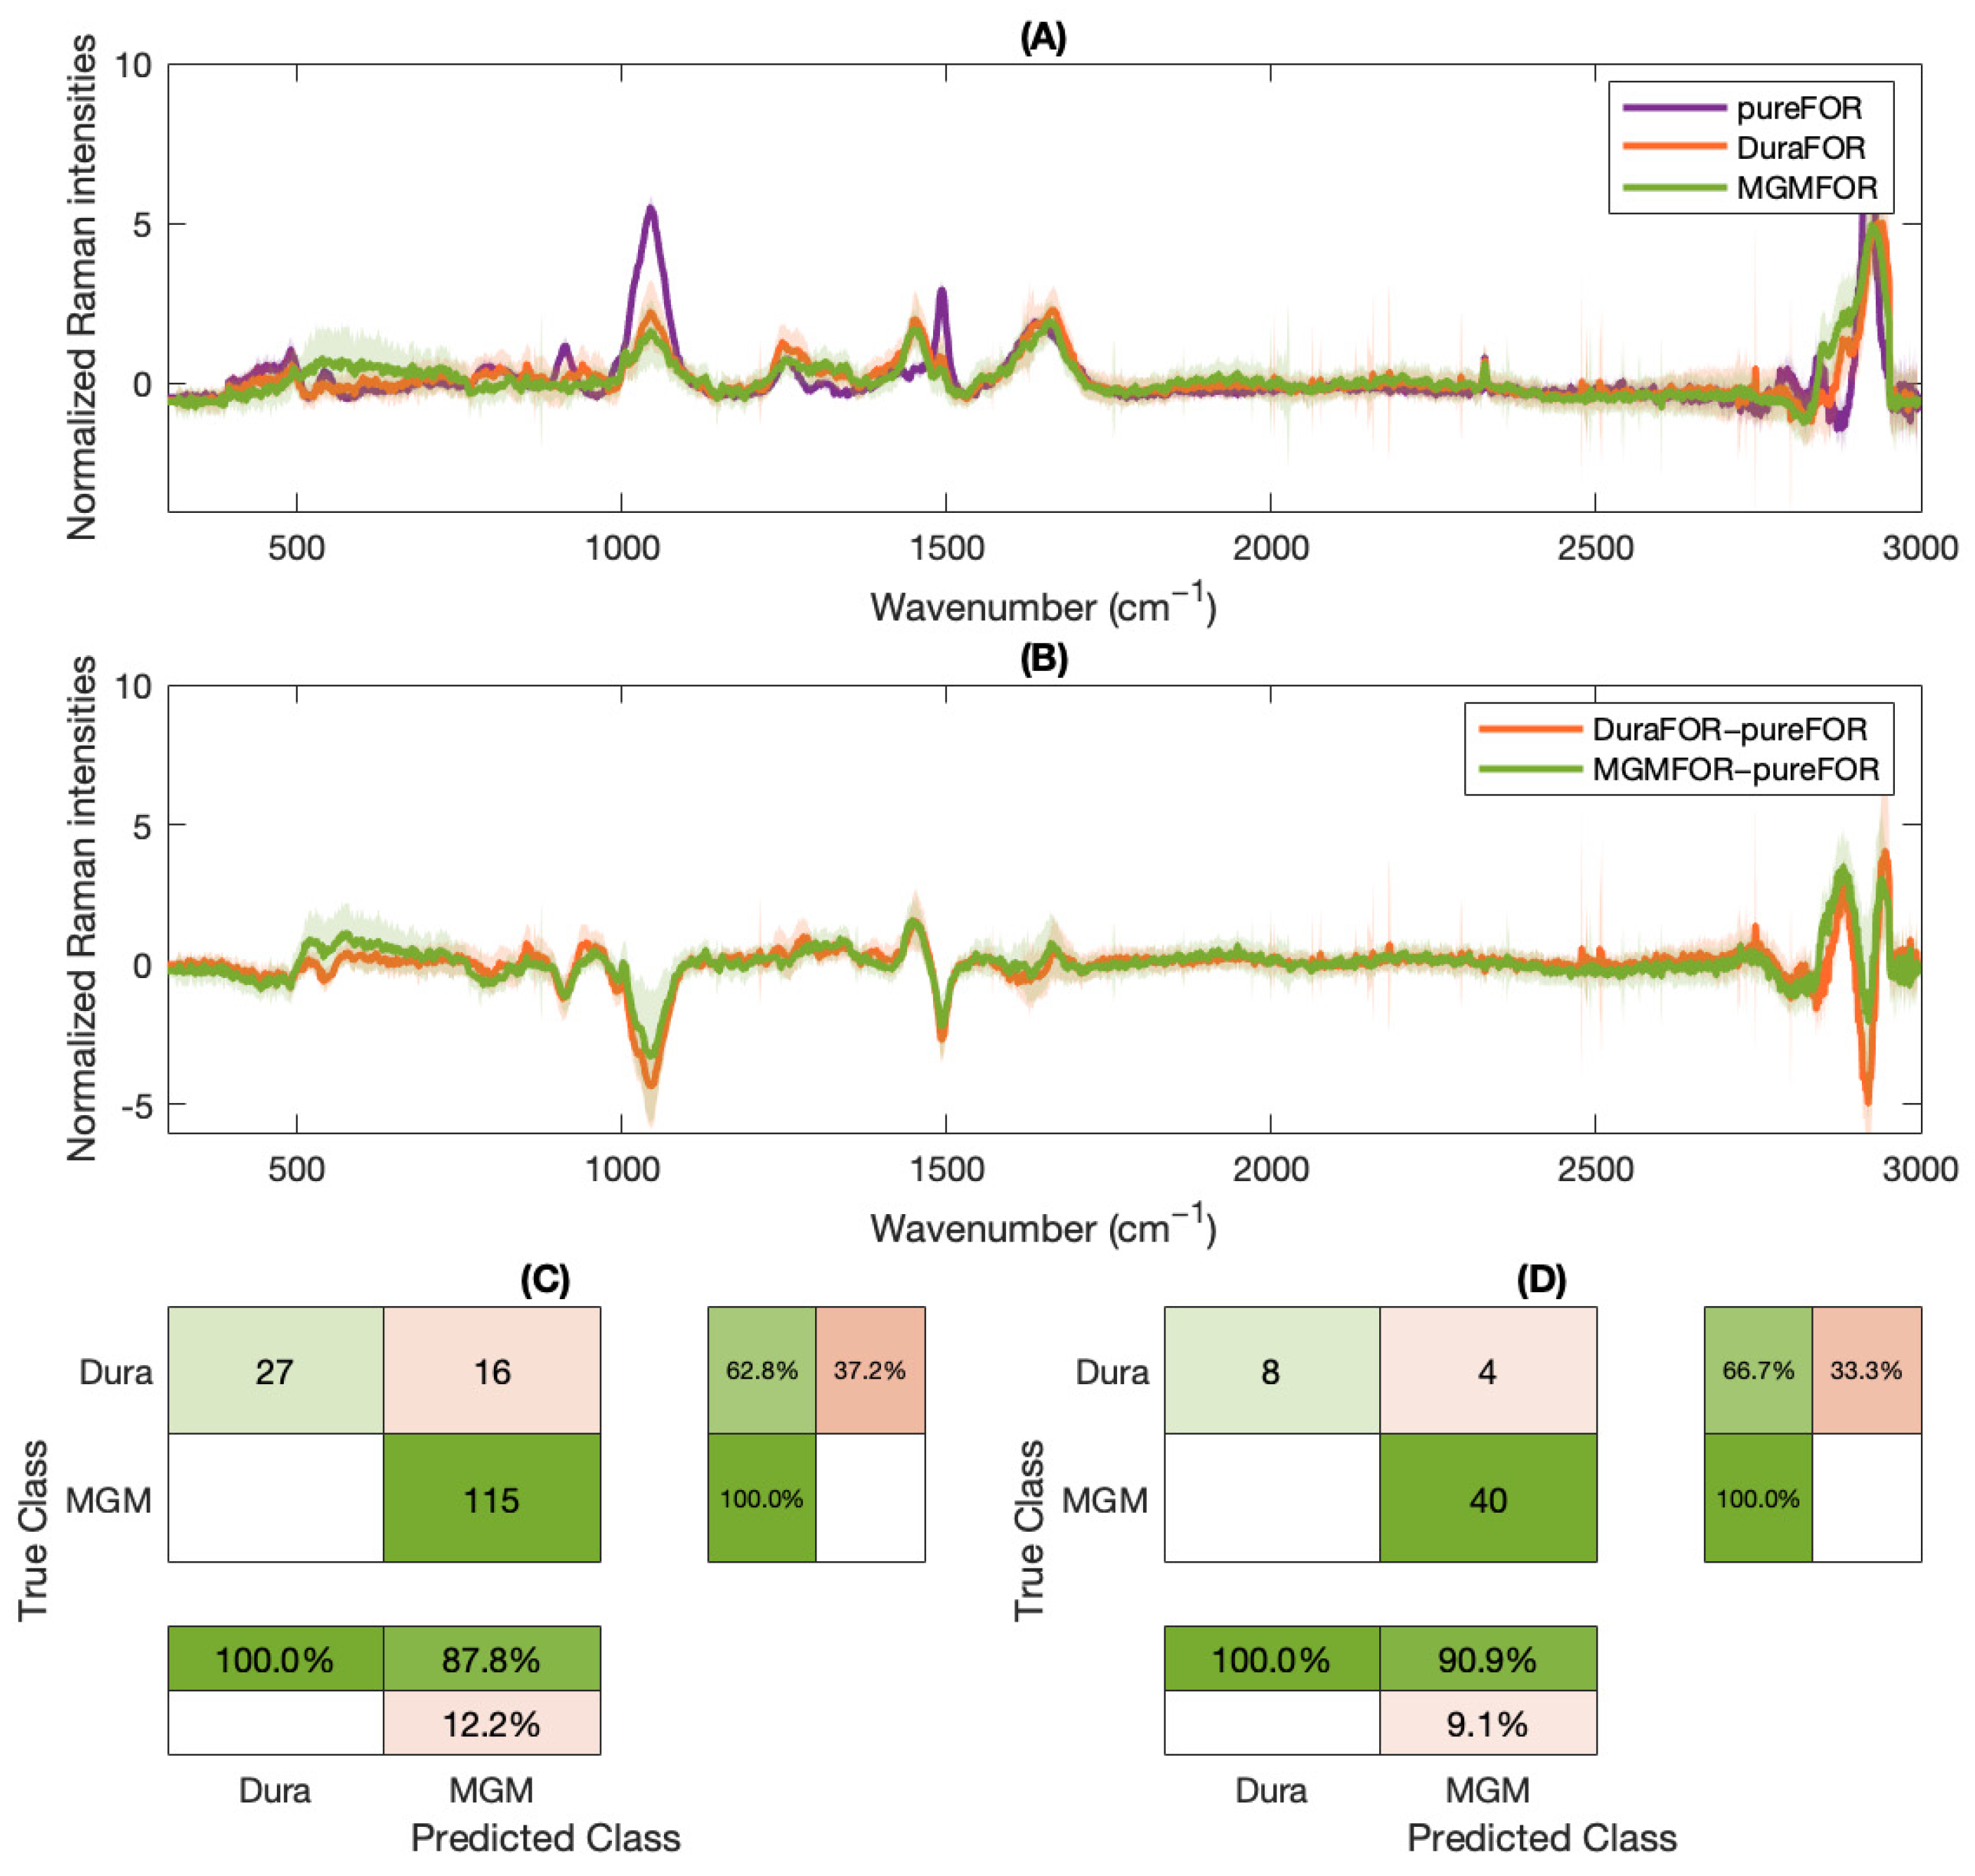
2. Results
3. Discussion
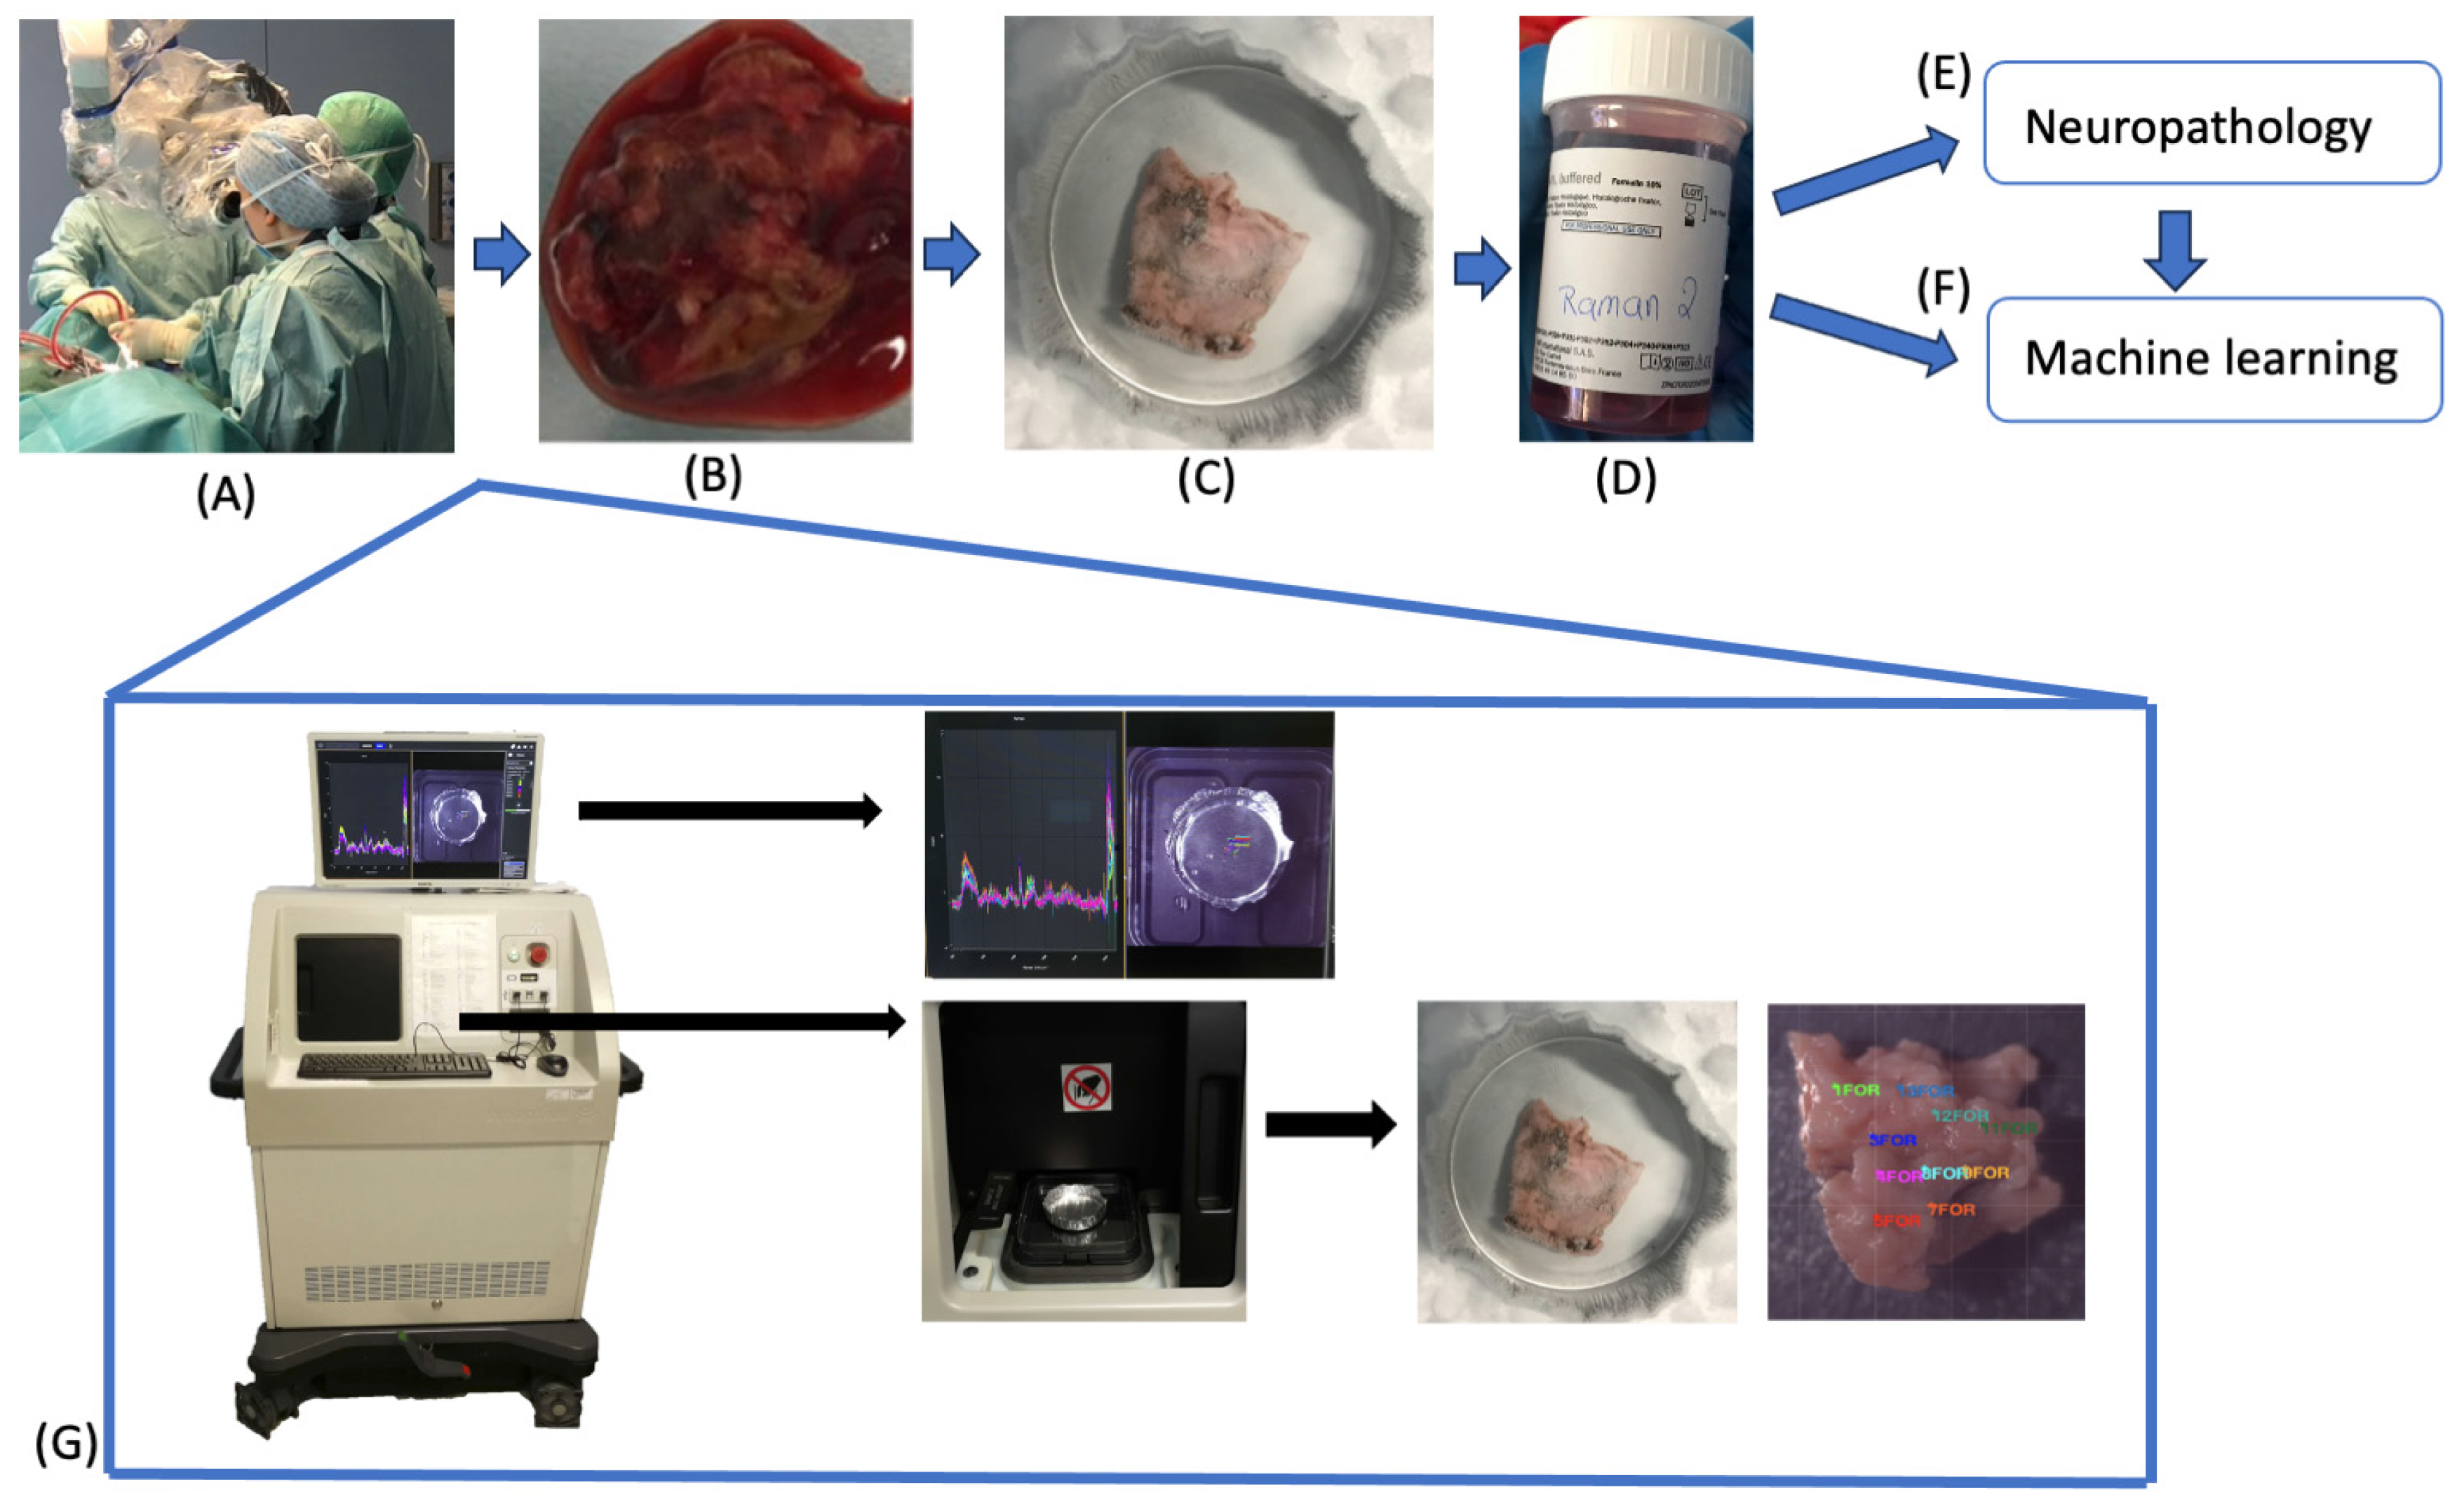
4. Materials and Methods
4.1. Raman Spectroscopy
4.2. Sample Acquisition
4.3. Sample Fixation
4.4. Machine Learning
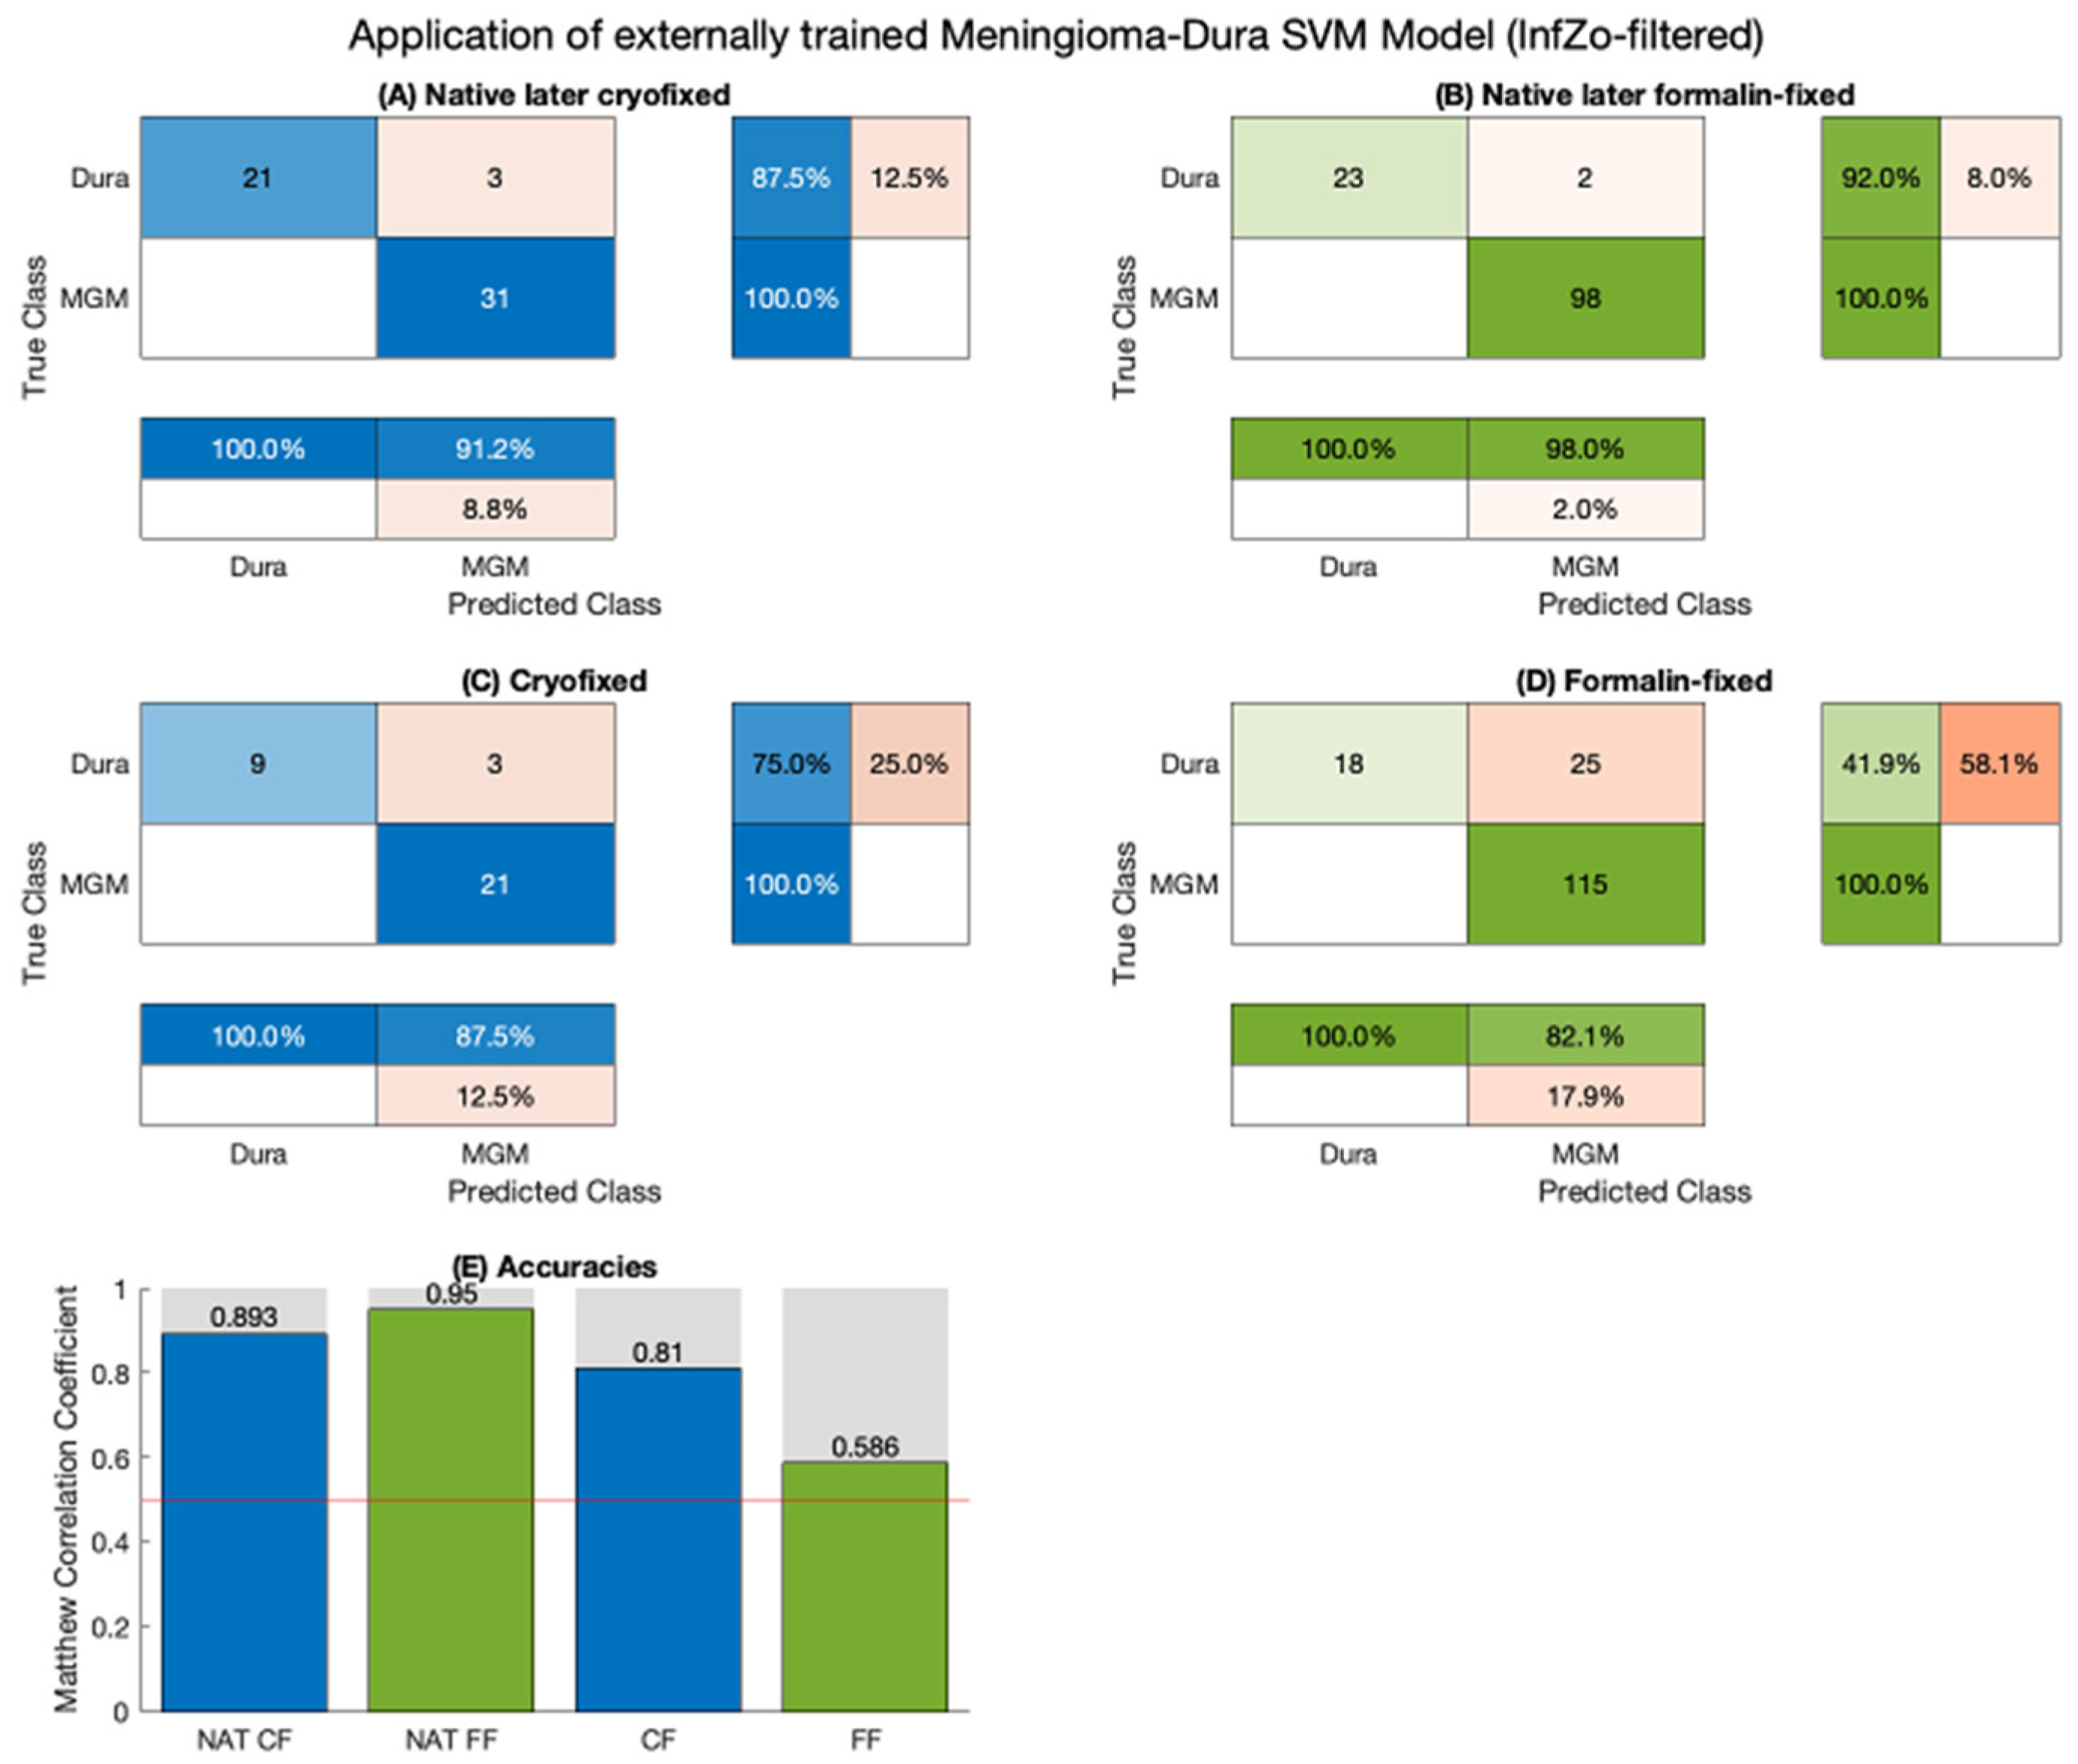
4.5. Application of an Internally Trained Classifier
5. Conclusions
Supplementary Materials
Author Contributions
Funding
Institutional Review Board Statement
Informed Consent Statement
Data Availability Statement
Acknowledgments
Conflicts of Interest
References
- André, S.; Cristau LSaint Gaillard, S.; Devos, O.; Calvosa, É.; Duponchel, L. In-line and real-time prediction of recombinant antibody titer by in situ Raman spectroscopy. Anal. Chim. Acta. 2015, 892, 148–152. [Google Scholar] [CrossRef]
- Cho, Y.; Song, S.W.; Sung, J.; Jeong, Y.S.; Park, C.R.; Kim, H.M. Hyperspectral depth-profiling with deep Raman spectroscopy for detecting chemicals in building materials. Analyst 2017, 142, 3613–3619. [Google Scholar] [CrossRef] [PubMed]
- Huang, Z.; Teh, S.K.; Zheng, W.; Mo, J.; Lin, K.; Shao, X.; Ho, K.Y.; Teh, M.; Yeoh, K.G. Integrated Raman spectroscopy and trimodal wide-field imaging techniques for real-time in vivo tissue Raman measurements at endoscopy. Opt. Lett. 2009, 34, 758. [Google Scholar] [CrossRef]
- De Biase, D.; Paciello, O. Essential and current methods for a practical approach to comparative neuropathology. Folia Morphol. 2015, 74, 137–149. [Google Scholar] [CrossRef] [PubMed]
- Bolon, B.; Anthony, D.C.; Butt, M.; Dorman, D.; Green, M.V.; Little, P.B.; Valentine, W.M.; Weinstock, D.; Yan, J.; Sills, R.C. “Current pathology techniques” symposium review: Advances and issues in neuropathology. Toxicol. Pathol. 2008, 36, 871–889. [Google Scholar] [CrossRef]
- Fix, A.S.; Garman, R.H. Practical Aspects of Neuropathology: A Technical Guide for Working with the Nervous System. Toxicol. Pathol. 2000, 28, 122–131. [Google Scholar] [CrossRef]
- Boonstra, H.; Oosterhuis, J.W.; Oosterhuis, A.M.; Fleuren, G.J. Cervical tissue shrinkage by formaldehyde fixation, paraffin wax embedding, section cutting and mounting. Virchows Archiv A 1983, 402, 195–201. [Google Scholar] [CrossRef]
- Jelke, F.; Mirizzi, G.; Borgmann, F.K.; Husch, A.; Slimani, R.; Klamminger, G.G.; Klein, K.; Mombaerts, L.; Gérardy, J.-J.; Mittelbronn, M.; et al. Intraoperative discrimination of native meningioma and dura mater by Raman spectroscopy. Sci. Rep. 2021, 11, 1–10. [Google Scholar] [CrossRef] [PubMed]
- Klamminger, G.G.; Klein, K.; Mombaerts, L.; Jelke, F.; Mirizzi, G.; Slimani, R.; Husch, A.; Mittelbronn, M.; Hertel, F.; Borgmann, F.B.K. Differentiation of Primary CNS Lymphoma and Glioblastoma Using Raman Spectroscopy and Machine Learning Algorithms. Free Neuropathol. 2021, 2, 26. [Google Scholar] [CrossRef]
- Devpura, S.; Thakur, J.S.; Poulik, J.M.; Rabah, R.; Naik, V.M.; Naik, R. Raman spectroscopic investigation of frozen and deparaffinized tissue sections of pediatric tumors: Neuroblastoma and ganglioneuroma. J. Raman Spectrosc. 2013, 44, 370–376. [Google Scholar] [CrossRef]
- Fox, C.H.; Johnson, F.B.; Whiting, J.; Roller, P.P. Formaldehyde fixation. J. Histochem. Cytochem. 1985, 33, 845–853. [Google Scholar] [CrossRef]
- Blum, F. Der Formaldehyd als Antisepticum. Med. Wochenschau 1893, 8, 601. [Google Scholar]
- Agarwal, A. Semen banking in patients with cancer: 20-year experience. Int. J. Androl. 2000, 23, 16–19. [Google Scholar] [CrossRef]
- Argyle, C.E.; Harper, J.C.; Davies, M.C. Oocyte cryopreservation: Where are we now? Hum. Reprod. Update 2016, 22, 440–449. [Google Scholar] [CrossRef]
- Yu, Y.-Y. Significance of biological resource collection and tumor tissue bank creation. World J. Gastrointest. Oncol. 2010, 2, 5. [Google Scholar] [CrossRef]
- Bauchet, L.; Rigau, V.; Mathieu-Daudé, H.; Figarella-Branger, D.; Hugues, D.; Palusseau, L.; Bauchet, F.; Fabbro, M.; Campello, C.; Capelle, L.; et al. French brain tumor data bank: Methodology and first results on 10,000 cases. J. Neurooncol. 2007, 84, 189–199. [Google Scholar] [CrossRef] [PubMed]
- Ghita, A.; Matousek, P.; Stone, N. Sensitivity of Transmission Raman Spectroscopy Signals to Temperature of Biological Tissues. Sci. Rep. 2018, 8, 8379. [Google Scholar] [CrossRef] [PubMed]
- Huang, Z.; McWilliams, A.; Lam, S.; English, J.; McLean, D.; Lui, H.; Zeng, H. Effect of formalin fixation on the near-infrared Raman spectroscopy of normal and cancerous human bronchial tissues. Int. J. Oncol. 2003, 23, 649–655. [Google Scholar] [CrossRef] [PubMed]
- Ockman, N. The infra-red and Raman spectra of ice. Adv. Phys. 1958, 7, 199–220. [Google Scholar] [CrossRef]
- Dörr, D.; Stracke, F.; Zimmermann, H. Noninvasive quality control of cryopreserved samples. Biopreserv. Biobank. 2012, 10, 529–531. [Google Scholar] [CrossRef] [PubMed]
- Ó Faoláin, E.; Hunter, M.B.; Byrne, J.M.; Kelehan, P.; McNamara, M.; Byrne, H.J.; Lyng, F.M. A study examining the effects of tissue processing on human tissue sections using vibrational spectroscopy. Vib. Spectrosc. 2005, 38, 121–127. [Google Scholar] [CrossRef]
- Galli, R.; Uckermann, O.; Koch, E.; Schackert, G.; Kirsch, M.; Steiner, G. Effects of tissue fixation on coherent anti-Stokes Raman scattering images of brain. J. Biomed. Opt. 2014, 19, 71402. [Google Scholar] [CrossRef] [PubMed]
- Meade, A.D.; Lyng, F.M.; Knief, P.; Byrne, H.J. Growth substrate induced functional changes elucidated by FTIR and Raman spectroscopy in in–vitro cultured human keratinocytes. Anal. Bioanal. Chem. 2007, 387, 1717–1728. [Google Scholar] [CrossRef] [PubMed]
- Hackett, M.J.; McQuillan, J.A.; El-Assaad, F.; Aitken, J.B.; Levina, A.; Cohen, D.D.; Siegele, R.; Carter, E.A.; Grau, G.E.; Hunt, N.H.; et al. Chemical alterations to murine brain tissue induced by formalin fixation. Analyst 2011, 136, 2941–2952. [Google Scholar] [CrossRef] [PubMed]
- Wills, H.; Kast, R.; Stewart, C.; Rabah, R.; Pandya, A.; Poulik, J.; Auner, G.; Klein, M.D. Raman spectroscopy detects and distinguishes neuroblastoma and related tissues in fresh and (banked) frozen specimens. J. Pediatr. Surg. 2009, 44, 386–391. [Google Scholar] [CrossRef] [PubMed]
- Kalkanis, S.N.; Kast, R.E.; Rosenblum, M.L.; Mikkelsen, T.; Yurgelevic, S.M.; Nelson, K.M.; Raghunathan, A.; Poisson, L.M.; Auner, G.W. Raman spectroscopy to distinguish grey matter, necrosis, and glioblastoma multiforme in frozen tissue sections. J. Neurooncol. 2014, 116, 477–485. [Google Scholar] [CrossRef] [PubMed]
- Carey, P.R.; Paulo, S. Biochemical Applications of Raman and Resonance Raman Spectroscopies; Academic Press: Cambridge, MA, USA, 1982. [Google Scholar]
- Movasaghi, Z.; Rehman, S.; Rehman, I.U. Raman Spectroscopy of Biological Tissues. Appl. Spectrosc. Rev. 2007, 42, 493–541. [Google Scholar] [CrossRef]
- Fiedler, I.A.K.; Casanova, M.; Keplinger, T.; Busse, B.; Müller, R. Effect of short-term formaldehyde fixation on Raman spectral parameters of bone quality. J. Biomed. Opt. 2018, 23, 1–6. [Google Scholar] [CrossRef] [PubMed]
- Ferraro, J.R.; Nakamoto, K.; Brown, C.W. Introductory Raman Spectroscopy, 2nd ed.; Elsevier: Amsterdam, The Netherlands, 2003. [Google Scholar]
- Zhang, Y.; Hong, H.; Weibo, C. Imaging with Raman spectroscopy. Curr. Pharm. Biotechnol. 2010, 11, 654–661. [Google Scholar] [CrossRef]
- Van der Maaten, L.; Hinton, G. Visualizing Data using t-SNE. J. Mach. Learn. Res. 2008, 9, 2579–2605. [Google Scholar]
- Benhur, A.; Weston, J. A User’ s Guide to Support Vector Machines; Carugo, O., Eisenhaber, F., Eds.; Methods Mol Biol [Internet]; Humana Press: New York, NY, USA; Springer Science & Business Media: Berlin/Heidelberg, Germany, 2009; pp. 223–239. Available online: https://link.springer.com/protocol/10.1007%2F978-1-60327-241-4_13 (accessed on 1 March 2024).
- Association, W.M. WMA Declaration of Helsinki—Ethical Principles for Medical Research involving Human Subjects [Internet]. 1964. Available online: https://www.wma.net/policies-post/wma-declaration-of-helsinki-ethical-principles-for-medical-research-involving-human-subjects/ (accessed on 1 March 2024).
- The Council of the European Union. (Text with EEA Relevance), 2016; The Council of the European Union: Brussels, Belgium, 2014. [Google Scholar]


| Diagnosis | Patients | Sex Ratio (W:M) | Fixation State (Nr of Spectra) | |||
|---|---|---|---|---|---|---|
| Native before FF | Formalin-Fixed (FF) | Native before CF | Cryofixed (CF) | |||
| Meningothelial meningioma | 4 | 3:1 | 13 | 17 | 31 | 21 |
| Dura mater | 9 | 4:5 | 25 | 43 | 24 | 12 |
| Glioblastoma | 8 | 2:6 | 49 | 24 | 38 | 22 |
| Modified CNS | 7 | 2:5 | 32 | 51 | 3 | 2 |
| TOTAL | 19 | 8:11 | 119 | 135 | 96 | 57 |
| Diagnosis | Patients | Sex Ratio (W:M) | Fixation State (Nr of Spectra) | ||
|---|---|---|---|---|---|
| Cryofixed | Thawed | Body Temperature | |||
| Hormone-inactive pituitary adenomas | 37 | 10:27 | 309 | 240 | 80 |
Disclaimer/Publisher’s Note: The statements, opinions and data contained in all publications are solely those of the individual author(s) and contributor(s) and not of MDPI and/or the editor(s). MDPI and/or the editor(s) disclaim responsibility for any injury to people or property resulting from any ideas, methods, instructions or products referred to in the content. |
© 2024 by the authors. Licensee MDPI, Basel, Switzerland. This article is an open access article distributed under the terms and conditions of the Creative Commons Attribution (CC BY) license (https://creativecommons.org/licenses/by/4.0/).
Share and Cite
Mirizzi, G.; Jelke, F.; Pilot, M.; Klein, K.; Klamminger, G.G.; Gérardy, J.-J.; Theodoropoulou, M.; Mombaerts, L.; Husch, A.; Mittelbronn, M.; et al. Impact of Formalin- and Cryofixation on Raman Spectra of Human Tissues and Strategies for Tumor Bank Inclusion. Molecules 2024, 29, 1167. https://doi.org/10.3390/molecules29051167
Mirizzi G, Jelke F, Pilot M, Klein K, Klamminger GG, Gérardy J-J, Theodoropoulou M, Mombaerts L, Husch A, Mittelbronn M, et al. Impact of Formalin- and Cryofixation on Raman Spectra of Human Tissues and Strategies for Tumor Bank Inclusion. Molecules. 2024; 29(5):1167. https://doi.org/10.3390/molecules29051167
Chicago/Turabian StyleMirizzi, Giulia, Finn Jelke, Michel Pilot, Karoline Klein, Gilbert Georg Klamminger, Jean-Jacques Gérardy, Marily Theodoropoulou, Laurent Mombaerts, Andreas Husch, Michel Mittelbronn, and et al. 2024. "Impact of Formalin- and Cryofixation on Raman Spectra of Human Tissues and Strategies for Tumor Bank Inclusion" Molecules 29, no. 5: 1167. https://doi.org/10.3390/molecules29051167