
3D-QSAR and Molecular Dynamics Study of Isoxazole Derivatives to Identify the Structural Requirements for Farnesoid X Receptor (FXR) Agonists


Abstract

1. Introduction
2. Results and Discussion
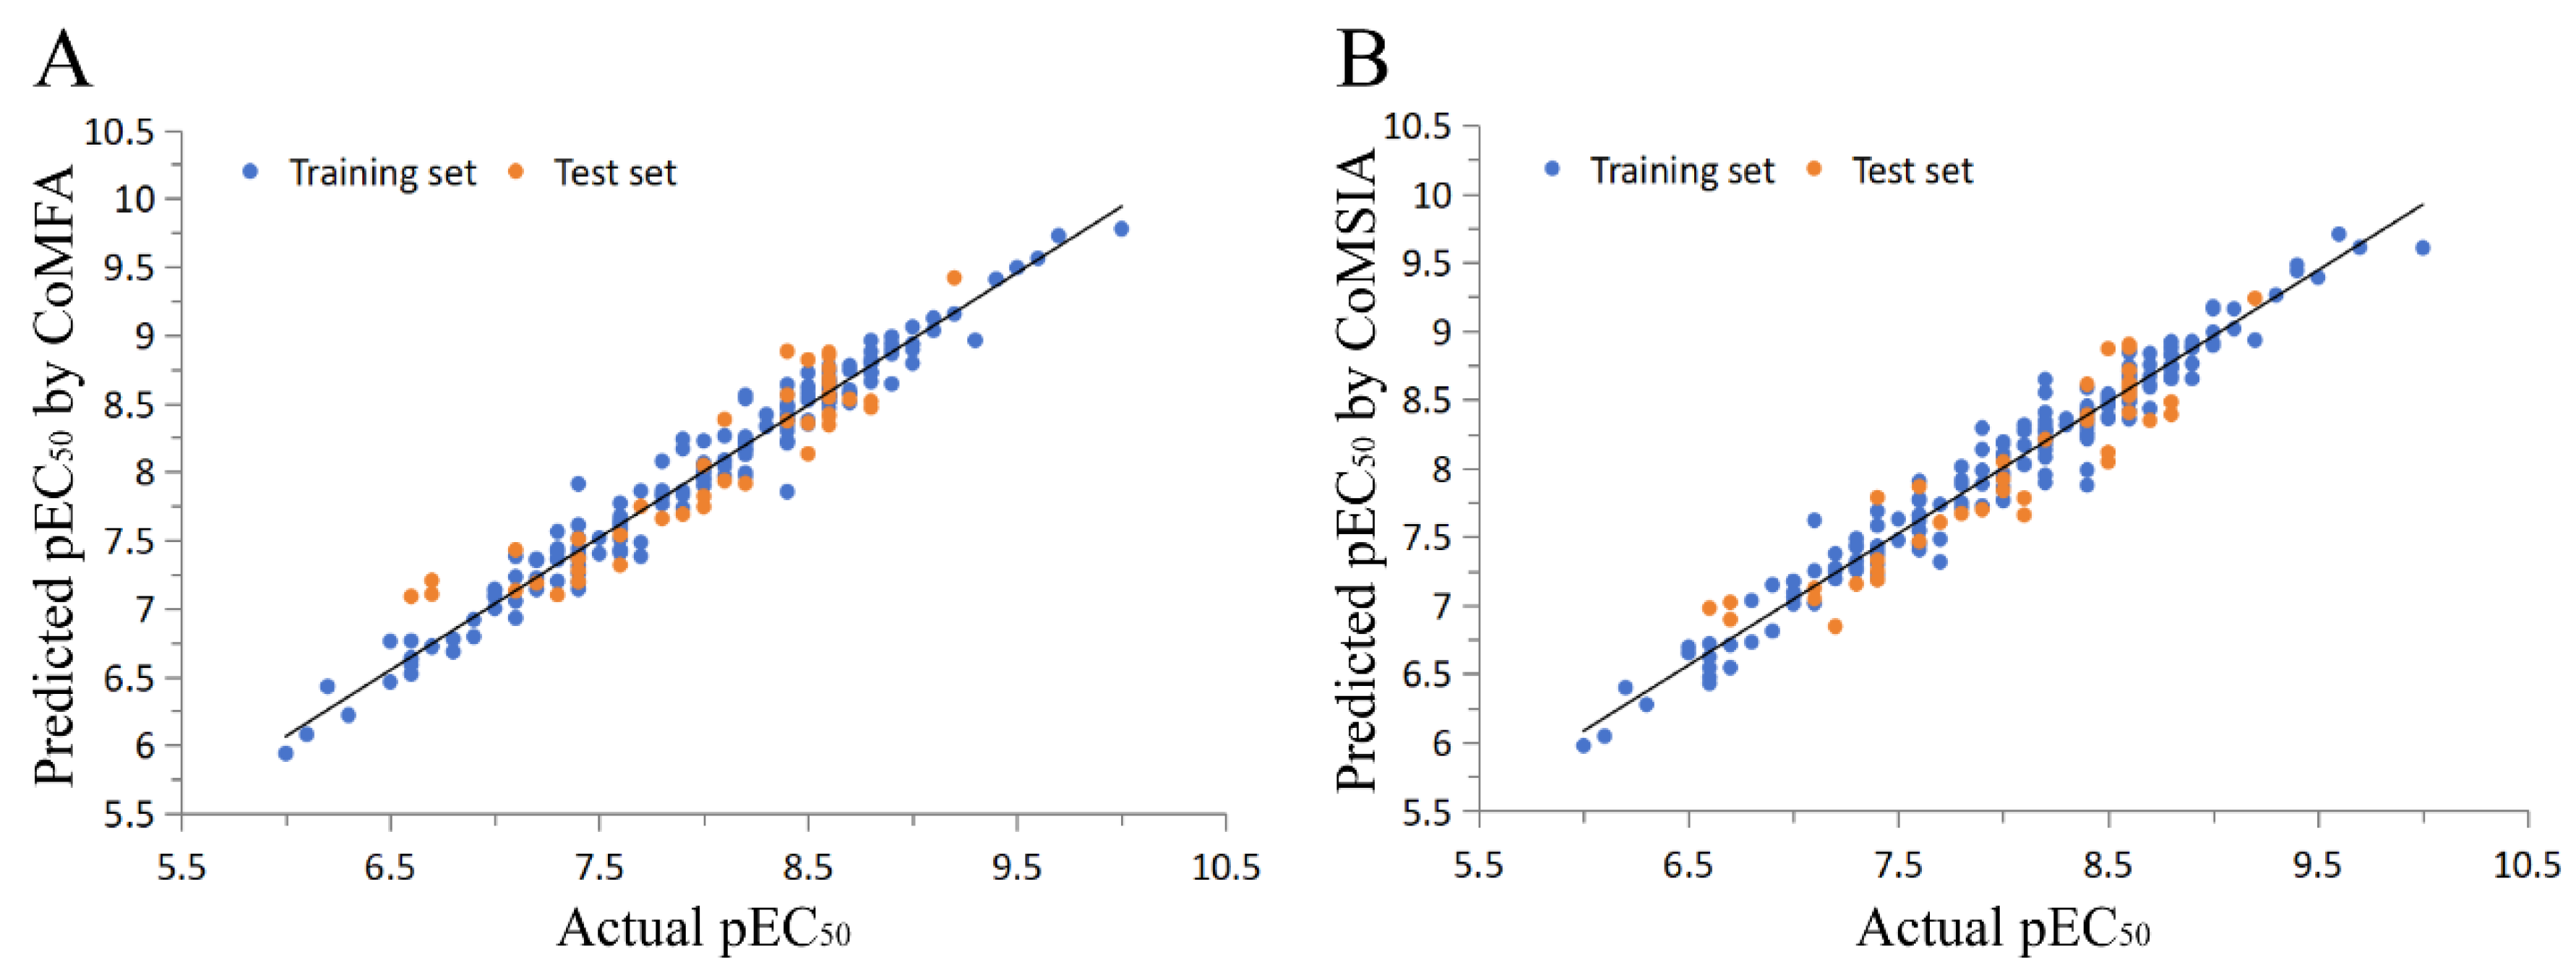
2.1. 3D-QSAR Model
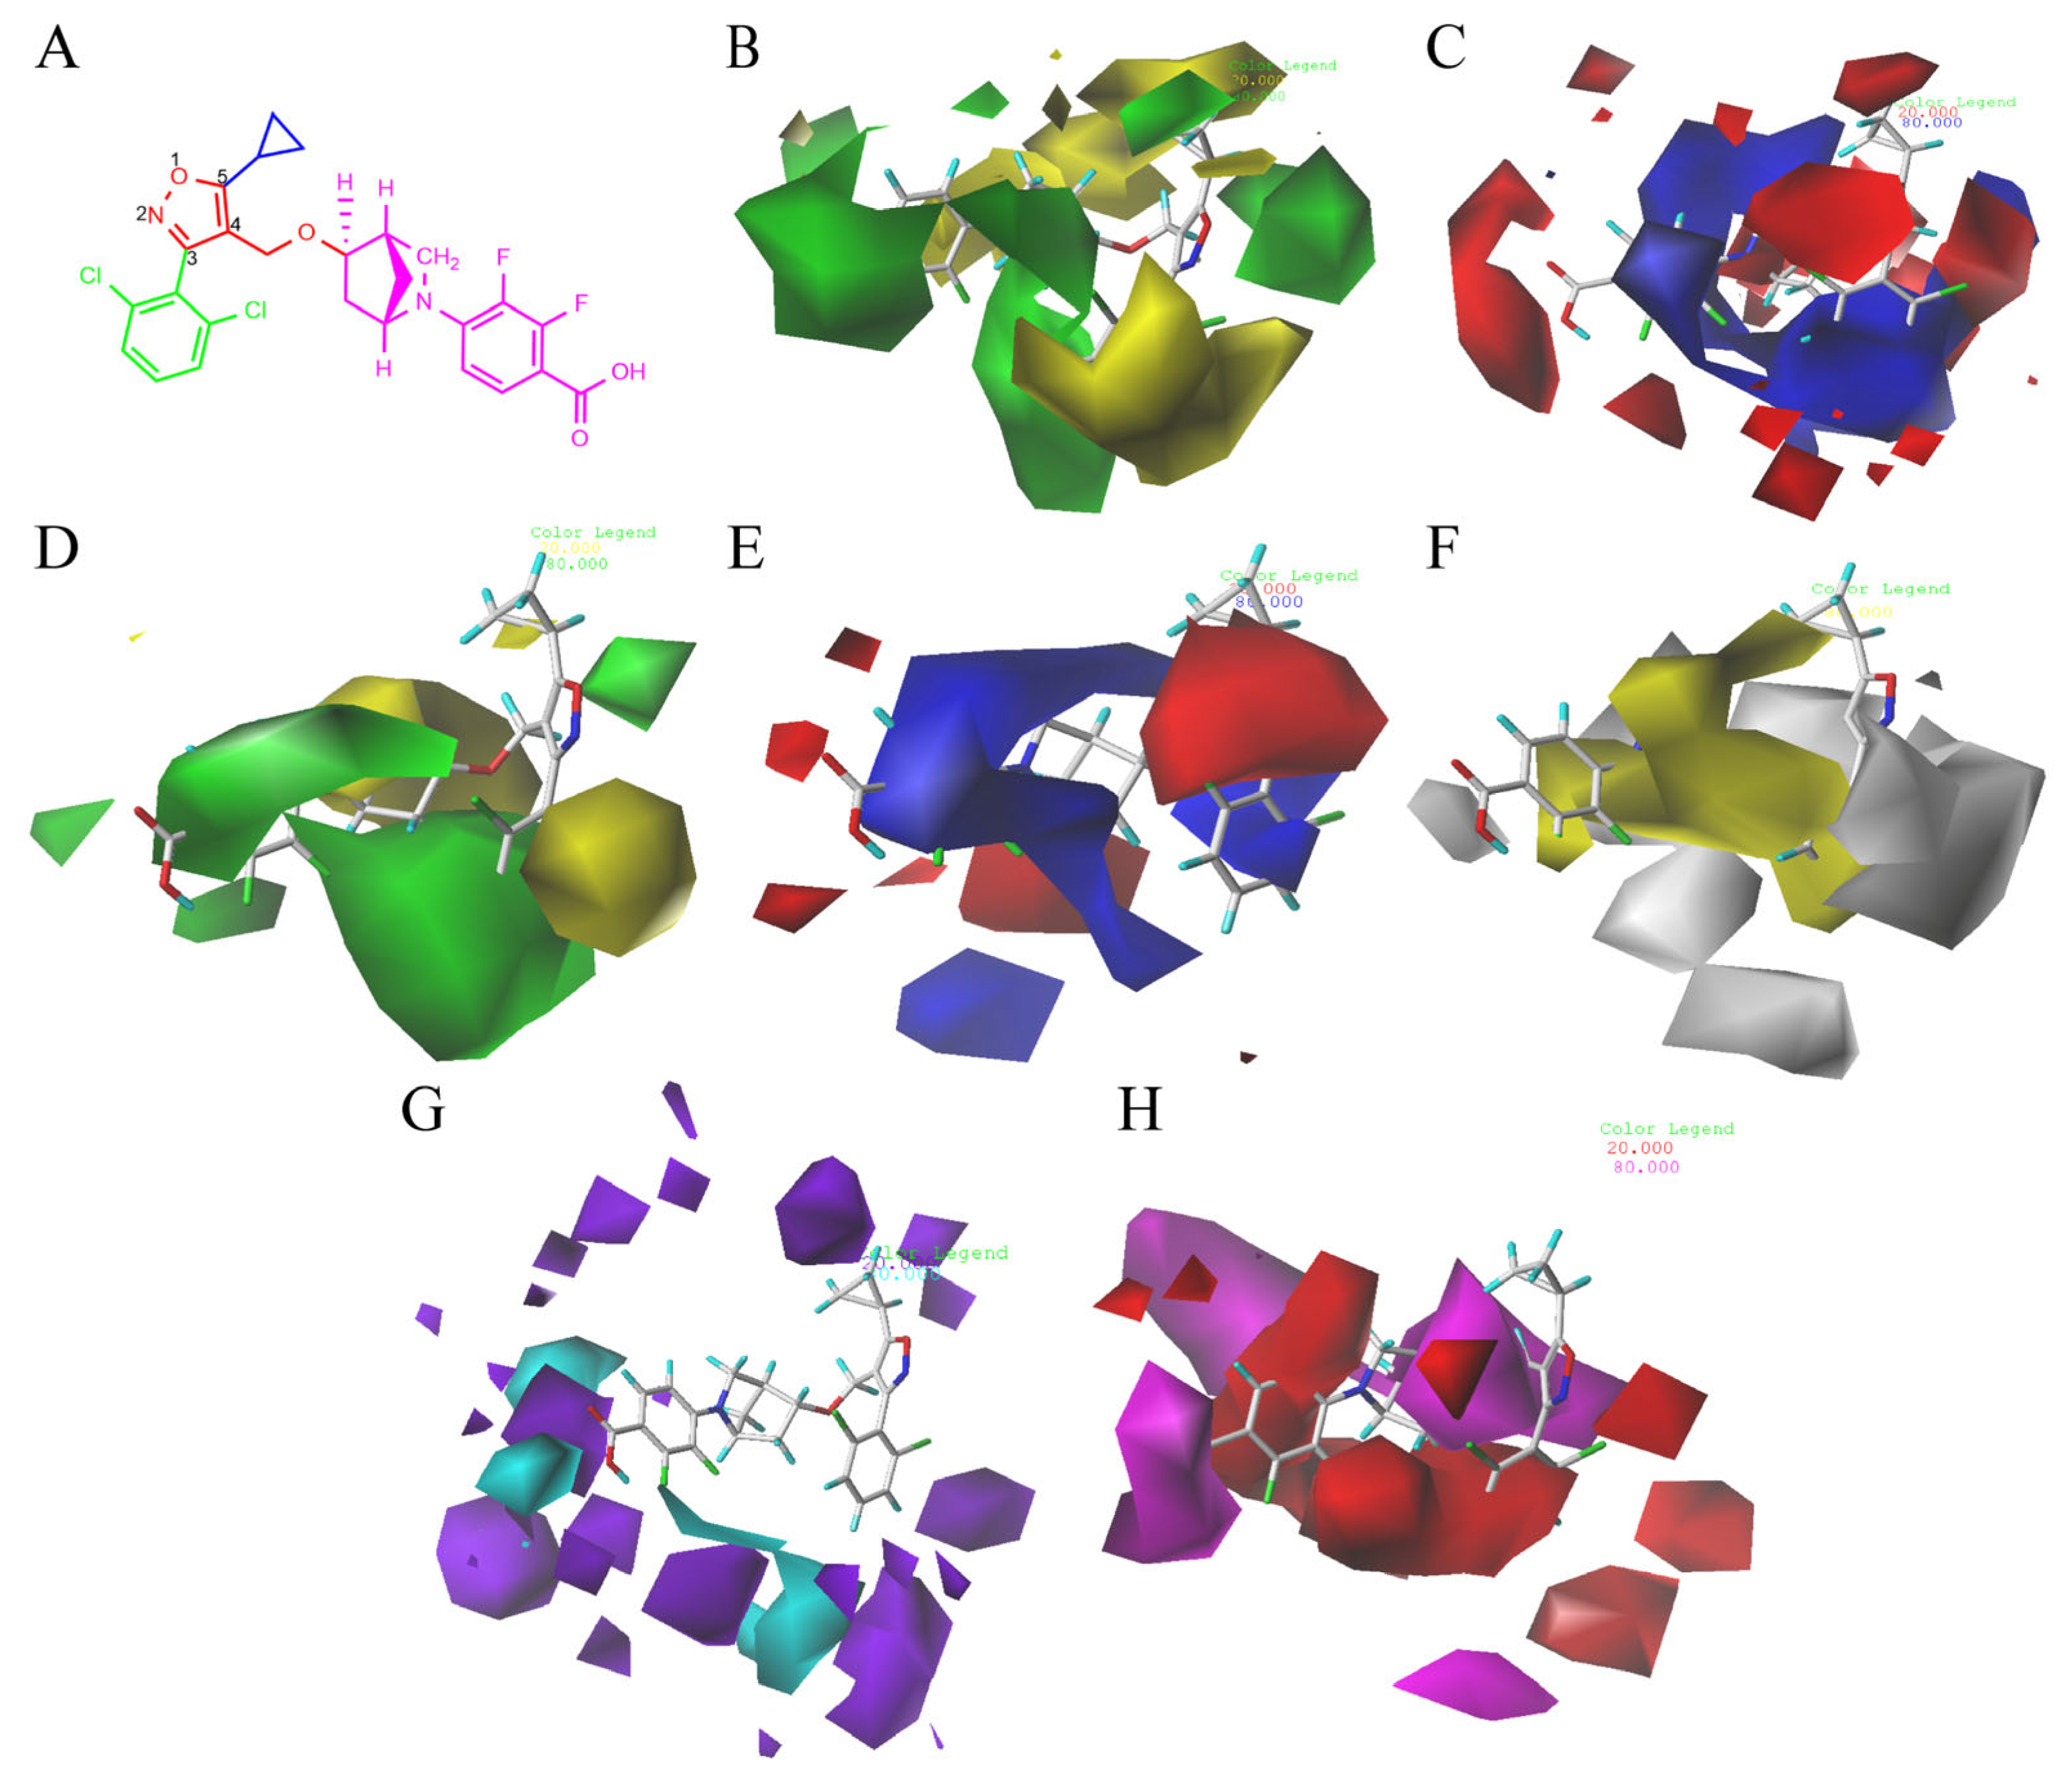
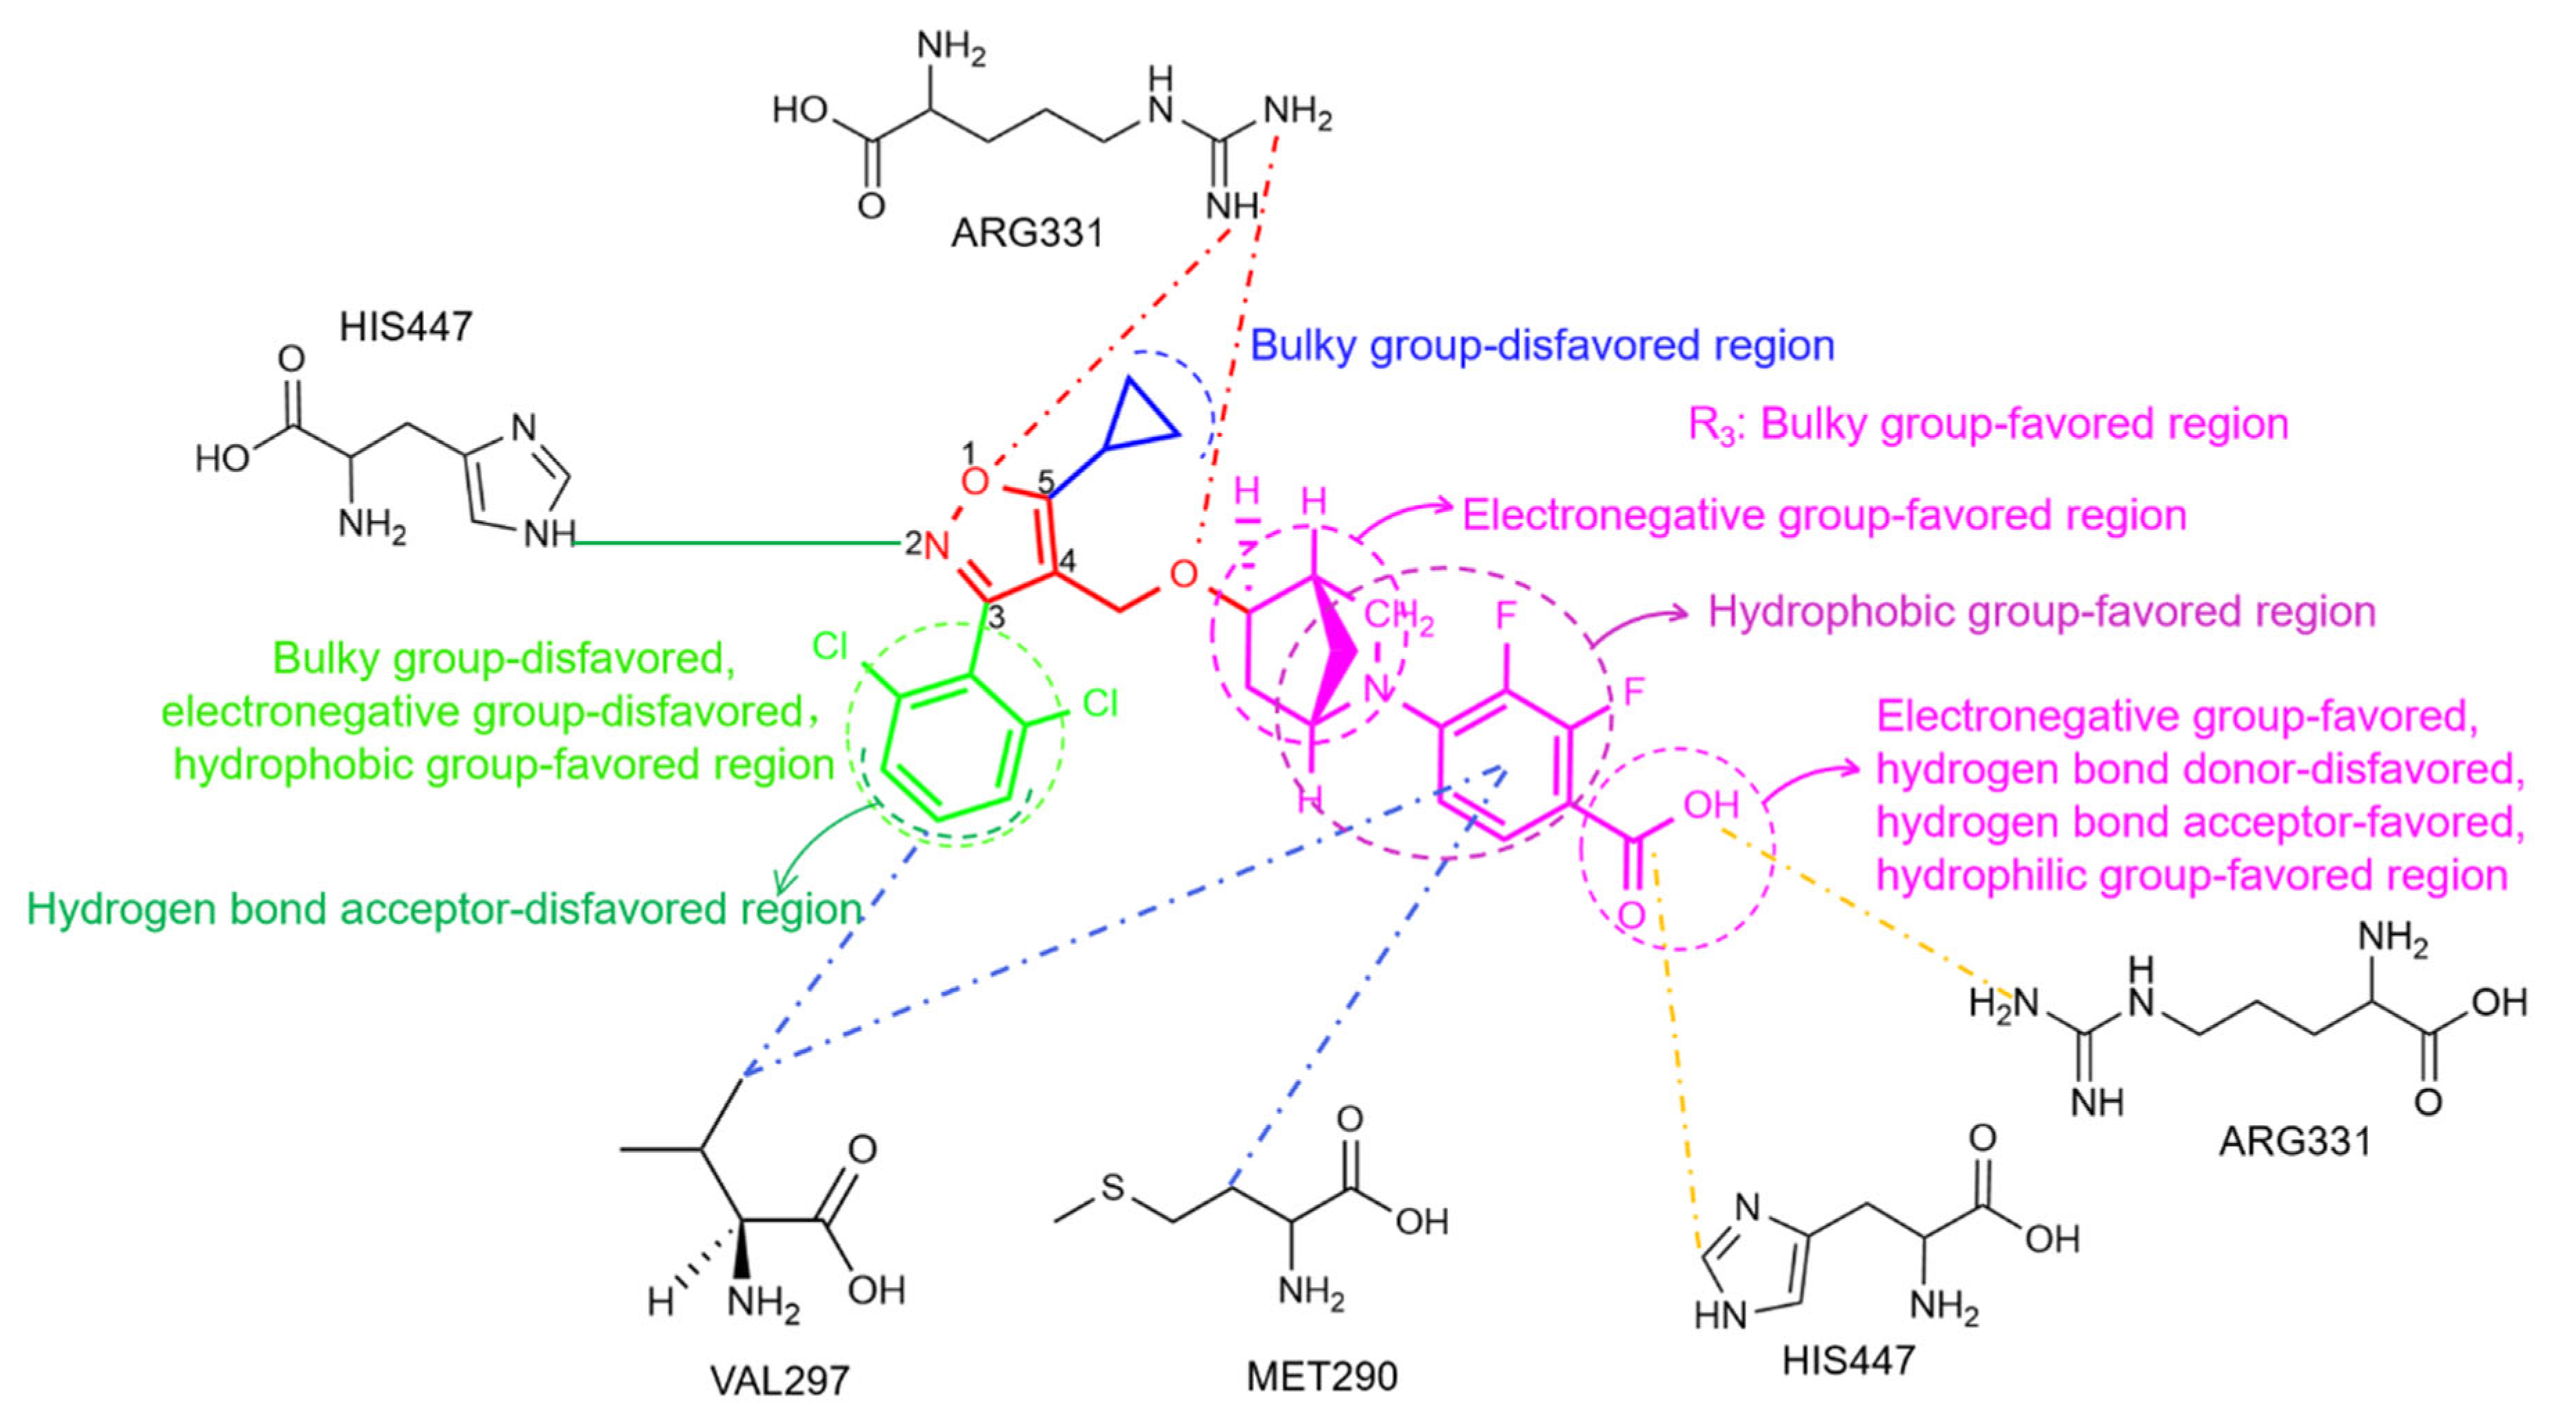
2.2. 3D-QSAR Contour Map Analysis
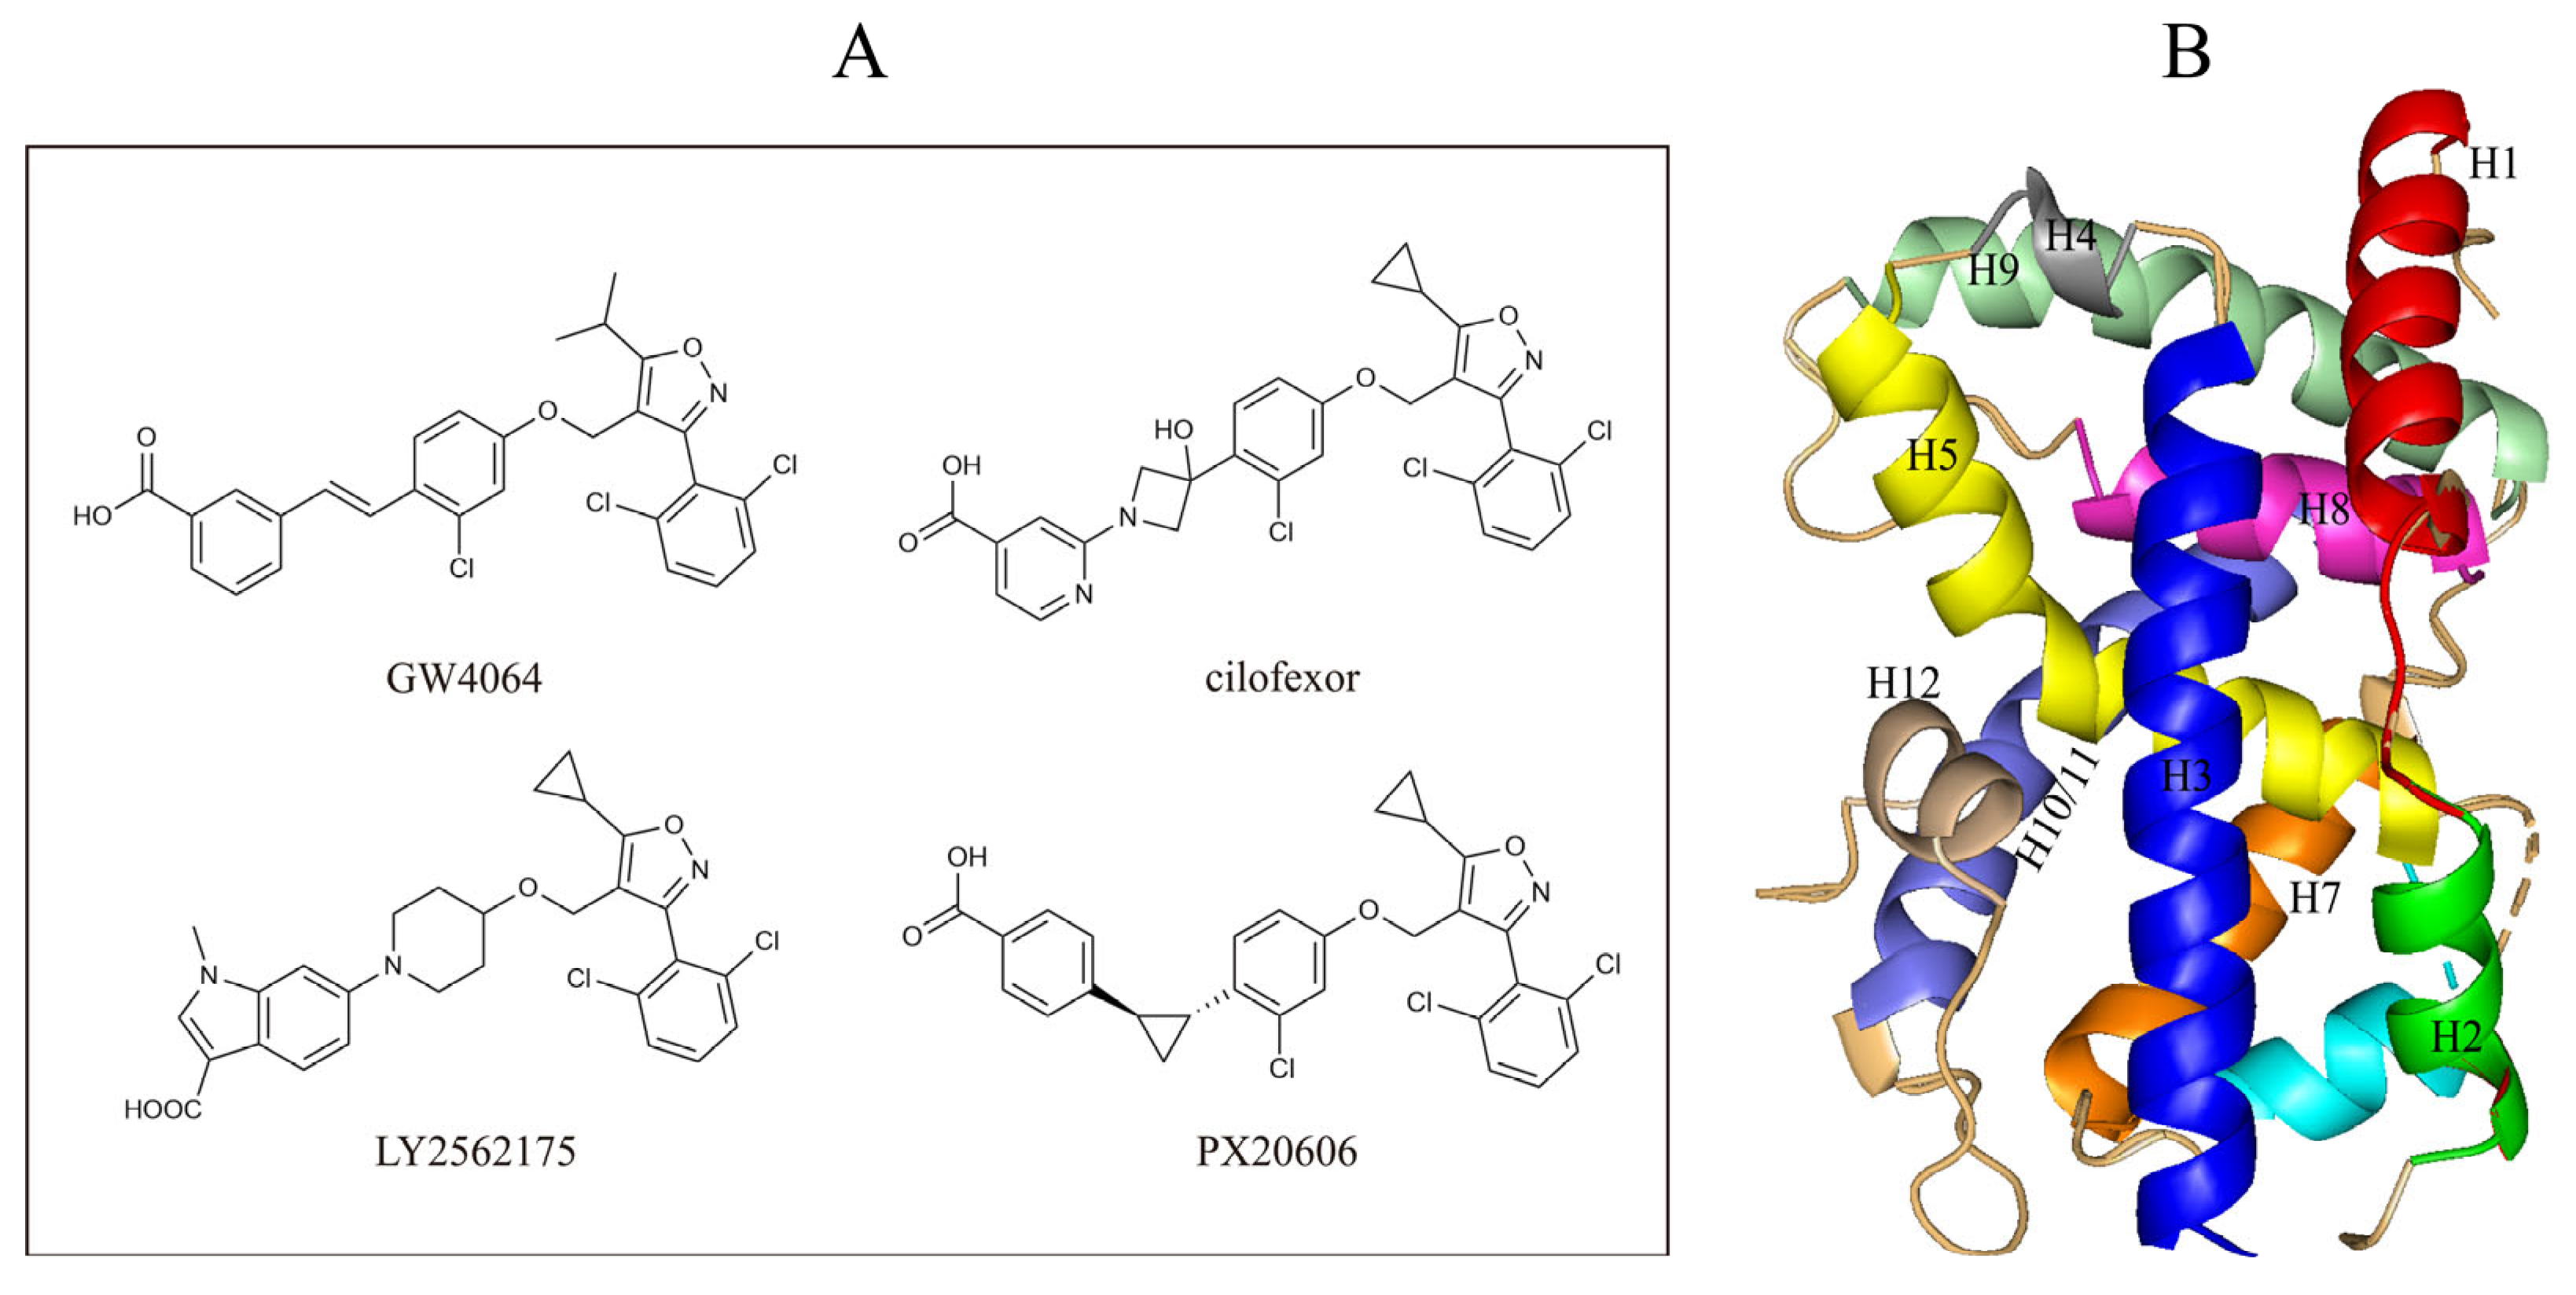
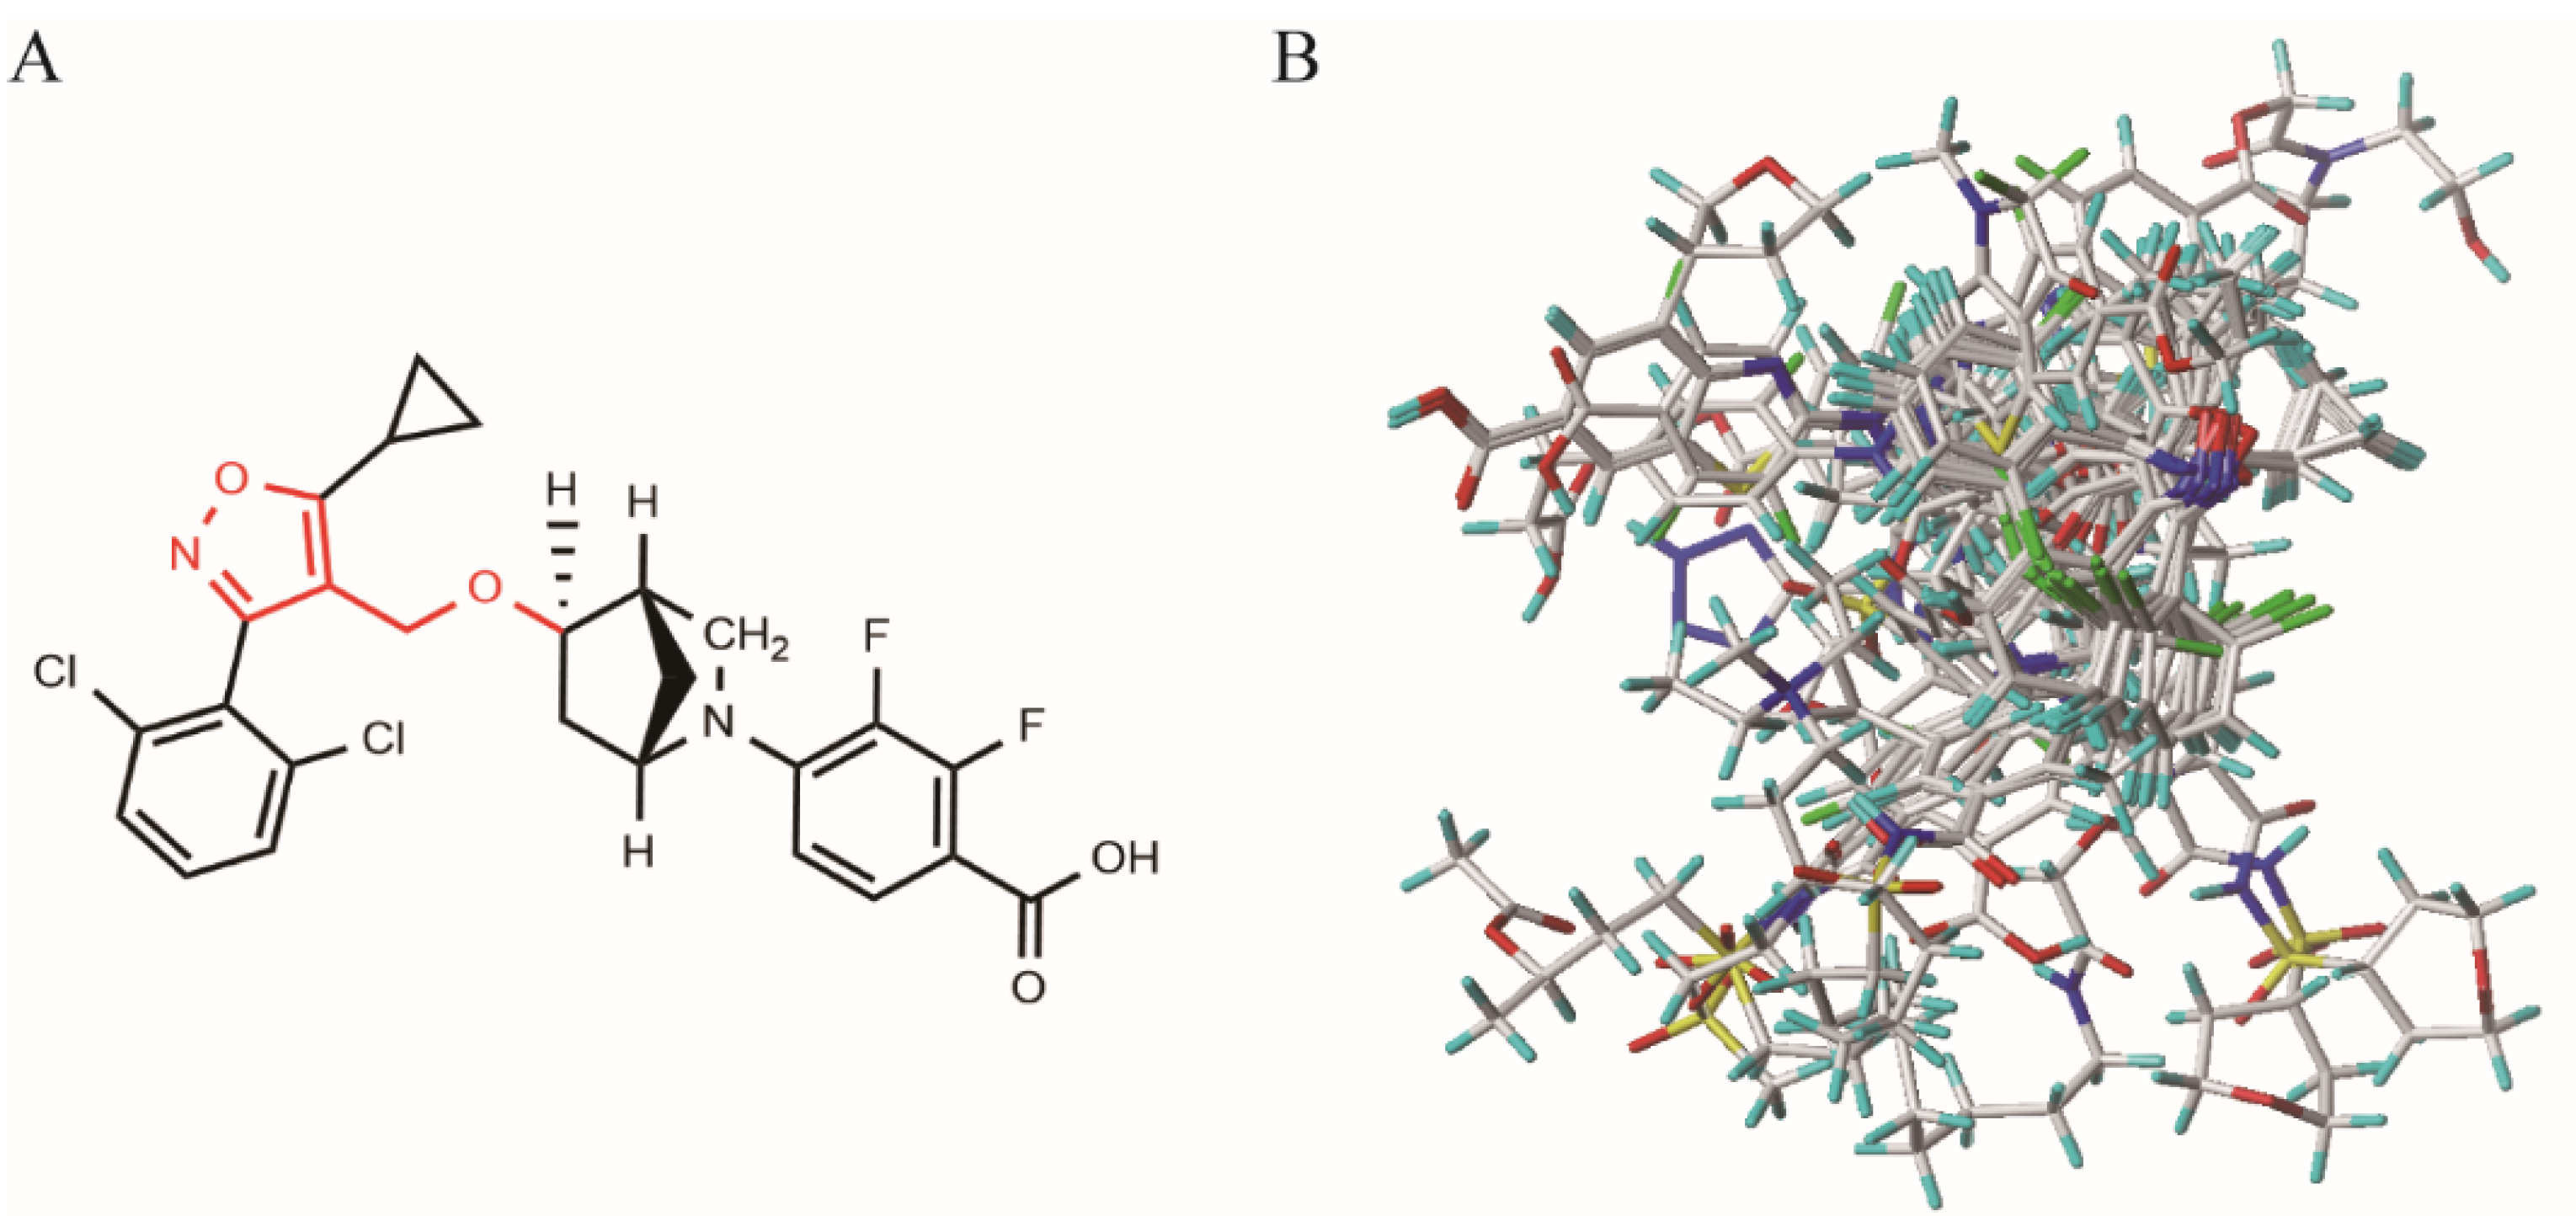
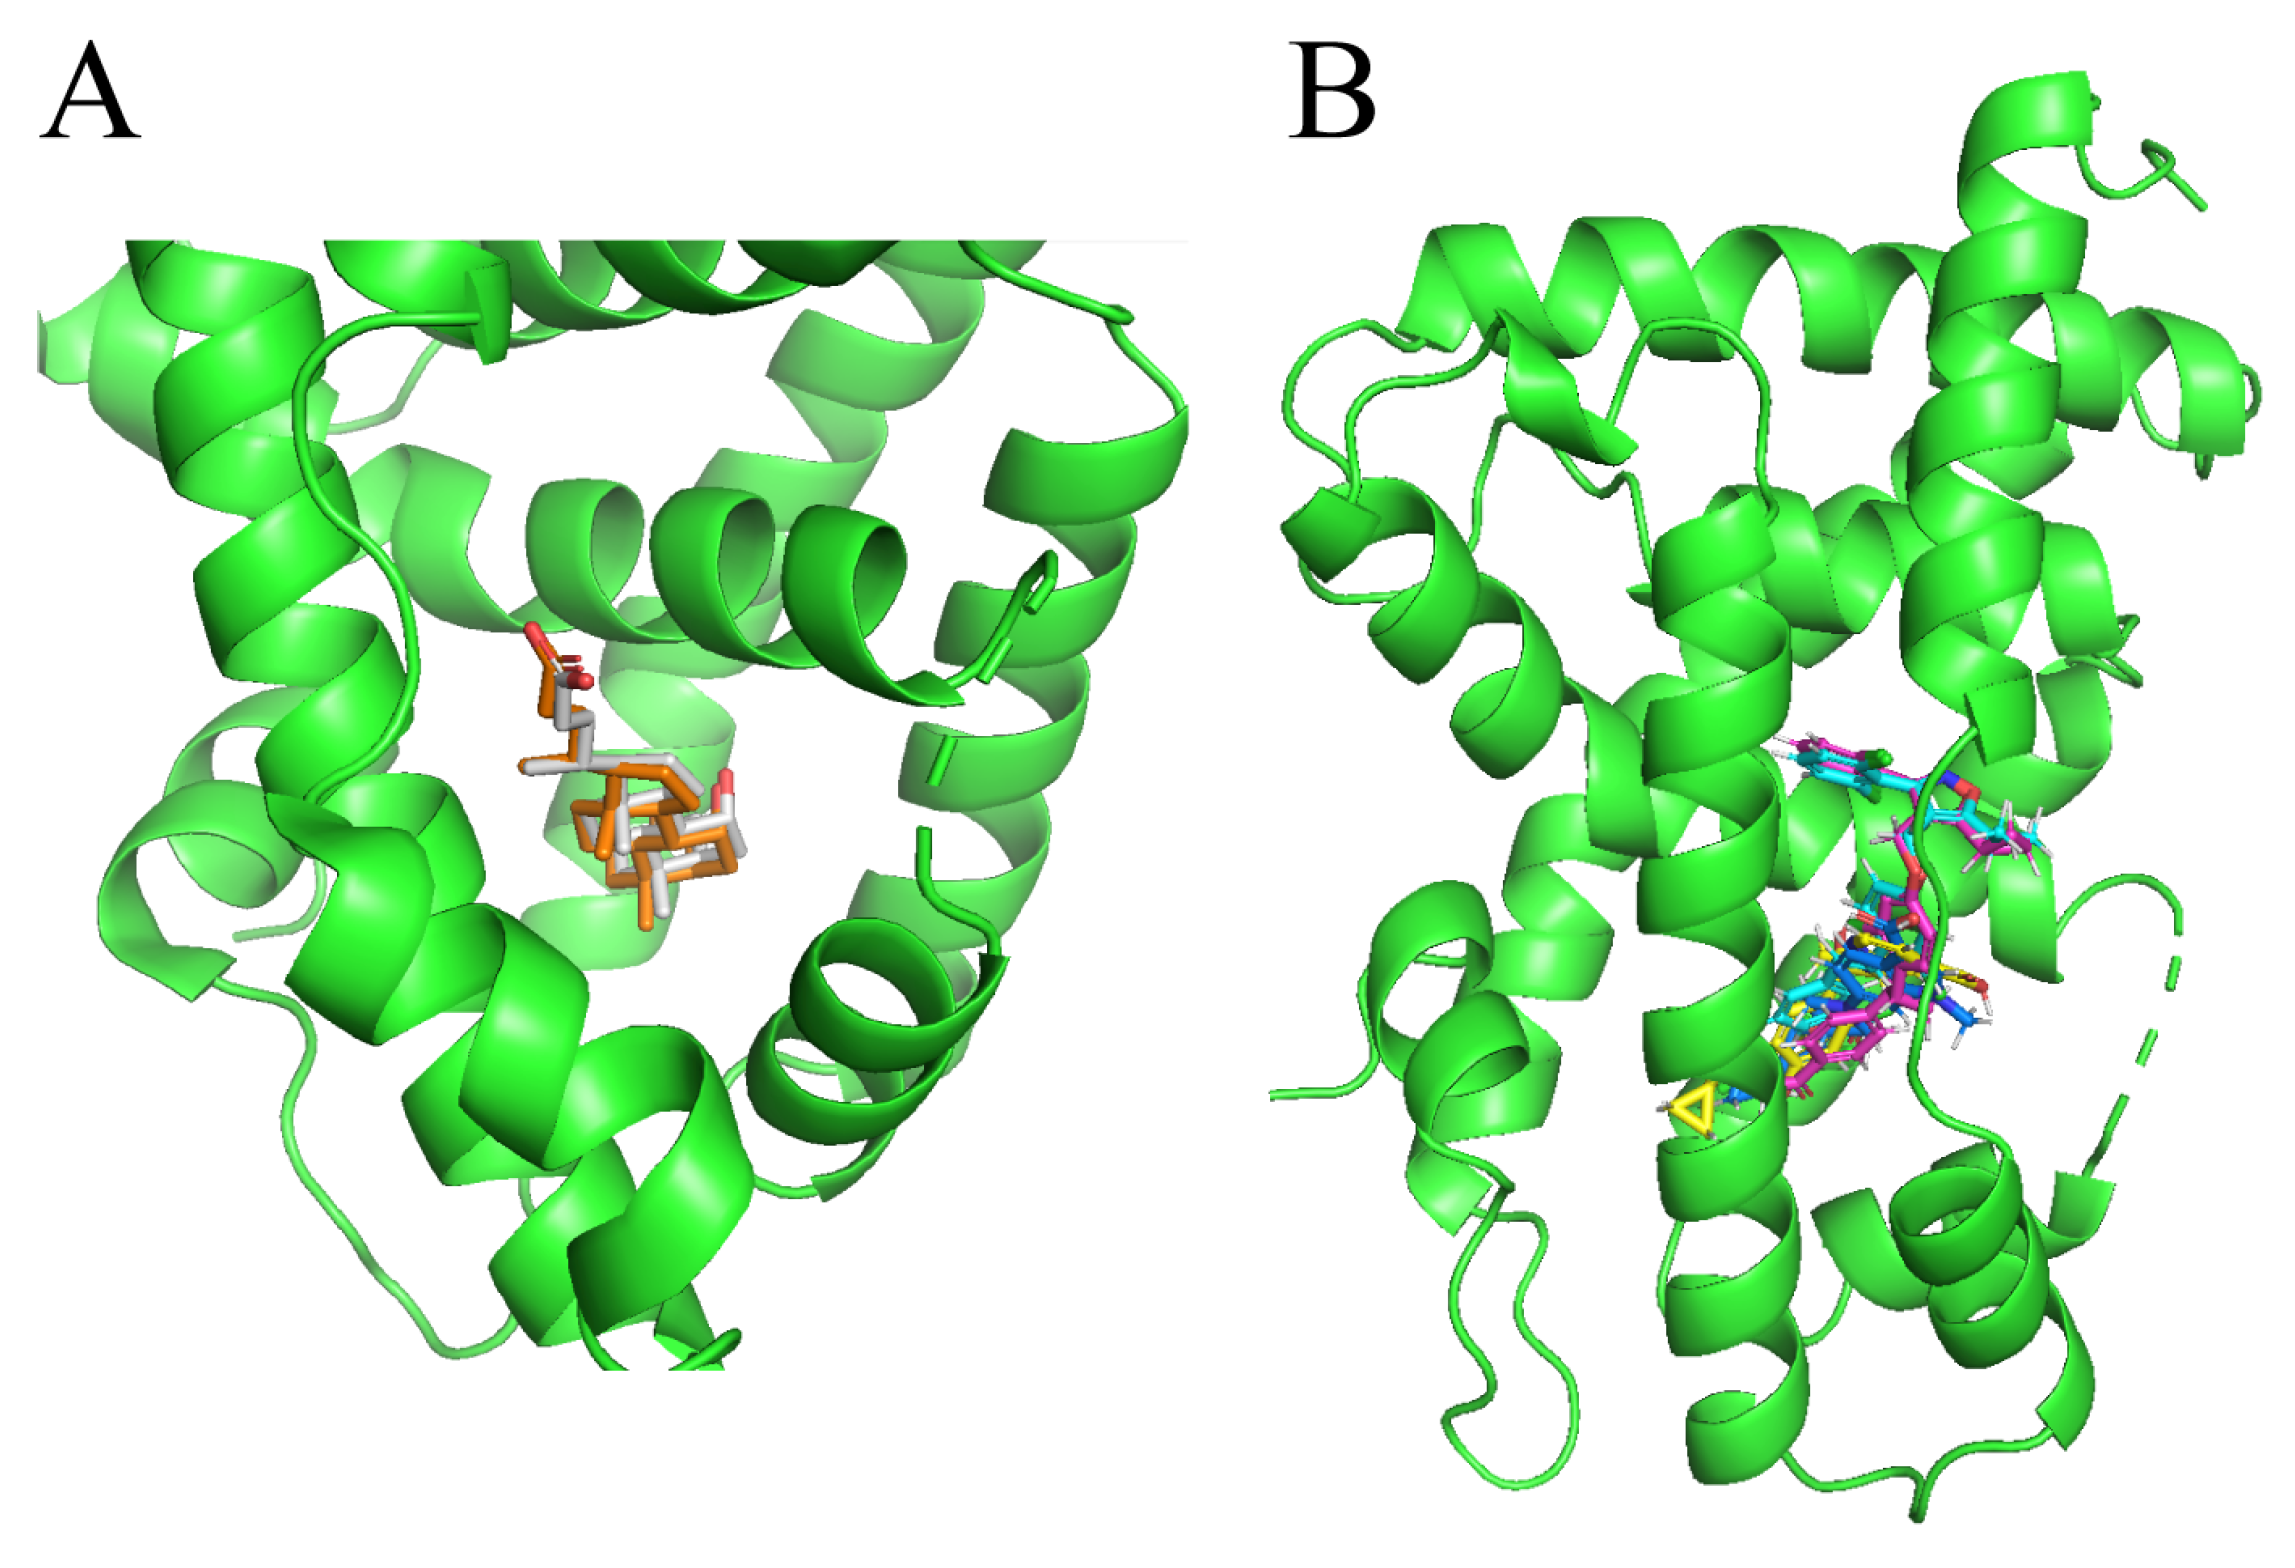
2.3. Molecular Docking
2.4. Molecular Dynamic Simulations
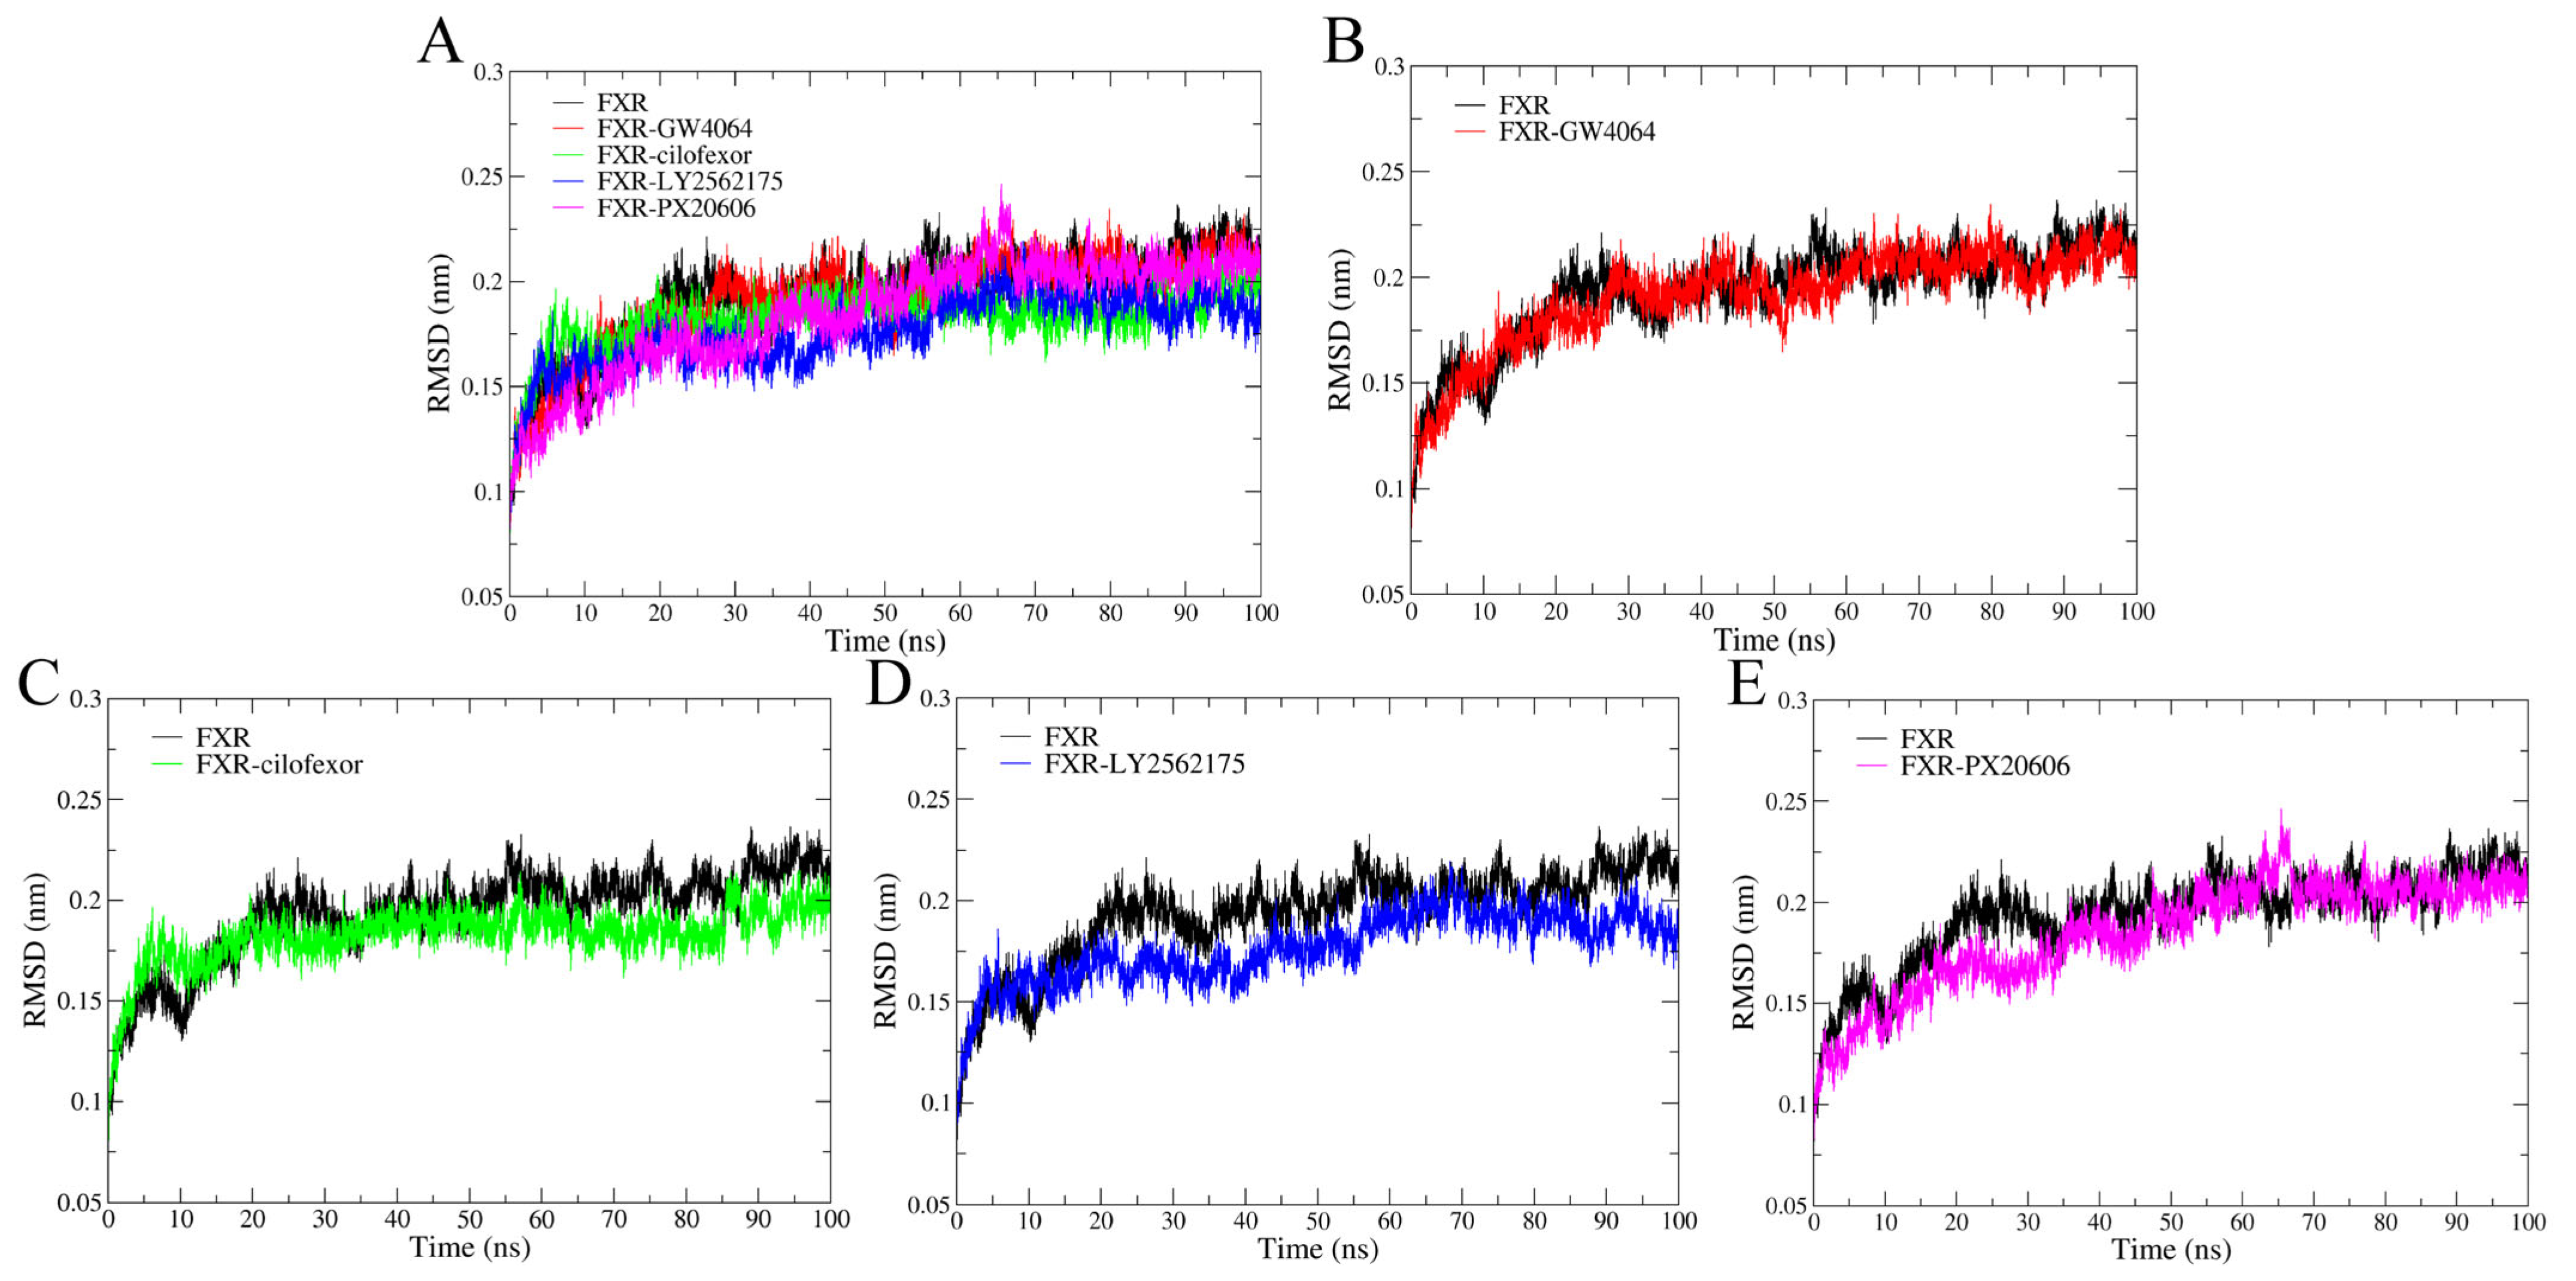
2.4.1. Root Mean Square Deviation
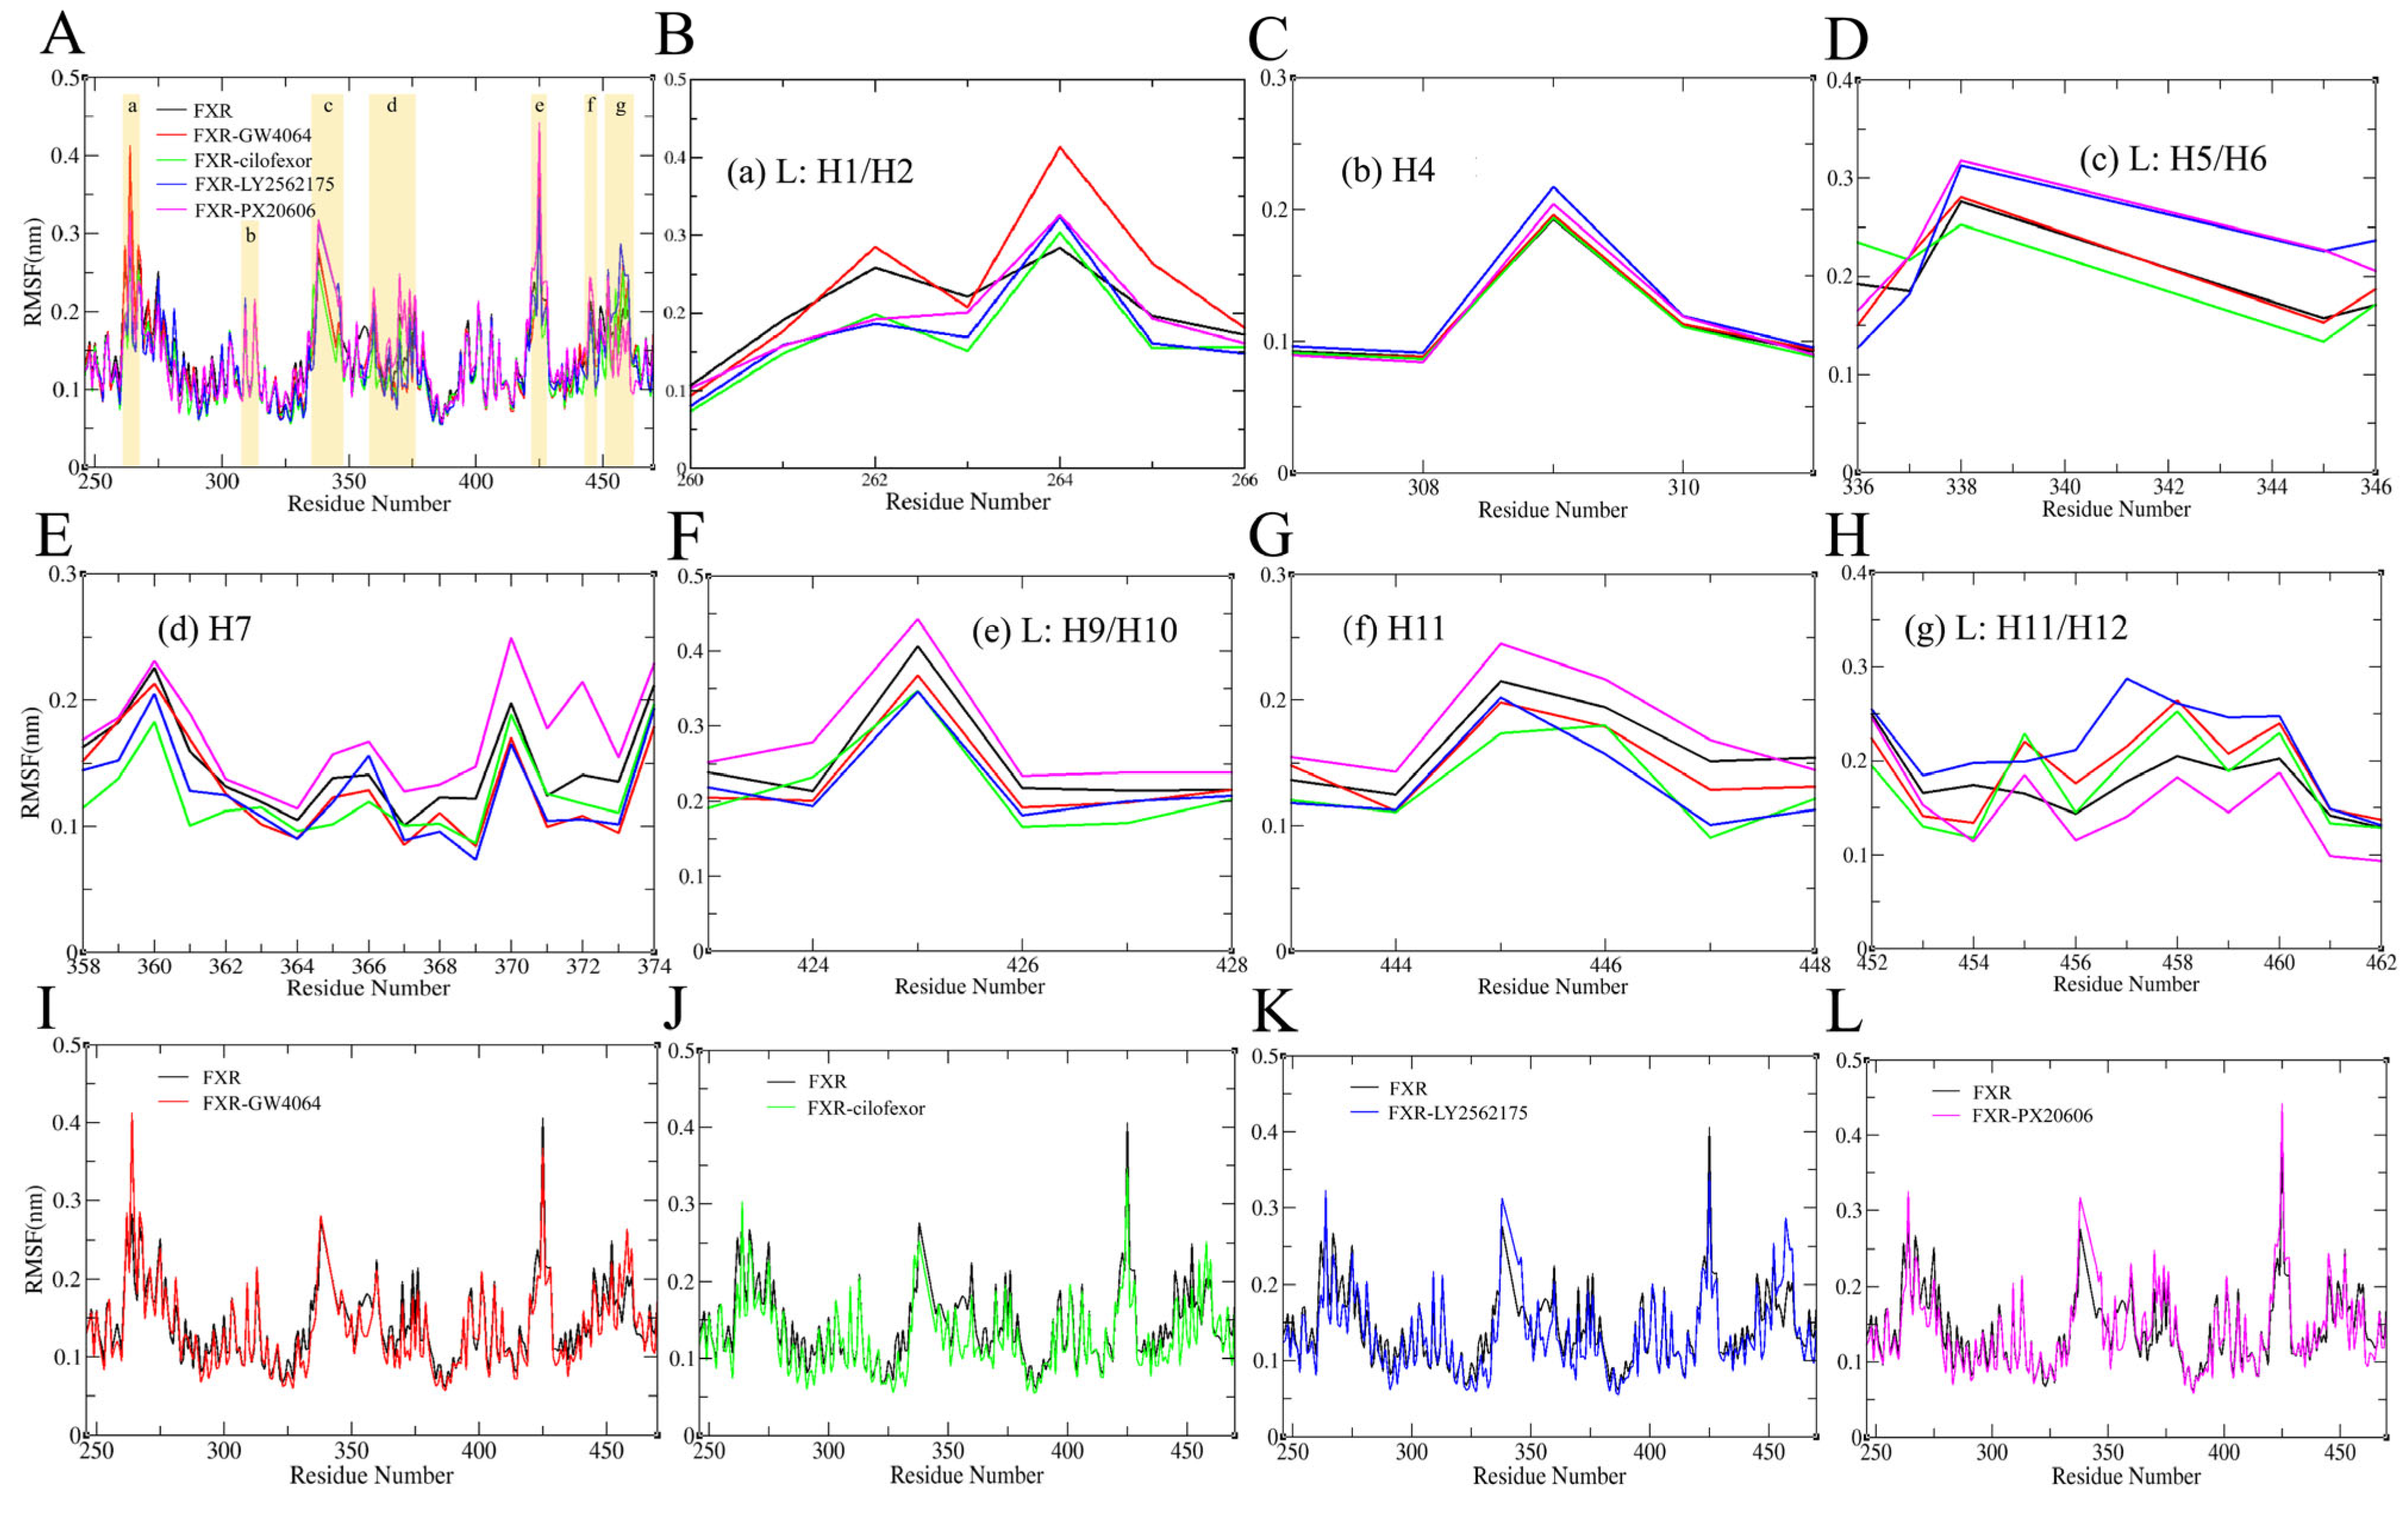
2.4.2. Root Mean Square Fluctuation
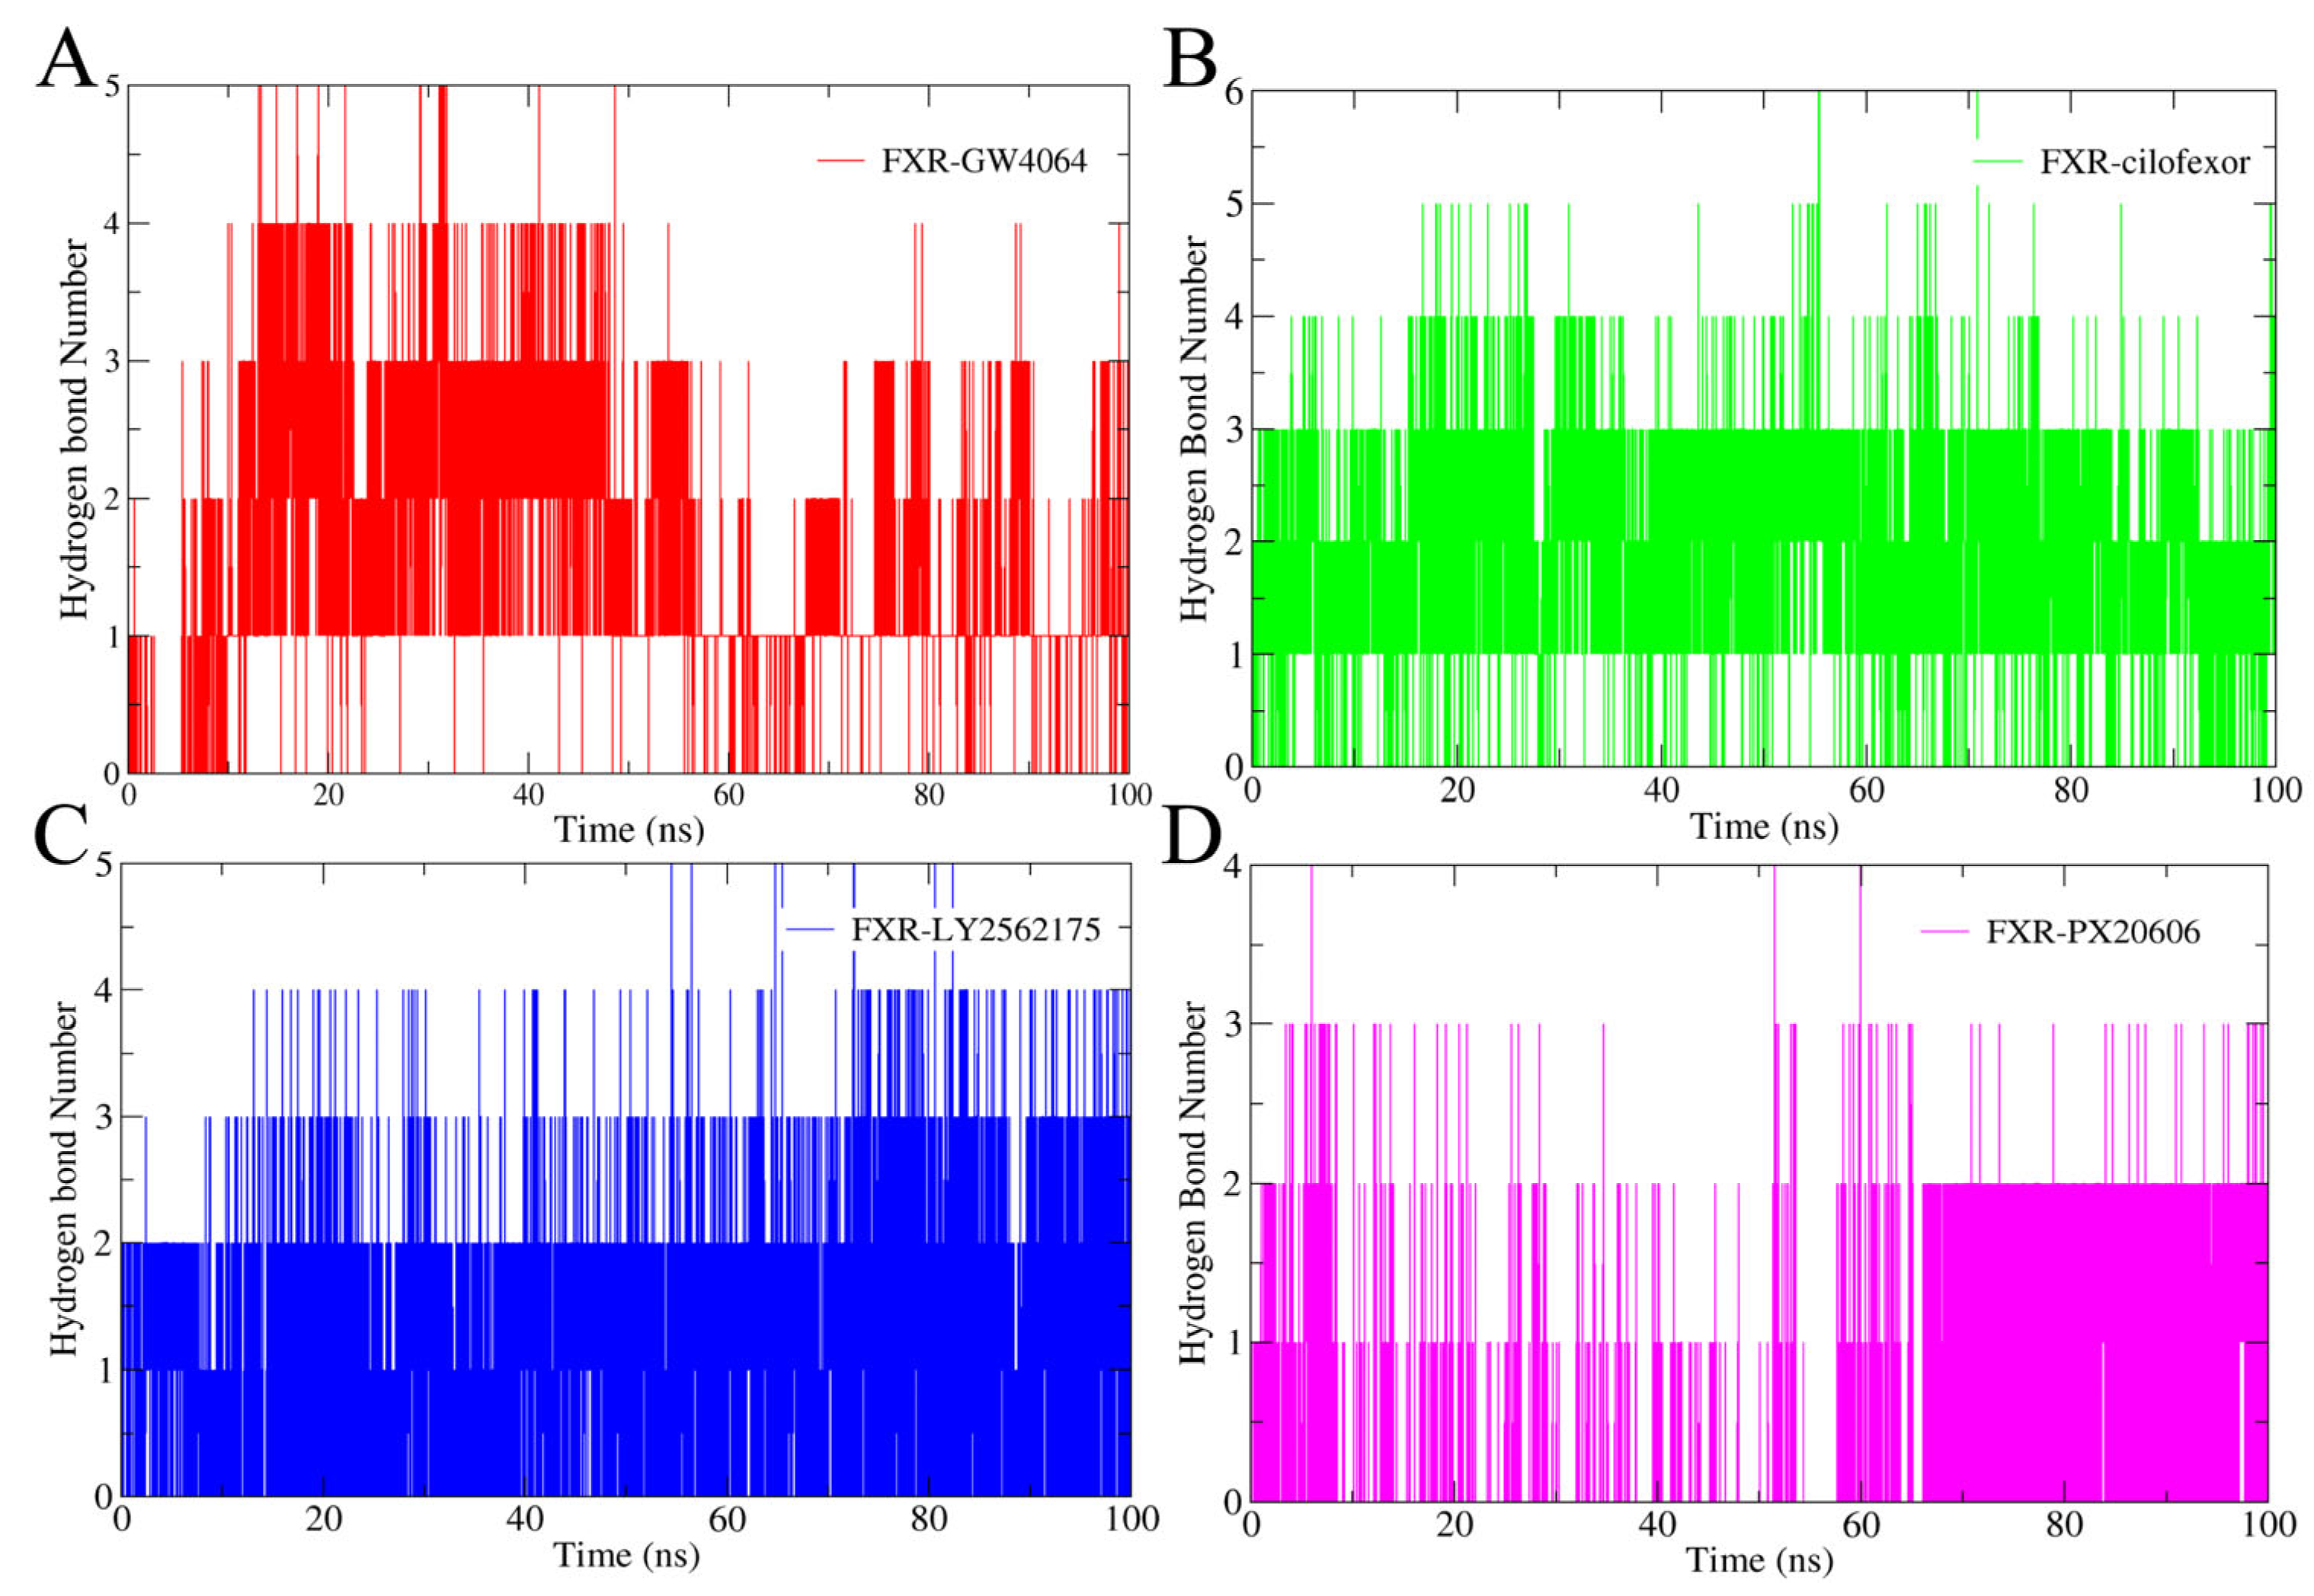
2.4.3. Hydrogen Bonding Analysis
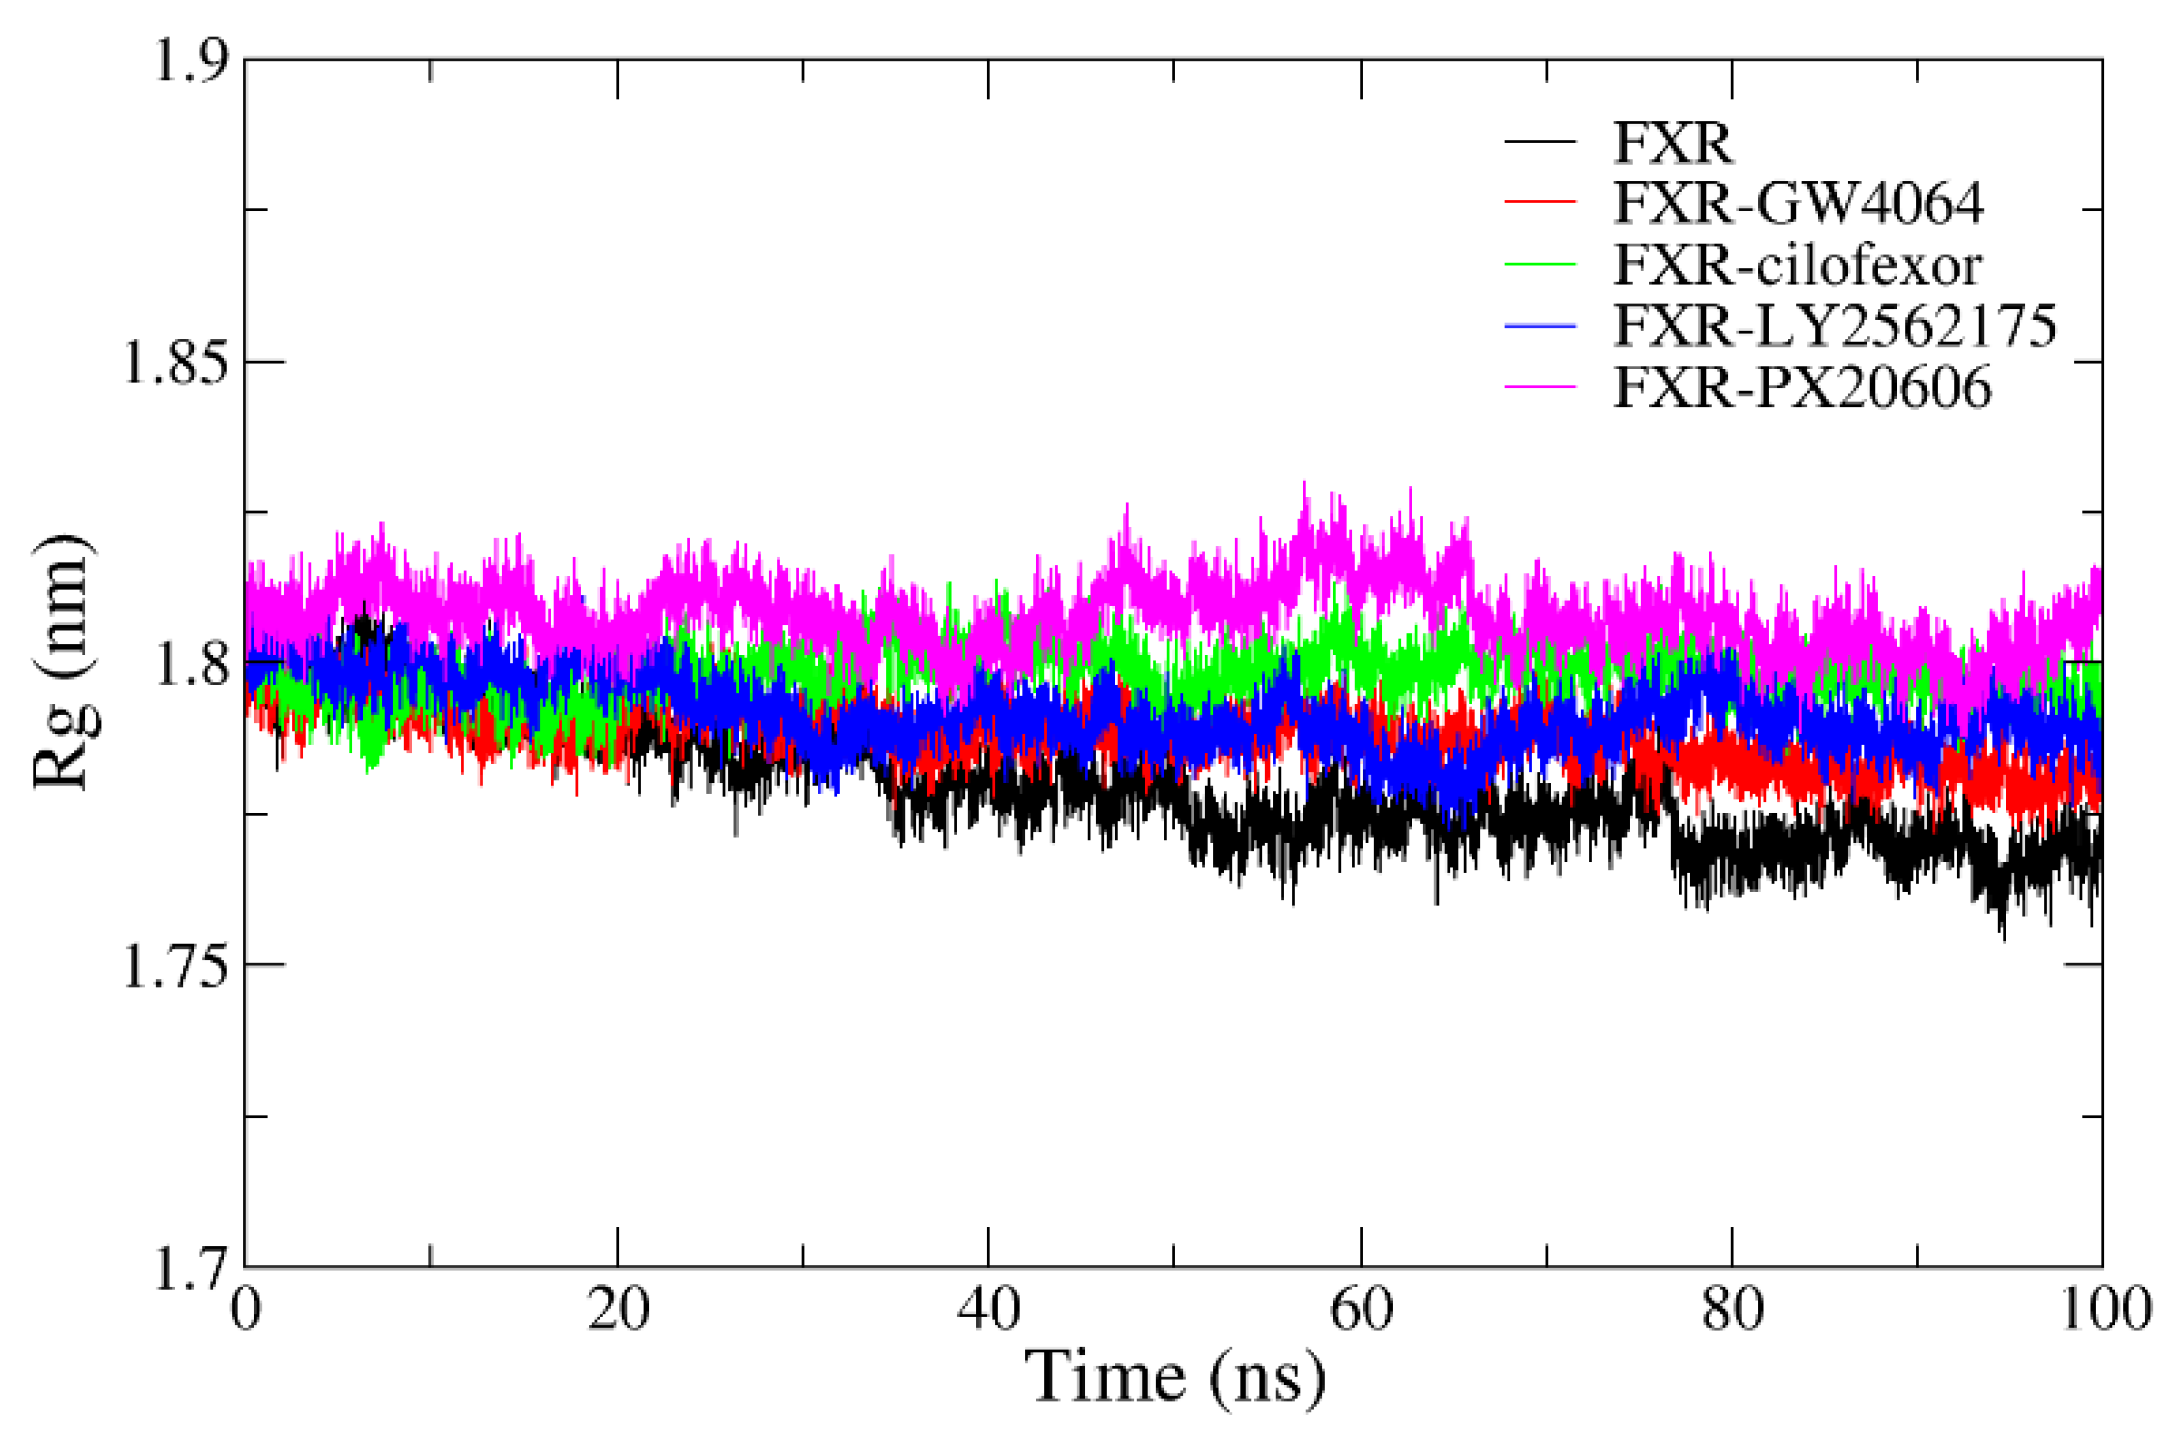
2.4.4. Radius of Gyration Analysis
2.4.5. Evaluation of Ligand Binding Affinities
2.4.6. Per residue Energy Decomposition
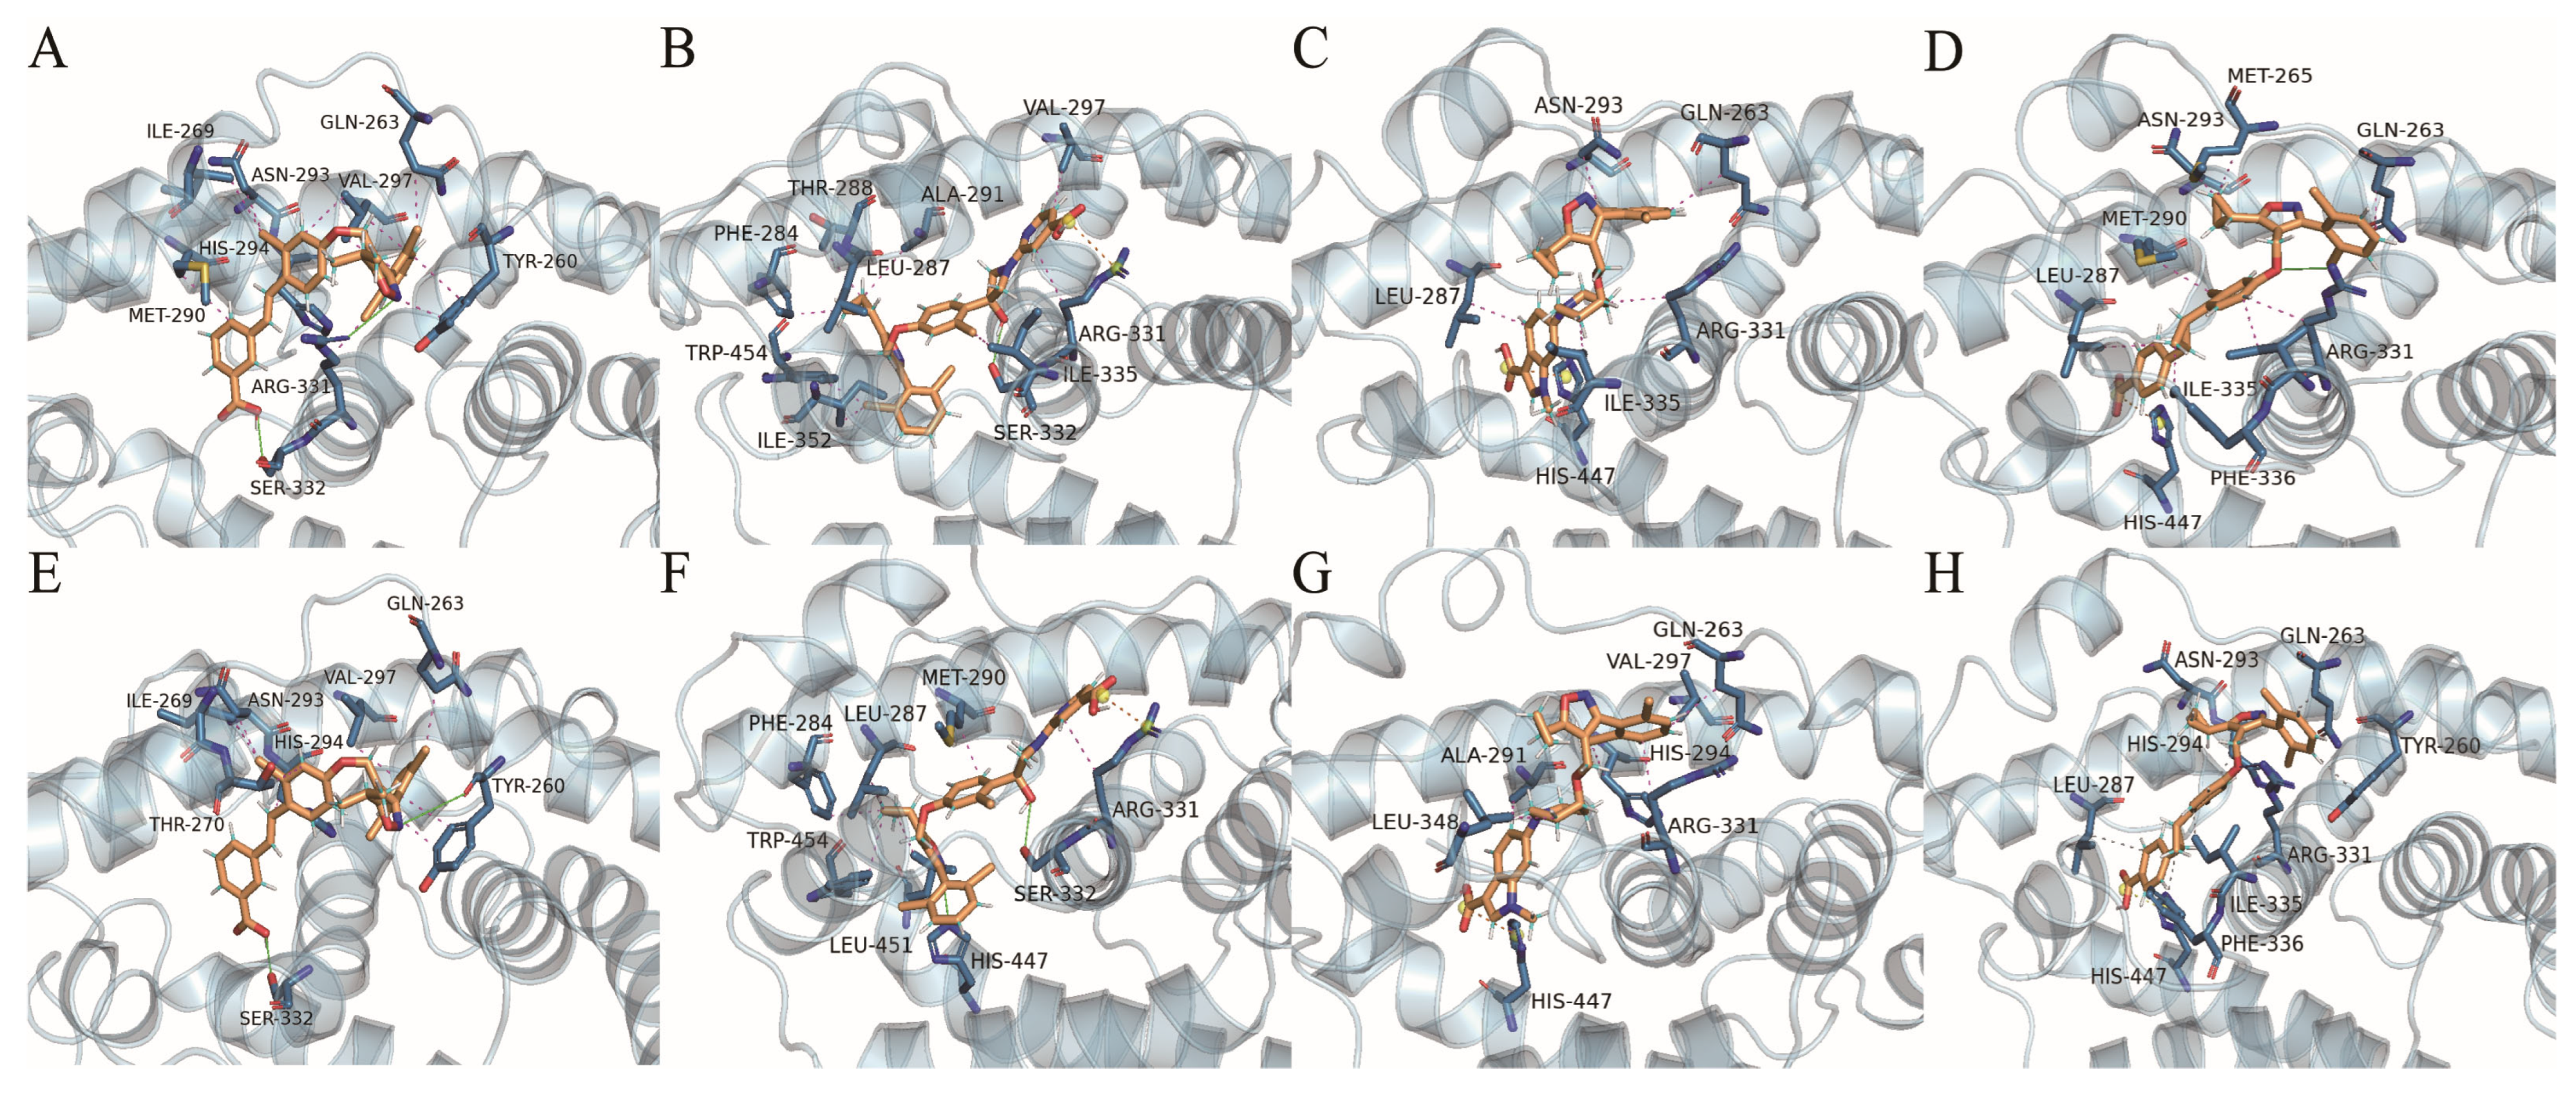
2.4.7. Protein–Ligand Interactions
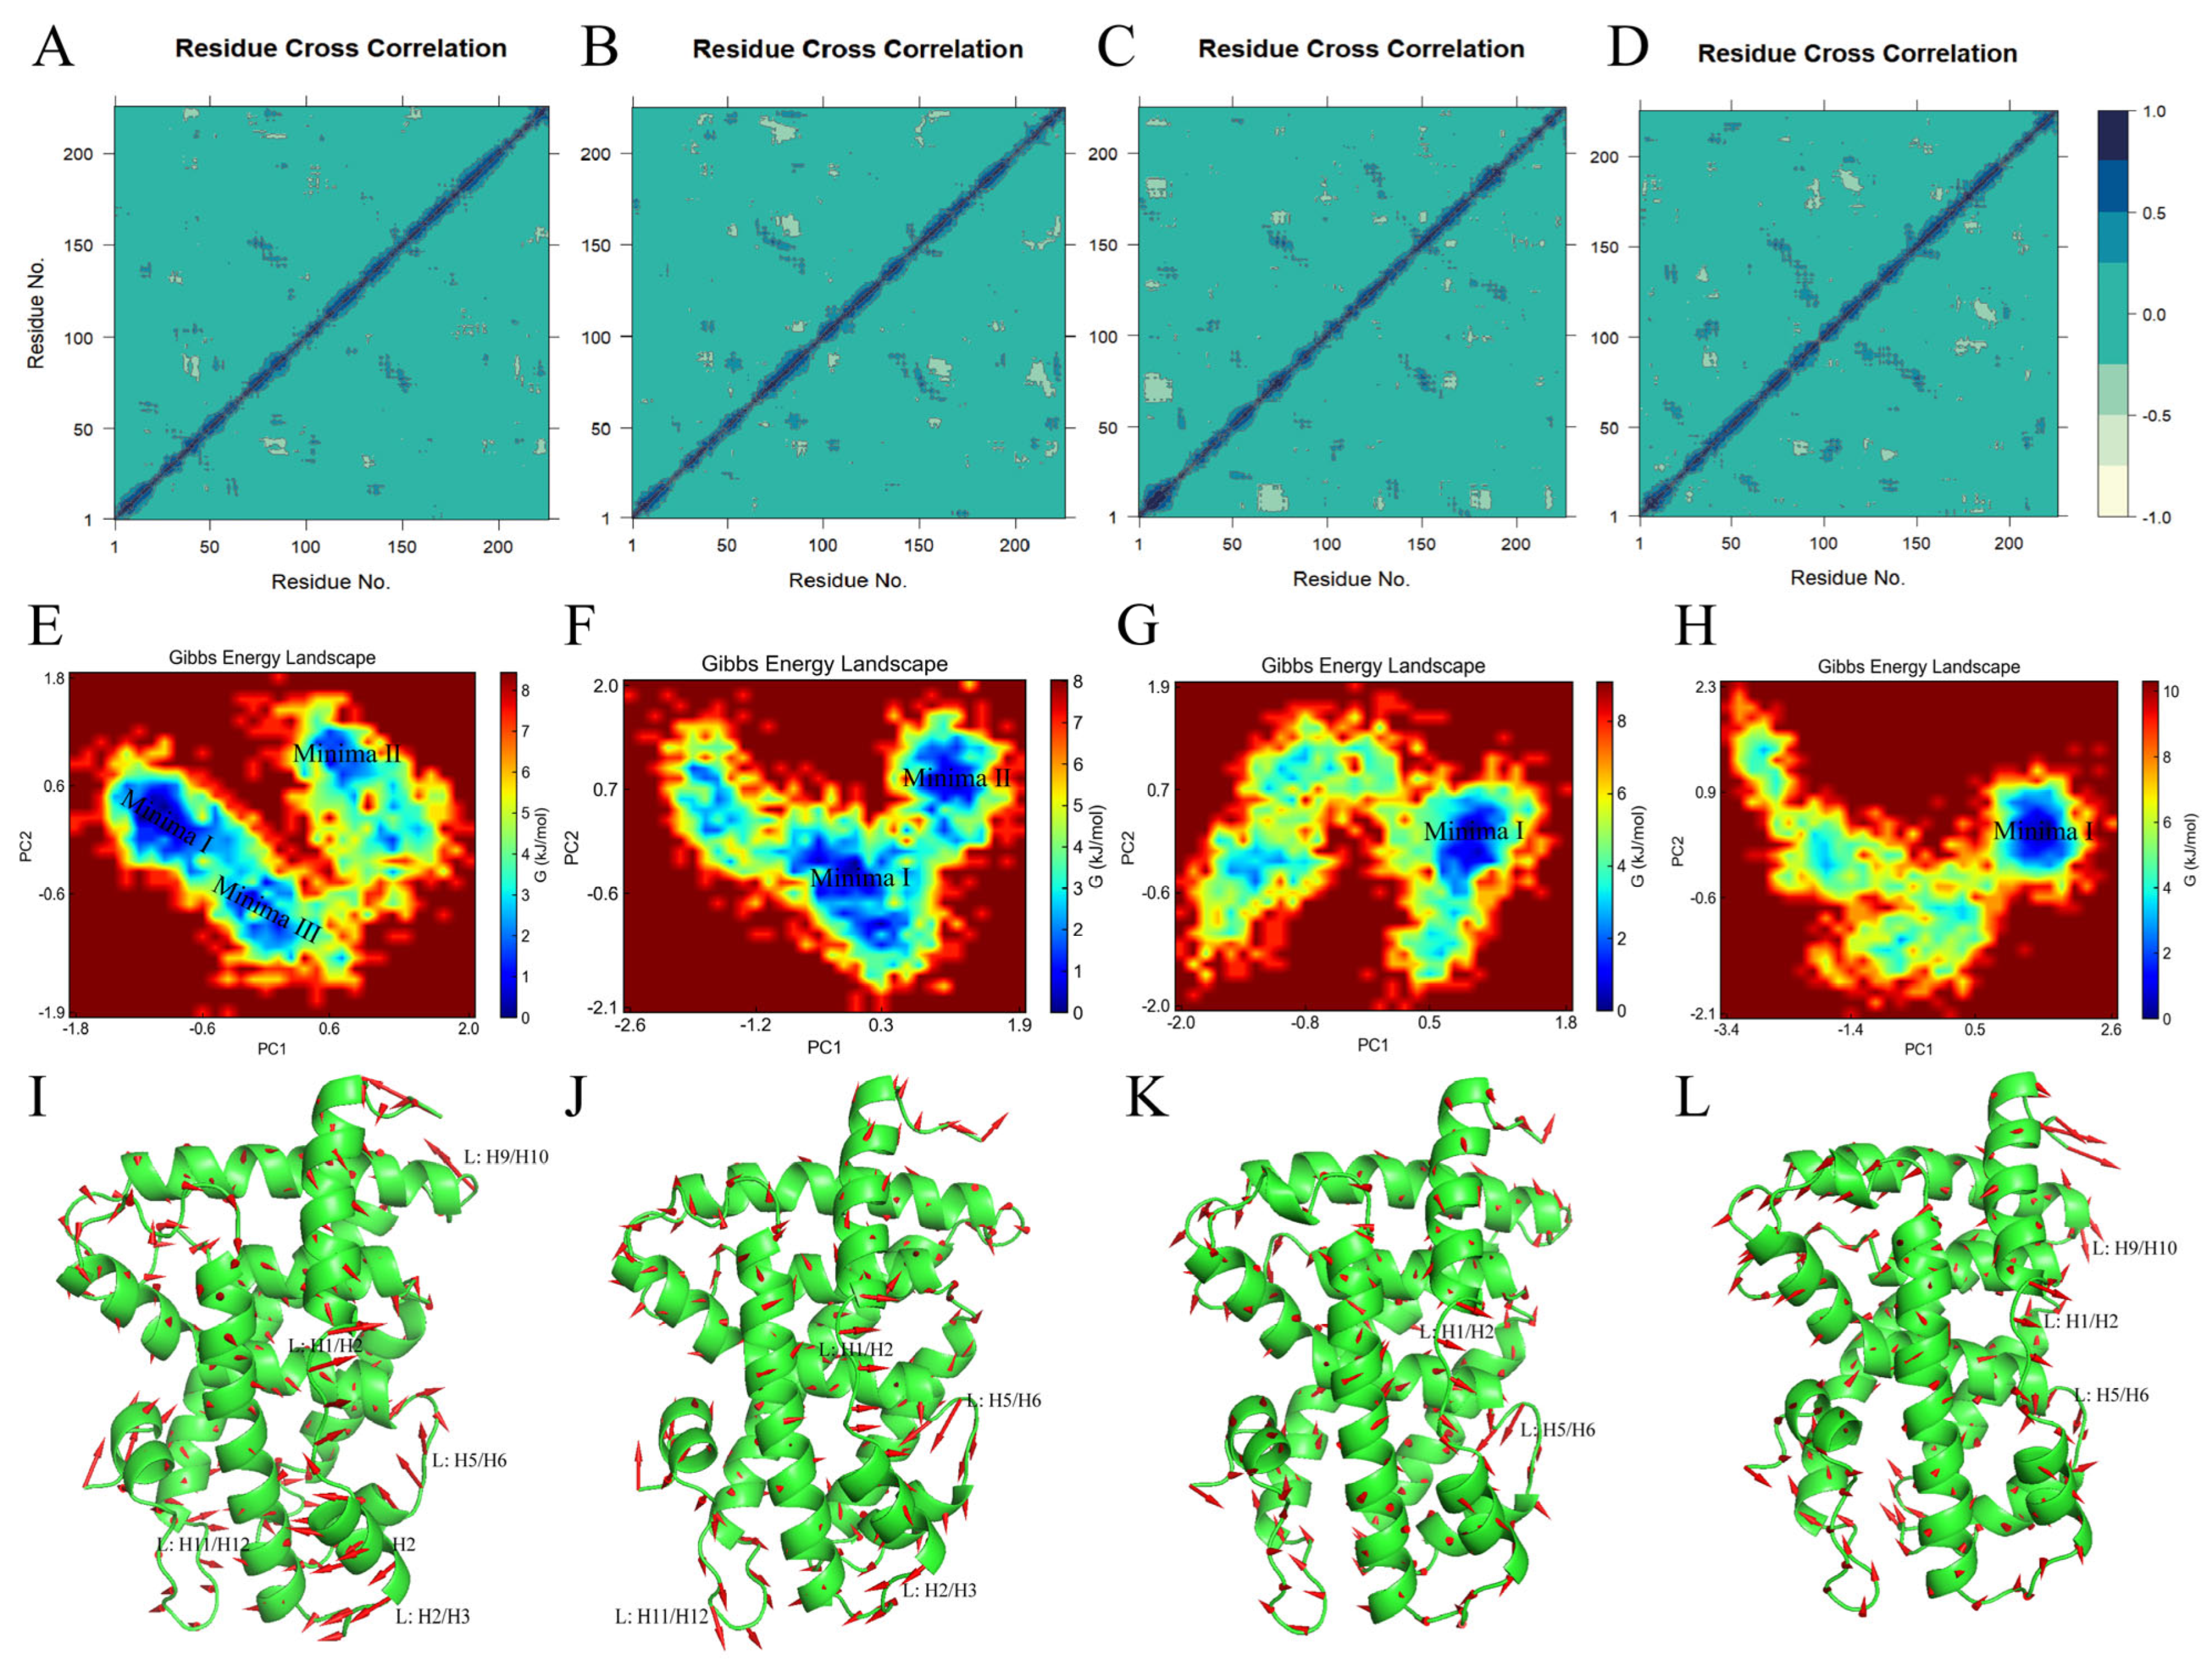
2.4.8. Conformational Flexibility in the Ligand Binding Domain of the FXR
2.5. Summary of Structure–Activity Relationships
2.6. Design of Novel Compound
3. Materials and Methods
3.1. Database Selection and Biological Activity
3.2. Molecular Optimization and Alignment
3.3. Construction of the 3D-QSAR Model
3.4. External Validation of the CoMFA and CoMSIA Models
3.5. Molecular Docking
3.6. Molecular Dynamic Simulations
3.6.1. System Preparation
3.6.2. MD Trajectory Analysis
3.6.3. Binding Free Energy Calculations
3.6.4. Protein–Ligand Interaction Analysis
3.6.5. Principal Component Analysis and Dynamic Cross-Correlation Matrix
3.6.6. Free Energy Landscape
4. Conclusions
Supplementary Materials
Author Contributions
Funding
Institutional Review Board Statement
Informed Consent Statement
Data Availability Statement
Conflicts of Interest
References
- Rom, O.; Liu, Y.; Liu, Z.; Zhao, Y.; Wu, J.; Ghrayeb, A.; Villacorta, L.; Fan, Y.; Chang, L.; Wang, L.; et al. Glycine-based treatment ameliorates NAFLD by modulating fatty acid oxidation, glutathione synthesis, and the gut microbiome. Sci. Transl. Med. 2020, 12, eaaz2841. [Google Scholar] [CrossRef]
- Tomasiewicz, K.; Flisiak, R.; Halota, W.; Jaroszewicz, J.; Lebensztejn, D.; Lisik, W.; Małkowski, P.; Pawłowska, M.; Piekarska, A.; Simon, K.; et al. Recommendations for the management of non-alcoholic fatty liver disease (NAFLD). Clin. Exp. Hepatol. 2018, 4, 153–157. [Google Scholar] [CrossRef]
- Eloranta, J.J.; Kullak-Ublick, G.A. The role of FXR in disorders of bile acid homeostasis. Physiology 2008, 23, 286–295. [Google Scholar] [CrossRef]
- Sepe, V.; Distrutti, E.; Fiorucci, S.; Zampella, A. Farnesoid X receptor modulators 2014-present: A patent review. Expert Opin. Ther. Pat. 2018, 28, 351–364. [Google Scholar] [CrossRef]
- Taylor, R.; Armstrong, L.; Bhattacharya, A.; Henry, Z.; Brinker, A.; Buckley, B.; Kong, B.; Guo, G. Myclobutanil-mediated alteration of liver-gut FXR signaling in mice. Toxicol. Sci. 2023, 191, 387–399. [Google Scholar] [CrossRef] [PubMed]
- Lee, S.; Woo, D.C.; Kang, J.; Ra, M.; Kim, K.H.; Lee, S.R.; Choi, D.K.; Lee, H.; Hong, K.B.; Min, S.H.; et al. The Role of the Histone Methyltransferase EZH2 in Liver Inflammation and Fibrosis in STAM NASH Mice. Biology 2020, 9, 93. [Google Scholar] [CrossRef] [PubMed]
- Gay, M.D.; Cao, H.; Shivapurkar, N.; Dakshanamurthy, S.; Kallakury, B.; Tucker, R.D.; Kwagyan, J.; Smith, J.P. Proglumide Reverses Nonalcoholic Steatohepatitis by Interaction with the Farnesoid X Receptor and Altering the Microbiome. Int. J. Mol. Sci. 2022, 23, 1899. [Google Scholar] [CrossRef]
- Roy, P.P.; Mahtab, M.A.; Rahim, M.A.; Yesmin, S.S.; Islam, S.B.; Akbar, S.M.F. Treatment of Nonalcoholic Steatohepatitis by Obeticholic Acid: Current Status. Euroasian J. Hepato-Gastroenterol. 2022, 12 (Suppl. S1), S46–S50. [Google Scholar]
- Neuschwander-Tetri, B.A.; Loomba, R.; Sanyal, A.J.; Lavine, J.E.; Van Natta, M.L.; Abdelmalek, M.F.; Chalasani, N.; Dasarathy, S.; Diehl, A.M.; Hameed, B.; et al. Farnesoid X nuclear receptor ligand obeticholic acid for non-cirrhotic, non-alcoholic steatohepatitis (FLINT): A multicentre, randomised, placebo-controlled trial. Lancet 2015, 385, 956–965. [Google Scholar] [CrossRef]
- Xiao, J.; Ng, C.H.; Chin, Y.H.; Tan, D.J.H.; Lim, W.H.; Lim, G.; Quek, J.; Tang, A.S.P.; Chan, K.E.; Soong, R.Y.; et al. A Class Effect Network Meta-analysis of Lipid Modulation in Non-alcoholic Steatohepatitis for Dyslipidemia. J. Clin. Transl. Hepatol. 2022, 10, 1042–1049. [Google Scholar] [CrossRef] [PubMed]
- Xia, J.; Wang, Z.; Huan, Y.; Xue, W.; Wang, X.; Wang, Y.; Liu, Z.; Hsieh, J.-H.; Zhang, L.; Wu, S.; et al. Pose Filter-Based Ensemble Learning Enables Discovery of Orally Active, Nonsteroidal Farnesoid X Receptor Agonists. J. Chem. Inf. Model. 2020, 60, 1202–1214. [Google Scholar] [CrossRef]
- Maloney, P.R.; Parks, D.J.; Haffner, C.D.; Fivush, A.M.; Chandra, G.; Plunket, K.D.; Creech, K.L.; Moore, L.B.; Wilson, J.G.; Lewis, M.C.; et al. Identification of a chemical tool for the orphan nuclear receptor FXR. J. Med. Chem. 2000, 43, 2971–2974. [Google Scholar] [CrossRef] [PubMed]
- Abel, U.; Schlüter, T.; Schulz, A.; Hambruch, E.; Steeneck, C.; Hornberger, M.; Hoffmann, T.; Perović-Ottstadt, S.; Kinzel, O.; Burnet, M.; et al. Synthesis and pharmacological validation of a novel series of non-steroidal FXR agonists. Bioorg. Med. Chem. Lett. 2010, 20, 4911–4917. [Google Scholar] [CrossRef]
- Fiorucci, S.; Biagioli, M.; Sepe, V.; Zampella, A.; Distrutti, E. Bile acid modulators for the treatment of nonalcoholic steatohepatitis (NASH). Expert. Opin. Investig. Drugs 2020, 29, 623–632. [Google Scholar] [CrossRef] [PubMed]
- Gege, C.; Kinzel, O.; Steeneck, C.; Schulz, A.; Kremoser, C. Knocking on FXR’s door: The “hammerhead”-structure series of FXR agonists—Amphiphilic isoxazoles with potent in vitro and in vivo activities. Curr. Top. Med. Chem. 2014, 14, 2143–2158. [Google Scholar] [CrossRef] [PubMed]
- Kinzel, O.; Steeneck, C.; Schlüter, T.; Schulz, A.; Gege, C.; Hahn, U.; Hambruch, E.; Hornberger, M.; Spalwisz, A.; Frick, K.; et al. Novel substituted isoxazole FXR agonists with cyclopropyl, hydroxycyclobutyl and hydroxyazetidinyl linkers: Understanding and improving key determinants of pharmacological properties. Bioorg. Med. Chem. Lett. 2016, 26, 3746–3753. [Google Scholar] [CrossRef] [PubMed]
- Genin, M.J.; Bueno, A.B.; Agejas Francisco, J.; Manninen, P.R.; Bocchinfuso, W.P.; Montrose-Rafizadeh, C.; Cannady, E.A.; Jones, T.M.; Stille, J.R.; Raddad, E.; et al. Discovery of 6-(4-{[5-Cyclopropyl-3-(2,6-dichlorophenyl)isoxazol-4-yl]methoxy}piperidin-1-yl)-1-methyl-1H-indole-3-carboxylic Acid: A Novel FXR Agonist for the Treatment of Dyslipidemia. J. Med. Chem. 2015, 58, 9768–9772. [Google Scholar] [CrossRef] [PubMed]
- Sepe, V.; Marchianò, S.; Finamore, C.; Baronissi, G.; Di Leva, F.S.; Carino, A.; Biagioli, M.; Fiorucci, C.; Cassiano, C.; Monti, M.C.; et al. Novel Isoxazole Derivatives with Potent FXR Agonistic Activity Prevent Acetaminophen-Induced Liver Injury. ACS Med. Chem. Lett. 2019, 10, 407–412. [Google Scholar] [CrossRef] [PubMed]
- Fang, Y.; Hegazy, L.; Finck, B.N.; Elgendy, B. Recent Advances in the Medicinal Chemistry of Farnesoid X Receptor. J. Med. Chem. 2021, 64, 17545–17571. [Google Scholar] [CrossRef]
- Xie, H.; Chen, L.; Zhang, J.; Xie, X.; Qiu, K.; Fu, J. A Combined Pharmacophore Modeling, 3D QSAR and Virtual Screening Studies on Imidazopyridines as B-Raf Inhibitors. Int. J. Mol. Sci. 2015, 16, 12307–12323. [Google Scholar] [CrossRef]
- Żołnowska, B.; Sławiński, J.; Brzozowski, Z.; Kawiak, A.; Belka, M.; Zielińska, J.; Bączek, T.; Chojnacki, J. Synthesis, Molecular Structure, Anticancer Activity, and QSAR Study of N-(aryl/heteroaryl)-4-(1H-pyrrol-1-yl)Benzenesulfonamide Derivatives. Int. J. Mol. Sci. 2018, 19, 1482. [Google Scholar] [CrossRef]
- Guidotti, I.L.; Neis, A.; Martinez, D.P.; Seixas, F.K.; Machado, K.; Kremer, F.S. Bambu and its applications in the discovery of active molecules against melanoma. J. Mol. Graph. Model. 2023, 124, 108564. [Google Scholar] [CrossRef]
- Abdullahi, S.H.; Uzairu, A.; Shallangwa, G.A.; Uba, S.; Umar, A.B. Pharmacokinetic profiling of quinazoline-4(3H)-one analogs as EGFR inhibitors: 3D-QSAR modeling, molecular docking studies and the design of therapeutic agents. J. Taibah Univ. Med. Sci. 2023, 18, 1018–1029. [Google Scholar] [CrossRef]
- Liu, X.; Shi, D.; Zhou, S.; Liu, H.; Liu, H.; Yao, X. Molecular dynamics simulations and novel drug discovery. Expert. Opin. Drug Discov. 2018, 13, 23–37. [Google Scholar] [CrossRef]
- Panzitt, K.; Zollner, G.; Marschall, H.U.; Wagner, M. Recent advances on FXR-targeting therapeutics. Mol. Cell. Endocrinol. 2022, 552, 111678. [Google Scholar] [CrossRef] [PubMed]
- Trauner, M.; Gulamhusein, A.; Hameed, B.; Caldwell, S.; Shiffman, M.L.; Landis, C.; Eksteen, B.; Agarwal, K.; Muir, A.; Rushbrook, S.; et al. The Nonsteroidal Farnesoid X Receptor Agonist Cilofexor (GS-9674) Improves Markers of Cholestasis and Liver Injury in Patients With Primary Sclerosing Cholangitis. Hepatology 2019, 70, 788–801. [Google Scholar] [CrossRef] [PubMed]
- Akwabi-Ameyaw, A.; Bass, J.Y.; Caldwell, R.D.; Caravella, J.A.; Chen, L.; Creech, K.L.; Deaton, D.N.; Jones, S.A.; Kaldor, I.; Liu, Y.; et al. Conformationally constrained farnesoid X receptor (FXR) agonists: Naphthoic acid-based analogs of GW 4064. Bioorg. Med. Chem. Lett. 2008, 18, 4339–4343. [Google Scholar] [CrossRef] [PubMed]
- Tully, D.C.; Rucker, P.V.; Chianelli, D.; Williams, J.; Vidal, A.; Alper, P.B.; Mutnick, D.; Bursulaya, B.; Schmeits, J.; Wu, X.; et al. Discovery of Tropifexor (LJN452), a Highly Potent Non-bile Acid FXR Agonist for the Treatment of Cholestatic Liver Diseases and Nonalcoholic Steatohepatitis (NASH). J. Med. Chem. 2017, 60, 9960–9973. [Google Scholar] [CrossRef] [PubMed]
- Bass, J.Y.; Caravella, J.A.; Chen, L.; Creech, K.L.; Deaton, D.N.; Madauss, K.P.; Marr, H.B.; McFadyen, R.B.; Miller, A.B.; Mills, W.Y.; et al. Conformationally constrained farnesoid X receptor (FXR) agonists: Heteroaryl replacements of the naphthalene. Bioorg. Med. Chem. Lett. 2011, 21, 1206–1213. [Google Scholar] [CrossRef] [PubMed]
- Bhaskar, B.V.; Babu, T.M.C.; Rammohan, A.; Zheng, G.Y.; Zyryanov, G.V.; Gu, W. Structure-Based Virtual Screening of Pseudomonas aeruginosa LpxA Inhibitors Using Pharmacophore-Based Approach. Biomolecules 2020, 10, 266. [Google Scholar] [CrossRef] [PubMed]
- Meyners, C.; Krämer, A.; Yildiz, Ö.; Meyer-Almes, F.J. The thermodynamic signature of ligand binding to histone deacetylase-like amidohydrolases is most sensitive to the flexibility in the L2-loop lining the active site pocket. Biochim. Biophys. Acta Gen. Subj. 2017, 1861, 1855–1863. [Google Scholar] [CrossRef] [PubMed]
- Mehranfar, A.; Khavani, M.; Izadyar, M. A molecular dynamic study on the ability of phosphorene for designing new sensor for SARS-CoV-2 detection. J. Mol. Liq. 2022, 345, 117852. [Google Scholar] [CrossRef] [PubMed]
- Srivastava, R.; Gupta, S.K.; Naaz, F.; Sen Gupta, P.S.; Yadav, M.; Singh, V.K.; Panda, S.K.; Biswal, S.; Rana, M.K.; Gupta, S.K.; et al. Exploring antiviral potency of N-1 substituted pyrimidines against HIV-1 and other DNA/RNA viruses: Design, synthesis, characterization, ADMET analysis, docking, molecular dynamics and biological activity. Comput. Biol. Chem. 2023, 106, 107910. [Google Scholar] [CrossRef] [PubMed]
- Shrivastava, A.; Mathur, K.; Verma, R.K.; Jayadev Magani, S.K.; Vyas, D.K.; Singh, A. Molecular dynamics study of tropical calcific pancreatitis (TCP) associated calcium-sensing receptor single nucleotide variation. Front. Mol. Biosci. 2022, 9, 982831. [Google Scholar] [CrossRef] [PubMed]
- Kumari, A.; Mittal, L.; Srivastava, M.; Pathak, D.P.; Asthana, S. Conformational Characterization of the Co-Activator Binding Site Revealed the Mechanism to Achieve the Bioactive State of FXR. Front. Mol. Biosci. 2021, 8, 658312. [Google Scholar] [CrossRef]
- Zhang, D.; Liu, X.; Qi, Y.; Lin, Y.; Zhao, K.; Jin, Y.; Luo, J.; Xu, L.; Yu, D.; Li, C. Binding, activity and risk assessment of bisphenols toward farnesoid X receptor pathway: In vitro and in silico study. Sci. Total Environ. 2023, 869, 161701. [Google Scholar] [CrossRef]
- Elkwafi, G.; Mohamed, N.; Elabbar, F.; Alnajjar, R. Flavonoid content of the Libyan Onosma Cyrenaicum: Isolation, identification, electronic chemical reactivity, drug likeness, docking, and MD study. J. Biomol. Struct. Dyn. 2022, 40, 7351–7366. [Google Scholar] [CrossRef]
- Dong, Y.; Fu, L.; Song, J.; Zhang, S.; Li, X.; Fang, W.; Cui, Q.; Gao, L. Thermodynamic Driving Forces for Divalent Cations Binding to Zwitterionic Phospholipid Membranes. J. Phys. Chem. Lett. 2022, 13, 11237–11244. [Google Scholar] [CrossRef]
- Lee, K.; Nada, H.; Byun, H.J.; Lee, C.H.; Elkamhawy, A. Hit Identification of a Novel Quinazoline Sulfonamide as a Promising EphB3 Inhibitor: Design, Virtual Combinatorial Library, Synthesis, Biological Evaluation, and Docking Simulation Studies. Pharmaceuticals 2021, 14, 1247. [Google Scholar] [CrossRef] [PubMed]
- Zhang, Y.; Huang, M.; Su, J.; Hu, H.; Yang, M.; Huang, Z.; Chen, D.; Wu, J.; Feng, Z. Overcoming biomass recalcitrance by synergistic pretreatment of mechanical activation and metal salt for enhancing enzymatic conversion of lignocellulose. Biotechnol. Biofuels 2019, 12, 12. [Google Scholar] [CrossRef] [PubMed]
- Shafiee, Z.; Karami, L.; Akbari, M.; Rezaee, E.; Maaza, M.; Tabatabai, S.A.; Karimi, G. Insights into the molecular mechanism of triazolopyrimidinone derivatives effects on the modulation of α(1)β(2)γ(2) subtype of GABA(A) receptor: An in silico approach. Arch. Biochem. Biophys. 2022, 729, 109380. [Google Scholar] [CrossRef]
- Akash, S.; Bayıl, I.; Rahman, M.A.; Mukerjee, N.; Maitra, S.; Islam, M.R.; Rajkhowa, S.; Ghosh, A.; Al-Hussain, S.A.; Zaki, M.E.A.; et al. Target specific inhibition of West Nile virus envelope glycoprotein and methyltransferase using phytocompounds: An in silico strategy leveraging molecular docking and dynamics simulation. Front. Microbiol. 2023, 14, 1189786. [Google Scholar] [CrossRef] [PubMed]
- Kumari, G.; Nigam, V.K.; Pandey, D.M. Mutational analysis of flavonol synthase of M. pinnata towards enhancement of binding affinity: A computational approach. J. Biomol. Struct. Dyn. 2023, 1–14. [Google Scholar] [CrossRef]
- Ma, C.; Liu, W.-G.; Liu, W.-D.; Xi, C.-C.; Xiong, F.; Zhang, S.-P. Molecular Docking and 3D-QSAR Studies on a Series of Benzenesulfonamide Derivatives as a Hepatitis B Virus Capsid Assembly Inhibitor. Polycycl. Aromat. Compd. 2021, 42, 3622–3637. [Google Scholar] [CrossRef]
- Ren, R.; Gao, L.; Li, G.; Wang, S.; Zhao, Y.; Wang, H.; Liu, J. 2D, 3D-QSAR study and docking of vascular endothelial growth factor receptor 3 (VEGFR3) inhibitors for potential treatment of retinoblastoma. Front. Pharmacol. 2023, 14, 1177282. [Google Scholar] [CrossRef] [PubMed]
- Ershov, P.V.; Veselovsky, A.V.; Mezentsev, Y.V.; Yablokov, E.O.; Kaluzhskiy, L.A.; Tumilovich, A.M.; Kavaleuski, A.A.; Gilep, A.A.; Moskovkina, T.V.; Medvedev, A.E.; et al. Mechanism of the Affinity-Enhancing Effect of Isatin on Human Ferrochelatase and Adrenodoxin Reductase Complex Formation: Implication for Protein Interactome Regulation. Int. J. Mol. Sci. 2020, 21, 7605. [Google Scholar] [CrossRef]
- Thillainayagam, M.; Malathi, K.; Anbarasu, A.; Singh, H.; Bahadur, R.; Ramaiah, S. Insights on inhibition of Plasmodium falciparum plasmepsin I by novel epoxyazadiradione derivatives—Molecular docking and comparative molecular field analysis. J. Biomol. Struct. Dyn. 2019, 37, 3168–3182. [Google Scholar] [CrossRef] [PubMed]
- Zhang, Y.; Chen, L.; Wang, Z.; Zhu, Y.; Jiang, H.; Xu, J.; Xiong, F. Design of novel DABO derivatives as HIV-1 RT inhibitors using molecular docking, molecular dynamics simulations and ADMET properties. J. Biomol. Struct. Dyn. 2023, 1–18, Online ahead of print. [Google Scholar] [CrossRef]
- Zięba, A.; Żuk, J.; Bartuzi, D.; Matosiuk, D.; Poso, A.; Kaczor, A.A. The Universal 3D QSAR Model for Dopamine D(2) Receptor Antagonists. Int. J. Mol. Sci. 2019, 20, 4555. [Google Scholar] [CrossRef]
- Medeiros, A.R.; Ferreira, L.L.G.; de Souza, M.L.; de Oliveira Rezende Junior, C.; Espinoza-Chávez, R.M.; Dias, L.C.; Andricopulo, A.D. Chemoinformatics Studies on a Series of Imidazoles as Cruzain Inhibitors. Biomolecules 2021, 11, 579. [Google Scholar] [CrossRef]
- Liu, G.; Wang, W.; Wan, Y.; Ju, X.; Gu, S. Application of 3D-QSAR, Pharmacophore, and Molecular Docking in the Molecular Design of Diarylpyrimidine Derivatives as HIV-1 Nonnucleoside Reverse Transcriptase Inhibitors. Int. J. Mol. Sci. 2018, 19, 1436. [Google Scholar] [CrossRef] [PubMed]
- Hou, Q.L.; Luo, J.X.; Zhang, B.C.; Jiang, G.F.; Ding, W.; Zhang, Y.Q. 3D-QSAR and Molecular Docking Studies on the TcPMCA1-Mediated Detoxification of Scopoletin and Coumarin Derivatives. Int. J. Mol. Sci. 2017, 18, 1380. [Google Scholar] [CrossRef]
- Gao, J.; Li, X.; Fu, R.; Li, Y. Mechanism analysis and improved molecular modification: Design of high efficiency and environmentally friendly triazole fungicide substitutes. Chemosphere 2023, 336, 139150. [Google Scholar] [CrossRef]
- Abdizadeh, R.; Hadizadeh, F.; Abdizadeh, T. Molecular Modeling Studies of Anti-Alzheimer Agents by QSAR, Molecular Docking and Molecular Dynamics Simulations Techniques. Med. Chem. 2020, 16, 903–927. [Google Scholar] [CrossRef]
- Clark, M.; Cramer, R.D.; Van Opdenbosch, N. Validation of the general purpose tripos 5.2 force field. J. Comput. Chem. 1989, 10, 982–1012. [Google Scholar] [CrossRef]
- Roy, K. On some aspects of validation of predictive quantitative structure-activity relationship models. Expert. Opin. Drug Discov. 2007, 2, 1567–1577. [Google Scholar] [CrossRef] [PubMed]
- Wang, Y.; Guo, Y.; Qiang, S.; Jin, R.; Li, Z.; Tang, Y.; Leung, E.L.H.; Guo, H.; Yao, X. 3D-QSAR, Molecular Docking, and MD Simulations of Anthraquinone Derivatives as PGAM1 Inhibitors. Front. Pharmacol. 2021, 12, 764351. [Google Scholar] [CrossRef] [PubMed]
- Yao, K.; Liu, P.; Liu, H.; Wei, Q.; Yang, J.; Cao, P.; Lai, Y. 3D-QSAR, molecular docking and molecular dynamics simulations study of 3-pyrimidin-4-yl-oxazolidin-2-one derivatives to explore the structure requirements of mutant IDH1 inhibitors. J. Mol. Struct. 2019, 1189, 187–202. [Google Scholar] [CrossRef]
- Oprea, T.I.; Waller, C.L.; Marshall, G.R. Three-dimensional quantitative structure-activity relationship of human immunodeficiency virus (I) protease inhibitors. 2. Predictive power using limited exploration of alternate binding modes. J. Med. Chem. 1994, 37, 2206–2215. [Google Scholar] [CrossRef]
- Gajjar, K.A.; Gajjar, A.K. CoMFA, CoMSIA and HQSAR Analysis of 3-aryl-3-ethoxypropanoic Acid Derivatives as GPR40 Modulators. Curr. Drug Discov. Technol. 2020, 17, 100–118. [Google Scholar] [CrossRef]
- Merk, D.; Sreeramulu, S.; Kudlinzki, D.; Saxena, K.; Linhard, V.; Gande, S.L.; Hiller, F.; Lamers, C.; Nilsson, E.; Aagaard, A.; et al. Molecular tuning of farnesoid X receptor partial agonism. Nat. Commun. 2019, 10, 2915. [Google Scholar] [CrossRef]
- Ma, Y.; Liu, Y.; Teng, L.; Luo, E.; Liu, D.; Zhou, F.; Wang, K.; Chen, W.; Bi, L. Zi Shen Decoction Inhibits Growth and Metastasis of Lung Cancer via Regulating the AKT/GSK-3β/β-Catenin Pathway. Oxidative Med. Cell. Longev. 2021, 2021, 6685282. [Google Scholar] [CrossRef]
- Li, W.; Fu, J.; Cheng, F.; Zheng, M.; Zhang, J.; Liu, G.; Tang, Y. Unbinding pathways of GW4064 from human farnesoid X receptor as revealed by molecular dynamics simulations. J. Chem. Inf. Model. 2012, 52, 3043–3052. [Google Scholar] [CrossRef]
- Wang, J.; Wolf, R.M.; Caldwell, J.W.; Kollman, P.A.; Case, D.A. Development and testing of a general amber force field. J. Comput. Chem. 2004, 25, 1157–1174. [Google Scholar] [CrossRef] [PubMed]
- Liu, L.; Jiao, Y.; Yang, M.; Wu, L.; Long, G.; Hu, W. Network Pharmacology, Molecular Docking and Molecular Dynamics to Explore the Potential Immunomodulatory Mechanisms of Deer Antler. Int. J. Mol. Sci. 2023, 24, 10370. [Google Scholar] [CrossRef]
- Essmann, U.; Perera, L.; Berkowitz, M.L.; Darden, T.; Lee, H.; Pedersen, L.G. A smooth particle mesh Ewald method. J. Chem. Phys. 1995, 103, 8577–8593. [Google Scholar] [CrossRef]
- Berendsen, J.-P.R.G.C.H.J.C. Numerical integration of the cartesian equations of motion of a system with constraints: Molecular dynamics of n-alkanes. J. Comput. Phys. 1977, 23, 327–341. [Google Scholar]
- Farid, N.; Bux, K.; Ali, K.; Bashir, A.; Tahir, R. Repurposing Amphotericin B: Anti-microbial, molecular docking and molecular dynamics simulation studies suggest inhibition potential of Amphotericin B against MRSA. BMC Chem. 2023, 17, 67. [Google Scholar] [CrossRef]
- Liu, S.; Zhang, S.; Sun, Y.; Zhou, W. Transcriptomics Changes in the Peritoneum of Mice with Lipopolysaccharide-Induced Peritonitis. Int. J. Mol. Sci. 2021, 22, 13008. [Google Scholar] [CrossRef] [PubMed]
- Chen, J.; Wang, X.; Pang, L.; Zhang, J.Z.H.; Zhu, T. Effect of mutations on binding of ligands to guanine riboswitch probed by free energy perturbation and molecular dynamics simulations. Nucleic Acids Res. 2019, 47, 6618–6631. [Google Scholar] [CrossRef] [PubMed]
- Enayatkhani, M.; Hasaniazad, M.; Faezi, S.; Gouklani, H.; Davoodian, P.; Ahmadi, N.; Einakian, M.A.; Karmostaji, A.; Ahmadi, K. Reverse vaccinology approach to design a novel multi-epitope vaccine candidate against COVID-19: An in silico study. J. Biomol. Struct. Dyn. 2021, 39, 2857–2872. [Google Scholar] [CrossRef]
- Ahmad, S.; Waheed, Y.; Ismail, S.; Abbasi, S.W.; Najmi, M.H. A computational study to disclose potential drugs and vaccine ensemble for COVID-19 conundrum. J. Mol. Liq. 2021, 324, 114734. [Google Scholar] [CrossRef] [PubMed]
- Guo, Y.; Jin, Y.; Wang, B.; Liu, B. Molecular Mechanism of Small-Molecule Inhibitors in Blocking the PD-1/PD-L1 Pathway through PD-L1 Dimerization. Int. J. Mol. Sci. 2021, 22, 4766. [Google Scholar] [CrossRef] [PubMed]
- Guo, Y.; Liang, J.; Liu, B.; Jin, Y. Molecular Mechanism of Food-Derived Polyphenols on PD-L1 Dimerization: A Molecular Dynamics Simulation Study. Int. J. Mol. Sci. 2021, 22, 10924. [Google Scholar] [CrossRef] [PubMed]
- Prajapat, M.; Singh, H.; Chaudhary, G.; Sarma, P.; Kaur, G.; Prakash Patel, A.; Medhi, B. A Novel Inhibitor of DKK1/LRP6 Interactions Against the Alzheimer Disease: An Insilco Approach. Bioinform. Biol. Insights 2023, 17, 11779322231183762. [Google Scholar] [CrossRef] [PubMed]
- Sun, Y.; Xia, Z.; Zhao, Q.; Zheng, B.; Zhang, M.; Ying, Y. Insights Into the Resistance Mechanisms of Inhibitors to FLT3 F691L Mutation via an Integrated Computational Approach. Front. Pharmacol. 2019, 10, 1050. [Google Scholar] [CrossRef] [PubMed]
- Yu, H.; Dalby, P.A. A beginner’s guide to molecular dynamics simulations and the identification of cross-correlation networks for enzyme engineering. Methods Enzym. 2020, 643, 15–49. [Google Scholar]
- Pronk, S.; Páll, S.; Schulz, R.; Larsson, P.; Bjelkmar, P.; Apostolov, R.; Shirts, M.R.; Smith, J.C.; Kasson, P.M.; van der Spoel, D.; et al. GROMACS 4.5: A high-throughput and highly parallel open source molecular simulation toolkit. Bioinformatics 2013, 29, 845–854. [Google Scholar] [CrossRef]


| PLS Statistics | CoMFA | CoMSIA |
|---|---|---|
| q2 a | 0.664 | 0.706 |
| r2 b | 0.960 | 0.969 |
| SEEcv c | 0.442 | 0.413 |
| SEEncv d | 0.152 | 0.134 |
| SEEpred e | 0.261 | 0.266 |
| F f | 581.48 | 760.15 |
| N g | 8 | 8 |
| r2pred h | 0.872 | 0.866 |
| Steric i | 0.421 | 0.103 |
| Electrostatic i | 0.579 | 0.234 |
| Hydrogen bond acceptor i | - | 0.211 |
| Hydrogen bond donor i | - | 0.303 |
| Hydrophobic i | - | 0.150 |
| No. | Clinical Medicine | CoMFA Pred. | CoMSIA Pred. |
|---|---|---|---|
| 1 | cilofexor | 8.748 | 8.427 |
| 2 | LY2562175 | 7.855 | 7.814 |
| 3 | PX20606 | 7.365 | 6.964 |
| 4 | GW4064 | 7.149 | 6.823 |
| No. | Clinical Medicine | LibDockScore |
|---|---|---|
| 1 | cilofexor | 139.386 |
| 2 | LY2562175 | 141.065 |
| 3 | PX20606 | 136.612 |
| 4 | GW4064 | 137.190 |
| Terms (kcal/mol) | FXR-GW4064 System | FXR-cilofexor System | FXR-LY2562175 System | FXR-PX20606 System |
|---|---|---|---|---|
| ∆Eele a | −3.2 ± 0.98 | −13.25 ± 3.50 | −8.39 ± 3.52 | −3.78 ± 1.33 |
| ∆Evdw b | −64.69 ± 4.35 | −78.87 ± 0.56 | −71.11 ± 2.80 | −65.24 ± 3.92 |
| ∆Egas c | −67.89 ± 4.13 | −92.11 ± 3.13 | −79.51 ± 5.68 | −69.02 ± 4.59 |
| ∆GPB d | 34.21 ± 2.00 | 44.91 ± 4.31 | 40.75 ± 4.15 | 33.71 ± 2.38 |
| ∆GSA e | −8.02 ± 0.18 | −8.32 ± 0.02 | −8.53 ± 0.21 | −7.85 ± 0.47 |
| ∆Gsol f | 26.19 ± 1.83 | 36.59 ± 4.30 | 32.22 ± 3.96 | 25.87 ± 1.92 |
| ∆Gbind g | −36.71 ± 2.55 | −49.83 ± 3.30 | −43.46 ± 2.48 | −39.24 ± 4.40 |
| Time | Protein–Ligand Interaction | Hydrophobic Interaction | Hydrogen Bond | Salt Bridge |
|---|---|---|---|---|
| 95 ns | FXR-GW4064 | TYR260, GLN263, ILE269, MET290, ASN293, HIS294, VAL297, ARG331 | ARG331, SER332 | - |
| FXR-cilofexor | PHE284, LEU287, THR288, ALA291, VAL297, ARG331, ILE335, ILE352, TRP454 | SER332 | ARG331 | |
| FXR-LY2562175 | GLN263, LEU287, ASN293, ARG331, ILE335 | - | HIS447 | |
| FXR-PX20606 | GLN263, MET265, LEU287, MET290, ASN293, ARG331, ILE335, PHE336 | ARG331 | HIS447 | |
| 100 ns | FXR-GW4064 | TYR260, GLN263, ILE269, THR270, ASN293, HIS294, VAL297 | TYR260, SER332 | - |
| FXR-cilofexor | PHE284, LEU287, MET290, ARG331, LEU451, TRP454 | SER332, HIS447 | ARG331 | |
| FXR-LY2562175 | GLN263, ALA291, HIS294, VAL297, ARG331, LEU348 | - | HIS447 | |
| FXR-PX20606 | TYR260, GLN263, LEU287, ASN293, HIS294, ILE335, PHE336 | ARG331 | HIS447 |
 | |||||
|---|---|---|---|---|---|
| Compound No. | R1 | R2 | R3 | CoMFA Pred. | CoMSIA Pred. |
| 246 |  |  |  | 12.45 | 11.312 |
| 247 |  |  |  | 11.055 | 10.025 |
| 248 |  |  |  | 10.719 | 9.703 |
| 249 |  |  | 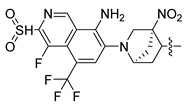 | 10.457 | 9.833 |
| 250 |  |  | 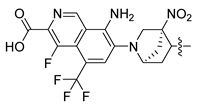 | 10.138 | 9.78 |
| 251 |  |  |  | 12.822 | 12.091 |
| 252 |  |  |  | 11.361 | 10.08 |
| 253 |  |  | 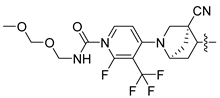 | 11.326 | 10.045 |
Disclaimer/Publisher’s Note: The statements, opinions and data contained in all publications are solely those of the individual author(s) and contributor(s) and not of MDPI and/or the editor(s). MDPI and/or the editor(s) disclaim responsibility for any injury to people or property resulting from any ideas, methods, instructions or products referred to in the content. |
© 2024 by the authors. Licensee MDPI, Basel, Switzerland. This article is an open access article distributed under the terms and conditions of the Creative Commons Attribution (CC BY) license (https://creativecommons.org/licenses/by/4.0/).
Share and Cite
Yan, D.; Yang, Y.; Shen, H.; Liu, Z.; Yao, K.; Liu, Q. 3D-QSAR and Molecular Dynamics Study of Isoxazole Derivatives to Identify the Structural Requirements for Farnesoid X Receptor (FXR) Agonists. Molecules 2024, 29, 1210. https://doi.org/10.3390/molecules29061210
Yan D, Yang Y, Shen H, Liu Z, Yao K, Liu Q. 3D-QSAR and Molecular Dynamics Study of Isoxazole Derivatives to Identify the Structural Requirements for Farnesoid X Receptor (FXR) Agonists. Molecules. 2024; 29(6):1210. https://doi.org/10.3390/molecules29061210
Chicago/Turabian StyleYan, Dan, Yueying Yang, Hanxiao Shen, Zhen Liu, Kun Yao, and Qing Liu. 2024. "3D-QSAR and Molecular Dynamics Study of Isoxazole Derivatives to Identify the Structural Requirements for Farnesoid X Receptor (FXR) Agonists" Molecules 29, no. 6: 1210. https://doi.org/10.3390/molecules29061210
APA StyleYan, D., Yang, Y., Shen, H., Liu, Z., Yao, K., & Liu, Q. (2024). 3D-QSAR and Molecular Dynamics Study of Isoxazole Derivatives to Identify the Structural Requirements for Farnesoid X Receptor (FXR) Agonists. Molecules, 29(6), 1210. https://doi.org/10.3390/molecules29061210