Communication

The Monitoring and Cell Imaging of Fe3+ Using a Chromone-Based Fluorescence Probe

1
College of Chemistry and Chemical Engineering, Jinzhong University, Jinzhong 030619, China
2
Department of Materials Science and Engineering, Jinzhong University, Jinzhong 030619, China
*
Authors to whom correspondence should be addressed.
Molecules 2024, 29(7), 1504; https://doi.org/10.3390/molecules29071504
Submission received: 25 January 2024 / Revised: 23 March 2024 / Accepted: 25 March 2024 / Published: 28 March 2024

Abstract

:
A new structurally simple fluorescent CP probe based on chromone was designed and synthesized, and its structure was fully characterized using various analytical techniques. The CP probe displays a high selectivity and sensitivity for sensing Fe3+ with a “turn-off” fluorescence response over other metal ions in a DMSO/H2O (4:1, v/v) solution. The experiment results show that the CP probe is stable over a wide pH range of 2.0–12.0. The detection limit for Fe3+ was calculated to be 0.044 μmol•L−1. The molar ratio method indicated that the binding mode between the CP probe and Fe3+ is a 1:1 complex formation. HR-MS and density functional theory (DFT) calculations were also performed to further confirm the recognition mechanism. Both fluorescence imaging experiments and the MTT assay demonstrated that the CP probe was suitable for detecting intracellular Fe3+ and no significant cytotoxicity in living cells.

Graphical Abstract

1. Introduction

Iron, as one of the essential microelements [1], is widespread in living organisms and plays crucial roles in a variety of fundamental biochemical processes, like oxygen metabolism, electron transfer, and enzyme catalysis [2,3,4]. In the human body, most irons are mainly stored in Fe3+ form [5]. When the Fe3+ content is within the proper level range, the body can function normally. Either the deficiency or the excess of Fe3+ could induce diseases such as hemochromatosis, heart failure, diabetes, and liver fibrosis [6,7,8,9]. Thus, it is very important to design a good method for the determination of Fe3+.
Compared with traditional detection methods, such as spectrophotometry, mass spectrometry, and atomic absorption spectroscopy [10,11,12], a method based on a fluorescent probe has attracted increasing interest due to its simple operation, high selectivity, and fast response. Currently, various fluorescent probes based on different fluorophores, such as naphthalimide, quinazolinone, rhodamine, and BODIPY, have been developed for the detection of Fe3+ [13,14,15,16,17,18]. Nevertheless, most of them were easily disrupted by other transition metal ions (e.g., Cu2+, Al3+, etc.), resulting in poor selectivity [19,20,21]. Therefore, it is still necessary to develop highly sensitive and selective Fe3+ fluorescent probes. Due to their excellent spectroscopic properties, many chromone-based derivatives have also been used as fluorescent probes. For example, Bai et al. proposed a fluorescent probe based on a chromone–dendron Schiff base to detect Mg2+ and Zn2+ [22]. Li et al. reported a chromone-derived probe for the monitoring of Al3+ based on a photoinduced electron-transfer mechanism [23]. A Cu2+ chromone derivative was also developed by Liu et al. by means of fluorescence quenching [24]. However, few chromone-based fluorescent probes were reported for the detection of Fe3+. Herein, we designed and synthesized a Schiff base fluorescent CP probe based on chromone with simple structure. The CP probe can be successfully applied to detect Fe3+ with high sensitivity and good selectivity. Meanwhile, fluorescence microscopy experiments demonstrated that the CP probe can also be used to monitor Fe3+ in living cells.

2. Results and Discussion

The general procedure for the synthesis of the CP probe is shown in Scheme 1. Intermediate compound 1 was prepared according to the reported method [25]. The CP probe was fully characterized by 1H NMR, 13C NMR, IR, and HR-MS.

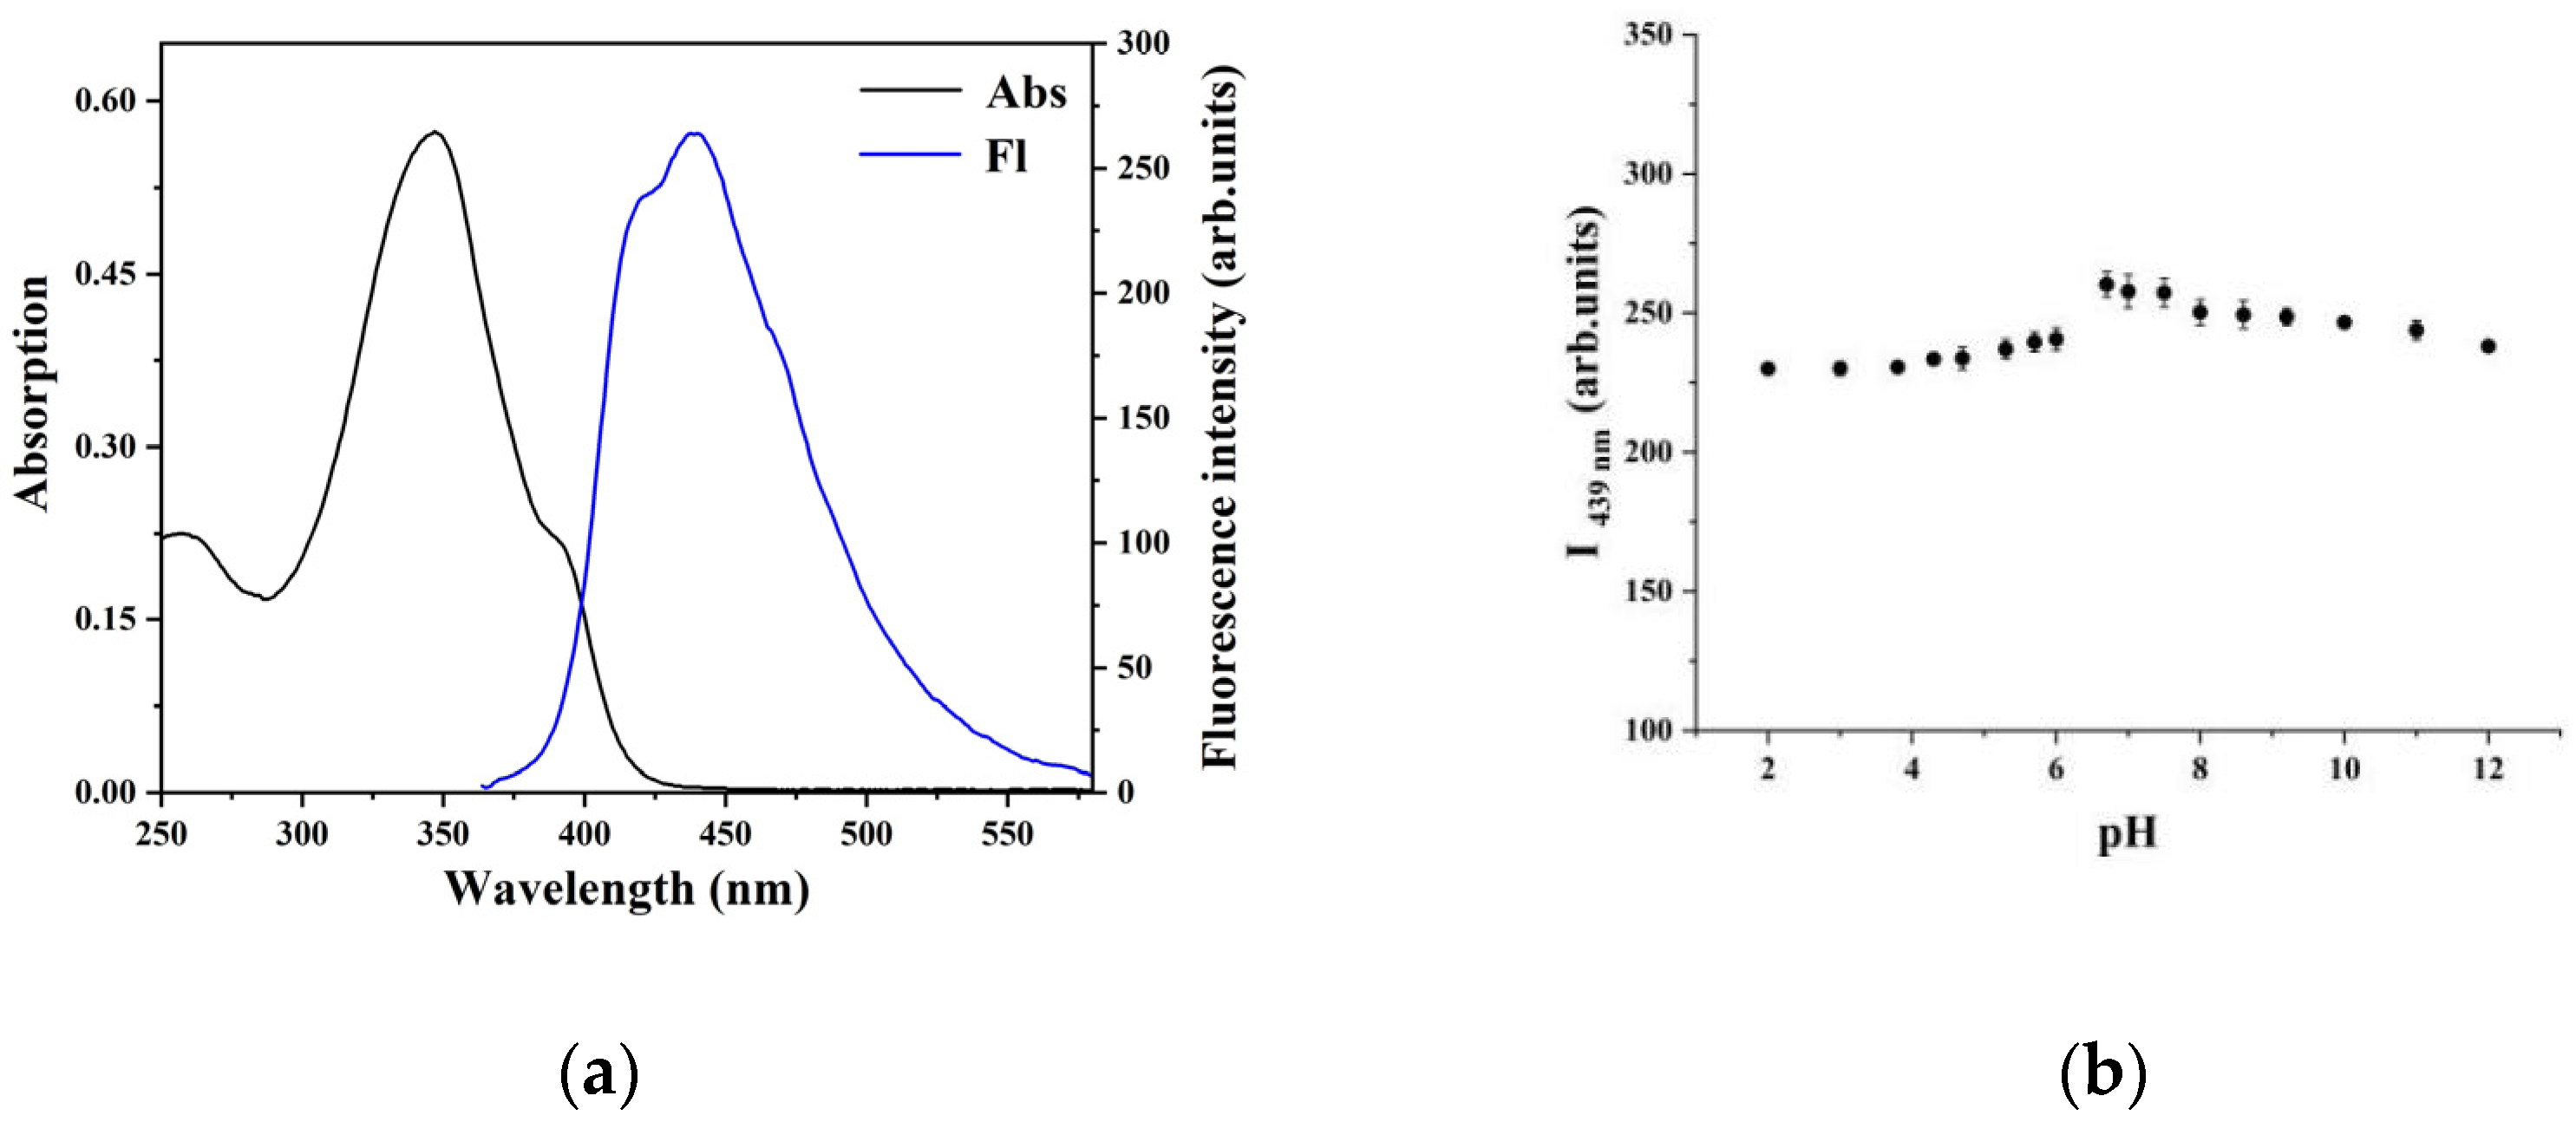
2.1. Characterization of the CP Probe

The UV/visible absorption and emission spectra of the CP probe in DMSO/H2O mixed solvent is investigated, as shown in Figure 1a. The absorption maximum of CP probe is centered at approximately 345 nm due to molecular skeleton group π→π* transition. Exciting at 345 nm in the CP probe provides an emission band at 439 nm. Meanwhile, we also studied the effect of pH on the fluorescence of the CP probe (Figure 1b). In the pH range of 2.0–12.0, there was no significant change in fluorescence intensity, which demonstrated that it is insusceptible to the change of acid–base solution.

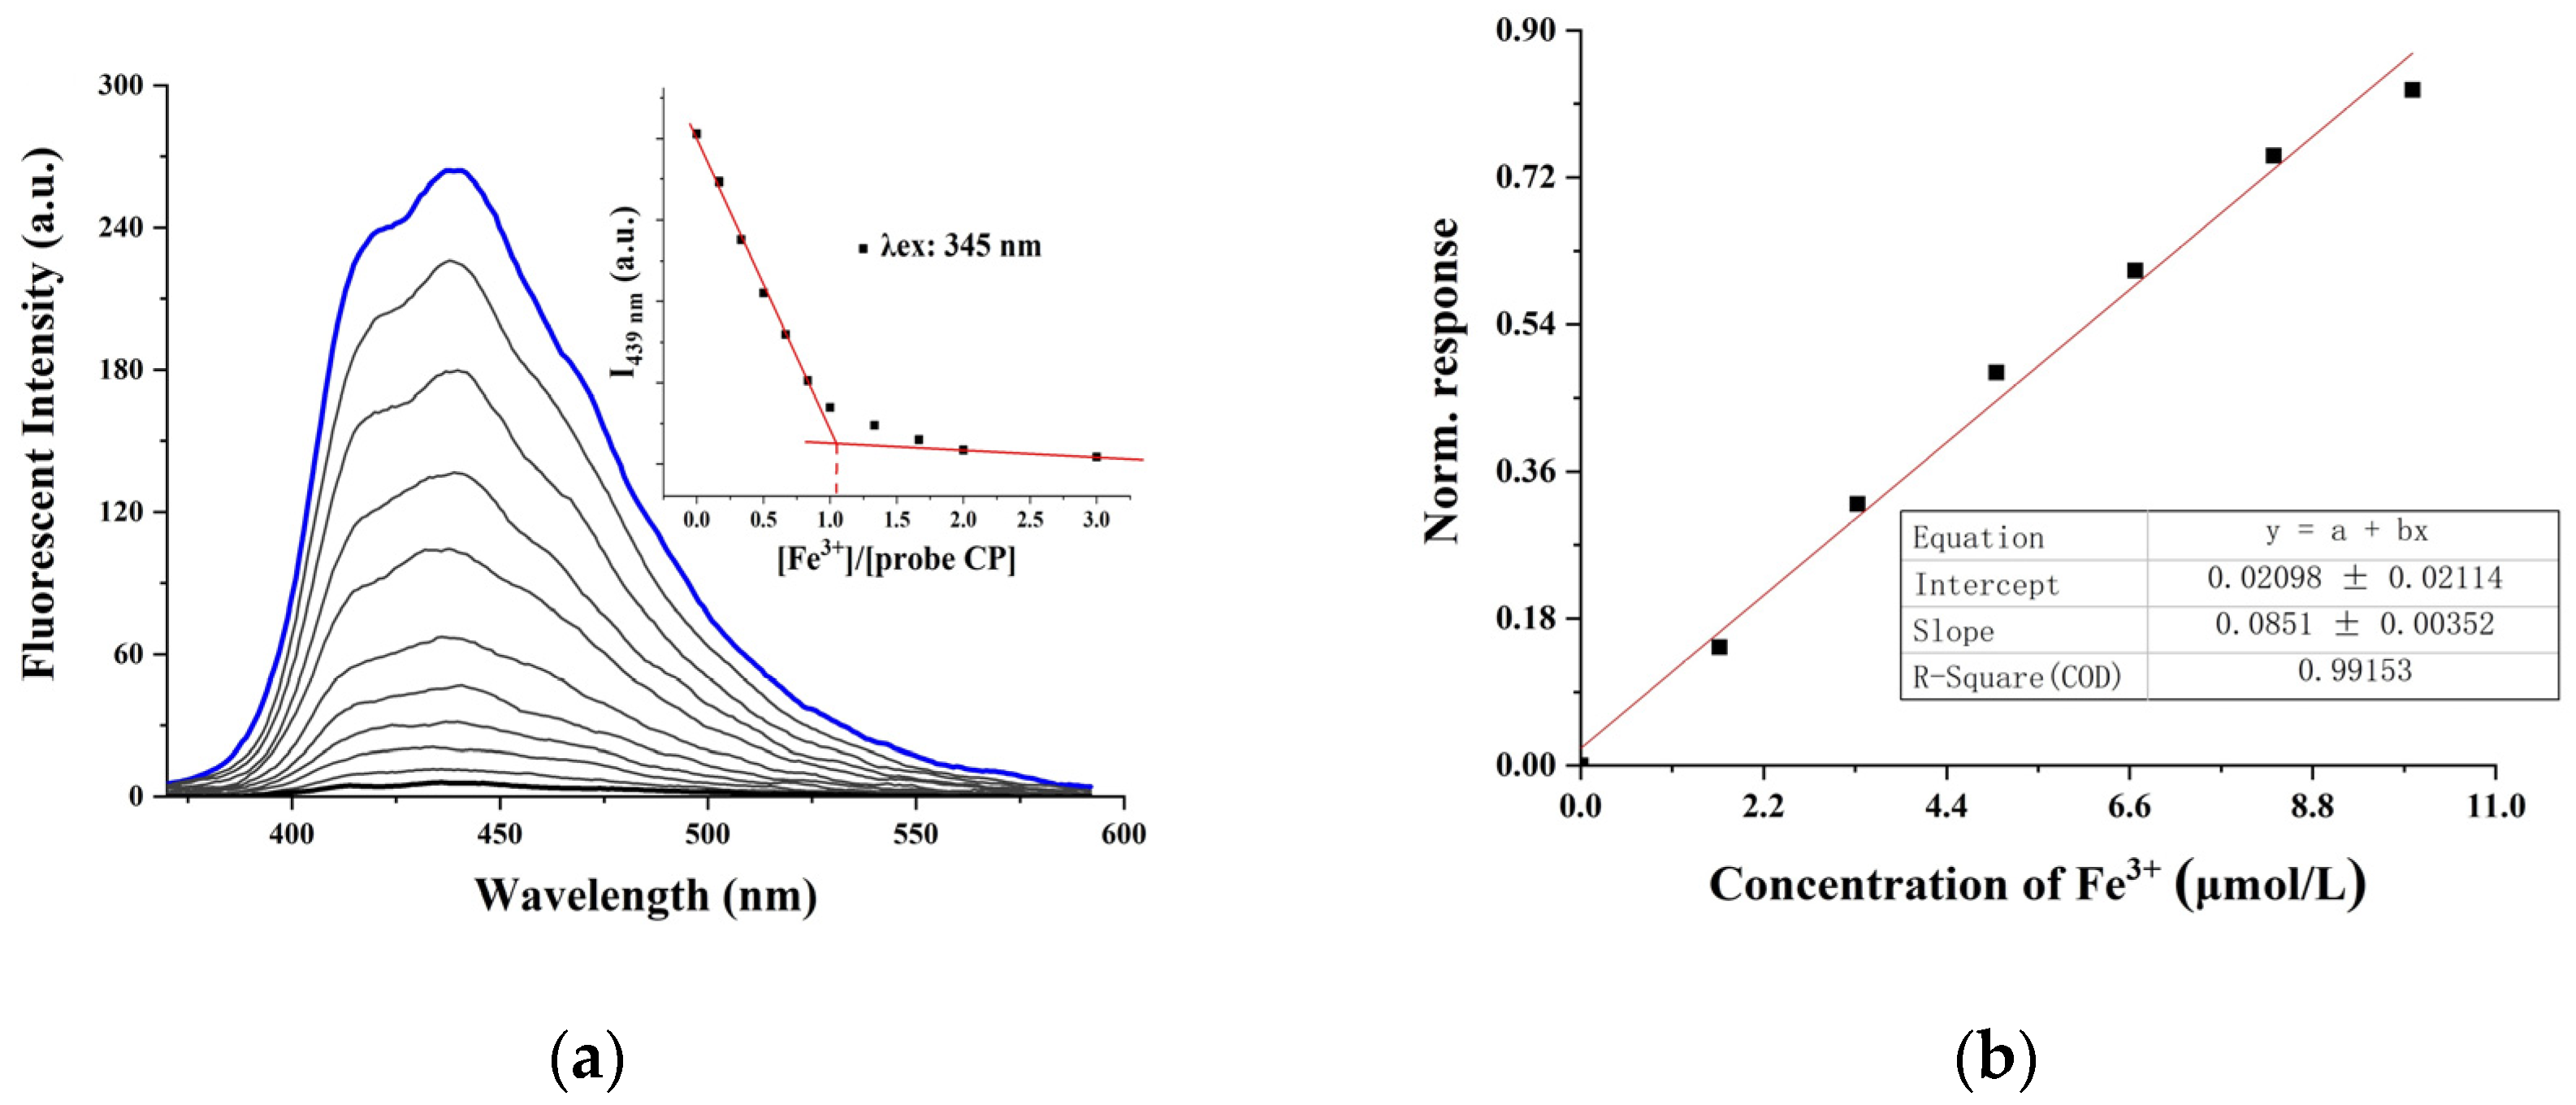
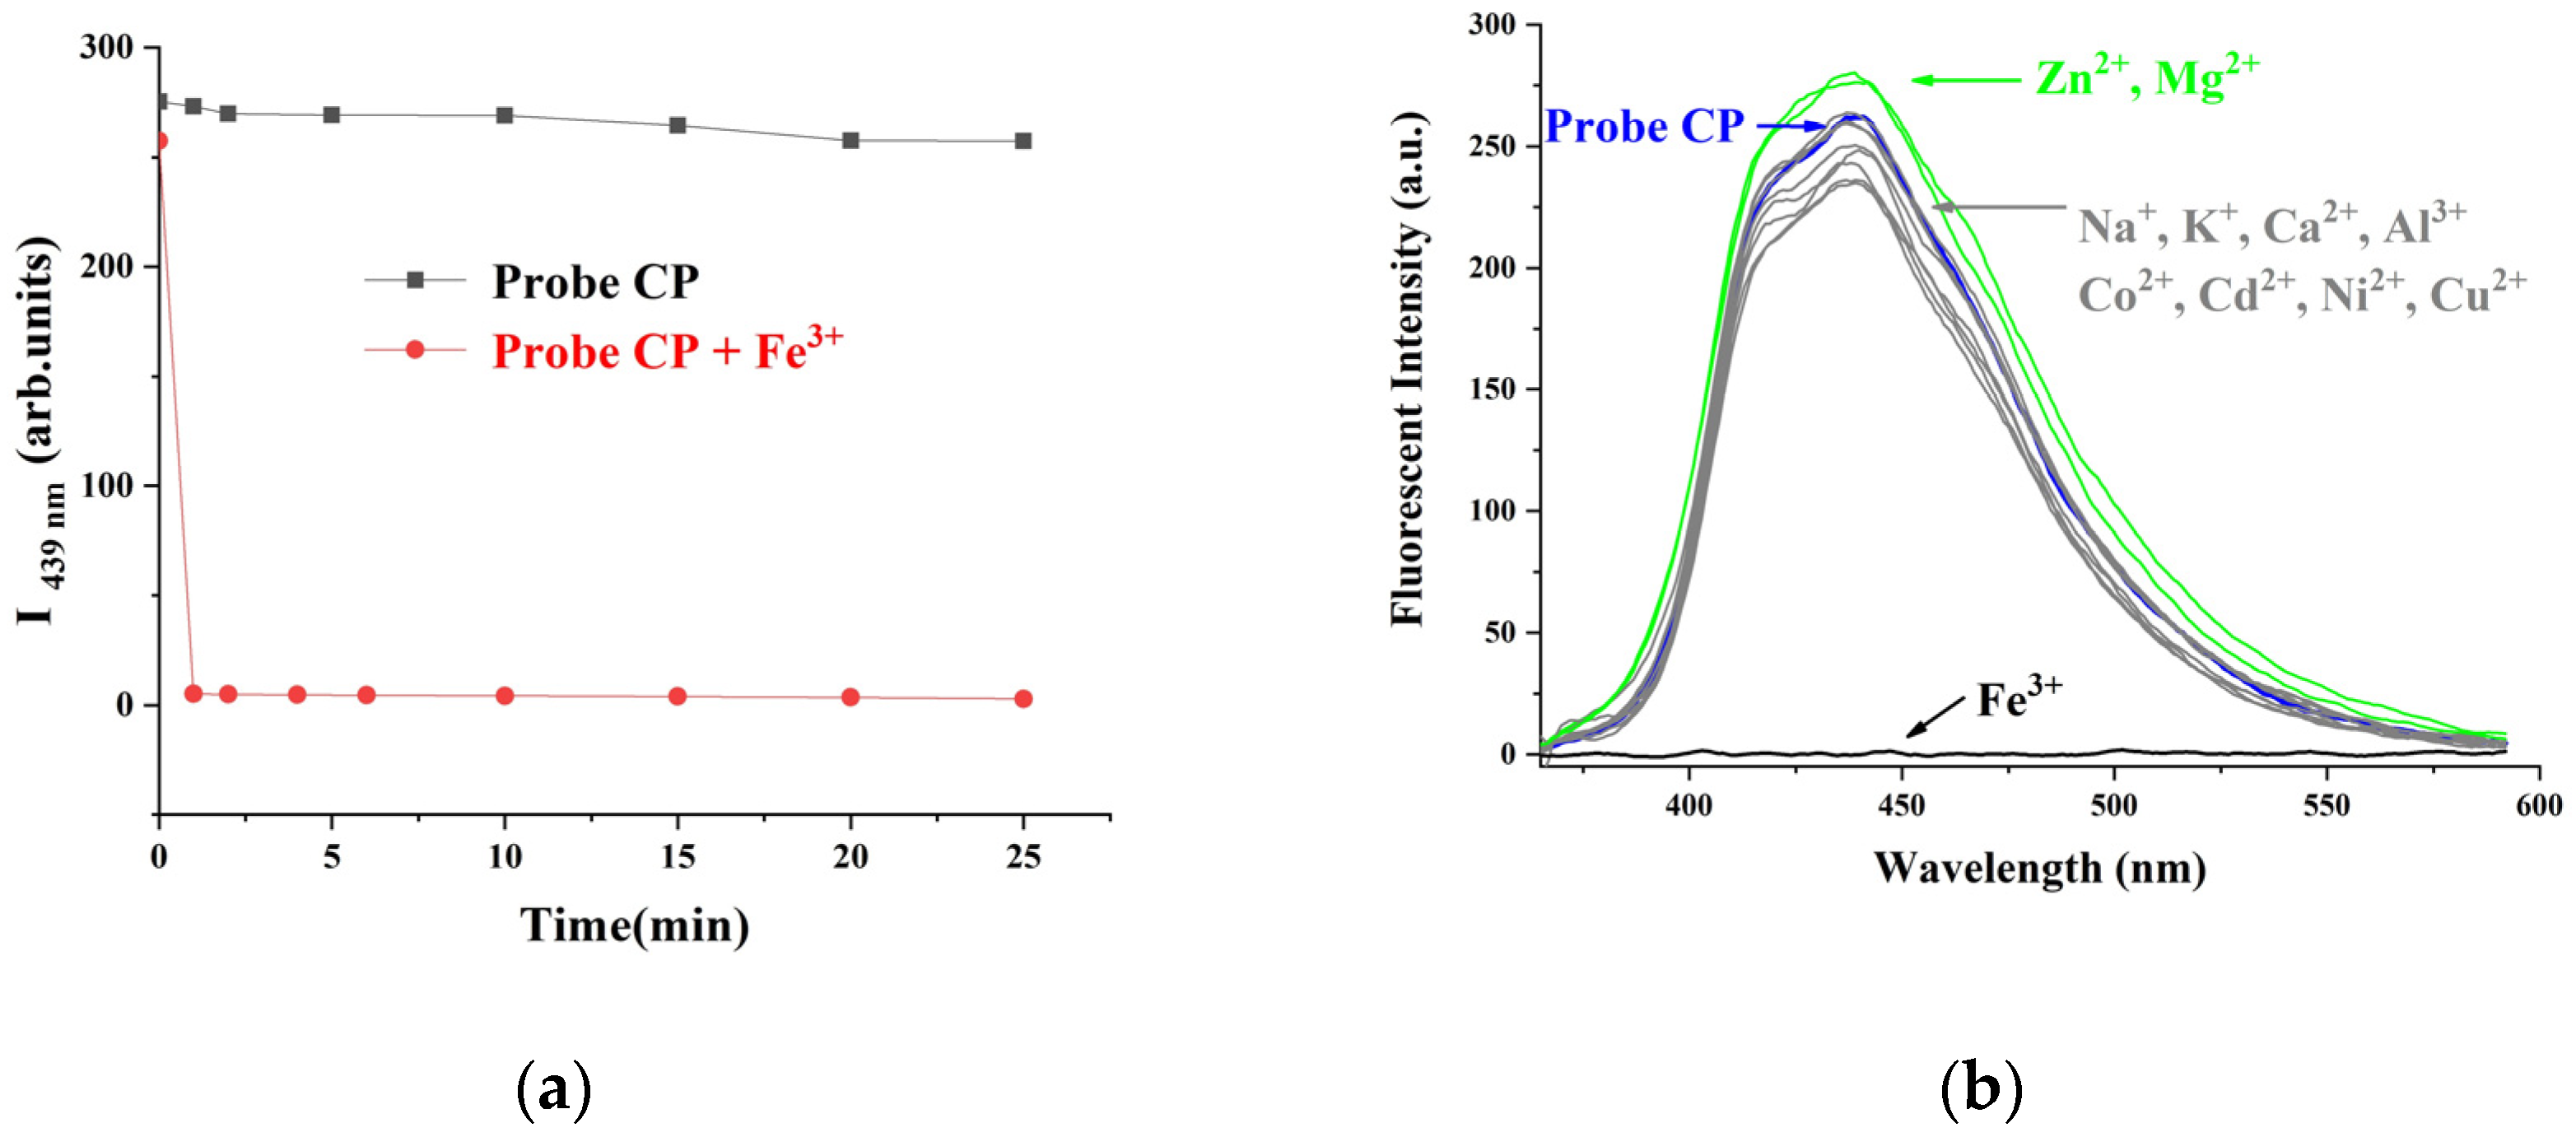
2.2. Fluorescence Detection and Selectivity of the CP Probe with Fe3+

Next, we conducted spectrophotometric titration experiments to investigate the response of the CP probe on Fe3+ ions in a DMSO/H2O mixed solvent, and the results are shown in Figure 2. The emission properties of the CP probe were explored using the gradual addition of Fe3+ (0 to 3 equiv.) by exciting the solution at 345 nm. As shown in Figure 2a, upon the gradual addition of Fe3+ to the CP solution, a decrease in fluorescence intensity at 439 nm can be observed with a virtually unchanged peak position; the intensity linearly decreased and remained unchanged after one equivalent addition of Fe3+. A plot of the intensity of the CP probe at 439 nm versus [Fe3+] initially showed linear behavior and then remained constant, which prompted us to propose a 1:1 binding between the CP probe and Fe3+ (Figure 2a Inset). The fluorescence response of CP toward Fe3+ is normalized as R = 1 − Ii/Imax [26], where Imax is the fluorescence response of CP without Fe3+, Ii is the luminescent intensity of CP with Fe3+. The lowest detection limit was 0.044 μmol•L−1. A good linear relationship between the fluorescence response and concentration of Fe3+ was given with a 0.9915 correlation coefficient (Figure 2b).
The specificity of the CP probe toward Fe3+ was also determined, and the results are shown in Figure 3. First, the effect of response time on the fluorescence emission intensity of the CP probe at 439 nm with and without Fe3+ was studied. When Fe3+ was added, the fluorescence emission intensity at 439 nm completely decreased in 1 min and became saturated for 25 min, as shown in Figure 3a. Thus, the results show that this CP probe could be applied for the real-time detection of Fe3+.
Subsequently, we investigated the fluorescence response of CP to all sorts of common metal ions, such as Na+, K+, Ca2+, Mg2+, Zn2+, Ni2+, Co2+, Cu2+, Cd2+, Fe3+, and Al3+, in order to evaluate selectivity, which is a very important parameter for a fluorescence probe; the results are shown in Figure 3b. When these ions were separately added to CP in a DMSO/H2O (4:1, v/v) mixed solution, only Fe3+ completely quenched the fluorescence of CP. Other metal ions only induced slight changes (either fluorescence enhancement or quenching) in the selected working conditions, even if their concentration was 33 times greater than that of Fe3+ ions. Some other ions, including anions and ROS, such as SO42−, HSO3, S2O32−, SCN, C2O42−, NO2, Cl, Br, I, H2O2, and OH·, were also studied to investigate the fluorescence response of the CP probe. The results show that additions of these other ions did not cause any discernible changes (Figure S1, Supplementary Information). These observations showed that the CP probe had good selectivity for Fe3+ ions and could be used to effectively detect them.

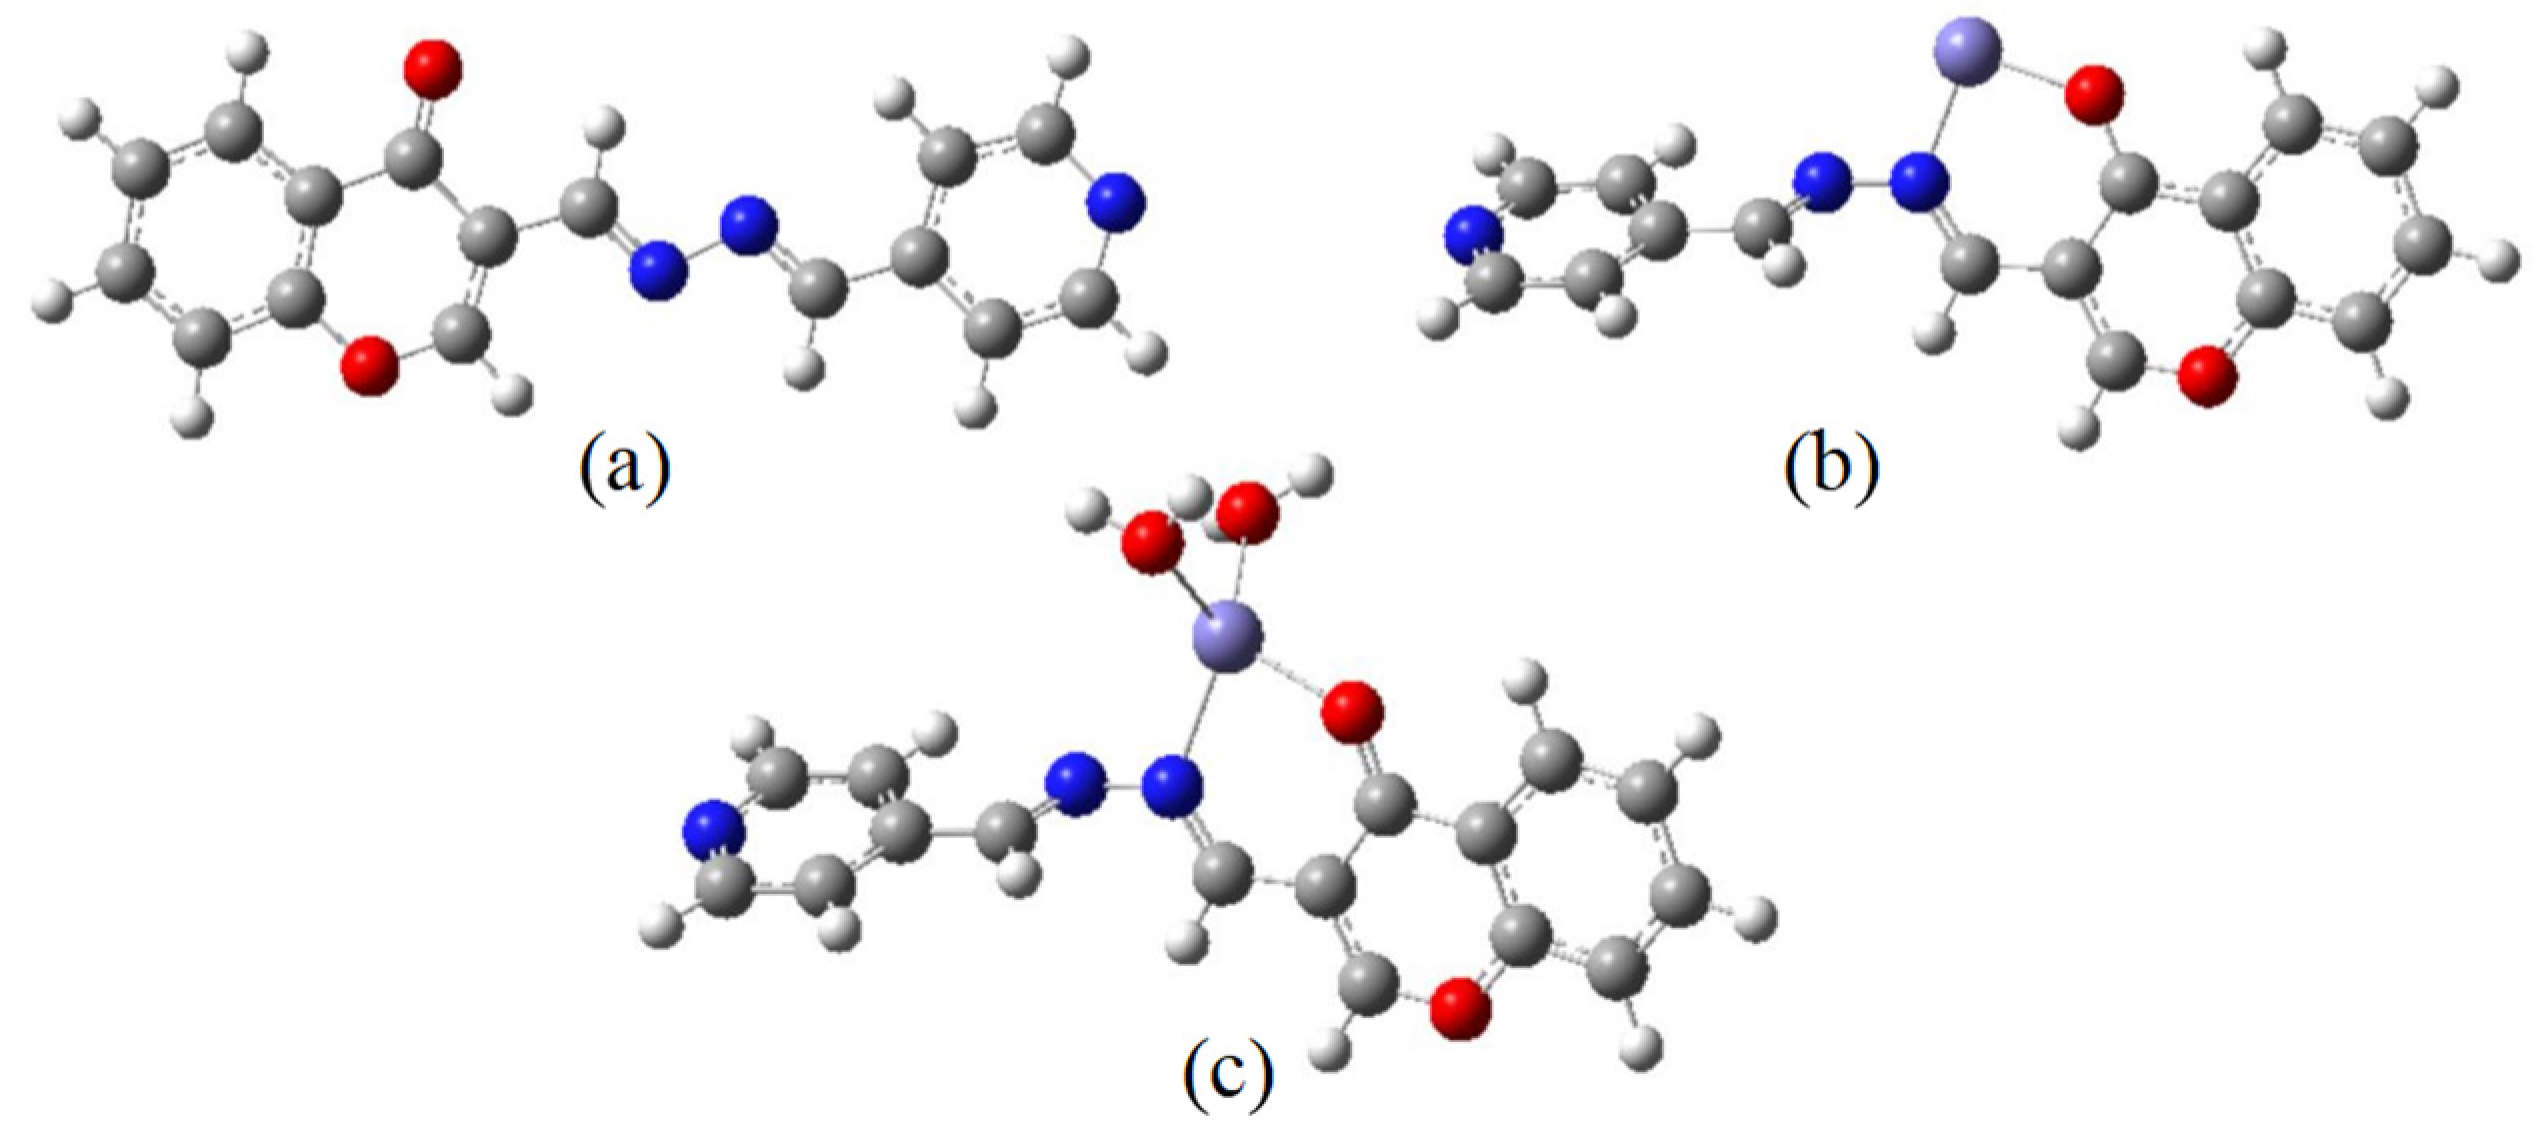
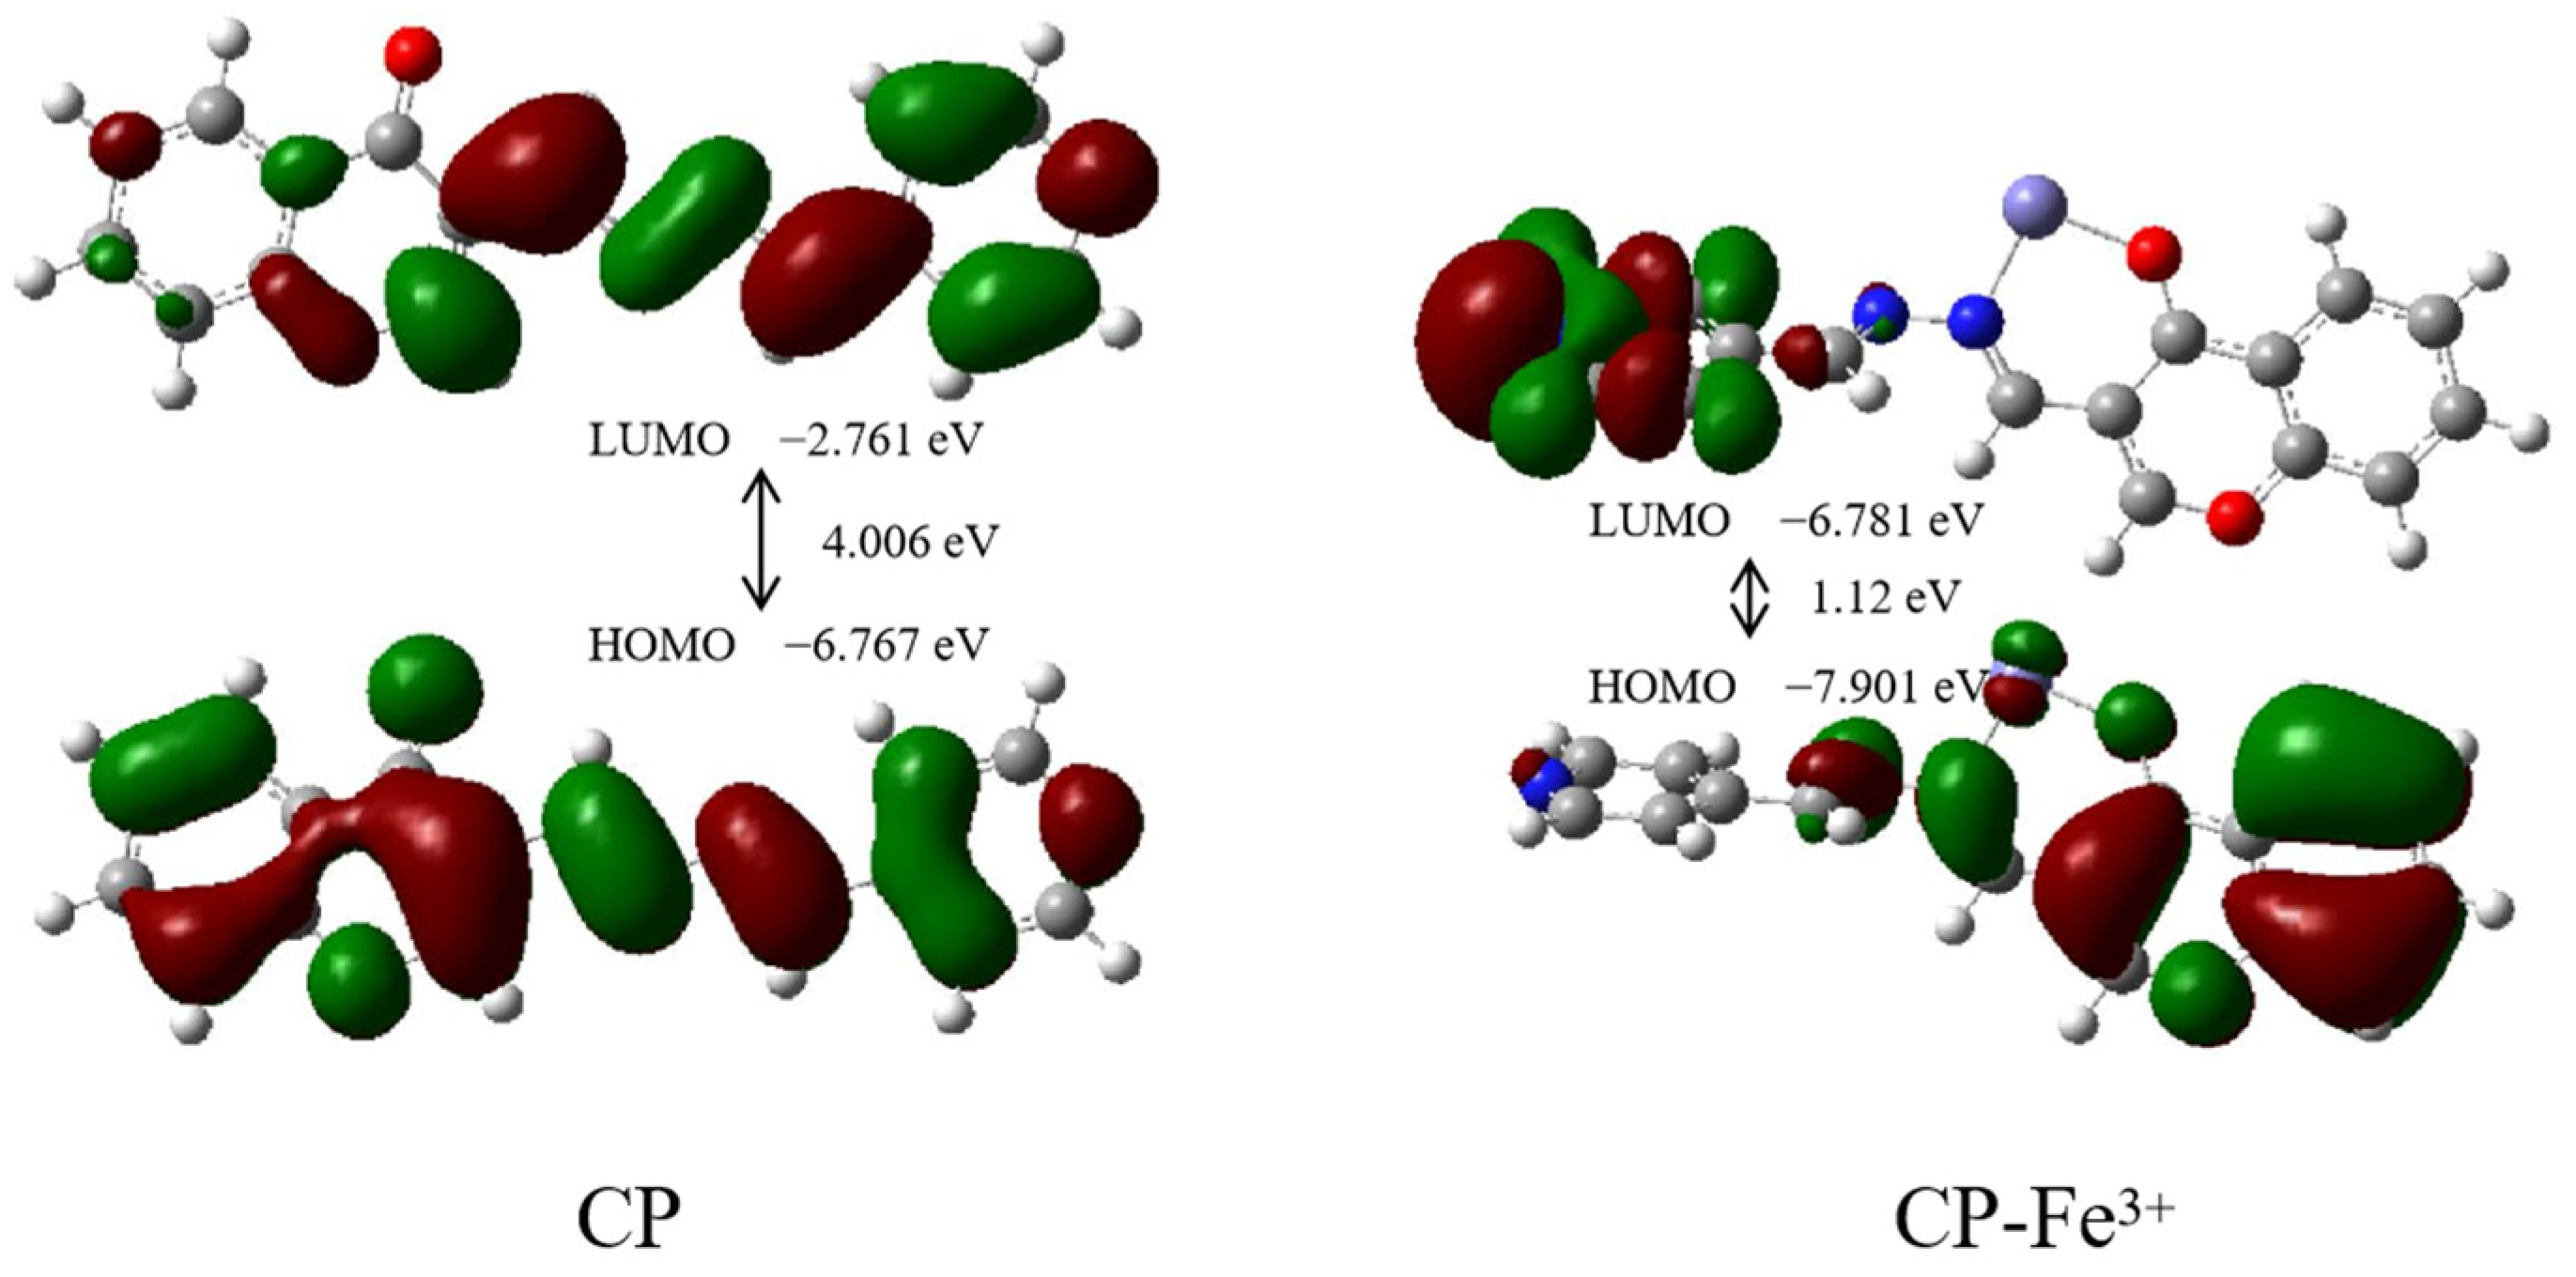
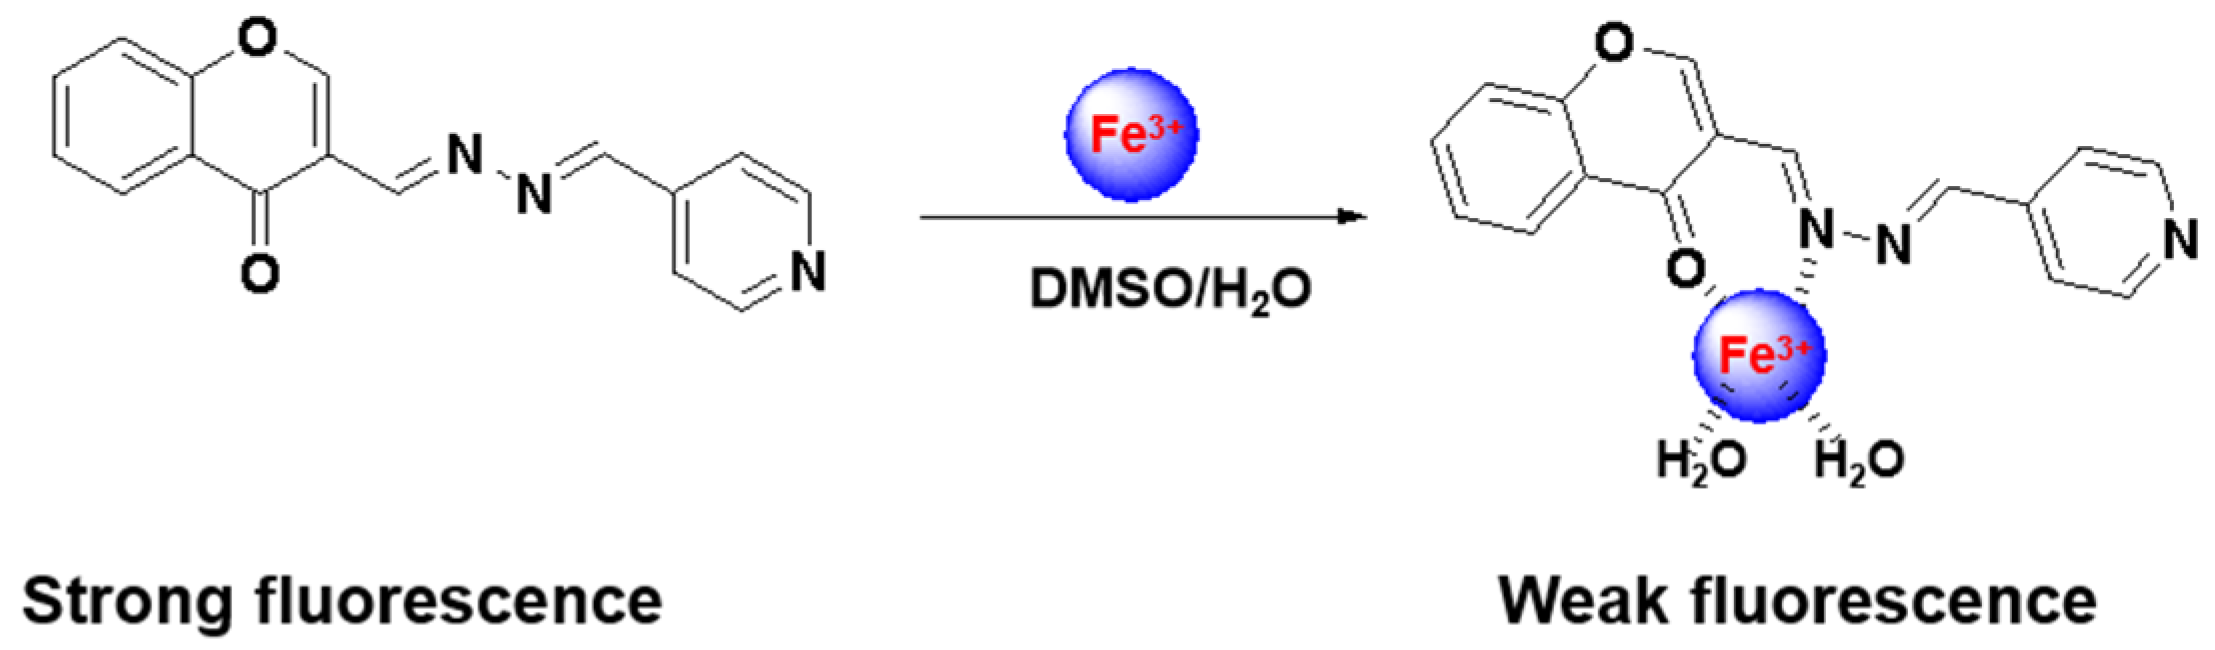
2.3. Sensing Mechanism of the CP Probe with Fe3+

The molar ratio method proved that the CP probe and Fe3+ formed a 1:1 stoichiometry complex, as shown in the inset to Figure 2 [27,28,29,30]. To further prove the sensing mechanism of the CP probe toward Fe3+, ESI-MS spectrometry analysis and a density functional theory (DFT) calculation were applied. Subsequently, the ESI-MS spectrometry of the forming complex CP-Fe3+ was first determined, in which the peak at m/z = 370.0169 was assigned to [CP + Fe3+ + 2H2O + H+], supporting the 1:1 binding mode of the CP probe and Fe3+ (Figure 4). The IR spectra also indicated that the CP probe and Fe3+ formed a coordination compound, where the characteristic absorption moieties of C=O- and C=N-situated chromones at 1641 cm−1 and 1615 cm−1 shifted to 1616 cm−1 and 1553 cm−1, respectively (Figure S2, Supplementary Information).
A DFT calculation was carried out using Gaussian 09 [31] software with the help of the GaussianView 5.0 visualization program. The structures of the probe and the complexes were fully optimized using the B3LYP/6-311++G(d,p) basis set and Lanl2dz basis set in a DMSO/H2O mixed solution according to the experimental procedure, respectively. For this, we performed an optimization using the polarizable continuum model (PCM) method. Figure 5 shows the energy-optimized structures of the probe and its complexes. Figure 5a indicated that the structure of CP probe is planar. Because of the repulsive force between two hydrogen atoms of imine moiety, the structures of the complexes are nonplanar (Figure 5b,c). Additionally, the total energy values of the CP probe and the complex CP-Fe3+ (Figure 5b) were −931.2326582 a.u. and −2194.3728797 a.u., respectively. Again, the total energy of the complex CP-Fe3+-2H2O (Figure 5c) was lower (−2347.3856608 a.u.) than that of both CP and CP-Fe3+, which implied a higher stability. This result was in accordance with that of ESI-MS spectrometry analysis.
Furthermore, the energy of highest occupied molecular orbital (HOMO) and the lowest unoccupied molecular orbital (LUMO) of the CP probe and its complex CP-Fe3+, along with their spatial distribution, was calculated, as shown in Figure 6. For the CP probe, both HOMO and LUMO essentially resided on its entire skeleton. In the case of the complex CP-Fe3+, the HOMO was mainly distributed in the chromone moiety, but the LUMO was mostly situated on the pyridine moiety. It can be seen in the frontier molecular orbital diagram that the HOMO of the complex CP-Fe3+ did not overlap with its LUMO. After the binding of Fe3+ to CP, the HOMO–LOMO energy gap (ΔΕ) was lowered from 4.01 eV to 1.12 eV, which further stabilized the CP-Fe3+ system. Hence, the electron transfer from the chromone moiety to the pyridine moiety easily occurred, resulting in fluorescence quenching. The probable detection mechanism for monitoring Fe3+ is described in Figure 7.

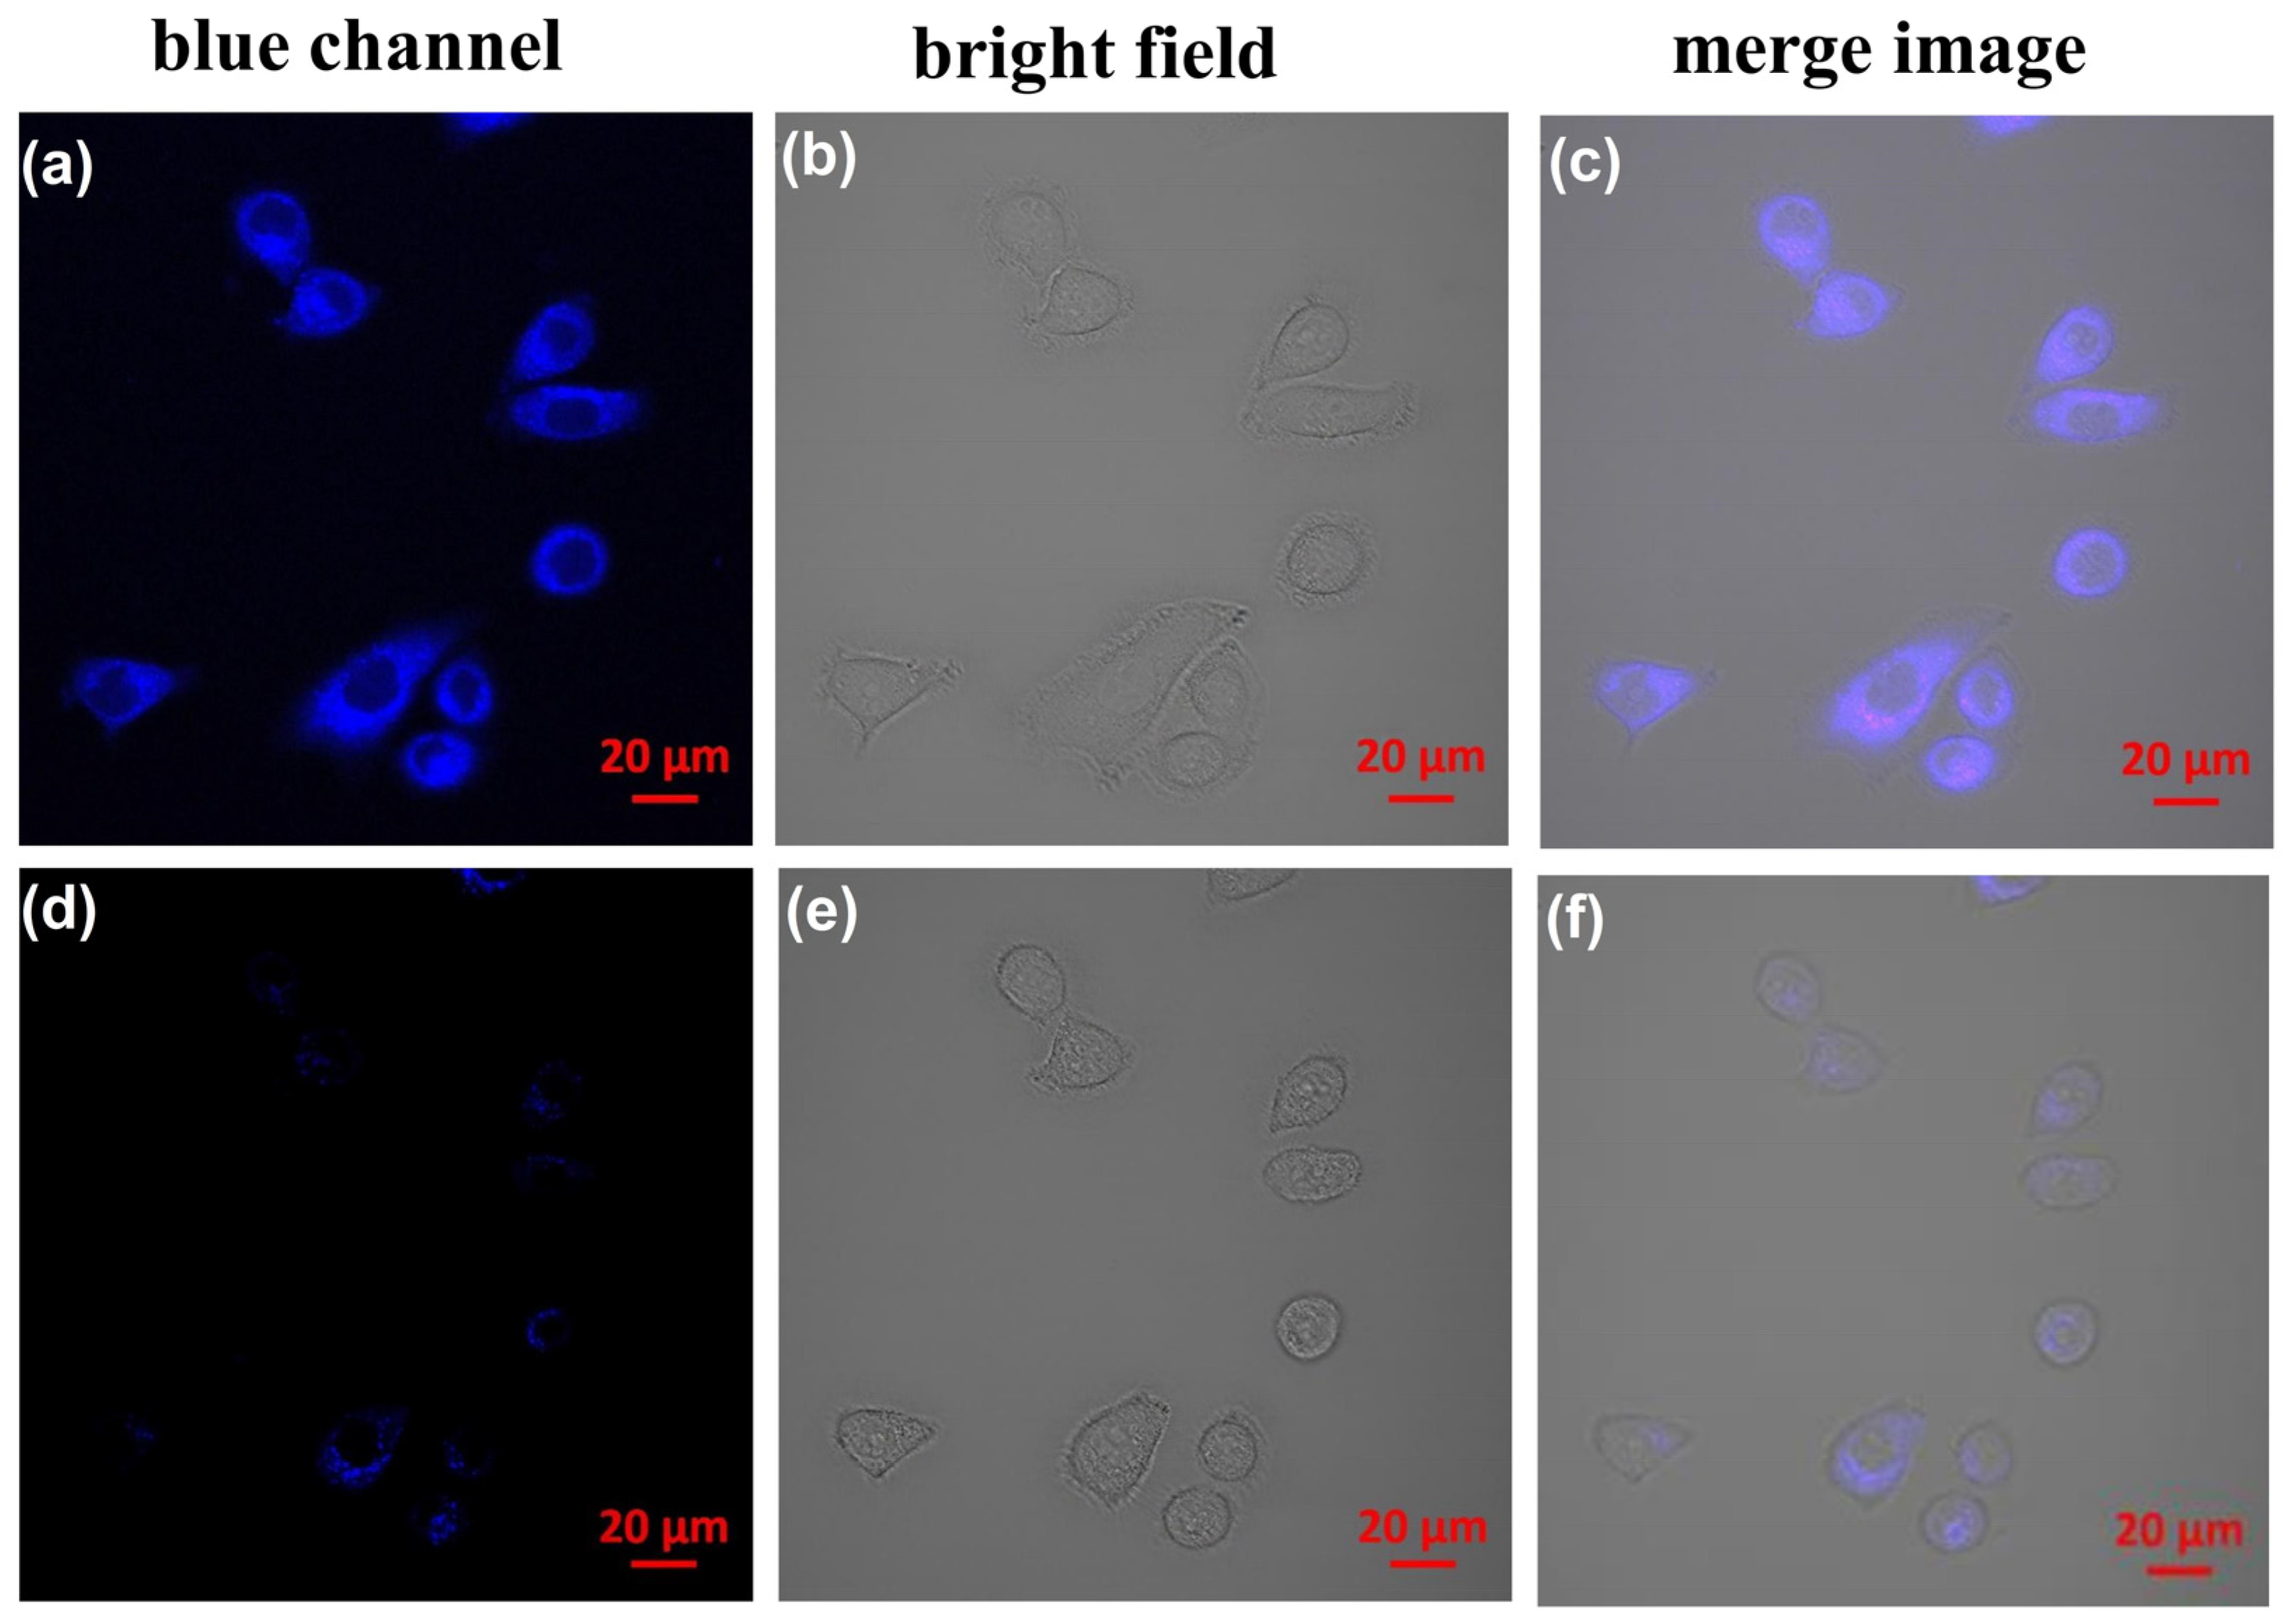
2.4. Practical Application of CP Probe

Next, to evaluate its practical application, the CP probe was subsequently used for living cell fluorescence imaging to detect Fe3+ ions. As shown in Figure 8, when the HeLa cells were incubated for 10 min at 37 °C with a 5 μmol•L−1 CP probe, a significant blue emission from the intracellular region was observed upon excitation at 405 nm (Figure 8a). After the cells were treated with 50 μmol•L−1 Fe3+ in the growth medium for 10 min at 37 °C, only weak intracellular fluorescence was observed in the microscope images (Figure 8d). Both bright field (Figure 8b,e) and overlay measurements (Figure 8c,f) with the Fe3+ and CP probe after treatment confirmed that the cells were viable for imaging experiments. The results confirm that the CP probe can monitor Fe3+ ions in a biological environment.
The cell viability of the probe is also an important parameter for its practical application. Therefore, the MTT assay experiments were conducted to evaluate the cell viability of the CP probe using three different kinds of cells, including HeLa, HepG2, and MCF-7 (Figures S3 and S4, Supplementary Information). Cell viability was monitored for 24 h after treatment with the CP probe over a wide range of concentrations (0–50 μmol•L−1). The results demonstrate that the CP probe did not negatively affect cell viability up to concentrations 20 μmol•L−1 for HeLa cells or 50 μmol•L−1 for HepG2 and MCF-7 cells, which showed that this probe had no prominent cytotoxicity to cells. Therefore, this CP probe could be an excellent device that has great potential for detecting Fe3+ in living cells.

3. Materials and Methods

3.1. Materials and Instruments

Both pyridine-4-carboxaldehyde and chromone-3-carboxaldehyde were purchased from HEOWNS Biochem Technologies LLC, Tianjin, China. Unless otherwise noted, all other reagents and solvents were commercially available and used without further purification. NMR spectra were recorded using a Bruker Avance NEO 600 MHz spectrometer (at 600 MHz for 1H NMR or 150 MHz for 13C NMR; Rheinstetten, Germany). A WQF-510A FT-IR spectrometer (Beijing Rayleigh Analytical Instrument Co., Ltd., Beijing, China) recorded the infrared spectroscopy in KBr discs in the 400–4000 cm−1 region. The melting points were measured on a Beijing Cossim X-5T micro-melting point apparatus (Beijing Century Letter Scientific instrument Co., Ltd., Beijing, China). HRMS (high-resolution mass spectra) was performed using an Aglient 7250 spectrometer (Santa Clara, CA, USA). Absorption spectra and fluorescence spectra were obtained using a TU-1901 UV-Vis spectrophotometer (Beijing Puxi General Instrument Co., Ltd., Beijng, China) and a Varian Cary Elipses spectro fluorophotometer (Palo Alto, CA, USA), respectively.

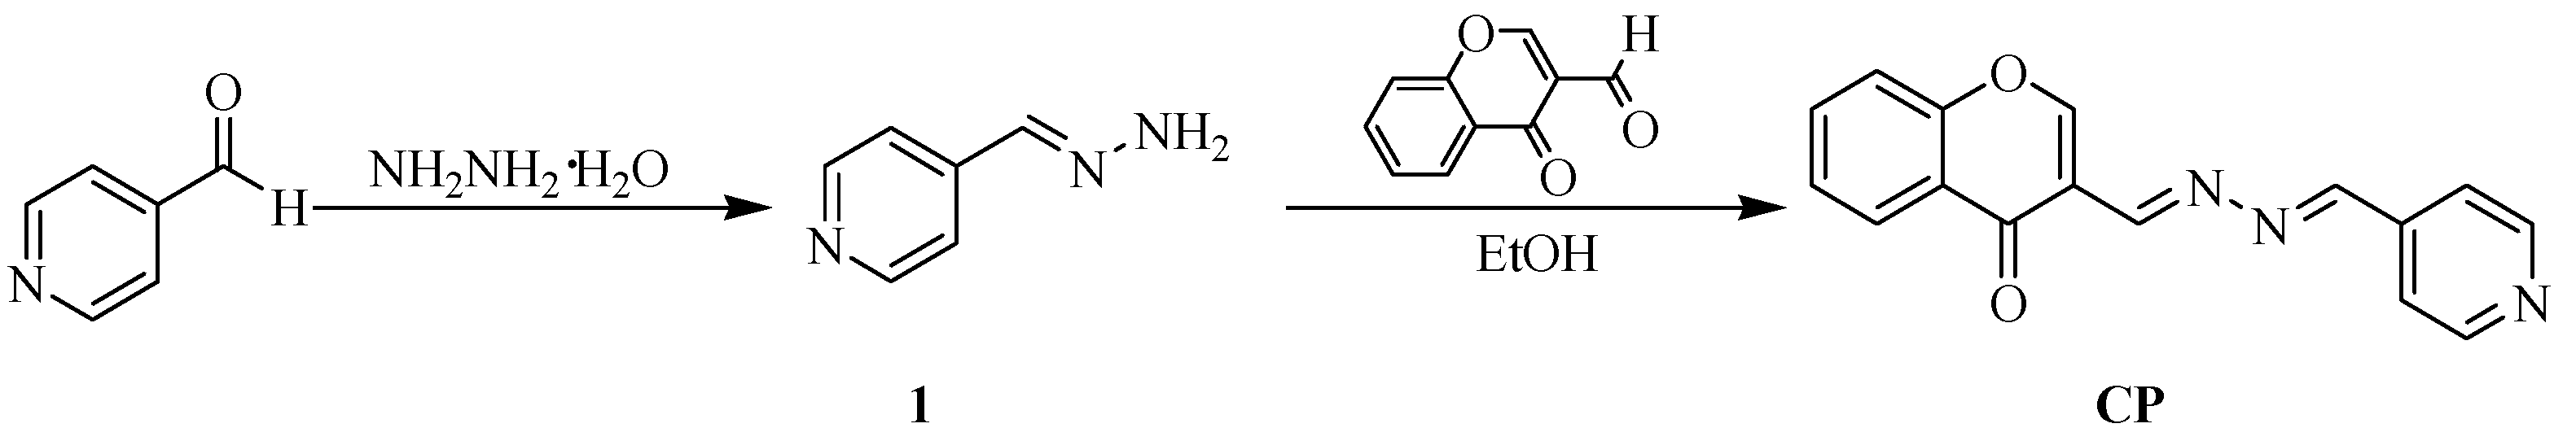
3.2. Synthesis of the CP Probe

A solution of chromone-3-carboxaldehyde in EtOH (5 mL) was added dropwise to a suspension of compound 2 (0.21 g, 1.72 mmol) EtOH (10 mL) over 5 min in an ice bath and the mixture was continually stirred for 8 h. Then, the precipitate was filtered and washed with EtOH. Finally, the solid was recrystallized from EtOAc to afford the CP probe (0.30 g, 66%) as a white solid. Rf = 0.34 (V(EtOAc):V(Petroleum ether) = 2:1), m.p. 220.5–221.3 °C. 1H NMR (CDCl3, 600 MHz), δ: 8.97 (s, 1H), 8.81 (s, 1H), 8.78 (d, J = 6 Hz, 2H), 8.56 (s, 1H), 8.33 (d, J = 12 Hz, 1H), 7.80–7.75 (m, 3H), 7.57 (d, J = 6 Hz, 1H), 7.52 (t, J = 6 Hz, 1H); 13C NMR(CDCl3, 150 MHz), δ: 175.60, 159.39, 156.25, 156.06, 155.73, 150.52, 140.96, 134.34, 126.21, 126.15, 124.26, 122.11, 118.45; IR(KBr)ν, cm−1: 3049, 1641, 1562, 1347, 1230, 991, 761, 661, 536; HR-MS(ESI): m/z calcd. for C16H11N3O2Na [M + Na+]: 300.0743, found: 300.0744.

3.3. Procedures for Metal Ions Sensing

Stock solutions of various metal ions (0.1 mol•L−1), such as Na+, K+, Ca2+, Mg2+, Zn2+, Ni2+, Co2+, Cu2+, Cd2+, and Al3+, were prepared in deionized water. Fe3+ (0.001 mol•L−1) is prepared in deionized water. For titration, the CP probe (3 mL, 10 μmol•L−1, dimethyl sulfoxide–water mixed solution) was added to a quartz optical cell of 1 cm optical path length. Metal ion stock solution was gradually added to the CP probe through a micro-pipette. The test samples for the evaluation of selectivity were obtained by adding appropriate amounts of metal ion stock solution to the CP probe (3 mL, 10μmol•L−1, dimethyl sulfoxide-water mixed solution). Fluorescence intensity was recorded at an excitation of 345 nm within 350–600 nm.

3.4. DFT Calculation

DFT calculation was performed in a binary solvent (DMSO/H2O, v/v, 4/1) using Gaussian 09. The calculation method is as follows. The static dielectric constant (EPS) and dynamic dielectric constant (EpsInf) of DMSO and H2O were calculated. The EPS and EpsInf values of DMSO were 46.8260 and 2.0079, respectively. The EPS and EpsInf values of H2O were 78.3553 and 1.7778, respectively. Then, according to the volume ratio, the static dielectric constant and dynamic dielectric constant of the mixed solvent with DMSO and H2O equal to 4:1 were determined. In the energy-optimized structure of probes and complexes, we used “scrf = (PCM, solvent = generic, read)” keywords.

3.5. Cell Culture and Fluorescence Bioimaging

The HeLa cell line was provided by Chemistry and Chemical Engineering of Shanxi University (Shanxi, China). The MTT assays for HepG2 and MCF-7 cells were conducted by Shiyanjia Lab (www.Shiyanjia.com, 21 February 2024). The cells were cultured in DMEM (4.5 g of glucose/L) supplemented with 10% FBS at 37 °C and 5% CO2, seeded into 96-well plates, and then stored for 12 h. The cells were washed with PBS buffer before use and then incubated with a 5 µmol•L−1 CP probe in a PBS buffer for another 10 min at 37 °C. The experiments were also carried out over 10 min in the same medium supplemented with 50 μmol•L−1 FeCl3·6H2O in order to assess Fe3+ uptake. Cell imaging was then carried out after washing the cells with PBS buffer 3 times. Confocal fluorescence imaging was performed with an Olympus FluoView FV1000 confocal microscope (Tokyo, Japan). Cells incubated with the CP probe were excited at 405 nm using a multi-line argon laser.

4. Conclusions

In summary, a new fluorescent CP probe was synthesized and structurally characterized. The recognition properties for Fe3+ were also evaluated. It displayed a high sensitivity and selectivity toward Fe3+, no significant optical interference arose from the other examined metal ions such as Na+, K+, Ca2+, Mg2+, Zn2+, Ni2+, Co2+, Cu2+, Cd2+ and Al3+. CP probe exhibited a fast fluorescence response within 1 min and a low detection limit of 0.044 μmol•L−1 for Fe3+. The stoichiometry ratio of CP probe binding with Fe3+ was verified as 1:1. The recognition mechanism of fluorescence quenching was the photoinduced electron transfer (PET) process between the CP probe and Fe3+ and the destruction of the large π-system of the CP probe. Further investigation demonstrated that the CP probe can be applied for the bioimaging of Fe3+ in living cells.

Supplementary Materials

The following supporting information can be downloaded at: https://www.mdpi.com/article/10.3390/molecules29071504/s1, Figure S1: Fluorescence spectra of CP probe for other species including anions and ROS; Figure S2: IR spectra for mechanism; Figure S3: MTT assay of CP probe at 24 h; Figure S4: MTT assay of CP probe for HepG2 and MCF-7 cells at 24 h; Figure S5: 1H NMR spectrum of CP; Figure S6: 13C NMR spectrum of CP; Figure S7: HR-MS spectrum of CP.

Author Contributions

Conceptualization, Y.B. and X.Q.; methodology, Y.B.; software, F.Z. and Z.Z.; validation, X.Q. and Y.B.; investigation, Y.B.; data curation, Y.B.; writing—original draft preparation, Y.B. and X.Q.; writing—review and editing, J.K.; supervision, X.Q.; project administration, X.Q.; funding acquisition, Y.B. All authors have read and agreed to the published version of the manuscript.

Funding

This research was funded by the Shanxi “1331” project Key Innovative Research Team (No. PY201817).

Institutional Review Board Statement

Not applicable.

Informed Consent Statement

Not applicable.

Data Availability Statement

Data are contained within the article and Supplementary Information.

Conflicts of Interest

The authors declare no conflicts of interest.

References

  1. Burdo, J.R.; Connor, J.R. Brain iron uptake and homeostatic mechanisms: An overview. Biometals 2003, 16, 63–75. [Google Scholar] [CrossRef]
  2. Kaplan, C.D.; Kaplan, J. Iron Acquisition and Transcriptional Regulation. Chem. Rev. 2009, 109, 4536–4552. [Google Scholar] [CrossRef] [PubMed]
  3. Kabat, G.C.; Rohan, T.E. Does excess iron play a role in breast carcinogenesis ? An unresolved hypothesis. Cancer Causes Control. 2007, 18, 1047–1053. [Google Scholar] [CrossRef] [PubMed]
  4. Hintze, K.J.; Theil, E.C. DNA and mRNA elements with complementary responses to hemin, antioxidant inducers, and iron control ferritin-L expression. Proc. Natl. Acad. Sci. USA 2005, 102, 15048–15052. [Google Scholar] [CrossRef]
  5. Liu, Y.; Zhao, C.; Zhao, X.; Liu, H.; Wang, Y.; Du, Y.; Wei, D. A selective N,N-dithenoyl-rhodamine based fluorescent probe for Fe3+ detection in aqueous and living cells. J. Environ. Sci. 2020, 90, 180–188. [Google Scholar] [CrossRef]
  6. Pietrangelo, A. Iron and the liver. Liver Int. 2016, 36, 116–123. [Google Scholar] [CrossRef] [PubMed]
  7. Espósito, B.P.; Epsztejn, S.; Breuer, W.; Cabantchik, Z.I. A Review of Fluorescence Methods for Assessing Labile Iron in Cells and Biological Fluids. Anal. Biochem. 2002, 304, 1–18. [Google Scholar] [CrossRef] [PubMed]
  8. Moll, R.; Davis, B. Iron, vitamin B12 and folate. Medicine 2017, 45, 198–203. [Google Scholar] [CrossRef]
  9. Papanikolaou, G.; Pantopoulos, K. Iron metabolism and toxicity. Toxicol. Appl. Phamacol. 2005, 202, 199–211. [Google Scholar] [CrossRef]
  10. Tesfaldet, Z.O.; van Staden, J.F.; Stefan, R.I. Sequential injection spectrophotometric determination of iron as Fe(II) in multi-vitamin preparations using 1,10-phenanthroline as complexing agent. Talanta 2004, 64, 1189–1195. [Google Scholar] [CrossRef]
  11. Akatsuka, K.; McLaren, J.W.; Lam, J.W.; Berman, S.S. Determination of iron and ten other trace elements in the Open Ocean Seawater reference material NASS-3 by inductively coupled plasma mass spectrometry. J. Ana. At Spectrom. 1992, 7, 889–894. [Google Scholar] [CrossRef]
  12. Bobrowski, A.; Nowak, K.; Zarebski, J. Application of a bismuth film electrode to the voltammetric determination of trace iron using a Fe(III)–TEA–BrO−3 catalytic system. Anal. Bioanal. Chem. 2005, 382, 1691–1697. [Google Scholar] [CrossRef] [PubMed]
  13. Sahoo, S.K.; Sharma, D.; Bera, R.K.; Crisponi, G.; Callan, J.F. Iron(Ⅲ) selective molecular and supramolecular fluorescent probes. Chem. Soc. Rev. 2012, 41, 7195–7227. [Google Scholar] [CrossRef] [PubMed]
  14. Boens, N.; Leen, V.; Dehaen, W. Fluorescent indicators based on BODIPY. Chem. Soc. Rev. 2012, 41, 1130–1172. [Google Scholar] [CrossRef] [PubMed]
  15. Nan, X.; Huyan, Y.; Li, H.; Sun, S.; Xu, Y. Reaction-based fluorescent probes for Hg2+, Cu2+ and Fe3+/Fe2+. Coordin. Chem. Rev. 2021, 426, 213580. [Google Scholar] [CrossRef]
  16. Yang, M.; Su, N.; Li, Y.; Wang, L.; Ma, L.; Zhang, Y.; Li, J.; Yang, B.; Kang, L. A New Fluorescent Probe for Fe3+ and Its Application to Bioimaging. Chin. J. Org. Chem. 2018, 38, 636–641. [Google Scholar] [CrossRef]
  17. Cao, X.; Zhang, F.; Bai, Y.; Ding, X.; Sun, W. A Highly Selective “Turn-on” Fluorescent Probe for Detection of Fe3+ in Cells. J. Fluoresc. 2019, 29, 425–434. [Google Scholar] [CrossRef]
  18. Qin, J.; Yang, Z.; Wang, G. A novel ratiometric fluorescent probe for detection of Fe3+ by rhodamine–quinoline conjugate. J Photoch. Photobio. A 2015, 310, 122–127. [Google Scholar] [CrossRef]
  19. Gupta, V.K.; Mergu, N.; Kumawat, L.K. A new multifunctional rhodamine-derived probe for colorimetric sensing of Cu(II) and Al(III) and fluorometric sensing of Fe(III) in aqueous media. Sens. Actuators B 2016, 223, 101–113. [Google Scholar] [CrossRef]
  20. Liu, J.; Qian, Y. A novel pyridylvinyl naphthalimide-rhodamine dye: Synthesis, naked-eye visible and ratiometric chemodosimeter for Hg2+/Fe3+. J. Lumin. 2017, 187, 33–39. [Google Scholar] [CrossRef]
  21. Yang, X.H.; Li, S.; Tang, Z.S.; Yu, X.D.; Huang, T.; Gao, Y. A simple, water-soluble, Fe3+-selective fluorescent probe and its application in bioimaging. Chinese Chem. Lett. 2015, 26, 129–132. [Google Scholar] [CrossRef]
  22. Bai, X.; Yan, J.; Qin, J.C.; Yang, Z.Y. A multi-ion fluorescent probe for Mg2+/Zn2+ based on a novel chromone-dendron Schiff base. Inorg. Chim. Acta 2018, 474, 44–45. [Google Scholar] [CrossRef]
  23. Li, C.R.; Li, S.L.; Yang, Z.Y. A chromone-derived Schiff-base as Al3+ “turn-on” fluorescent probe based on photoinduced electron-transfer (PET) and C=N isomerization. Tetrahedron. Lett. 2016, 57, 4898–4904. [Google Scholar] [CrossRef]
  24. Liu, C.; Tian, L.; Liu, K.; Xue, J.; Fan, L.; Li, T.; Yang, Z.Y. A chromone derivative as a colorimetric and “ON-OFF-ON” fluorescent probe for highly sensitive and selective detection of Cu2+ and S2−. Inorg. Chim. Acta 2021, 519, 120280. [Google Scholar] [CrossRef]
  25. Cheng, L.; Li, M.M.; Wang, B.; Xiao, L.J.; Xie, J.H.; Zhou, Q.L. Nickel-catalyzed hydroalkylation and hydroalkenylation of 1,3-dienes with hydrazones. Chem. Sci. 2019, 10, 10417–10421. [Google Scholar] [CrossRef] [PubMed]
  26. Mironenko, A.Y.; Tutov, M.V.; Sergeev, A.A.; Voznesenskiy; Bratskaya, S.Y. On/off rhodamine based fluorescent probe for detection of Au and Pd in aqueous solutions. Sens. Actuators B Chem. 2017, 246, 389–394. [Google Scholar] [CrossRef]
  27. Abd-Alrassol, K.S.; Jasim, E.Q. Spectrophotometric Determination of Some Phenolic Compounds by Formation of Copper(II) Complexes. IOP Conf. Ser. Mater. Sci. Eng. 2019, 571, 012097. [Google Scholar] [CrossRef]
  28. Xin, L.; Chen, Y.Z.; Niu, L.Y.; Wu, L.Z.; Tung, C.H.; Tong, Q.X.; Yang, Q.Z. A selective turn-on fluorescent probe for Cd2+ based on a boron difluoride β-dibenzoyl dye and its application in living cells. Org. Biomol. Chem. 2013, 11, 3014–3019. [Google Scholar] [CrossRef] [PubMed]
  29. Liu, W.; Xu, L.; Sheng, R.P.; Wang, P.; Li, H.; Wu, S. A Water-Soluble “Switching On” Fluorescent Chemosensor of Selectivity to Cd2+. Org. Lett. 2007, 9, 3829–3832. [Google Scholar] [CrossRef]
  30. Liu, Q.M.; Wang, H.; Guo, H.R.; Guo, Y. A Highly Selective Coumarin-based Fluorescent Probe for Detecting Fe3+ in Pure Water Systems and Living Cells. Chin. J. Inorg. Chem. 2019, 35, 923–929. [Google Scholar]
  31. Frisch, M.J.; Trucks, G.W.; Schlegel, H.B.; Scuseria, G.E.; Robb, M.A.; Cheeseman, J.R.; Scalmani, G.; Barone, V.; Petersson, G.A.; Nakatsuji, H.; et al. Gaussian 09; Gaussian, Inc.: Wallingford, CT, USA, 2009. [Google Scholar]
Scheme 1. Synthesis route for the CP probe.
Molecules 29 01504 sch001
Figure 1. (a) The UV/visible absorption and emission spectra of the CP probe (10 μmol•L−1) in DMSO/H2O mixed solvent (4:1, v/v). (b) Effect of pH on the fluorescence intensity of the CP probe (10 μmol•L−1) in DMSO/H2O mixed solvent (4:1, v/v) at 439 nm.
Molecules 29 01504 g001
Figure 2. (a) Fluorescence spectra of the CP probe (10 μmol•L−1) upon addition of Fe3+ in mixed DMSO/H2O (4:1, v/v) solution (λex = 345 nm). (Inset) The emission intensity at 439 nm of CP probe changes as a function of the ratio of Fe3+ concentration to CP probe concentration. (b) Dependence of normalized signal on concentration of Fe 3+ ions.
Molecules 29 01504 g002
Figure 3. (a) Fluorescence intensity of the CP probe (10 μmol•L−1) at 439 nm before and after adding Fe3+ (0.03 mmol•L−1) over time. (b) Fluorescence spectra of the CP probe (10 μmol•L−1) upon addition of 1 mmol•L−1 different metal ions (Na+, K+, Ca2+, Mg2+, Zn2+, Ni2+, Co2+, Cu2+, Cd2+, and Al3+) and 0.03 mmol•L−1 Fe3+ in DMSO/H2O (4:1, v/v) mixed solution.
Molecules 29 01504 g003
Figure 4. MS spectrum of CP-Fe3+-2H2O complex.
Molecules 29 01504 g004
Figure 5. Energy-optimized structures of the CP probe (a), CP-Fe3+ (b), and CP-Fe3+-2H2O complex (c).
Molecules 29 01504 g005
Figure 6. Energy level diagram of CP probe and the CP-Fe3+ complex for the HOMO and LUMO.
Molecules 29 01504 g006
Figure 7. Proposed recognition mechanism for the CP probe.
Molecules 29 01504 g007
Figure 8. Confocal fluorescence, bright field images, and overlay image of the CP probe in HeLa cells. (a) Cells incubated with 5 μmol•L−1 of CP probe for 10 min at 37 °C upon excitation at 405 nm. (d) Cells supplemented with 50 μmol•L−1 of Fe3+ in growth media for 10 min at 37 °C upon excitation at 405 nm. (b,e) Bright field image of cells shown in the panel. (c,f) Overlay image of cells is shown in panel.
Molecules 29 01504 g008
Disclaimer/Publisher’s Note: The statements, opinions and data contained in all publications are solely those of the individual author(s) and contributor(s) and not of MDPI and/or the editor(s). MDPI and/or the editor(s) disclaim responsibility for any injury to people or property resulting from any ideas, methods, instructions or products referred to in the content.

