Article

Sorption of Polycyclic Aromatic Sulfur Heterocycles (PASH) on Nylon Microplastics at Environmentally Relevant Concentrations

by
Stephanie D. Nauth
and
Andres D. Campiglia
*
Department of Chemistry, University of Central Florida, Physical Sciences Building. 4111, Orlando, FL 32816, USA
*
Author to whom correspondence should be addressed.
Molecules 2024, 29(7), 1653; https://doi.org/10.3390/molecules29071653
Submission received: 1 March 2024 / Revised: 29 March 2024 / Accepted: 3 April 2024 / Published: 7 April 2024

Abstract

:
Microplastics have garnered an infamous reputation as a sorbate for many concerning environmental pollutants and as a delivery vehicle for the aquatic food chain through the ingestion of these contaminated small particulates. While sorption mechanisms have been extensively studied for polycyclic aromatic hydrocarbons, polycyclic aromatic sulfur heterocycles (PASHs) have not been investigated, partly due to their low concentrations in aquatic ecosystems. Herein, an analytical methodology is presented for the analysis of dibenzothiophene, benzo[b]naphtho[1,2-b]thiophene, benzo[b]naphtho[2,1-b]thiophene, benzo[b]naphtho[2,3-b]thiophene, chryseno[4,5-bcd]thiophene and dinaphtho[1,2-b:1′,2′-d]thiophene at relevant environmental concentrations based on solid phase extraction and high-performance liquid chromatography. The sorption uptake behavior and the sorption kinetics of the three benzo[b]napthothiophene isomers were then investigated on nylon microplastics to provide original information on their environmental fate and avoid human contamination through the food chain. The obtained information might also prove relevant to the development of successful remediation approaches for aquatic ecosystems.

Graphical Abstract

1. Introduction

Microplastics have been a concern in aquatic environments throughout the years. With dimensions ranging from 0.1 to 5000 μm, the small size of these particulates makes their removal from environmental waters challenging [1] and facilitates their ingestion by aquatic organisms [2]. The rather large surface area of microplastics promotes the uptake of toxic contaminants from aquatic environments and enhances their role as chemical vectors for food chain contamination [3]. For instance, specific surface areas for polyamide microplastics have been reported in the range of 0.017–0.544 m2/g for particles sizes varying from 4000 to 29.7 µm, respectively [4]. Organic pollutants known to sorb onto microplastics include polycyclic aromatic hydrocarbons (PAHs) [3], pharmaceuticals [5], polychlorinated biphenyl [6] and polyhalogenated carbazole [7]. Their sorption onto microplastics occurs due to several retention mechanisms, which include a combination of pore filling, hydrogen bonding, pi-pi interactions, electrostatic interactions and van der Waals forces [8].
The presented studies deal with the sorption of polycyclic aromatic sulfur heterocycles (PASHs) onto nylon microplastics. Similar to their parent homocyclic species (PAHs), which contain only carbon and hydrogen, PASHs are usually formed during the incomplete combustion or pyrolysis of organic matter. In addition to their mutagenic and carcinogenic properties, some of them appear on pollutant lists around the world [9,10,11]. Specifically relevant to food chain contamination is the exacerbated ability of PASHs to bioaccumulate in aquatic organisms [12], which results from the presence of the sulfur atom in their heterocyclic molecular structure.
According to our literature search, this is the first report on the sorption of PASHs onto microplastics. To achieve low concentrations of PASHs in aqueous environments [13,14], a method was developed based on solid-phase extraction (SPE) and high-performance liquid chromatography (HPLC) with fluorescence detection. The pre-concentration factors achieved with the SPE procedure, and the appropriate choice of excitation and emission wavelengths made the analysis of several PASHs at parts per trillion (ppt) concentration levels possible. These included dibenzothiophene (DBT), benzo[b]naphtho[1,2-b]thiophene (BbN12T), benzo[b]naphtho[2,1-b]thiophene (BbN21T), benzo[b]naphtho[2,3-b]thiophene (Bb23T) chryseno[4,5-bcd]thiophene (C45T) and dinaphtho[1,2-b:1′,2′-d]thiophene (DiN1212T).
The SPE-HPLC method was then applied to study the sorption uptake and sorption kinetics of BbN12T, BbN23T and BbN21T onto nylon 11 and nylon 6,12. Nylon or polyamide is a popular type of plastic used in fishing gear for both commercial and recreational purposes. Since 18% of marine plastic waste is due to the fishing industry [15], the present studies provide relevant information regarding the contamination issue of microplastics in aquatic ecosystems.

2. Results and Discussion

2.1. HPLC Analytical Figures of Merit

HPLC conditions were optimized for the separation and detection of the six PASHs studied in this investigation. Figure S1 shows a typical chromatogram obtained from a synthetic mixture with the separation conditions outlined in Section 3.3. Since complete separation was obtained in all cases, these chromatographic conditions were kept constant for the remainder of this study.
The excitation and emission wavelengths for fluorescence detection were selected from signal-to-noise (S/N) ratios measured at the maximum intensities of chromatographic peaks (S) and the baseline noise (N) collected for 0.5 min prior to each chromatographic peak in the chromatograms. Table S1 summarizes the excitation and emission wavelengths that provided the highest S/N ratio for each PASH, along with their time window for chromatographic elution.
The analytical figures of merit for HPLC analysis are summarized in Table 1. No attempts were made to experimentally determine the upper concentration limit of the linear dynamic range. The correlation coefficients that are close to unity confirm the linear dynamic ranges (LDRs) with at least two orders of magnitude and the relative standard deviations (RSDs) demonstrate the good reproducibility of measurements at the parts-per-billion (ng/mL) concentration levels. The limits of detection (LODs) and the limits of quantitation (LOQs) were below 1 and 3 ng/mL, respectively. These LODs and LOQs are well above the parts-per-trillion concentration levels of PASHs in aquatic ecosystems [13,14].

2.2. HPLC-SPE Analytical Figures of Merit

Figure S2 provides a schematic diagram of the SPE procedure coupled to HPLC to achieve environmental concentrations of PASHs. The use of heptanol prior to sample pre-concentration removed unknown fluorescence impurities present in the SPE cartridges that co-eluted with several PASHs.
Figure S3 shows a typical SPE-HPLC chromatogram obtained from the pre-concentrated sample. Table 2 summarizes the SPE-HPLC AFOMs for the studied compounds. As expected, the retentions times were consistent with those in Table 1 and the LODs and LOQ were improved by at least one order of magnitude. The LDRs of the calibration curves and the acceptable reproducibility of measurements (RSD at medium linear concentrations demonstrate the ability to perform an SPE-HPLC analysis of PASHs at environmentally relevant concentration levels). Although BbN12T was the only PASH to present an analytical recovery statistically equivalent to 100% (texp = 1.98, tcrit = 4.30, P = 95%; N = 3), the low standard deviations of all the analytical recoveries show the satisfactory precision of measurements for pursuing sorption studies at environmentally relevant concentrations.

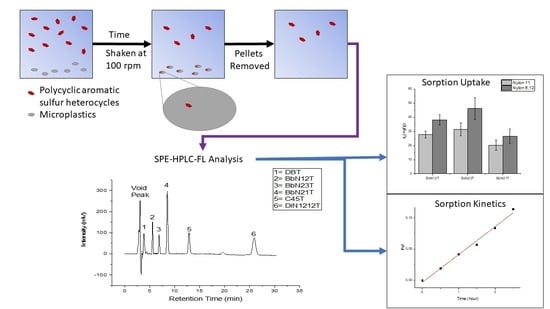
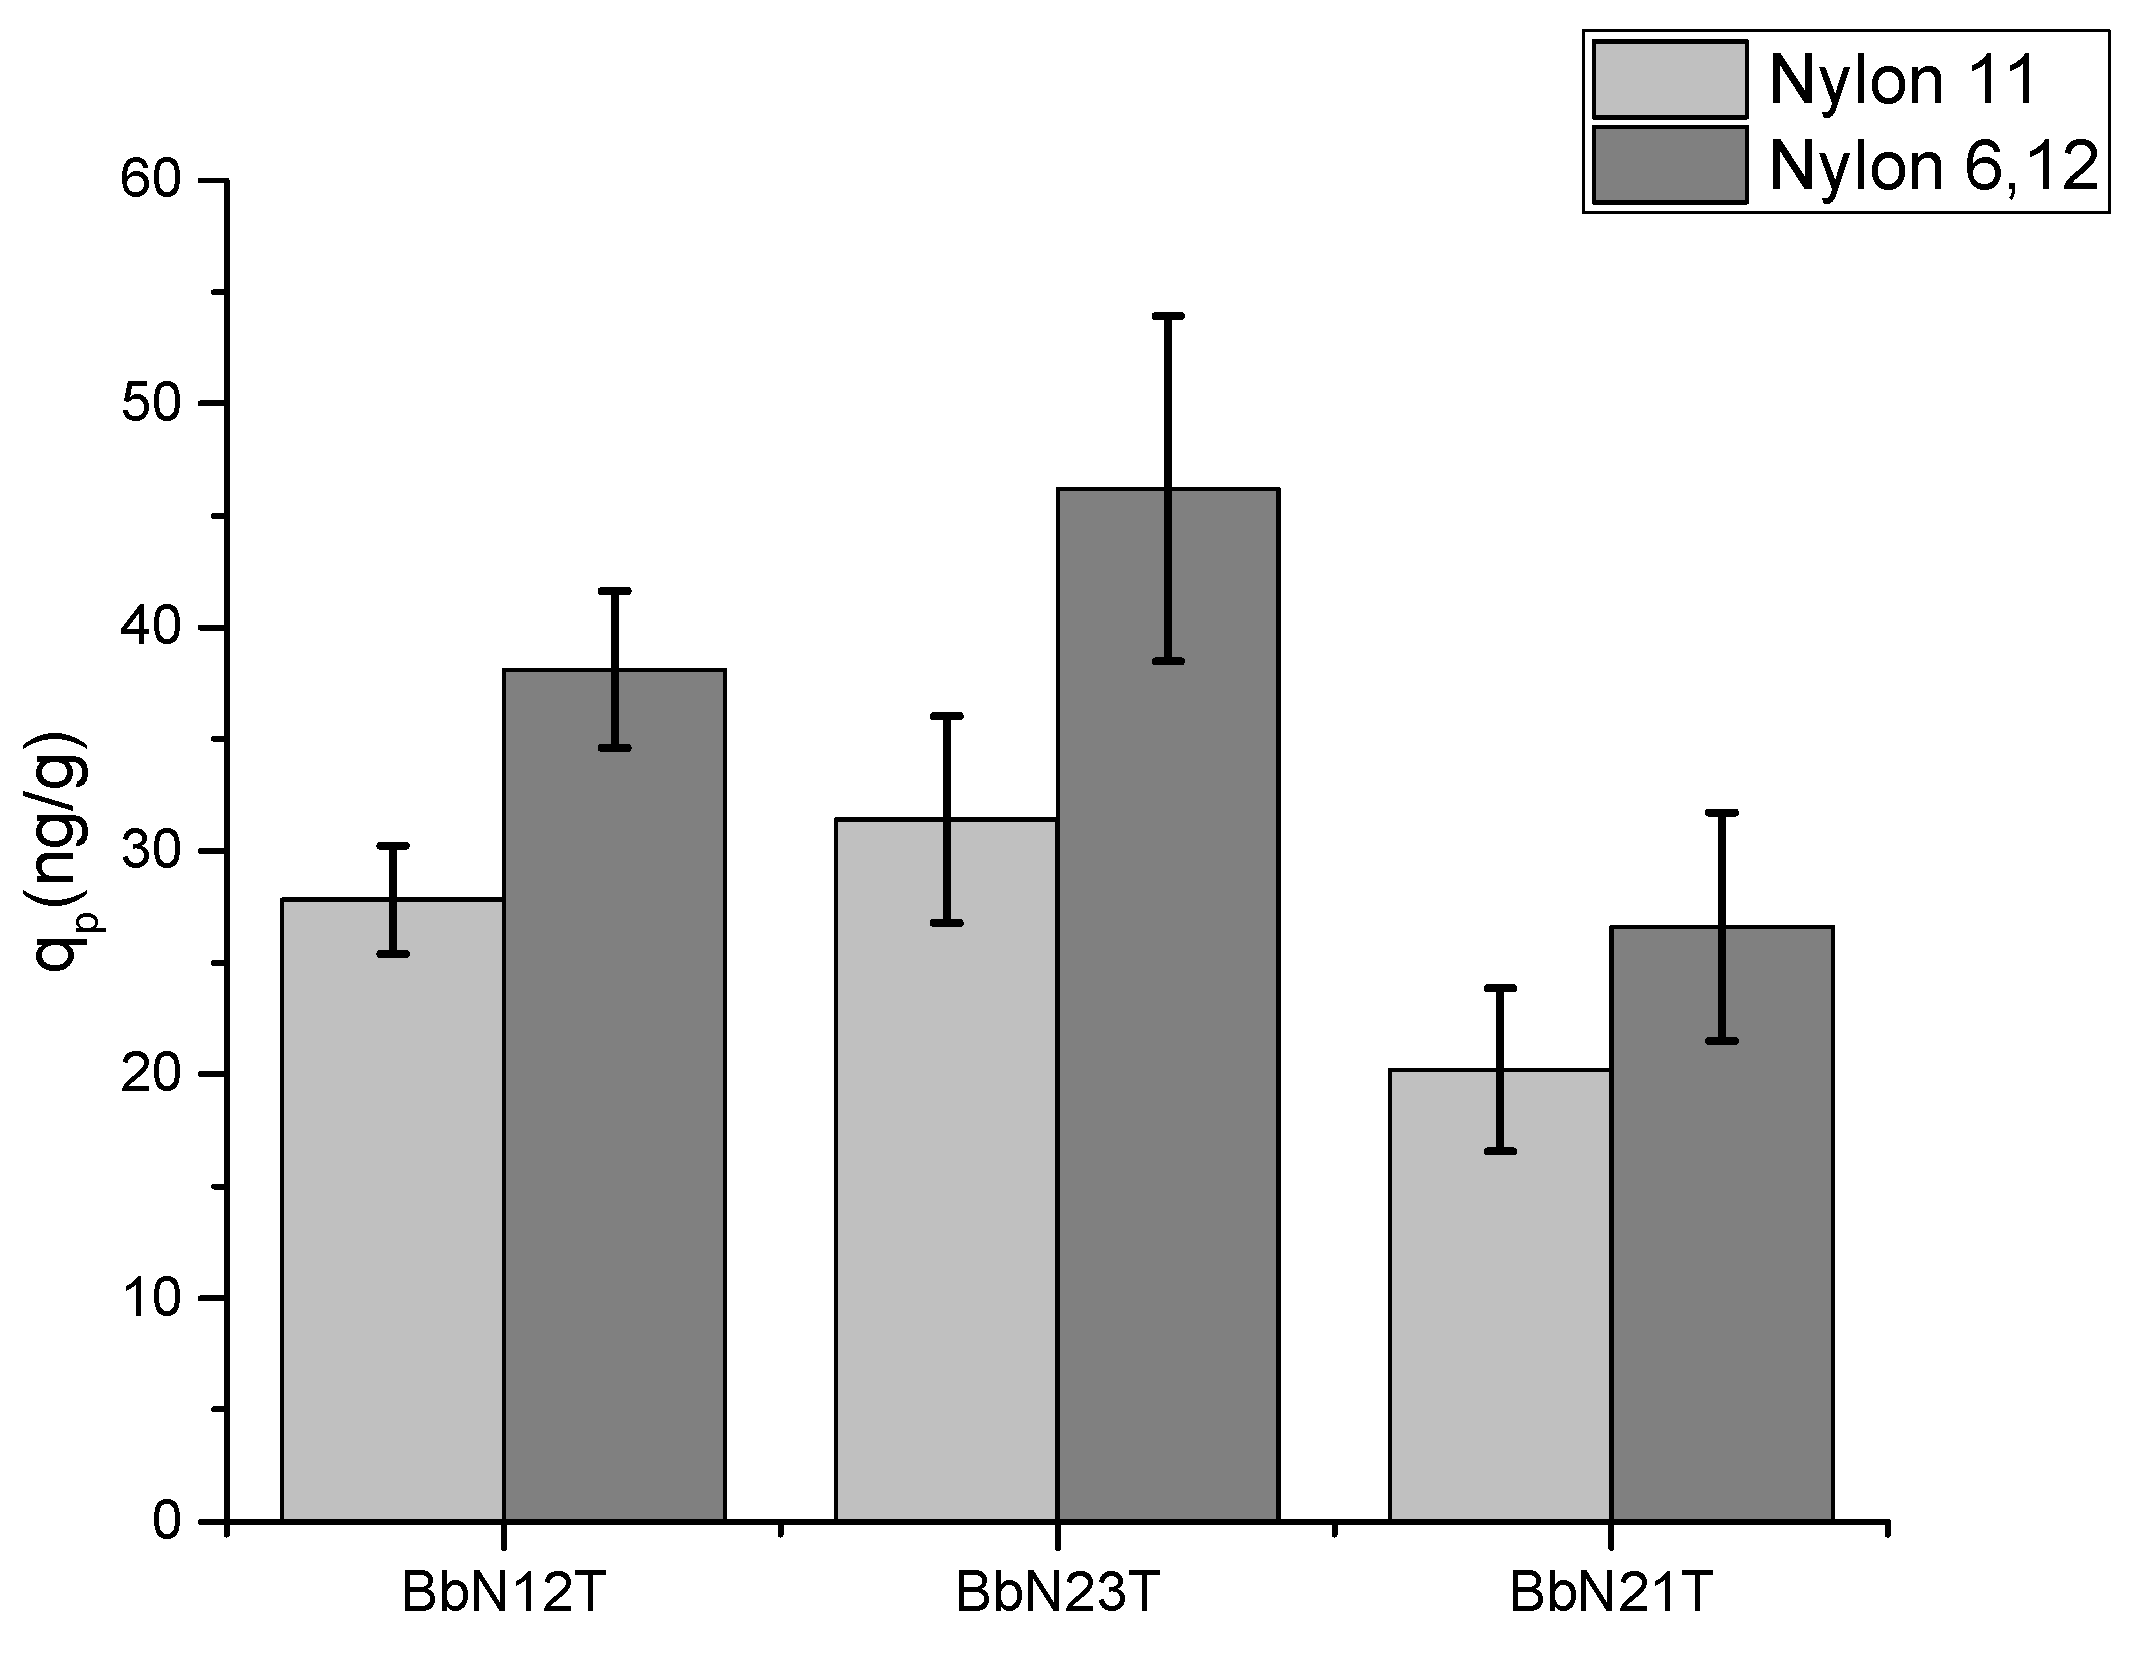
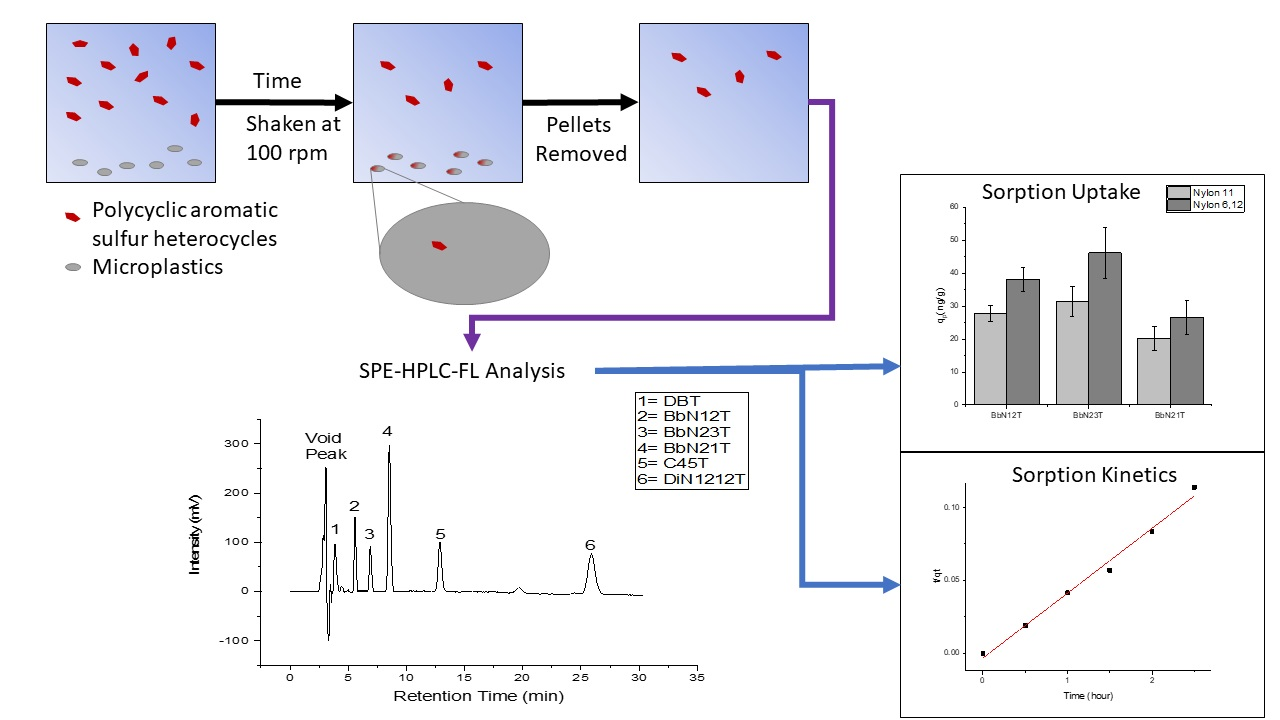
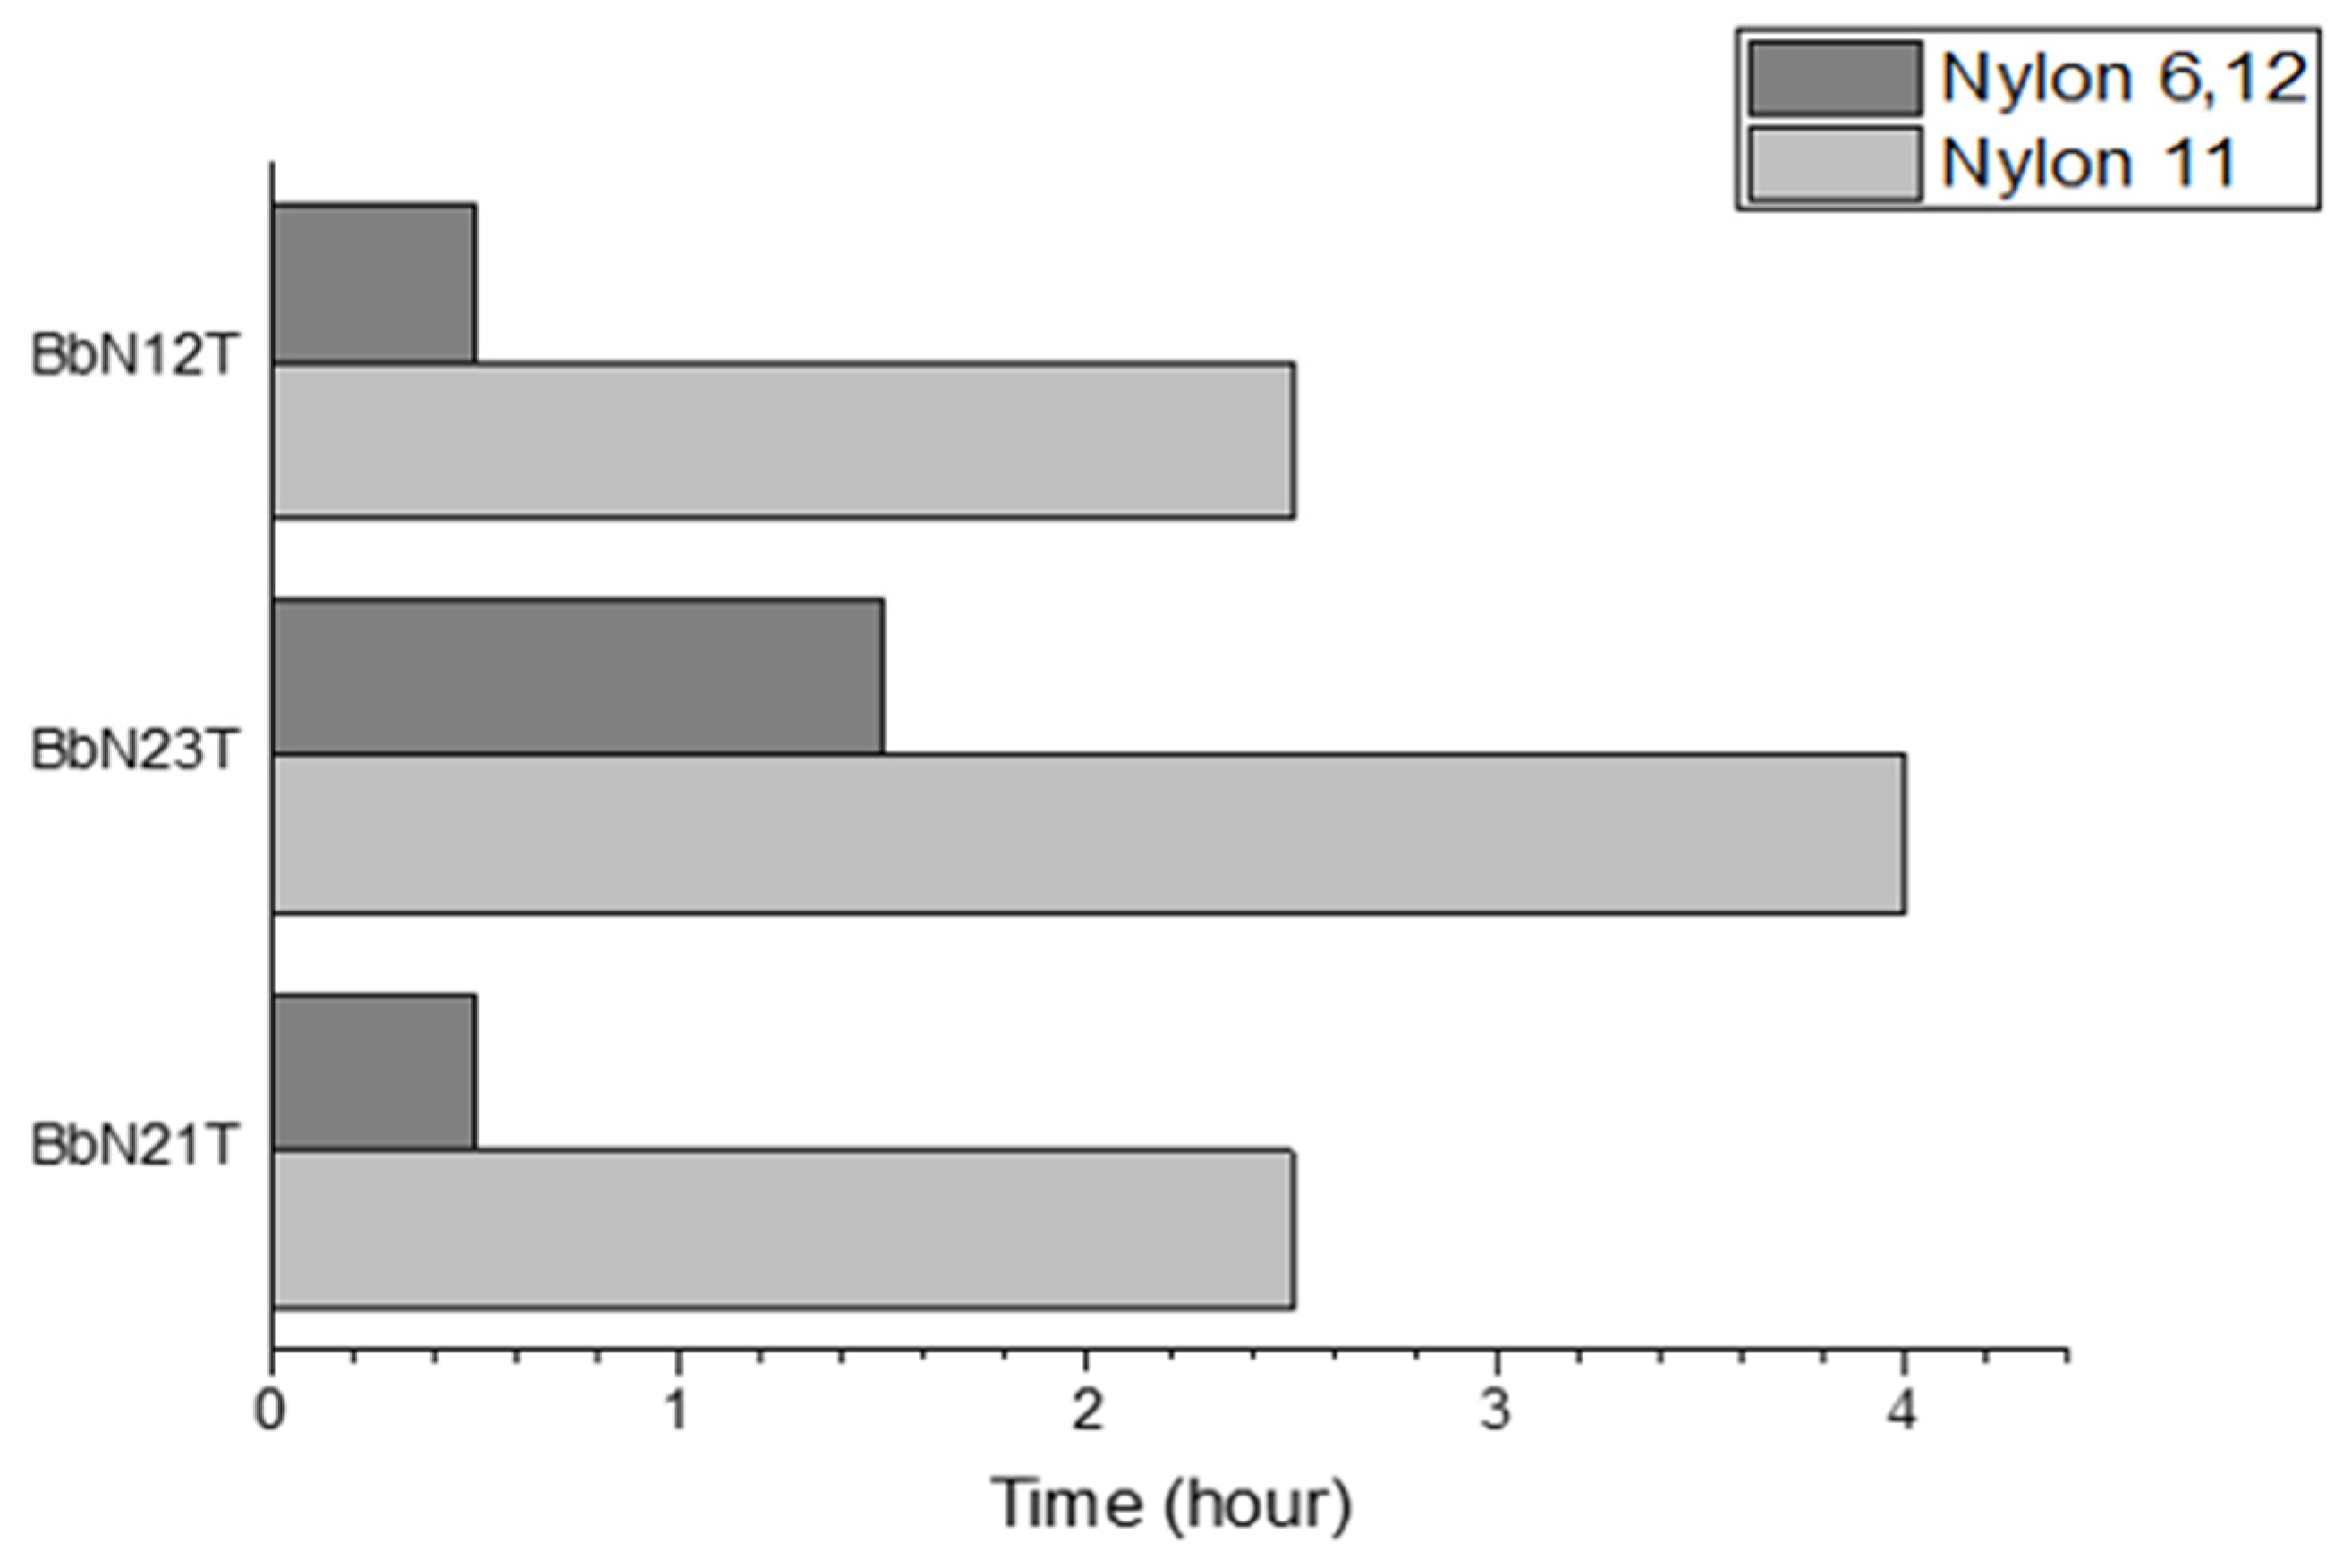
2.3. Sorption Uptake by Nylon Microplastics

BbN12T, BbN23T and BbN21T were selected for these studies. These three PASHs have the same molecular weight (234 g·mol−1) and the same water solubility (2.291 mmol/L) [16,17,18]. Their molecular lengths (L) and thicknesses (T) varied as follows: BbN12T (L = 12.72 Å and T = 4.39 Å), BbN21T (L = 13.66 Å and T = 4.06 Å) and BbN23T (L = 13.90 Å and T = 4.06 Å) [19,20].
Aqueous solutions containing the three isomers and microplastic particles were thoroughly shaken for various exposure times and the isomer concentrations were monitored via SPE-HPLC. The sorption uptake (qp) of each PASH was calculated with the following formula [21]:
q p = c t c a q × 0.100   L m p
where qp represents the mass of PASH adsorbed on the surface of the pellet (ng/g), ct is the initial concentration of each PASH in aqueous solution (ng/L), caq is the PASH concentration in the aqueous solution after a certain exposure time (ng/L) and mp is the mass of the microplastics (g) used for the experiments.
The maximum sorption uptake for the tested plastics is shown in Figure 1. The maximum sorption uptake was determined using Equation (1) and the standard deviations were calculated using the values from Table S2 and the Equation (S1) through Equation (S3). The figure shows that Nylon 6,12 shows a higher mass sorbed for all the PASH isomers. BbN23T showed the highest sorption between both plastics while BbN21T showed the least sorption. These trends indicate that the type of nylon impacts the sorption uptake of these pollutants, and that the pollutant structure also dictates the sorption onto microplastics. In addition, Table S3 shows the masses for the maximum sorption uptake. The masses sorbed for BbN23T and BbN12T are statistically different from each other, while the masses sorbed for BbN21T for both Nylon 11 and Nylon 6,12 are statistically equivalent.
Figure 2 shows the time needed to achieve the maximum sorption. For all PASHs, Nylon 6,12 was shown to be faster than Nylon 11. With Nylon 6,12, the sorption the maximum sorption occurred in less than 2 h for all three isomers. It took almost more than double the time for Nylon 11 to reach the maximum sorption uptake compared to Nylon 6,12.

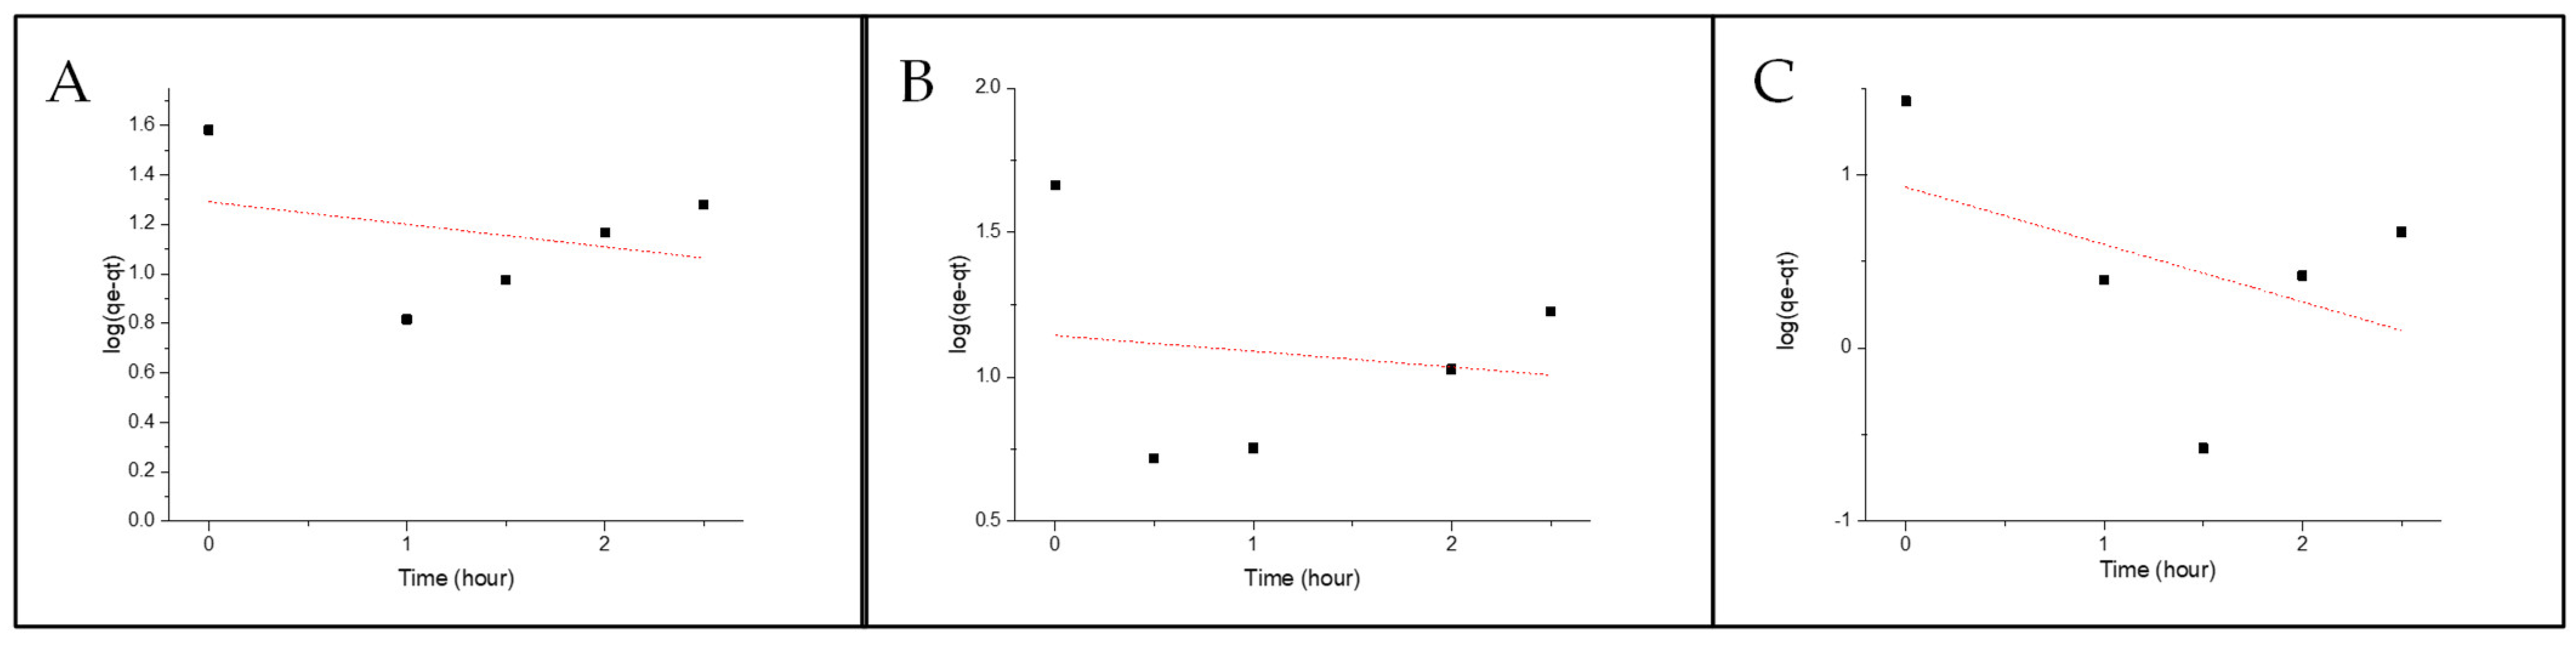
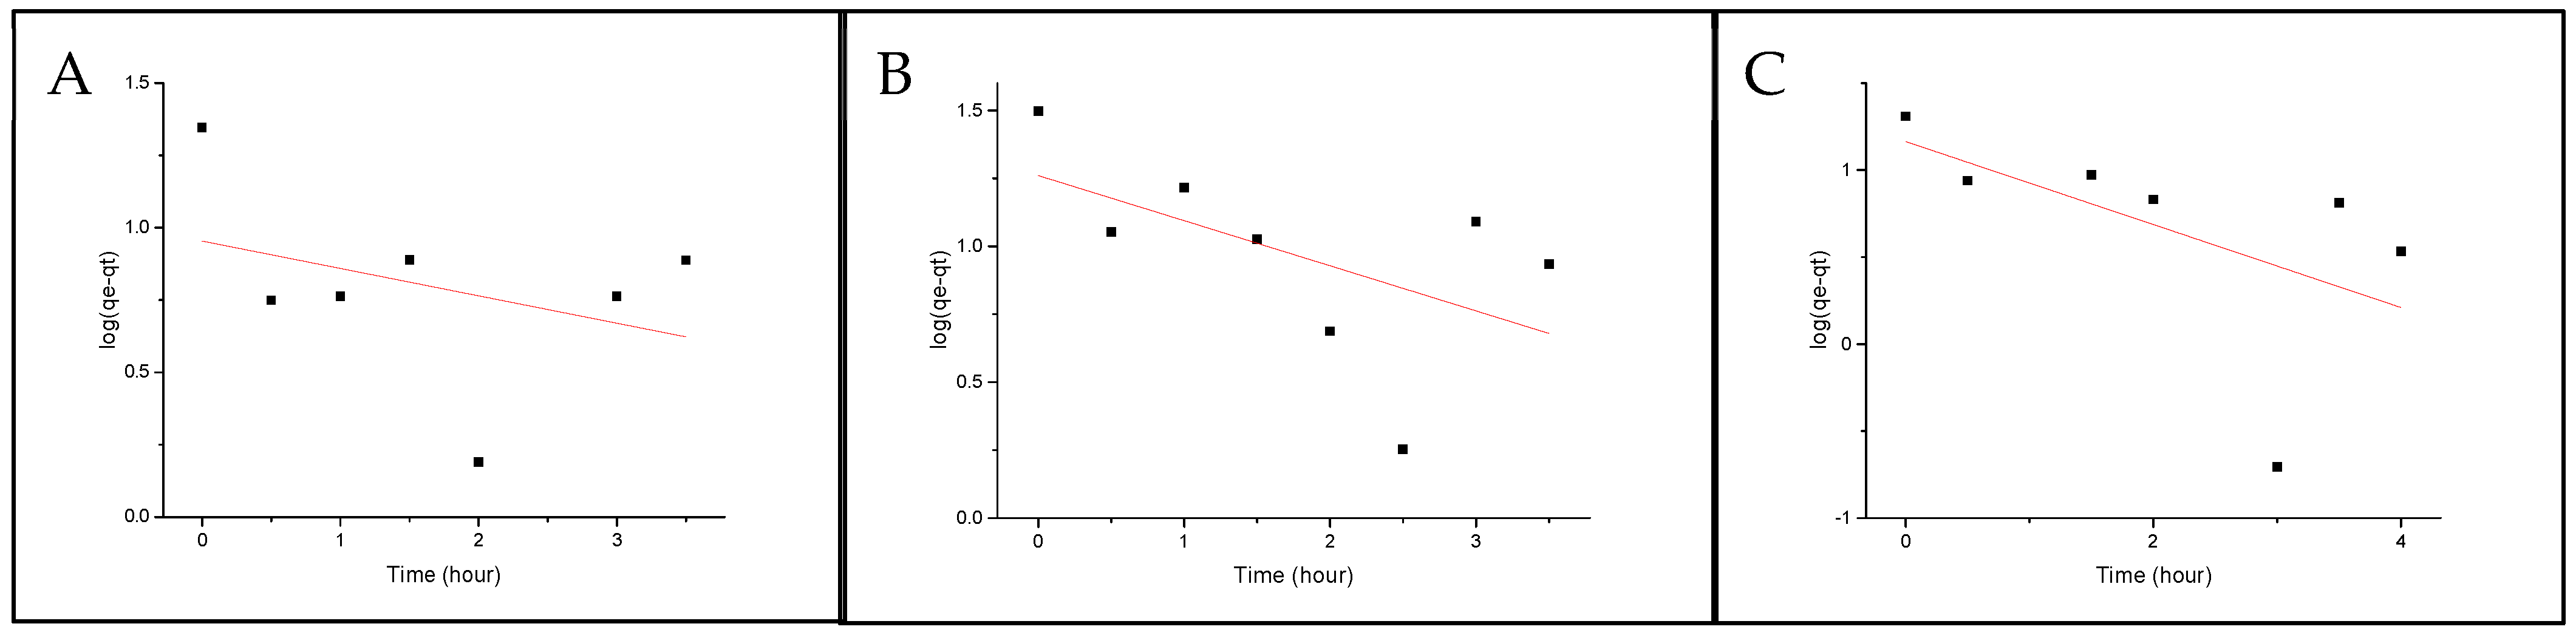
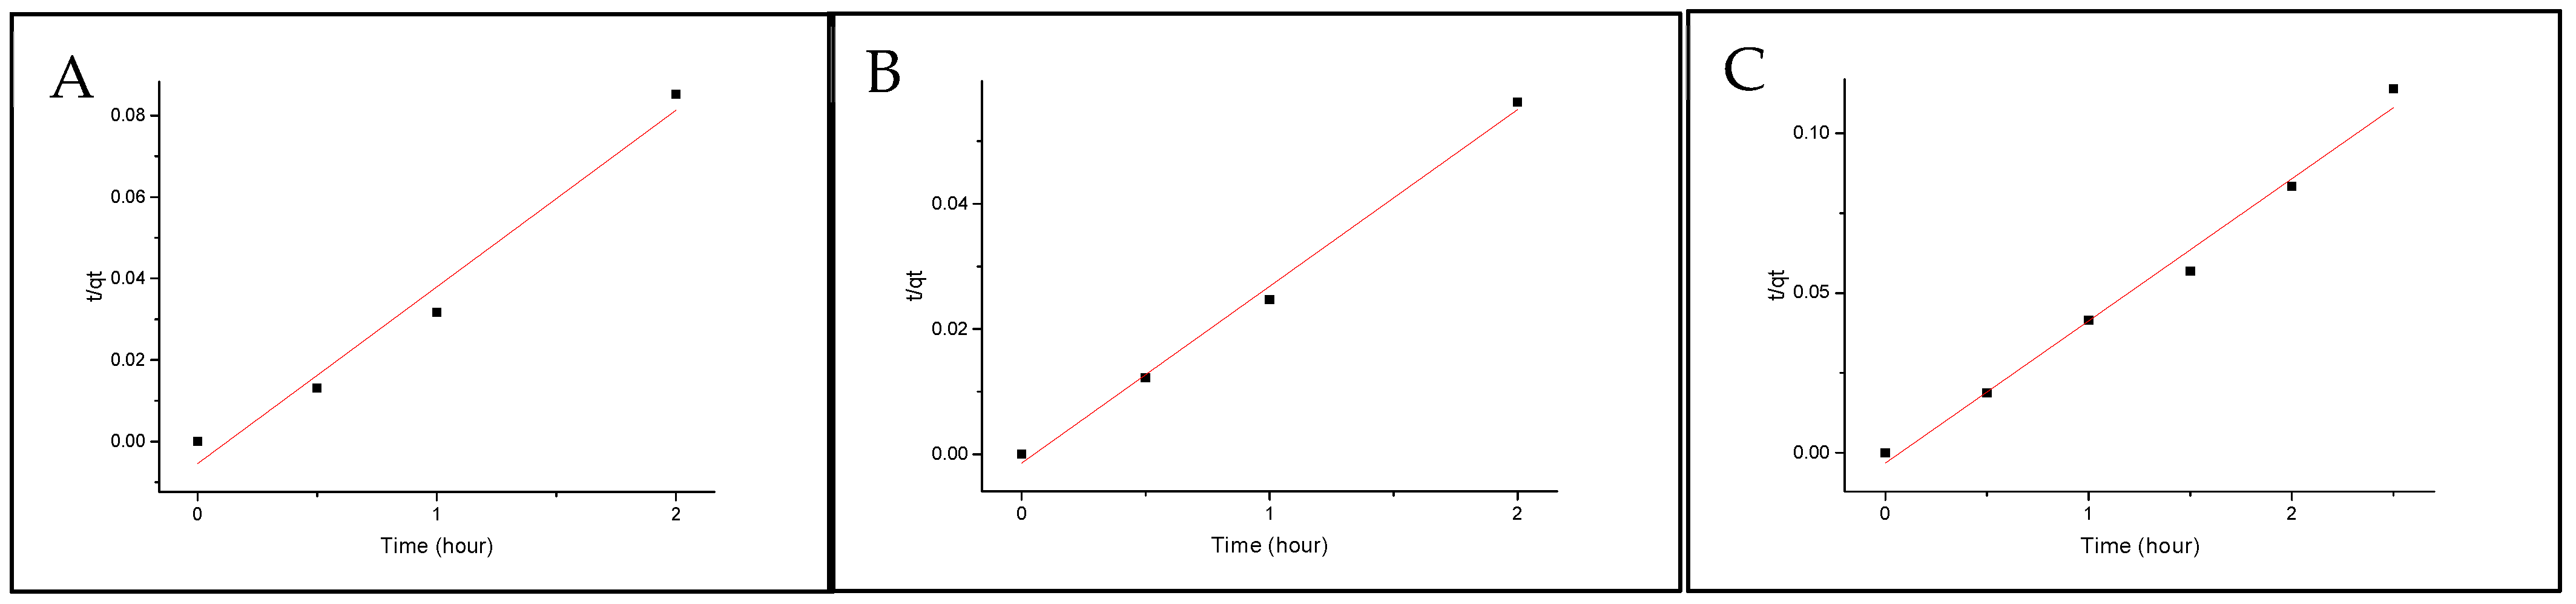
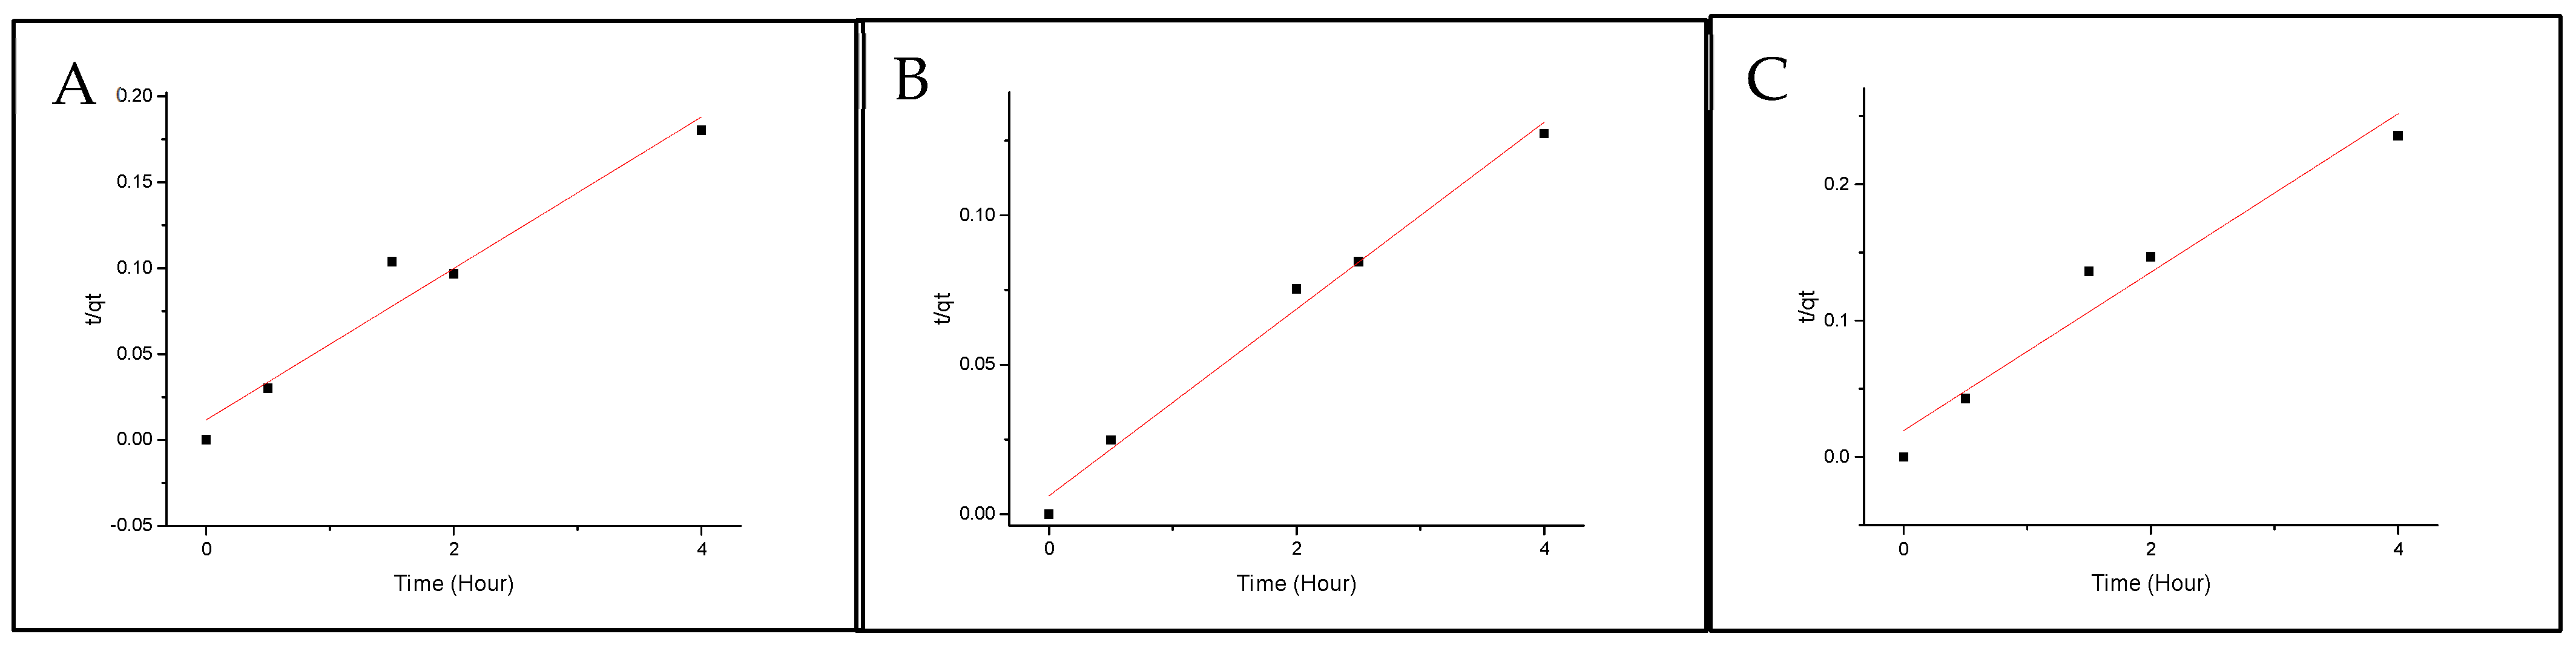
2.4. Sorption Kinetic Modeling

The sorption of the PASHs onto the microplastics was further analyzed using pseudo-first-order and pseudo-second-order fittings. Both fittings are commonly used to understand the mechanisms driving the sorption. The sorption uptakes established an equilibrium that was further proven by the statistical equivalence of the last two time points.
When the sorption behavior follows pseudo-first-order, adsorption occurs through diffusion [21]. Pseudo-first-order is represented by Equation (2).
log q e q p = log q e q , 1 k 1 2.303 t
where qe = mass on the pellet at equilibria (ng/g), qp = mass on pellet after exposure time (ng/g), qeq,1 =mass on the pellet at equilibria, determined by the pseudo-first-order model, and k1 = rate constant for the pseudo-first-order model. Figure 3 and Figure 4 show the fittings for both Nylon 11 and Nylon 6,12. None of the isomers show any linearity with the model; therefore, it can be concluded that the absorption mechanism is not diffusion-based.
Pseudo-second-order kinetic modeling shows that the absorption rate is dependent on the capacity for sorption and not the concentration of the absorbate [21]. This model is represented by the following equation:
t q t = 1 k 2 q e , m o d e l 2 + 1 q e , m o d e l t
where qe, model is the sorption capacity at equilibrium, qt is the amount of the analyte sorbed at each time point, k2 is the pseudo-second-order rate constant and k2qe is the initial sorption rate. Figure 5 and Figure 6 show the fitting for both Nylon 6,12 and Nylon 11. All the isomers show great linearity, which indicates good agreement with the model.
Table 3 summarizes the rate constants and the initial sorption rates. Nylon 6,12 showed a higher initial sorption rate than Nylon 11. The model predicts that BbN23T will have the highest sorption capacity at equilibrium, which is confirmed by the sorption uptake showing that BbN23T has the largest uptake on the microplastics.

3. Materials and Methods

3.1. Materials and Chemicals

DBT and BbN12T (purity = 99%) were purchased from Sigma Aldrich (Milwaukee, WI, USA). BbN23T (purity > 99%) and BbN12T (purity > 99%) were acquired from the European Commission (Brussels, Belgium). C45T and DiN1212T were both obtained from the National Institute Standards and Technology (NIST) (Gaithersburg, MD, USA) and used as-received. The molecular structures for these compounds are presented in Figure S4.
Nylon 11 and Nylon 6–12 were obtained from Sigma Aldrich as pellets, with particle sizes of 3 mm and 2 mm, respectively. The molecular structures for these compounds are shown in Supplemantal Information Figure S5. Physicochemical properties for both nylons are displayed in Table S4 [22,23,24]. The averaged dimensions of the microplastic pellets used are shown in Table S5.
HPLC-grade n-hexane, n-heptane, n-octane, n-nonane and methanol were acquired from Sigma Aldrich. HPLC-grade heptanol was purchased from Acros Organic (Geel, Belgium). HPLC-grade acetonitrile (ACN) was obtained from VWR (Radnor, PA, USA). Nanopure water obtained from a Barnstead Nanopure Infinity (Dubuque, IA, USA) water system was used throughout all the experiments. Waters (Milford, MA, USA) Sep-Pak Plus C-18 cartridges were used on a vacuum manifold.

3.2. Stock Preparation

Stock solutions of PASHs were prepared with the following solvents: n-heptane (DBT) n-octane (BbN12T, BbN21T, C45T and DiN1212T) and n-nonane (BbN23T). All stock solutions were kept in the dark at 4 °C. Working solutions of pure PASHs were prepared daily via evaporation of the n-alkane solvent under a gentle stream of nitrogen gas (100% purity). In all cases, the reconstituting solvent was ACN.

3.3. HPLC Analysis

All PASHs concentrations were monitored via high-performance liquid chromatography (HPLC) with an HPLC system from Hitachi (San Jose, CA, USA). Its main components were an L-7100 mobile phase pump, an L-7485 fluorescence detector and an L-761 on-line degasser. The entire system was computer-controlled with D-7000 HPLC Software Manager. All separations were made using a Zorbax Eclipse PAH column with a 4.6 mm length, 250 mm diameter and 5 μm average particle diameters. All sample injections were held constant at 20 μL using a fixed-volume injection loop. Laboratory reagent blanks were run with each series of samples under identical experimental conditions. Supplemantal Information Table S1 shows the wavelengths used during the HPLC analysis.

3.4. Solution Preparation for HPLC Analytical Figures of Merit

Calibration curves were constructed with synthetic mixtures containing DBT, BbN12T, BbN21T, C45T, BbN23T and DiN1212T at various concentrations. All the mixtures were made in 100% ACN to match the mobile phase selected for HPLC. This was accomplished by evaporation of the n-alkane PASH solvent under a gentle stream of nitrogen gas and reconstitution with ACN.

3.5. Preparation for SPE-HPLC Analytical Figure of Merit

Synthetic mixtures containing DBT, BbN12T, BbN21T, C45T, BbN23T and DiN1212T were prepared for the experiments with PASHs concentrations varying from 25 to 100 parts per trillion. The solvent composition of all the mixtures was 99.5% H2O/0.5% ACN. This was accomplished by spiking 100 mL of H2O with microliter volumes of PASHs solutions in ACN. SPE followed the procedure outlined in Supplemantal Information Figure S3.

3.6. Sorption Experiments

Synthetic mixtures for these experiments contained BbN12T, BbN23T and BbN21T, with final concentrations at the 50 pg/mL level. Their solvent composition was 99.5% H2O/0.5% ACN. This was accomplished by spiking 100 mL of H2O with microliter volumes of PASHs solutions in ACN. Six (6) pellets of each plastic consisting of approximately 150 mg of Nylon 11 and 100 mg of Nylon 6,12 were added to 100 mL of the aqueous solution and shaken for various exposure times, which ranged from 0.5 h to 4 h. An SPE-HPLC analysis of the aqueous solution was conducted at 0.5, 1, 1.5, 2, 2.5, 3, 3.5 and 4 h. An SPE-HPLC analysis of synthetic mixtures shaken in the absence of microplastics was run in parallel at all time intervals.

4. Conclusions

The SPE-HPLC method developed in these studies makes it possible to determine PASH in aqueous solutions at pg/mL concentration levels. To reach such low concentration levels, excitation and fluorescence wavelengths were optimized for each of the studied fluorophores. By doing so, excellent analytical figures of merit were obtained at relevant environmental concentrations. With the new method, the sorption uptake of benzonaphthothiophene isomers onto nylon microplastics was demonstrated for the first time. In all cases, the nylon type and the isomer structure played a role in the sorption uptake, which followed pseudo-second-order kinetics. Our findings, therefore, indicate that the interaction of PASH with microplastics in aquatic environments deserves more attention from both the remediation and the toxicological perspectives.

Supplementary Materials

The following supporting information can be downloaded at: https://www.mdpi.com/article/10.3390/molecules29071653/s1, Figure S1: HPLC-FL Chromatogram of the PASH. All PASH concentration is 50 ng/mL. Table S1: Summary of Fluorescence wavelengths used for HPLC Detection; Figure S2: Summary of SPE method used in this study; Figure S3: HPLC-FL Chromatogram following SPE extraction procedure, where the concentration of all PASH were 25 pg/mL prior to extraction.; Table S2: Values used for the calculation of the maximum sorption uptake with corresponding standard deviations; Equation (S1)–(S3) Error Propagation; Table S3: Maximum Sorption Uptake Masses and Statistical Comparison, Figure S4: Structures of PASH used in this study; Figure S5: Structures of Nylon 11 and Nylon 6,12 used in this study; Table S4: Physicochemical Properties for Nylon 11 and Nylon 6,12; Table S5: Dimensions of 10 Randomly Selected Nylon Pellets.

Author Contributions

S.D.N.: conduction of research via performance of experiments; data collection; data analysis; first draft writing. A.D.C.: formulation of research goals and aims; development of methodology; management of research activity planning and execution; writing review. All authors have read and agreed to the published version of the manuscript.

Funding

This research received no external funding.

Institutional Review Board Statement

Not applicable.

Informed Consent Statement

Not applicable.

Data Availability Statement

Data is contained within this article and Supplementary Materials.

Conflicts of Interest

The authors declare no conflict of interest.

References

  1. Arthur, C.; Baker, J.; Bamford, H. (Eds.) Proceedings of the International Research Workshop on the Occurrence, Effects and Fate of Micro-Plastic Marine Debris, 9–11 September 2008. NOAA Technical Memorandum NOS-OR&R-30. 2009. Available online: https://marine-debris-site-s3fs.s3.us-west-1.amazonaws.com/s3fs-public/publications-files/TM_NOS-ORR_30.pdf?VersionId=AkHQs2er_rm6MTlJLwSTu35mauQxDuaU (accessed on 12 October 2019).
  2. Wagner, J.; Wang, Z.-M.; Ghosal, S.; Rochman, C.; Gassel, M.; Wall, S. Novel method for the extraction and identification of microplastics in ocean trawl and fish gut matrices. Anal. Methods 2017, 9, 1479–1490. [Google Scholar] [CrossRef]
  3. Gao, F.; Lia, J.; Sun, C.; Zhang, L.; Jiang, F.; Cao, W.; Zheng, L. Study on the capability and characteristics of heavy metals enriched on microplastics in marine environment. Mar. Pollut. Bull. 2019, 144, 61–67. [Google Scholar] [CrossRef] [PubMed]
  4. Costigan, E.; Collins, A.; Hatinoglu, M.D.; Bhagat, K.; MacRae, J.; Perreault, F.; Apul, O. Adsorption of organic pollutants by microplastics: Overview of a dissonant literature. J. Hazard. Mater. Adv. 2022, 6, 100091. [Google Scholar] [CrossRef]
  5. Wang, Y.; Yang, Y.; Liu, X.; Zhao, J.; Liu, R.; Xing, B. Interaction of Microplastics with Antibiotics in Aquatic Environment: Distribution, Adsorption, and Toxicity. Environ. Sci. Technol. 2021, 55, 15579–15595. [Google Scholar] [CrossRef] [PubMed]
  6. Gerdes, Z.; Ogonowski, M.; Nybom, I.; Ek, C.; Adolfsson-Erici, M.; Barth, A.; Gorokhova, E. Microplastic-mediated transport of PCBs? A depuration study with Daphnia magna. PLoS ONE 2019, 14, e0205378. [Google Scholar] [CrossRef] [PubMed]
  7. Qui, Y.; Zheng, M.; Wang, L.; Zhao, L.; Lou, Y.; Shi, L.; Qu, L. Sorption of polyhalogenated carbazoles (PHCs) to microplastics. Mar. Pollut. Bull. 2019, 146, 718–728. [Google Scholar] [CrossRef]
  8. Wang, F.; Zhang, M.; Sha, W.; Wang, Y.; Hao, H.; Dou, Y.; Li, Y. Sorption Behavior and Mechanisms of Organic Contaminants to Nano and Microplastics. Molecules 2020, 25, 1827. [Google Scholar] [CrossRef]
  9. NOAA, Technical Memorandum NMFS-NWFSC-125 Northwest Fisheries Science Center’s Analyses of Tissue, Sediment, and Water Samples for Organic Contaminants by Gas Chromatography/mass Spectrometry and Analyses of Tissue for Lipid Classes by Thin Layer Chromatography/flame Ionization Detection. Washington, DC, USA. 2014. Available online: https://repository.library.noaa.gov/view/noaa/4626 (accessed on 12 October 2019).
  10. European Commission, Priority Substances and Certain Other Pollutants According to Annex II of Directive 2008/105/EC. 2019. Available online: https://ec.europa.eu/environment/water/water-framework/priority_substances.htm (accessed on 12 October 2021).
  11. EPA United States Environmental Protection Agency. Priority Pollutant List. 2014. Available online: https://www.epa.gov/sites/default/files/2015-09/documents/priority-pollutant-list-epa.pdf (accessed on 12 October 2021).
  12. Eastmond, D.A.; Booth, G.M.; Lee, M.L. Toxicity, Accumulation, and Elimination of Polycyclic Aromatic Sulfur Heterocycles in Daphnia magna. Arch. Environ. Contam. Toxicol. 1984, 13, 105–111. [Google Scholar] [CrossRef]
  13. Siemers, A.K.; Mänz, J.; Wolf-Ulric, P.; Ruck, W. Development and application of a simultaneous SPE-method for polycyclic aromatic hydrocarbons (PAHs), alkylated PAHs, heterocyclic PAHs (NSO-HET) and phenols in aqueous samples from German Rivers. Chemosphere 2015, 122, 105–114. [Google Scholar] [CrossRef] [PubMed]
  14. MacKenzie, M.J.; Hunter, J.V. Sources and fates of aromatic compounds in urban stormwater runoff. Environ. Sci. Technol. 1979, 13, 179–183. [Google Scholar] [CrossRef]
  15. Andrady, A.L. Microplastics in the marine environment. Mar. Pollut. Bull. 2011, 62, 1596–1605. [Google Scholar] [CrossRef] [PubMed]
  16. Ambeed. Available online: https://www.ambeed.com/products/205-43-6.html (accessed on 11 January 2024).
  17. Chemical Properties of Benzo[b]naphtho[2,3-d]thiophene. Chemeo. Available online: https://www.chemeo.com/cid/66-382-5/Benzo-b-naphtho-2-3-d-thiophene (accessed on 11 January 2024).
  18. Chemical Properties of Benzo[b]naphtho[2,1-d]thiophene. Chemeo. Available online: https://www.chemeo.com/cid/42-561-2/Benzo-b-naphtho-2-1-d-thiophene (accessed on 11 January 2024).
  19. Farkas, O.; Heberger, K.; Zenkevich, I.G. Quantitative structure-retention relationships. XIV. Prediction of gas chromatographic retention indices for saturated O-, N-, and S heterocyclic compounds. Chemometr. Intell. Lab. Syst. 2004, 72, 173–184. [Google Scholar] [CrossRef]
  20. Wilson, W.B.; Hayes, H.V.; Sander, L.C.; Campiglia, A.D.; Wise, S.A. Normal-phase liquid chromatography retention behavior of polycyclic aromatic sulfur heterocycles and alkyl-substituted polycyclic aromatic sulfur heterocycle isomers on an aminopropyl stationary phase. Anal. Bioanal. Chem. 2018, 410, 1511–1524. [Google Scholar] [CrossRef] [PubMed]
  21. Sahoo, T.R.; Prelot, B. Chapter 7—Absorption Processes for the removal of contaminants from wastewater: The perspective of nanomaterials and nanotechnology. In Nanomaterials for the Detection and Removal of Wastewater Pollutants, 1st ed.; Bonelli, B., Freyria, F.S., Rossetti, I., Sethi, R., Eds.; Elsevier: Amsterdam, The Netherlands, 2020; pp. 161–222. ISBN 9780128184905. [Google Scholar]
  22. Nylon 11. Available online: https://www.sigmaaldrich.com/US/en/product/aldrich/181153#product-documentation (accessed on 17 March 2024).
  23. Nylon 6,12. Available online: https://www.sigmaaldrich.com/US/en/product/aldrich/181145 (accessed on 17 March 2024).
  24. Baldi, L.D.C.; Iamazaki, E.T.; Atvars, T.D.Z. Evaluation of the polarity of polyamide surfaces using the fluorescence emission of pyrene. Dye. Pigment. 2008, 76, 669–676. [Google Scholar] [CrossRef]
Figure 1. Maximum sorption uptake for BbN12T, BbN23T and BbN21T onto Nylon 11 and Nylon 6,12.
Molecules 29 01653 g001
Figure 2. Time taken for maximum sorption to occur of BbN12T, BbN23T and BbN21T onto Nylon 11 and Nylon 6,12.
Molecules 29 01653 g002
Figure 3. Pseudo-first-order fitting onto Nylon 6,12 for (A) BbN12T, (B) BbN23T and (C) BbN21T.
Molecules 29 01653 g003
Figure 4. Pseudo-first-order fitting onto Nylon 11 for (A) BbN12T, (B) BbN23T and (C) BbN21T.
Molecules 29 01653 g004
Figure 5. Pseudo Second Order fitting onto Nylon 6,12 for (A) BbN12T, (B) BbN23T, and (C) BbN21T.
Molecules 29 01653 g005
Figure 6. Pseudo-second-order fitting onto Nylon 11 for (A) BbN12T, (B) BbN23T and (C) BbN21T.
Molecules 29 01653 g006
Table 1. HPLC analytical figures of merit.
PASHRetention Time 1 (min)LOD 2 (ng/mL)LOQ 3 (ng/mL)LDR 4 (ng/mL)% RSD 5
DBT3.87 ± 0.0220.93.03.0–2005.64
BbN12T5.68 ± 0.0780.30.90.9–2003.53
BbN23T7.07 ± 0.1350.20.80.8–2000.30
BbN21T8.78 ± 0.1960.30.90.9–2001.94
C45T13.24 ± 0.346 0.51.81.8–2004.10
DiN1212T26.33 ± 0.8680.72.22.2–2003.75
1 Retention times are the average of three sample injections; sample volume = 20 µL. 2 Limit of detection (LOD) was calculated using LOD = 3SB/m, where SB is the standard deviation of the blank using the following formula: 1/5 (NoisemaxNoisemin). The noise was recorded for 0.5 min at the base peak of each chromatographic peak. 3 Limit of quantitation (LOQ) was calculated using LOQ = 10SB/m. 4 Linear Dynamic Range (LDR), in ng/mL, extends from the LOQ to an arbitrarily chosen upper linear concentration. 5 Relative Standard Deviation (RSD) = S/I × 100, where I is the average intensity and S is the standard deviation of the intensity calculated from three measurements at the middle concentration.
Table 2. SPE−HPLC analytical figures of merit.
PASHRetention Time 1
(min)
LOD 2
(pg/mL)
LOQ 3
(pg/mL)
LDR 4
(pg/mL)
RSD 5
(%)
Analytical Recovery 6
(%)
DBT3.73± 0.0150.050.20.2–755.090.5 ± 3.1
BbN12T5.57 ± 0.12031010–751.1101.6 ± 1.4
BbN23T7.02 ± 0.1250.722–1003.088.2 ± 3.4
BbN21T8.72 ± 0.1590.622–1003.977.0 ± 2.7
C45T13.11 ±0.405288–757.468.5 ± 4.1
DiN1212T25.89 ± 0.674277–751.169.9 ± 2.5
1 Retention Times are the average of three sample injections; sample volume = 20 µL. 2 Limit of detection (LOD) was calculated using LOD = 3SB/m, where SB is the standard deviation of the blank using the following formula: 1 5 N o i s e m a x N o i s e m i n . The noise was recorded for 0.5 min at the base peak of each chromatographic peak. 3 Limit of quantitation (LOQ) was calculated using LOQ = 10SB/m. 4 Linear Dynamic Range (LDR) in ng/mL; extends from the LOQ to an arbitrarily chosen upper linear concentration. 5 Relative Standard Deviation (RSD) = S/I × 100, where I is the average intensity and S is the standard deviation of the intensity calculated from three measurements at the middle concentration. 6 Analytical recoveries (AR) were calculated with the formula AR = CS/CM × 100, where Cs is a medium linear concentration of the standard submitted to the entire experimental procedure and CM is the concentration obtained with the method. The reported values are the averages of three experimental runs.
Table 3. Pseudo-second-order fitting parameters.
Type of MicroplasticsPASHsR2 a q e , m o d e l  b
(ng/g)
k 2 q e , m o d e l 2  c
(ng/g) × h
k 2  d
(g/ng) × h
Nylon 6,12BbN12T0.977823.87181.80.3191
BbN23T0.995335.46714.30.5681
BbN21T0.994924.3911111.8676
Nylon 11BbN12T0.997522.52217.40.4287
BbN23T0.989531.95163.90.1606
BbN21T0.951517.2151.810.1749
a R2 = Correlation coefficient obtained by fitting data to the pseudo-second-order model. b qe,model = PASHs-sorbed amount at equilibrium obtained from the pseudo-second-order model fitting using Equation (2). c  k 2 q e , m o d e l 2   = initial sorption rate, obtained from the intercept of Equation (2). d k2 = Rate constant of the pseudo-second-order model, obtained from the intercept of pseudo second-order model’s Equation (2).
Disclaimer/Publisher’s Note: The statements, opinions and data contained in all publications are solely those of the individual author(s) and contributor(s) and not of MDPI and/or the editor(s). MDPI and/or the editor(s) disclaim responsibility for any injury to people or property resulting from any ideas, methods, instructions or products referred to in the content.

