
Use of Residual Malt from an Artisanal Beer Brewing Process in the Biosynthesis of Silver Nanoparticles Mediated by Nucleating and Structure-Directing Agents


 , , , , ,
Abstract
:1. Introduction
2. Results
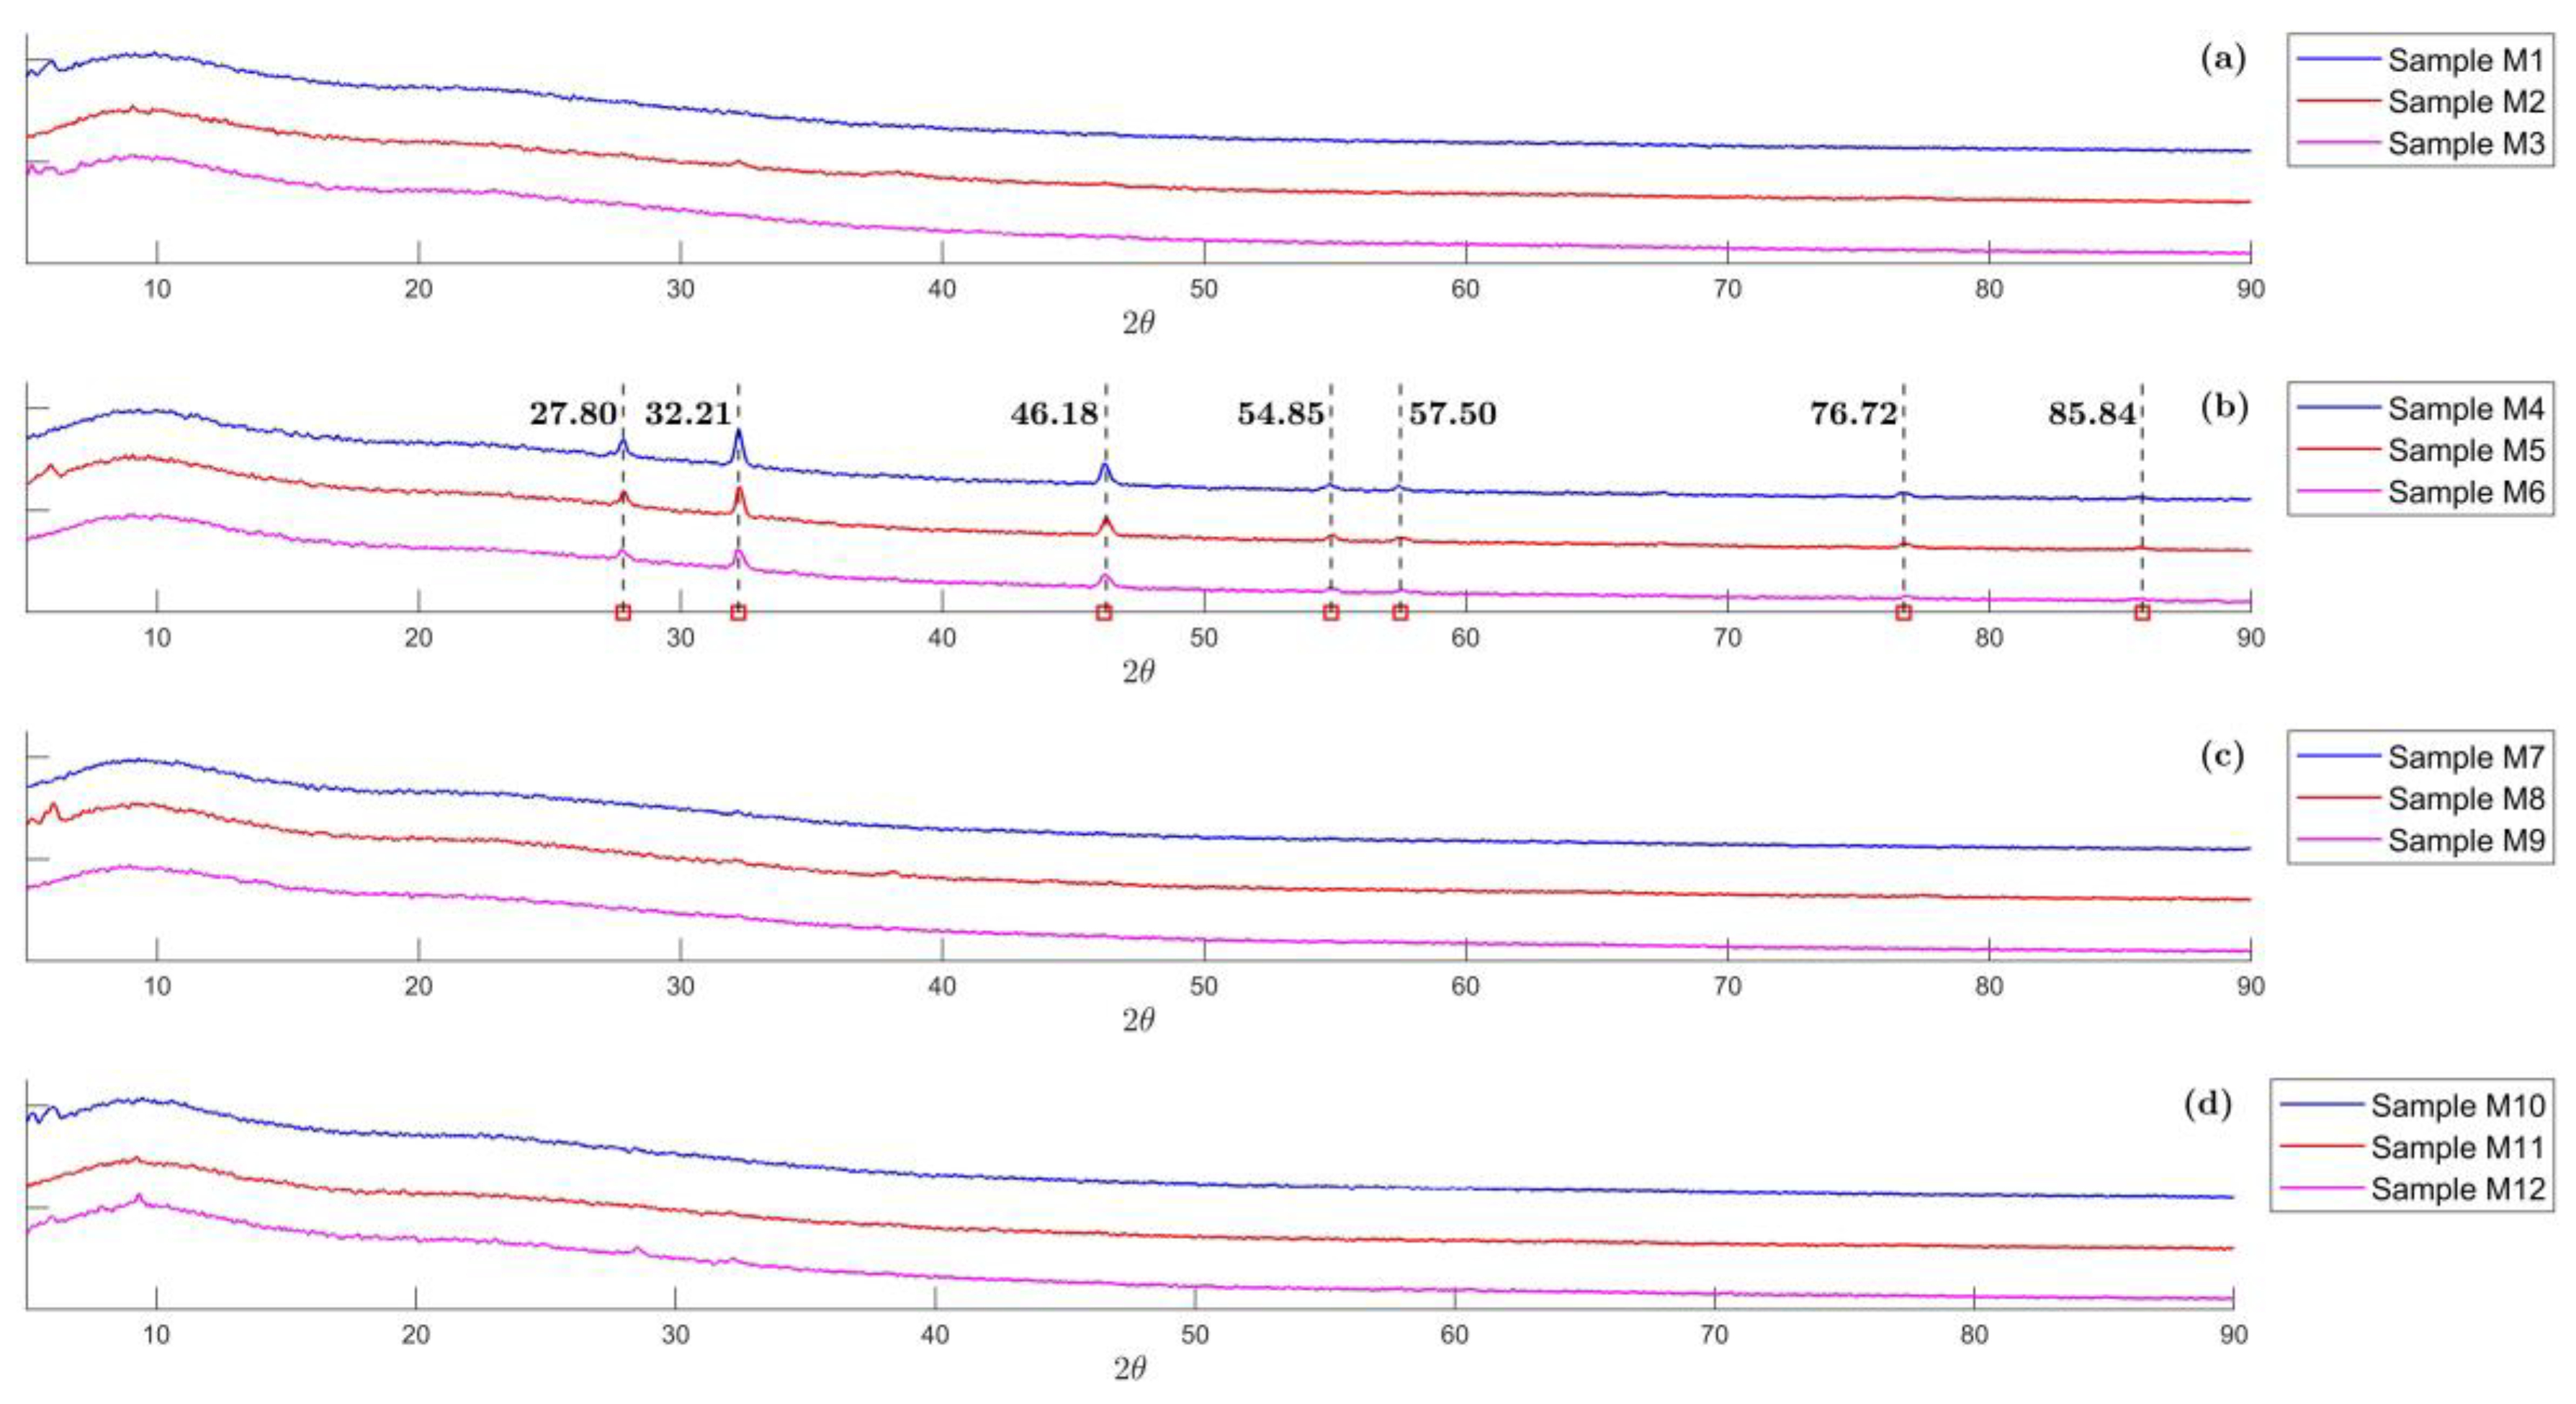
2.1. XRD Analysis
2.2. DLS Analysis
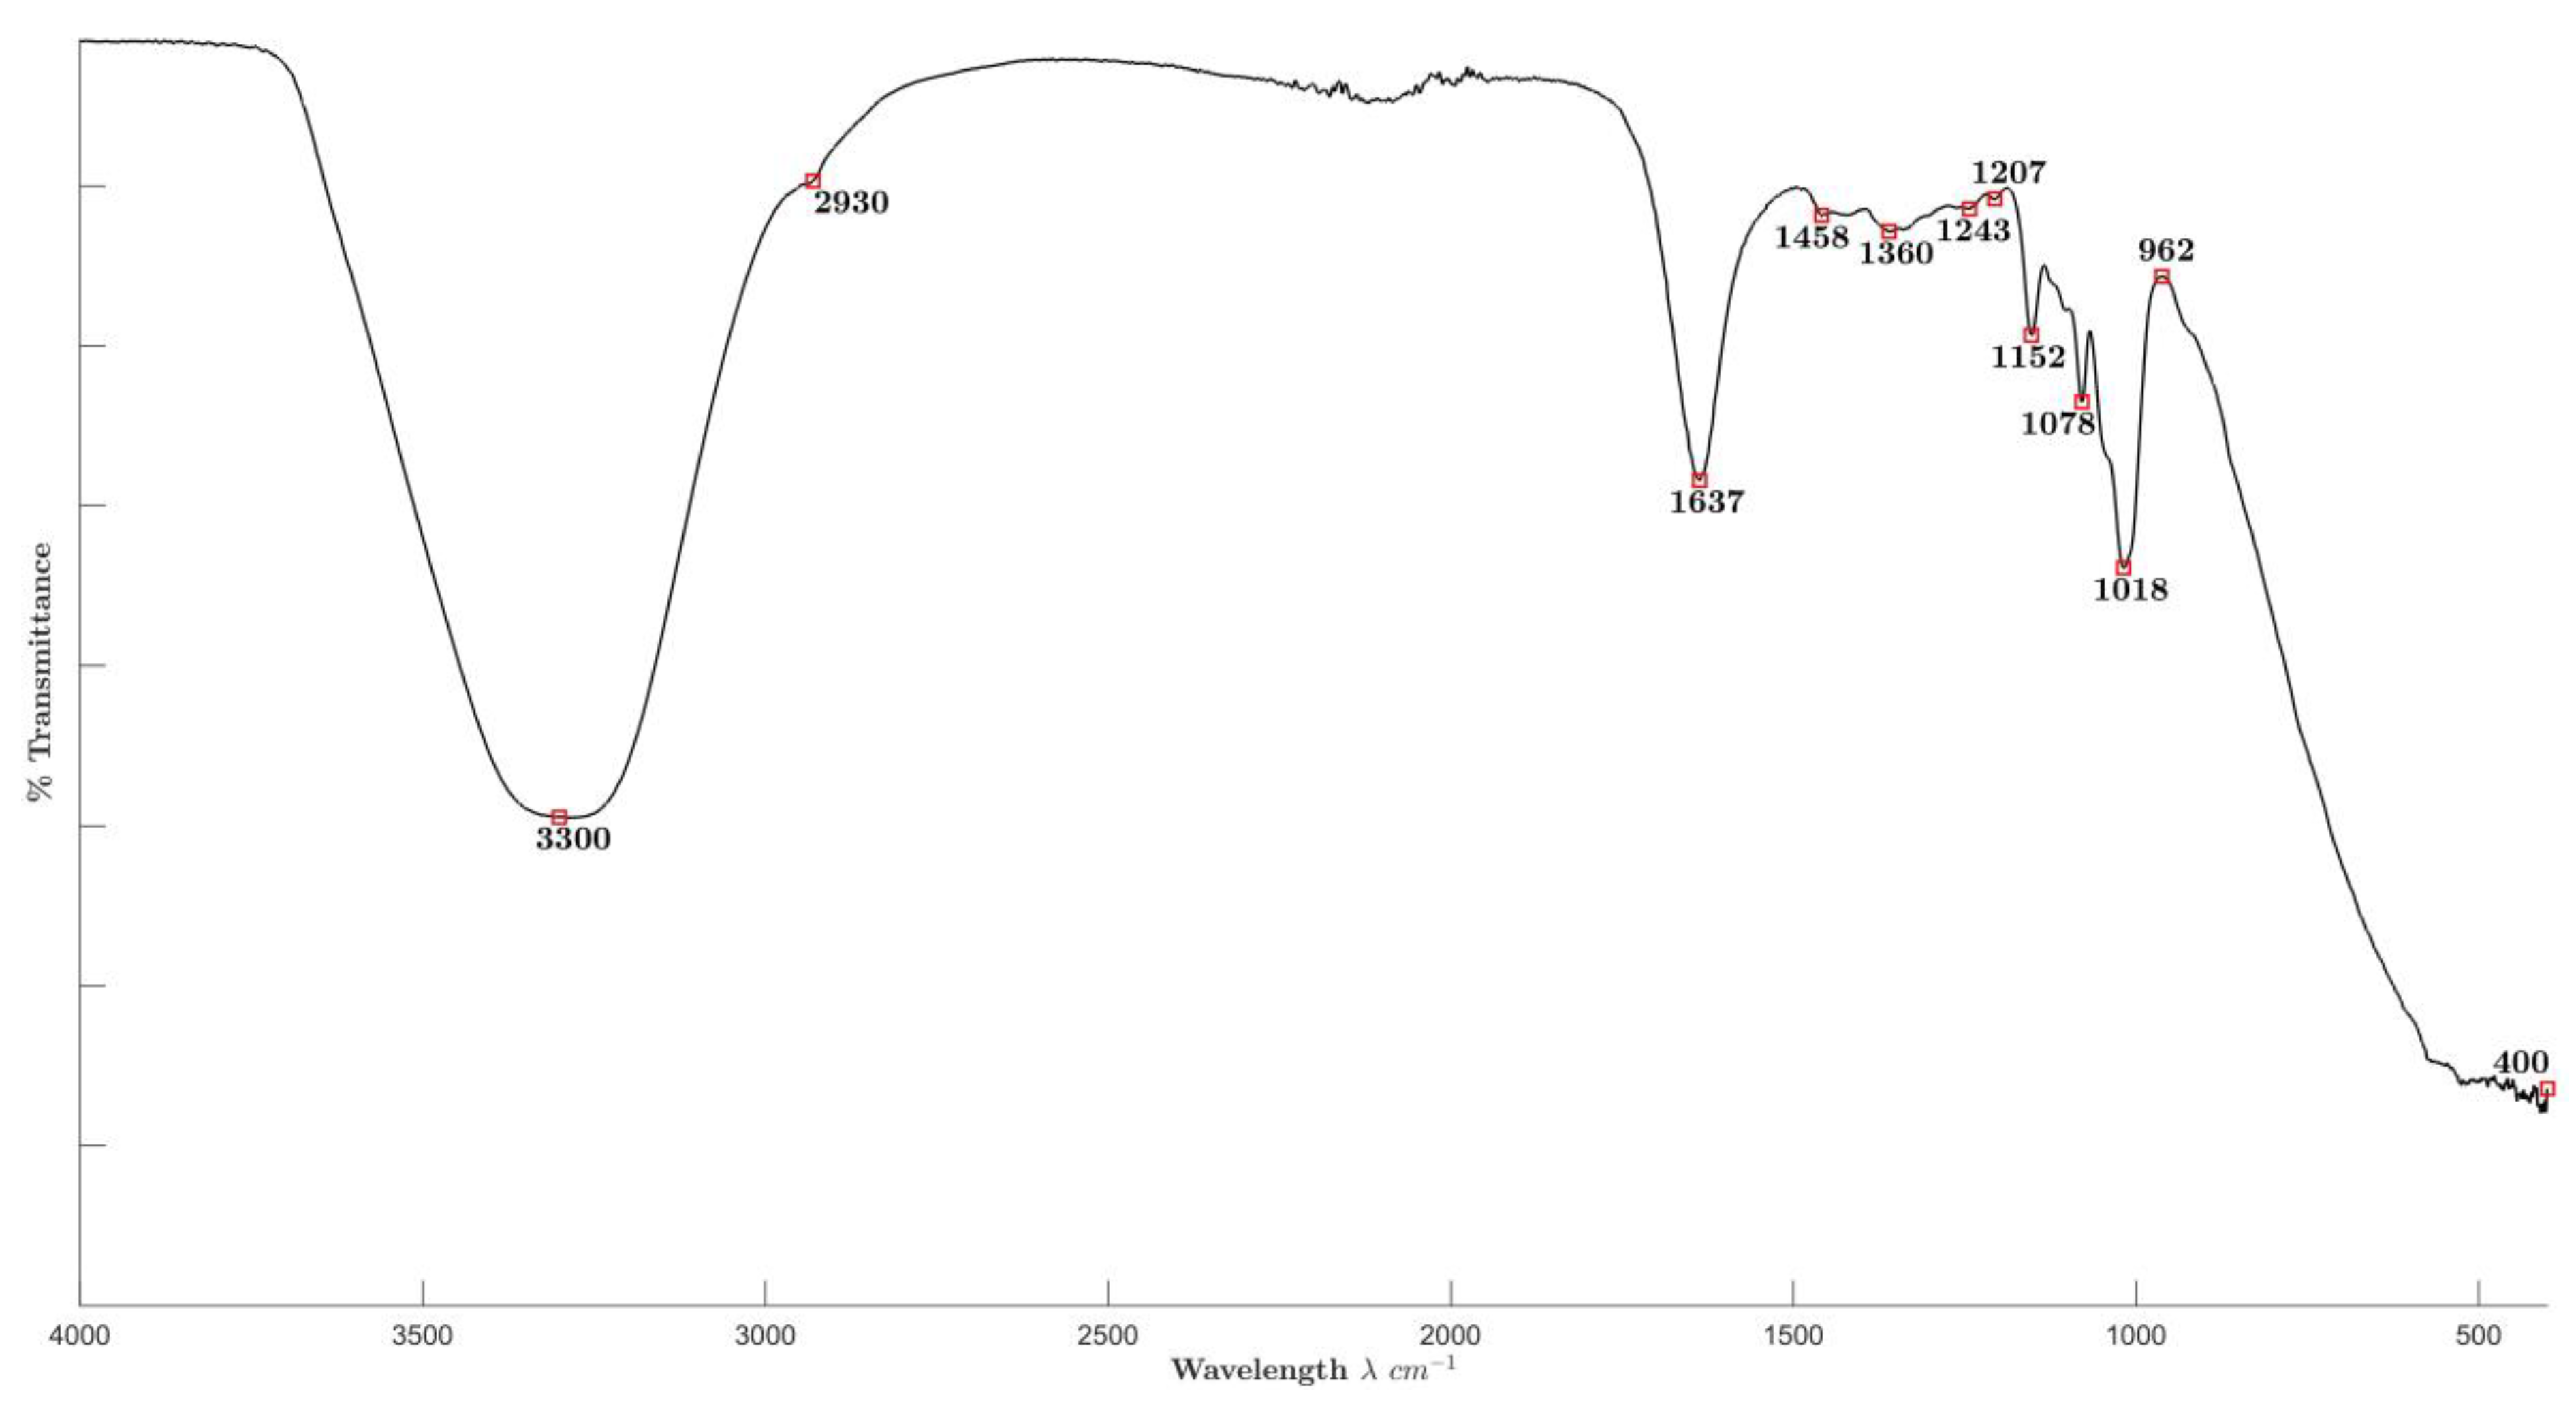
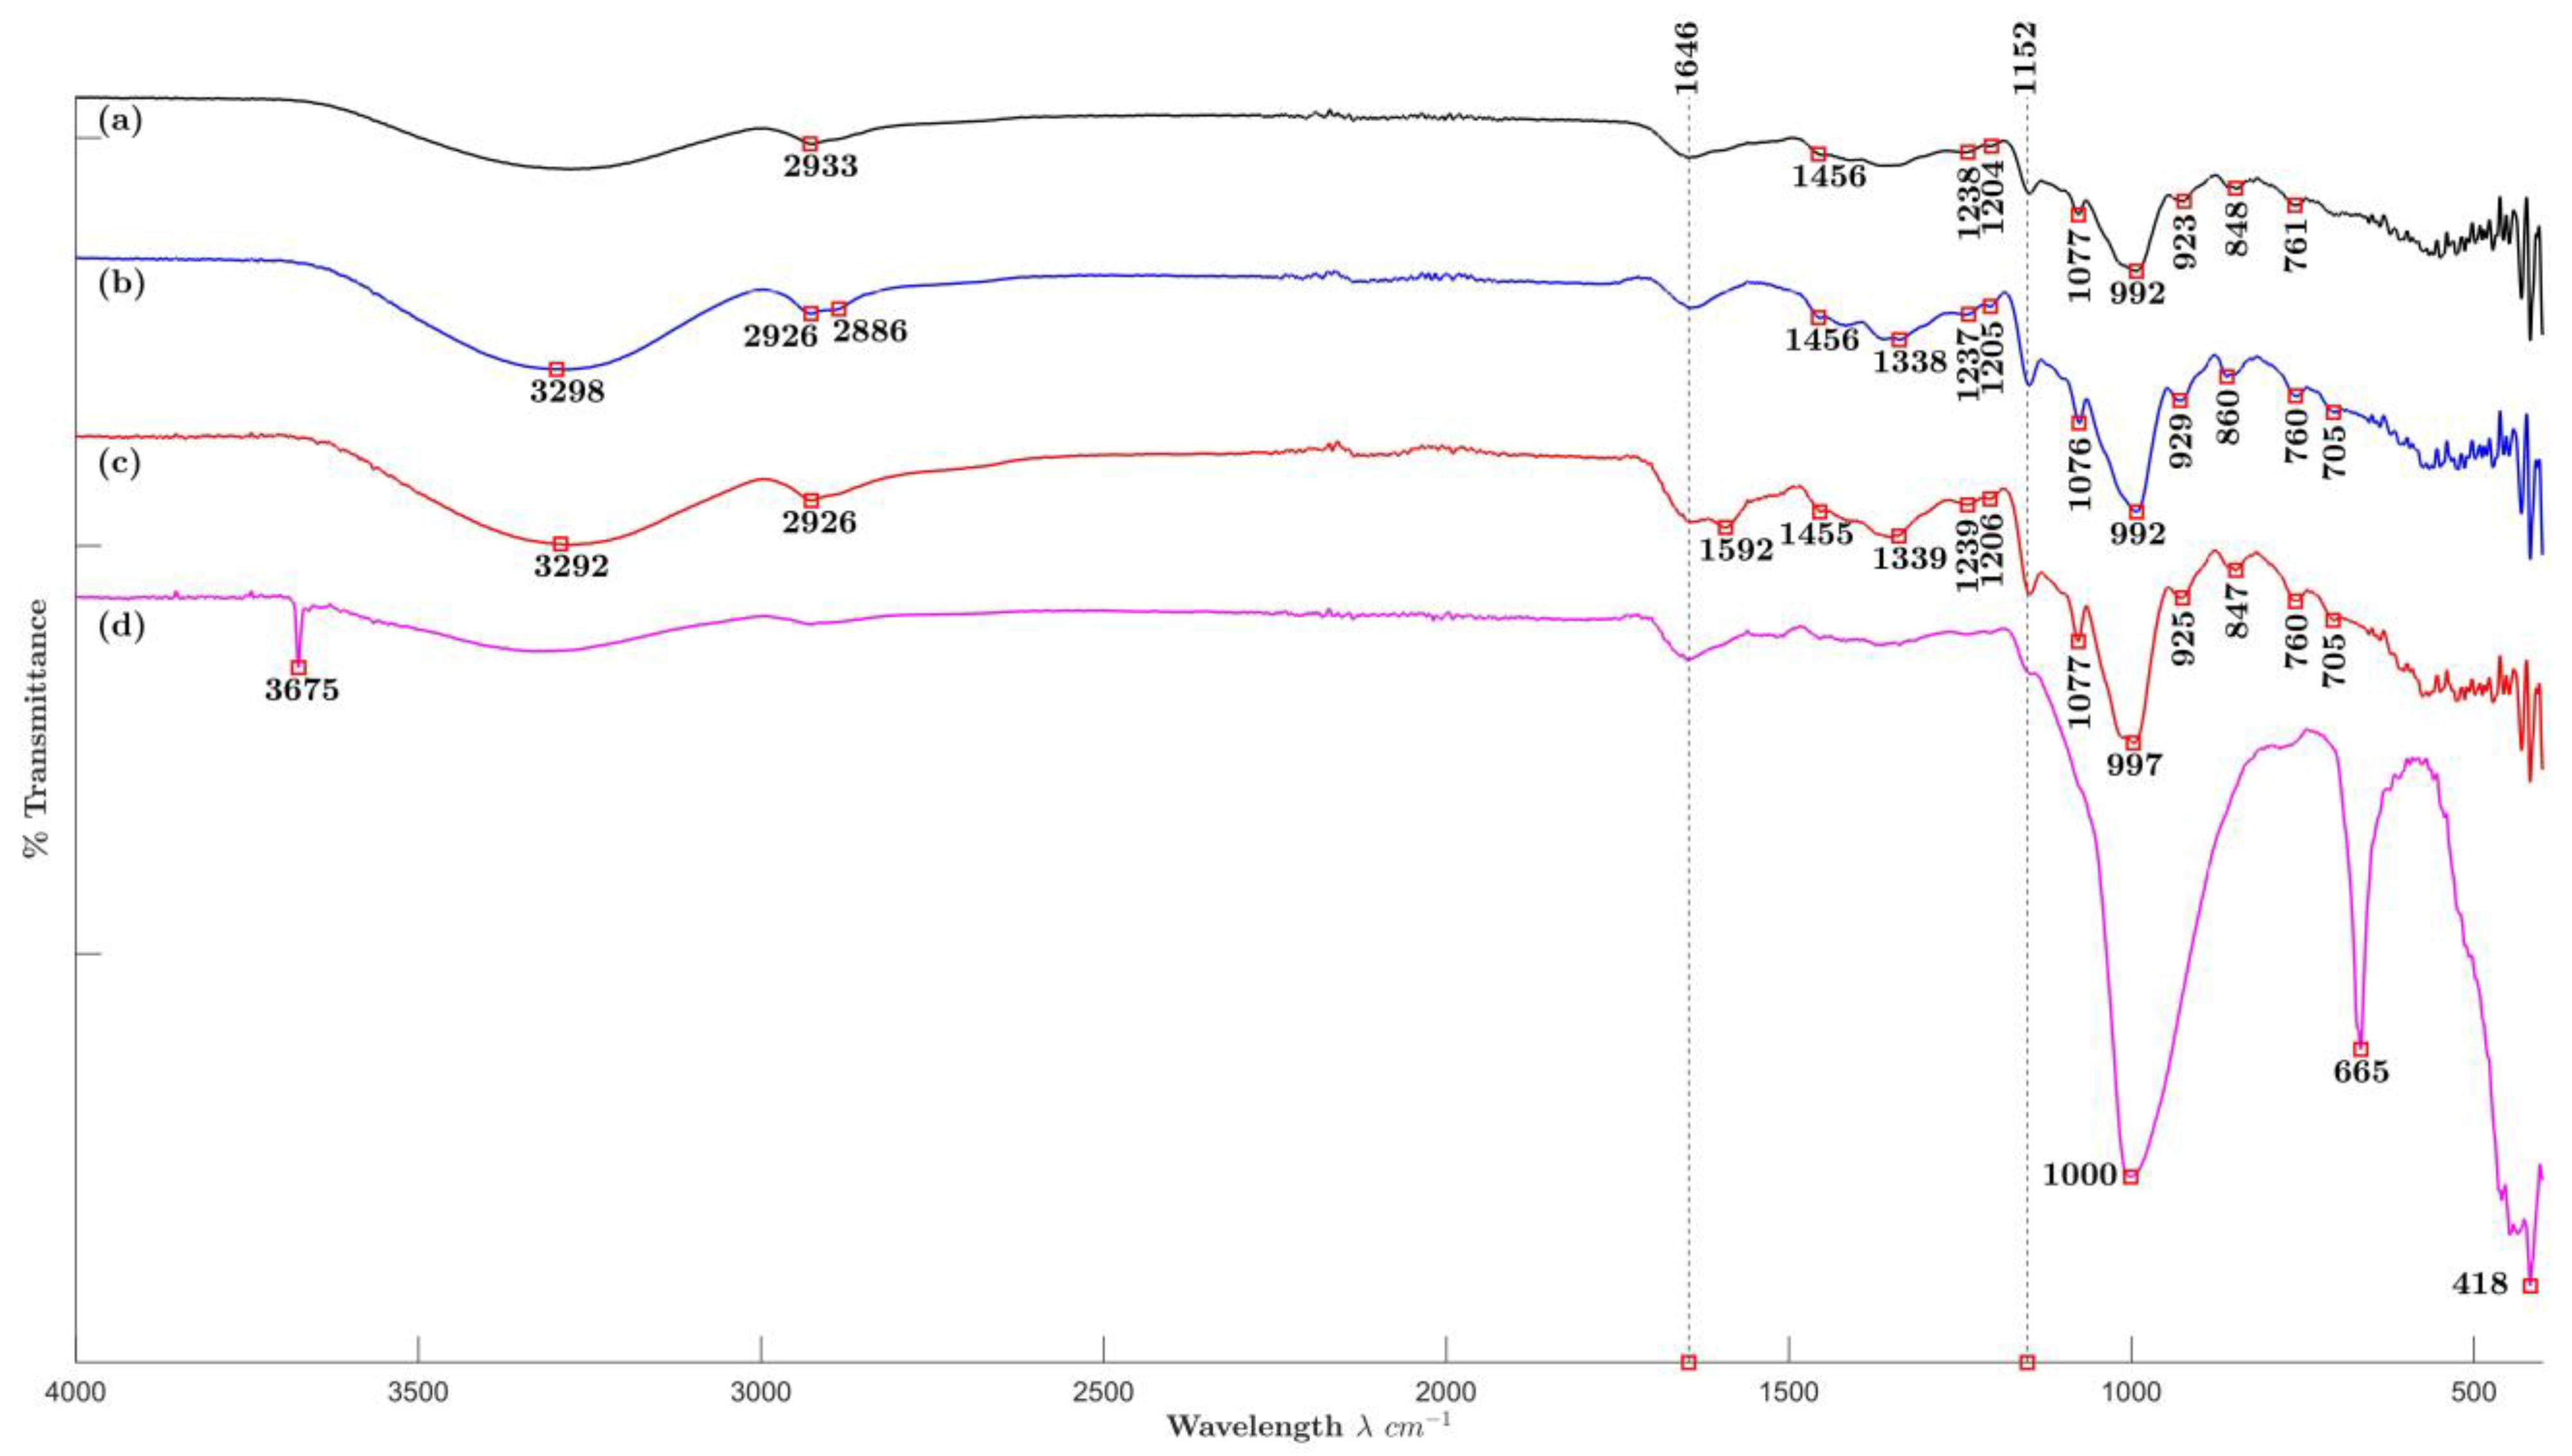
2.3. FTIR Analysis
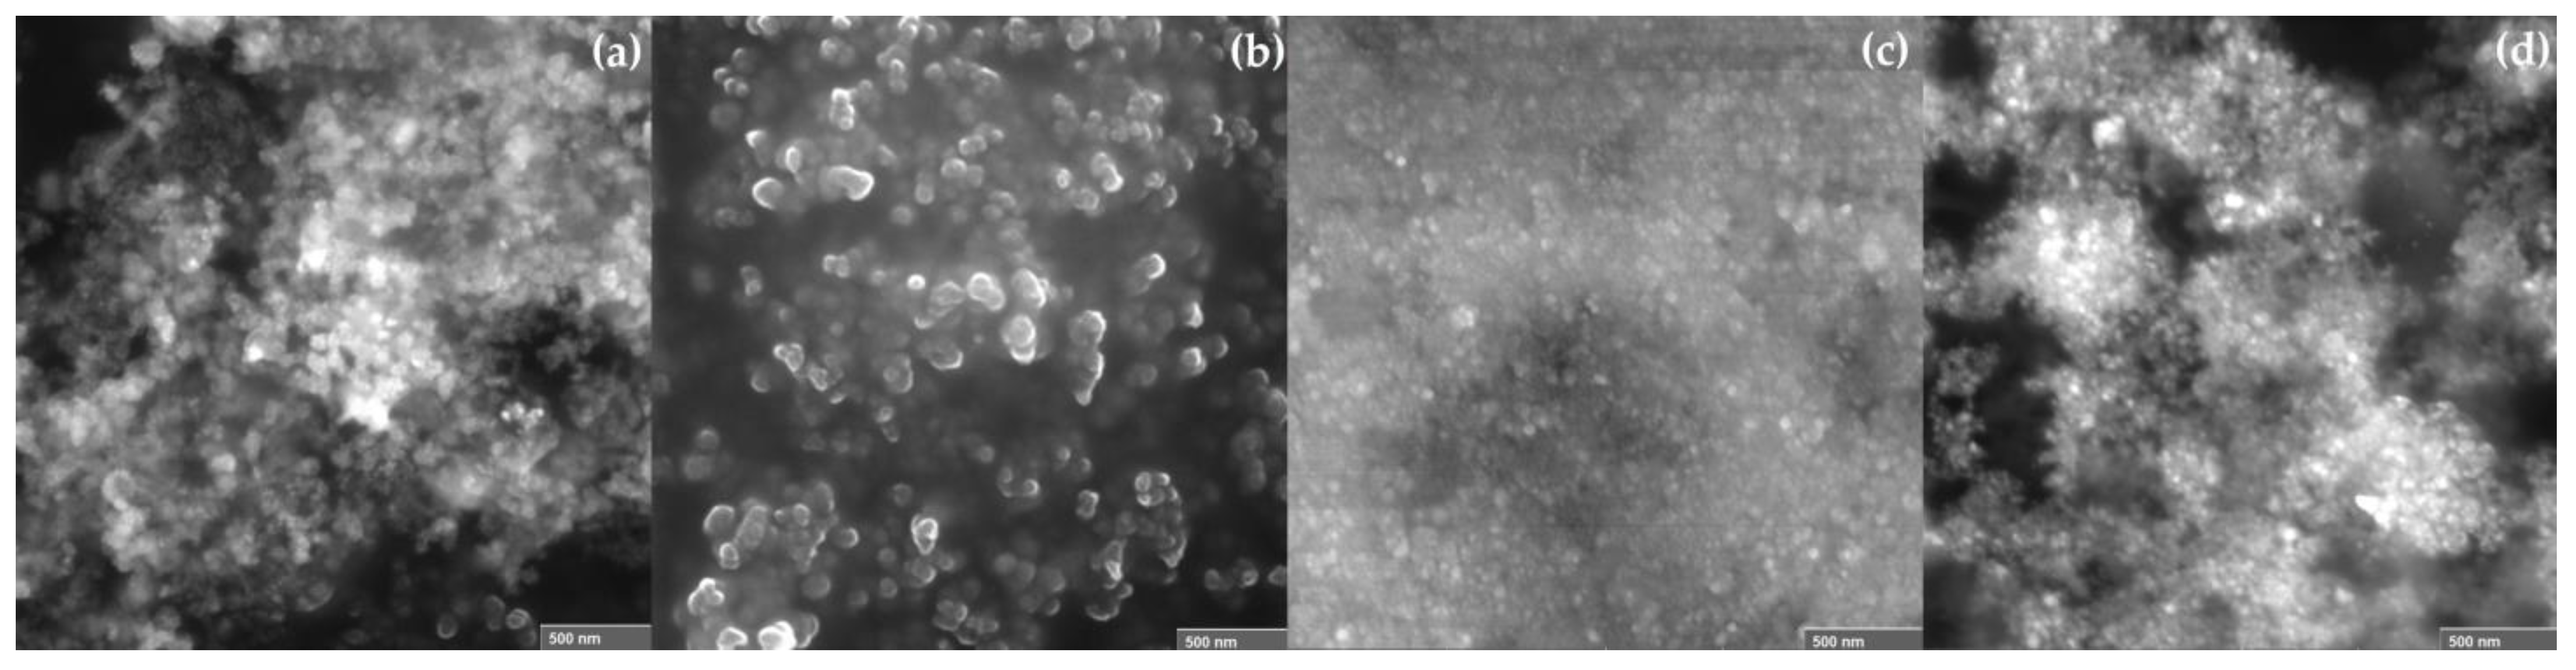
2.4. SEM Analysis
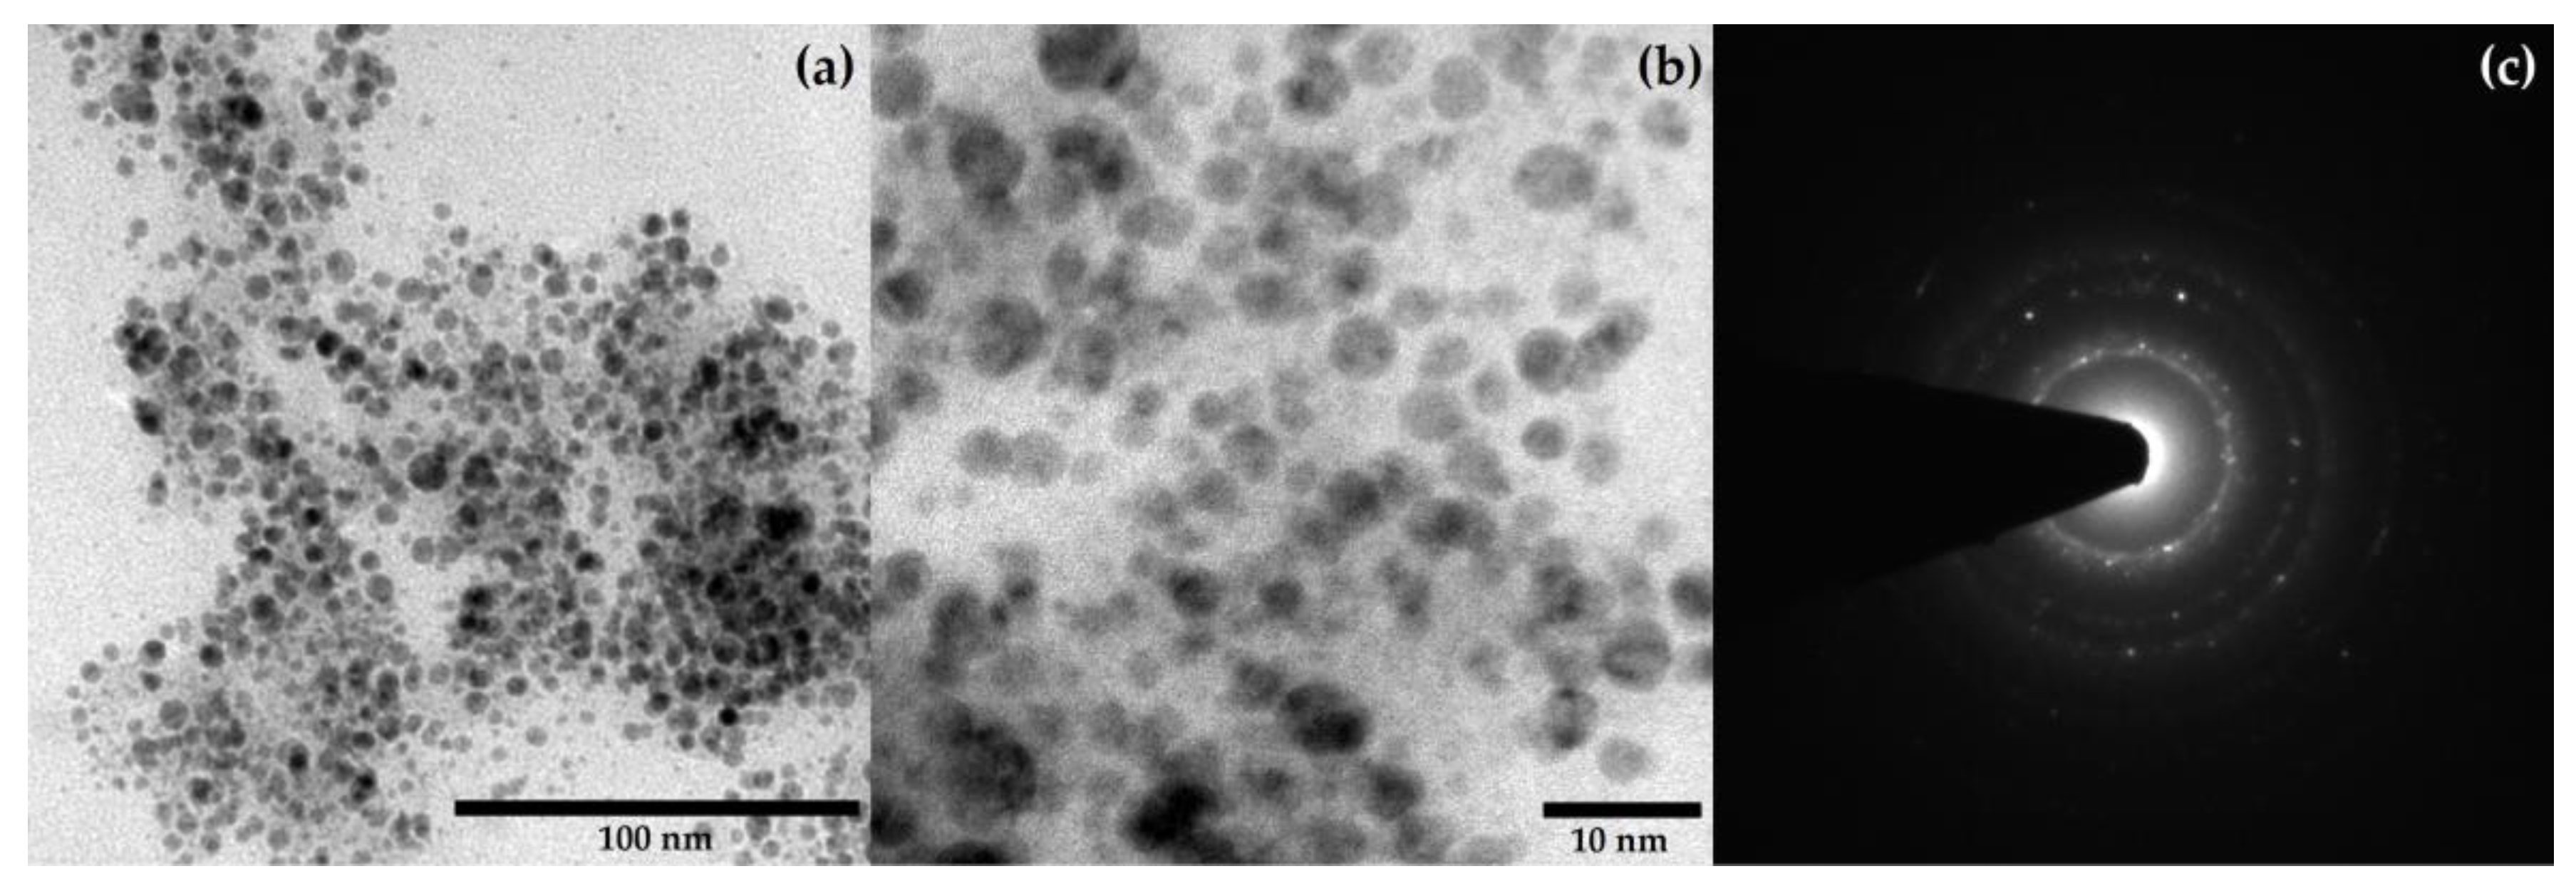
2.5. TEM Analysis
2.6. HPLC Analysis of ME before and after AgNP Biosynthesis
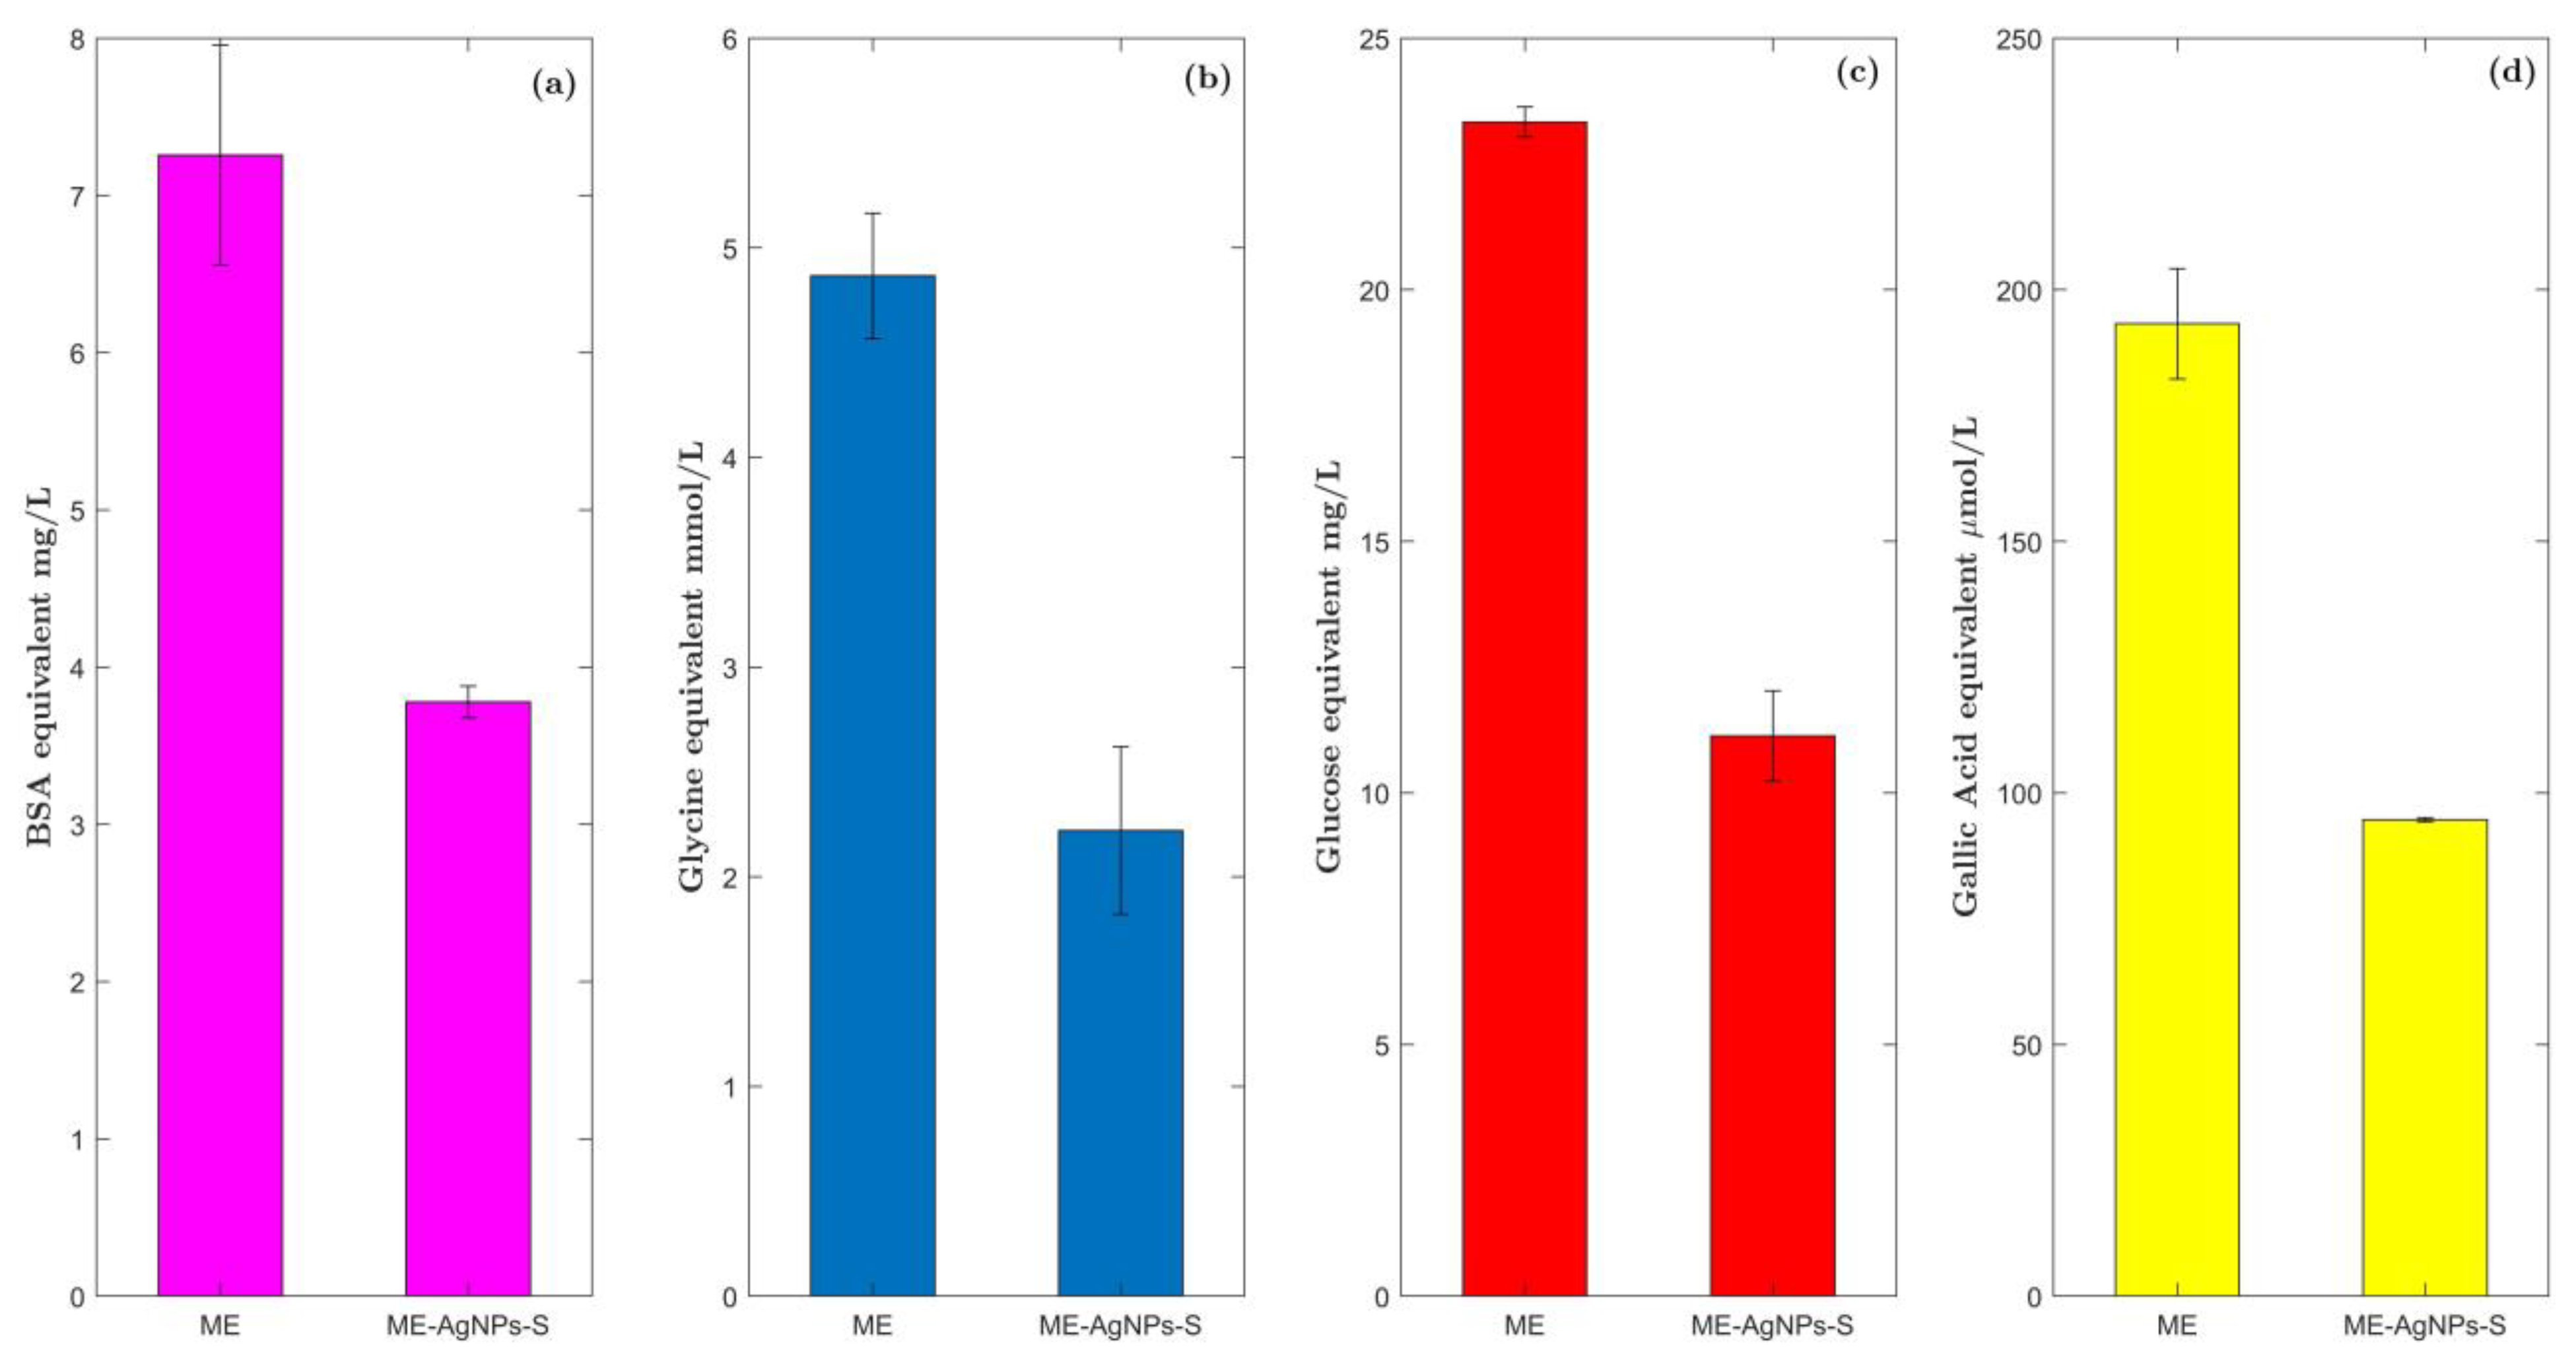
2.7. Phytochemical Screening of ME before and after AgNP Biosynthesis
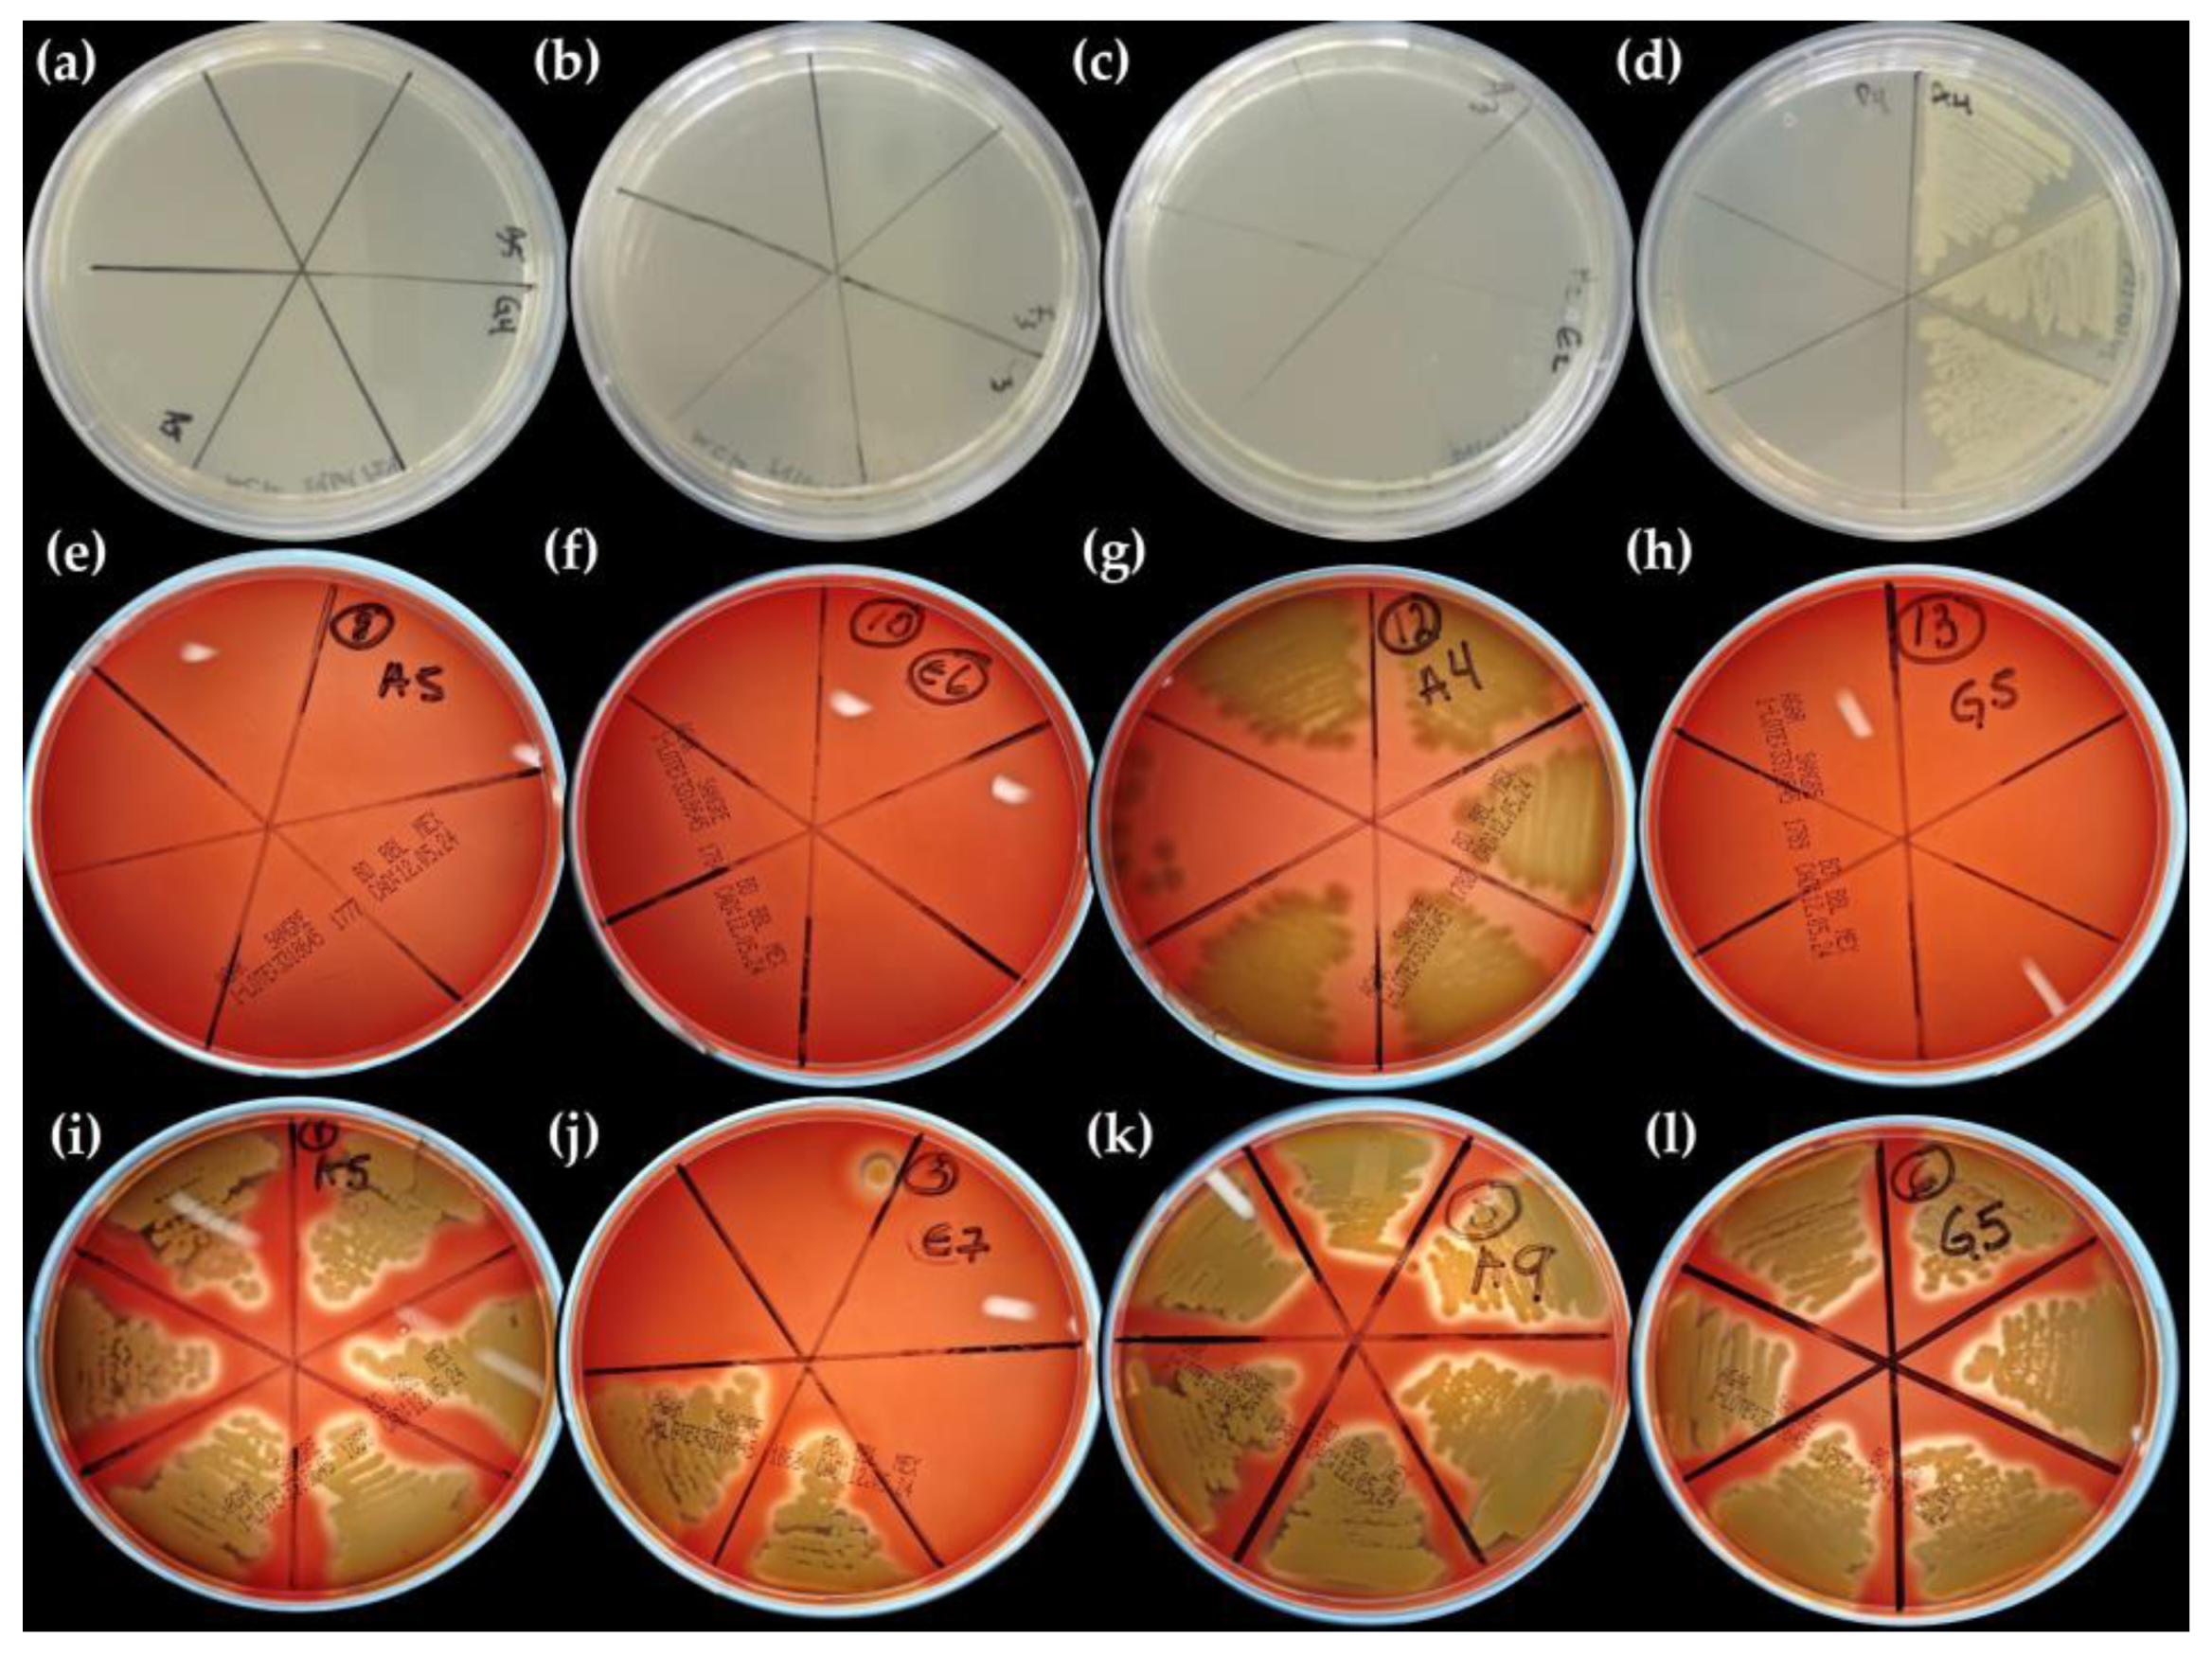
2.8. Antimicrobial Activity
3. Materials and Methods
3.1. Materials
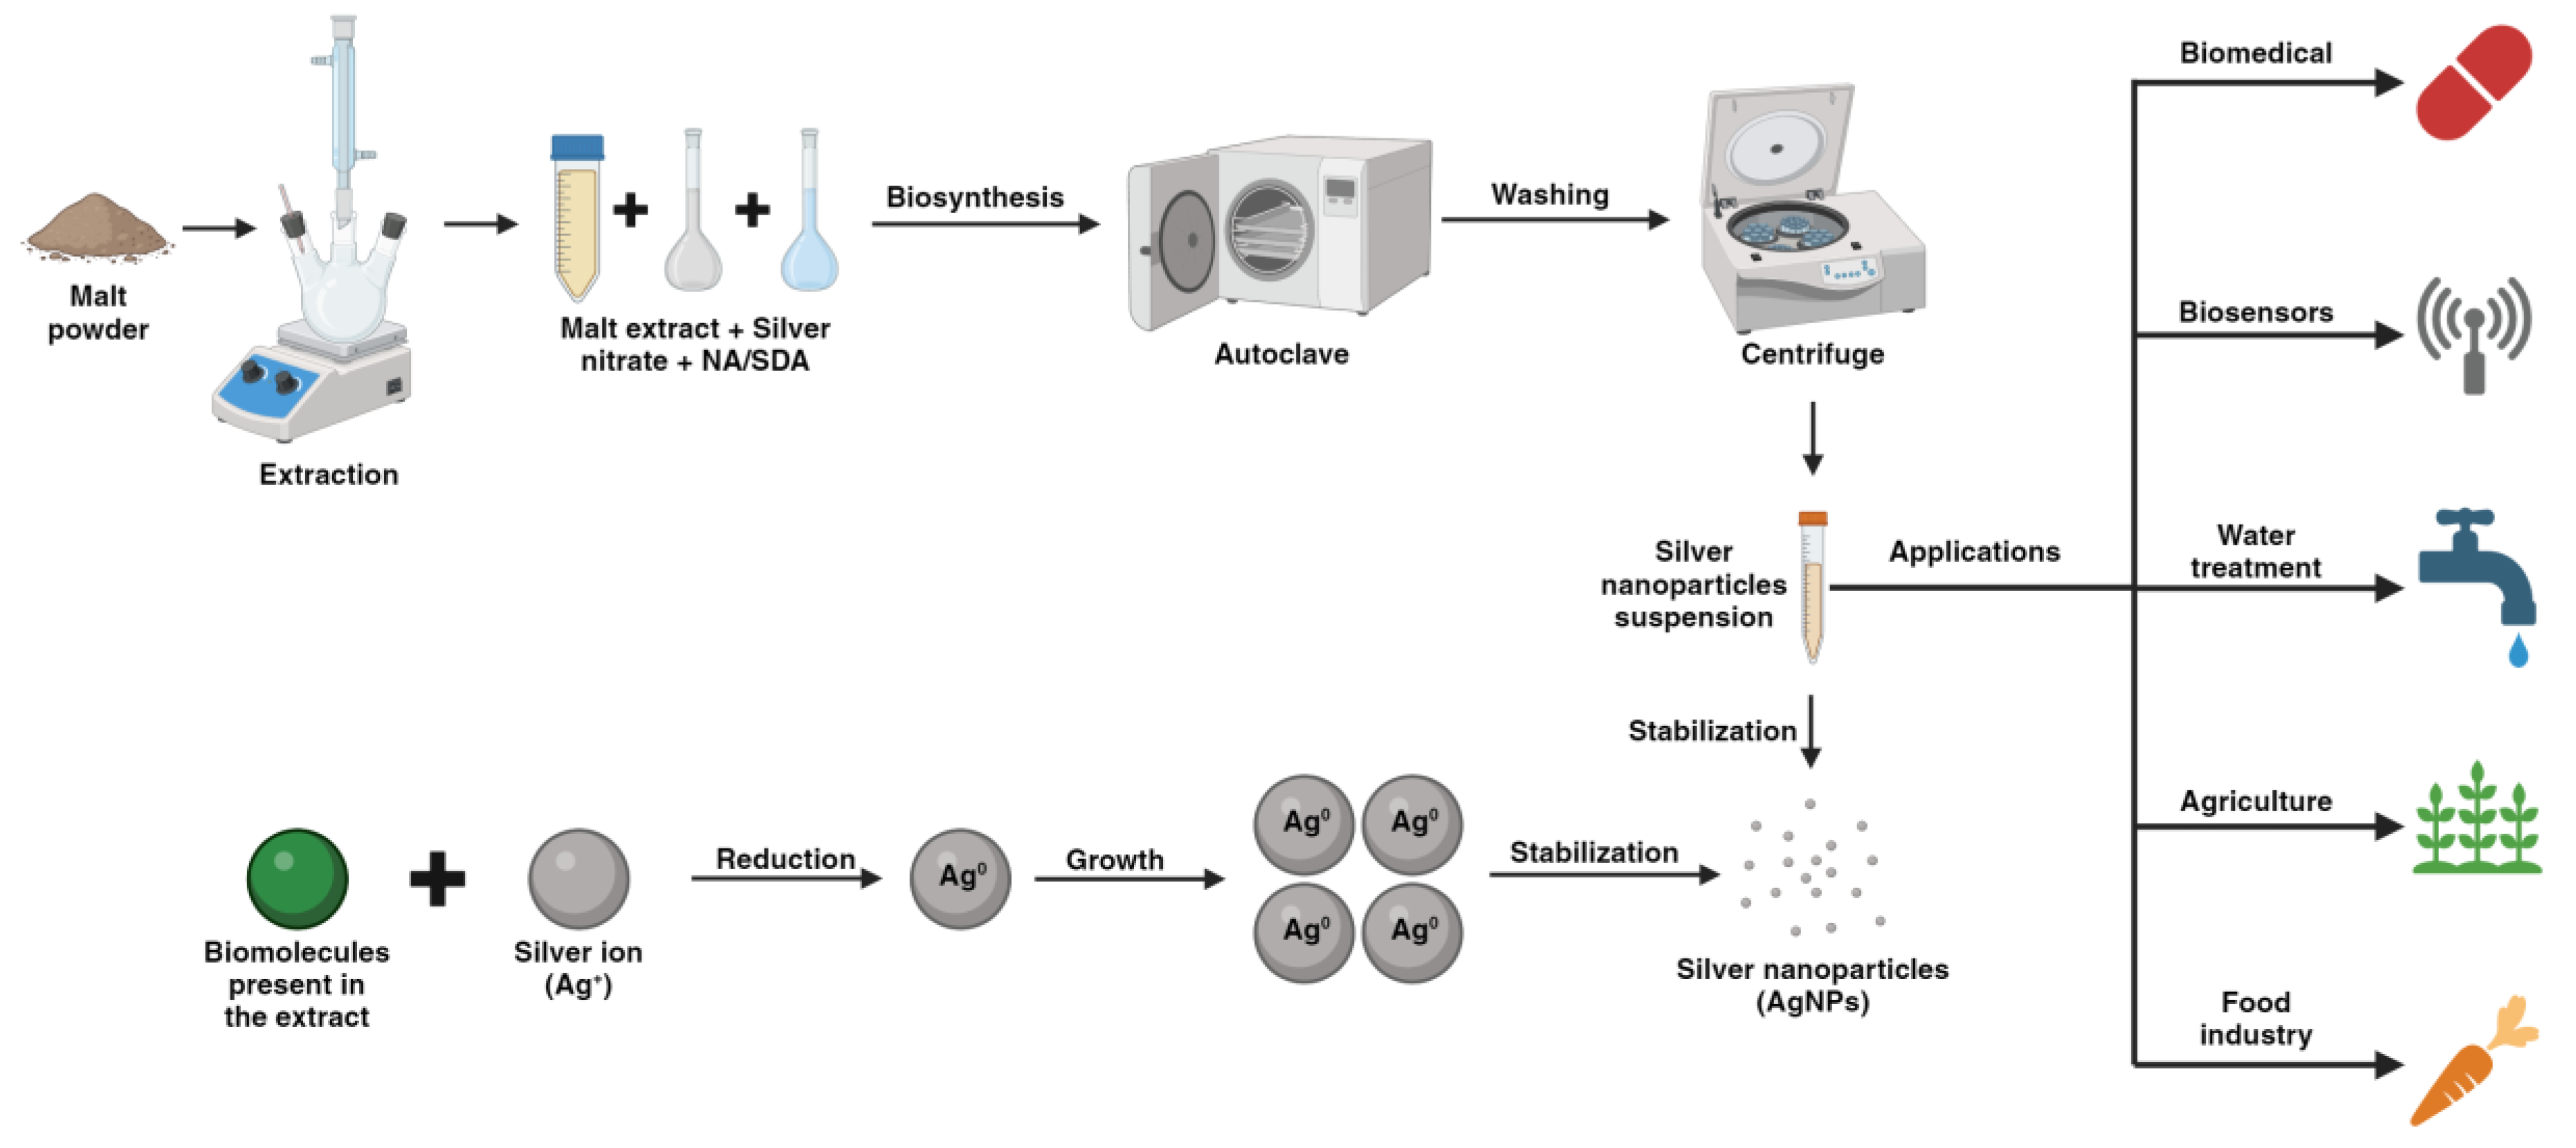
3.2. Preparation of ME
3.3. Biosynthesis of AgNPs
3.4. Characterization of ME-AgNPs
3.4.1. X-ray Diffraction (XRD) Analysis
3.4.2. Dynamic Light Scattering (DLS)
Experimental Design and Statistical Analysis
3.4.3. Fourier Transform Infrared (FTIR) Spectroscopy Analysis
3.4.4. Scanning Electron Microscopy (SEM) Analysis
3.4.5. Transmission Electron Microscopy (TEM) Analysis
3.4.6. High-Performance Liquid Chromatography (HPLC)
3.5. Phytochemical Screening of ME before and after the Reaction
3.5.1. Supernatant Obtention
3.5.2. Total Protein Concentration
3.5.3. Free Amino Acid Estimation
3.5.4. Reducing Sugars
3.5.5. Total Phenolic Content
3.6. Antibacterial Activity
Determination of Minimal Inhibitory Concentration (MIC)
4. Conclusions
Author Contributions
Funding
Institutional Review Board Statement
Informed Consent Statement
Data Availability Statement
Acknowledgments
Conflicts of Interest
References
- Ahmed, S.; Ahmad, M.; Swami, B.L.; Ikram, S. A Review on Plants Extract Mediated Synthesis of Silver Nanoparticles for Antimicrobial Applications: A Green Expertise. J. Adv. Res. 2016, 7, 17–28. [Google Scholar] [CrossRef]
- Hekmati, M.; Hasanirad, S.; Khaledi, A.; Esmaeili, D. Green Synthesis of Silver Nanoparticles Using Extracts of Allium rotundum l, Falcaria vulgaris Bernh, and Ferulago Angulate Boiss, and Their Antimicrobial Effects in Vitro. Gene Rep. 2020, 19, 100589. [Google Scholar] [CrossRef]
- Chaloupka, K.; Malam, Y.; Seifalian, A.M. Nanosilver as a New Generation of Nanoproduct in Biomedical Applications. Trends Biotechnol. 2010, 28, 580–588. [Google Scholar] [CrossRef]
- Shnoudeh, A.J.; Hamad, I.; Abdo, R.W.; Qadumii, L.; Jaber, A.Y.; Surchi, H.S.; Alkelany, S.Z. Synthesis, Characterization, and Applications of Metal Nanoparticles. In Biomaterials and Bionanotechnology; Elsevier: Amsterdam, The Netherlands, 2019; pp. 527–612. ISBN 9780128144282. [Google Scholar]
- Vishwanath, R.; Negi, B. Conventional and Green Methods of Synthesis of Silver Nanoparticles and Their Antimicrobial Properties. Curr. Res. Green Sustain. Chem. 2021, 4, 100205. [Google Scholar] [CrossRef]
- Gudikandula, K.; Charya Maringanti, S. Synthesis of Silver Nanoparticles by Chemical and Biological Methods and Their Antimicrobial Properties. J. Exp. Nanosci. 2016, 11, 714–721. [Google Scholar] [CrossRef]
- Rauwel, P.; Küünal, S.; Ferdov, S.; Rauwel, E. A Review on the Green Synthesis of Silver Nanoparticles and Their Morphologies Studied via TEM. Adv. Mater. Sci. Eng. 2015, 2015, 682749. [Google Scholar] [CrossRef]
- Savvidou, M.G.; Kontari, E.; Kalantzi, S.; Mamma, D. Green Synthesis of Silver Nanoparticles Using the Cell-Free Supernatant of Haematococcus pluvialis Culture. Materials 2024, 17, 187. [Google Scholar] [CrossRef]
- Sharma, V.K.; Yngard, R.A.; Lin, Y. Silver Nanoparticles: Green Synthesis and Their Antimicrobial Activities. Adv. Colloid. Interface Sci. 2009, 145, 83–96. [Google Scholar] [CrossRef]
- Sharma, D.; Kanchi, S.; Bisetty, K. Biogenic Synthesis of Nanoparticles: A Review. Arab. J. Chem. 2019, 12, 3576–3600. [Google Scholar] [CrossRef]
- Gong, D.; Sun, L.; Li, X.; Zhang, W.; Zhang, D.; Cai, J. Micro/Nanofabrication, Assembly, and Actuation Based on Microorganisms: Recent Advances and Perspectives. Small Struct. 2023, 4, 2200356. [Google Scholar] [CrossRef]
- Abbas, N.; Awan, M.B.; Badshah, M.A.; Sajjad, U.; Raza, W. Nanofluids for Enhanced Performance of Building Thermal Energy Systems. In Advances in Nanofluid Heat Transfer; Elsevier: Amsterdam, The Netherlands, 2022; pp. 479–501. ISBN 9780323886567. [Google Scholar]
- Qiu, L.; Wang, S.; Ma, Y.; Li, F. Nanofluid and Nanopowders. In Micro and Nano Thermal Transport: Characterization, Measurement, and Mechanism; Elsevier: Amsterdam, The Netherlands, 2022; pp. 247–284. ISBN 9780128235393. [Google Scholar]
- Rajeshkumar, S.; Bharath, L.V. Mechanism of Plant-Mediated Synthesis of Silver Nanoparticles—A Review on Biomolecules Involved, Characterisation and Antibacterial Activity. Chem. Biol. Interact. 2017, 273, 219–227. [Google Scholar] [CrossRef]
- Saleh, N.; Yousaf, Z. Tools and Techniques for the Optimized Synthesis, Reproducibility and Scale up of Desired Nanoparticles from Plant Derived Material and Their Role in Pharmaceutical Properties. In Nanoscale Fabrication, Optimization, Scale-Up and Biological Aspects of Pharmaceutical Nanotechnology; Elsevier: Amsterdam, The Netherlands, 2017; pp. 85–131. ISBN 9780128136294. [Google Scholar]
- Zhang, N.; Sun, J.; Yin, L.; Liu, J.; Chen, C. Silver Nanoparticles: From in Vitro Green Synthesis to in Vivo Biological Effects in Plants. Adv. Agrochem 2023, 2, 313–323. [Google Scholar] [CrossRef]
- Nath, P.C.; Ojha, A.; Debnath, S.; Sharma, M.; Sridhar, K.; Nayak, P.K.; Inbaraj, B.S. Biogeneration of Valuable Nanomaterials from Agro-Wastes: A Comprehensive Review. Agronomy 2023, 13, 561. [Google Scholar] [CrossRef]
- Devadiga, A.; Shetty, K.V.; Saidutta, M.B. Timber Industry Waste-Teak (Tectona grandis Linn.) Leaf Extract Mediated Synthesis of Antibacterial Silver Nanoparticles. Int. Nano Lett. 2015, 5, 205–214. [Google Scholar] [CrossRef]
- Shashidhara, V.; Srinivasappa, P.M.; Jadhav, A.H.; Alwarsamy, M. Phyto-Synthesis of Silver Nanoparticles from Tephrosia purpurea and Its in-Vitro Biogenic Actions. Appl. Organomet. Chem. 2023, 37, e7266. [Google Scholar] [CrossRef]
- Younas, M.; Rasool, M.H.; Khurshid, M.; Khan, A.; Nawaz, M.Z.; Ahmad, I.; Lakhan, M.N. Moringa oleifera Leaf Extract Mediated Green Synthesis of Silver Nanoparticles and Their Antibacterial Effect against Selected Gram-Negative Strains. Biochem. Syst. Ecol. 2023, 107, 104605. [Google Scholar] [CrossRef]
- Abdelrazik, M.; Elkotaby, H.H.; Yousef, A.; El-Sayed, A.F.; Khedr, M. Green Synthesis of Silver Nanoparticles Derived from Lemon and Pomegranate Peel Extracts to Combat Multidrug-Resistant Bacterial Isolates. J. Genet. Eng. Biotechnol. 2023, 21, 97. [Google Scholar] [CrossRef]
- Gowda, S.; Sriram, S. Dragon Fruit Peel Extract Mediated Green Synthesis of Silver Nanoparticles and Their Antifungal Activity against Colletotrichum Truncatum Causing Anthracnose in Chilli. J. Hortic. Sci. 2023, 18, 201–208. [Google Scholar] [CrossRef]
- Al-Zahrani, S.A.; Bhat, R.S.; Al-Onazi, M.A.; Alwhibi, M.S.; Soliman, D.A.; Aljebrin, N.A.; Al-Suhaibani, L.S.; Al Daihan, S. Anticancer Potential of Biogenic Silver Nanoparticles Using the Stem Extract of Commiphora gileadensis against Human Colon Cancer Cells. Green Process. Synth. 2022, 11, 435–444. [Google Scholar] [CrossRef]
- Thomas, O.E.; Adegoke, O.A.; Adeniyi, E.M.; Oliver, C.G. Phytosynthesis, Antimicrobial and Catalytic Activities of Silver Nanoparticles Derived Using Leaf and Stem Extracts of Indigofera macrophylla. Niger. J. Pharm. Res. 2022, 18, 43–54. [Google Scholar] [CrossRef]
- Gharari, Z.; Hanachi, P.; Walker, T.R. Green Synthesized Ag-Nanoparticles Using Scutellaria multicaulis Stem Extract and Their Selective Cytotoxicity against Breast Cancer. Anal. Biochem. 2022, 653, 114786. [Google Scholar] [CrossRef]
- Nagaraja, S.K.; Kumar, R.S.; Chakraborty, B.; Hiremath, H.; Almansour, A.I.; Perumal, K.; Gunagambhire, P.V.; Nayaka, S. Biomimetic Synthesis of Silver Nanoparticles Using Cucumis sativus Var. hardwickii Fruit Extract and Their Characterizations, Anticancer Potential and Apoptosis Studies against Pa-1 (Human Ovarian Teratocarcinoma) Cell Line via Flow Cytometry. Appl. Nanosci. 2023, 13, 3073–3084. [Google Scholar] [CrossRef]
- Ullah, S.; Khalid, R.; Rehman, M.F.; Irfan, M.I.; Abbas, A.; Alhoshani, A.; Anwar, F.; Amin, H.M.A. Biosynthesis of Phyto-Functionalized Silver Nanoparticles Using Olive Fruit Extract and Evaluation of Their Antibacterial and Antioxidant Properties. Front. Chem. 2023, 11, 1202252. [Google Scholar] [CrossRef]
- Bhat, M.P.; Kumar, R.S.; Rudrappa, M.; Basavarajappa, D.S.; Swamy, P.S.; Almansour, A.I.; Perumal, K.; Nayaka, S. Bio-Inspired Silver Nanoparticles from Artocarpus lakoocha Fruit Extract and Evaluation of Their Antibacterial Activity and Anticancer Activity on Human Prostate Cancer Cell Line. Appl. Nanosci. 2023, 13, 3041–3051. [Google Scholar] [CrossRef]
- Mouriya, G.K.; Mohammed, M.; Azmi, A.A.; Khairul, W.M.; Karunakaran, T.; Amirul, A.A.A.; Ramakrishna, S.; Santhanam, R.; Vigneswari, S. Green Synthesis of Cicer arietinum Waste Derived Silver Nanoparticle for Antimicrobial and Cytotoxicity Properties. Biocatal. Agric. Biotechnol. 2023, 47, 102573. [Google Scholar] [CrossRef]
- Shet, V.B.; Kumar, P.S.; Vinayagam, R.; Selvaraj, R.; Vibha, C.; Rao, S.; Pawan, S.M.; Poorvika, G.; Quintero, V.M.; Ujwal, P.; et al. Cocoa Pod Shell Mediated Silver Nanoparticles Synthesis, Characterization, and Their Application as Nanocatalyst and Antifungal Agent. Appl. Nanosci. 2023, 13, 4235–4245. [Google Scholar] [CrossRef]
- Argenziano, R.; Agustin-Salazar, S.; Panaro, A.; Calarco, A.; Di Salle, A.; Aprea, P.; Cerruti, P.; Panzella, L.; Napolitano, A. Combining the Potent Reducing Properties of Pecan Nutshell with a Solvent-Free Mechanochemical Approach for Synthesizing High Ag0 Content-Silver Nanoparticles: An Eco-Friendly Route to an Efficient Multifunctional Photocatalytic, Antibacterial, and Antioxidant Material. Nanomaterials 2023, 13, 821. [Google Scholar] [CrossRef]
- Martínez, C. Cerveza Mexicana: Conoce El Valor de Su Producción, Exportación y Tendencias; The Logistics World Newsletter: Mexico City, Mexico, 2023; Available online: https://thelogisticsworld.com/manufactura/produccion-de-cerveza-hecha-en-mexico-con-presencia-en-otras-latitudes/#:~:text=La%20producci%C3%B3n%20de%20cerveza%20en%202022%20alcanz%C3%B3%20los%20mil%20890,la%20elaboraci%C3%B3n%20de%20la%20bebida (accessed on 20 December 2023).
- Chaudhary, D.P.; Kumar, D.; Verma, R.P.S.; Langyan, S.; Sangwaman, S. Maize: Nutrition Dynamics and Novel Uses, 1st ed.; Chaudhary, D.P., Kumar, S., Langyan, S., Eds.; Springer: New Delhi, India, 2014; ISBN 978-81-322-1622-3-0. [Google Scholar]
- Montanuci, F.D.; Ribani, M.; de Matos Jorge, L.M.; Matos Jorge, R.M. Effect of Steeping Time and Temperature on Malting Process. J. Food Process Eng. 2017, 40, e12519. [Google Scholar] [CrossRef]
- Steiner, J.; Procopio, S.; Becker, T. Brewer’s Spent Grain: Source of Value-Added Polysaccharides for the Food Industry in Reference to the Health Claims. Eur. Food Res. Technol. 2015, 241, 303–315. [Google Scholar] [CrossRef]
- Mussatto, S.I. Brewer’s Spent Grain: A Valuable Feedstock for Industrial Applications. J. Sci. Food Agric. 2014, 94, 1264–1275. [Google Scholar] [CrossRef] [PubMed]
- Xiros, C.; Christakopoulos, P. Biotechnological Potential of Brewers Spent Grain and Its Recent Applications. Waste Biomass Valorization 2012, 3, 213–232. [Google Scholar] [CrossRef]
- Khodashenas, B.; Ghorbani, H.R. Synthesis of Silver Nanoparticles with Different Shapes. Arab. J. Chem. 2019, 12, 1823–1838. [Google Scholar] [CrossRef]
- Shenashen, M.A.; El-Safty, S.A.; Elshehy, E.A. Synthesis, Morphological Control, and Properties of Silver Nanoparticles in Potential Applications. Part. Part. Syst. Charact. 2014, 31, 293–316. [Google Scholar] [CrossRef]
- Sharenko, A.; Treat, N.D.; Love, J.A.; Toney, M.F.; Stingelin, N.; Nguyen, T.Q. Use of a Commercially Available Nucleating Agent to Control the Morphological Development of Solution-Processed Small Molecule Bulk Heterojunction Organic Solar Cells. J. Mater. Chem. A Mater. 2014, 2, 15717–15721. [Google Scholar] [CrossRef]
- Rousseau, R.W. Crystallization Processes. In Encyclopedia of Physical Science and Technology; Mayers, R.A., Ed.; Academic Press: San Diego, CA, USA, 2001; Volume 1, ISBN 9780122274107. [Google Scholar]
- Qi, X.; Balankura, T.; Zhou, Y.; Fichthorn, K.A. How Structure-Directing Agents Control Nanocrystal Shape: Polyvinylpyrrolidone-Mediated Growth of Ag Nanocubes. Nano Lett. 2015, 15, 7711–7717. [Google Scholar] [CrossRef]
- Alvarado-Arámburo, A.; Velázquez, G.; Cid Hernández, M.; Reyes, O.K.; González-Ortiz, L.J.; Cruz-Estrada, R.H.; Vázquez-Lepe, M.O.; Jimenez-Aguilar, J.A.; Navarro-Partida, J.; López-Naranjo, E.J. Effect of Biosynthesized Silver Nanoparticles on the Properties of Chemically Modified Agave tequilana Weber Var. Azul Fibers. J. Nanomater. 2022, 2022, 1826730. [Google Scholar] [CrossRef]
- Wang, J.; An, C.; Zhang, M.; Qin, C.; Ming, X.; Zhang, Q. Photochemical Conversion of AgCl Nanocubes to Hybrid AgCl-Ag Nanoparticles with High Activity and Long-Term Stability towards Photocatalytic Degradation of Organic Dyes. Can. J. Chem. 2012, 90, 858–864. [Google Scholar] [CrossRef]
- Al Aboody, M.S. Silver/Silver Chloride (Ag/AgCl) Nanoparticles Synthesized from Azadirachta indica Lalex and Its Antibiofilm Activity against Fluconazole Resistant Candida tropicalis. Artif. Cells Nanomed. Biotechnol. 2019, 47, 2107–2113. [Google Scholar] [CrossRef]
- Erdogan, O.; Abbak, M.; Demirbolat, G.M.; Birtekocak, F.; Aksel, M.; Pasa, S.; Cevik, O. Green Synthesis of Silver Nanoparticles via Cynara scolymus Leaf Extracts: The Characterization, Anticancer Potential with Photodynamic Therapy in MCF7 Cells. PLoS ONE 2019, 14, e0216496. [Google Scholar] [CrossRef]
- Vanitha, G.; Rajavel, K.; Boopathy, G.; Veeravazhuthi, V.; Neelamegam, P. Physiochemical Charge Stabilization of Silver Nanoparticles and Its Antibacterial Applications. Chem. Phys. Lett. 2017, 669, 71–79. [Google Scholar] [CrossRef]
- Bettenhausen, H.M.; Barr, L.; Broeckling, C.D.; Chaparro, J.M.; Holbrook, C.; Sedin, D.; Heuberger, A.L. Influence of Malt Source on Beer Chemistry, Flavor, and Flavor Stability. Food Res. Int. 2018, 113, 487–504. [Google Scholar] [CrossRef]
- Malečková, M.; Vrzal, T.; Vaško, T.; Olšovská, J.; Sobotníková, J. Natural Occurrence of Nitrite-Related Compounds in Malt and Beer. J. Agric. Food Chem. 2023, 71, 17321–17329. [Google Scholar] [CrossRef]
- Kashyap, M.; Samadhiya, K.; Ghosh, A.; Anand, V.; Shirage, P.M.; Bala, K. Screening of Microalgae for Biosynthesis and Optimization of Ag/AgCl Nano Hybrids Having Antibacterial Effect. RSC Adv. 2019, 9, 25583–25591. [Google Scholar] [CrossRef]
- Venkatesham, M.; Ayodhya, D.; Madhusudhan, A.; Veerabhadram, G. Synthesis of Stable Silver Nanoparticles Using Gum Acacia as Reducing and Stabilizing Agent and Study of Its Microbial Properties: A Novel Green Approach. Int. J. Green Nanotechnol. 2012, 4, 199–206. [Google Scholar] [CrossRef]
- Hariram, M.; Vivekanandhan, S.; Ganesan, V.; Muthuramkumar, S.; Rodriguez-uribe, A.; Mohanty, A.K.; Misra, M. Tecoma stans Flower Extract Assisted Biogenic Synthesis of Functional Ag-Talc Nanostructures for Antimicrobial Applications. Bioresour. Technol. Rep. 2019, 7, 100298. [Google Scholar] [CrossRef]
- Li, X.-Z.; Nikaido, H.; Williams, K.E. Silver-Resistant Mutants of Escherichia coli Display Active Efflux of Ag and Are Deficient in Porins. J. Bacteriol. 1997, 179, 6127–6132. [Google Scholar] [CrossRef]
- Levard, C.; Mitra, S.; Yang, T.; Jew, A.D.; Badireddy, A.R.; Lowry, G.V.; Brown, G.E. Effect of Chloride on the Dissolution Rate of Silver Nanoparticles and Toxicity to E. coli. Environ. Sci. Technol. 2013, 47, 5738–5745. [Google Scholar] [CrossRef]
- Silver, S.; Perry, R.D.; Tynecka, Z.; Kinscherf, T.G. Mechanisms of Bacterial Resistances to the Toxic Heavy Metals Antimony, Arsenic, Cadmium, Mercury and Silver. In Proceedings of the Third Tokyo Symposium on Drug Resistance in Bacteria, Japan Scientific Societes Press Tokyo, Tokyo, Japan, August 1982; Thieme-Stratton Inc.: New York, NY, USA, 1982; pp. 347–361. [Google Scholar]
- Morones, J.R.; Elechiguerra, J.L.; Camacho, A.; Holt, K.; Kouri, J.B.; Ramírez, J.T.; Yacaman, M.J. The Bactericidal Effect of Silver Nanoparticles. Nanotechnology 2005, 16, 2346–2353. [Google Scholar] [CrossRef]
- Awwad, A.M.; Salem, N.M.; Aqarbeh, M.M.; Abdulaziz, F.M. Green Synthesis, Characterization of Silver Sulfide Nanoparticles and Antibacterial Activity Evaluation. Chem. Int. 2020, 6, 42–48. [Google Scholar]
- Lee, J.H.; Lim, J.M.; Velmurugan, P.; Park, Y.J.; Park, Y.J.; Bang, K.S.; Oh, B.T. Photobiologic-Mediated Fabrication of Silver Nanoparticles with Antibacterial Activity. J. Photochem. Photobiol. B 2016, 162, 93–99. [Google Scholar] [CrossRef]
- Rosen, H. A Modified Ninhydrin Colorimetric Analysis for Amino Acids. Arch. Biochem. Biophys. 1957, 67, 10–15. [Google Scholar] [CrossRef] [PubMed]
- Miller, G.L. Use of Dinitrosalicylic Acid Reagent for Determination of Reducing Sugar. Anal. Chem. 1959, 31, 426–428. [Google Scholar] [CrossRef]
- Singleton, V.L.; Orthofer, R.; Lamuela-Raventós, R.M. Analysis of Total Phenols and Other Oxidation Substrates and Antioxidants by Means of Folin-Ciocalteu Reagent. In Methods in Enzymology; Academic Press: Cambridge, MA, USA, 1999; Volume 299, pp. 152–178. ISBN 9780121822002. [Google Scholar]
- Clinical and Laboratory Standards Institute, Methods for Dilution Antimicrobial Susceptibility Tests for Bacteria That Grow Aerobically. In Approved Standard, 9th ed.; CLSI document M07-A9; Clinical and Laboratory Standards Institute: Wayne, PA, USA, 2012; Volume 32, ISBN 1-56238-784-7. Available online: https://clsi.org/media/1928/m07ed11_sample.pdf (accessed on 20 December 2023).


| Source of the Extract | Involved Plant/Agro-Waste | Size (nm) | Shape | Reference |
|---|---|---|---|---|
| Plant’s leaf | Tectona grandis | 28 | Spherical | [18] |
| Tephrosia purpurea | ~100 | Spherical | [19] | |
| Moringa oleifera | 25.235 ± 0.694 | Spherical | [20] | |
| Plant’s peel | Citrus limon | 32 | Spherical | [21] |
| Punica granatum | 28 | Spherical | [21] | |
| Hylocereus spp. | 7 | Spherical | [22] | |
| Plant’s stem | Commiphora gileadensis | 13 | Spherical | [23] |
| Indigofera macrophylla | 18.09 ± 4.13 | Spherical | [24] | |
| Scutellaria multicaulis | ~60 | Spherical and oval | [25] | |
| Plant’s fruit | Cucumis sativus var. hardwickii | 11.12–39 | Spherical | [26] |
| Olea europaea | 77 | Spherical | [27] | |
| Artocarpus lakoocha | 6.59–25 | Spherical | [28] | |
| Agro-waste | Cicer arietinum (black chickpea peels) | 47.46 | Spherical | [29] |
| Theobroma cacao (cocoa pod shells) | 48.83–55.24 | Spherical | [30] | |
| Carya illinoinensis (pecan nutshell) | 15–35 | Spherical | [31] |
| Sample | Utilized NA/SDA | DLS | |
|---|---|---|---|
| Average Size [nm] | Z-Potential (mV) | ||
| M1 | - | 4.733 ± 1.128 | −8.84 ± 0.23 |
| M2 | - | 4.104 ± 0.475 | −8.95 ± 1.34 |
| M3 | - | 3.899 ± 0.712 | −8.42 ± 0.38 |
| M4 | NaCl | 4.209 ± 0.379 | −14.07 ± 0.55 |
| M5 | NaCl | 3.347 ± 0.045 | −17.27 ± 0.50 |
| M6 | NaCl | 3.945 ± 0.456 | −8.79 ± 0.69 |
| M7 | GA | 3.791 ± 0.749 | −11.56 ± 1.99 |
| M8 | GA | 4.613 ± 1.181 | −17.33 ± 1.30 |
| M9 | GA | 4.286 ± 0.738 | −8.65 ± 0.42 |
| M10 | T | 4.174 ± 0.548 | −10.33 ± 0.35 |
| M11 | T | 3.601 ± 0.107 | −9.47 ± 0.73 |
| M12 | T | 4.300 ± 1.092 | −11.47 ± 0.32 |
| Sample | Maltose gL−1 | Glucose gL−1 | Fructose gL−1 |
|---|---|---|---|
| ME | 20.40 ± 0.79 | 2.4 ± 0.14 | 0.57 ± 0.07 |
| ME-AgNPs-S | 8.32 ± 0.41 | 1.47 ± 0.34 | 0.44 ± 0.09 |
| Bacterial Strain | Minimal Inhibitory Concentration of the Samples [mM Ag] | |||||
| No NA/SDA | NaCl | |||||
| M1 | M2 | M3 | M4 | M5 | M6 | |
| Escherichia coli | 0.1875 | 0.1875 | 0.1875 | 0.1875 | 0.09375 | 0.1875 |
| Salmonella typhimurium | 0.1875 | 0.1875 | 0.1875 | 0.1875 | 0.09375 | 0.09375 |
| Staphylococcus aureus | 0.375 | 0.1875 | 0.1875 | 0.09375 | 0.046875 | 0.09375 |
| Bacterial Strain | Minimal Inhibitory Concentration of the Samples [mM Ag] | |||||
| GA | T | |||||
| M7 | M8 | M9 | M10 | M11 | M12 | |
| Escherichia coli | 0.375 | 0.375 | 1.5 | 0.75 | 0.75 | 0.375 |
| Salmonella typhimurium | 0.375 | 0.375 | 0.75 | 0.1875 | 0.1875 | 0.09375 |
| Staphylococcus aureus | 0.375 | 0.375 | 0.75 | 0.1875 | 0.375 | 0.1875 |
| Group | Sample | Former Colony Units Inhibited by Millimole of Silver [CFU/mmol Ag] | ||
|---|---|---|---|---|
| Escherichia coli | Salmonella typhimurium | Staphylococcus aureus | ||
| No NA/SDA | M1 | 2.78 × 10⁸ ± 9.51 × 10⁷ | 6.35 × 10⁷ ± 5.06 × 10⁶ | 1.53 × 10⁸ ± 1.58 × 10⁷ |
| M2 | 2.78 × 10⁸ ± 9.51 × 10⁷ | 6.35 × 10⁷ ± 5.06 × 10⁶ | 3.06 × 10⁸ ± 3.15 × 10⁷ | |
| M3 | 2.78 × 10⁸ ± 9.51 × 10⁷ | 6.35 × 10⁷ ± 5.06 × 10⁶ | 3.06 × 10⁸ ± 3.15 × 10⁷ | |
| NaCl | M4 | 2.78 × 10⁸ ± 9.51 × 10⁷ | 6.35 × 10⁷ ± 5.06 × 10⁶ | 6.12 × 10⁸ ± 6.30 × 10⁷ |
| M5 | 5.56 × 10⁸ ± 1.90 × 10⁸ | 1.27 × 10⁸ ± 1.01 × 10⁷ | 1.22 × 10⁹ ± 1.26 × 10⁸ | |
| M6 | 2.78 × 10⁸ ± 9.51 × 10⁷ | 1.27 × 10⁸ ± 1.01 × 10⁷ | 6.12 × 10⁸ ± 6.30 × 10⁷ | |
| GA | M7 | 1.39 × 10⁸ ± 4.75 × 10⁷ | 3.17 × 10⁷ ± 2.53 × 10⁶ | 1.53 × 10⁸ ± 1.58 × 10⁷ |
| M8 | 1.39 × 10⁸ ± 4.75 × 10⁷ | 3.17 × 10⁷ ± 2.53 × 10⁶ | 1.53 × 10⁸ ± 1.58 × 10⁷ | |
| M9 | 3.47 × 10⁷ ± 1.19 × 10⁷ | 1.59 × 10⁷ ± 1.27 × 10⁶ | 7.65 × 10⁷ ± 7.88 × 10⁶ | |
| T | M10 | 6.95 × 10⁷ ± 2.38 × 10⁷ | 6.35 × 10⁷ ± 5.06 × 10⁶ | 3.06 × 10⁸ ± 3.15 × 10⁷ |
| M11 | 6.95 × 10⁷ ± 2.38 × 10⁷ | 6.35 × 10⁷ ± 5.06 × 10⁶ | 1.53 × 10⁸ ± 1.58 × 10⁷ | |
| M12 | 1.39 × 10⁸ ± 4.75 × 10⁷ | 1.27 × 10⁸ ± 1.01 × 10⁷ | 3.06 × 10⁸ ± 3.15 × 10⁷ | |
| Sample | AgNO3 (mL of 10 mM Solution) | First Stirring (min) | ME (mL) | Reaction Time (min) | Temperature of Reaction (°C) | Second Stirring (min) | NA or SDA (mL of 10 mM Solution) |
|---|---|---|---|---|---|---|---|
| M1 | 3 | - | 3 | 15 | 120 | - | - |
| M2 | 3 | 15 | 3 | 15 | 120 | - | - |
| M3 | 3 | 15 | 3 | 15 | 120 | 15 | - |
| M4 | 3 | - | 3 | 15 | 120 | - | NaCl |
| M5 | 3 | 15 | 3 | 15 | 120 | - | NaCl |
| M6 | 3 | 15 | 3 | 15 | 120 | 15 | NaCl |
| M7 | 3 | - | 3 | 15 | 120 | - | GA |
| M8 | 3 | 15 | 3 | 15 | 120 | - | GA |
| M9 | 3 | 15 | 3 | 15 | 120 | 15 | GA |
| M10 | 3 | - | 3 | 15 | 120 | - | T |
| M11 | 3 | 15 | 3 | 15 | 120 | - | T |
| M12 | 3 | 15 | 3 | 15 | 120 | 15 | T |
Disclaimer/Publisher’s Note: The statements, opinions and data contained in all publications are solely those of the individual author(s) and contributor(s) and not of MDPI and/or the editor(s). MDPI and/or the editor(s) disclaim responsibility for any injury to people or property resulting from any ideas, methods, instructions or products referred to in the content. |
© 2024 by the authors. Licensee MDPI, Basel, Switzerland. This article is an open access article distributed under the terms and conditions of the Creative Commons Attribution (CC BY) license (https://creativecommons.org/licenses/by/4.0/).
Share and Cite
Dueñas-Bolaños, C.A.; Cid-Hernández, M.; Velázquez-Juárez, G.; García-Casillas, L.A.; González-Ortiz, L.J.; Sánchez-Peña, M.J.; Herrera-González, A.; Zúñiga-González, O.G.; López-Naranjo, E.J. Use of Residual Malt from an Artisanal Beer Brewing Process in the Biosynthesis of Silver Nanoparticles Mediated by Nucleating and Structure-Directing Agents. Molecules 2024, 29, 1660. https://doi.org/10.3390/molecules29071660
Dueñas-Bolaños CA, Cid-Hernández M, Velázquez-Juárez G, García-Casillas LA, González-Ortiz LJ, Sánchez-Peña MJ, Herrera-González A, Zúñiga-González OG, López-Naranjo EJ. Use of Residual Malt from an Artisanal Beer Brewing Process in the Biosynthesis of Silver Nanoparticles Mediated by Nucleating and Structure-Directing Agents. Molecules. 2024; 29(7):1660. https://doi.org/10.3390/molecules29071660
Chicago/Turabian StyleDueñas-Bolaños, César A., Margarita Cid-Hernández, Gilberto Velázquez-Juárez, Luis A. García-Casillas, Luis J. González-Ortiz, María Judith Sánchez-Peña, Azucena Herrera-González, Oscar Guillermo Zúñiga-González, and Edgar J. López-Naranjo. 2024. "Use of Residual Malt from an Artisanal Beer Brewing Process in the Biosynthesis of Silver Nanoparticles Mediated by Nucleating and Structure-Directing Agents" Molecules 29, no. 7: 1660. https://doi.org/10.3390/molecules29071660