
Optimization of Extraction Process and Analysis of Biological Activity of Flavonoids from Leaves of Cultivated ‘Qi-Nan’ Agarwood
Abstract
:1. Introduction
2. Results and Analyses
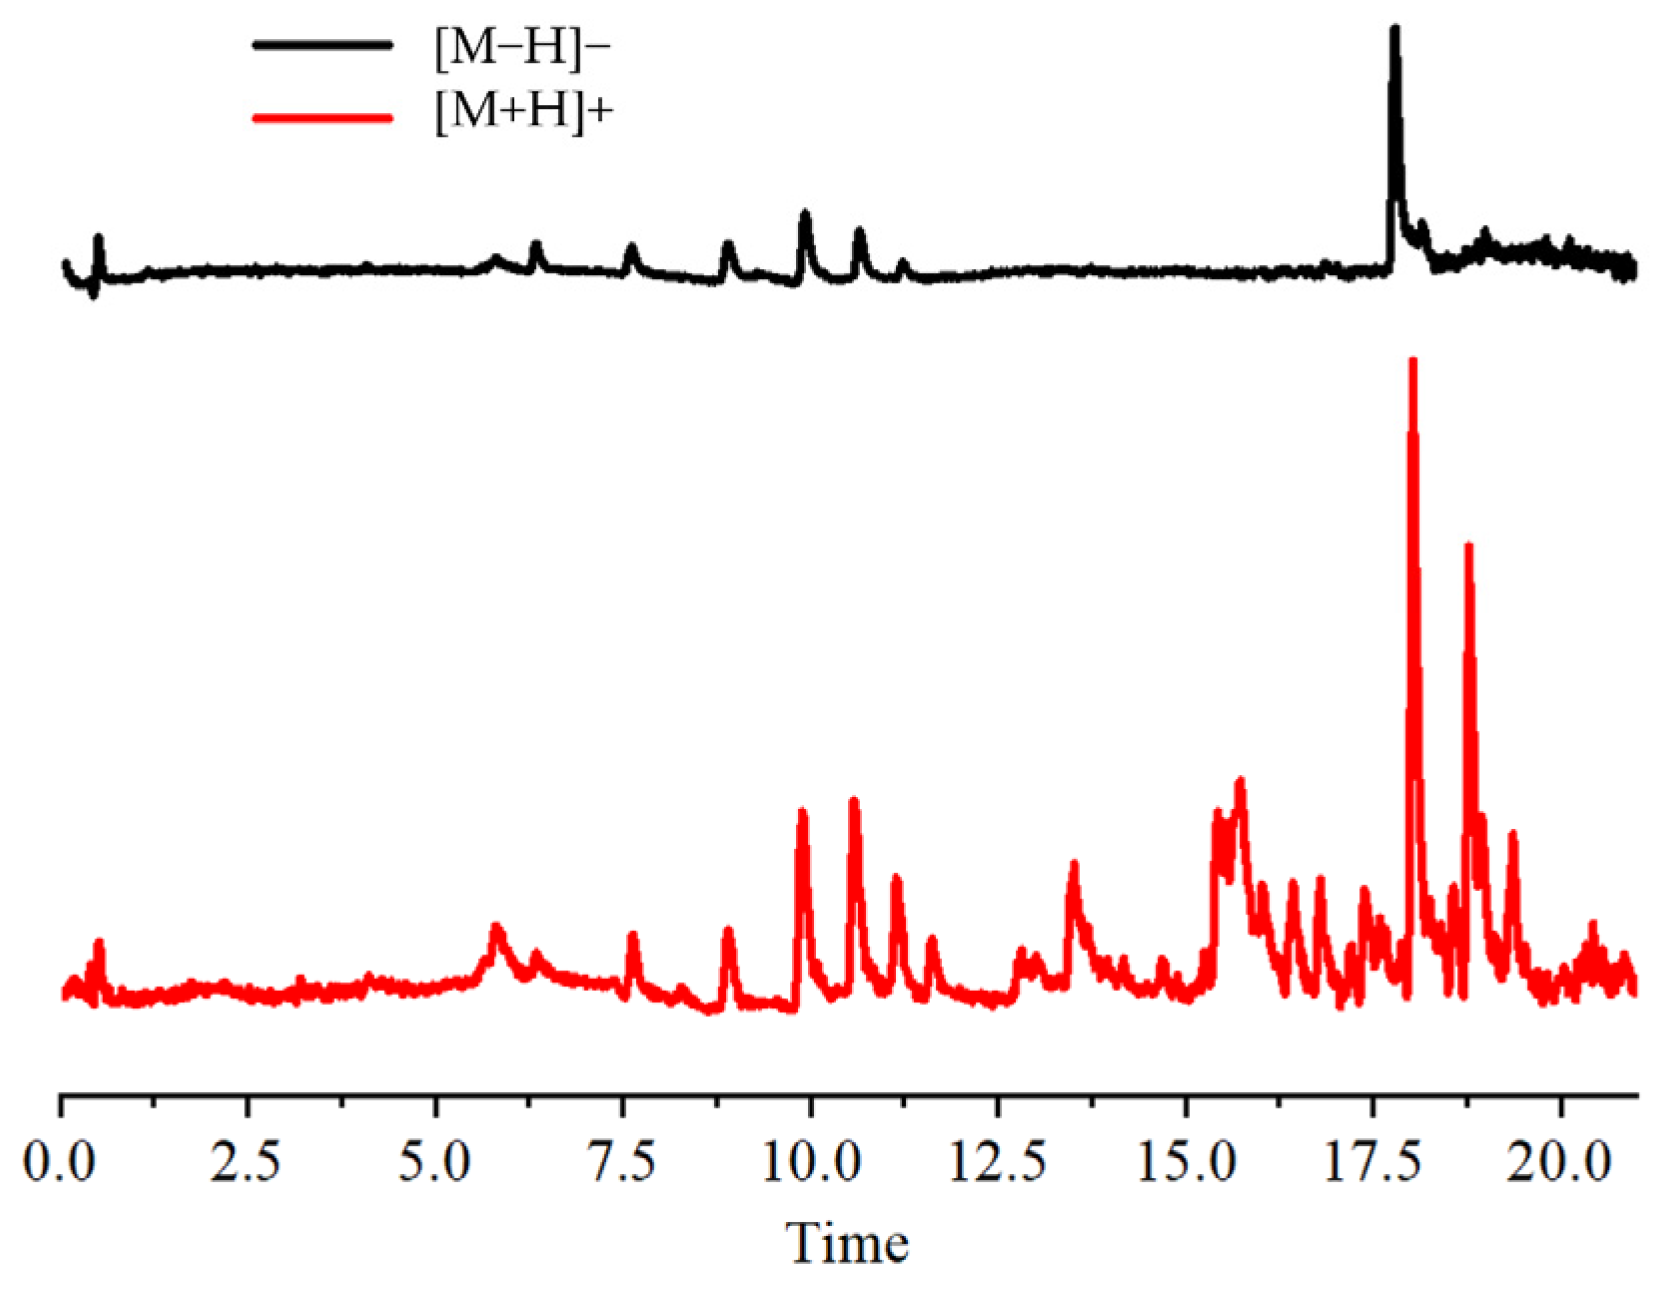
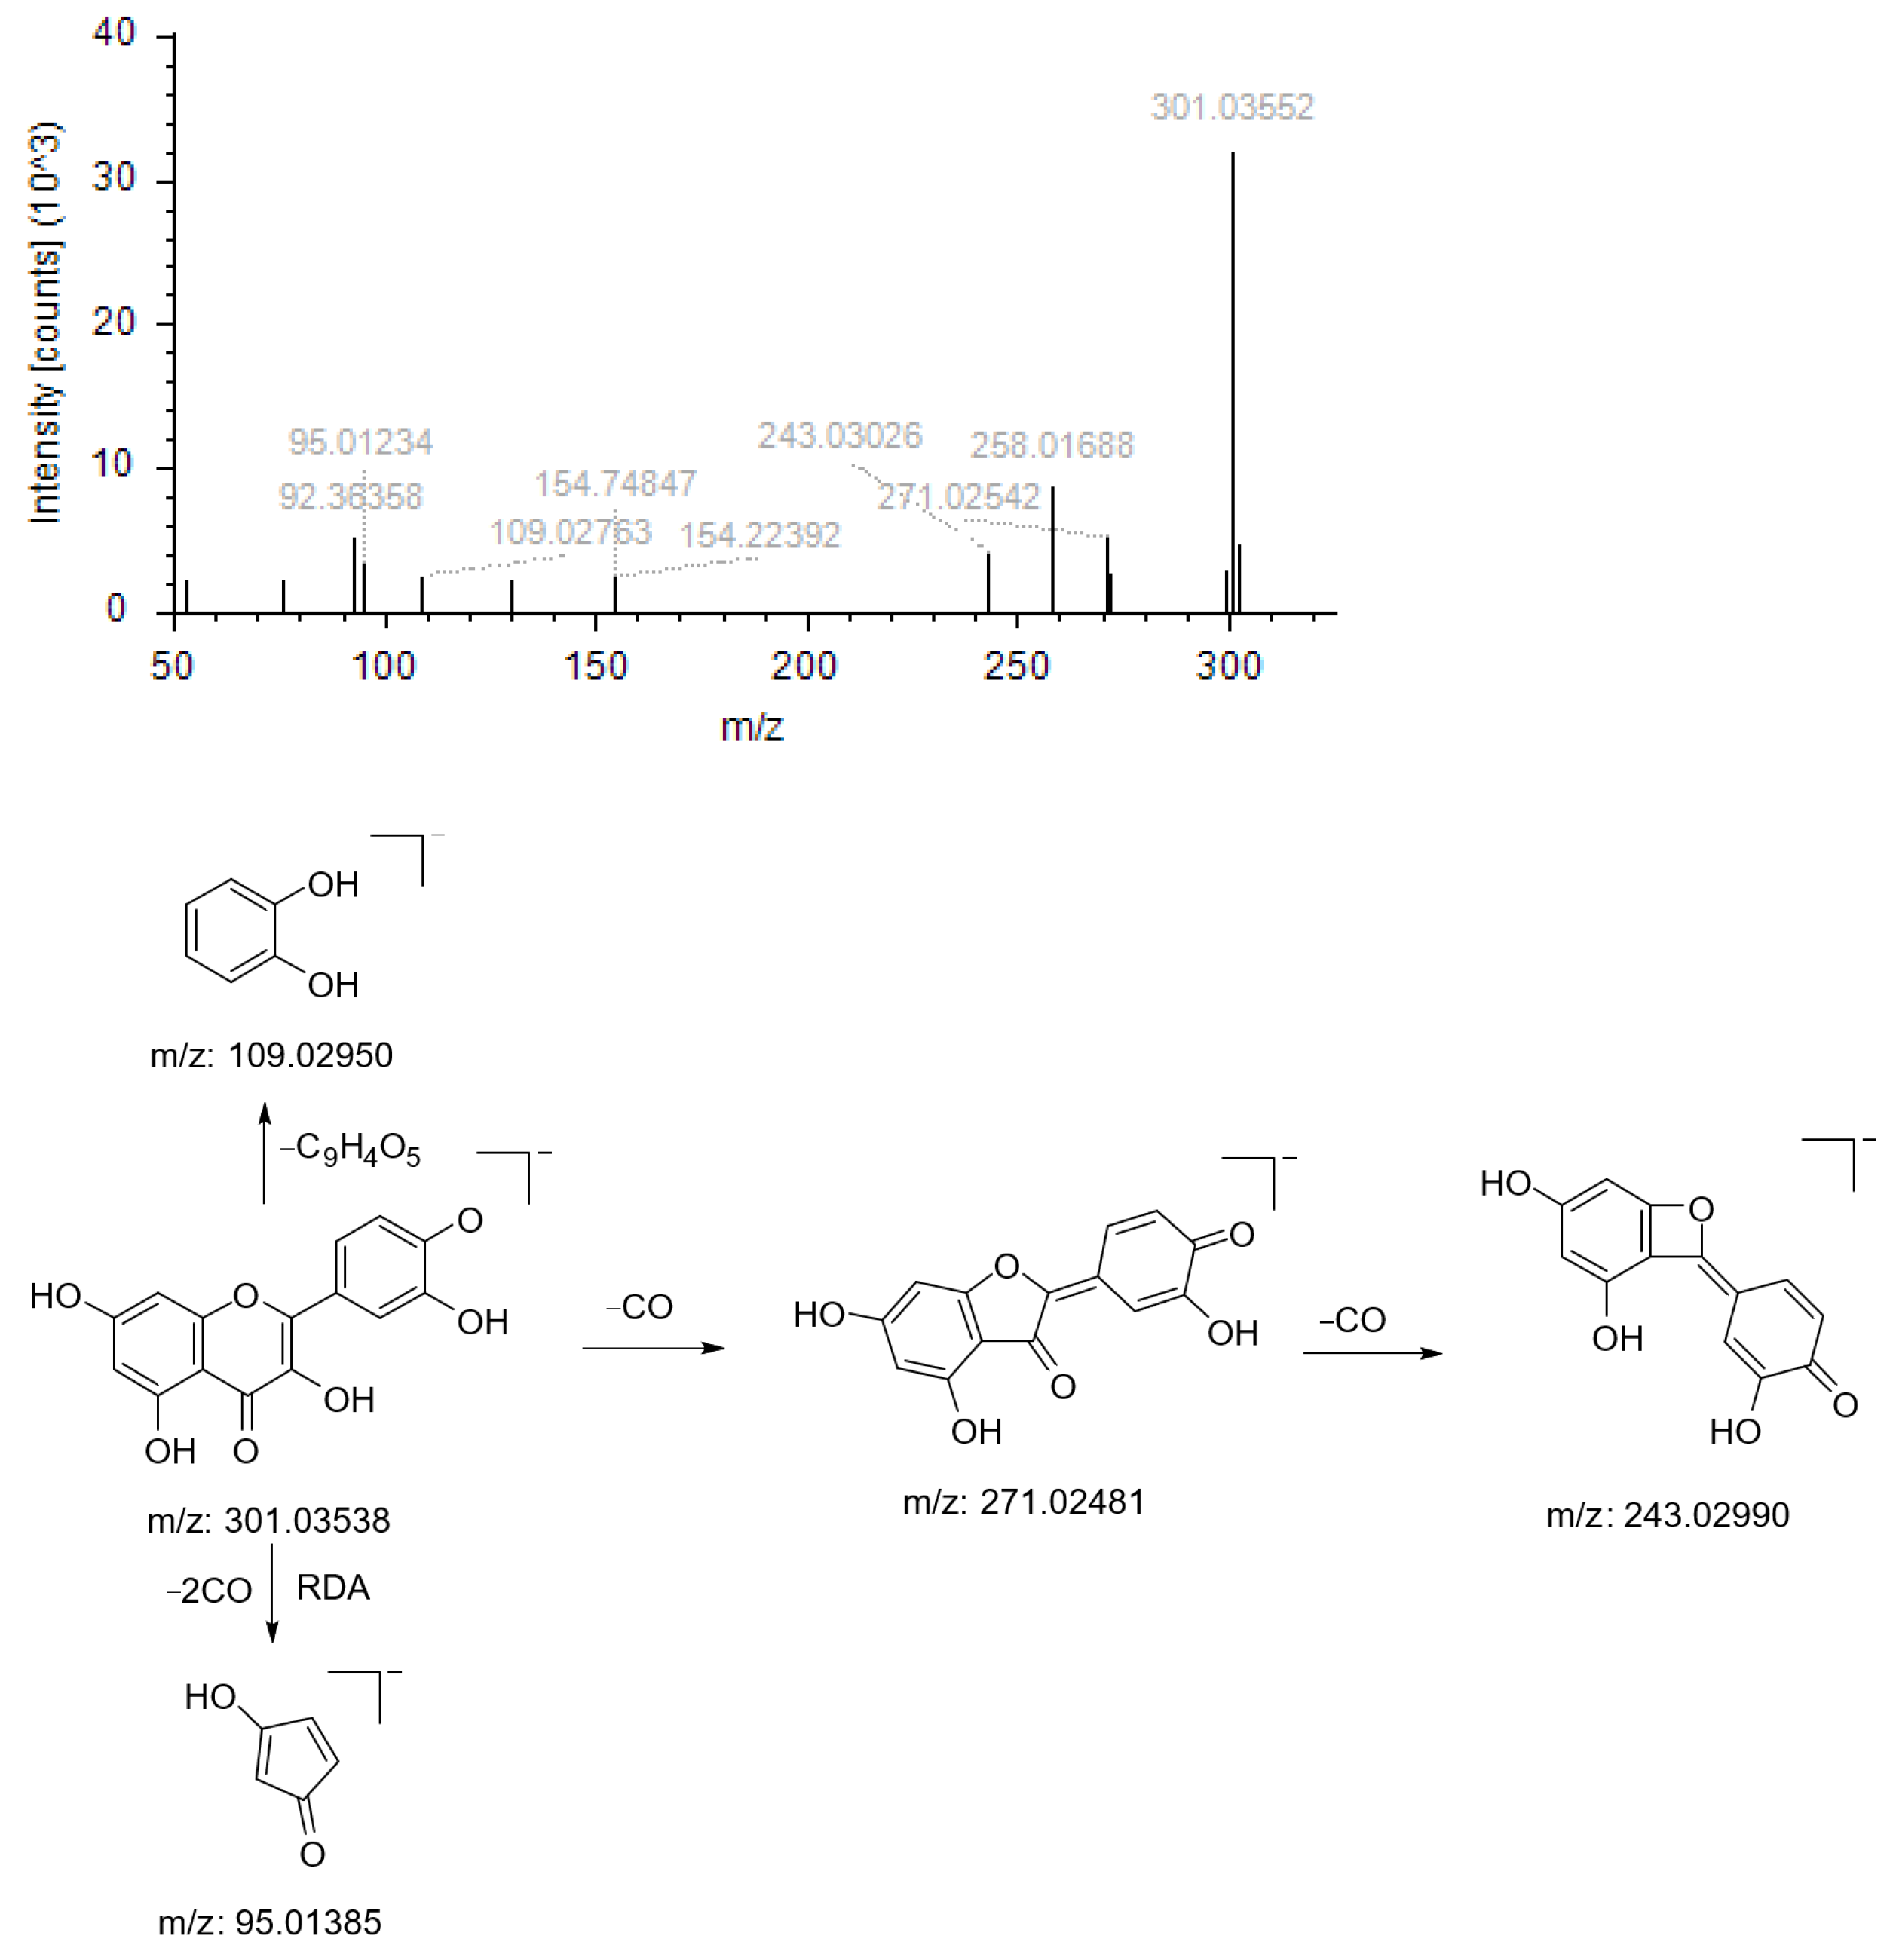
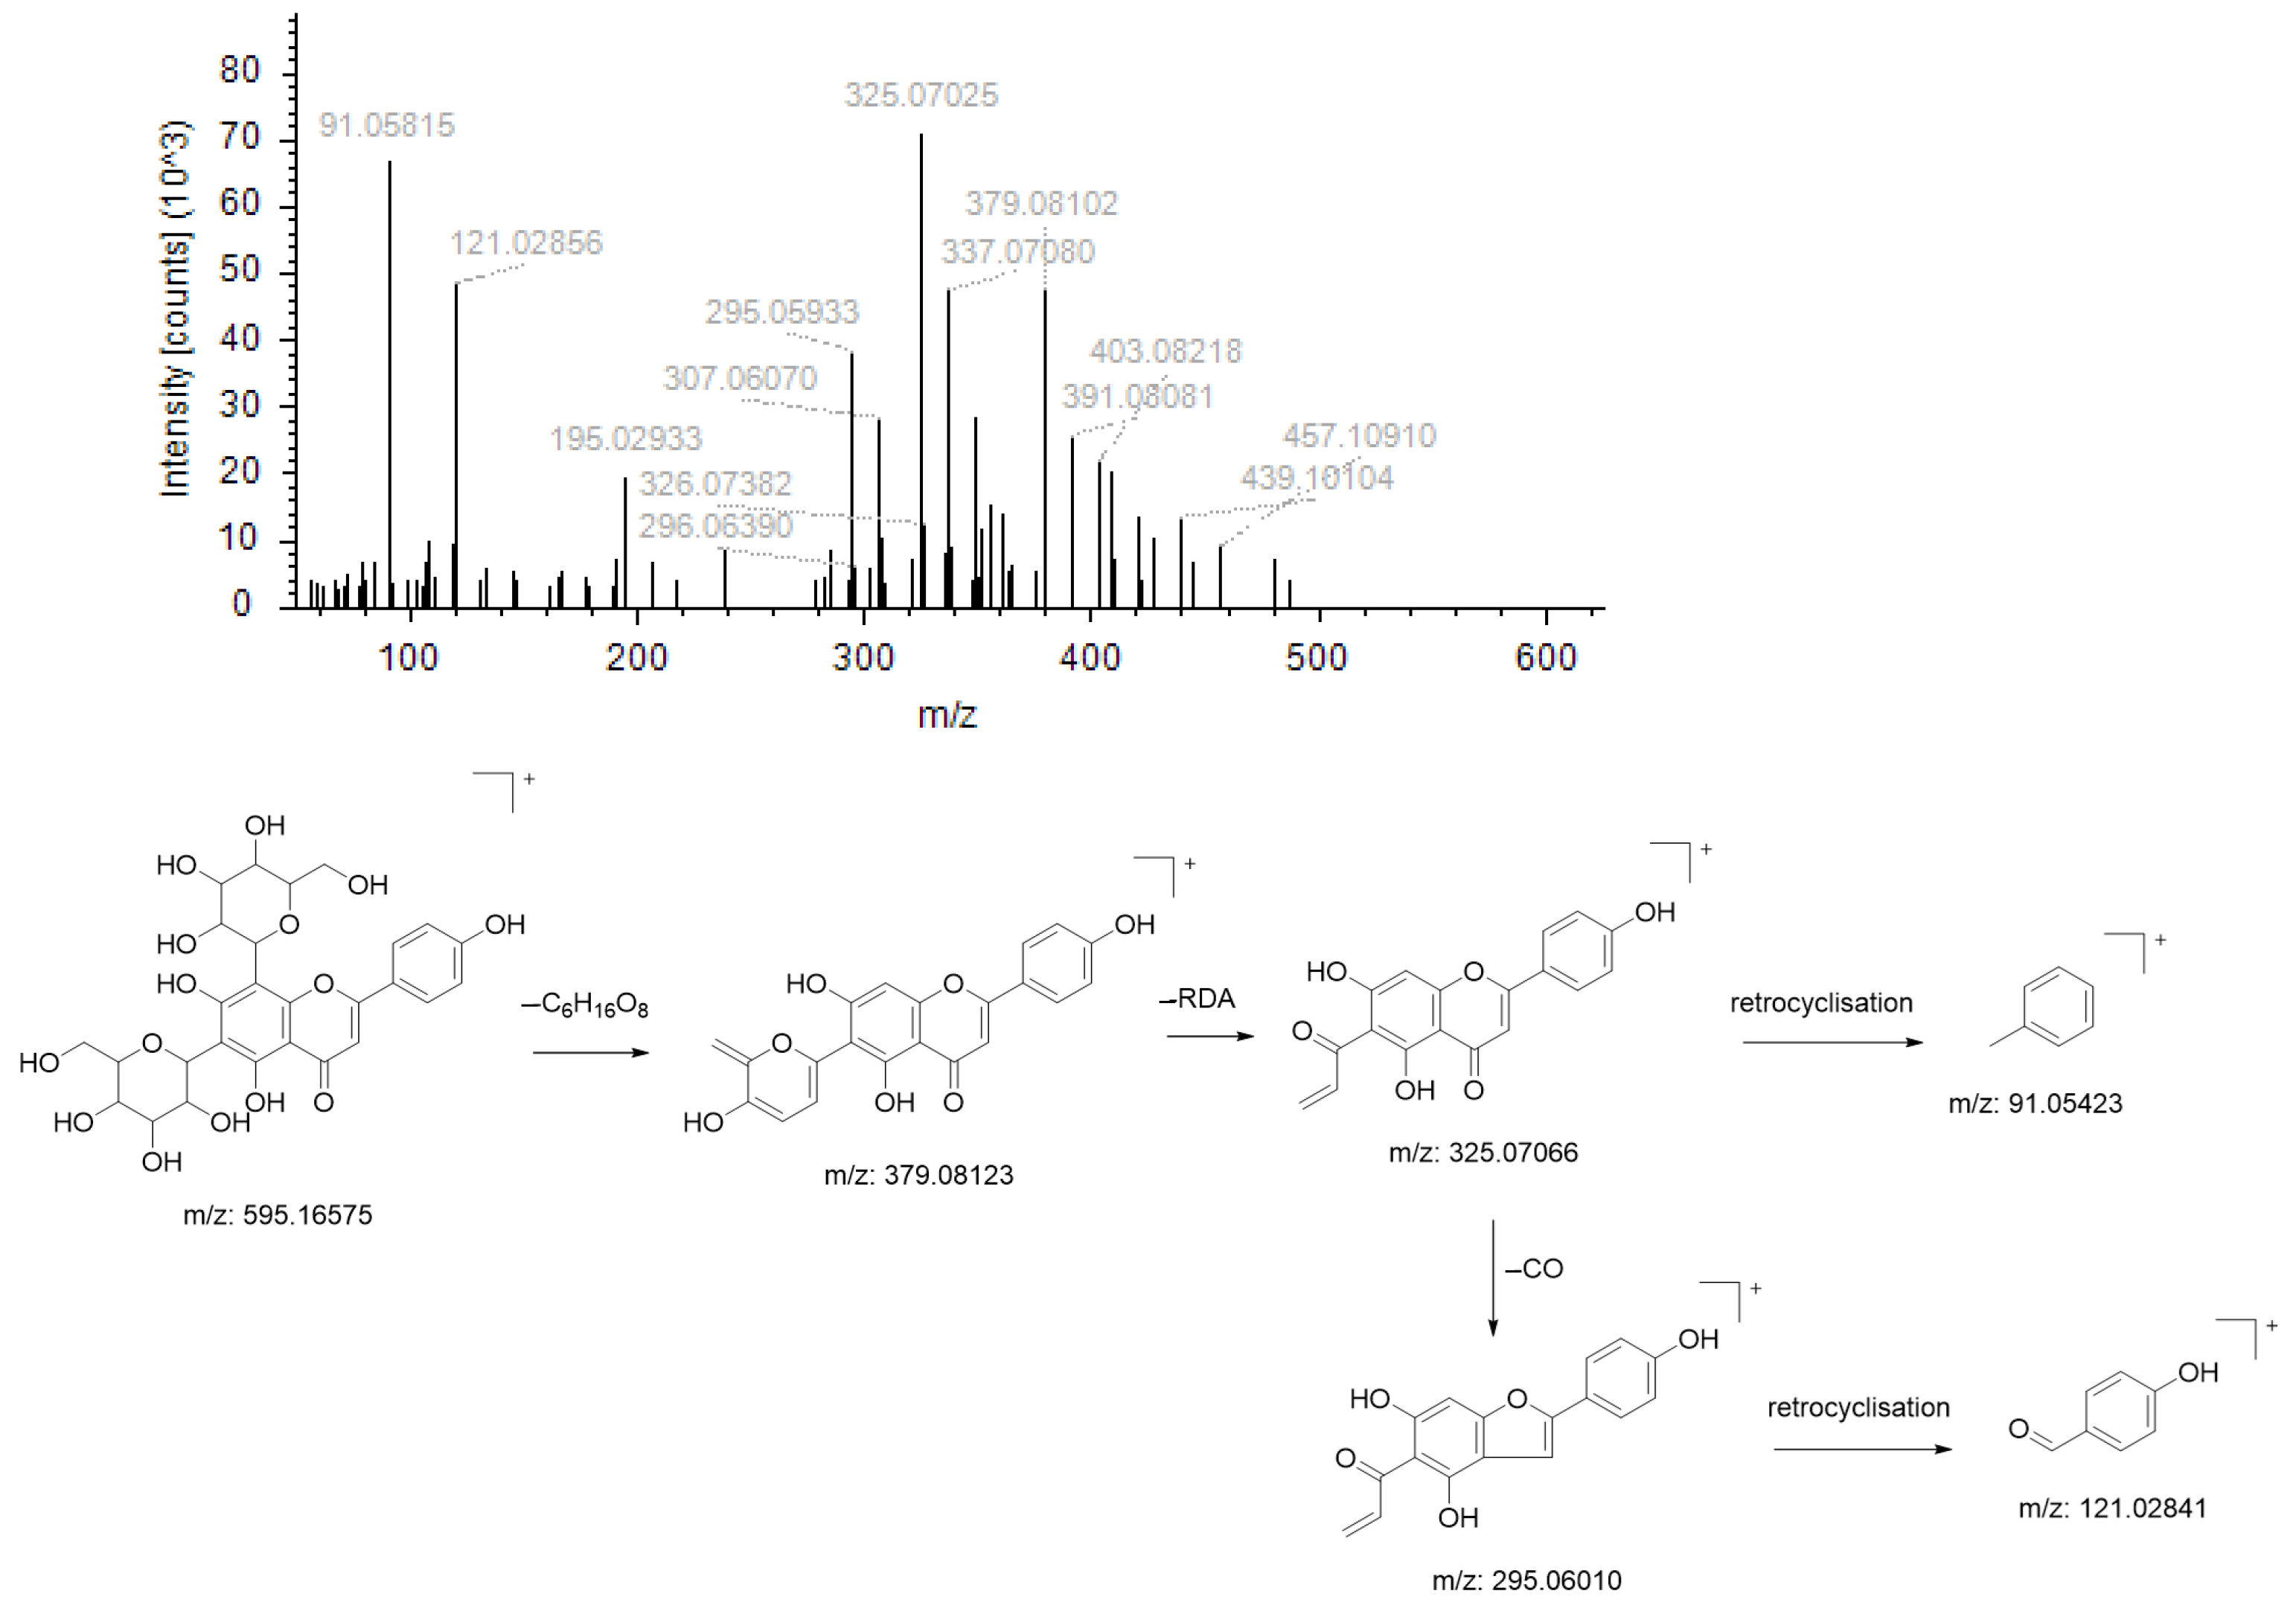
2.1. UHPLC-MS
2.2. Results and Analyses of Single-Factor Experiments
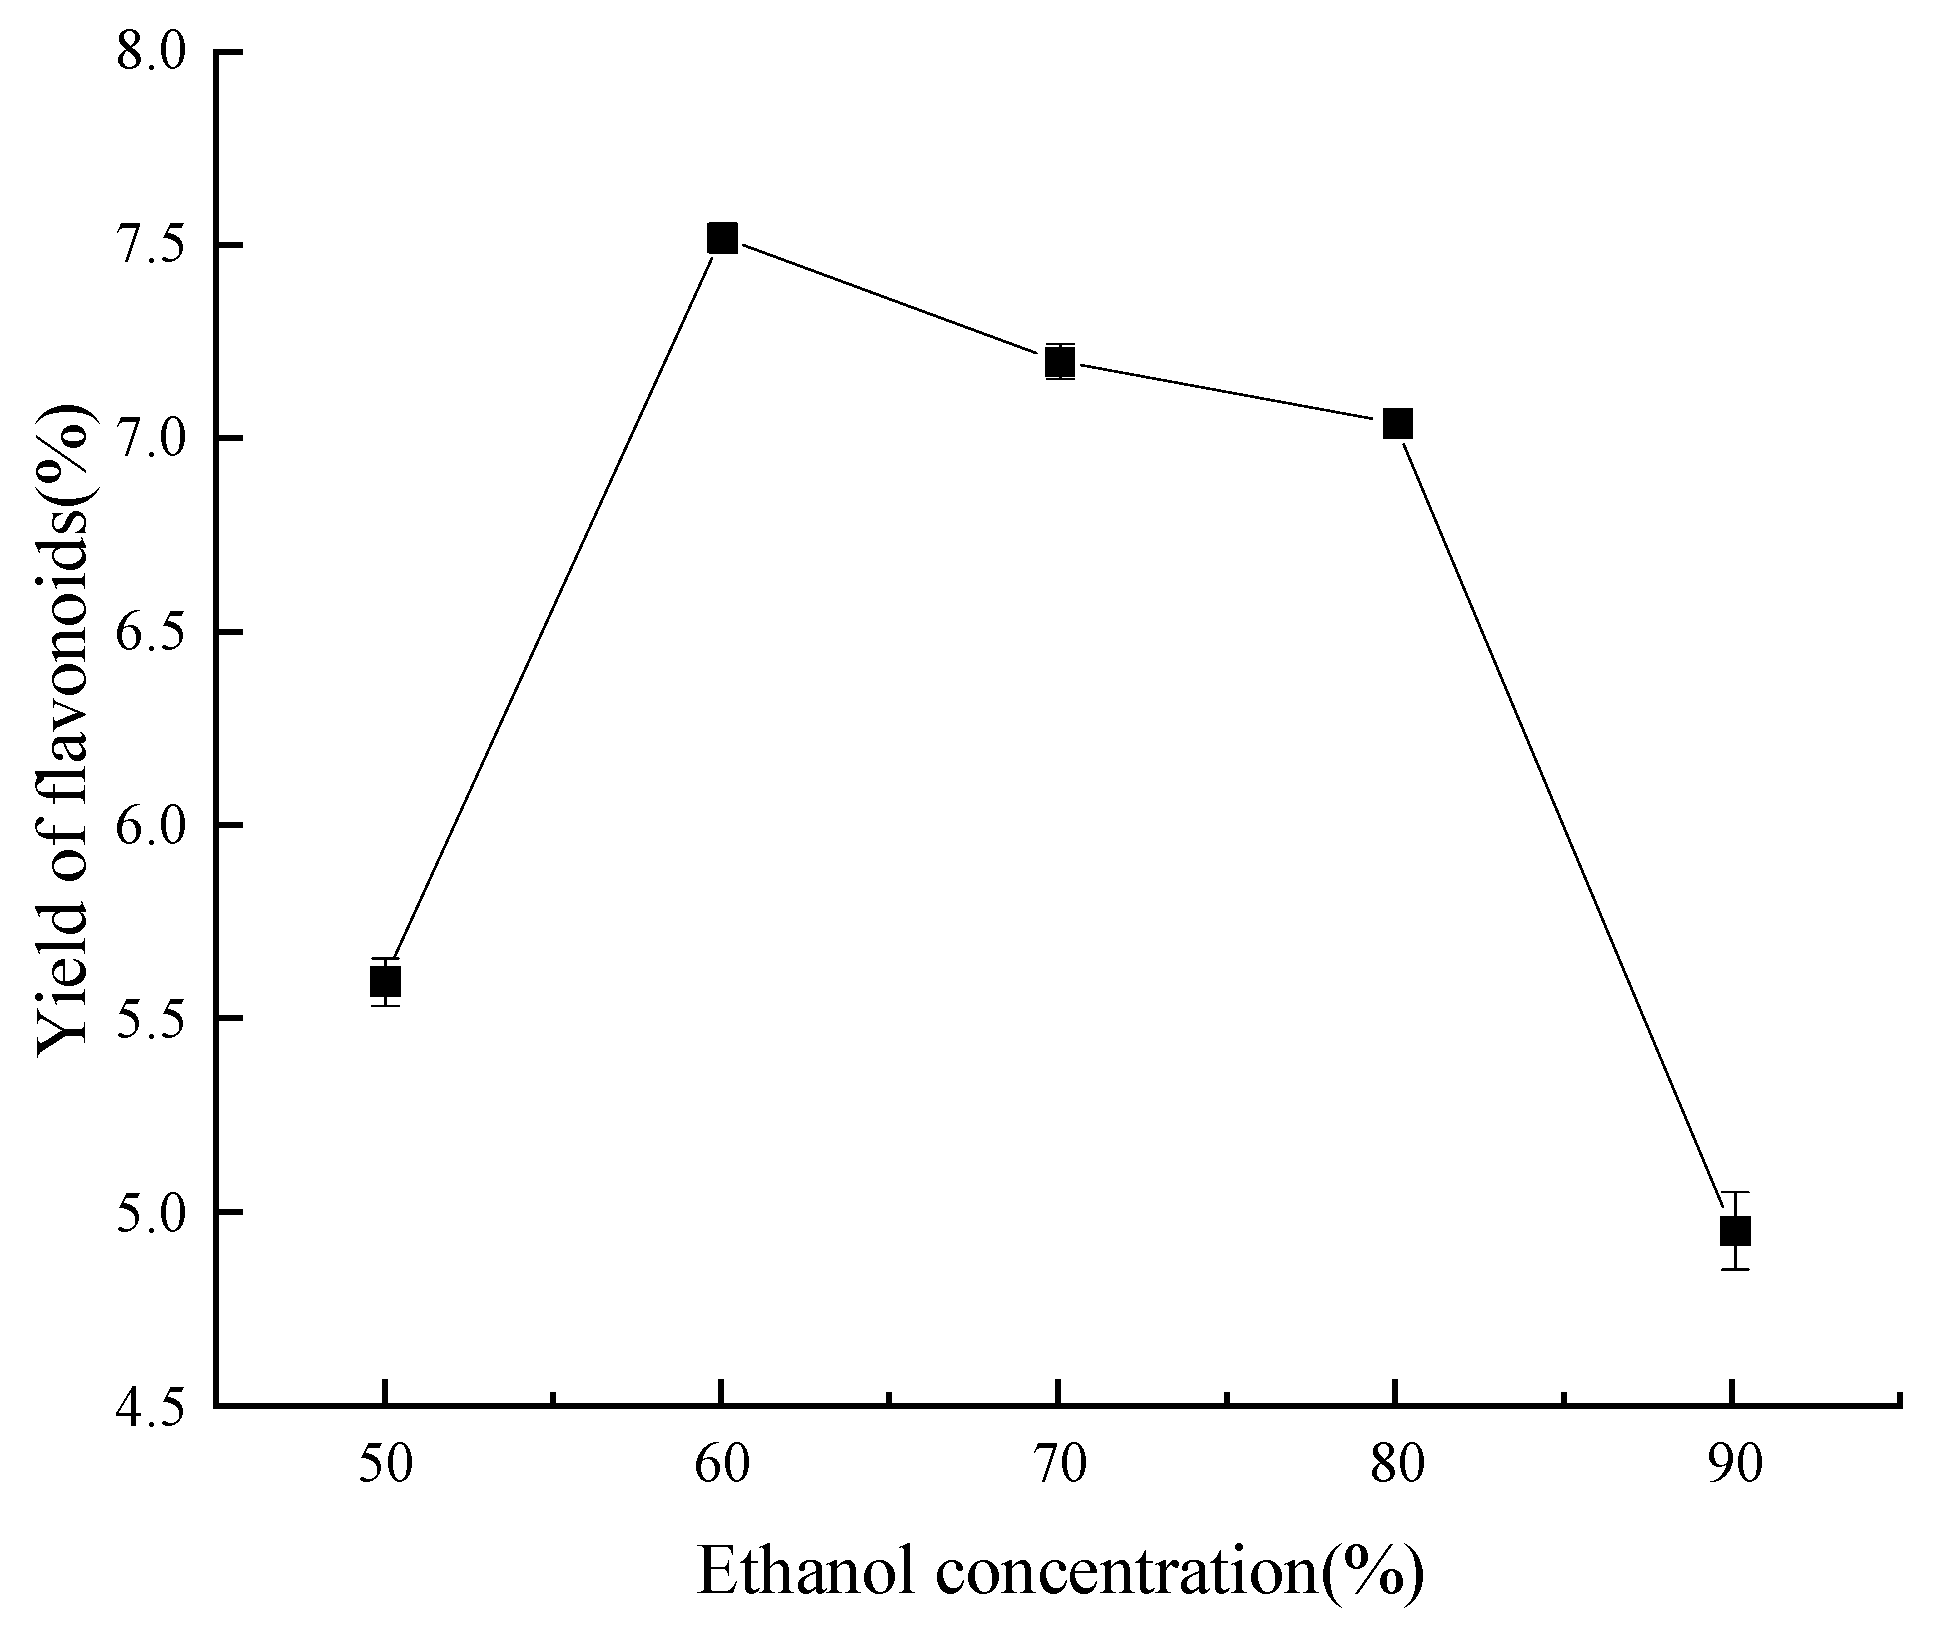
2.2.1. Ethanol Concentration
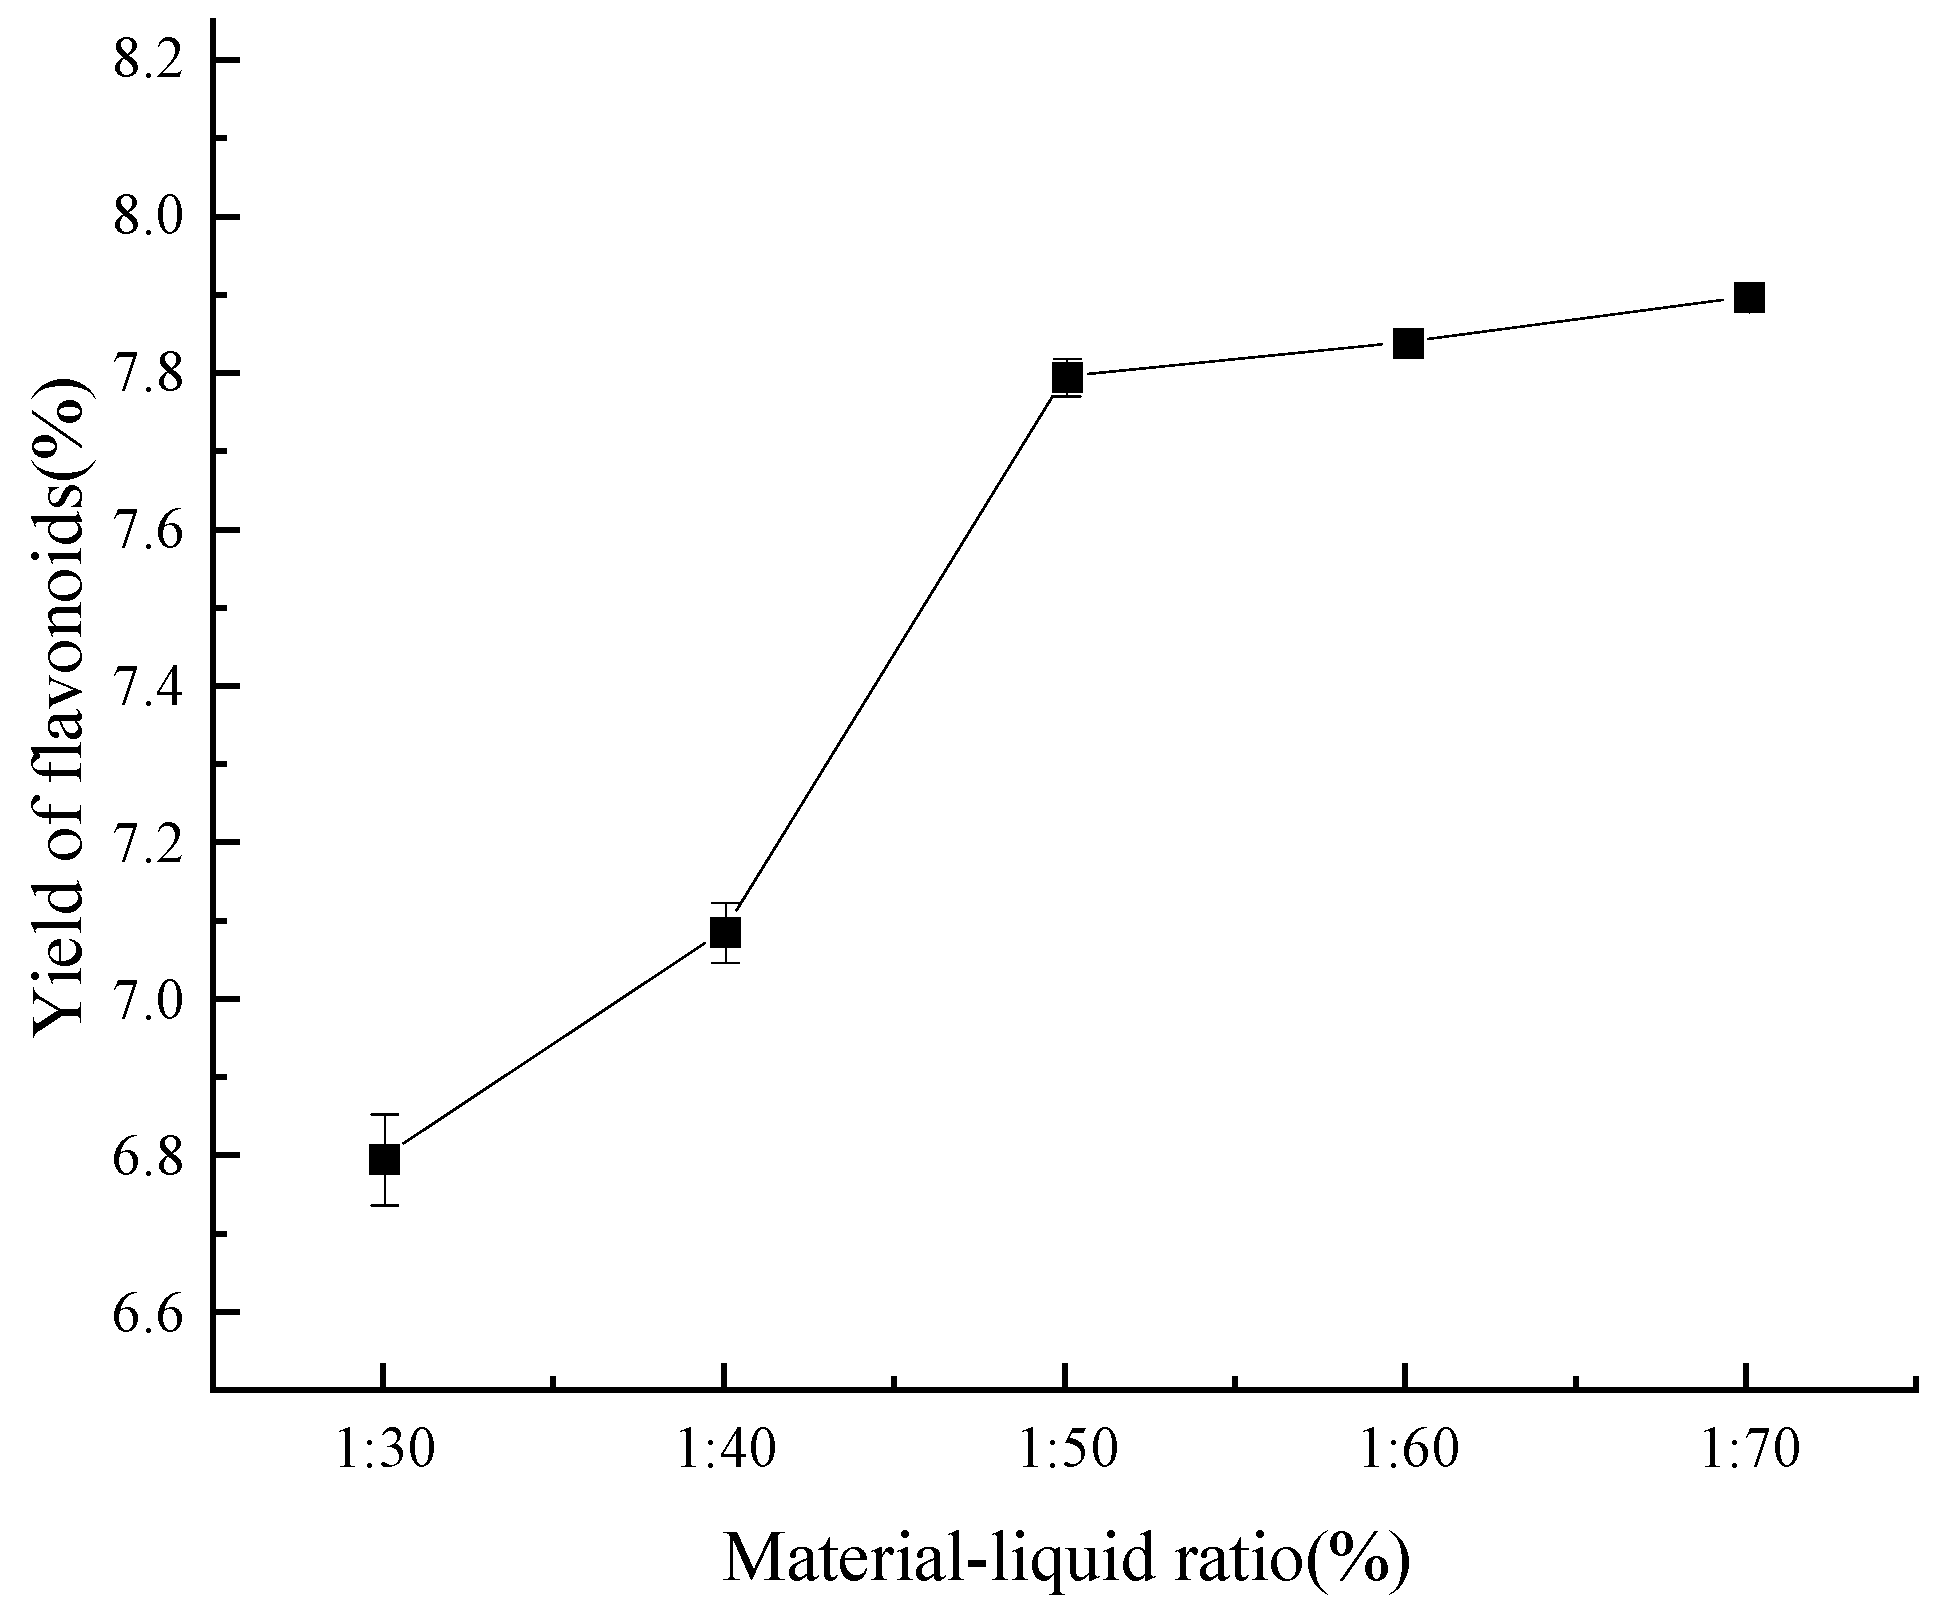
2.2.2. Material–Liquid Ratio
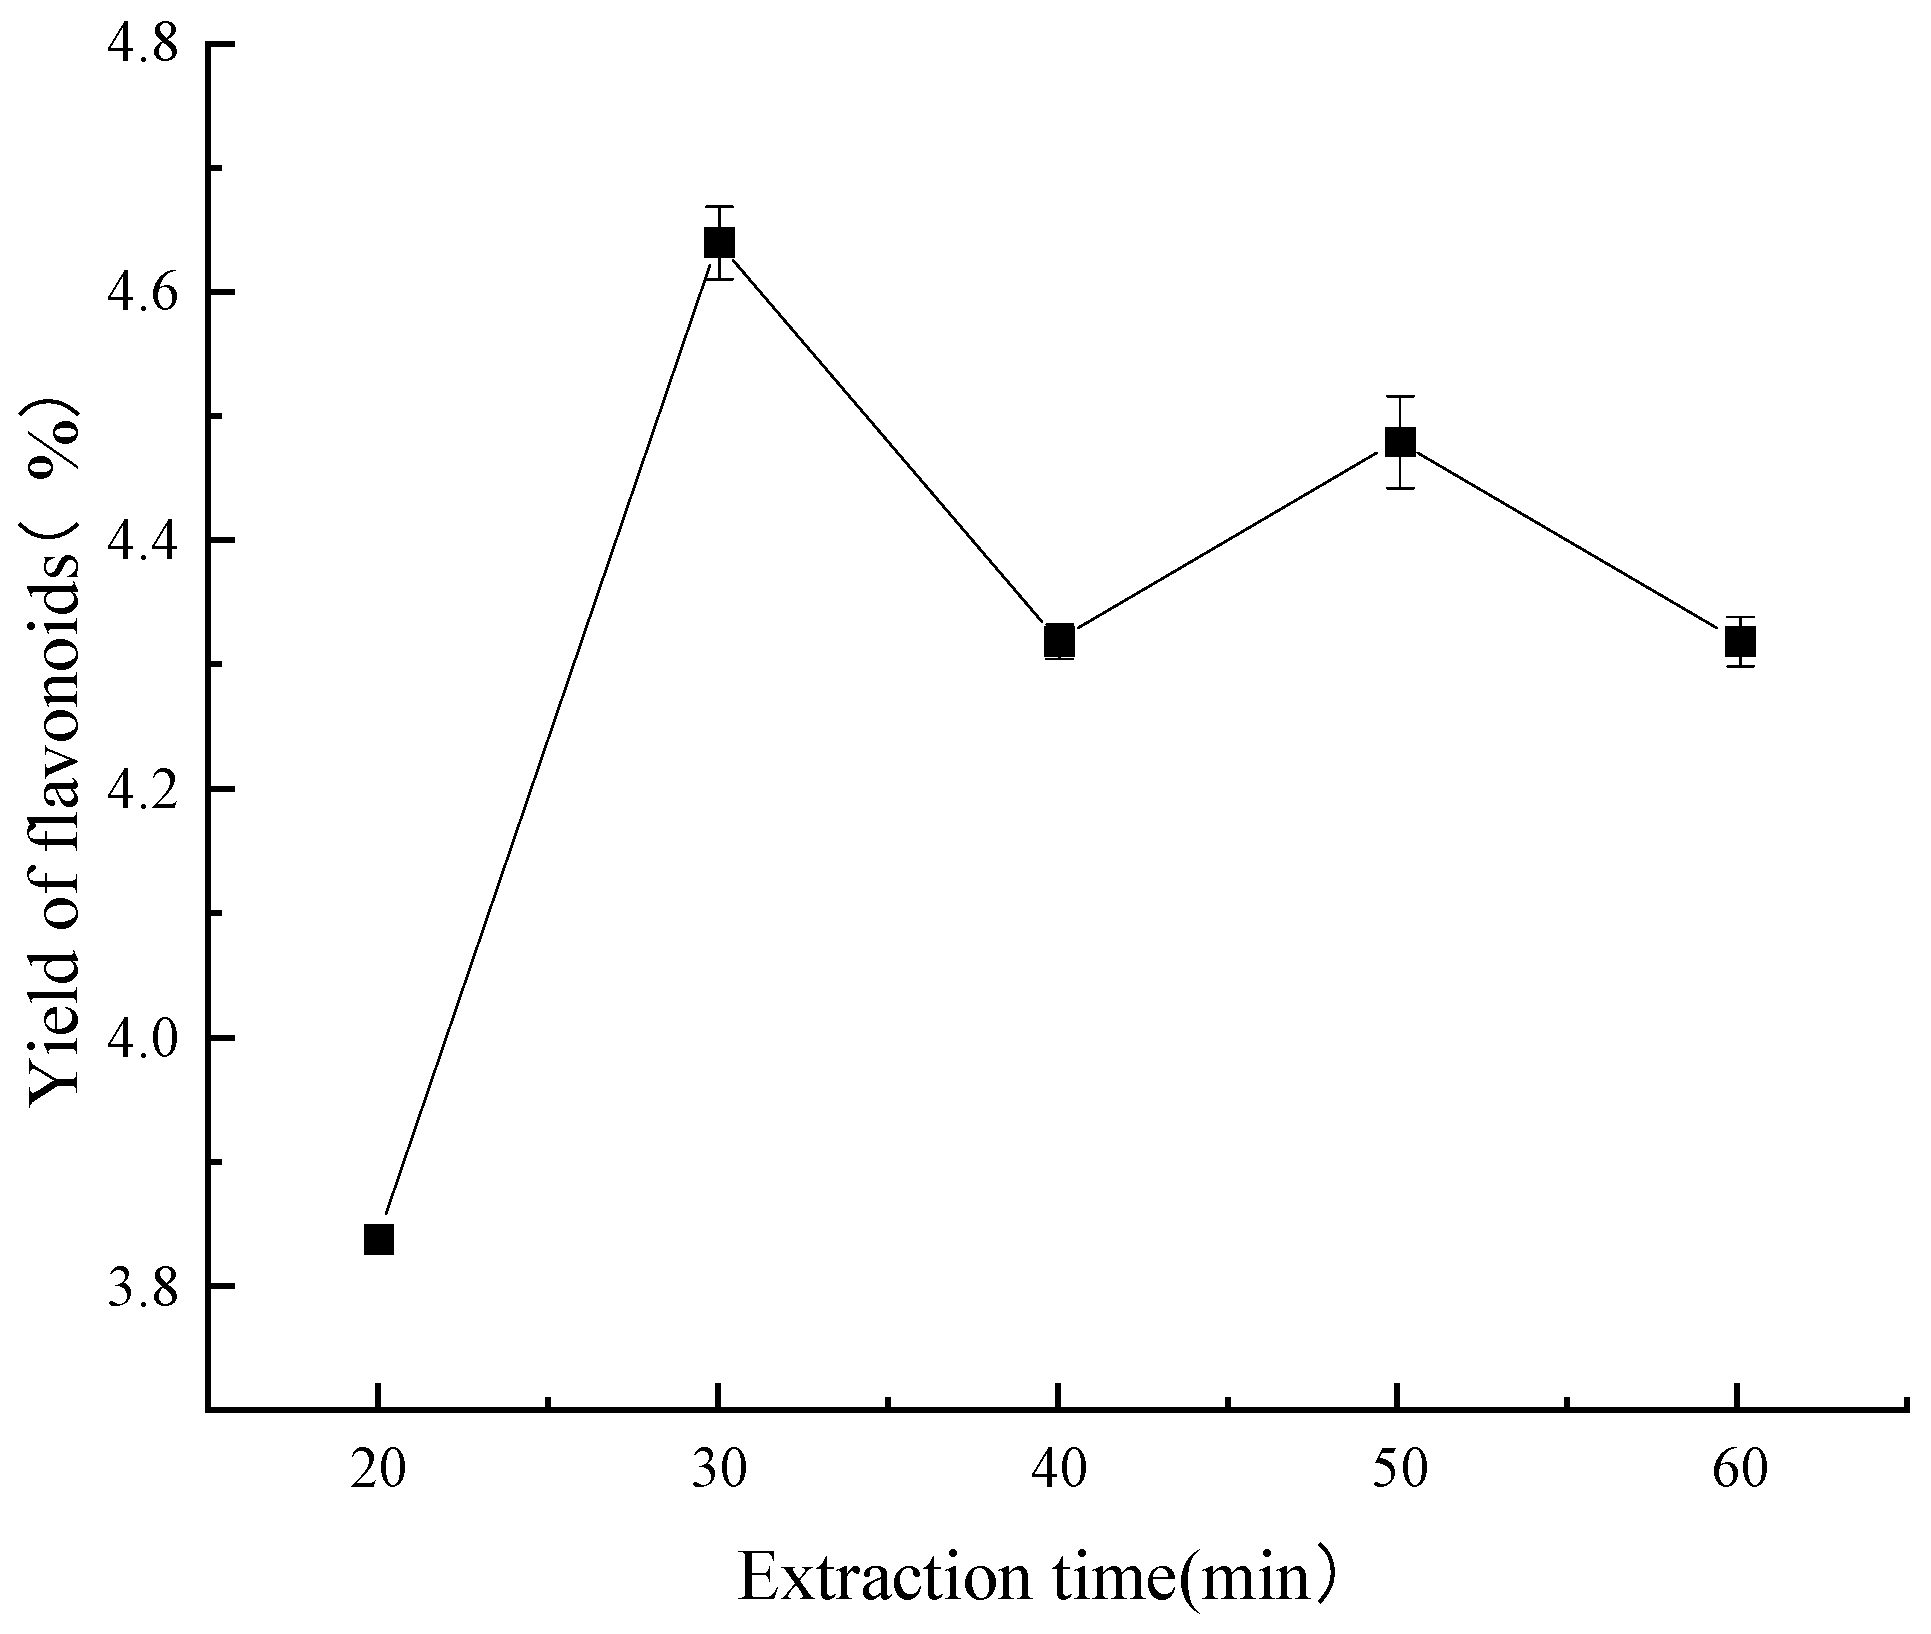
2.2.3. Extraction Time
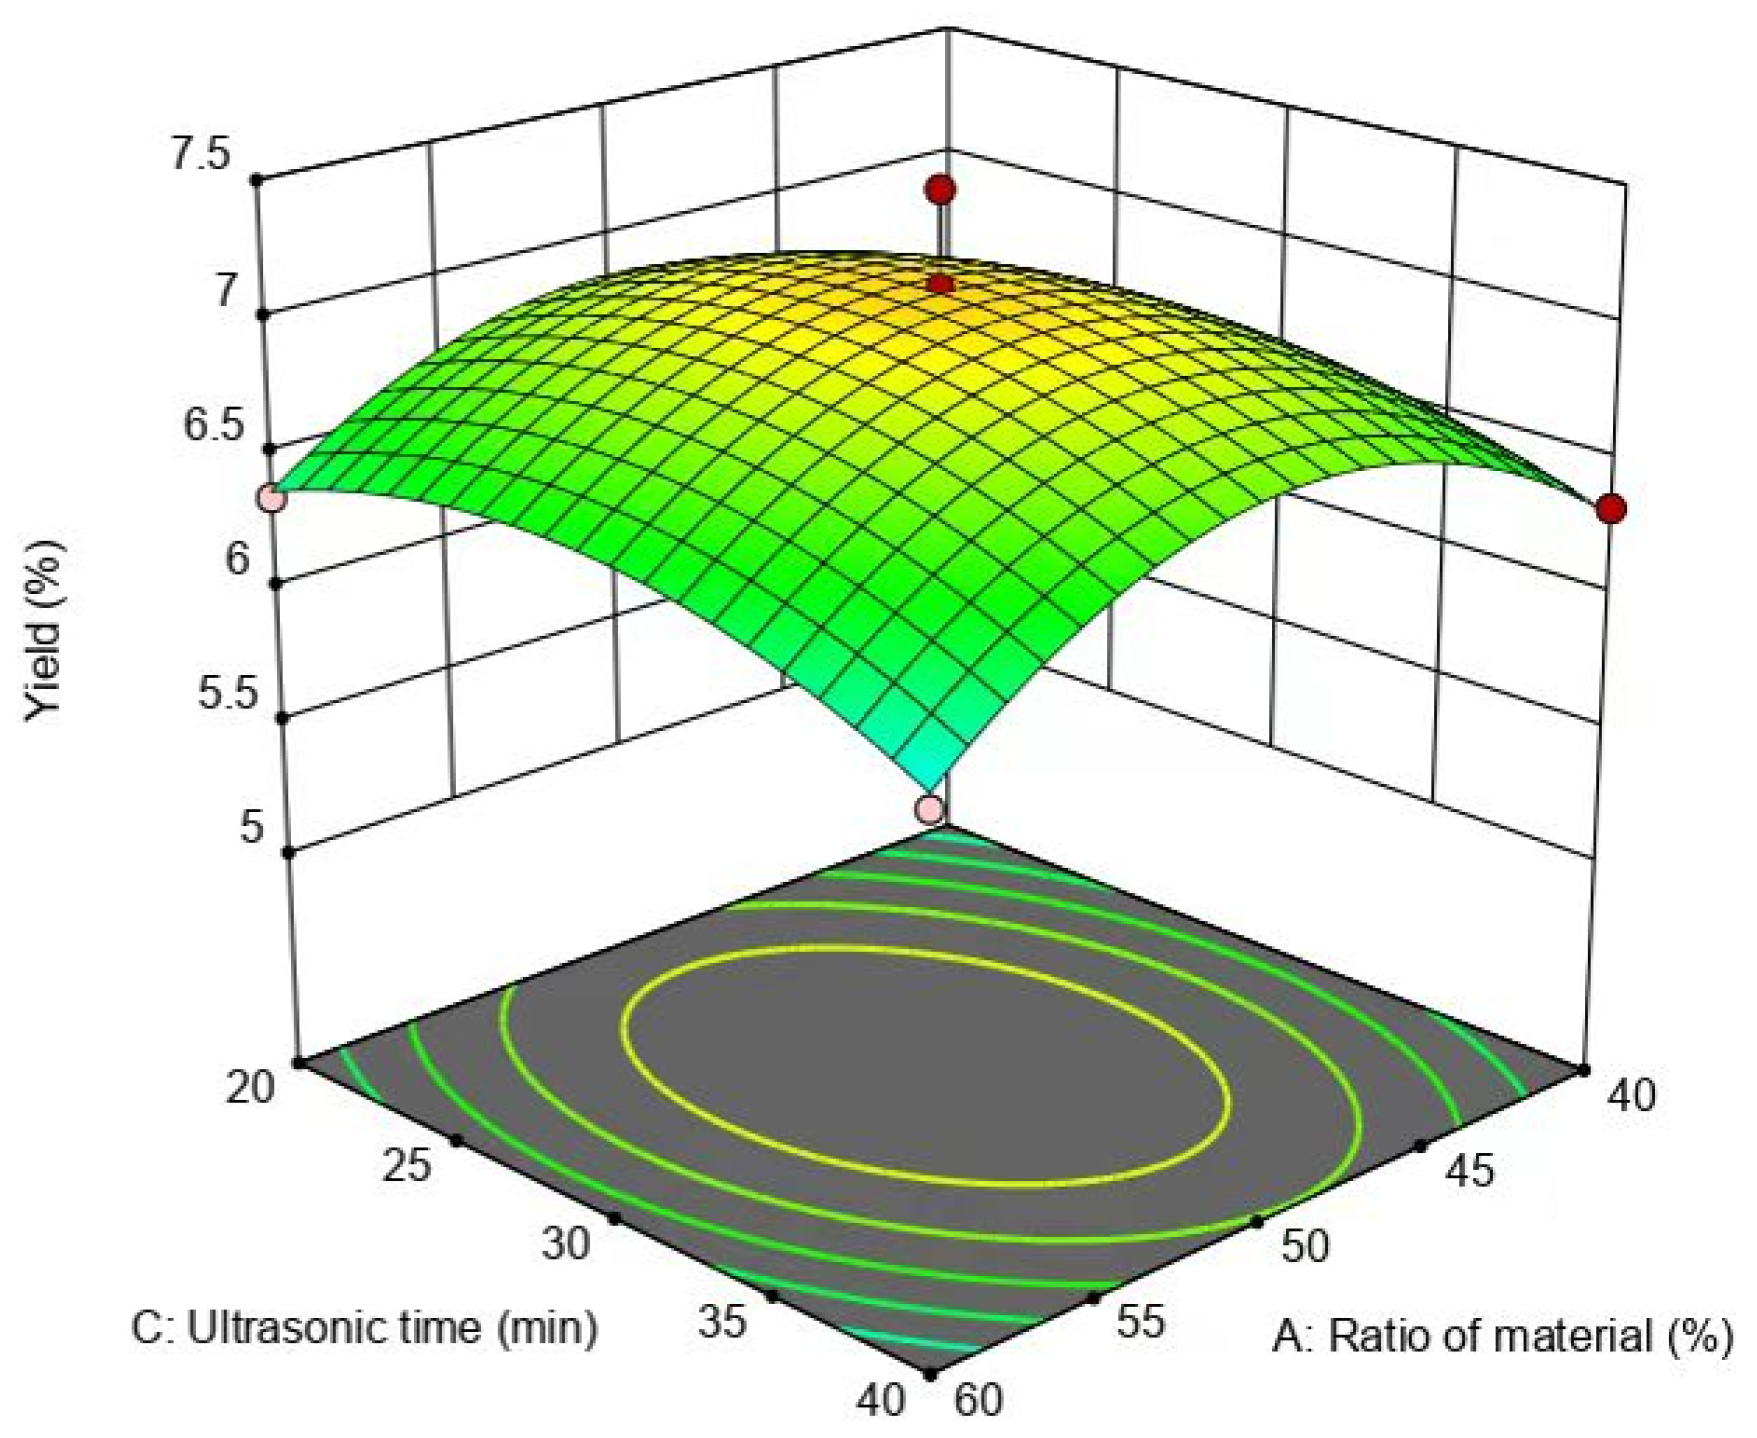
2.3. Analysis of Response Surface Optimization Extraction Methods
2.3.1. Box–Behnken Experimental Design and Results
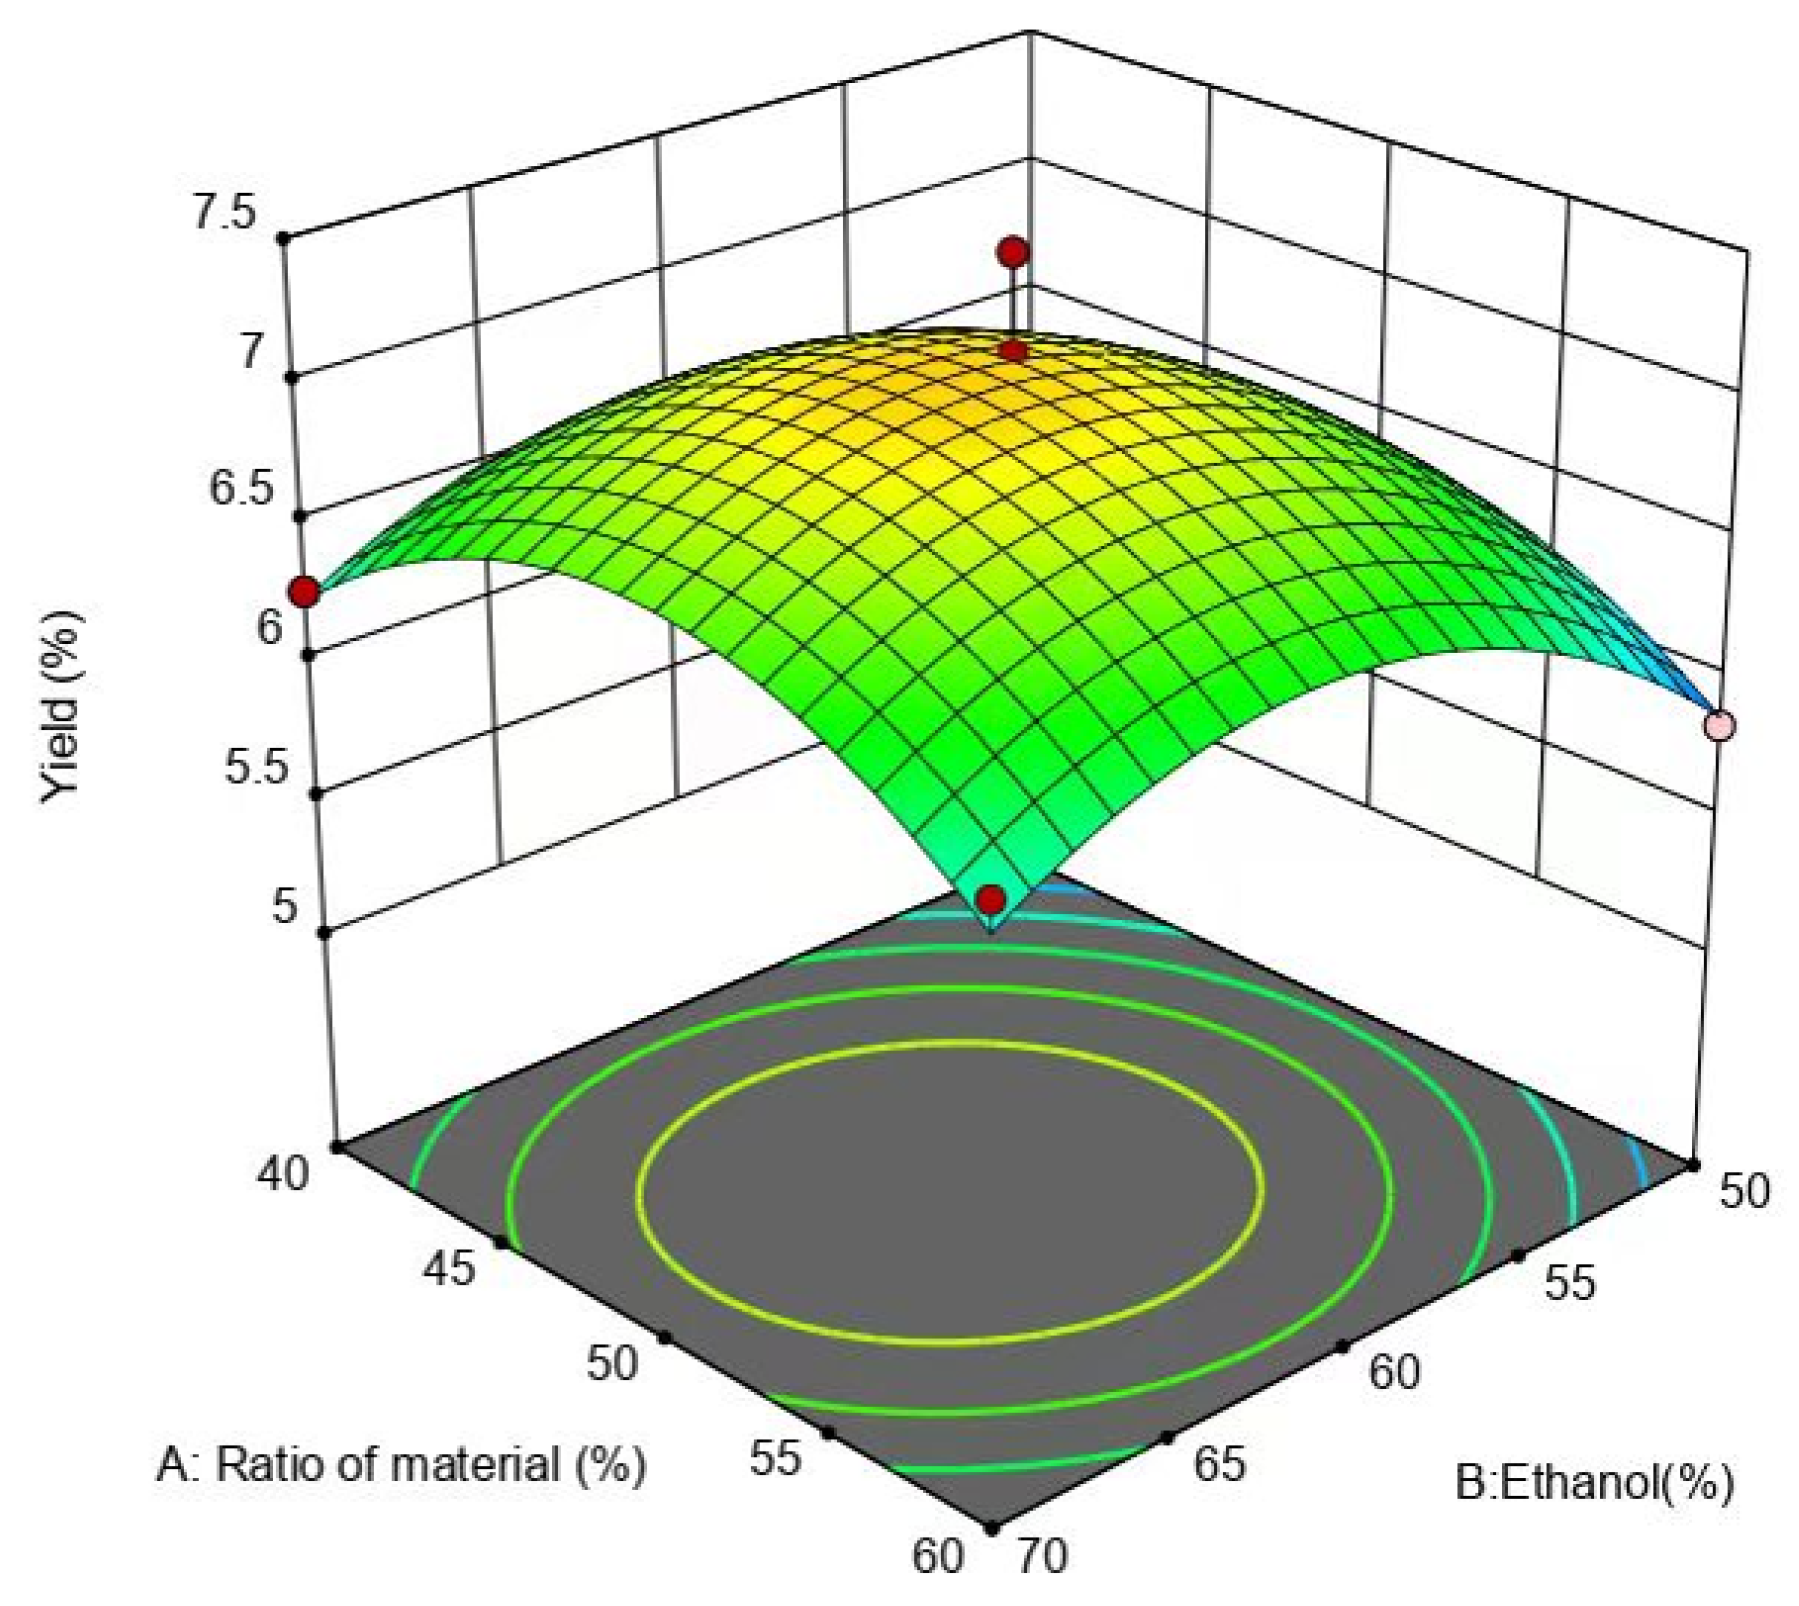
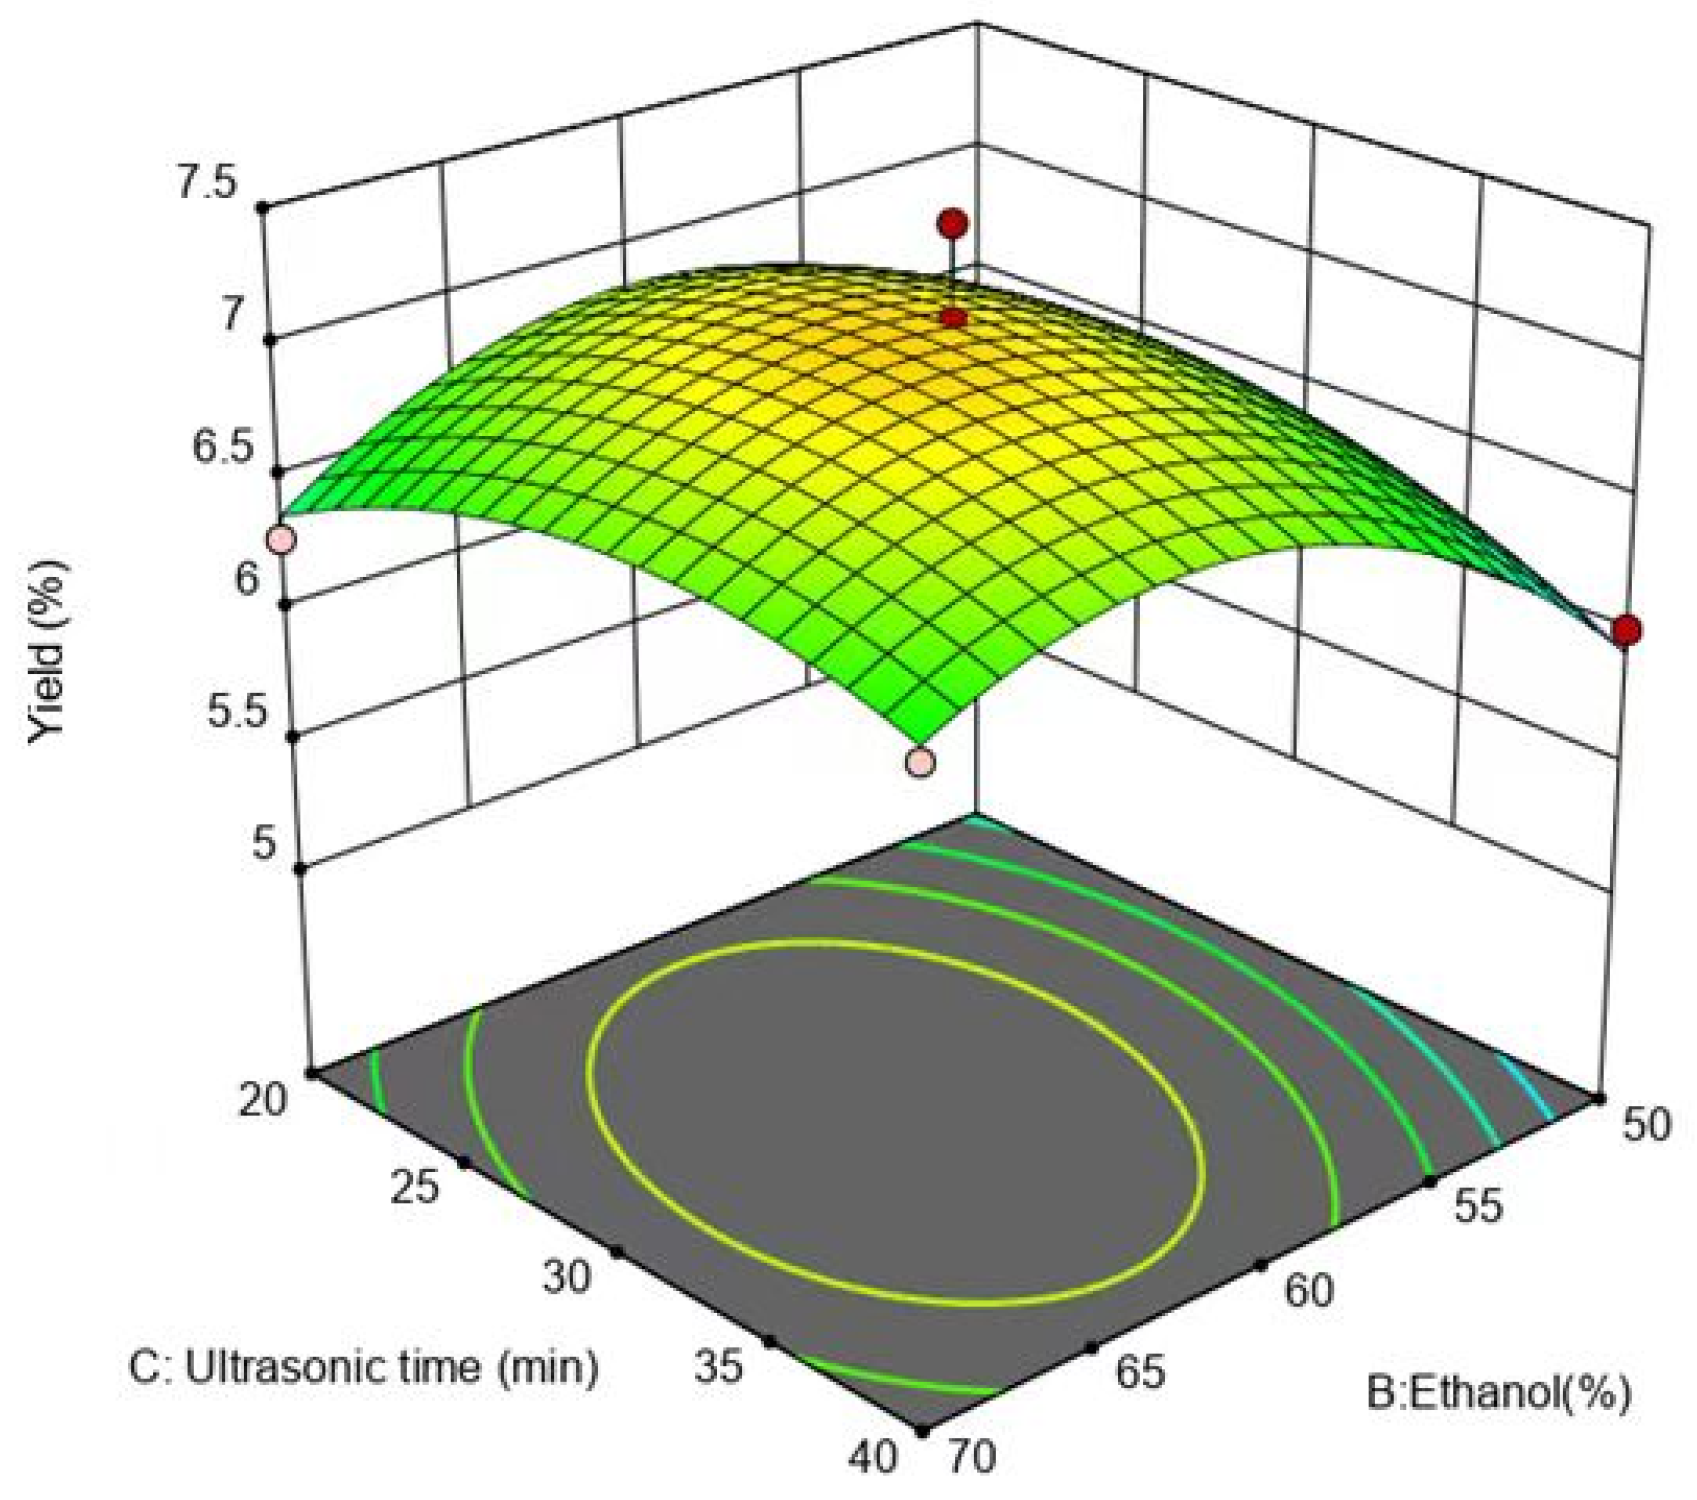
2.3.2. Response Surface Analysis (RSA)
2.3.3. Optimization of the Extraction Process
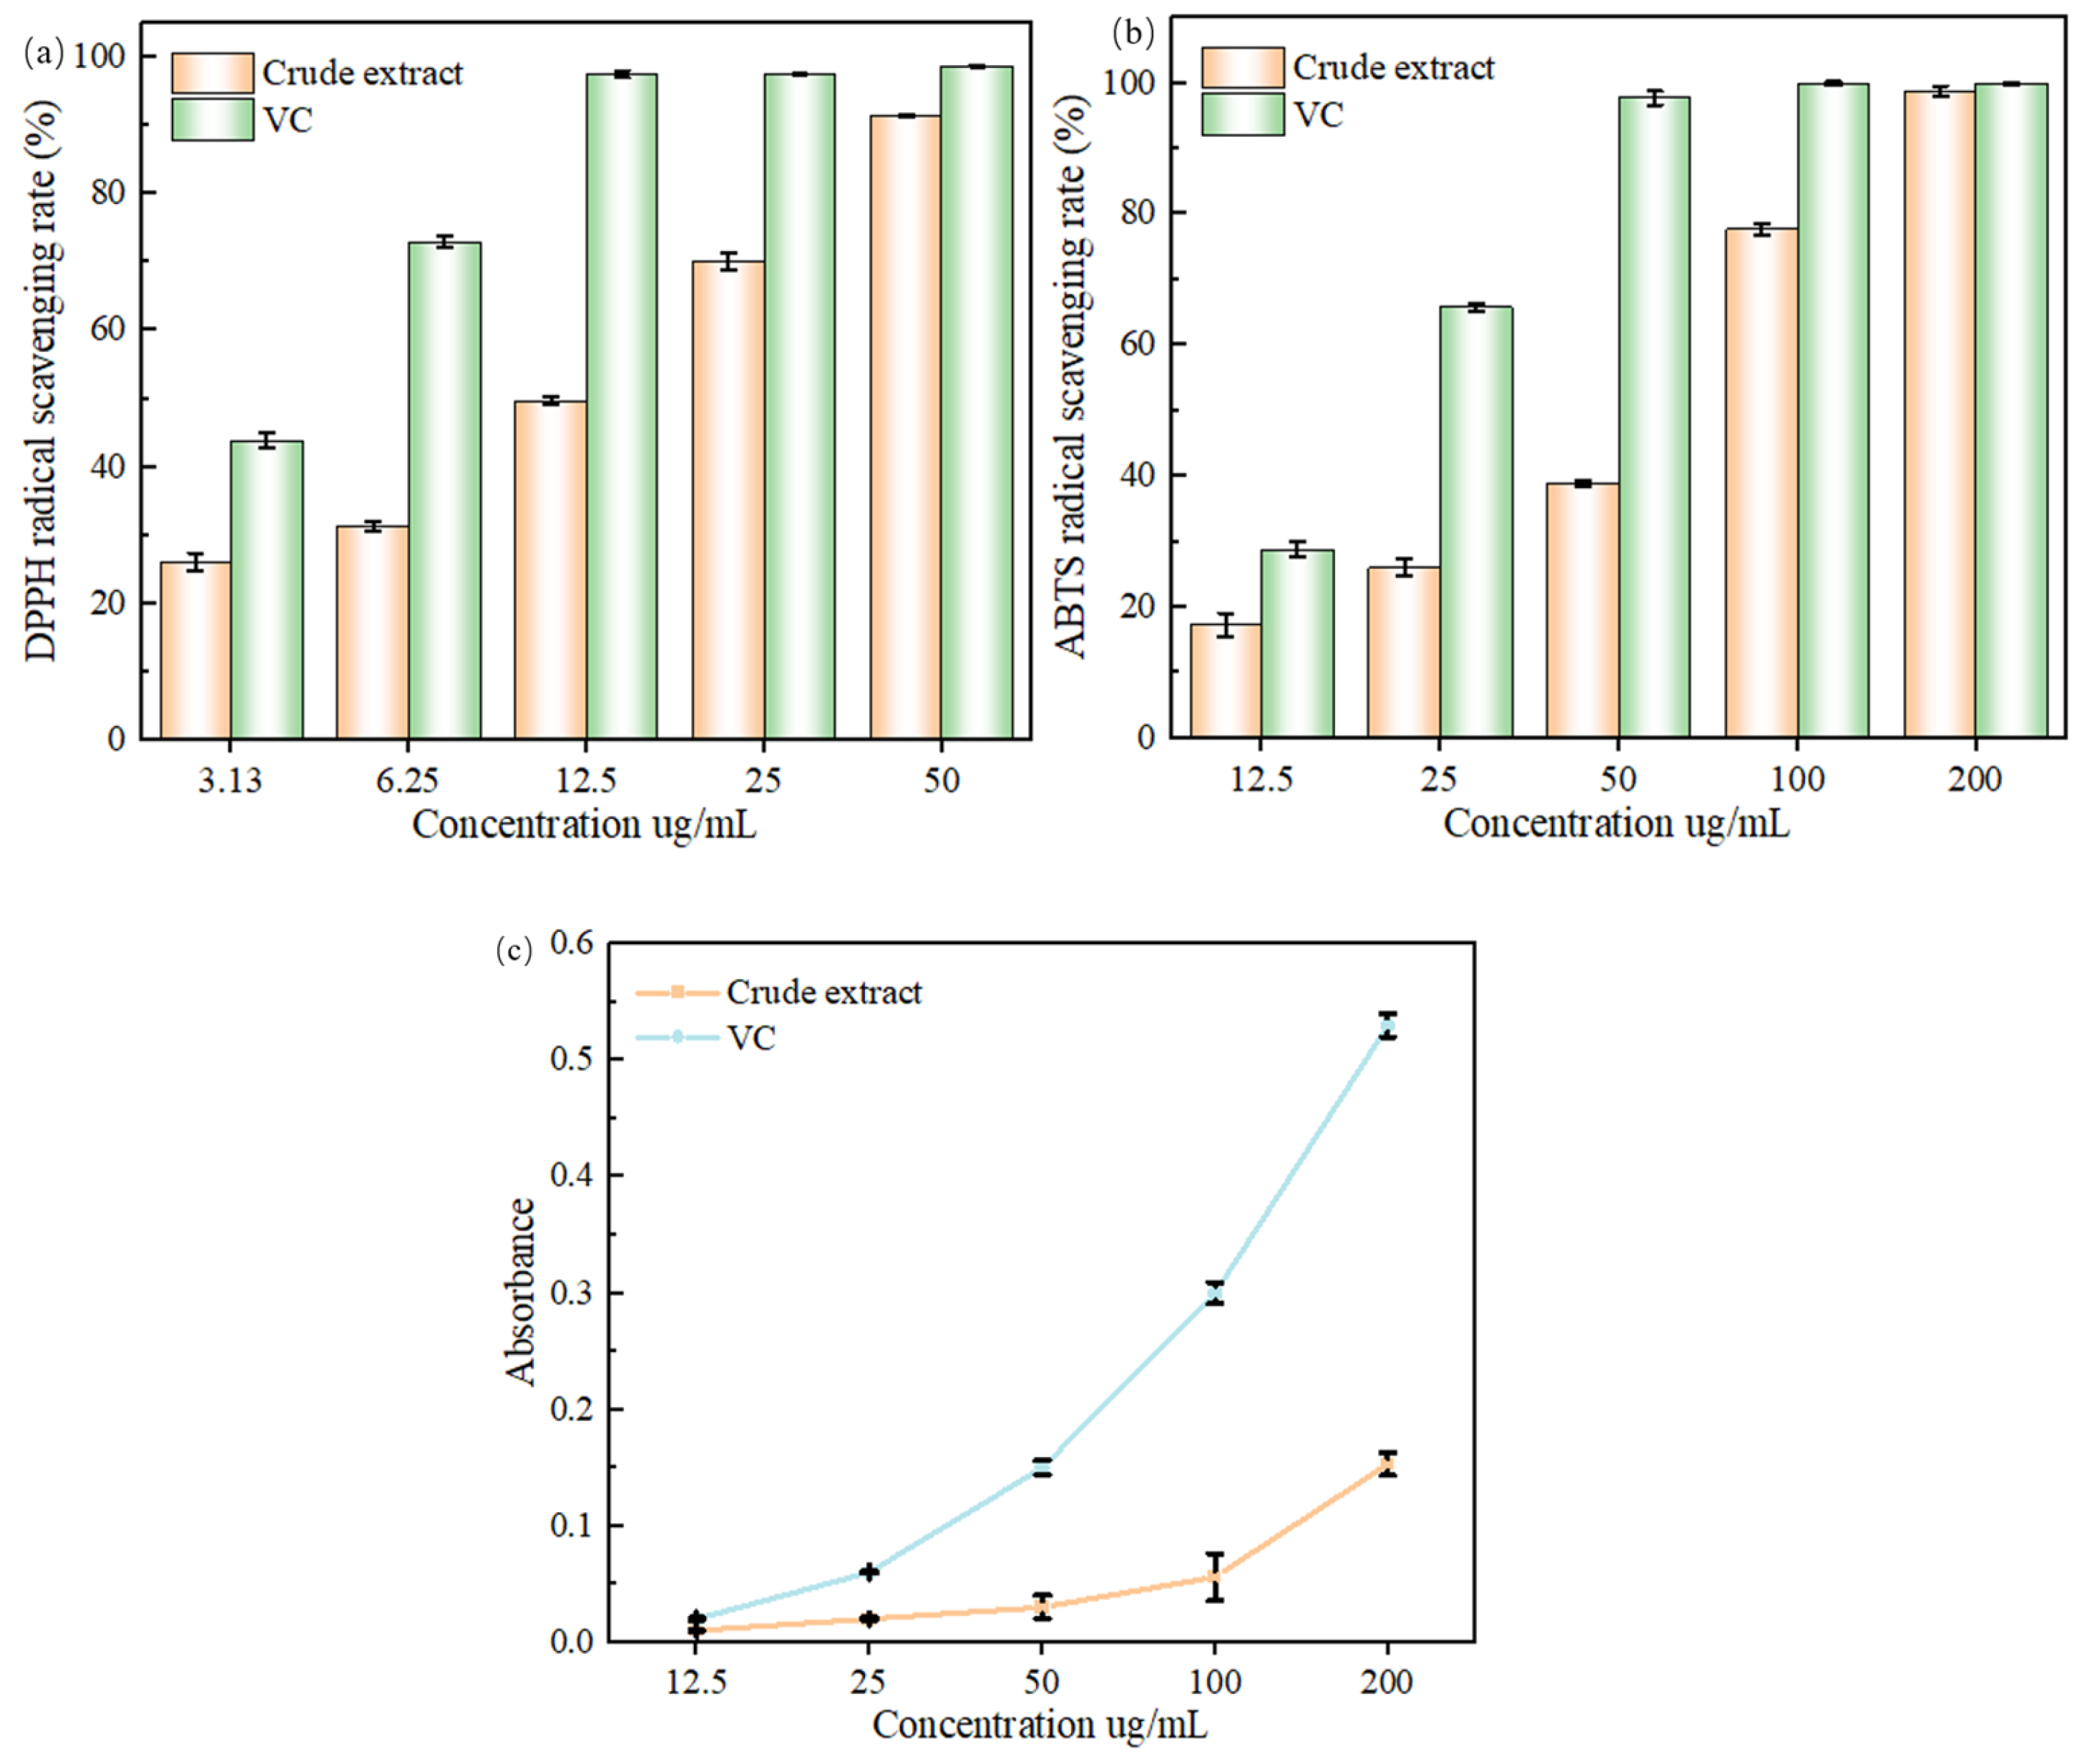
2.4. Antioxidant Capacity
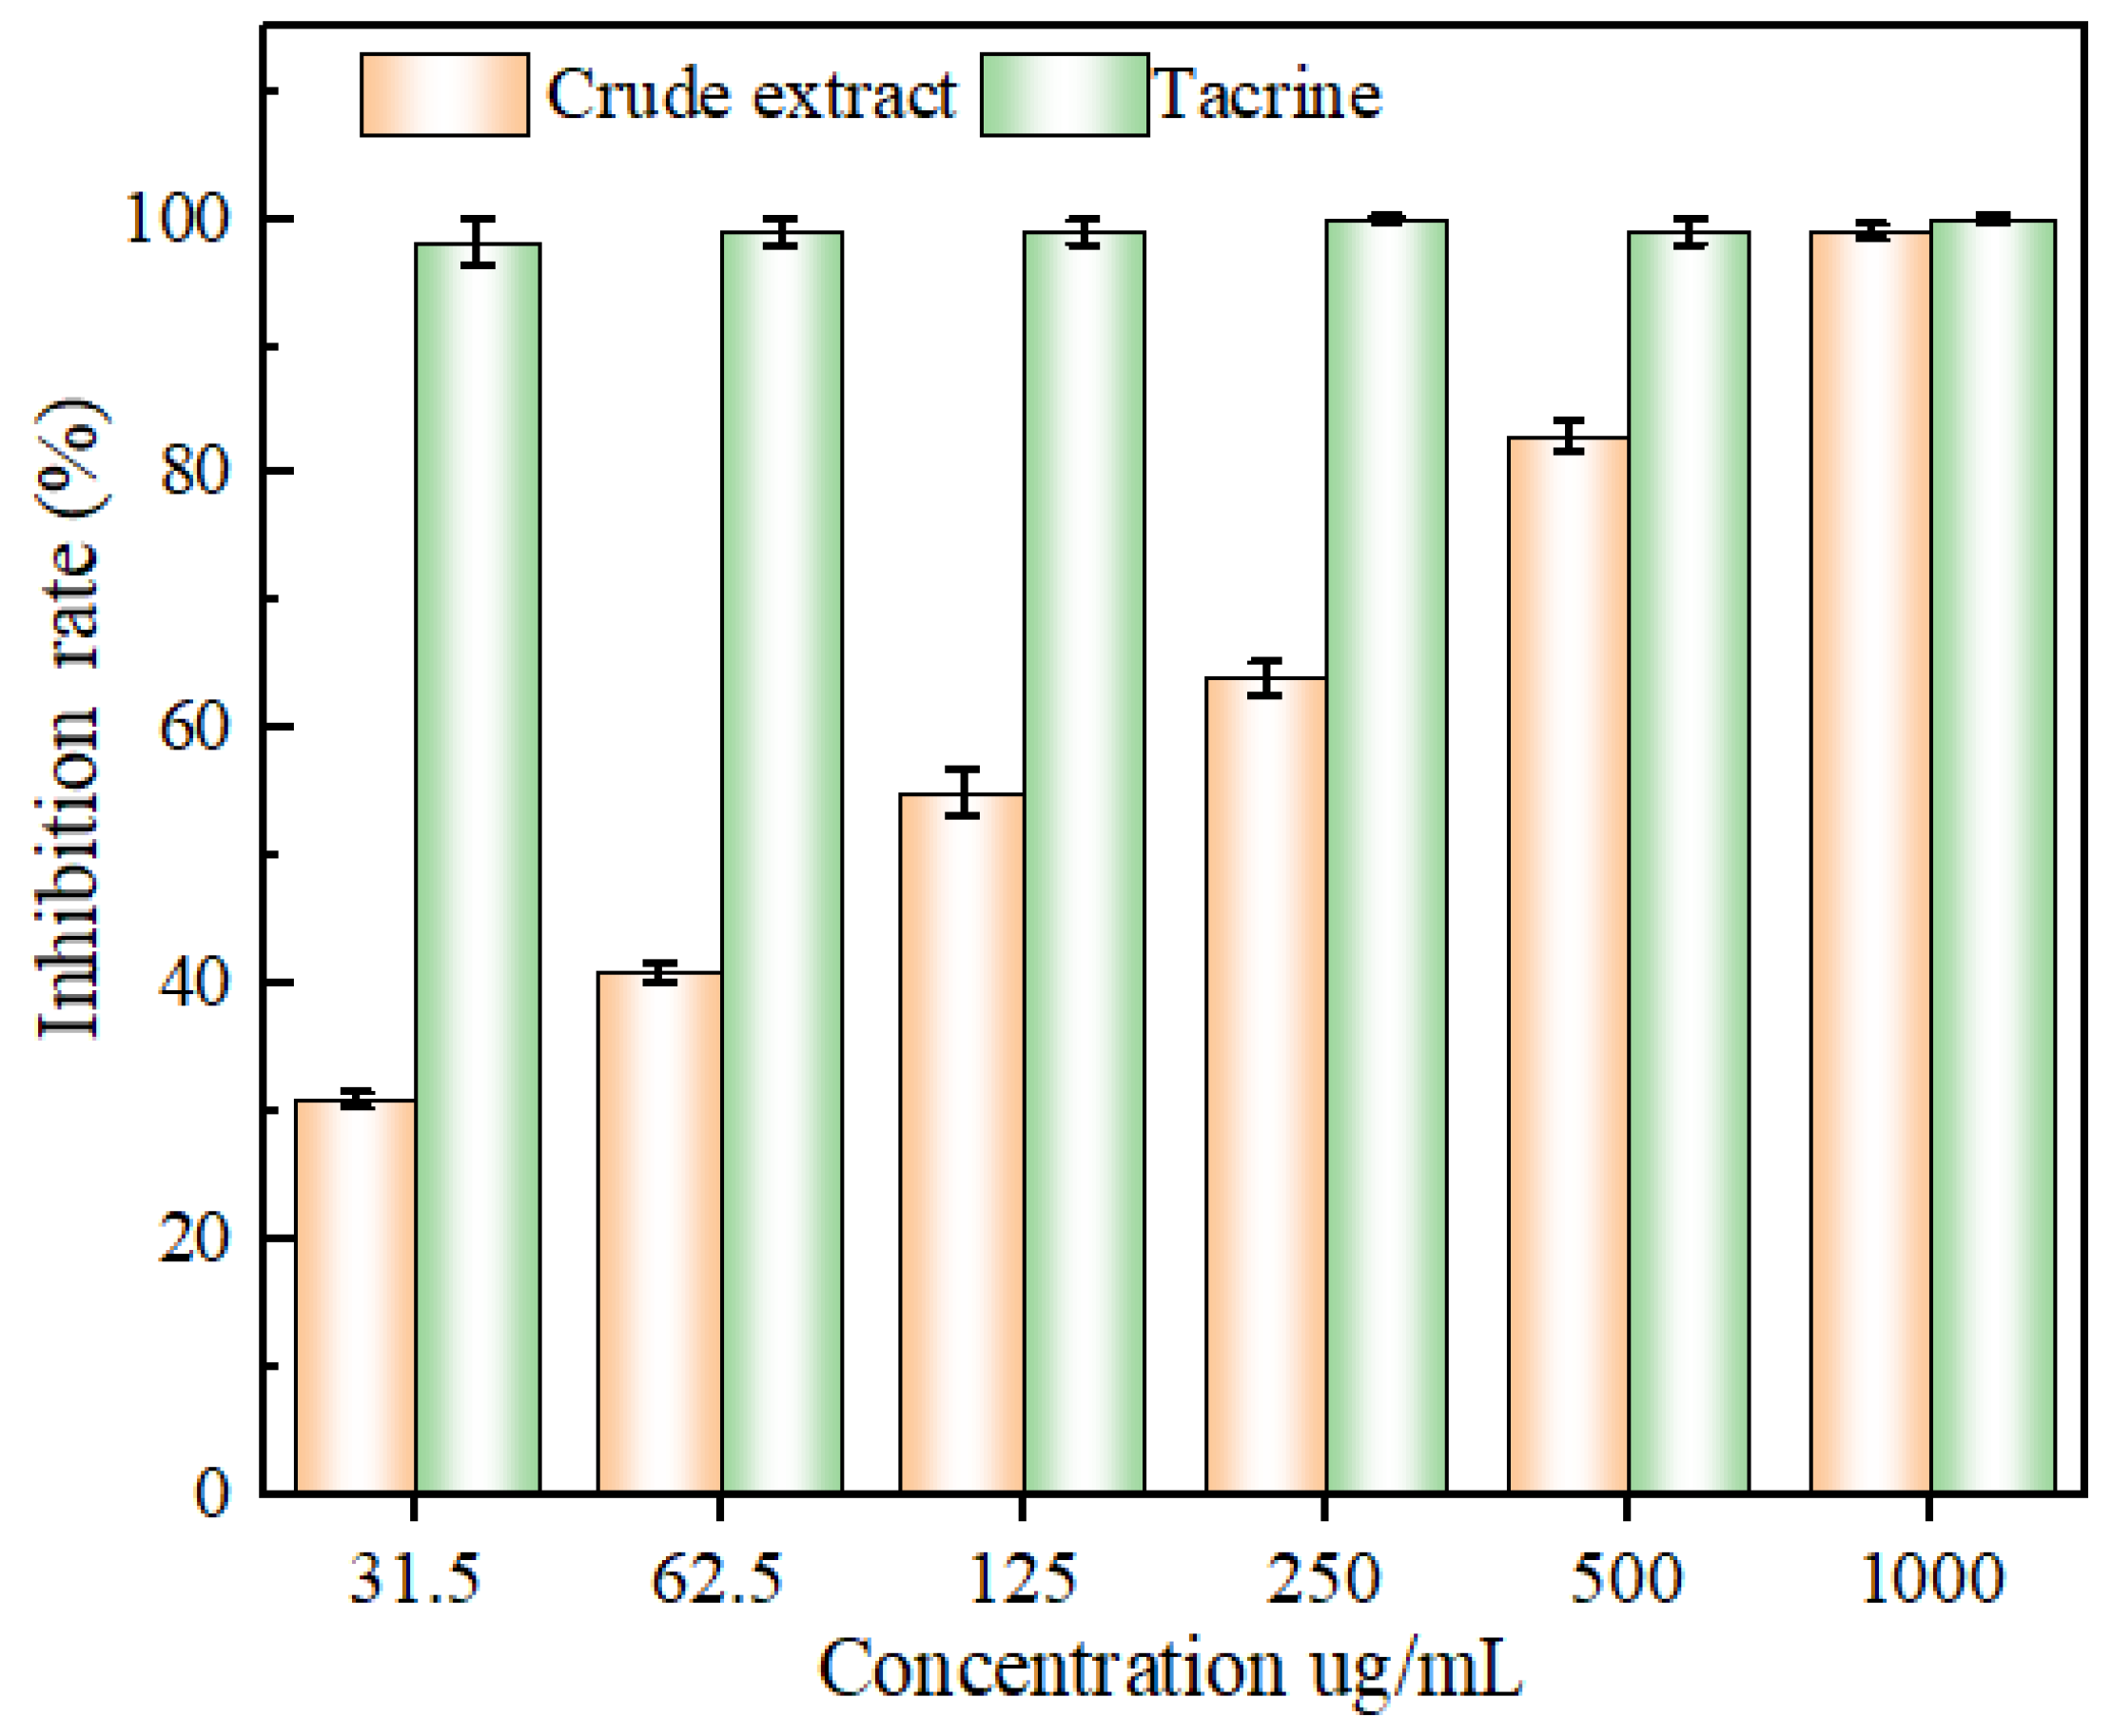
2.5. Acetylcholinesterase-Inhibitory Capacity
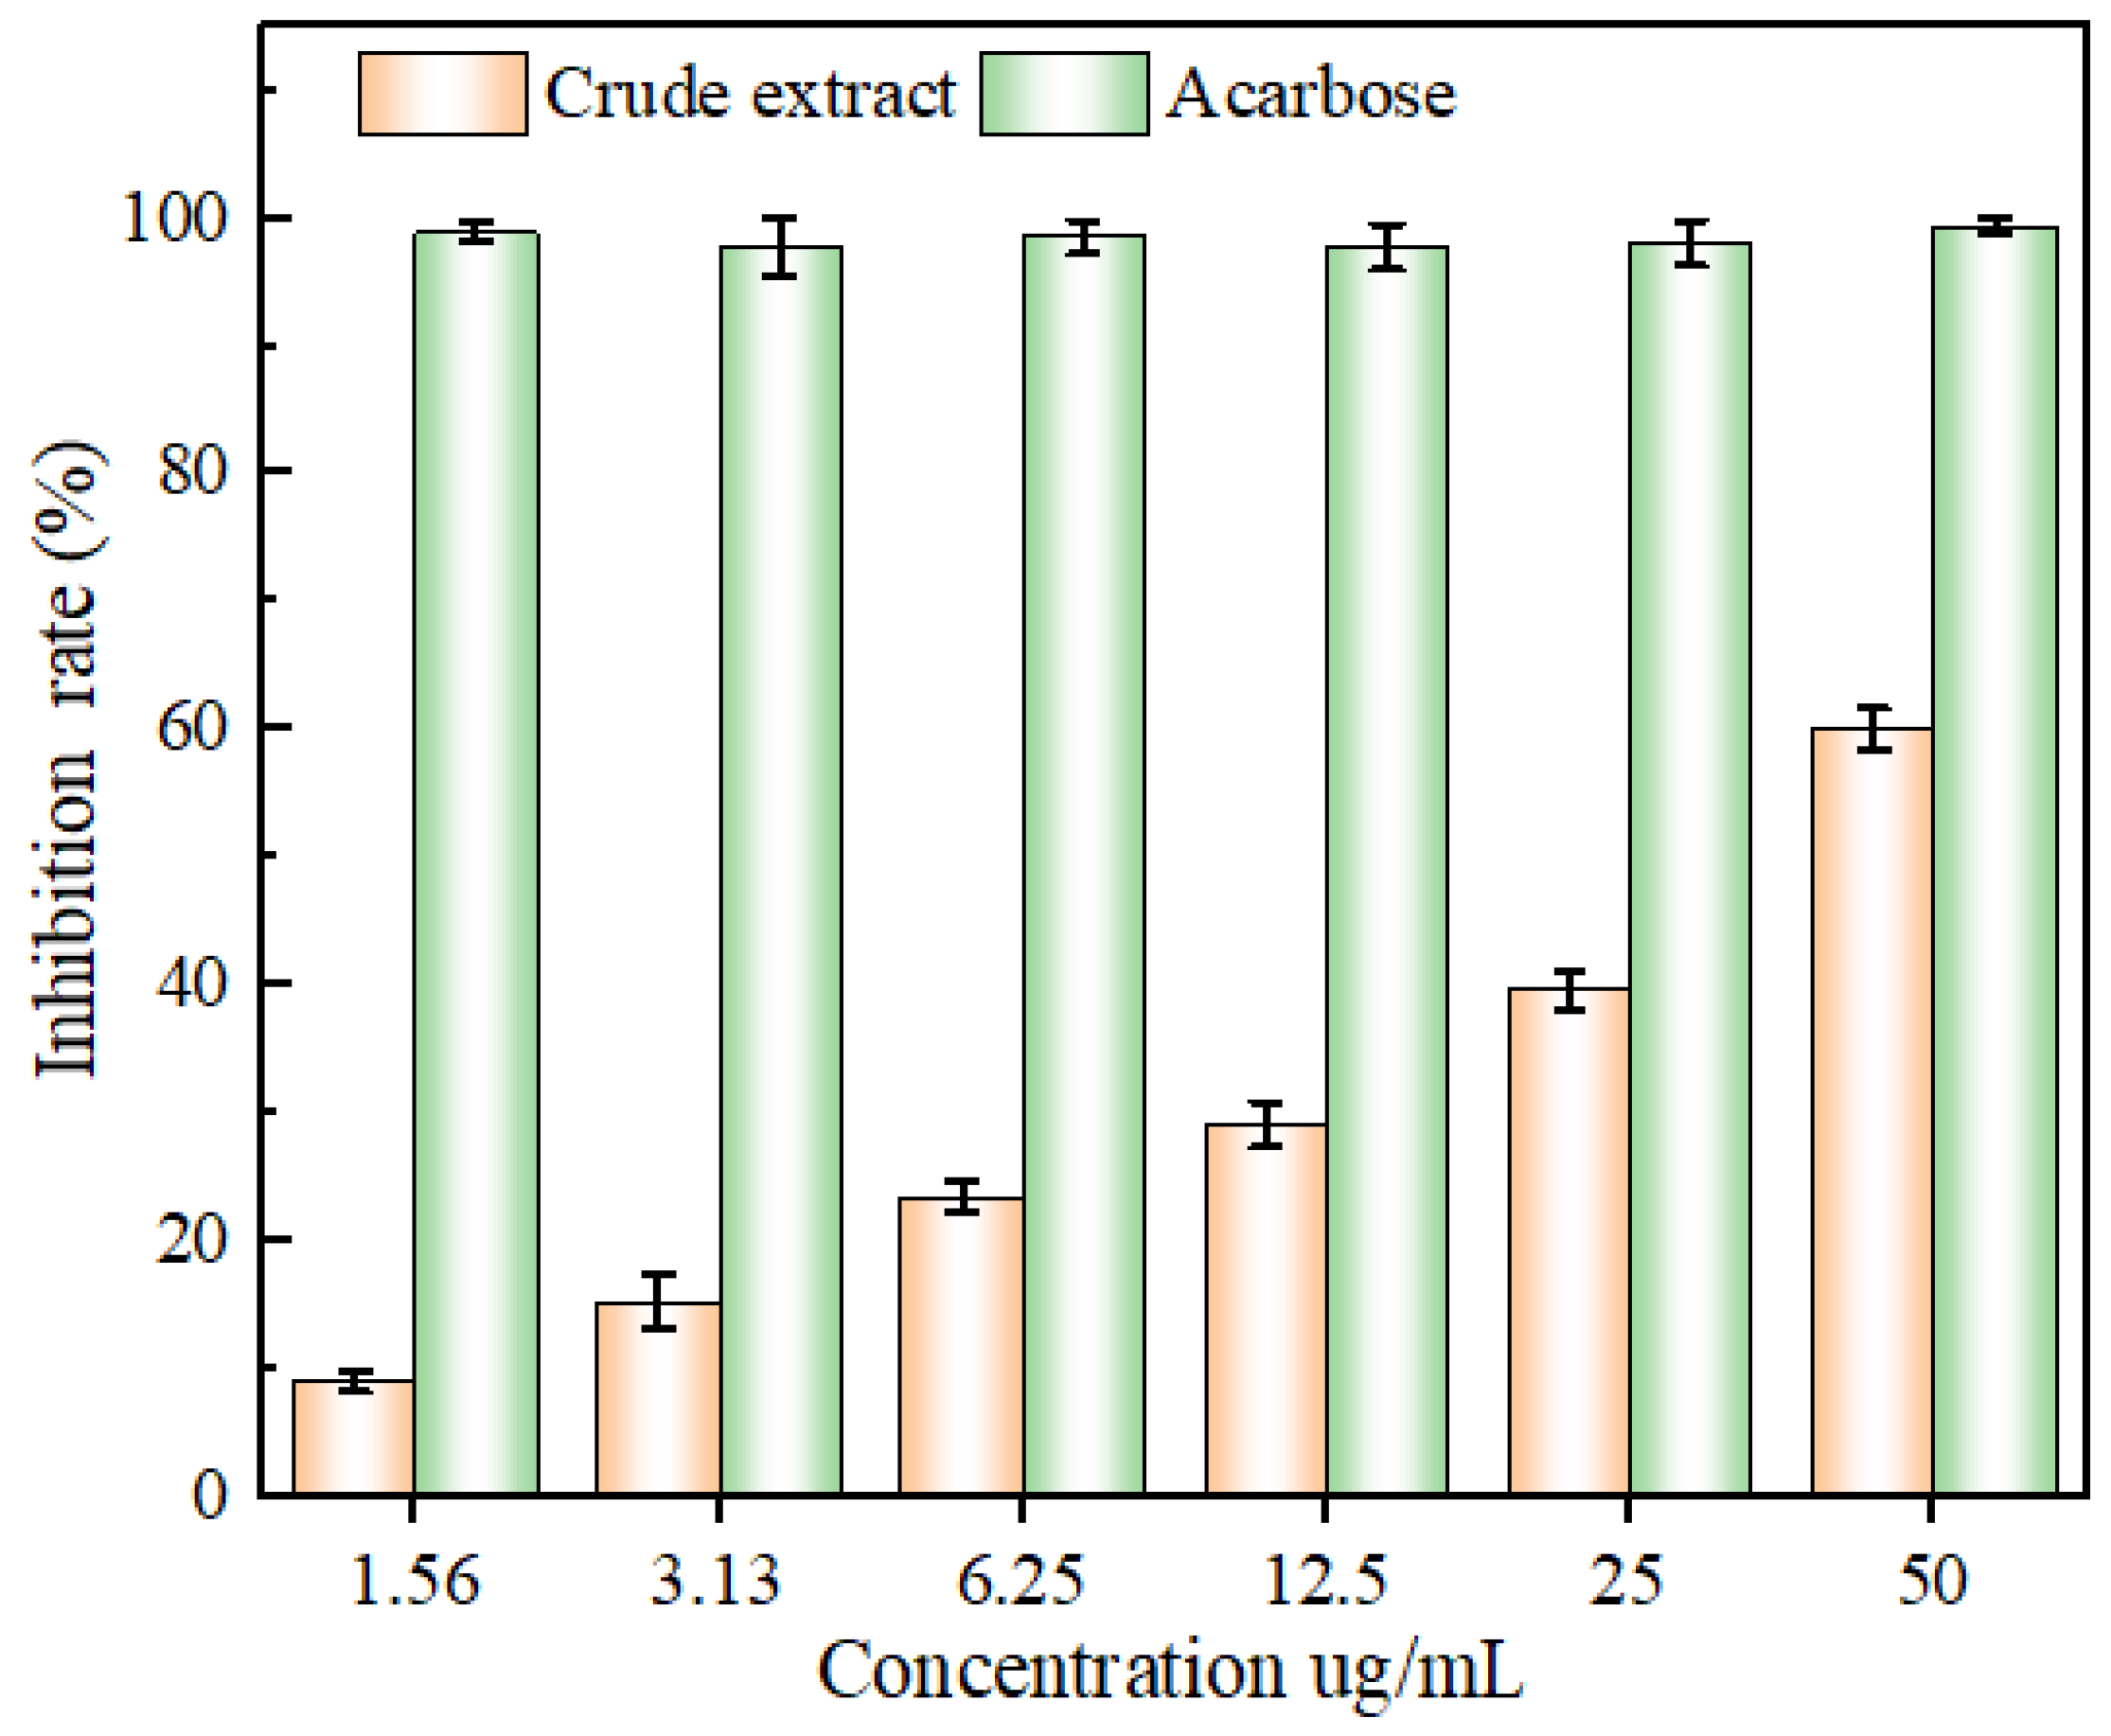
2.6. Glucosidase-Inhibitory Capacity
3. Materials and Methods
3.1. Plant Materials and Chemical Products
3.2. UHPLC-MS
3.3. Determination of Flavonoid Content
3.3.1. Extraction of Flavonoids
3.3.2. Establishment of Standard Equations
3.3.3. Flavonoid Yield
3.4. Single-Factor Experiment
3.4.1. Ethanol Concentration as a Single Variable
3.4.2. Extraction Time as a Single Variable
3.4.3. Material–Liquid Ratio as a Single Variable
3.5. Response Surface Optimization
3.6. Antioxidant Activity and Enzyme-Inhibitory Activity
3.6.1. Antioxidant Activity
3.6.2. Inhibitory Activity of Acetylcholinesterase
3.6.3. Inhibitory Activity of Alpha-Glucosidase
4. Conclusions
Supplementary Materials
Author Contributions
Funding
Data Availability Statement
Acknowledgments
Conflicts of Interest
References
- Ng, L.T. A review on agar (gaharu) producing Aquilaria species. J. Trop. Forest Prod. 1997, 2, 272–285. [Google Scholar]
- Yang, D.; Mei, W.; Yang, J.; Zeng, Y.; Dai, H. GC-MS Analysis of the Fragrant Sesquiterpenes and 2-(2-Phenylethyl) Chromone Derivatives in Four Types of Agarwood Qi-Nan. J. Chin. J. Trop. Crops 2014, 35, 1235–1243. [Google Scholar]
- Huang, S.; Mei, W.; Zeng, J.; Dai, H. The textual research of Chinese herbal medicine Qinan and its historical origin. Chin. J. Trop. Agric. 2021, 1, 41–48. [Google Scholar]
- Yang, Y.; Liu, P.; Kang, Y.; Chen, X.; Lv, F.; Huang, L.; Wei, J. Germplasm resources investigation and analysis of representative germplasm characteristics of Chi-Nan agarwood in China. J. Fujian For. Sci. Technol. 2023, 50, 100–106. [Google Scholar]
- Liu, W.; Ding, H.; Li, M.; Lu, S. Research progress and development of agarwood leaves. J. Guangdong Chem. Ind. 2021, 48, 79–80. [Google Scholar]
- Wang, X.; Liu, B.; Ying, J.; Wang, L.; Kang, L.; Hou, C.; Xiao, J.; Niu, X.; Niu, L. Research Progress and Quality Influencing Factors of Aquilaria sinensis Leaves. Chin. J. Trop. Agric. 2021, 41, 48–58. [Google Scholar]
- Xu, L.; Liu, H.; Ma, P.; Teng, L.; Yang, Y.; Wei, J.; Xiao, P. Review of Agarwood Tea. Mod. Chin. Med. 2021, 23, 1525–1533. [Google Scholar]
- Wang, S.; Xie, Y.; Zhou, H.; Liu, L. Study on the chemical composition of the Leaves of Aquilaria sinensis. Chin. J. Ethnomed. Ethnopharm. 2023, 32, 35–40. [Google Scholar]
- Yang, M.; Liang, Y.; Chen, H.; Mao, S.; Gong, H. Chemical constituents from leaves of wild Aquilaria sinensis. Chin. Tradit. Herbal Drugs 2014, 45, 1989–1992. [Google Scholar]
- Zhang, X.; Zeng, Y.; Zhou, L.; Huang, L.; Ling, H. Preliminary Study on Optimization of Extraction Process and Antioxidant Activity of Total Flavonoids from Artemisia argyi Leaves. Ind. Microbiol. 2024, 54, 134–136. [Google Scholar]
- Zou, B.; Zhong, S.; Lin, J.; Yu, Y.; Fu, M.; Zhou, X.; Li, J.; Bu, Z.; Xu, Y. Research Progress of the Structure and Biological Activity of Flavonoids in Wampee. China Fruit Veg. 2024, 44, 47–53. [Google Scholar]
- Wang, Y.; Wang, S.; Dai, Y.; Fu, L.; Sun, G. Progress in the study of the leaves of Aquilaria sinensis. Jiangsu J. Prevent. Med. 2019, 30, 59–61. [Google Scholar]
- He, W.; Zhang, X.; Xu, C.; Wang, B.; Ye, B.; Fu, X.; Xia, D. Research Progress of Flavonoids in Prevention and Treatment of Diabetes and Its Complications. J. Zhejiang Chin. Med. Univ. 2024, 48, 241–246. [Google Scholar]
- Mei, Q. A comparative study on the hypoglycaemic effect of agarwood leaves and agarwood herbs. J. Lishizhen Med. Materia Med. Res. 2013, 24, 1606–1607. [Google Scholar]
- Hao, J.; Wu, C. Optimization of Ultrasonic Extraction Processand Research on Biological Activity of Total Flavonoids from the Stems and Leaves. China Condiment 2023, 48, 79–82. [Google Scholar]
- Ren, M. Optimization of ultrasonic extraction process of flavonoids from sweet potato leaves and its antioxidative and antibacterial ability. China Food Addit. 2023, 34, 224–232. [Google Scholar]
- Wang, X.; Zhang, J.; Li, Y.; Tian, L. Inhibition of Luteolin on SNHG14 Expression to Improve SW1353 Osteoarthritis Cell Model. Guiding J. Tradit. Chin. Med. Pharm. 2017, 45, 75–79. [Google Scholar]
- Akram, M.; Syed, A.S.; Kim, K.A. Heme oxygenase 1-mediated novel anti-inflammatory activities of Salvia plebeia and its active components. J. Ethnopharmacol. 2015, 174, 322–330. [Google Scholar] [CrossRef]
- Wang, H.; Li, C.; Wang, X.; Zhang, J.; Xu, T.; Liu, T. Determination of Acteoside, Luteoloside and Oleuropein in Youganlanye(Olea europaea Linn.) by HPLC. Guiding J. Tradit. Chin. Med. Pharm. 2016, 22, 68–70. [Google Scholar]
- Zeng, Y.Q.; Igarashi, K.; Li, Y. Anti-diabetic effects of luteolin and luteolin-7-O-glucoside on KK-Ay mice. J. Biosci. Biotechnol. Biochem. 2016, 80, 1580–1586. [Google Scholar] [CrossRef]
- Li, B.; Chen, Z.Y.; Liu, T.Y.; Li, D.L. Effects and mechanisms of wogonin on proliferation and invasion of skin squamous-cell carcinoma cell line A431. J. Reg. Anat. Operat. Surg. 2019, 28, 256–261. [Google Scholar]
- Liu, Y.; Huang, J.; Zheng, X. Luteolin, a natural flavonoid, inhibits methylglyoxal induced apoptosis via the mTOR/4E-BP1 signalling pathway. J. Sci. Rep. 2017, 7, 7877. [Google Scholar] [CrossRef] [PubMed]
- Han, N.; Sun, Y.; Sheng, S. Regulatory Mechanism of Luteolin on Oxidative Stress and Inflammation. Chin. J. Anim. Nutr. 2022, 34, 2856–2861. [Google Scholar]
- Zan, L. Systematic Analysis of Anti-inflammatory Active Components in Diospyros lotus Fruit Using UPLC-Q-TOF/MS Combined with Network Pharmacology. Sci. Technol. Food Ind. 2023, 10, 1002–1306. [Google Scholar]
- Liu, Y.C. Identification of Chemical Components in Gannan Navel Orange Pulp by UPLC-QTOF-MS Coupled with HS-SPME-GC-MS. Food Sci. 2023, 44, 216–228. [Google Scholar]
- Hao, Z.P.; Cang, J.; Xu, Z. Identification of Chemical Components in Actinidia chinensis Root by UHPLC-Q-TOF-MS/MS. China Pharm. 2020, 31, 1725–1731. [Google Scholar]
- Li, R. Identification of Chemical Components in Polygonum orientate by UPLC-QTOF-MS. Chin. J. Ethnomed. Ethnopharm. 2022, 31, 23–30. [Google Scholar]
- Sun, J.F.; Dong, W.T.; Chen, L.Y.; Sun, G.D.; Huo, J.H.; Wang, W.M. Analysis of chemical constituents of Ginseng-Douchi compound fermentation products based on UPLC-Q-TOF-MS. China J. Chin. Mater. Med. 2021, 46, 1417–1429. [Google Scholar]
- Ren, Y.; Zhao, Y.; Liu, Z. Chemical constituents in different parts of Ixeris sonchifolia based on UPLC-LTQ-Orbitrap-MSn. China J. Chin. Mater. Med. 2021, 27, 91–99. [Google Scholar]
- Zhang, H.; Deng, Q.; Wei, M.; Zhang, X. ldentification of Chemical Constituents in Coptis chinensis Inflorescence by UPLC-Q-Orbitrap HRMS. Chin. J. Exp. Tradit. Med. Formulae 2021, 27, 91–99. [Google Scholar]
- Zhang, B. Identification of Chemical Constituents in Potentilla kleiniana Inflorescence by UPLC-Exactive-Plus-Orbitrap-MS. J. Chin. Med. Mater. 2023, 12, 3014–3022. [Google Scholar]
- Cai, H.Y.; Wu, J.; Xu, L.Z. Material basis and mechanism of the anti-inflammation effect of Trolliuschinensis Bge. based on UHPLC-Q-TOF-MS and network pharmacology. Drugs Clin. 2023, 38, 1041–1050. [Google Scholar]
- Duan, Z.W.; Li, G.W.; Dou, Z.H.; Xie, H.; He, A.; Shi, M. Extraction and Antioxidant Activity of Flavonoids from Aquilaria sinensis (Lour.) Gilg Leaves. Food Sci. 2015, 36, 45–50. [Google Scholar]
- Li, D.; Ying, T.C. Experimental study on the optimization of the extraction process of total flavonoids from Rubus corchorifolius leaves. Hunan J. Anim. Sci. Vet. Med. 2023, 3, 45–50. [Google Scholar]
- Lin, Z.L.; Sha, X.M.; Zhang, Z.B.; Xia, Q.L.; Sun, R.; Wang, Z.X. In vitro antioxidant activities and inhibitory activities of a-glucosidase and acetylcholinesterase in Rubus parvifolius L. root extract. Food Ferment. Ind. 2021, 47, 83–89. [Google Scholar]
- Li, J.; Huang, X.; Wu, M.; Huang, Q.; Ni, S.; Chen, L.; Wu, D.; Wang, W.; Lin, Z. Optimization of Extraction Process of Flavonoids from Leaves of Aquilaria sinensis by Central Composite Design Response Surface Methodology. Modern Food 2023, 29, 214–219. [Google Scholar]
- Su, W.X. Study on Ultrasonic Extraction Process of Flavonoids from Leaves of Aquilaria sinensis Gilg in Guangxi. Chin. Commun. Dr. 2022, 38, 10–12+57. [Google Scholar]
- Lin, S.Q.; Zhao, Z.H.; Si, T.J. Determination of the Active Ingredient Content and Evaluation of Its Bioactivity in the Aquilaria sinensis Leaves. J. Guangzhou Univ. Tradit. Chin. Med. 2023, 40, 1239–1247. [Google Scholar]
- Zheng, Y.; Shao, Y.; Chen, A.H.; Zhang, N.N. Optimization of Ultrasonic-Assisted Extraction and Antioxidant Activities of Total Flavonoids from Alpinia oxyphylla Fruits. Food Sci. 2014, 35, 44–49. [Google Scholar]
- Yi, L.; Meng, X.L. Optimization of the extraction process and study of in vitro antioxidant activity of total flavonoids from Perilla frutescens leaves by orthogonal test. Feed Res. 2024, 4, 99–103. [Google Scholar]
- Yin, L. Flavonoids analysis and antioxidant, antimicrobial, and anti-inflammatory activities of crude and purified extracts from Veronicastrum latifolium. Ind. Crops Prod. 2019, 137, 652–661. [Google Scholar] [CrossRef]
- Fu, T.W. Extraction, Component Analysis and Biological Activity Evaluation of Total Flavonoids from Phellinus lgniarius. Sci. Technol. Food Ind. 2023, 10, 1–16. [Google Scholar]
- Chen, J.Z.; Ge, S.; Yang, J.M.; Zan, L.F.; Liu, N. Inhibition of the a-Glucosidase Activity by the Flavonoids from Opisthopappus taihangensis (Ling) Shih. J. Food Sci. Biotechnol. 2023, 42, 95–102. [Google Scholar]
- Yang, S.H.; Chen, H.L.; Wang, W.Q.; Zhang, X.F.; Luo, G.H. Antiglycation activity, acetylcholine esterase and c-glucosidase inhibitory activity of total flavonoids from corn silk. Nat. Prod. Res. Dev. 2019, 31, 1230–1239. [Google Scholar]
- Ma, S.; Huang, M.; Fu, Y.; Qiao, M.; Li, Y. How Closely Does Induced Agarwood’s Biological Activity Resemble That of Wild Agarwood? Molecules 2023, 28, 2922. [Google Scholar] [CrossRef]


| NO. | Ion Mode | TR/min | Molecular Formula | Theoretical Value | Measured Value | Ion Fragment | Compounds |
|---|---|---|---|---|---|---|---|
| 1 | [M−H]− | 7.100 | C15H10O7 | 302.04265 | 302.04173 | 301.03538 271.02481 243.02990 109.02950 95.01385 | Quercetin [24] |
| 2 | [M+H]+ | 7.167 | C27H30O15 | 594.15847 | 594.15849 | 595.16575 379.08102 325.07025 295.05933 121.02856 91.05815 | Vicenin-2 [25] |
| 3 | [M+H]+ | 8.982 | C21H20O11 | 448.10056 | 448.10066 | 449.10784 287.05496 153.01833 135.04385 | Cynaroside [26] |
| 4 | [M+H]+ | 10.083 | C21H18O13 | 478.07474 | 478.07497 | 479.08202 303.04959 257.04404 169.01303 135.04428 | Miquelianin [27] |
| 5 | [M+H]+ | 10.582 | C22H22O10 | 465.12130 | 446.12155 | 447.12857 285.07556 242.05705 124.01576 91.05800 | Glycitin [28] |
| 6 | [M−H]− | 11.639 | C15H10O6 | 286.04774 | 286.04796 | 285.04046 133.02834 132.02000 | Luteolin [29] |
| 7 | [M+H]+ | 13.290 | C16H14O5 | 286.08412 | 286.08415 | 287.09140 167.03389 147.04414 91.05490 | Sakurantein [30] |
| 8 | [M−H]− | 13.573 | C16H12O6 | 300.06339 | 300.06367 | 299.05611 284.03250 133.02849 | Hispidulin [31] |
| 9 | [M+H]+ | 14.495 | C16H12O5 | 284.06847 | 284.06850 | 284.06847 242.05736 167.03389 124.01550 | Glycitein [28] |
| 10 | [M+H]+ | 14.497 | C17H14O6 | 314.07904 | 314.07898 | 315.08631 300.06281 272.06754 257.04379 243.06512 167.0230 | Scrophulein [32] |
| NO. | A Material–Liquid Ratio (%) | B Ethanol Concentration (%) | C Extraction Time (min) | Y Flavonoid Yield (%) |
|---|---|---|---|---|
| 1 | 50 | 50 | 20 | 6.3377 |
| 2 | 60 | 60 | 20 | 6.3474 |
| 3 | 50 | 60 | 20 | 7.1234 |
| 4 | 50 | 60 | 30 | 6.9875 |
| 5 | 40 | 60 | 20 | 6.2899 |
| 6 | 40 | 60 | 40 | 6.3293 |
| 7 | 50 | 70 | 40 | 6.5365 |
| 8 | 50 | 60 | 30 | 7.4755 |
| 9 | 60 | 60 | 40 | 6.1243 |
| 10 | 40 | 70 | 20 | 6.2640 |
| 11 | 50 | 60 | 30 | 6.8673 |
| 12 | 50 | 70 | 20 | 6.2798 |
| 13 | 60 | 70 | 30 | 6.3128 |
| 14 | 50 | 60 | 30 | 7.0574 |
| 15 | 40 | 50 | 30 | 5.7103 |
| 16 | 60 | 50 | 30 | 5.8337 |
| 17 | 50 | 50 | 40 | 6.0182 |
| Source | Sum of Squares | df | Mean Square | F-Value | p-Value | Significant |
|---|---|---|---|---|---|---|
| Model | 3.44 | 9 | 0.3823 | 10.07 | 0.0030 | ** |
| A | 0.0001 | 1 | 0.0020 | 0.0020 | 0.9656 | |
| B | 0.2787 | 1 | 0.2787 | 7.34 | 0.00302 | ** |
| C | 0.0076 | 1 | 0.0076 | 0.2003 | 0.6680 | |
| AB | 0.0014 | 1 | 0.0014 | 00366 | 0.8537 | |
| AC | 0.0172 | 1 | 0.0172 | 0.4540 | 0.5221 | |
| BC | 0.0830 | 1 | 0.0830 | 2.19 | 0.1828 | |
| A2 | 1.26 | 1 | 1.26 | 33.80 | 0.0007 | ** |
| B2 | 1.1.6 | 1 | 1.16 | 30.67 | 0.0009 | ** |
| C2 | 0.3380 | 1 | 0.33880 | 8.90 | 0.0204 | * |
| Residual | 0.2657 | 7 | 0.0380 | |||
| Lack of fit | 0.0556 | 3 | 0.0185 | 0.3528 | 0.7907 | |
| Pure error | 0.2101 | 4 | 0.0525 | |||
| Total error | 3.71 | 16 |
| R2 | 0.9283 |
| Adjusted R2 | 0.8361 |
| Predicted R2 | 0.6714 |
| Adeq Precision | 8.5682 |
Disclaimer/Publisher’s Note: The statements, opinions and data contained in all publications are solely those of the individual author(s) and contributor(s) and not of MDPI and/or the editor(s). MDPI and/or the editor(s) disclaim responsibility for any injury to people or property resulting from any ideas, methods, instructions or products referred to in the content. |
© 2024 by the authors. Licensee MDPI, Basel, Switzerland. This article is an open access article distributed under the terms and conditions of the Creative Commons Attribution (CC BY) license (https://creativecommons.org/licenses/by/4.0/).
Share and Cite
Li, Q.; Wei, P.; Li, Y.; Fu, Y. Optimization of Extraction Process and Analysis of Biological Activity of Flavonoids from Leaves of Cultivated ‘Qi-Nan’ Agarwood. Molecules 2024, 29, 1828. https://doi.org/10.3390/molecules29081828
Li Q, Wei P, Li Y, Fu Y. Optimization of Extraction Process and Analysis of Biological Activity of Flavonoids from Leaves of Cultivated ‘Qi-Nan’ Agarwood. Molecules. 2024; 29(8):1828. https://doi.org/10.3390/molecules29081828
Chicago/Turabian StyleLi, Qingle, Penglian Wei, Yingjian Li, and Yunlin Fu. 2024. "Optimization of Extraction Process and Analysis of Biological Activity of Flavonoids from Leaves of Cultivated ‘Qi-Nan’ Agarwood" Molecules 29, no. 8: 1828. https://doi.org/10.3390/molecules29081828