Review

Biomass-Based Hydrogen Extraction and Accompanying Hazards—Review

1
Mjniescioruk AEI, Traktorowa Str. 55/34, 91-111 Lodz, Poland
2
Faculty of Civil and Transport Engineering, Poznan University of Technology, Piotrowo Str. 3, 61-138 Poznań, Poland
3
The Szewalski Institute of Fluid-Flow Machinery Polish Academy of Sciences, Fiszera 14 St., 80-231 Gdańsk, Poland
4
BADER Polska Sp. z o.o., Mostowa 1 St., 59-700 Bolesławiec, Poland
5
Faculty of Process and Environmental Engineering, Lodz University of Technology, Wolczanska 213, 90-924 Lodz, Poland
6
Department of Vehicles and Fundamentals of Machine Design, Lodz University of Technology, Stefanowskiego Str. 1/15, 90-537 Lodz, Poland
*
Author to whom correspondence should be addressed.
Molecules 2025, 30(3), 565; https://doi.org/10.3390/molecules30030565
Submission received: 29 November 2024 / Revised: 17 January 2025 / Accepted: 20 January 2025 / Published: 26 January 2025
(This article belongs to the Section Green Chemistry)

Abstract

:
Nowadays, there is an increased demand for energy, the access to which, however, is limited due to the decreasing of fossil sources and the need to reduce emissions, especially carbon dioxide. One possible remedy for this situation is using hydrogen as a source of green energy. Hydrogen is usually bound to other chemical elements and can be separated via energy-intensive few-step conversion processes. A few methods are involved in separating H2 from biomass, including biological and thermochemical (TC) ones. Such methods and possible hazards related to them are reviewed in this study.

1. Introduction

Substances like coal, oil, and natural gas (NG) and their derivatives are and will be for some time the most extensively utilized energy source worldwide [1]. Their combustion is associated with inherent CO2 emissions related to fossil fuels, including coal (38%), NG (25%), and crude oil (23%) [2]. The improvement of such a bad situation requires substituting fossil fuels with green (environmentally friendly) energy sources, including H2.
However, about 48% of H2 in the industry comes from synthesis gas, which is produced through the thermal conversion of NG CH4 with H2O or O2 from the air. For CO2-rich NG, the main technique is CO2 thermal conversion (dry reforming) to generate synthesis gas and H2. This technique often utilizes catalysts to lower the energy barrier for the related chemical reactions during this process [3].
Lately, significant focus has been directed toward high-yield biogas with low energy consumption, achievable via the biocatalytic process resulting from the anaerobic transformation of various wastes, including biological ones. Besides H2 and various impurities, it includes above 50% CH4 and can substitute NG as a H2 production source. Unlike direct biocatalytic H2 production using bacteria, cyanobacteria, and green microalgae, the hybrid method of thermochemical H2 generation from biogas is of high interest today. Direct H2 production via the biocatalytic acid generation of organic waste requires the fulfillment of several strict conditions to sustain a specific consortium of microorganisms; alterations in external factors may redirect biochemical reactions toward products that hinder the process, like fatty acids. Their buildup in the working medium changes the pH of the medium toward acidification, thus diminishing H2 production. The functioning of methanogenic consortia is influenced by the substrate type, biogas plant material, and operational conditions like temperature, pH, and hydrodynamics. However, they exhibit greater resilience to external factors and environmental components compared to H2-producing monocultures. In contrast to pilot bioreactors for H2 generation, anaerobic biogas facilities are already integrated into numerous industrial, municipal, and agricultural establishments linked to waste management [3].
Additionally, H2 production from other renewable sources became important, as they are C-neutral because the CO2 released during their combustion is applied by plants for photosynthesis [4]. Renewable H2 (green H2) is a pure form of H2 obtained from biomass [5]. Of course, Greenhouse Gas (GHG) emissions accompany renewable energy generation due to the small existing effect of the energy incorporated into the materials applied to construct infrastructure for renewable energy [6]. Biohydrogen (bio-H2) production is an option to supersede fossil fuels in an environmentally friendly manner [7]. Biomass conversion techniques like gasification (GA) and pyrolysis (PY) have restrictions and consume much energy [4]. Among PY, hydro-pyrolysis (H-PY), reforming, liquefaction, and GA, the last approach is a good thermochemical (TC) method to produce syngas and hydrocarbons from biomass. H2 output and C neutralization have been achieved via physicochemical (PC), TC, or biological processes, especially in the case of lignocellulose as a second-generation biomass feedstock [8].
Besides the application of biomass for the production of various types of biofuels, especially biodiesel from various first-generation or edible biomass feedstocks [9], second-generation or non-edible feedstocks [10,11,12,13,14], and third-generation feedstocks [15,16,17], green H2 can also be obtained from biomass (e.g., from C3H8O3), with better fuel properties than the other biofuels [18,19].
Recently, various C capture and storage technologies have been integrated with H2 production processes to raise the environmental sustainability of H2 as a pure energy carrier [20]. However, such integration is accompanied by various risks and hazards.
To explain, a hazard is a potential source of harm or adverse health effect on a person or persons. Risk is the likelihood that a person may be harmed or suffer adverse health effects if exposed to a hazard. The terms hazard and risk are often used interchangeably. The level of risk is often categorized based on the potential harm or adverse health effect that the hazard may cause, the number of times people are exposed to it, and the number of people exposed to it. Control measures (hierarchized) comprise possible actions lowering the potential of exposure to the hazard, removing the hazard, or lowering the likelihood of the risk of exposure to that hazard being realized. The (overall) risk assessment is performed by various methods where the hazard severity and its potential outcomes are considered together with the exposure level, the number of persons exposed, and the risk of that hazard being realized. The residual risk after implementation of control measures should be “as low as is reasonably possible” (ALARP). One must confirm that the expense of lowering the risk further would be exceedingly disproportionate to the advantages obtained [21].
Equipment for extracting H2 from biomass is often made of stainless steel [22,23,24,25]. Stainless steel is not hazardous in its solid form. Some processes like cutting, milling, grinding, melting, and welding can cause some unsafe materials to be emitted. In particular, metal fumes may be generated. Cr(VI) carcinogens may result from pickling stainless steel. The mentioned unsafe materials may induce cancer, allergies, or asthma signs or breathing troubles if inhaled. Despite being harmful if swallowed, they probably damage the unborn child and induce damage to organs via prolonged or repeated exposure. Such materials induce eye irritation and may induce allergic skin reactions and respiratory irritation [26]. Employees employed in the extraction of H2 from biomass are exposed to hazards occurring when working with equipment specific to process engineering and are to obey basic health and safety requirements [27]. The risks associated with biomass processing are quite comparable to those encountered in the biotechnology sector. Chen and Reniers [28] observed that industrial biotechnology shares several risks with chemical technology but also faces biological dangers associated with biological agents. Workers in the biotechnology sector face health hazards due to various forms of exposure to harmful substances. The outside environment might also be impacted by these agents in instances of unintended release. Various conventional risk assessment techniques can be applied in industrial biotechnology, considering the distinctions between conventional incidents (such as fires, explosions, and toxic emissions) and challenges in industrial biotechnology and chemical technology. Moreover, the evaluation of risks concerning occupational health and safety linked to biological threats can be conducted through exposure analysis and risk characterization. A two-step risk evaluation approach is suggested to evaluate environmental and ecological hazards in industrial biotechnology. Different protective strategies have been examined in [29,30,31].
The goal of this study was to review various hazards and risks related to various methods of H2 extraction from biomass.

2. Methods

The literature from electronic databases such as “ISI Web of Science”, “Scopus”, and “Google Scholar” was retrieved via “logical” database searches using various keywords, such as: “hydrogen”, ”biohydrogen”, ”biomass”, “hazards”, and ”risk”. The sources for the extraction of H2 from biomass and associated risks covered the years 1998–2024. As English-language publications are commonly accessible to readers worldwide, mainly those published in that language are featured. Similarly to [32], this review explores the techniques employed to transform biomass into hydrogen through electrochemical, biological, and thermochemical processes. The advantages, disadvantages, progress, and risks associated with each method are examined. Moreover, a techno-economic analysis was performed, and an evaluation of the environmental impacts of these methods was carried out. The expenses associated with H2 processes, the challenges of techno-economic commercialization, and the financial evaluation of various H2 production methods were also considered.

3. Various Hazards Related to Hydrogen, Biohydrogen, and Biomass

H2 is a pure option for CH4, also known as NG. It contributes about 75% of the mass of the universe. It can be obtained from NG, nuclear power, biogas (BG), and renewable power like solar and wind. The challenge is harnessing H2 as a gas on a large scale [33].
H2 production from fossil fuels demands greater energy and liberates CO2, mainly enhancing the greenhouse effect. Such production from a renewable source is a sustainable and environmentally friendly process. Bio-H2 is a clean and C-free fuel. It is widely applicable in transportation to the generation of electricity. Bio-H2 is obtained by fermentation. The commonly used bacterial species are Clostridium sp. and facultative anaerobes of the Enterobacteriaceae family. Agro-residues are good sources for producing bio-H2. Primarily, pretreated lignocellulosic biomasses are utilized to produce bio-H2. Bio-H2 production is also possible from non-pretreated lignocellulosic biomass [23].
Biohydrogen as a fuel exhibits some advantages, including its C-neutral or C-zero nature, ready renewability, environmentally effective generation via biological routes, eco-friendly transformation, and maximum energy content compared to other fuels [24].
Bio-H2 is a clean, non-toxic energy carrier [25].
Being a clean, C-zero option to non-renewable fossil fuels, bio-H2 possesses a great energy yield of 122 kJ/g [34].
“Biomass” relates to the unfossilized and biodegradable organic substances from plants, animals, and microorganisms. Biomass comprises byproducts, residues, and waste from farming, forestry, and associated industries. It also comprises unfossilized and biodegradable organic fractions of factory and municipal wastes, gases, and liquids obtained from decomposing unfossilized and biodegradable organic matter [27].
It is a renewable organic complex originating from plants and animals. It can be burned directly for heat or transformed into liquid and gaseous fuels via diverse processes [33].
Biomass sources for energy include the following [33]:
  • Wood and its processing waste—firewood, wood pellets, and chips; lumber and furniture mill sawdust and waste; and black liquor from pulp and paper mills.
  • Farming crops and waste materials—corn, soybeans, sugar cane, switchgrass, woody plants, algae, crop, and food processing residues, applicable to biofuels’ production.
  • Biogenic substances in municipal solid waste-paper products; cotton and wool products; and food, yard, and wood waste.
  • Animal manure and human sewage for BG production.
Biomass transformation to energy is realized via diverse processes, like the following [33]:
  • Direct combustion (burning) to produce heat.
  • TC transformation for producing solid, gaseous, and liquid fuels.
  • Chemical transformation for producing liquid fuels.
  • Biological transformation for producing liquid and gaseous fuels.

3.1. Various Hazards Related to Hydrogen and Biohydrogen

H2 energy features comprise a lack of local pollution during combustion and H2O as the sole byproduct. Compared with CH4 and gasoline, H2 has several advantages [35,36]:
During accidental outdoor operation, H2 disperses faster than the other fuels.
H2 has the greatest flammability range in the air (4–77% by volume) with no safety issues.
The H2 flame speed (346 cm/s) exceeds that of CH4 8-fold (43.25 cm/s).
H2 burns with low docility, so its fast consumption is accompanied by little damage to the adjacent elements.
The H2 explosion range exceeded those of the other two fuels but H2 deflagrate at higher volume concentrations.
The H2 energy per unit mass (LHV = 120 MJ/kg) thrice exceeds that from gasoline combustion (40 MJ/kg).
The primary risks associated with H2 storage are the following:
Ability to ignite easily.
Dangers posed by high-pressure and low-temperature storage conditions.
Potential to penetrate small gaps or porous materials due to its small molecular size [37].
H2 can be explosive at concentrations of 18.3–59% in contact with air [38].
As a highly inflammable and explosive substance, H2 cannot be easily transported from one place to another compared to CH4 and gasoline [39].
A large spill of liquid H2 is like one of gasoline; however, it dissipates much quicker. Another virtual danger is an explosion of a boiling liquid expanding vapor when the pressure relief valve fails. H2 onboard a car may induce a safety hazard [40].
H2 is non-toxic and lighter compared to air; it dissipates suddenly when released, allowing for the relatively sudden dispersal of the fuel when a leak occurs. Therefore, additional engineering controls are required to provide for its safe use [41].
High H2 concentrations can induce an O2-scarce milieu. People inhaling such an atmosphere may experience signs like headaches, ringing in the ears, dizziness, drowsiness, unconsciousness, nausea, vomiting, and the depression of each sense [42].
While H2 production generates no GHG emissions, H2 combustion creates harmful pollutants like NOx. These are associated with smog, acid rain, and damaging health influences such as asthma and respiratory infections [43].
If not produced using renewable sources, H2 pollutes. More than 96% of the H2 used is gray, highly affecting the environment, as 10 kilos of CO2 is produced for every kilo of H2 obtained [44].
During bio-H2 production, the H2 yield is low due to byproduct formation and the complex nature of biomass [45].
The use of green H2 is accompanied by the virtual risk of H2O scarcity. The generation of green H2 needs a high H2O amount, and in some areas where H2O is already scarce, such an enhanced demand could exacerbate present H2O shortages [46].
During H2 generation from biomass, usually, various gases can be released, including mainly CO, CO2, N2, NOx, CH4, and C2H6 [39].
CH4 is an extremely combustible and explosive gas that ignites rapidly when subjected to heat, sparks, or flames. When CH4 builds up to 5–15% by volume in an air mixture, it creates an extremely explosive gas. Above 15% (150,000 ppm), there is a lack of sufficient O2 in the air (danger of asphyxiation) [47].
CH4 additionally functions as an asphyxiant. The level of exposure and symptoms can vary from mild to severe and from acute to chronic, depending on the concentration and duration of exposure. CH4 gas can be deadly when present at high concentrations over extended periods [48].
The mitigation of hazards comprises the following measures [48]:
  • When handling CH4, all risks of ignition and explosion must be removed from the surrounding area, and smoking is prohibited nearby.
  • When CH4 might exist in an enclosed area, its levels ought to be regulated and assessed alongside O2 levels.
  • CH4 contained in a cylinder needs to be safeguarded against harm and maintained in an upright stance. When stored in facilities, CH4 must be placed in a cool, well-aired area away from direct sunlight and other potential ignition sources.
  • If there is a suspicion of a CH4 leak, it is essential to clear the area right away.
  • If a person is exposed to CH4, wearable units can notify them to seek fresh air to avoid methane gas poisoning.
C2H6 is an extremely flammable gas, which may form explosive mixtures with the air. C2H6 gas stored in a tank under pressure may explode if heated. It may also displace O2 and cause rapid suffocation. Exposure to swiftly expanding gas can lead to burns or frostbite [49].
The mitigation of hazards comprises the following measures [49]:
  • Attempting to heat frozen tissues and obtaining medical assistance.
  • Staying clear of heat, hot surfaces, sparks, open flames, and other sources of ignition. No use of tobacco products.
  • Do not attempt to extinguish a fire caused by leaking gas unless the leak can be safely closed. Remove all ignition sources if it is safe to do so.
  • Shielding tanks containing C2H6 from sunlight and keeping them in a properly ventilated area.

3.2. Various Hazards Related to Biomass Storage

The storage of biomass carries several significant concerns as well as health and safety problems, including self-ignition and mold inhalation. Both bacterial or fungal diseases and biomass fires will probably occur, especially in large biomass facilities. The primary health concern is linked to hazardous molds found in wood chips. Normally, Aspergillus Fumigatus leads to severe health issues such as Aspergillosis, various respiratory problems, pulmonary and cardiac infections, asthmatic issues, etc. Aspergillosis is seen as uncommon. Another dangerous situation arises when biomass produces CO in storage rooms because of inadequate air circulation [50].
Biomass creates significant fire and explosion hazards. In addition to the risks to personnel, there may be significant environmental risks related to fire fighting and the pollution effects arising from fire H2O run-off. The size of the potential fire area can be great, so it can become an issue [51].
A great deal of energy is wasted because of large amounts of biomass waste. Not only does the waste pollute the environment by infiltrating soil, H2O, and air, but certain pollutants, such as heavy metals, are also absorbed by and build up in living organisms, leading to significant harm to their systems [52]. The primary issue linked to landfills is the generation of leachate and BG. Leachate is the waste H2O produced as a result of biochemical activities in waste substances [53]. It has a significant quantity of organic materials and contaminants, which taint land, ground H2O, and H2O bodies. Landfill BG primarily consists of CH4 (approximately 40–70% by dry volume), which has 20–25 times more potent warming effects compared to CO2 [54]. In addition to landfilling, burning waste results in CO2, ash, H2O, and various other byproducts. In contrast to PY, incineration occurs in an O2-rich environment [55].
Accelerated industrialization, the ongoing application of heavy metals in manufacturing techniques, and inadequate industrial waste management have led to higher metal concentrations in the environment [56]. The buildup of heavy metals in soil impacts fertility and leads to the creation of polluted land, which in turn alters the quality of food [57]. The buildup of heavy metals in H2O and air leads to significant harm to the species that are exposed to them. Potential health concerns are identified, including mental disorders, developmental irregularities, neuromuscular issues, changed metabolic functions, infertility, organ dysfunction, and cancer development in humans [58], whereas plants experience cellular harm, ionic balance disruption, O2 pressure, and the inhibition of crucial enzymes, microelements, and pigments, as well as interrupted photosynthesis and respiration [59].
Prolonged exposure to environments with elevated levels of heavy metals threatens the variety and lifespan of all living organisms [60].
Strategies for the mitigation of hazards related to biomass storage include processing biomass into hydrogen and other materials using technologies such as pyrolysis (PY). Additionally, biochar, obtained through PY and co-PY, can be used for soil remediation to stabilize heavy metals, thus reducing the phytotoxicity and bioavailability of heavy metals [61]. Biochar promotes the transformation of heavy metals into residual fractions, thus decreasing the accumulation of heavy metals in plants [62]. Moreover, the higher pH value of biochar also favors the immobilization of heavy metals [63].

4. Methods for Renewable-H2 Production from Biomass

Among various renewable energy sources, H2 is deemed the purest energy generator since its only byproduct is H2O, resulting in genuinely zero pollutant emissions. Consequently, creating effective H2 production technologies that make use of biomass resources and guaranteed clean energy with minimal C emissions is essential in combating global warming and achieving waste recovery [64].
H2 is usually bound to other chemical elements and can be separated via energy-intensive few-step conversion processes. For example, Gladchenko et al. [3] optimized the thermophilic anaerobic bioconversion of wheat distillery vinasse, either pure or linked with cow and chicken manure, focusing on the amount of CH4 and BG as a potential source for H2 production.
Additionally, there are two methods for separating H2 from biomass: biological and TC ones. Renewable H2 relates to bio-H2 from microorganisms and H2 produced via the TC conversion of biomass (Figure 1) [39]. Recently, electrochemical processes have also started to be applied for the conversion of biomass into hydrogen [65]. The final product of such methods needs to be subjected to a separation and purification process to provide the high-quality H2 needed by an efficient power system [66].

4.1. Biological Methods Used for Hydrogen Production from Biomass and Hazards Related to It

According to [67], the production of H2 through the conversion of biological biomass may play a key role in future biorefinery systems. Biological methods for producing hydrogen are considered limitless and advantageous for the environment. It allows for producing renewable and C-neutral H2. Numerous biological methods for H2 production have been developed and applied, such as fermentation, bio-photolysis, enzymatic reactions, and microbial electrolysis. Fermentation for the generation of H2 or H2-enriched gases can be categorized into two types according to the requirement for light in the process, specifically dark fermentation (light-independent) and photo-fermentation (light-dependent). In the photo-fermentation process, photosynthetic bacteria use solar energy to generate H2 from organic materials. In addition, bio-photolysis can be categorized into direct and indirect types.

4.1.1. Bio-Photolysis

H2 production via bio-photolysis relies on photosynthetic O2-producing microorganisms like green microalgae (such as Chlamydomonas reinhardtii, Chlorella vulgaris, Scenedesmus obliquus, and Chlorococcum minutum) and cyanobacteria (such as Nostoc sp. and Cyanothece sp.) [68,69,70,71,72,73].
These microorganisms use sunlight to power photosynthesis, which splits H2O and creates H2 with the help of the enzyme hydrogenase (H2ase) as a catalyst [74].
Bio-photolysis helps direct the reductants from splitting H2O for H2 production without utilizing the Calvin cycle or pentose phosphate pathway, entailing photochemical oxidation in the thylakoid membrane of algae and cyanobacteria. In these organisms, two functional assemblies are formed by light-absorbing pigments: photosystems (PSs) I and II. In milieus without O2 or with high energy intake, specific microorganisms direct extra electrons toward hydrogenase, transforming proton (H+) ions into sustainable H2. The electrons and protons combine in this process to produce 98% pure renewable H2 via the chloroplast enzyme dehydrogenase. Bio-photolysis falls under the direct bio-photolysis (DbP) or indirect bio-photolysis (i-DbP) category [75,76].
In the absence of O2, photoautotrophic organisms in DbP utilize the enzyme hydrogenase to transform H2O molecules into molecular H2 and O2 with the help of light absorbed by PSII. These organisms use light energy to remove electrons and protons from H2O molecules. The captured electrons and protons enable the reduction of ferredoxin (Fd) and nicotinamide adenine dinucleotide phosphate (NADP) [77]. Figure 2 shows the flowchart of DbP (based on [76]).
Formulas (1) and (2) [49] outline the general reactions of DbP.
H 2 O L i g h t 2 H + + 2 e + 0.5 O 2 ,
2 H + + 2 e H y d r o g e n a s e 2 H 2
Even though DbP has a high yield, its production is hindered by the O2 released by photosystem II (PSII), which significantly restricts H2ases and weakens H2 production [39].
In the i-DbP process, cyanobacteria and microalgae produce H2 and O2 separately in two steps. During the initial phase, carbohydrates are created with the help of light energy, CO2 is trapped, and O2 is produced. H2 is produced from the synthesized carbohydrates via cell metabolism in the anaerobic milieu in the second step [78,79].
Cyanobacteria are predisposed to be involved in i-DbP because they employ nitrogenase (N2ase) and H2ase enzymes for H2 production, unlike microalgae, which only use H2ase. N2ase operates in one direction, whereas H2ase works in both directions. The process of H2 formation by cyanobacteria is explained via Formulas (3) and (4) [80].
6 C O 2 + 6 H 2 O L i g h t C 6 H 12 O 6 + 6 O 2 ,
C 6 H 12 O 6 + 6 H 2 O L i g h t 12 H 2 + 6 O 2
i-DbP starts with cyanobacteria fixing CO2 and uses sunlight for the production of cellular components and O2 [81]. NADPH produced by metabolism moves to the plastoquinone pool (PQ) and PSII. Ferredoxin transports the electrons produced by PSII via both PSII and PSI to H2ase. The latter facilitates the reaction in which H+ is converted into sustainable H2 [78]. Figure 3 shows the flowchart of i-DbP (based on [79]).
i-DbP has disadvantages, such as poor effectiveness, restricted catalyst supply, sensitivity to the milieu, and technological hurdles [73,77,82].
N2 fixation is carried out by the H2ase uptake, consisting of small (hupS) and large (hupL) subunits. N2ase can reabsorb the H2 released by H2ase while also removing O2 from the system. This process helps to safeguard enzymes sensitive to O2 and results in an indirect boost in H2 production. Certain filamentous cyanobacteria, such as Anabaena, Calothrix, and Nostoc, have produced heterocysts that support N2 fixation and can increase H2 production.
The second phase of i-DbP shares some characteristics with anaerobic fermentation processes. The benefit of i-DbP, in contrast to DbP, is that the O2 generation phase is distinct from the H2 evolution phase, preventing O2 from inhibiting H2 evolution [83,84].
Rey et al. [39] stated that H2 production in bio-photolysis is primarily influenced by temperature, pH, O2 levels, brightness, N2 and S constraints, the availability of organic C sources, cell concentration, and growth stage.
S is a combustible material and poses a fire and explosion hazard at temperatures above 232 °C. Harmful gases generated in fire include H2S, SO2, and SO3 [85].
S has a low level of toxicity to humans. Nevertheless, consuming excessive S might lead to a burning feeling or diarrhea. Inhaling S dust may irritate the respiratory passages or lead to coughing. It may also cause irritation to the skin and eyes [86].
The dangers of H2S arise during the storage or transport of molten sulfur. H2S may build up in enclosed areas [87].
The mitigation of hazards comprises the following measures [87]:
  • Keeping solid S in a ventilated space, away from substances that may react with it.
  • Implementing suitable engineering measures or respiratory safeguards.
  • It is advised to wear safety goggles when exposed to high levels of dust.
  • Wearing a face shield for safety from molten S.
  • Steering clear of continuous or extended skin contact.
  • To safeguard against molten S, it is advised to use gloves and skin protection made from leather or heat-resistant materials.
C is highly flammable in the powder form. The latter is combustible. Finely dispersed particles form explosive mixtures in the air [88].
The mitigation of hazards comprises the following measures [88]:
  • Avoiding open flames, sparks, and smoking.
  • Storing in a closed system, dusting explosion-proof electrical equipment and lighting, and preventing the deposition of dust.
  • Preventing the buildup of electrostatic charges (e.g., by grounding).
  • Wearing safety goggles.
Information on the hazards related to bio-photolysis is shown in Table 1.
The effects of the main parameters on H2 yield in bio-photolysis are shown in Table 2.
Cyanobacteria and microalgae have received significant attention among the microorganisms that can generate H2 [89].
Essential research focused on enhancing the efficiency of H2 production through photosynthetic cultures and accelerating the reaction rate of this process is necessary to address issues related to the concurrent emission of O2 and H2 while ensuring the process remains highly sensitive to O2. Within this framework, studies focused on increasing the H2 production rate by photosynthetic bacteria are currently very significant.
In principle, transformation technology such as chemical catalysis, biocatalysts, or a combination of both can produce 12 mol of H2 for every mole of glucose derived from biomass sugars. Nonetheless, the majority of experimental studies employing those methods did not achieve optimal H2 production due to the formation of undesired products and severe reaction conditions [90]. Scientists also explored an enzymatic method to enhance H2 efficiency from biomass. Zhang et al. [91] showed the excellent performance of the enzymatic process utilizing starch and H2O, with H2 production being approximately 70% of the theoretical prediction. Additionally, 13 enzymes aided the study, which occurred at a temperature of 30 °C.
H2 can be generated by transforming substrates with specific enzymes that do not yield undesired byproducts. The required H2 gas can then be conveniently obtained from the reactor, enabling sustained production. Since the enzymatic process does not involve cellular membranes that can impede mass transfer, unlike the microbial process, it can operate more rapidly to enhance H2 production [92]. This method yields more than dark fermentation (DF—described further), boasts a faster production rate, and can expedite non-natural processes. Several studies on enzymatic hydrogen production have been carried out by scientists [92].
During bio-photolysis, Song et al. [93] obtained a H2 yield range of 140–160 (mL/L) utilizing Chlorella sp. as a microorganism and 30 mM glucose as a substrate. The process was realized in the temperature range of 25–42 °C, with a light intensity (LI) of 120 μmol/m2/s, an incubation time (IT) of 70 h, and a pH of 8.6, using MA as a medium and a serum bottle reactor (Table 1).
In a similar process, Sengmee et al. [94] produced a H2 yield of 11.65 (mL/L) using C. vulgaris as a microorganism and crude C3H8O3 as a substrate. The process was realized at a temperature of 30 °C, with an LI of 48 μmol/m2/s, an IT of 72 h, and a pH of 6.8, using modified Tris-Acetate-Phosphate (TAP) as a medium and a 1 L bioreactor (Table 1).
Then, Pyokim et al. [95] obtained a H2 yield of 225 (mL/L) utilizing C. reinhardtii as a microorganism. The process was realized at a temperature of 25 °C, with an LI of 200 μmol/m2/s, an IT of 140 h, and a pH of 7.2, using TAP as a medium and 250 mL Erlenmeyer flasks as reactors (Table 1).
Also, during bio-photolysis, Bala Amutha and Murugesan [96] produced a H2 yield of 220 (mL/L) using C. vulgaris as a microorganism and corn stalk as a substrate. The process was realized at a temperature of 30 °C, with an LI of 108 μmol/m2/s, an IT of 144 h, and a pH of 7.0, using modified Blue-Green (BG-11) as a medium and a 500 mL bioreactor (Table 1).
Then, Chader et al. [97] obtained a H2 yield of 147 (mL/L) utilizing C. sorokiniana as a microorganism and acetate as a substrate. The process was realized at a temperature of 30 °C, with an LI of 120 μmol/m2/s, an IT of 222 h, and a pH of 7.2, using BG-11 as a medium and 500 mL Erlenmeyer flasks as reactors (Table 1).
With the same reactor, Hong et al. [98] obtained a H2 yield of 118 (mL/L) using C. reinhardtii as a microorganism and starch as a substrate. The process was realized at a temperature of 28 °C, with an LI of 50 μmol/m2/s, an IT of 144 h, and a pH of 7.5, using TAP-C as a medium (Table 1).
In a similar process, Huesemann et al. [99] produced a H2 yield of 115 (mL/L) utilizing P. boryanum as a microorganism and 3-(3,4-dichlorophenyl)-1,1-dimethylurea (DCMU) as a substrate. The process was realized at a temperature of 22 °C, with an LI of 50 μmol/m2/s, an IT of 188 h, and a pH of 7.5, using 0.5 mM N as a medium and Roux bottles as reactors (Table 1).
During their study, Vargas et al. [100] obtained a H2 yield of 61.7 (mL/L) using C. reinhardtii as a microorganism. The process was realized at a temperature of 24 °C, with an LI of 60 μmol/m2/s, an IT of 204 h, and a pH of 7.2, using TAP-S as a medium and 500 mL Duran glass bottles as reactors (Table 1).
Then, Vargas et al. [101] produced a H2 yield of 13.15 (mmol H2/mg Chla) utilizing Anabaena sp. as a microorganism and glucose as a substrate. The process was realized at a temperature of 24 °C, with an LI of 4400 lux, an IT of 156 h, and a pH of 9.2, using BG-11 as a medium and 500 mL Duran glass bottles as reactors (Table 1).
Also, using the cyanobacterium Anabaena sp., Vargas et al. [102] generated H2 through Ni2 limitation in two phases of growth. They found that improving biomass during the initial culture phase increased production by 18.3%, and heterocyst formation was 3.4 times more significant in N2-deficient conditions.
During their study, Raksajit et al. [103] obtained a H2 yield of 3.61 (mmol H2/mg Chla) using Arthrospira sp. as a microorganism and 0.1% glucose as a substrate. The process was realized at a temperature of 30 °C, with an LI of 40 μmol/m2/s, an IT of 156 h, and a pH of 9.0, using Zarrouk medium [104] without nitrate (ZN0) as a medium and 500 mL Duran glass bottles as reactors (Table 1).
With the same reactor, Vargas et al. [105] obtained a H2 yield of 9.23 (mmol H2/mg Chla) utilizing Chlamydomonas sp. as a microorganism. The process was realized at a temperature of 24 °C, with an LI of 60 μmol/m2/s, an IT of 372 h, and a pH of 7.2, using TAP-S as a medium (Table 1).
Kossalbayev et al. [89] investigated the production of biological H2 from various strains of cyanobacteria, such as Synechocystis sp. PCC 6803, Desertifilum sp. IPPAS B-1220, Synechococcus sp. I12, and Phormidium corium B-26. Synechocystis sp. produced H2 accumulation. PCC 6803 reached a peak of 0.037 μmol/mg Chl/h after 120 h in darkness. The native, filamentous, non-heterocystous cyanobacterium Desertifilum sp. IPPAS B-1220 achieved a peak of 0.229 μmol/mg Chl/h in the gas phase after 166 h of light exposure, matching the highest yield documented in existing research. DCMU at a concentration of 10 μM enhanced H2 production by Desertifilum sp. IPPAS B-1220, which increased by 1.5 times to 0.348 μmol H2/mg Chl/h. Desertifilum sp. IPPAS B-1220 produced H2 in the light at a 20-fold greater rate than in the dark during studies aimed at discovering new cyanobacterial strains that can generate and enhance conditions for H2 production. The cyanobacteria could effectively transform solar energy into molecular H2.
A significant challenge in bio-H2 production is the presence of O2 generated during the process, which poses a major barrier to obtaining H2 from biomass and organic solid waste [106]. In the presence of O2, the activity of enzymes, transcription processes, and protein maturation may be suppressed [107]. Scientists are working to enhance H2 production from biomass and organic solid waste while tackling the issue of O2 molecule presence. Melis [108] showed that H2ase enzyme activity in algae cultures, like Chlamydomonas, requires the absence of O2. To enhance H2 production from green algae, Paramesh and Chandrasekhar [109] employed O2 scavengers like Na2SO3, Na2S2O5, and Na2S2O4. They found that all three scavengers could enhance H2 production. Due to its elevated O2 usage, Na2SO3 yielded the best results. NaHSO3 has been utilized before to enhance H2 production in Chlamydomonas reinhardtii [110]. The findings indicated that a minor amount of sodium bisulfite in the examined algae could effectively extract O2. Surzycki et al. [111] studied the application of O2 blockers with Cu to enhance H2 production in algae farming.
Efficient bioreactors and genetic engineering are essential elements in creating a sustainable biological method for H2 production. The latter is considered pioneering research regarding the enhancement of H2 production during the process [106]. Certain photosynthetic bacteria, including cyanobacteria and Rhodobacter sphaeroides, have undergone genetic engineering [112,113]. Since most studies are conducted on a laboratory scale, the reactor’s efficient design needs to be developed on a larger scale. When designing bioreactors, crucial factors to consider include temperature regulation, the stirring mechanism, bioreactor efficiency with identical volumes but different area–volume ratios, and the capacity to manage consortium organisms [114].
Table 1. Hazards related to bio-photolysis used for H2 production during diverse studies.
Microorganism/Substrate/Operating ConditionsInformation of HazardsRefs.
Chlorella sp.;
30 mM glucose;
T: 25–42 °C; LI: 120 μmol/m2/s; IT: 70 h; pH: 8.6; Medium: MA; Reactor type: serum bottle reactor.
MA-Medium for fresh-H2O, terrestrial, hot-spring, and salt-H2O algae. Some types of algae are harmful when they grow too quickly or make toxins. Toxins from algal cells or those released into H2O can make people and animals ill when they encounter these toxins via food or H2O. At times, algal blooms can grow so thick that they block sunlight, preventing other aquatic plants and animals from obtaining the amount needed for their survival. Thick blooms can similarly obstruct the gills of fish, shellfish, and other creatures, hindering their ability to breathe. When a bloom fades away, the decomposition process can consume all the O2 in the H2O, leading to the suffocation of other aquatic life. When a bloom deteriorates, it might emit gases like CH4 and H2S that can pose dangers to humans.
The mitigation of hazards comprises the following measures:
  • Restrict nutrient pollution or fertilizers in H2O to prevent the growth of harmful algal blooms.
  • Decrease the quantity of nutrients that enter H2O via the use of the proper quantity of fertilizer and maintain the septic system.
[115,116,117]
Chlorella sp.—The cells of Chlorella sp. do not create any harmful substances and are regarded as safe for people to eat (when used as food supplements based on such microalgae). There are serious worries about the quality of products made from such microalgae because they may be contaminated with toxic metals, inorganic arsenic, or cyanotoxins.
The mitigation of hazards comprises the following measures:
Use only premium Chlorella products and make sure that the food is well formulated to prevent any possible negative impacts on fish health and productivity.
[118]
Chlorella sp. has no negative impact on fish health, growth, or immune system function, but more research is necessary to understand its long-term effects on fish.[119]
Glucose is a safe substance or mixture under Regulation (EC) No 1272/2008 [120].[121]
Serum bottles are commonly made of transparent polyester (PET) material (inedible). This substance is harmless, has no flavor, and is highly transparent.[122]
Serum bottles made from Wheaton 400 borosilicate molded glass can also meet USP Type I requirements.[123]
Cyanobacteria, also known as blue-green algae, induce most toxic algal blooms in fresh H2O. Diatoms or dinoflagellates (red tides) are responsible for inducing the most harmful algal blooms in salt H2O.
Prevention: Similar to the case of MA.
[116]
Excessive algal growth deprives or restricts other types of marine life and obstructs the sunlight needed for their rapid proliferation. Issues with taste and smell in drinking H2O and fish deaths are linked to high levels of planktonic algae blooms.
Prevention: Similar to the case of MA
[124]
C. vulgaris;
Crude glycerol;
Temp.: 30 °C; LI: 48 μmol/m2/s, IT: 72 h; pH: 6.8; Medium: Modified TAP; Reactor type: 1 L bioreactor
Administering Chlorella vulgaris orally to mice in both acute and multiple doses did not result in any toxicity or adverse reactions.[125]
No physical or behavioral changes were observed with different doses of C. vulgaris, and there were no signs of pain or distress, suggesting that C. vulgaris is not toxic. A study based on OECD Guideline 420 found no acute liver damage in female SD rats when given Chlorella vulgaris at 2000 mg kg−1 BW. Therefore, C. vulgaris falls into the unclassified category within the classification of GHS.[126]
Crude C3H8O3/Glycerin can induce skin irritation (H315) and organ damage (H370) and is dangerous if ingested (H302).
Excessive mist buildup can cause irritation of the respiratory tract. It can cause temporary eye discomfort (burning, stinging, and tearing).
Possible health impacts relate to the following:
Eyes: Contact can lead to slight eye discomfort.
Skin: Exposure might lead to skin irritation.
Ingestion: It is of minimal toxicity. It could be dangerous if swallowed. It can result in nausea, headaches, and diarrhea.
Inhalation: Due to its low vapor pressure, it is improbable that vapor would be inhaled at room temperature. Breathing in mist can lead to irritation of the respiratory system.
The mitigation of hazards comprises the following measures:
  • P260: Avoid inhaling dust/fume/gas/mist/vapors/aerosol.
  • P264: Clean well after contact.
  • P270: Avoid eating, drinking, or smoking while using this product.
  • P280: Utilize protective gloves/protective clothing/eye safety/face protection.
  • P301 + P312: If ingested, contact a poison control center or medical professional if feeling unwell.
  • P302 + P352: In case of skin contact, rinse thoroughly with soap and H2O.
  • P309 + P311: If exposed or feeling unwell, contact a poison center or a doctor/physician.
  • P330: Wash out the mouth.
  • P332 + P313: In case of skin irritation, seek medical advice/assistance.
  • P362: Remove soiled clothing and launder it before wearing it again.
  • P405: Store secured.
  • P501: Dispose of the contents/container according to local, regional, national, and international regulations.
[127,128]
C. reinhardtii;
-;
T: 25 °C; LI: 200 μmol/m2/s; IT: 140 h; pH: 7.2; Medium: TAP; Reactor type: 250 mL Erlenmeyer flasks
Dried biomass powder of C. reinhardtii (THN 6) did not show mutagenic properties in the bacterial reverse mutation test at the highest recommended concentration for soluble non-cytotoxic substances and did not exhibit clastogenic effects in the chromosomal aberrations test at the maximum cytotoxic concentration. The micronucleus test showed that THN 6 dried biomass powder did not exhibit genotoxic effects in vivo when tested at the maximum dose. In the end, the administration of 6 dried biomass powders via gavage to male and female HSD showed no specific organ effects or toxicity. Han Wistar rats were fed 4000 mg/kg bw/day doses.[129]
Erlenmeyer flasks made of PTFE: According to CLP regulation (EC) No. 1272/2008 [120], this product is not classified as an unsafe substance/unsafe mixture. Products can induce burns in hot conditions. Heating PTFE above 400 °C can induce unsafe vapors. The latter can induce irritation in the eyes, nose, throat, and lungs.
The mitigation of hazards comprises the following measures:
  • If the product becomes too hot, ensure there is sufficient ventilation or exhaust when the product is heated. Utilize respiratory protective equipment if the ventilation is inadequate.
  • An evaluation of occupational exposure is needed to identify appropriate eye/face protection. If hot PTFE contacts your eyes, rinse them with cold water for a minimum of 15 min. Do not attempt to take out such hot material. Seek medical advice/attention without delay.
  • Steer clear of touching the skin. In the case of contact with hot PTFE, rinse the skin right away with cold water for a minimum of 15 min. Avoid attempting to take out the hot material. Dress the wounded area with sterile bandages. Seek medical advice or attention right away.
  • Wearing chemically resistant protective gloves is not essential. When working with hot PTFE, use thermal-insulating gloves to prevent burns.
  • When PTFE products are utilized in compliance with regulations, there is no need for respiratory protection.
  • If inhaled, promptly relocate to an area with fresh air. Seek medical guidance if you experience discomfort.
[130]
TAP-TAP (Tris-Acetate Phosphate) Medium induces skin irritation (H315). It also induces serious eye irritation (H319). In a blend including, i.a., CuSO4.5H2O and ZnSO4·7H2O, it might be harmful to the user or the environment or may be presumed to be so.
The mitigation of hazards comprises the following measures:
  • P280: Use protective apparel/protective gloves/eye safety gear.
  • P305 + P351 + P338: In case of eye contact, gently rinse with water for a few minutes. Take out contact lenses if they are in place and simple to remove. Keep rinsing.
[131]
C. vulgaris;
Corn stalk;
T: 30 °C; LI: 108 μmol/m2/s; IT: 144 h; pH: 7.0; Medium: Modified BG-11; Reactor type: 500 mL bioreactor
C. vulgaris—as mentioned.
Corn stalk-The cornstalk plant is moderately toxic to pets. In dogs, it induces signs of gastrointestinal upset with vomiting and diarrhea.
Mitigation of hazards: Avoid contacting pets with the corn stalk. If necessary, contact a veterinarian.
[132]
Corn plant sap is toxic, especially to inquisitive kids and pets. Consuming the corn plant may result in nausea, vomiting, and diarrhea. The intensity of these symptoms frequently depends on the quantity ingested. Continuous contact with the toxins in the corn plant can lead to long-term health problems.
The mitigation of hazards comprises the following measures:
  • It is vital to recognize the dangers and refrain from excessive consumption of corn plants or its products.
  • If ingestion happens, it is crucial to obtain medical help quickly to reduce possible long-term consequences.
[133]
Cornstalk plants are toxic to dogs, cats, and horses. It can cause vomiting (seldom with blood), depression, anorexia, hypersalivation, and dilated pupils in cats.[134]
Modified BG-11 (Blue-Green) Medium can harm fertility or the developing baby (H360). It causes irritation of the skin (H315) and eyes (severely) (H319). It can cause irritation of the respiratory system (H335).
The mitigation of hazards comprises the following measures:
  • P221: Take all necessary measures to prevent contact with flammable materials.
  • P280: Use protective clothing/gloves/eye protection.
  • P305 + P351 + P338: If it contacts the eyes, rinse gently with water for a few minutes. Take out contact lenses if in place and simple to remove. Keep rinsing.
  • P308+P313: If exposed or worried, seek medical advice/assistance.
  • P405: Store secured.
  • P501: Dispose of contents/container in compliance with federal, state, and local environmental laws.
[135]
C. sorokiniana;
Acetate;
T: 30 °C; LI:
120 μmol/m2/s; IT: 222 h; pH: 7.2; Medium: BG-11; Reactor type:
500 mL Erlenmeyer flasks
Chlorella sorokiniana can contain heavy metals (Hg, Pb, Cd) if its culture medium is not strictly controlled, such as culture in a non-glass tube. The composition of samples of material containing Chlorella sorokiniana should be systematically monitored.[136]
Some people may experience gastrointestinal signs such as nausea, diarrhea, gas, or abdominal pain.
The mitigation of hazards comprises the following measures:
People who are allergic to I2 or have thyroid problems and troubles need to be extremely careful or avoid chlorella containing naturally present I2. Chlorella should also be avoided by people with autoimmune diseases and by pregnant and breastfeeding women.
[137]
Ethyl acetate is an extremely flammable liquid and vapor (H225). It causes severe irritation of the eye (H319). It can cause drowsiness or dizziness (H336). Repeated exposure can cause skin dryness or cracking (EUH066).
The mitigation of hazards comprises the following measures:
  • P210: Avoid exposure to heat, hot surfaces, sparks, open flames, and other sources of ignition. No tobacco use.
  • P233: Ensure the container is securely closed.
  • P240: Ground and connect the container and receiving apparatus.
  • P241: Utilize explosion-safe electrical/ventilation/lighting equipment.
  • P242: Utilize tools that do not create sparks.
  • P305 + P351 + P338: If in contact with eyes, gently rinse with water for a few minutes. Take out contact lenses if in place and simple to manage. Keep rinsing.
[138]
BG11 Broth-An oxidizer able to amplify fire (H272). It causes severe irritation of the eye (H319).
The mitigation of hazards comprises the following measures:
  • P210: Avoid exposure to heat, hot surfaces, sparks, open flames, and other sources of ignition. No tobacco use.
  • P220: Stay clear of apparel and other flammable substances.
  • P264: Cleanse skin thoroughly after contact.
  • P280: Use protective gloves/protective clothing/eye protection/facial protection.
  • P305 + P351 + P338: In case of eye contact, rinse gently with water for a few minutes. Take out contact lenses if they are in place and easy to remove. Keep rinsing.
  • P337 + P313: If eye irritation continues, seek medical advice/attention.
[139]
Erlenmeyer flasks-as mentioned.
C. reinhardtii;
Starch;
T: 28 °C; LI: 50 μmol/m2/s; IT: 144 h; pH: 7.5; Medium: TAP-C; Reactor type: 500 mL Erlenmeyer flasks
C. reinhardtii—as mentioned.
Starch is not an unsafe substance or mixture. It may form an explosible dust–air mixture if dispersed.
The mitigation of hazards comprises the following measures:
  • When the product is managed correctly, dangerous effects are not probable.
  • Respiratory protection is not necessary, but it is important to avoid inhaling the dust since even harmless dust can adversely affect respiratory function.
  • Use appropriate body armor.
  • To safeguard the skin, use gloves when handling the material.
  • Wear appropriate safety goggles that have side protection.
  • Avoid allowing the product to go into drains.
[140]
Starch has the potential to create flammable dust levels in the air (while being processed).
The mitigation of hazards comprises the following measures:
  • Prevent material from reaching children.
  • Avoid eating, drinking, or smoking while using this product.
  • Ensure adequate exhaust ventilation. Under normal usage conditions, respiratory protection is not necessary. Utilize appropriate respiratory protection when high levels are present or when aerosol or mist is created. In cases of spills, it might be wise to use respiratory protection.
  • To safeguard the skin, the glove material must be waterproof and durable against the product, substance, or formulation being used or handled.
  • Eye safety requires the use of safety glasses with side shields or goggles. Standard safety precautions must be followed when working with chemicals. Maintain distance from food, drinks, and feed supplies. Promptly take off all dirty and contaminated garments. Clean hands before taking breaks and after finishing work. Avoid breathing in gases, fumes, dust, mist, vapor, or aerosols. Steer clear of contact with the eyes and skin.
[141]
TAP—as mentioned. However, TAP-C—no information.
Erlenmeyer flasks—as mentioned.
P. boryanum;
DCMU;
T: 22 °C; LI: 50 μmol/m2/s; IT: 188 h; pH: 7.5; Medium: 0.5 mM N; Reactor type: Roux bottle
Administration of lyophilized microalgal biomass suspension of P. boryanum at doses of 300 and 2000 mg.kg−1 showed no toxicity signs, indicating its safety according to its OECD classification as “Minimal Toxicity or Secure”.[142]
DCMU is toxic when ingested (H302). It is believed to cause cancer (H351). Prolonged or repeated inhalation of the substance may induce harm to organs (blood) (H373). It has high toxicity to aquatic organisms with long-lasting effects (H410).
The mitigation of hazards comprises the following measures:
  • P202: Do not touch until all safety measures have been read and comprehended.
  • P260: Avoid inhaling dust. Respiratory protection is necessary when dust is produced.
  • P264: Cleanse skin thoroughly following handling. Utilize appropriate gear for skin safety.
  • P273: Prevent discharge into the environment. Avoid letting the product go down the drain.
  • P301 + P312: If ingested, contact a poison center/doctor if you feel unwell.
  • P308 + P313: If exposed or worried, seek medical advice/attention. Wear protective clothing and suitable gear for eye safety.
[143]
Roux bottle—Roux laboratory bottles made of Borosil are chemically resistant and stable.[144]
C. reinhardtii;
-;
T: 24 °C; LI: 60 μmol/m2/s; IT: 204 h; pH: 7.2, Medium: TAP-S; Reactor type: 500 mL Duran glass bottles.
C. reinhardtii—as mentioned.
TAP—as mentioned. However, TAP-S—no information.
Duran glass bottles are made from 3.3 borosilicate glass, exhibiting exceptional thermal shock resistance and chemical compatibility, ensuring safe handling of diverse substances.[145]
Anabaena sp.;
Glucose;
T: 24 °C; LI: 4400 lux; IT: 156 h; pH: 9.2; Medium: BG-11, Reactor type: 500 mL Duran glass bottles.
Anabaena sp. is non-toxic and not pathogenic (hazard class: 1).[146]
Anabaena spp. can generate anatoxin-a, anatoxin-a(s), saxitoxin, and microcystins. Anatoxin-a affects nerve synapses. It works as a postsynaptic cholinergic nicotinic agonist, inducing a depolarizing neuromuscular blockade.[147]
Glucose—as mentioned.
BG-11—as mentioned.
Duran glass bottles—as mentioned.
Arthrospira sp.;
0.10% glucose;
T: 30 °C; LI:
40 μmol/m2/s; IT: 156 h; pH: 9.0; Medium: ZnO.
Arthrospira sp. is safe to ingest by animals and humans.[148]
ZN0—a complex medium, no information about hazards.[148]
Glucose—as mentioned.
Chlamydomonas sp.;
-;
T: 24 °C; LI: 60 μmol/m2/s; IT: 372 h; pH: 7.2; Medium: TAP-S; Reactor type: 500 mL Duran glass bottles.
Chlamydomonas sp. is non-toxic.[149]
TAP—as mentioned. However, TAP-S—no information.
Duran glass bottles—as mentioned.
Abbreviations: Tris-Acetate-Phosphate (TAP), Blue-Green (BG), 3-(3,4-dichlorophenyl)-1,1-dimethylurea (DCMU).
The operational conditions should be optimized to enhance H2 generation via bio-photolysis using microalgae or cyanobacteria [39].
Microorganisms used during bio-photolysis usually exhibit no or low toxicity or pathogenicity. Only for Anabaena spp., information was found indicating that they can produce several kinds of toxins. Materials used as reactors exhibited no toxicity. Materials used as substrates or media can exhibit different levels of toxicity depending on the type and application. For ZN0, being a complex medium, no information was found about hazards. However, it is expensive, and various cheaper substitutes for ingredients [104] are used instead of the original ones. The resulting toxicity level of the resulting mixtures remains unknown and requires further research.
Table 2. Effects of the main parameters on H2 yield in bio-photolysis.
Parameters Effects on H2 Yield in Bio-Photolysis Refs.
Temperature The ideal temperature for H2 production significantly differs between species.[39]
The peak H2 yields for cyanobacteria are found at temperatures between 30 and 40 °C; however, certain strains show maximum production within a cooler temperature range of 20–25 °C.[150,151]
pH Cyanobacteria demonstrated the greatest H2 production at a pH of 8.0, while an acidic pH of 4.5 led to an 83% decrease in H2 output. The ideal pH range for achieving peak H2 production in most species lies between 6.0 and 8.0.
H2 production significantly declined at a starting acidic pH (5.0) and gradually increased under alkaline conditions, attaining peak yield at pH 9.0.
[150]
O2 content O2 in the milieu hinders renewable-H2 production by the enzyme hydrogenase, and production stops entirely when O2 levels completely deactivate the catalytic activity.
Producing O2 and H2 simultaneously necessitates the extraction of O2 from the milieu to maintain process efficacy.
[89]
Light intensity H2 production by C. reinhardtii demonstrated a gradual increase in yield from 60 to 200 µE m−2 s−1, ultimately achieving peak production. Raising the light intensity to 300 µE m−2 s−1 showed light saturation accompanied by a reduction in H2 production.[95]
N2
and S limitation
It was reported that ongoing H2 production from cyanobacteria achieves the greatest yield when deprived of N2 and S.[103]
The S absence creates an anaerobic setting, boosting the capacity of microalgae to generate H2.[152]
Organic carbonOrganic carbon sources enhance the growth of mixotrophic cyanobacteria and aid in H2 production by fostering an anaerobic milieu suitable for achieving greater process efficacy.[101]
Cell density and culture ageElevated cell density within the photobioreactor limits light access for each cell, diminishing photosynthesis and elevating respiration. Even younger cultures with lower biomass demonstrate greater H2 production because the exponentially growing cells are more metabolically active than the older cells.[101]
Loyte et al. [153] noticed that methods like enhancing growth conditions, genetic modification, employing microalgal consortia, creating advanced photobioreactor designs, and utilizing enzymatic processes are utilized to gain a clearer understanding and consequently devise strategies and techniques to boost H2 production from microalgae. Obstacles like inadequate production rates, significant expenses associated with various stages of cultivating the desired traits of microalgae, and understanding the evolutionary trends under production conditions, environmental influences, and numerous difficulties in harvesting have presented serious challenges, highlighting the urgent need for progress in genetic engineering, photo-biochemistry, and photobioreactors. Economic feasibility is yet another challenge that can be addressed through enhancements in comprehension of the existing generative model. Methods that are still uncertain with today’s technology but show significant potential for future progress in the present model of inference and synthesis encompass artificial photosynthesis, synthetic biology, improved materials for photobioreactors, enhanced microalgal consortia, the application of nanomaterials, and sophisticated process control systems.
Bio-photolysis is in the developing stage, and its cost is 2.13 USD/kg. The process drawbacks include the high O2 sensitivity of hydrogenase and low light conversion efficacy. The remedy for them is the requirement for proper enzymes. The process efficiency is in the range of 10–11% [154].
No matrices of risks related to any solutions for hydrogen extraction from biomass using bio-photolysis were found in the literature. Thus, more studies are needed in this area.

4.1.2. Photo-Fermentation

H2 is generated in photo-fermentation (PF) during the breakdown of organic compounds by photosynthetic bacteria like purple non-sulfur bacteria (PNS), such as Rhodo-bacteria sphaeroides, Rhodobacter capsulatus, Rhodobacter sulfidophilus, Rhodopseudo-monas palustris, and Rhodospirillum rubrum. Light energy assists N2ase in catalyzing this process [155,156]. The tricarboxylic acid (TCA) cycle metabolizes organic substrates to produce the necessary reducing power and C intermediates for H2 generation [157]. H2 production by PNS bacteria via the TCA cycle involves multiple biochemical processes.
Firstly, the C source is oxidized to generate CO2, H+ ions, and electrons. N2ase is supported by the oxidation/reduction of electron carriers such as NAD(P)H and ferredoxin (Fd) during the transfer of the latter. At that moment, PSI in the photosynthetic membrane uses light energy to produce the ATP required for N2ase activity in collaboration with ATP synthase. Furthermore, N2ase converts protons (H+) into molecular H2. Additionally, H2ase enzymes are involved in metabolism, transforming H2 into electrons and protons in specific circumstances [158]. According to Formula (5), CH4 production results in the creation of one H2 molecule for every N2 molecule fixed [159].
N 2 + 8 e + 8 H + + 16 A T P 2 N H 3 + H 2 + 16 A D P + 16 P i ,
In the absence of N2, N2ase does not convert N2 but instead facilitates a different reaction producing H2, as shown in Equation (6).
8 e + 8 H + + 16 A T P 4 H 2 + 16 A D P + 16 P i
Under these circumstances, bacteria in the peripheral nervous system (PNS) use organic acids like acetic acid (C2H4O2), butyric acid (C4H8O2), or lactic acid (C3H6O3) to generate H2 [160]. They can also use monosaccharides, such as glucose, and polysaccharides, such as starch, to produce H2 [161]. Nevertheless, this response requires a high consumption of energy within the cell, specifically in the form of ATP molecules. Despite being energy-intensive, this process is very efficient for producing H2 because all protons can be converted to renewable H2 [159].
The PF process yields 4 moles of H2 gas per mole of glucose, with CH3COOH being the result. Yet, the yield decreases to 2 mol H2/mol glucose if butyric acid is the result, as outlined in Equations (7) and (8) [161,162].
C 6 H 12 O 6 + 2 H 2 O 2 C 2 H 4 O 2 + 4 H 2 + 2 C O 2 ,
C 6 H 12 O 6 C 4 H 8 O 2 + 2 H 2 + 2 C O 2
In the absence of O2, the thermodynamics of acid production promotes the formation of CH3COOH and C4H8O2, leading to their presence in the metabolites of the ultimate PF output. Thus, the H2 production is consistently less than 4 mol H2/mol glucose [163].
Figure 4 shows the flowchart of PF (based on [156]).
Similar to anaerobic conversion, the PF process involves the fermentative transformation of organic substrates into bio-H2 by various photosynthetic bacteria through a sequence of three biochemical steps [67].
Photosynthetic bacteria such as Rhodospirillum, Rhodobacter, Rhodobium, and Rhodopseudomonas can produce H2 via their nitrogenases. Due to its significant advantages of abundant material resources and comprehensive substrate utilization, PF H2 production has garnered interest in recent years [79].
The rate of H2 production rises with higher light intensity, while the efficiency of light conversion decreases. When compared to cyanobacteria, utilized in indirect bio-photolysis, the photosynthetic bacteria in the PF pathway demonstrate a higher efficiency in light conversion [67].
Basak et al. [164] studied purple non-S bacteria cultivated in an O2-poor milieu employing N2ase and an organic acid as a reducing agent for H2 production. This method has multiple shortcomings, outlined as follows:
  • Minimal efficiency in converting solar energy (3–10%).
  • The requirement for extensive anaerobic photo-bioreactors.
  • The reliance on nitrogenase enzymes, which require significant energy for activation.
The activity of N2ase is essential for H2 production in photosynthetic bacteria. Hydrogenase functions in both H2 production and H2 uptake under identical conditions. The primary benefit of this approach is the elevated concentration of H2 in the resulting gas stream [67]. Tao et al. [165] indicated a concentration of approximately 96% H2 in the product gas stream.
Another benefit of this technique is that the organic acid used as a substrate is present in the wastewater discharge of various industries. The effluent from DF can be utilized as a substrate for PF [166,167]. This method could be utilized to generate H2 from various types of biomass waste [168].
Utilizing only C sources, H2 production was demonstrated to rise by 2–3 times [169].
Fedorov et al. [170] introduced the bacterial system and the efficiency of H2 conversion for different feedstocks.
The effectiveness of PF in producing H2 depends on anaerobic milieus, light intensity, temperature, pH levels, light wavelength, the concentration of the substrate, and the type of substrate [67].
N2ase is very responsive to O2 and is permanently deactivated by it [159]. Therefore, increasing the production of H2 is achieved by creating a low-O2 milieu in the reaction mixture [158]. For effective H2 production, the ideal conditions are temperatures between 31 and 36 °C, LI between 6 and 10 klux, pH levels between 6.8 and 7.5, and a wavelength between 400 and 1000 nm. Another important factor is the amount and composition of the substrate [171]. Bacteria from the PNS group produce more H2 when utilizing fatty acids such as short-chain and volatile fatty acids (acetate, butyrate, lactate, malate, etc.) compared to when using sugar substrates [77,109].
Numerous research efforts focused on photosynthetic bacteria have been recorded in the literature; however, the PF process has never been found to be an economically viable method. PF techniques provide various benefits, such as utilizing a significant amount of feedstock and harnessing abundant heat from sunlight. The problems that still need to be addressed include the lower volumetric flow rate of H2, the efficiency of conversion, and the requirement for a large surface area [67].
Details regarding hazards associated with PF are displayed in Table 2.
In the process of PF, Cheng et al. [172] achieved a total H2 yield of 463 (mL H2/g vs) by utilizing C. butyricum and R. palustris as starter cultures and rice straw as the substrate at 30 °C, pH 7.0, and LI conditions of 6000 lux illuminance (Table 2).
In a similar manner, García-Sánchez et al. [173] achieved a total H2 yield of 260 (mL H2/L) by employing R. pseudopalustris DSM 123 as an inoculum and tequila vinasses as a substrate at a temperature of 30 °C, a pH of 7.0, and LI from an LED lamp (13.5 W/m2). The inoculum was in the form of a cell suspension with a concentration of 3.3 g/L (Table 2).
In a study by Yue et al. [174], a total H2 yield of 74.0 (mL H2/g TS) was achieved with an inoculum containing HAU-M1 (R. sphaeroides (9%), R. palustris (28%), R. rubrum (27%), R. capsulata (25%), and R. capsulatus (11%)), along with corn stover as the substrate. The inoculum contained 30% TS with 150 mg/g, and 100 mg/L of TiO2/activated carbon fiber was added. The procedure was carried out at a pH of 7.0 and an LI of 3000 lux (Table 2).
Lu et al. [175] achieved a total H2 yield of 68.4 (mL H2/g DM) under the conditions of 30 °C temperature, pH 7.0, and an LI of 3000 lux using an identical inoculum and substrate with a concentration of 25 gDM/L (Table 2).
Likewise, Budiman and colleagues [176] achieved a total H2 yield of 14.4 (mL H2/mL medium) by using R. sphaeroides NCIMB8253 as the inoculum and a substrate consisting of a mixture of palm oil (25%, v/v) and pulp and paper (75%, v/v) mill effluents. The mixed substrate consisted of 25% POME and 75% PPME. The procedure was carried out at a temperature of 30 degrees Celsius and a light intensity of 7000 lux (Table 2).
PF is in the developing stage and is characterized by a cost of 3.7 USD/kg. PF has drawbacks such as low H2 yield and an efficiency equal to 11.9% (after using a catalyst). The remedy for them is utilizing appropriate catalysts [177,178].
No matrices of risks related to any solutions of H2 extraction from biomass using bio-photolysis were found in the literature. Thus, more studies are needed in this area.

4.1.3. Dark Fermentation

DF primarily uses anaerobic microorganisms such as Enterobacter cloacae, Escherichia coli, Klebsiella pneumoniae, and Bacillus subtilis (facultative anaerobes) and Clostridium butyricum, Clostridium acetobutylicum, Clostridium thermocellum, and Thermoanaerobacterium thermosaccharolyticum (strict anaerobes) in the absence of light at temperatures ranging from 25 to 45 °C for mesophilic conditions, 45 to 80 °C for thermophilic conditions, and above 80 °C for extreme thermophilic conditions. Additionally, gases like CO2, CO, and H2S may also be produced under these conditions. Glucose molecules in carbohydrates and other feedstocks are the main source of H2 [179,180]. Figure 5 shows the flowchart of PF (based on [180]).
The metabolic pathways utilized by microorganisms are the primary factors influencing the H2 yield and effluent composition in dark fermentation (DF). Facultative anaerobes utilize the first pathway, which involves pyruvate formate lyase (PFL). The second one, which is used by strict anaerobes, includes pyruvate ferredoxin oxidoreductase (PFOR) [181]. In the process of generating H2 from glucose-rich substances, intricate compounds are initially broken down into simpler molecules, such as pure glucose. Afterward, it is broken down without O2 to create NADH, pyruvate, and ATP [163]. During the PFL pathway, pyruvate converts to formate and acetyl-CoA with the help of coenzyme A (CoA-H) present. Formate is oxidized to CO2 and H2 via either the formate-H2 lyase (NiFe-H2ase) pathway or a formate-dependent [FeFe] H2ase pathway. In the PFOR route, pyruvate is converted into reduced ferredoxin and acetyl-CoA through the actions of ferredoxin oxidase and CoA-H. Ferrodoxin that has been reduced is subsequently oxidized to produce hydrogen gas using a ferredoxin-dependent enzyme called H2ase (Fd-[FeFe]) [182].
Additionally, H2 can be produced by NADH via the reduction of ferredoxin, the reduction of a H2ase (NADH-[FeFe]), or the oxidation of NADH by Fd-NADH-[FeFe]. Acetyl-CoA has the potential to be converted into CH3COOH, C4H8O2, or CH3CH2OH with the help of NADH, resulting in a variety of PF liquid byproducts. Additional types of liquid waste, including propionate, butanol, and lactate, may also be produced [163].
Hydrolysis, acidogenic fermentation, acetogenesis, and methanogenesis make up the anaerobic digestion (AD) process [183]. Both fermentation and anaerobic digestion (AD) are processes that occur without O2.
Ellofy et al. [67] explained that the DF process consists of the initial two stages of AD (hydrolysis and acidogenesis) to generate H2, while in anaerobic AD, the goal is to create BG that can be subsequently refined into bio-CH4. The primary distinctions between them lie in their operational parameters. To generate H2 in an anaerobic setting, it is necessary to inhibit methanogens (H2 users). Extracellular hydrolytic enzymes assist in breaking down complex organic molecules that are not directly consumable by bacteria into soluble monomers like monosaccharides, amino acids, and other basic organic components in the initial phase. Obligate anaerobes like Bacteroides, Clostridia, and various facultative bacteria perform this stage. In the hydrolysis process, the degradation rate is primarily influenced by the type of substrate. The breakdown of hemicellulose and cellulose takes place at a slower rate than protein decomposition [184]. Acidogenic fermentation bacteria convert the products of hydrolysis into short-chain organic acids like butyric acid (C3H7COOH), propanoic acid (CH3CH2COOH), and acetic acid (CH3COOH), along with alcohols, H2, and CO2 during the second stage. During this phase, simple sugars, fatty acids, and amino acids are typically converted into acetate, CO2, and H2 (70%), along with volatile fatty acids (VFAs) and alcohols (30%) [67].
DF’s effectiveness in transforming substrates into H2 is restricted by the presence of other microorganisms that consume H2 in the mixed microbial community. This includes homo-acetogens, methanogens that use H2, bacteria that reduce sulfate, bacteria that reduce nitrate, and producers of propionate, all of which decrease the overall production of H2.
There is no evidence in the literature of any risks associated with homo-acetogens impacting humans or the environment.
Methanogenic Archaea contributes to the development of periodontal disease in specific patients by acting as a hydrogen sink, allowing pathogenic secondary fermenters to grow more extensively than they would without the presence of the archaea.
Methanogens, archaea that thrive in O2-free milieus, convert bacterial fermentation byproducts into CH4 through the reduction of CO2, acetate fermentation, or the breakdown of CH3OH or methylamines. Euryarchaeota, such as Methanobrevibacter smithii, Methanobrevibacter oralis, Methanobrevibacter arbophilus, Methanobrevibacter massiliensis, Methanomassiliicoccus luminyensis, Methanosphaera stadtmanae, and Ca, are the only methanogens found in the human microbiota. Methanomethylophilus alvus and Ca. are both mentioned. M. intestinalis is a type of Methano-massiliicoccus found in the intestines. Methanogens are recently discovered harmful organisms associated with abscesses in the brain and muscles. They were involved in the imbalance of the oral microbiota, as well as periodontitis and peri-implantitis [185]. They have also been linked to imbalances in the gut microbiota, which are associated with metabolic disorders such as anorexia, malnutrition, and obesity, as well as digestive tract damage like colon cancer [186]. The mistaken introduction of methanogens from the system for PF into the digestive system could lead to the progression of the mentioned illness.
CH4, the main result of carbohydrate fermentation by methanogens, has traditionally been believed to induce no harm in humans other than causing bloating. Yet, recent findings have associated the production of CH4 with the development of constipation and irritable bowel syndrome (IBS), as well as obesity [187].
Sulfate-reducing bacteria use sulfate for respiration instead of O2 in anaerobic conditions. The toxic H2S from sulfate-reducing bacteria has a significant impact on gut health by harming intestinal epithelial cells and causing DNA damage in human cells [188].
They are found naturally in O2-deprived marine and fresh H2O milieus and can generate hydrogen sulfide gas, which is harmful to humans and animals. SRB can cause corrosion of metals through the release of acidic compounds like H2SO4 [189].
Sulfate-reducing bacteria typically inhabit the human gut and play a role in inflammatory bowel diseases and colorectal cancers [190].
No dangers have been discovered in the literature concerning the effects of nitrate-reducing bacteria on humans or the environment.
The elevated levels of propionate may be attributed to the Bacteroidetes group, which are the primary producers of propionate in the human intestinal tract. In older adults, there is an increased presence of the Bacteroidetes phylum [191].
Propionate has the potential to function as a “metabolic disruptor”, which could elevate the chances of diabetes and obesity in humans. One of the primary focuses of the research was propionate, a short-chain fatty acid found in nature that aids in preventing the growth of mold on food products [192].
DF also generates waste streams containing high levels of volatile fatty acids (VFAs), which require costly treatment prior to being released [163].
Among biological methods for H2 extraction from biomass, DF is the most comprehensively understood and promising [193,194]. Though its yields are relatively low (up to 4 mol-H2/mol-glucose and 6 mol-H2/mol-sucrose), DF requires straightforward reactor designs, which makes it attractive for hydrogen production. Additionally, extensive studies have been conducted to enhance H2 production efficiency with hybrid systems involving DF, including microbial electrolysis cells (MECs), PF, anaerobic digester, and DF combined with a cell-free enzymatic system [195].
The DF process can be utilized to directly transform biomass-derived resources into H2 through either a one-stage or two-stage method. The most straightforward method is the one-stage AD process, which permits all stages (hydrolysis, acidogenesis, and acetogenesis) to occur within a single reactor. The hardest part of this approach is preserving the microbial balance throughout the entire process. The two groups of organisms vary considerably concerning physiology, nutritional needs, growth rates, and vulnerability to environmental influences, as previously noted [196]. A multistage process utilizes two or more reactors for digestion to distinguish the hydrolysis/acidogenesis and acetogenesis phases. Acidogenic bacteria produce organic acids and multiply faster than methanogenic bacteria. The multistage approach is implemented to enhance every phase of digestion, leading to more stable operations, a greater organic loading capacity, and heightened resistance to toxic substances and inhibitory compounds [197,198,199]. Consequently, in comparison to a single-stage method, this approach requires a higher initial investment and continuous operating costs.
The DF pathway can occur at temperatures between 26 and 40 °C, as in several studies presented in Table 3, or in hyper-thermophilic milieus (temperatures exceeding 70 °C). Due to the uncertain advantages of functioning outside mesophilic conditions (26–40 °C), the majority of DF operational research is conducted at approximately 35–37 °C [200]. At temperatures ranging from 29 to 70 °C, variability was noted to be greater during the decomposition of various biomasses and organic solid wastes [201]. To achieve optimal conditions during DF, researchers examined not only temperature but also various key environmental factors, including the pretreatment, pH, hydraulic retention time (HRT), organic loading rate (OLR), biomass composition, partial pressure, and type of reactor. On a broader level, the choice of raw materials is just as important. Due to their biodegradable substrates, the DF process emphasizes carbon sources that include monosaccharides, like glucose, and disaccharides, such as lactose or sucrose [67].
Numerous studies have highlighted the utilization of biomass and organic solid waste for H2 production. Nowadays, further investigation is required to identify the optimal reactor design, enhancements for microbial immobilization, innovative microbial strains, reductions in inhibitory effects, and a comprehensive fermentation process that might effectively convert biomass into H2 [202].
DF is in the developing stage and is characterized by a cost of 18.7 USD/kg. PF has drawbacks such as a low H2 yield and the necessity of a large reactor. The remedy for them is the requirement for solid-state anaerobic digestion (SS-AD), a cell-free enzymatic system, a microbial electrolysis cell, and an anaerobic digester. The process efficiency is in the range of 60–80% [177,178].
Table 3 displays details about the hazards associated with DF.
Kim et al. [203] achieved a cumulative H2 yield of 0.9 (mol H2/mol substrate) in a fermentation process utilizing sludge from an anaerobic digester of a waste-H2O treatment plant as an inoculum and food waste as a substrate at 35 °C, pH 5.3, and HRT 36 h (Table 2).
Likewise, Kumar et al. [204] achieved a cumulative H2 yield of 0.259 (mol H2/mol substrate) using Escherichia coli XL1-Blue/Enterobacter cloacae DSM 16657 as an inoculum and beverage waste H2O as a substrate at 37 °C and pH 6.5 (Table 2).
In a study by Yang et al. [205], a fermentative consortium MC 1 (composed mainly of Firmicutes and Bacteroidota phyla) was used as an inoculum along with food waste containing Fe-modified biochar as a substrate. The cumulative H2 yield achieved was 74.9 (mL H2/g vs) at 55 °C and pH 7.0. The ratio of inoculation was 10% by volume (Table 2).
Zhao et al. [206] achieved a cumulative H2 yield of 82.4 (mL H2/g TS) using activated sludge from a waste-H2O treatment plant and corn stover with thermally modified maifanite as a substrate at 35 °C (Table 2).
Likewise, Chantawan et al. [207] achieved a cumulative H2 yield of 225.2 (mL H2/g vs) by utilizing anaerobic granules from a waste-H2O treatment plant’s digester as an inoculum and cassava processing wastes (cassava pulp and cassava processing waste H2O) as a substrate. The experiment was conducted at 35 °C, pH 6.0, and an HRT of 132 h (Table 2).
During their study, Kazemi et al. [208] achieved a cumulative H2 yield of 82.4 (mL H2/g TS) by using anaerobically digested sludge from a primary anaerobic digester as an inoculum and pruning wastes with food-rich MSW as a substrate. This was carried out at a temperature of 37 °C, pH levels of 5.0 and 7.0, and an HRT of 72 h (Table 2).
Likewise, Ban et al. [209] obtained a cumulative H2 yield of 101.8 (mL H2/g VS) by utilizing granular sludge from an upflow anaerobic sludge blanket that treated papermaking waste H2O as the inoculum and by using corn straw alongside excess sludge as the substrate, all at a temperature of 35 °C, a pH of 7.0, and an HRT of 17 days (Table 2).
In a subsequent study, Hussien et al. [210] achieved a cumulative H2 yield of 275.6 (mL H2/g vs) by utilizing anaerobic sludge from a digester and swine manure mixed with food waste as substrates under conditions of 35 °C, pH 5.5, and an HRT of 4 days (Table 2).
The dangers associated with using PF for extracting H2 from biomass are greater and more intricate compared to PF. Their reliance is influenced by the type of inoculum and substrate, as well as their level of interaction with the fermentation conditions.
Plant stalks, farming waste, and cheese waste are examples of substrates containing starch and cellulose that can be used to facilitate both DF and PF processes. Yet, their intricate composition prevents them from being directly used as substrates, so various technologies must be used to pretreat them before extracting fermentable sugars [211].
Table 3. Hazards related to fermentation types applied for H2 extraction from biomass during diverse studies.
Fermentation TypeInoculum/Substrate/
Operating Conditions
Information of HazardsRefs.
PFC. butyricum and R. palustris;
Rice straw;
T: 30 °C; pH 7.0; LI: 6000 lux
C. butyricum—The presence of Clostridium bacteria in food products threatens human health and life. There are many poisonings and deaths due to the ingestion of Clostridium spp. toxins.
The mitigation of hazards comprises the following measures:
Regularly clean areas that may be contaminated with C. difficile.
Wear protective clothing and gloves when it is essential to have direct skin contact with infected materials or animals.
Eye protection should be worn when there is a recognized or possible risk of splash exposure.
Any procedures that could generate aerosols or that entail high concentrations or substantial volumes must be performed within a biological safety cabinet (BSC). The use of needles, syringes, and other sharp instruments must be highly restricted. Extra measures should be considered when dealing with animals or large-scale operations.
[212,213]
Some rare strains of Clostridium butyricum comprise the gene encoding the botulinal type E neurotoxin and promote hazards in certain types of food. The control of toxigenic C. butyricum in the food industry needs to allow for the great pH tolerance of this species.
Clostridium butyricum—German TRBA Risk group: 2. (Agents that are associated with human disease that is rarely serious and for which preventive or therapeutic interventions are often available. They pose a medium risk to a person but a minimal risk to the community.)
[214]
R. palustris’s metabolic effectiveness and growth rate are truly low. Very few genetic manipulation tools are achievable for R. palustris to raise its performance.[215]
Rice straw—Besides inducing air pollution, burning paddy straw leads to the loss of soil organic matter and essential nutrients, lowers microbial activities, and makes the land more vulnerable to soil erosion.
Mitigation of hazards: Avoid burning paddy straw.
[216]
Post-harvest straw is often burned, releasing several pollutants into the environment. CO2 dominates at 70%, accompanied by CH4 at 0.66%, CO at 7%, and N2O at 2.09%.
Mitigation of hazards: Avoid burning post-harvest straw.
[217]
Rhodopseudomonas palustris—German TRBA Risk group: 1. (Agents that are not associated with disease in healthy adult humans. This group has a record of animal viral etiologic agents in common use. They represent no or little risk to an individual and no or little risk to the community).[218]
R. pseudopalustris DSM 123;
Tequila vinasses;
T: 30 °C; pH 7.0; LI: LED lamp (13.5 W/m2); Inoculum: 3.3 g/L cell suspension
Rhodopseudomonas pseudopalustris (DSM 123)—German TRBA Risk group: 1.[215]
Tequila vinasses pose a significant threat to surface aquatic ecosystems when discharged without proper treatment or with insufficient treatment. The disposal of highly concentrated Tequila vinasses poses an ecological risk.
Mitigation of hazards: Utilizing AD methods to decrease organic material while generating BG.
[219,220,221]
Improperly disposing of untreated Tequila vinasses (TVs) can result in significant environmental harm to soil and H2O sources and the production of elevated levels of GHG emissions. Using TV for field fertilization may not always be effective since not all the nutrients (N, P, K) on TV are readily available for crops.
Mitigation of hazards: TV adjustment to crop parameters.
[222]
HAU-M1 (R. sphaeroides (9%), R. palustris (28%), R. rubrum (27%), R. capsulata (25%) and R. capsulatus (11%);
Corn stover;
The 1st study: pH 7.0; LI: 3000 lux; Inoculum: 30% 150 mg/g TS; TiO2/AC fiber addition of 100 mg/L.
The 2nd study: T: 30 °C; pH 7.0; LI: 3000 lux; Substrate concentration: 25 gDM/L.
Rhodobacter sphaeroides, Rhodopseudomonas palustris, Rhodospirillum rubrum, and Rhodopseudomonas capsulata—German TRBA Risk group: 1.[215]
Corn straw roots can easily absorb Cu and Zn in the soil, which can be harmful to human health, especially to children. The levels of heavy metals in soil and flue gas from burning corn straw have reached a very high ecological risk.
The mitigation of hazards comprises the following measures:
  • Systematic control of samples of corn straw roots.
  • Avoid burning corn straw.
[223]
When crop straw is added to PAH-contaminated agricultural soils, particularly corn straw, the accumulation of polycyclic aromatic hydrocarbons (PAHs) in winter wheat, as well as the ecological and human health risks, seems to decrease due to increased PAH dissipation in the rhizosphere soil.[224]
R. sphaeroides NCIMB8253;
Combination of palm oil (25%, v/v), pulp and paper (75%, v/v) mill effluents;
T: 30 °C; LI: 7000 lux; Combined substrate (25 vol.% POME and 75 vol.% PPME).
Rhodobacter sphaeroides—German TRBA Risk group: 1.[215]
Inhaling palm oil could be dangerous. It can cause irritation of the respiratory tract and skin. Absorbing it via the skin could be dangerous.
The mitigation of hazards comprises the following measures:
  • Relocate to an open area if vapors or decomposition products are accidentally inhaled.
  • In case of skin contact, rinse thoroughly with soap and abundant H2O.
  • In case of eye contact, rinse the eyes with a specialized eyewash solution.
  • The consumption of safe vegetable oil is non-harmful.
  • Make sure there is sufficient dry storage space with good ventilation, maintained between 10 and 50 degrees C.
  • Address any spills right away. Avoid open flames, hot surfaces, and ignition sources.
[225]
Palm oil contains high levels of saturated fat, which can increase LDL cholesterol levels and increase the likelihood of developing heart disease. The oil may be associated with inflammation, specific cancer risks, and type 2 diabetes. It is damaging to the environment. The sector has a record of unsustainable farming methods, is known for unjust labor practices, and has led to extensive deforestation.[226]
Palm oil, often grown on plantations after rainforests are flattened and burned, is environmentally destructive. Following some initial advances, the reemergence of deforestation linked to palm oil production in Indonesia is evident once more.[227]
The pulp and paper industry uses a significant quantity of energy and releases pollutants and GHGs into the atmosphere. The waste produced by the pulp and paper industry causes significant damage to aquatic life, disrupts the food chain, and leads to various health issues. This garbage creates significant issues for both H2O- and land-dwelling creatures. Health risks associated with waste H2O range from skin irritation to genetic abnormalities. Toxic substances in waste H2O demonstrate mutagenic and genotoxic effects.
Mitigation of hazards: The waste from the pulp and paper industry must be directed (under strict control) to appropriate treatment plants.
[228]
DFSludge from an anaerobic digester of a waste-H2O treatment plant;
Food waste;
T: 35 °C; pH 5.3; HRT: 36 h
Toxic substances in the AD system, whether from influent waste streams or bacterial metabolism, can hinder the digestion process.
Mitigation of hazards: Systematic control of sources of consumed substances.
[229]
Wasted food releases damaging gases like CO2, H2S, CH4, N2O, and PM2.5, which are harmful to human health.
Mitigating hazards: Provide necessary ventilation for the zone with people present.
[230]
E. Coli XL1-Blue/Enterobacter cloacae DSM 16657;
Beverage waste H2O;
T: 37 °C; pH 6.5
E. coli XL-1-Blue—no known hazards.
Enterobacter cloacae—There is a risk to immunocompromised patients when in direct or indirect contact with contaminated persons/objects. Pathogens can be transmitted via contaminated infusion solutions or blood products.
Mitigation of hazards: Avoid contact with contaminated people. Use proper protective clothing, gloves, masks, and glasses.
[231]
Enterob. cl.—a biosafety level 1 organism in the USA/level 2 in Canada.[232]
Enterobacter infections are serious ones with a high mortality rate, even with appropriate treatment. Enterobacter species induce many nosocomial infections and, less frequently, community-acquired infections, including urinary tract infections (UTIs), respiratory infections, soft tissue infections, osteomyelitis, and endocarditis, among many others.[233]
Waste H2O in the beverage industry contains raw materials used in beverage fabrication, such as diverse sugars, ethanol, fruit concentrates, malts, hops, syrups, acids, and mineral salts. Due to the raw materials used in beverages, the concentration of organic matter is high in the waste H2O.
Mitigation of hazards: Waste H2O from the beverage industry must be directed (under strict control) to appropriate treatment plants.
[234]
Fermentative consortium MC 1 (Firmicutes and Bacteroidota phyla);
Food waste + Fe-modified biochar;
T: 55 °C; pH 7.0; Inoculation ratio: 10 vol.%
Firmicutes—A higher ratio of Firmicutes is tied to Type 1 and Type 2 diabetes, heart disease, certain cancers, Alzheimer’s, and obesity.[235]
Firmicutes and Bacteroidetes can influence diseases related to obesity, which are also risk factors for breast cancer.
It may be necessary to adopt an appropriate diet and change your lifestyle habits toward being more active.
[236]
Unsafe waste can contaminate the soil, H2O, and air, disrupting ecosystems and harming wildlife.
The mitigation of hazards comprises the following measures:
  • Limit unsafe waste production.
  • Store such waste only in designated zones.
[237]
Human exposure to unsafe waste can lead to acute or chronic health issues, ranging from respiratory problems to cancer.
Mitigation of hazards: Avoid contact with unsafe waste.
[238]
Food waste—1/3 of all human-caused GHG emissions and 8% of GHG annually, a significant waste of fresh H2O and ground H2O resources. Emissions from food waste, like H2S, CH4, and volatile organic carbons, can affect human endocrine, respiratory, nervous, and olfactory systems.
The mitigation of hazards comprises the following measures:
  • Avoid food waste.
  • Provide enough ventilation in zones with people present.
[230]
Fe-modified biochar feedstock and temperature mainly affect biochar (BC) contamination and toxicity. PAHs, heavy metals, pH, and EC affect BC toxicity.
Mitigation of hazards: Systematic control of biochar parameters.
[239]
Biochar is a flammable material (H228). After inhalation (H333) or swallowing (H305), it may be harmful. It induces eye irritation (H320). If heated, it may induce a fire (H242).
Excessive C dust from handling biochar may produce allergenic responses in a few sensitive individuals. Overexposure to biochar dust may cause skin/eye and upper respiratory tract irritation, allergenic responses, and asthma.
The mitigation of hazards comprises the following measures:
  • Avoid heat/sparks/open flames/hot surfaces and do not smoke (P210).
  • Refrain from inhaling dust (P261).
  • Utilize personal protective gear as needed (P281).
  • Do not keep the material under conditions with moisture levels under 10% or at temperatures exceeding 400 °C.
  • Suitable personal protective gear should be used to reduce irritation caused by dust.
[240]
The production of Pinus patula raw biochar—the source of energy utilized during this process—accompanied by the generation of gases and polycyclic aromatic hydrocarbons. For Fe-modified biochar, the potential environmental effects differed only in the stage of biomass modification with the metal. They depend on the extraction of Fe and the generation of waste H2O.[241]
Sludge from waste-H2O treatment facility;
Corn stover+ therm.-modified maifanite;
T: 35 °C
Corn stover—as mentioned
Thermally modified maifanite—no hazards found.
The MicroStart waste-H2O bacterial inoculum is harmful if swallowed. It can induce harm if it contacts the skin or is breathed in. It may induce eye irritation.
The mitigation of hazards comprises the following measures:
  • Use gloves for protection/clothing for protection/eye safety/face safety.
  • If ingested, provide plenty of H2O to dilute. Seek medical advice without delay.
  • If on the skin or clothes, promptly rinse the skin with H2O. If discomfort continues, consult a healthcare professional.
  • If in the eyes, promptly rinse them thoroughly with H2O for a minimum of 15 min. If discomfort continues, consult a medical professional.
  • Avoid extreme temperatures. Steer clear of potent acids and alkaline substances. Steer clear of carbon and nitrogen oxides.
  • Disposal must adhere to federal, state, and local regulations.
[242]
Anaerobic granules from an anaerobic digester of a waste-H2O treatment plant;
Cassava pulp and processing waste H2O;
T: 35 °C; pH 6.0; HRT: 132 h
Organoarsenic feed additives (roxarsone) induce organoarsenicals in livestock waste H2O and anaerobic waste-H2O treatment systems.[243]
AD—as mentioned.
Cassava production worsens soil fertility via crop removal of nutrients, a more serious and long-term effect on environmental erosion.
Mitigation of hazards: Limit areas for cassava production.
[244]
Cassava leaves contain toxins from cyanogenic glucosides (which may cause cyanide poisoning, resulting in signs like headaches, nausea, dizziness, diarrhea, vomiting, and potentially fatal outcomes) as well as antinutritional components (such as high fiber, tannins, polyphenols, and phytic acid) that lower the absorption and digestion of nutrients.
Mitigation of hazards: Avoid eating improperly prepared Cassava leaves.
[245]
Improperly cooked Cassava may have substances that change into cyanide in the body. This could induce cyanide poisoning and result in specific paralysis conditions. Some individuals may experience an allergic response to cassava.
Mitigation of hazards: Follow good Cassava cooking practices.
[245]
Sludge from primary anaerobic digester;
Pruning wastes + food-rich MSW;
T: 37 °C; pH 5.0 and 7.0; HRT: 72 h
AD—as mentioned.
Burning waste from tree pruning outdoors decreases air quality and adds to the greenhouse effect.
Mitigating hazards: Avoid burning waste from tree pruning.
[246]
Food waste—as mentioned
Sludge from upflow anaerobic sludge blanket treating papermaking waste H2O;
Corn straw + excess sludge;
T: 35 °C; pH 7.0; HRT: 17 days
Toxic pollutants in papermaking waste H2O have carcinogenic, genotoxic, and mutagenic effects. Gaseous compounds are toxic to human health and the environment.
The mitigation of hazards comprises the following measures:
Waste H2O from the paper industry must be directed (under strict control) to appropriate treatment plants.
Provide enough ventilation for zones with people present.
[247]
Corn straw—as mentioned.
Anaerobic sludge—A problem with AD occurs since the feedstock may contain heavy metals or persistent organic pollutants (POPs). Heavy metals cannot be destroyed by digestion.
The mitigation of hazards comprises the following measures:
Systematic control of AD parameters.
Limit its contact with people. Proper personal protective gear should be used.
[248]
Anaerobic sludge from an anaerobic digester;
Swine manure + food waste;
T: 35 °C; pH: 5.5–6; HRT: 4 days
AD—as mentioned.
The concentration of Cu in swine manure exceeded the Cu limit; likewise, the concentration of Zn in swine manure exceeded the Zn limit. All livestock manure showed elevated levels of Zn, Cu, and Cr, suggesting possible ecological hazards. Swine manure exhibits the maximum potential ecological risk for agronomic application. Swine manure poses a non-carcinogenic risk to kids and an unacceptable carcinogenic risk to kids.
The mitigation of hazards comprises the following measures:
  • Swine manure should be stored only in determined zones.
  • Limit its contact with people. Proper personal protective gear should be used.
  • The swine manure content must be controlled before its application to the soil.
[249]
Food waste—as mentioned.
Abbreviations: Volatile solids (VSs), dry matter (DM), Total Solids (TSs), Palm Oil Mill Effluent (POME), Pulp and Paper Mill Effluent (PPME), hydraulic retention time (HRT).
No matrices of risks related to any solutions for hydrogen extraction from biomass using the dark fermentation process were found in the literature. Nevertheless, Lubentsov et al. [250] presented the choices and rationale for priority control tasks employed in the automation of biogas plants (BPs), considering the risk of losing control. The various kinds of technological risks involved in managing fermentation processes in methane tanks were examined, resembling DF utilized for H2 extraction from biomass. The authors performed a well-supported examination of quantitative risk evaluations by employing the pairwise comparison technique. Utilizing the expert opinion consistency method within an algorithm for addressing the selection and justification problem enabled a thorough analysis of the coherence of expert opinions and helped establish whether the resulting estimates were random. Utilizing the acquired data models for the anaerobic fermentation process parameters, the rationale for creating an improved control system for optimal substrate heating temperature, temperature regulation within the methane tank, and efficient timing for the conclusion of the fermentation process was established.
H2 yields in PF and DF depend on the inoculum, temperature, pH, and substrate type and concentration [39]. Such effects are presented in Table 4.
Table 4. Effects of the main parameters on H2 yield in PF and DF.
Parameters Effect on H2 Yield in PF and DF Refs.
InoculumIn PF, incorporating purple non-S bacteria such as Rhodobacter sp. and increased light intensity can boost H2 production, while using mixed strains can further enhance the yield.
In DF, H2 production relies on the use of strict (e.g., Clostridium sp.) or facultative anaerobic bacteria and can be improved through methods like immobilization and the addition of metal ions or oxide nanoparticles (NPs).
[155]
TemperatureThe fermentative bacterial community generates H2 across a broad temperature spectrum, with mesophilic (35–40 °C) and thermophilic (50–60 °C) conditions frequently utilized due to their effects on pH and VFA generation.[251]
pHIn PF, an acidic pH promotes H2 production, while in DF, a nearly neutral pH is more effective for H2 generation. Raising the pH might improve the capacity of H2-generating bacteria; nonetheless, elevated pH levels could lower H2 production.[252,253]
Type of substrateThe selection of the substrate is based on factors like expense, accessibility, carbohydrate levels, and ease of fermentation. Although glucose is widely used, solid waste and industrial waste H2O present attractive options for economic and sustainability factors, with little pretreatment, affecting the best substrate choice for H2 generation.[254]
Substrate concentrationOptimal H2 production is positively associated with the substrate concentration, ensuring adequate nutrition for photosynthetic bacteria to sustain H2 production.[175]
In PF, a high substrate concentration can greatly elevate butyric acid levels, which reduces the pH and halts H2 production.[255]
Research conducted by Salma Aathika and the team also confirms that the appropriate selection of process parameters allows for an increase in H2 yield. The optimization of the waste mixing ratio, pH, and temperature resulted in a 92.3% reduction in volatile solids, while the H2 yield itself increased eightfold [256].

4.1.4. Integrated Systems (ISs)

DF exhibits a high H2 generation rate but a low yield, whereas PF and microbial electrolysis cell technology have a slower generation rate but a higher yield. Hence, it is recommended to incorporate varied technologies [257].
Combining DF and PF processes enhances efficiency and sustainability in H2 production. This integration can be accomplished in one step by co-cultivating H2-producing bacteria in DF with photosynthetic bacteria in PF or in two steps by using the DF effluent as a substrate for the PF process, raising renewable-H2 generation. Because the single-step process has low yields, the two-step process is preferable. In the second system, in the first step, glucose is broken down by DF bacteria to produce H2 and CH3COOH acetic acid as intermediate products (Formula (7)), which are then transformed to H2 by PF bacteria in step II (Formula (9)) [89].
2 C 2 H 4 O 2 + 4 H 2 O L i g h t 8 H 2 + 4 C O 2
Theoretically, in pure DF with glucose as the substrate, it is possible to achieve a H2 yield of up to 12 mol H2/mol substrate, with CH3COOH being the main metabolite [163]. Nevertheless, tweaking the concentration, composition, and pH of the effluent produced during DF, as well as the selection of PF bacteria, is crucial for achieving maximum generation efficiency. A two-stage bioreactor with integrated DF and PF systems is shown in Figure 6.
To summarize the pros and cons of the biological method used for H2 extraction from biomass (Table 5—based on [39]), it can be noted that DbP exhibits excellent energy efficiency, achieving as much as 12.2% in green algae [258]. In comparison, DbP usually exceeds i-DbP (maximum efficiency 4.1%), PF (maximum efficiency 8.5%), and DF (maximum efficiency 12.0%) [182,258]. Although DbP is efficient, the O2 generated during PSII significantly inhibits hydrogenases, subsequently decreasing H2 [259]. Mitigation methods like inert gas purging, O2 production inhibitors (e.g., Cu), and S scarcity have been investigated [260,261].
i-DbP provides benefits including renewability, sustainability, scalability, and the ability to integrate with current infrastructure. Nonetheless, it faces issues with low efficacy, the restricted availability of catalysts, sensitivity to the environment, and technological hurdles, requiring additional research and development for enhanced performance and cost-effectiveness [81,262,263].
DF is a recognized technique for producing renewable H2, utilizing various substrate sources and functioning continuously without light. It guarantees consistent and dependable hydrogen generation at a reduced price [264]. However, its effectiveness in transforming substrates into H2 is restricted by competition from H2-utilizing microorganisms in the mixed microflora. These consist of homo-acetogens, hydrogenotrophic methanogens, sulfate-reducing bacteria, nitrate-reducing bacteria, and propionate producers, which lower overall H2 production. Additionally, DF produces effluents high in volatile fatty acids (VFAs), requiring expensive treatment prior to release [163]. Incorporating other biological techniques such as PF presents possible ways to improve total hydrogen production and address effluent issues. In this regard, integrated systems that incorporate DF and PF demonstrate promise for enhancing H2 production via synergistic interactions [158]. Nevertheless, additional research and technological progress are essential to improve their efficiency and scalability, given that deploying integrated systems can be costly and demand specialized infrastructure, which are major drawbacks [161].
Additionally, Ghasemi et al. [32] noticed that certain studies have utilized microbes to aid in the biological transformation of biomass, primarily through dark fermentation methods. The primary advantages are discovered in situations of moderate use. The slow conversion rate and low production volumes of these technologies are the main constraints hindering progress. The capital expenses of these systems are elevated due to the requirement for expensive bioreactors and separation methods. Pretreatments are necessary for biomass that resists treatment, as this leads to the production of inhibitors and reduced operational and capital expenses. The primary objectives of future developments should be the development of new bacterial strains, improved bioreactors, and localized small-scale production facilities. Economic limitations to PF consist of higher yields accompanied by elevated energy expenses. To address these challenges, metabolic engineering can allow for considerable progress in the bio-H2 process. The effects of nutrient limitations and substrate utilization were examined to recognize genes in microalgae that enhance H2 production. The design of photobioreactors needs to be optimal. The inhibitory substances present during pretreatment create a significant barrier, representing one of the main technical challenges of integrated DF and PF. The substrate restricts either or both of the processes. The elevated feedstock expenses, the processing costs caused by the toxicity of waste-H2O treatment byproducts, the operation and upkeep of the sequential reactor, and the operational costs incurred during the pretreatment of DF effluent constitute further economic obstacles to this approach.

4.1.5. Projects Focused on Biological Technologies

The composition and attributes of biomass are influenced by various feedstocks that have different levels of carbohydrates, lipids, proteins, and lignocellulosic substances, with each necessitating particular pretreatment and conversion techniques. The first steps consist of deconstructing intricate biomass into basic sugars, which are subsequently fermented to produce hydrogen. Various factors, including substrate levels, microbial metabolism, and enzyme activity, can influence the effectiveness and rate of these processes [265].
Choosing microorganisms like bacteria and archaea is essential. Some microbes possess the natural capability to generate hydrogen from biomass, whereas others might require genetic alterations or co-culturing with different organisms. Thermophilic species flourish at elevated temperatures, whereas mesophilic species favor temperate conditions [266]. The pH level of the medium influences microbial activity and product yield, as various microbes thrive in specific pH ranges [265].
The design of the bioreactor, which encompasses a continuous stirred-tank reactor or an anaerobic baffled reactor, and its operational parameters, like gas removal, mixing, and retention time, are essential elements that influence the scalability and effectiveness of biomanufacturing procedures [265].
Utilizing the microalga Chlorella sp., H2 was generated by Giang et al. [267] via DF and anaerobic solid-state fermentation. The result was 16.2 mL/g of volatile solid (VS, or total organic material in the biomass). Pre-hydrolysis combined with simultaneous saccharification and fermentation enabled the attainment of up to 172 mL/g VS in production and 2.4 mL/g VS·h in productivity. Additionally, Wang and Yin [268] reported H2 production from various forms of biomass microalgae. The pretreatment enhanced the yield (reaching 958 mL H2/g VS from Chlorella sp. with heat pretreatment using HCl) through the disruption of the microalgal cells. Nevertheless, as the procedures have not reached the industrial scale, additional research is needed to enhance their feasibility.
Multiple strategies can improve this process, such as refining pretreatment methods, expanding operations, incorporating cutting-edge technologies, etc. A possible solution is to collaborate with different organizations that can support commercialization. The goal is to enhance productivity and hydrogen output while minimizing environmental effects. Whereas other studies focused exclusively on crop residues, Kumar et al. [269] assessed the production of hydrogen from various biomass types (lignocellulosic, waste H2O, and algae) through the dark fermentation process. The research evaluated different pretreatments for lignocellulosic biomass, such as alkali pretreatment to isolate lignin and generate fermentable sugars through enzymatic hydrolysis using cellulase and xylanase. The highest yield was achieved under slightly acidic conditions (pH 4.8, 0.2% HCl) utilizing 176 mL H2/g of cornstalk with cellulase.
Integrating various pretreatment techniques and focusing on affordable enzymes will enhance efficiency and address the expensive components of this process [265].
In a study, the C/N ratio, phosphate concentration, and substrate concentration for photo-fermentation (PF) were modified to develop a one-step approach that employs Rhodobacter sphaeroides to produce hydrogen from straw biomass. Initially, the biomass underwent hydrolysis in an acidic condition for 30 min at 118 °C using 5% HCl. Two Rhodobacter sphaeroides strains, HYO1 (wild type) and WHO4 (mutant), transformed the hydrolyzates in a balanced environment. Thanks to pH stabilization, they achieved a higher yield (for the WHO4 strain, the reducing sugar was 4.62 mol/mol) compared to what they could have obtained with direct sugar PF [270,271,272]. This streamlines the standard multistep procedure, thereby lowering expenses, intricacy, and material consumption. Nonetheless, options other than HCl can be investigated to enhance environmental sustainability and further reduce costs related to the acid for hydrolysis when considering scaling up for industrial applications [265].
As mentioned above, an essential aspect of DF is the selection of substrates. Substrates rich in starch and cellulose facilitate the progress of this process. A surprising yet promising substrate with potential for use in DF is waste from the leather tanning process—shaving waste. Shaving wastes are produced during the shaving process of the flesh side of preliminarily tanned leather to reduce its thickness. They appear as small shavings, as shown in Figure 7. This previously underutilized waste material presents a potential source of bio-H2 in the DF process.
The installation for studying the DF process of tannery waste at a laboratory scale is a specially designed setup that allows for continuous gas production measurement and maintains stable temperature conditions. The schematic of this setup and its actual version are given in Figure 8.
Additionally, the DF process was intensified by the mixing process. The PF process was conducted at a temperature of 50 °C and a pH of 5.0. The mixing was carried out using a magnetic stirrer and manual mixing. Magnetic stirring was performed for 1.5 h per day, and manual mixing was performed twice for 5 min each per day. Mixing improves the homogeneity of milieu conditions and improves contact between microorganisms and the substrate. Preliminary results from the DF of chromium shaving waste with glucose addition clearly indicate that the mixing process can increase the H2 yield several times. Figure 9 shows a comparison of the total H2 yield in DF with and without mixing. The data indicate that, in the case of mixing, 5.81 cm3 of H2 was produced per 1 g of dry matter (DM) of the substrate, while in the process without mixing, only 1.112 cm3 of H2 per 1 g of DM was produced. The H2 concentration in BG is also more than twice as high for the DF process with mixing compared to the process without mixing. The mixing process contributes to a longer and more stable PF process by ensuring a constant supply of nutrients to microorganisms.
The process effectiveness is also affected by the method of substrate pretreatment. The pretreatment can include grinding, granulation, or chemical or thermal treatment. In the case of grinding substrates as a pretreatment method, a mixture of chrome shaving waste and a co-substrate in the form of husks (from buckwheat, variety VI) was ground to a powder below 1 mm. The process was conducted at a temperature of 50 °C and a pH of 5.0. The results presented in Figure 10 indicate that grinding increases the H2 yield by nearly 2 cm3 per 1 g of dry matter (DM) of the substrate. Reducing the substrate to a powder form allows for a 7% increase in H2 production efficiency in terms of the total H2 yield.
The conducted research on DF using Cr shaving waste confirms the potential of utilizing new substrate sources, such as the leather industry. The proper selection of parameters and the application of additional processes allow for a multifold increase in the H2 yield.

4.2. Thermochemical Methods for H2 Extraction from Biomass and Hazards Related to It

TC methods used for H2 extraction from biomass include PY, hydrothermal (HT) processes, and GA. The GHG emission intensities of biomass combustion systems (0.25–0.30 kg CO2-eq/MJ) highly exceed those of biomass GA systems (0.02–0.14 kg CO2-eq/MJ) and of the biomass PY systems (0.012–0.1 kg CO2-eq/MJ) [273]. For the comparison, the life cycle equivalent CO2 emissions for fuels utilized for transport equal 0.073 kg CO2-eq/MJ for 100% mineral petrol, 0.075 kg CO2-eq/MJ for 100% mineral diesel, and 0.065 kg CO2-eq/MJ for LPG [274]. Inexpensive and simple biomass combustion can provide heat for the other techniques used for biomass processing; however, it is in the developing stage. Its main drawback is the generation of CO2 and CO. The remedy for this is the requirement for post-combustion separation and CO2 storage [275].
According to OSHA, CO2 is considered dangerous at levels of 5,000 ppm (0.5%) during an 8 h work shift. Levels exceeding 40,000 ppm (4%) may pose a risk to life. Indicators of excessive exposure encompass headaches, lightheadedness, breathlessness, and disorientation. Elevated levels can replace O2, resulting in a lack of atmospheric O2. In limited areas, the buildup of CO2 is significantly dangerous. Because it is denser than air, it moves along the ground and accumulates in ditches and cellars. During a release, CO2 may create a noticeable vapor cloud, elevating the chances of injuries.
Effective strategies for CO2 management involve adequate ventilation, ongoing monitoring, and prompt response protocols, greatly improving safety throughout operations. When managing CO2, it is essential to recognize its possible dangers. The management of CO2 necessitates the use of personal protective gear, including gloves, goggles, and face shields. When elevated CO2 levels can occur, workers should employ proper CO2 sensors and alarm systems [276].

4.2.1. Biomass Pyrolysis

PY resembles GA, but it can function at reduced temperatures and needs no oxidizing agent [277]. In certain situations, a small amount of an oxidizing agent may be used to improve heat generation [278]. During PY, biomass is heated in an O2-less milieu or partially combusted with a poor O2 supply, resulting in a hydrocarbon-rich gas mixture, an oil-like liquid, and a carbon-rich solid residue.
PY involves breaking down biomass into solid, liquid, and gas parts using heat in a non-reactive milieu [279]. In the PY process, the complex hydrocarbon compounds derived from biomass are transformed into simpler molecules through various reaction pathways. Initially, hemicellulose, a component of biomass, breaks down at temperatures between 220 and 315 °C, leading to the production of CH3COOH, various organic acids, sugars, and furans. Cellulose decomposition occurs between 315 and 400 °C, leading to the production of levoglucosan and other anhydrocelluloses [280].
Lignin, consisting of several aromatic rings, breaks down slowly, with decomposition occurring across a wide temperature spectrum (200–900 °C), producing various compounds, like oligomers, polysubstituted phenol monomers, H2, and CH4, as the main outputs [281].
PY can be carried out between 400 and 800 °C. Depending on the temperature, heating rate, and residence time, PY can be classified as slow, fast, or ultra-fast. Equation (10) outlines the overall pyrolysis process [282].
B i o m a s s + H e a t H 2 + C O + C O 2 + C H 4 + H 2 O + B i o o i l + C h a r
Enhancing biomass characteristics, temperature, heating rate, residence time, and catalyst usage can improve the obtaining of H2 via PY [283].
A comprehensive review of biomass PY, including conventional and advanced technologies, reactor designs, product compositions, and yields, as well techno-economic aspects, was published by [284]. Based on the character of the biomass motion in the reaction zone, PY reactor types belong to the following categories: pneumatic bed reactors, gravity, stationary beds, and mechanical reactors. In particular, the development of hybrid reactors integrating multiple PY techniques can enhance product yields while lowering operational costs.
Various advanced biomass pyrolysis technologies are still being developed, including co-pyrolysis, catalytic pyrolysis, microwave pyrolysis, hydrothermal pyrolysis, and plasma pyrolysis. Such technologies differ to varying degrees in their mechanisms, advantages, and potential applications. Very promising is the integration of catalytic and co-pyrolysis methods [284].
Scaling up pyrolysis technologies from laboratory to industrial scales requires ensuring techno-economic feasibility and adaptation to regulatory issues with large-scale operations [284].
The composition and yield of pyrolysis products are affected by the type of biomass, heating rate (HR), hot vapor residence time (HVRT), solid residence time (SRT), particle size (PS), temperature (T), and type of reactor used [284].
Slow PY (carbonization) is mainly used to produce char as the primary product (yields in a range from 30 to 40 wt.%), along with bio-oil and non-condensable gases as secondary products. It occurs at temperatures ranging from 300 °C to 900 °C, with a heating rate (HR) of less than 0.4 °C/s and an extended solid residence time (SRT) of up to 12 h. The hot vapor residence time (HVRT) can vary from 1 s in reactors with a N2 flow during pyrolysis to 7200 s when N2 is solely utilized to eliminate air from the reactor prior to PY. The particle size (PS) of biomass employed in slow pyrolysis may vary between 0.075 and 19 mm. As this PY has the greatest SRT, a substantial PS is not an issue. All forms of biomass (irrespective of moisture levels) can be utilized in slow PY [284]. Performing slow PY at temperatures lower than 450 °C results in a significant charcoal content [67].
When N2 gas is stored in a pressurized tank, it can explode when exposed to heat. N2 may replace O2 and lead to quick suffocation [285]. The solution approach is similar to that of O2.
Intermediate PY is characterized by a moderate heating rate (0.4–10 °C/s), brief heating times (0.5 to 40 s), reaction temperatures between 350 and 700 °C, and solid residence times ranging from 1.2 to 78 min. This procedure usually results in a liquid output of 40–50 wt.%, along with non-condensable gases and solid char, attaining values between those of the outcomes of slow and fast PY. The bio-oil produced via intermediate PY is notable for its lower viscosity and minimal tar content, predestinating it for immediate thermal applications. In addition, the generated char is dry and fragile, making it suitable for biofertilization and gasification. This approach likewise accommodates a diverse range of feedstocks, such as woody biomass, straws, grasses, and agricultural byproducts, without requiring significant grinding. The adaptability of intermediate PY enables the processing of larger feedstock sizes and contaminated biomass, increasing its usability [284].
H2 generation can be realized by fast or flash PY at high temperatures and appropriate residence time [286].
Fast PY enables the swift transformation of biomass into bio-oil, charcoal, and gas products. This method consists of heating the biomass to temperatures between 300 and 1400 °C at high heating rates of 10 to 1000 °C/s, with an extremely short high-velocity reaction time of 0.1 to 12 s and a solid residence time of 0.017 to 10 min. The main goal of fast pyrolysis is to enhance the production of bio-oil, which usually accounts for 50–75% by weight of the output, greatly exceeding the yields of char and gases. These yields are attained by raising the biomass to a temperature where thermal cracking takes place while reducing the exposure duration that encourages char formation. Essential factors vital for enhancing fast pyrolysis involve elevated heating rates, regulated temperatures near 500 °C, efficient char removal, and dry biomass input containing under 10 wt.% moisture. If the bio-oil has a low pH, it needs to be refined prior to use. Rapid PY is important not only for generating bio-oil but also for creating food flavors and specific chemicals [284]. According to [287], fast PY yields up to 75 wt.% bio-oil in a medium temperature range (450–600 °C), at a great heating rate (about 300 °C/min), and with a short residence time.
Flash PY enables the rapid conversion of solid organic materials into liquid or gas products. Functioning at temperatures between 300 and 1400 °C and with a swift heating rate of 1000–21,000 °C/s, biomass particles undergo a short heat pulse lasting only 0.015 to 2 s. This short exposure triggers the swift breakdown of organic macromolecules like cellulose and lignin, resulting in the release of volatile compounds that are swiftly removed from the high-temperature area and rapidly cooled to avert additional secondary reactions. The residence time for solid particles (ranging from 0.05 to 2 mm in size) is between 0.016 and 0.34 min. Difficulties in scaling flash pyrolysis involve reactor design to support extremely short residence times at high heating rates, with issues focusing on the stability and quality of bio-oil resulting from the catalytic impacts of char and ash residues. Even with these obstacles, flash pyrolysis shows potential for effective energy conversion, though it requires sophisticated technologies for refining products and eliminating pollutants, especially to address the corrosive and unstable characteristics of the resulting bio-oil [284]. A residence period (below 1 s) shorter than that of fast PY can maximize the gas output [288]. Figure 11 shows a flowchart of H2 production via biomass PY (based on [39]).
Following PY, a bio-oil resembling tar is formed by condensing oxygenated molecules (ketones, phenolic compounds, aldehydes, alcohols, and carboxylic acids), along with resulting H2O and ash. Only H2O-soluble fractions of bio-oils are suitable for H2 production, and a steam GA unit can be incorporated to enhance their yields. The generation of H2 via biomass PY is greatly influenced by the type of catalyst, process temperature, type of feedstock, and residence time [289].
The yield of H2 production is especially enhanced by an increase in pyrolysis temperature and is further boosted by a higher heating rate and extended residence time; at elevated temperatures, fast pyrolysis yields more H2 compared to slow PY [281]. Lignin is the most stable component that breaks down at elevated temperatures compared to cellulose, which decomposes between 310 and 400 °C, while hemicellulose (primarily xylan) decomposes in the 220 to 350 °C range [290]. In PY, studies on pine, cottonwood, and rice straw showed that initial H2 emissions began at 400 °C across all species, peaking between 650 and 750 °C. However, due to variations in biomass composition, rice straw exhibited a higher release rate than pine, while cottonwood had the lowest rate [290].
Solar pyrolysis can achieve extremely high temperatures reaching 2000 °C, which has been shown to enhance gas yield [291]. Additionally, research on hot radiofrequency plasma pyrolysis was able to explore a temperature range of 900–2000 °C and achieved a high productivity of syngas [291]. The complete breakdown of unstable compounds can be observed at pyrolysis temperatures exceeding 700 °C, leading to the formation of phenolic compounds [292].
Prasertcharoensuk et al. [293] noted that increasing the PY temperature from 600 to 700 °C resulted in minimal yield variations, but they did find a 23% increase in gas yield when the temperature reached 800 °C. This pattern was due to the full release of volatiles beyond the 700 °C range and their subsequent cracking and dry reforming at elevated temperatures. They typically noted an increasing trend in CO and the H2/CO ratio, while CO2 content exhibited a downward trend, which is explained by the ongoing utilization of the emitted CO2 in the Boudouard reaction occurring above 700 °C and the dry reforming of light hydrocarbons driven at temperatures over 640 °C, generating additional H2 and CO [293]. The content of H2 and CO increased from 48.8 to 67.2 mol% and 4.5 to 8.8 mol%, respectively, as the PY temperature rose from 600 to 900 °C. In general, the gas yield grew from 77.8 to 95.8 wt.%, while the solid residues and ash decreased from 16.3 to 0.4 wt.%. At every temperature, the liquids primarily contain aromatics, phenolics, and furans, which suggests that high temperatures are not adequate for their decomposition [293].
During the slow PY of sugarcane by Al Arni et al., the yield of syngas improved, with H2 notably rising from 7 to 28.8% as the temperature was elevated from 773 to 953 K, attributed to enhanced tar-cracking reactions, leading to an increase in gases at the cost of heavier hydrocarbons. Significantly, CO and CO2 gases were initially prevalent due to the simpler decomposition of hemicellulose and cellulose and then subsided past 400 °C, when the gradual breakdown of lignin commenced, leading to the release of H2 and CH4 [294].
A similar observation was noted, as H2 content rose notably from 1.13 to 16.5 vol% when the PY temperature of palm kernel cake was raised from 500 to 700 °C and from 2.03 to 20.36 vol% for cassava pulp residue [281]. A considerable rise in syngas yield was noted, from 26 to 46%, due to a temperature increase from 300 to 700 °C during the slow PY of Salsola collina Pall. A similar pattern was observed for the pyrolysis of pine wood and corn stalks [295]. Cheng et al. [296] observed a reduction in bio-oil yield and an elevation in gas yield after surpassing 600 °C during the PY of Crofton weed. The content of syngas and H2 was enhanced by elevating the temperature from 350 to 800 °C during the PY of Alcell lignin, achieving a H2 content of 31.5 mol%. A similar effect was observed with coconut shells at temperatures ranging from 500 to 900 °C, where the gas yield rose notably from 36.59 to 64.47 wt.%, and H2 levels increased from 3.56 to 15.04 vol% at 800 °C, ultimately reaching 33.49 vol% at 900 °C. In the inline PY–catalytic SR of pyrolysates from sawdust using 10 wt.% Ni/Al2O3, both gas production and H2 yield improved as the temperature increased, with peak H2 concentration occurring between 600 and 700 °C [281].
Syngas is a dangerous material that presents fire, explosion, and toxicity risks due to the physical and chemical characteristics of its components. The progression of an emergency situation involving syngas is influenced by system operating conditions, gas composition, and/or the onset of ignition [297].
The buildup of adequate levels of syngas can present a fire or explosion hazard when there is an ignition source and enough O2. This can happen in confined areas like dryers, dryer cyclones, combustion chambers, ducts, or pipes. The buildup of ample quantities of syngas may present a fire or explosion hazard if an ignition source and enough O2 are present. This can happen in confined areas like dryers, dryer cyclones, combustion chambers, ducts, or pipes [298].
Dangerous areas emerge around a compromised synthesis gas pipeline. The dimensions of the zones depend on the gas composition and are typically much smaller when there is a release of syngas produced from biomass gasification. It also depends on the extent of damage to the pipeline. The generated hazard zone is largest if the pipeline is fully ruptured [299].
Syngas possesses 50% of the energy density found in NG. It cannot be ignited directly yet serves as a source of fuel. Another application is as a precursor for manufacturing additional chemicals. The creation of syngas for use as a feedstock in fuel production is achieved through the gasification of coal or urban waste. In these processes, carbon interacts with H2O or O2 to produce carbon dioxide, carbon monoxide, and hydrogen. The safety requirements for syngas involve a mix of safety procedures for H2 and CO, as both are found in considerable amounts [300].
Typically, the heating rate determines the PY classification and influences the output of all products, which can be particularly important for the yield of gases. With a high heating rate, the gas yield would rise at the cost of oil and char yields due to the quicker depolymerization of complex structures into primary volatile matter and vapors, which undergo secondary cracking and decomposition at such elevated heating rates. Conversely, a reduced heating rate would hinder dehydrogenation and secondary reactions, resulting in increased oil and char production. Nonetheless, certain studies indicated that a limited range of heating rates analyzed, between 5 and 20 °C/min, had a minimal impact on gas yield, whereas a higher rate exceeding 30 °C/min would significantly influence it. In a study on the pyrolysis of refuse-derived fuel (RDF), it was noted that the gas yield rose from 14 to 47% when the heating rate was elevated from 5 to 350 °C/min, while there was a significant drop in bio-oil from 55 to 23% and a more gradual reduction in solid content. This trend was explained by the breakdown and conversion of both oil and solid materials [281].
As reported by Safdari M-S et al. [301], it is not an absolute trend, as they observed that elevating the rate from 30 to 1000 °C/min at a steady temperature of 765 °C resulted in a decrease in char and light-gas yields, while the tar content increased by 49–60%.
Concerning the residence time, a brief PY duration is inadequate for decomposition and fails to generate sufficient heat for the reactions to occur, resulting in incomplete pyrolysis. Typically, an elevated operating temperature, combined with a rapid heating rate and adequate residence time, propels the process kinetics to achieve a greater gas yield [281].
In slow PY with an extended residence time, repolymerization occurs, resulting in char production, while facilitating the conversion of liquids/tar into a greater gas yield. In a different study examining the pyrolysis of palm oil waste without a catalyst, the total gas yield initially rose with longer residence times, peaking at approximately 14 s, then slightly declined with additional increases in residence time. Specifically, a rise in residence time resulted in an initial abrupt decrease in H2 yield, whereas further extension of the residence time resulted in an increased H2 yield. Nevertheless, excessive prolongation of the residence time results in decreased H2 output, even though extending the residence time promotes the thermal cracking of heavier hydrocarbons, which in turn boosts the gas release rate. However, this also causes some H2 to be consumed in reactions and results in the generation of other gaseous products like COx and CH4 [302].
PY–SR is a modern two-step thermochemical technique that has garnered significant interest [303]. The catalysts employed are identical to those applied in the cracking stages of GA, and they, too, become deactivated due to C buildup (coke). A catalyst regeneration stage enables the conversion of coke into CO2 via combustion, thereby clearing the active sites [304]. Global H2 production rates are comparable to those achieved via SR through GA, falling within the range of 70% to 80% [305].
Isolating the reactors in the PY–steam reforming process prevents the formation of coke deposits that could hinder the reforming catalyst [306]. The method is easy to expand and can serve as an alternative to direct GA and the reformation of bio-oil [307].
Table 6 contains details about the hazards associated with the biomass PY process.
Table 6. Hazards related to TC methods used for H2 extraction from biomass.
MethodsInformation of HazardsRefs.
PYEfficient separation and purification of end products are necessary because of high temperatures and long residence times, leading to high energy consumption.[308]
  • Plants that transform C-based substances into energy have the following hazards:
  • The risk of fire and explosion is high due to the highly flammable gases (H2 and CO) present.
  • The large amounts of CO could lead to a potentially serious toxic gas release.
  • Biochar created after PY is harmful in soil applications, contributes to GHG emissions, hinders the efficacy of pesticides, and impacts soil microorganisms. The risks come from feedstock, feedstock contamination, and PY conditions. The presence of these harmful substances in food endangers human health.
[309]
Certain biomass samples are not environmentally friendly during PY.[310]
Biomass dominated by lignin produces products dominated by char, significantly impacting two environmental categories. Cellulose-rich biomass has an impact on six other categories by generating oil-rich products. Biomass rich in hemicellulose produces gases with high levels and minimal environmental impacts.[311]
HT processesHTCProcess water (PW) with a short retention time contains toxic phenols, furfurals, and their derivatives, which enable AD to produce biogas (BG). [312]
The PW is contaminated by both organic and inorganic sources and requires treatment. The issues concerning the management of stable and toxic organic substances such as phenols, phenolic compounds, furfural, and 5-HMF remain unresolved. These compounds can sometimes be hard to break down through biological processes (having high COD-BOD5 ratios), which could create challenges in treating PW.
Mitigation of hazards: Post-PW should be directed to an appropriate sewage treatment plant.
[89]
HTL
  • The reactors, which are intricate and costly, operate at high pressures and have a high capacity for H2O management.
  • It is challenging to measure the product yields in the HT reaction.
  • It creates coke and tar.
  • The reactor becomes blocked and obstructed as a result of organic salts precipitating together.
[313]
HTGHigh levels of energy consumption and technological requirements for the process are costly.[314]
GAThe safety of startup processes is influenced by the temperature used for heating. The possibility of fire and explosion, along with the release of environmental pollutants through various routes, is a concern due to the presence of a flammable gas mixture with a high amount of H2 gas produced under high-temperature and high-pressure conditions. [315,316]
The specific dangers include the possible release of harmful gases such as CO, SOx, NOx, and particles.[317]
CO can enter the bloodstream and bind with hemoglobin to inhibit O2 absorption and circulation. Prolonged exposure to CO can lead to asthma, inflammation of the lungs, schizophrenia, and heart defects. Harmful gases such as SOx, NOx, and volatile organics can harm human respiratory, digestive, and skin systems. [318]
CO is an extremely poisonous gas. It is referred to as a toxic (blood) asphyxiant, indicating that it diminishes the blood’s ability to transport O2. Low-level doses of CO can lead to headaches and dizziness; however, if the person is taken to fresh air, no lasting harm will occur. Elevated levels, however, can saturate an individual’s blood within minutes and rapidly result in respiratory failure or demise. The existing allowable exposure limit for CO is determined by a Time-Weighted Average (TWA) of 30 ppm. Even though extremely high levels of CO can be acutely harmful, potentially causing immediate respiratory failure or death, it is the long-term health impacts from chronic exposure at lower concentrations that have the most significant effect on affected workers. Exposure levels are insufficient to cause immediate symptoms; however, frequent small doses gradually diminish the blood’s ability to carry O2 to dangerously low levels.
The mitigation of hazards comprises the following measures:
  • Be aware of the signs of CO poisoning: headaches, disorientation, tiredness, convulsions, lightheadedness or fainting, and queasiness.
  • Seek fresh air and obtain medical assistance right away if exhibiting these symptoms.
  • Set up and regularly check a battery-powered CO detector.
  • Arrange periodic maintenance inspections for the engine and exhaust system conducted by skilled and trained professionals.
  • Notice that hazardous levels of CO can build up in just seconds.
[319,320]
In elevated amounts, gaseous SOx can negatively impact trees and plants by harming leaves and inhibiting growth. SO2 and various sulfur oxides may lead to acid rain that can damage delicate ecosystems.
SO2 may lead to respiratory issues like bronchitis and can irritate your nose, throat, and lungs. It can lead to coughing, wheezing, mucus production, and asthma episodes. The impacts are more severe during physical activity. SO2 has been associated with heart disease.
The mitigation of hazards comprises the following measures:
  • Systematic control of SOx in air.
  • Use of efficient ventilation in places where people are exposed to SOx.
  • Use of respiratory protection equipment in places with increased SOx concentrations.
  • Developing plans to lower the amount of SO2 in the air.
  • Utilize techniques to reduce SOx production, including fuel purification systems and alterations in combustion processes.
  • Whenever feasible and economical, opt for dry SOx removal systems instead of wet ones.
[321,322,323]
Low concentrations of NOx in the atmosphere can irritate your eyes, nose, throat, and lungs, potentially leading to coughing and symptoms such as shortness of breath, fatigue, and nausea. Being exposed to low levels can also lead to fluid accumulation in the lungs one or two days following the exposure. Inhaling elevated amounts of nitrogen oxides may lead to quick combustion, spasms, and inflammation of the throat and upper respiratory area, decreased O2 supply to body tissues, fluid accumulation in the lungs, and death. Skin or eye contact with high levels of nitrogen oxide gases or liquid nitrogen dioxide would probably result in severe burns.
Possible reduction in hazards:
Reducing NOx and N2O emissions is a significant issue since these compounds can inflict considerable harm to the atmosphere, soil, H2O, and human health. Currently, selective catalytic reduction is the most efficient and common technology for eliminating NOx from flue gases. Additional approaches are utilized selectively, particularly those below:
  • Catalytic breakdown of NOx and N2O, where nitrogen oxides are broken down without other reactants, can be used.
  • Selective non-catalytic reduction is commonly employed when catalytic beds cannot be used or are restricted. Electron beam irradiation and electrochemical reduction represent some of the most promising emerging technologies.
[324,325]
Particle emission (PM2.5) induces cancer. Their ability to soak up various soluble organic compounds such as alkanes, carboxylic acid, and aromatic compounds can harm the lungs and livers of humans.
Short-term exposure to PM2.5 (lasting up to 24 h) is linked to early death, heart or lung issues, both acute and chronic bronchitis, asthma episodes, respiratory problems, and limited activity.
PM2.5 particles in the air can penetrate deeply into the respiratory system, reaching the lungs and leading to immediate health issues such as irritation in the eyes, nose, throat, and lungs, along with symptoms like coughing, sneezing, a runny nose, and difficulty breathing.
The mitigation of hazards comprises the following measures:
  • Ongoing enhancement of broad application and effective advancement of clean energy.
  • Enhancing the dissemination of air quality monitoring and related data.
  • Enhancing understanding of the dangers of air pollution and providing suggestions for safeguarding public health against air pollution.
  • Enhancing the health safeguards for groups at risk from ambient air pollution.
  • Crafting sensible outdoor travel plans, accurately donning masks that filter PM2.5 while outside, promptly and suitably opening windows for indoor ventilation based on air quality, and utilizing purification devices to lower indoor PM2.5 levels during periods of severe air pollution.
  • Enhancing studies on air pollutant detection technology and surveillance systems to advance precise exposure evaluation.
[326,327,328,329]
Environmental issues can arise when ashes and condensates produced from biomass gasification are not appropriately disposed of. Dealing with a toxic condensate that has a high tar content is challenging and presents greater hazards.[330]
PY comes with challenges related to separating and purifying H2 from complex gas mixtures, reducing GHG emissions, and the expensive and complicated process of large-scale H2 production [265].
The weaknesses of biomass PY involve high energy usage and the requirement for the effective separation and purification of the final products. The high energy consumption is due to the use of high temperatures and long residence times in the process [308].
Conversion facilities that turn C-containing substances, such as biomass and municipal solid waste, into a gas product and PY exhibit the following hazards:
  • Potential dangers of fire and explosion caused by the existence of extremely flammable gases (H2 and CO).
  • Dangerous release of toxic gas, with potentially severe outcomes, caused by the abundant presence of CO [309].
The characteristics of the raw materials and the resulting biochar created during various pyrolysis methods impact their chemical, physical, and structural properties. Biochar use has been associated with certain dangers when used in soil, including biochar toxicity, reducing GHG emissions, diminishing pesticide effectiveness, and impacting soil microorganisms. Possible dangers arise due to the feedstock, tainted feedstock, and pyrolysis conditions that support the formation of characteristics and functional groups of this type.
The harmful chemicals created represent a danger to human health via the food web [310].
Biomass with a high lignin content results in products dominated by char, impacting two environmental categories, while biomass rich in cellulose mostly affects six other categories while producing products dominated by oil. Samples rich in hemicellulose produce products with high gas content and gentle environmental impacts. During the PY process, not every biomass sample is environmentally friendly [311].
Ndirangu et al. [310] highlighted the importance of assessing biochar risks and examined risk evaluation concerning the PY process, feedstock, and hazard sources in biochar, along with their possible impacts and the methods employed in risk assessment.
Cordella et al. [331] performed a comprehensive experimental study to collect detailed and quantitative data regarding the composition of bio-oils produced from biomass slow PY. Comprehensive composition data were collected for the primary components and for the polycyclic aromatic hydrocarbons (PAHs) found in bio-oils from corn stalks, poplar, and switchgrass. These data were utilized to evaluate the hazard profiles of the bio-oils. Particular screening methods were created, capable of generating hazard scores for the bio-oil characteristics derived from the individual bio-oil components. Their findings indicate the following:
  • Risks to human health may be linked to long-term exposure to bio-oils.
  • Severe harmful impacts on humans and eco-toxic impacts on H2O environmental ecosystems might also occur in the event of a loss of containment.
  • A slight carcinogenic risk might arise from the existence of cancer-causing substances such as catechol and PAHs. Therefore, evaluating and managing the risks associated with bio-oils is a crucial factor to consider for ensuring the safe and sustainable utilization of products derived from biomass PY.
According to [332], bio-oil remains stable in typical ambient conditions, but it can react with strong acids or powerful oxidizing agents like chlorates, nitrates, peroxides, and others. When it comes into contact with the eyes, it can result in irritation. Frequent contact with the skin can lead to irritation. When heated, its vapors might induce nausea and irritation in the eyes and upper respiratory system.
The mitigation of hazards comprises the following measures [332]:
  • Remove all ignition sources near the spilled material.
  • Steer clear of heat, sparks, flames, and oxidizers.
  • Steer clear of exposure to mineral acid/alkali.
  • Halt the origin of the release if you can accomplish it safely. Perform release containment to avoid additional pollution of soil, surface H2O, or ground H2O.
  • Use protective gear to avoid eye contact and skin exposure.
  • Typically, no respiratory protection is needed. Nevertheless, utilize a positive-pressure air-supplying respirator in situations where air-purifying respirators are insufficient.
According to [60], in contrast to combustion, PY and co-PY produce fewer air pollutants and serve as alternative methods for hazardous material and biomass waste disposal instead of landfills and incineration.
Biomass PY is in the developing stage, and its cost is equal to 2.8 USD/kg. The process’s drawbacks include the production of tar, CO2, and CO. The remedy for them is the requirement for post-combustion separation, oxyfuel separation, and CO2 storage. The process efficiency is in the range of 35–50% [291,333].

4.2.2. Hydrothermal Processes of Biomass

HT procedures function at high temperatures and pressures that surpass the saturation pressure of H2O. These conditions cause various reactions that alter the physical and magnetic characteristics of H2O, such as its density, dielectric constant, and ionic product. Reactions like these influence the production of fuels with high energy content and valuable chemicals. Researchers classify hydrothermal (HT) processes into three main types, hydrothermal carbonization (HTC), hydrothermal liquefaction (HTL), and hydrothermal gasification (HTG), based on the temperature range and target products [334] (Figure 12 [39]).
Figure 13 (based on [39]) shows the specific operating parameters mainly affecting the maximalization of biomass conversion into valuable gases and activated charcoal via HT processes. This figure presents the critical temperature and pressure settings needed to maximize efficacy and H2 yield in the biomass conversion process.
Producing hydrochar via biomass HTC is an effective and environmentally friendly process, creating a C-rich solid fuel that has a high energy density. This process converts various biomass materials into clean solid fuels without producing smoke, working at pressures between 2 and 10 MPa and temperatures between 180 and 250 °C [335]. Hydrochar can undergo additional processing by being physically activated with steam at high temperatures (500–900 °C) to produce activated carbon, resulting in surface areas exceeding 700 m2/g [336].
The HTL transforms biomass into biocrude, similar to pyrolysis bio-oil, via chemical processes at high temperatures (280–370 °C) and pressures (10–25 MPa). This process also produces solid, liquid, and gas byproducts with higher energy content and better heat recovery capabilities compared to other methods [337]. Additional treatment of biocrude using reforming methods can convert it into bio-CH4 and H2 [338].
HTG, or supercritical H2O gasification (SWG), makes use of H2O in its supercritical state as both a solvent and a reactant due to its unique properties. This process converts biomass into H2 and CO2 using catalytic cracking and steam under specific conditions (T ≥ 374 °C, P ≥ 22 MPa) [339]. In these circumstances, H2O acts as an oxidizing agent and engages in a steam reforming (SR) process with biomass, following Formula (11), to produce H2, CH4, CO, and CO2.
B i o m a s s + H 2 O H 2 + C O + C O 2 + C H 4
After this initial reaction, similar gas–gas reactions occur, leading to the creation of H2 and CO2, as outlined in Equations (12)–(14) [339].
C H 4 + C O 2 2 H 2 + 2 C O ,
C H 4 + H 2 O 3 H 2 + C O ,
C O + H 2 O C O 2 + H 2
HTG and the other HT processes utilize H2O as both the reaction and reagent medium, without the necessity of drying the feedstock before the process, thus lowering energy consumption [340]. This method is beneficial for the drying of biomass with high levels of moisture. It also enables the attainment of high biomass conversion rates (up to 100%) and a volumetric H2 content of at least 50% in final gaseous products while producing less tar or other byproducts [341]. Optimizing the operating temperature and pressure, reagent concentration, and reaction time is necessary to achieve high yields.
Some information regarding hazards accompanying diverse HT processes of biomass is presented in Table 6.
In HTC, biomass is treated with H2O at low temperatures (around 200 °C) and pressures for several hours [342]. This method consumes less energy compared to traditional carbonization and enables a greater product yield in a shorter period [343]. Its benefits encompass a low carbonization temperature, synthesis in the aqueous phase, and the utilization of biomass [343].
The primary benefit of HTC compared to PY is that the HTC process handles wet waste, enabling feedstocks to be processed without the need for pre-drying. Numerous feedstocks, such as aquatic biomass, agricultural byproducts, and industrial as well as animal wastes, are appropriate for HTC [344]. PW serves as an efficient medium for heat transfer in HTC; however, if the variation in feedstock particle size is excessive and the reaction time is insufficient, it can lead to mass transfer limitations. Therefore, the particle size must be consistent to guarantee even heat and mass transfer. The feed material introduced into the reactor is warmed to a designated temperature and maintained for a specified duration. During HTC, gases (mainly CO2) and a liquid mixture (predominantly PW with a small number of organics and solids) are generated. The liquid mixture is centrifuged or filtered to divide the PW from the solids (wet cake). The moist cake is subsequently dried to generate a carbon-dense hydrochar [345].
Various reactions take place during the HTC process, including hydrolysis, dehydration, decarboxylation, and aromatization. These reactions take place at elevated temperatures and pressures and are crucial for reducing the hydrogen to carbon (H/C) and O2 to carbon (O/C) ratios to yield carbon-dense hydrochar. Hydrochar is the main product due to its characteristics allowing its use as a solid fuel [345].
The hydrochar yield depends on the type of feedstock, the solids loading (the ratio of feedstock to H2O), as well as the process temperature and residence time. Overall, hydrochar production diminishes as process conditions become more severe, meaning that elevated temperatures and extended residence times break down a greater portion of the cellulosic and hemicellulosic components in the feedstock. Although the yield is low, the hydrochar exhibits a greater C content and higher heating value (HHV) when subjected to elevated temperatures and extended residence times [346].
The HTC hydrochar contains less moisture and is more hydrophobic compared to the raw feedstock [347]. Nevertheless, obtaining these characteristics necessitates the use of reactors and machinery, like a filter press, resulting in an energy-intensive procedure. HTC hydrochar and HTC PW can contain unwanted metals like Ni, Pb, Cd, and Cr, depending on the feedstock utilized, which are found in both solid and liquid fractions after the HTC process [345].
Depending on the feedstock, hydrochar possesses a calorific value ranging from 15 to 30 MJ/kg, which is marginally greater than the usual raw HTC feedstocks, which vary from 13 to 19 MJ/kg [345]. However, certain hydrochar possesses enough energy content to serve as solid fuel. Furthermore, hydrochar can be used as a feedstock for the production of liquid fuels (bio-oil, blend-stock fuel) and gaseous fuels (syngas) [348,349].
HTC does not necessitate the pre-drying of biomass and can use feedstocks with different moisture levels, resulting in savings on energy and drying costs prior to processing [350]. One of the primary advantages of HTC over other thermochemical processing techniques is that it does not need dry feedstocks to create char [351]. HTC increases the dewatering efficiency of raw materials by aiding in the release of bound H2O, making it extremely advantageous for biosolid management [352]. HTC can significantly reduce the environmental effects of waste biomass since it generates more energy and releases far fewer pollutants and odors compared to incineration, landfilling, and composting [353]. HTC can handle biomass without the need for pre-drying and is capable of using feedstocks with different moisture levels, resulting in energy and cost savings on drying prior to processing [350]. This is a significant advantage of HTC over other thermochemical processing techniques that need dry feedstocks to create char [351]. HTC can reduce the environmental effects of waste biomass by recovering greater energy and producing significantly fewer pollutants and odors compared to incineration, landfilling, and composting [353].
Yang et al. [354] explored the properties of the aqueous phases (APs) obtained from various agricultural residues (such as peanut and wheat straws) and the co-gasification of cotton stalk (CS) along with APs. Hydrothermal temperatures significantly affected the development of primary gaseous products. By experimenting and analyzing the co-gasification of CS and APs, it was revealed that the syngas product from co-gasification was primarily hydrogen. The hydrothermal temperature of the AP affected the spread and output of syngas products. In all experiments, the highest hydrogen content reached 57% (maximum syngas output, 1657 mL).
According to [345], the capital expenditure for an HTC system differs significantly based on the reactor size and operational scale. Operating expenses encompass elements like feedstock costs, HTC conditions (temperature and duration), and the characteristics of the intended product. Few studies exist regarding the costs associated with hydrochar production since the technology is not yet broadly commercialized. Nevertheless, according to the existing literature, the expenses of hydrochar generated from various feedstocks, including a coal–miscanthus mixture, compost, and grape marc, range from USD 106 to USD 170 per ton. The primary factors influencing the expense of hydrochar production include the size of the production facility, the characteristics of the feedstock, and the yield of hydrochar. There are still several uncertainties linked to heat transfer dynamics, product yields, and the expenses of large-scale hydrochar production. Broader research on various feedstock combinations, large reactors, and effective hydrochar production techniques may enhance the process and decrease resource needs and expenses.
Hydrothermal carbonization (HTC) is a TC pretreatment process in which biomass is treated with hot pressurized H2O to produce hydrochar. The latter is a persistent, hydrophobic, friable solid product, which has a fuel value close to that of lignite coal. The HTC process realized with a short retention time is accompanied by PW comprising potentially toxic phenols, furfurals, and their derivatives. This allows AD to generate BG [312].
If untreated, the process H2O (PW) from hydrothermal carbonization (HTC) would cause significant environmental contamination due to both organic and inorganic pollutants. During HTC, the creation of stable and harmful phenols, phenolic compounds, furfural, and 5-HMF causes issues because they can leach into the PW. Sometimes, these compounds are not easily broken down by biological processes (having high COD-BOD5 ratios) and can make the treatment of PW more complicated. The PW makeup is primarily influenced by the waste biomass used initially and the reaction conditions [355].
Usman et al. [356] noted in their review that HTL’s adaptability in transforming various biomass or waste products into biocrude is significant, allowing high biocrude yields (reaching 60–86% from assorted biomass types). Researchers investigated the impact of catalysts on HTL processes, the scalability of the technology, and the prospects for commercializing continuous HTL with aqueous-phase recycling. They additionally investigated the application of machine learning integration for HTL optimization aimed at improving process efficiency and the quality of output. They identified HTL and the following hydrotreatment as essential methods for converting biomass into a renewable fuel source.
The selection of the catalyst is vital in the HTL process, influencing biocrude production, its quality, and the efficiency of biomass transformation. Although alkaline catalysts, alkali salts, and metal-based catalysts typically demonstrate potential in improving biocrude production for certain feedstocks, their effects may differ based on the type of biomass. Conversely, acidic environments generally encourage repolymerization and condensation processes, leading to lower biocrude production. These insights highlight the importance of customized catalyst selection to enhance the advantages of HTL for various feedstock sources [356].
Research on continuous-flow HTL systems can be conducted using both lab-scale continuous-flow reactors and batch reactors with rapid heating. Nonetheless, creating a lab-scale continuous-flow system poses multiple challenges due to its complexity, safety factors, and the constraints of reducing its size, such as obtaining a lab-scale high-pressure pump [357]. Consequently, most studies on continuous-flow HTL systems utilize reactors that lie between laboratory and pilot scales, providing a feasible balance.
Continuous-flow HTL systems generally demonstrate reduced reaction times and greater biocrude outputs compared to results from commonly utilized batch HTL reactors. Importantly, even with considerable industry funding and various initiatives, there is still a notable lack of information on performance failures and issues faced during the design, construction, startup, and operational stages in the industrial setting concerning continuous-flow HTL systems [356].
The recycling of the H2O phase in HTL is seen as a hopeful method to boost biocrude production and increase energy recovery. Multiple studies mentioned earlier have shown substantial advantages, such as higher biocrude production and improved resource efficiency. Nevertheless, it is essential to recognize the related difficulties, including heavy-metal buildup, changes in biocrude characteristics, and concerns regarding nitrogen content. Tackling these issues will be vital for the effective execution of aqueous-phase recycling in HTL processes [356].
In their research on the TEA and LCA of HTL involving microalgae and the later hydrotreating of the generated biocrude, Masoumi and Dalai [358] indicated a minimum selling price (MSP) of USD 2.2 per liter to achieve an operational breakeven. Their LCA analysis showed a significant performance in GHG emissions, with an estimated decrease of −1.13 gCO2-eq per MJ, markedly less than that of traditional petroleum-based fuel production. A different analysis of TEA and LCA regarding HTL camel manure biocrude indicated that the upgraded biofuel had an MSP ranging from USD 0.87 to USD 0.91 per kg. Moreover, LCA showed a 7% decrease in GHG emissions when evaluating the biofuel generated from camel dung (84 gCO2/MJ) against commercial gasoline (90.2 gCO2/MJ), highlighting its ecological benefits [359].
A research project carried out in 2019 by de Rose et al. [360] evaluated the HTL of microalgae, revealing an MSF of USD 12.85/GGE for the biochemical pathway and USD 10.41/GGE for the thermal–chemical pathway. Their LCA showed a notably reduced global warming potential for the thermal–chemical method at 2 g CO2eq/MJ, in contrast to 111.2 g CO2eq/MJ for the biochemical method. The aforementioned studies suggest that the HTL of biomass is not only economically feasible but also environmentally advantageous, especially regarding GHG emissions. Nevertheless, it is crucial to recognize that the results of TEA and LCA can differ greatly based on several elements, like the kind of feedstock, its makeup, and operational parameters [361].
HTL presents several challenges [356]:
  • A major challenge is the existence of heteroatoms, like sulfur and nitrogen, in HTL biocrudes. Effectively controlling these heteroatoms via desulfurization and denitrogenation processes is needed. Specifically, it is essential to create strong and economical techniques to lower the sulfur and nitrogen levels in biocrudes.
  • Despite numerous HTL studies being performed at laboratory and pilot levels, moving to full-scale industrial operations is complicated. Difficulties involve creating sizable reactors, guaranteeing a steady supply of feedstock, and tackling financial factors. Research needs to concentrate on expanding HTL and hydrotreatment techniques for commercial use.
  • While often challenging, securing a steady supply of sustainable biomass feedstocks is crucial. The sustained availability and continuity of feedstocks are essential for commercial viability and process consistency.
  • Although different catalysts have demonstrated potential in enhancing biocrude yield and quality, obstacles persist in creating highly efficient, reusable, and feedstock-flexible catalysts. Catalyst innovation represents a crucial area of research focus.
  • Enhancing the hydrotreatment process is essential for attaining optimal biocrude upgrading efficiency. Additional studies are necessary to enhance selectivity, yield, and energy usage in the hydrotreatment process.
Four hazards accompany HTL: reactors are costly and intricate, requiring high pressures and H2O-handling capacity; product yield measurement is challenging; coke and tar can form; and organic salts combined with coke can clog and block reactors [313].
HTL is in the developing stage and costs 2.24 USD/kg. The process drawback is the low efficiency in the range of 30–35%. The remedy for this is the requirement for the Fischer–Tropsch reactor path [362,363].
HTG has disadvantages like high energy consumption and technological demand for equipment, leading to substantial investment and maintenance expenses [198].
Yoshida et al. [364] explored the SCWG processes of cellulose, hemicellulose, and lignin. They discovered that the lignin content greatly influences the quantity and composition of the product gas. This is likely because cellulose or xylan acts as a hydrogen donor to lignin. The quantity and makeup of the product gas can be reliably forecasted using solely the lignin component as a variable. This validated the significance of the lignin fraction’s influence on the SCWG features.
Bircan et al. [365] indicated that producing H2 via HTG can occur without taking into account the toxicity of dioxins. Dioxins were identified, yet their levels were significantly lower than the environmental regulation standards. An additional advantage discovered was that this method addresses the issue of chicken manure disposal during H2 generation.
Antal et al. [366] documented the HTG of corn- and potato-starch gels, wood sawdust immersed in a cornstarch gel, and potato waste delivered to three distinct tubular flow reactors via a “cement” pump. When quickly heated to temperatures exceeding 650 °C at pressures greater than the critical pressure of H2O (22 MPa), the organic components of these feedstocks turned into vapors. A dense C layer in the reactor facilitated the GA of these organic vapors in the H2O; thus, the reactor’s H2O output was purified. The generated gas composition was significantly affected by the reactor’s peak temperature and the state of the reactor wall. Remarkable gas yields (>2 L/g) with a high H2 content (57 mol %) were achieved at the peak temperatures used. Regardless of the reactor design and heating technique, all three reactors became clogged after 1−2 h of operation with feedstocks that had 15 wt.% organic content. Reduced loadings of organics extended the duration prior to plugging happening. The plug was created from buildups of ash and minor quantities of char produced by coking reactions involving the vapors of biomass. A technique for extracting plugs from the reactor was created and applied during an 8 h GA operation using potato waste. Significant erosion of the inner wall of each reactor took place during these tests. Ni and various metals were extracted from the reactor and accumulated in the C catalyst. Ni alloy tubes are inappropriate for use in this application.
Deniz et al. [367] examined the HTG of Posidonia oceanica in a batch reactor without the use of any catalysts. The experiments took place within a temperature range of 300–600 °C, using varying biomass loading levels of 0.04–0.12 (g/mL) over a reaction duration of 1 h. The gas produced consisted of H2, CH4, CO2, CO, and a slight quantity of C2–C4 compounds. They discovered that raising the temperature and lowering the biomass loading improved the HTG yield and H2 production by accelerating the water–gas shift (WGS) and SR reactions. The highest molar fraction and H2 yield achieved were 62.51% and 10.37 mol/kg, respectively, at 600 °C with a biomass loading of 0.08 g/mL.
In contrast to PY, thermal GA, and PO processes, needing substantial energy, HTG is energy-efficient without needing extra resources [368]. Moreover, the dewatering and drying of biomass is not needed [351,352,353]. For instance, the GA of biomass with a minimum of 30% moisture demands less energy than drying because it does not involve the energy needed for the phase transition from liquid to vapor [369]. Moreover, HTG facilitates integrated energy recovery since the hot effluent stream from the reactor can be utilized to preheat the feed stream at ambient temperature [370]. In contrast, traditional biomass GA methods with drying operate at lower temperatures, which complicates energy recovery from the process streams. For HTG, energy efficiencies of the process are usually noted to be between 45% and 70% [371,372]. Ro et al. [373] determined that the HTG of biomass yields a net positive energy result when the feedstock contains more than 2% solids and effective heat recovery systems are implemented. In research examining the SCWG of corn starch at 745 °C and 280 bar, an overall process energy efficiency of 76% was noted [374]. In another related study on the HTG of chicken manure, a process energy efficiency of 70% was achieved with a biomass loading of 15%. The most efficient method for enhancing energy efficiency was increasing the biomass load. Nonetheless, the overall gas yields from SCWG may decrease with increased biomass loadings, highlighting the need for thorough process optimization [375].
HTG enhances gasification efficiency, boosts the gas yield, and lowers char/tar formation while achieving high residue yields [376]. Additionally, supercritical water (SCW) uses are viewed as “eco-friendly” substitutes for corrosive acids and organic solvents [377].
SCW serves as a reactant that facilitates hydrolysis and WGS reactions, exhibiting high diffusivity and density, making it an excellent solvent for generating industrially significant gases. Nonetheless, it has not been implemented on an industrial scale due to various drawbacks, including high pressure and temperature demands, clogging, corrosion issues, and material expenses [378].
Significant amounts of gases (mainly H2, CO2, CO, and CH4) produced during HTG have been shown in numerous lignocellulosic materials, including rice straw, rice husk, wheat straw, peanut husk, corn stalk, corn cob, sorghum stalk, and wood sawdust [22]. Temperature, biomass loading (or biomass concentration), and reaction duration are the key factors influencing gas production. A comparison of two methods for the HTG of biomass—low-temperature (374–460 °C) catalytic GA [379] and GA without a catalyst [380]—reveals that catalytic GA faces numerous issues, including reactor corrosion due to homogeneous catalysts and the recovery of the catalysts. Thus, it is crucial to create a GA process that produces a high H2 yield without the use of additional catalysts.
HTG is an alternative to traditional steam GA methods, in which steam is employed as a gasifying agent across various reactor configurations (fixed bed, fluidized bed, entrained bed, vertical shaft, etc.). The major benefit of steam GA is its ability to deliver a higher heating rate (up to 1000 °C) with a shorter residence time (in minutes) compared to HTG. Nevertheless, the primary disadvantage of steam is its significant endothermic characteristics and substantial energy input needs. In an earlier report, legume straw produced 50.6% H2 and 21.2% CO at 850 °C, while pine sawdust yielded 44.0% H2 and 28.2% CO through steam gasification in a free-fall reactor [381].
Furthermore, H2 gas yields of 37% and 40% were achieved from pine sawdust in a conical spouted bed reactor [382] and from olivine-supported biomass [383] at 900 °C, respectively. The greater gas yields observed in their results were due to elevated operating temperatures. It was stated that at higher temperatures above 750 °C in the biomass GA process, the gas composition was mainly affected by the WGS reaction [384].
HTG represents a hopeful technology for H2 generation, especially given its capacity to directly gasify biomass that has a high moisture level. This approach demonstrates great reaction efficiency and results in significant H2 generation [385]. Nonetheless, HTG disadvantages include that its scalability is restricted, and no known large-scale commercial system utilizing this technology exists at present. All HT technologies require ongoing research and development to enhance their effectiveness for large-scale H2 generation.

4.2.3. Biomass Gasification

In GA, a biomass substrate is converted into a flammable gas at temperatures between 700 and 1200 °C, without combustion. This procedure requires the application of a GA agent at a restricted level, such as air, O2, steam (Table 7—based on [67]), CO2, or their combinations.
GA’s primary output is syngas, a fuel in gas form composed mainly of H2, CO, CO2, N2, tars, char, ash, and particles. As a result, syngas produces a combination of flammable CO, H2, and CnHm compounds [386]. General Formula (15) defines the biomass stream GA.
B i o m a s s + S t e a m H 2 + C O + C O 2 + C H 4 + L H C + T a r + C h a r
The type of biomass and the GA agent utilized can impact both the content and lower heating value (LHV) of syngas. When air is used as the gasifying agent, the resulting syngas usually has a lower heating value (LHV) between 4 and 8 MJ/Nm3, whereas if steam, O2, or a combination of both are used, the syngas produced has an LHV ranging from 8 to 20 MJ/Nm3 [387]. Figure 14 shows the flowchart of PF (based on [39]).
GA operations are categorized into different groups based on the type of gasifier and source of heat. Direct and self-sustaining GA involves using air or O2 for the partial combustion of biomass to generate process heat, while indirect and non-self-sustaining gasification uses steam along with external heat sources. Indirect and allothermal gasification is advantageous for the production of H2 due to its support of the SR process in syngas. This kind of response raises the production of H2 when compared to the gas yield from air, which primarily encourages burning and results in a larger amount of N2 in the syngas [388]. The SR process in GA decreases the carbon-to-hydrogen (C/H) ratio in the syngas, improving its quality by reducing the number of light hydrocarbons and tar. This improvement boosts the production of H2, reduces pipe clogging, and prevents corrosion caused by tar polymerization and condensation [282].
During steam GA, multiple extra reactions take place. Following the drying process, the biomass goes through a pyrolysis reaction that changes it into a gas containing CO, CO2, CH4, light hydrocarbons like C2H4, char, and tar [389], as shown in Formula (16).
B i o m a s s H 2 O + C O + C O 2 + C H 4 + L H C + T a r + C h a r
Tar consists of a combination of polycyclic aromatic hydrocarbons (PAHs) and oxygenated compounds, such as alcohols, phenols, and furans, creating a complex and concentrated substance. Under high-temperature conditions (700–1000 °C) with steam, reactions such as cracking and SR occur, altering the structures of oxygenated molecules. In reforming reactions, tar decomposes into CO, H2, char, and polycyclic aromatic hydrocarbons (PAH) according to Formula (17) [390]. PAHs undergo thermal cracking at extremely high temperatures (~1250 °C) to generate CO and H2 as part of heterogeneous reactions.
T a r + H 2 O C O + C O 2 + H 2 + C h a r
The reforming reactions develop under a mixture of steam and CO2, transforming CH4 and C2H4 into CO and H2, as described by Formulas (18)–(22) [39].
Partial Oxidation of Methane (POM):
2 C H 4 + O 2 2 C O + 2 H 2 ,
Dry Reforming of Methane (DRM):
C H 4 + C O 2 2 C O + 2 H 2 ,
Dry Reforming of Ethylene (DRE):
C 2 H 4 + 2 C O 2 4 C O + 2 H 2 ,
Steam Reforming of Methane (SRM)
C H 4 + H 2 O C O + 3 H 2 ,
Steam Reforming of Ethylene (SRE)
C 2 H 4 + 2 H 2 O 2 C O + 4 H 2 ,
Light HCs and COx, as well as H2, are generated during tar cracking. These compounds remain stable during cracking/reforming conditions. Additionally, the WGS reaction changes CO when H2O is present, resulting in a combination of CO2 and H2, according to Formula (23) [39].
Water–Gas Shift Reaction (WGSR):
C O + H 2 O C O 2 + H 2 ,
Ellofy et al. [67] found that the biomass GA process entails a complex series of chemical reactions happening simultaneously and consecutively. Certain reactions are exothermic, releasing heat as they occur, while numerous reactions are endothermic, requiring heat to take place. The reactions may be classified as either homogeneous or heterogeneous reactions.
The introduction of steam into the GA process alters a reversible reaction to produce H2. Increasing the temperature of the WGS reaction, an exothermic process, favors the formation of CO and H2O by shifting the equilibrium toward the reactants, as stated by Le Chatelier’s principle. Finally, there are also various heterogeneous reactions observed, as defined by Equations (24)–(27), such as the oxidation of C and the Boudouard reaction, which involves the conversion of C generated during PY into CO and CO2 [282].
C + O 2 C O 2 ,
2 C + O 2 2 C O ,
C + C O 2 2 C O ,
C + H 2 O C O + H 2
Optimizing the biomass characteristics, operating temperature, steam–biomass ratio (S/B), and catalysts is crucial for achieving a high H2 generation yield via steam GA [283]. The effects of such parameters on the H2 generation yield in steam GA are shown in Table 8.
Table 6 shows details about the hazards associated with biomass GA.
Table 8. Effects of the main parameters on H2 yield in biomass steam GA.
ParametersEffect on H2 Yield in Biomass Steam GARefs.
TemperatureIncreasing the temperature encourages endothermic processes like hydrocarbon reforming (Formula (17)), methane reforming (Formula (21)), and carbon gasification (Formula (23)), leading to enhanced gas production and a higher volumetric fraction of H2 in syngas.[391],
Raising the temperature further reduces the tar content in syngas.[392]
Temperatures exceeding 950 °C can inhibit the WGS reaction (Formula (23)), an exothermic process, resulting in a reduction in the H2 content in syngas.[393,394]
Steam to biomass ratio (S/B)The S/B ratio plays a crucial role in determining the syngas composition and energy input in biomass gasification.
A low S/B ratio results in the creation of solid C and CH4.
Augmenting steam availability enhances the reforming processes of C and CH4 into CO and H2.
An S/B ratio exceeding 1.3 leads to excess steam, which decreases solid C and CH4 while increasing H2 and CO2 production.
Steam aids in lowering CO through the WGS (Formula (23)) and hydrocarbon reforming reactions (Formulas (17), (21), and (22)).
Ideal S/B ratios of up to 1.3 promote H2 production, whereas ratios above 1.3 lower temperature and elevate tar creation.
[282,314,395]
Biomass characteristicsBiomass type: A composition high in cellulose and lignin increases the yield of gaseous products and the H2 percentage in syngas.[314,396]
Particle size: Reduced particle sizes enhance the surface area, facilitating better heat transfer, increasing gasification rates, and elevating H2 content while minimizing tar production. Particles less than 1 mm may raise energy usage.[283],
Moisture content: The ideal range is 10–15% by weight; levels over 40% result in lower temperatures, increased energy consumption, and decreased GA efficacy and H2 levels. [395,397]
Ash content: Elevated ash levels boost coke and particulate generation in syngas, requiring efficient gas-cleaning methods.[396,397]
CatalystsBoost H2 and CO yields by optimizing heat and mass transfer efficiency during the GA process (Formulas (23)–(27)).[306]
Catalysts additionally assist in tar elimination, enhancing H2 yield and overall GA efficacy, thereby augmenting renewable-H2 generation.[282]
Typical catalysts consist of Ni-based compounds, alkali metals (such as K2CO3, Na2CO3), alumina, aluminosilicate, ZnCl2, and dolomite.[283]
The initiation of the heating process is crucial for the safety and stability of biomass GA, as it can impact the chances of fire, explosion, and the release of toxic gases. The startup process’s crucial factor is the heating temperature because it influences safety. The biomass GA process poses significant hazards, such as fire, explosion, and environmental emissions through numerous pathways [315,316].
One of the primary dangers is the possible release of harmful producer gas and particles. The incomplete combustion and oxidation of trace elements in feedstock are involved in the production of CO, SOx, NOx, and volatile organics [317]. CO, one of the most hazardous elements, can enter the bloodstream and bond with hemoglobin, preventing the absorption and distribution of O2. Prolonged CO exposure can result in asthma, lung inflammation, schizophrenia, and cardiac defects. Harmful gases such as SOx, NOx, and volatile organic compounds can also damage the respiratory, digestive, and skin systems of humans [318]. Particle emission (PM2.5) causes cancer. PM2.5 particles have the ability to absorb various soluble organic compounds like alkanes, carboxylic acid, and aromatic compounds, leading to harm to organs such as the lungs and liver [326]. If ashes and condensates from biomass GA are not disposed of correctly, they also add to environmental issues. Specifically, dealing with a toxic condensate containing high levels of tar is challenging and increases the likelihood of danger.
GA also poses a danger of fire and explosion. Since the GA system typically functions under high-temperature and high-pressure conditions, it also generates a flammable gas mixture containing a significant amount of H2 gas [330].
HT GA processes of biomass can be categorized into three main types based on the reaction conditions and desired main product gases [398]:
I.
A process called aqueous-phase reforming (APR) involves converting biomass-derived compounds (C6H12O6, C6H14O6, C3H8O3, CH3OH, and C2H6O2) into mainly H2 and CO2 at temperatures between 215 and 265 °C with the help of a catalyst (initially Pt, later also Ni, Ru, Rh, Pd, and Ir).
II.
The catalyzed near-critical GA of biomass or organic compounds at approximately 350 °C in the liquid phase or 400 °C in the supercritical state using a heterogenous catalyst converts them mainly to CH4 and CO2 for combustion.
III.
Supercritical H2O gasification (SCWG) involves the gasification of biomass or organic compounds to produce mainly H2 as a burnable gas and CO2, without requiring the use of a solid catalyst or the presence of C or other solid catalysts.
Aqueous-phase reforming (APR) mainly converts O2-rich compounds into H2. In the aqueous phase, feedstock molecules dissolve and interact with H2O molecules at low temperatures (270 °C) and elevated pressures (up to 50 bar) [202,399]. APR techniques are suitable for biomass-based oxygenated hydrocarbons with a C/O ratio of 1:1 that can mix with H2O, including CH4O, C2H6O, C2H6O2, C3H8O3, glucose, or polyols such as sorbitol [400].
The primary drawback is the restricted range of efficiently soluble compounds altered by the process. Nevertheless, after a pretreatment phase, APR has the potential to transform pure cellulose and woody biomass [399]. This involves hydrolyzing cellulose and hemicellulose to generate monomers that can be used as feedstocks [401]. The reaction mechanism resembles that of SR and relies on the breaking of C–C bonds to generate H2. When ethylene glycol interacts with a catalyst’s surface, the C–C bonds break apart, producing CO. The catalyst further improves the WGS process, resulting in only 300 ppm of CO in the gas stream. Other reaction intermediates exist, promoting C–O bond breaking and leading to the formation of alkanes (CH4, C2H6) and a lower yield of H2 production [402].
The selection of a metal (M)-based catalyst is significantly affected by the stability of the M–C bond (which enhances the C–C cleavage route) and the M–O bond (which enhances the C–O cleavage pathway). Conversely, the expense of metal catalysts is prohibitively high for extensive development. In addition, the role of catalysts should be taken into account. Due to their greater selectivity for H2 and lower selectivity for alkanes, basic and neutral supports are preferred over overly acidic ones [67]. In acidic conditions, alkanes are generated via dehydrogenation, making it essential to choose a catalyst that does not selectively favor alkanes while functioning at an appropriate pH [202]. The selectivity of APR is also affected by the biomass feedstock and the parameters of the process [402,403]. Transforming intricate O2-containing compounds, like carbohydrates, is challenging due to their lower H2 output [404]. The uniform thermal breakdown of carbohydrates generates a significant amount of coke that hinders the catalyst and interferes with the reforming processes [67].
Ellofy et al. [67] found that the SR strategy represents a valuable supplementary technology that can be integrated with existing GA operations to reduce tar and char levels. To improve H2 production, the syngas discharged from the gasifier must exhibit a high concentration of H2 and a minimal tar output. Multiple factors, such as the temperature, gas flow rate, pressure, residence time, equivalence ratio, biomass characteristics, and gasifier design, can influence the quality of gas generated through biomass GA. The air GA of biomass produces syngas that has a low H2 content and low heating value. Steam GA generates considerably more H2 compared to PY or air GA, with the overall thermal energy-to-H2 conversion efficiency potentially reaching as high as 52%. Given the H2% in gas (40%), increased H2/CO ratio (1.6), and fewer contaminants relative to air GA, steam GA is the optimal method for generating H2. Steam GA is suitable for wet biomass (moisture content between 5 and 35 wt.%), whereas air GA requires dry feedstock [405]. Biomass GA with O2-rich air is an effective method for generating gas with a medium heating value; however, its high O2 production costs hinder its widespread use. Steam GA processes utilizing a fluidized-bed reactor, either with or without added O2, are effective in generating MHVs of 10–16 MJ N−1 m3 gas containing 30–60 vol% H2. This is due to the lack of N2 in air GA products and the potential for a homogeneous WGS reaction occurring early in the GA process to enhance H2 production. However, such a method needs a steam temperature above 700 °C, and high costs are incurred for high-performance steam generators.
The SR process is a concurrent purification method that reduces the carbon-to-hydrogen mass ratio (C/H) of syngas during steam gasification [67]. By fine-tuning the operational parameters of SR, the quantities of light hydrocarbons and tar that cause pipe corrosion and blockage due to polymerization and condensation have been reduced [406].
The partial oxidation (PO) scenario differs from the SR process. The reaction pathway remains the same as that of SR, with H2O replaced by O2 [407]. A characteristic is that reactions involving O2 are exothermic, which removes the need for an external energy source or the use of smaller reactors. Based on the O2 levels in the reactor, various reactions take place. PO is thoroughly documented for ethanol, the most comprehensively studied feedstock in the literature. As H2 is produced along with CO due to ethanol and diminished O2 concentrations, the reaction starts as endothermic and turns exergonic when the amount of O2 in the reactor increases. In this case, the PO reaction is auto-thermal, resulting in the generation of CO2. PO is conducted at reduced temperatures because of the highly exothermic nature of the process [408,409]. With reduced O2 levels, WGS processes might enhance the H2 yield from PO using steam. This reaction is slightly exothermic, and the H2O added to the system inhibits catalyst deactivation by decreasing coke formation, similar to SR [410,411]. Catalysts are also necessary in PO, similar to SR, though there is no external heat source in PO.
Supercritical water gasification (SCWG) is a different thermochemical method that is more adaptable for various biomass types, including wet biomass (moisture > 35%), like carbohydrates and timber. To form a supercritical fluid, H2O needs to be heated above 374 °C and subjected to pressure exceeding 221.2 bars. Under such conditions, the dielectric constant of H2O and the number of H2 bonds both decrease. At elevated temperatures, organic compounds and gases mix well in supercritical H2O, speeding up their transformation. The entire procedure is endothermic and similar to reforming in the aqueous phase. In comparison to other GA methods, residence times may be quite brief (2–6 s), and the reaction can occur at a reduced temperature (600–650 °C) [412]. Nonetheless, maintaining these conditions demands significant energy levels, increasing costs and constraining scalability [304]. Consequently, no large-scale industrial system has been developed because the high pressure needed demands considerable capital and operational costs [413]. Specific technical issues (standardization of reactor design, waste neutralization, and comprehension of chemical dynamics) need to be tackled to generate commercially feasible SCWG systems [200]. SCWG systems operate within two temperature ranges: elevated temperatures, typically between 500 and 700 °C, and reduced temperatures, usually from 374 to 500 °C. PY techniques take place prior to gasification at elevated temperatures, breaking down the fuel without requiring a catalyst. Nevertheless, alkali catalysts may be utilized to enhance H2 generation by elevating WGS reactions. Hydrolyzed compounds are gasified and reduced at lower temperatures (374–500 °C) using alkali-based catalysts, transition-metal catalysts, and activated carbon, which are essential for efficient biomass-to-gas conversion [380,414]. Methanation occurs at lower temperatures and utilizes the H2 produced to form CH4, requiring charcoal or an alternative carbon-based catalyst to address this challenge.
Catalytic Supercritical Water Gasification (CSCWG) is also known as low-temperature catalytic gasification due to its operational temperature range of 350–600 °C. The catalyst, along with the reduced reaction temperature, minimizes the formation of char and tar. Resende et al. [415] explored and documented the use of metal catalysts for the SCWG of cellulose and lignin. Numerous researchers have performed laboratory tests, laying the foundation for the concept’s use at pilot and commercial levels.
Rauzan et al. [416,417,418] established the initial CSCWG pilot facility in San Diego at the General Atomics location to explore the previous findings from lab-scale research. It was found that the H2 production matched the results from laboratory experiments, yielding 10 g of H2 for every 100 g of feed [366]. Catalysts play a significant role in the H2O GA process, enhancing H2 production [419,420]. Watanabe et al. [421] found that the use of CSCWG resulted in a twofold increase in H2 production compared to non-catalytic supercritical gasification. For aromatic compounds, Park et al. [422] employed RuO2. This analysis demonstrated that RuO2 provided the complete activity mechanism for the K2CO3 catalyst. K2CO3 exhibited greater activity than Ca(OH)2 in the gasification of cellulose within CSCWG, even though it did not capture CO2 [423]. For many years, metallic Ni catalysts have been used in conventional fossil fuel GA and are now applied in biomass CSCWG [424]. The expense of H2 production is essential for technological advancement; a comprehensive assessment was performed considering all elements, and the price of H2 was determined to be 3.4 USD/kg for the hydrogasification of biomass wastes [425]. Zhang et al. [426] examined the literature concerning the energy efficiencies of the SCWG method and identified values between 0.04 and 42.05%.
The risk assessment for biomass GA plants was overviewed in [427], while explosion parameters and protection in such plants were discussed in [428].
Some information about hazards accompanying the use of catalyst materials is presented further when GSR technology is discussed.
According to [429], hazard evaluation is essential for a biomass GA facility, as it encompasses multiple dangerous elements. Set pair analysis (SPA) is a useful and efficient technique for hazard evaluation, yet it has drawbacks, such as the failure to show differences when data fall under the same hazard category, and the evaluation outcomes suffer from imprecision and inaccuracy. Not only are the generated biomass gas and biomass substances combustible, but the biomass gas also possesses explosive and toxic properties. This imposes multiple risks on the biomass GA facility that require evaluations. The authors developed an enhanced technique known as general set pair analysis (GSPA). The Connection Measure Degree (CMD), based on the cosine function, along with the Weighting Deviation Degree (WDD), Relative Membership Degree (RMD), and Comprehensive Index (CI), was introduced in GSPA. During GSPA, six assessment metrics were defined: the hourly production volume of biomass gas (m3/h), the CO volume fraction in the biomass gas (%), the lower explosive limit of the biomass gas (%), the air exchange rate (time/h), the pressure relief capacity (m2/m3) during incidents of fires and explosions at the biomass GA station, which depends on the pressure relief area (m2) and the biomass GA station volume (m3), and the volume of biomass materials stored at the GA station (m3). Nevertheless, the complete hazard causes of biomass GA facilities cannot be captured solely by the six evaluation indicators. Numerous factors can trigger fires, explosions, and poisonings in biomass GA facilities, including tar, human mistakes, and weather conditions, among others. Tar is particularly significant, as it represents the main challenge in biomass GA technology. However, the aforementioned causes were not the direct triggers of fires, explosions, and poisoning in biomass GA facilities. For instance, being one of the components of the generated biomass gas, tar can cause equipment blockages, which may subsequently result in equipment damage and gas leaks, and such gas leaks can immediately cause fires, explosions, and poisoning in biomass GA facilities. In summary, tar was an indirect factor in causing fires, explosions, and poisoning. Likewise, other factors like human mistakes and weather conditions are also indirect causes of fires, explosions, and poisoning. As noted earlier, the hazard evaluation of the biomass GA facility utilizing GSPA was conducted in relation to the direct causes of fires, explosions, and poisoning identified in this research, and this hazard evaluation can be viewed as a targeted assessment focused on the immediate causes. For continued research, indirect factors, such as tar, human mistakes, weather conditions, and others, can be taken into account to conduct a more thorough hazard evaluation for the biomass GA facility. A case study was conducted on two biomass GA facilities located in Shenyang City, Liaoning Province, in Northeast China. The results of the hazard assessment for the GSPA were compared to those of the SPA. The findings indicated that GSPA is a more efficient, precise, and accurate approach for the hazard evaluation of a biomass GA facility.
In the dry method, the existence of inorganic substances such as Cl in the gas phase results in significant corrosion issues. In the aqueous product phase of HT GA, these compounds can be found. This reduces the amount of cleaning required and minimizes corrosion issues with the product gases in subsequent processing. Nevertheless, achieving cost-effective isolation of these inorganic compounds to complete the nutrition cycle remains difficult.
One major downside of HT GA could be the requirement to heat up a large amount of H2O. The amount of heat needed to reach 600 °C might be more than the energy stored in the biomass if the H2O content is above 80% (g/g). This implies that a costly heat exchanger with a high level of effectiveness is necessary. This is especially relevant for supercritical H2O GA, where specific materials are necessary due to the elevated pressures and temperatures exceeding 600 °C [398].
The HT conditions and high pressure in APR make it difficult to advance aqueous-phase reforming. Nonetheless, the primary obstacles are low yields of desired products and rapid catalyst deactivation [430].
In the APR process, the alcohols are converted into adsorbed intermediates on the catalyst surface following dehydrogenation steps, and then the C-C or C-O bonds are broken. If unsuitable catalysts are used, the breaking of C-O bonds can produce persistent organic acids that are difficult to regenerate. These generated organic acids can cause damage to the equipment and deactivate the catalysts. Hence, catalysts that are efficient for the APR process need to show strong performance in breaking C-C bonds [430].
According to [431], the yield of the main PY and GA products is affected by the hemicellulose, cellulose, and lignin content. Increasing the cellulose content in biomass enhances the yield of the liquid pyrolysis product. The amount of pyrolysis gas depends largely on the proportion of hemicellulose, whereas the content of lignin conditions is the share of char in the total amount of PY products. Lowering the size of a biomass particle enhances the gas release and the concentrations of H2 therein. This increases the reaction surface area between the particle and a heated medium, thus intensifying heating and decomposition. Changing the biomass surface structure enhances the efficiency of C conversion and facilitates gas release. The particle size and surface structure have a less significant effect compared to temperature, catalyst addition, and steam/biomass ratio. H2 yield is enhanced with a temperature rise because of intensified GA and tar-cracking reactions. A steam medium was more efficient in maximizing the hydrogen yield than the air. Adding catalysts increased the H2 release and enhanced the gas quality by lowering the amount of H2O, removing O2, and cracking heavy aromatic structures.
Ghasemi et al. [32] noticed that the technical challenges of GA encompass product standardization, catalyst degradation, corrosion, blockage, and insufficient commercial application. Economic challenges to GA may involve substantial operating and investment expenses due to the requirement for elevated temperatures. Membrane reactors are capable of integrating H2 production methods, thus enhancing the efficiency of the TH process and alleviating these issues.
The most information about hazards related to the implementation of TC processes of biomass was found for GA, then pyrolysis, and the least for HT processes. In the case of the first two types, these hazards are related to the release of toxic gases. The last type of process may be related to the quality and quantity of post-process H2O and all of the processes with large amounts of energy involved.
Biomass GA is in the commercialized stage and its cost is in the range of 1.77–2.05 USD/kg. Biomass GA has drawbacks such as tar formation and feedstock impurity. The remedy for them is the requirement for carbonaceous materials. The process efficiency is in the range of 30–40% [180,432].

4.2.4. Initiatives Focused on TC Methods

Thermochemical processing entails exposing biomass to particular temperatures and chemical environments, influencing both the quality and amount of H2 produced. The length of exposure is essential for total conversion and avoiding degradation. The type of biomass utilized has a significant effect on the efficiency of the conversion process. Feedstocks rich in carbohydrates, cellulose, and hemicellulose are favored because of their substantial H2 yields. Nonetheless, these feedstocks need pretreatment techniques like drying, size reduction, and catalyst incorporation to improve their reactivity and accessibility for the conversion process. Catalysts can be naturally present in the biomass or introduced from outside. The characteristics of the reactors have been shown to influence heat transfer, mixing, flow patterns, H2 yield, and its composition [182].
Li and Guo [270] investigated a co-precipitated Mg-promoted Ni/Al2O3 catalyst (Ni-Mg-Al) for the SCWG of various biomass models and real biomass, along with its stability and performance. The jointly participated catalyst demonstrated higher activity recoveries due to its stable Ni crystal size, based on their comparison of the Ni-Mg-Al catalyst and an impregnation method. Moreover, the research examined how SCWG variables influenced the gasification efficiencies of phenol and glucose, along with the non-catalytic and catalytic gas products. The results indicate that full carbon gasification of various organic substances, such as phenol and real biomass, was achievable with an adequate amount of Ni catalyst. Between 400 and 500 °C, the catalyst generated CH4, while between 500 and 600 °C, there were higher yields. Actual biomass was less effective than the co-precipitated Ni-Mg-Al catalyst in gasifying H2O-soluble organic materials.
This technology could be integrated with other renewable energy sources like solar and wind to form synergistic energy generation systems that utilize biomass resources for H2 production and energy storage. This procedure functions based on the principle of temperature regulation regarding certain product distributions [265]. Yao et al. [433] have demonstrated that biochar serves as an effective catalyst and gasification aid for biomass. The biochar produced from Corn Stover Pyrolysis (CSP) effectively interacts with volatiles because of the existence of alkali and alkaline earth metals, aiding in the conversion to H2. In SR, the introduction of Ni (Ni-based biochar) to a two-stage fixed-bed reactor at 800 °C led to a rise in H2 production from 45.91 to 92.08 mg H2/g biomass.
Studies on gasification are ongoing, aimed at discovering the optimal catalysts and operating conditions to enhance gas quality and yield affordably. To promote tar conversion and prevent the formation of unwanted products, innovative and efficient catalysts are being implemented [265]. A variety of catalysts for thermochemical processes—especially gasification—have been analyzed and compared in research [282]. These typically consist of compounds reliant on nickel, olivine, potassium minerals, and dolomite [434]. Metal catalysts enhance the efficiency of gasification processes, leading to higher H2 yields from biomass. The selection of metal catalysts influences the conversion rates of biomass feedstocks, the generation of byproducts, and the effectiveness of H2 production. Fe-based composite catalysts in biomass steam gasification effectively generate H2-rich gas, underscoring the significance of choosing the right catalyst to optimize H2 production from biomass GA processes [435]. Metal catalysts, particularly Fe-based ones and other metals like Ni, Ru, Pt, Pd, Co, Cr, etc., significantly influence the H2 yield in the biomass hydrothermal gasification process by modifying reaction pathways, conversion rates, and the overall efficiency of H2 production.
Zhang et al. [395] found that employing limestone and dolomite at a 1:1 ratio as a catalyst yielded a peak output of 204.6 mL/kg of biomass within a temperature range of 450 to 850 ° C. Ma et al. [436] examined how different temperatures influence the H2 production of dolomite and olivine employed as catalysts. As the temperature rose from 700 to 900 °C, the tar production declined for dolomite, decreasing from 12.5 to 7.2 g/Nm3, and for olivine, from 15.9 to 9.1 g/Nm3. The tar conversion enhanced the H2 yield, rising from 36.2 to 46.4 g/kg and from 32.4 to 42.3 g/kg of biomass, respectively [395].
Chen et al. [437] examined Ni/CaAlOx catalysts derived from wood sawdust through pyrolysis and SR techniques. Assuming a 1:1 molar ratio of Ca to Al, the catalysts generated 15.57 mmol of H2 for each gram of feedstock. Ca is a cost-effective alkaline metal that enhances CO selectivity, facilitating biomass conversion. A 90% concentration for CO was attained using a 3:1 Ca/Al ratio. Nonetheless, catalyst deactivation caused by coke deposition remains the restricting factor.
Xu et al. [438] investigated how alkaline earth metals affect GA efficacy. They discovered that calcined CaO containing 5-weight percent iron resulted in the greatest yield in a 700 °C fluidized-bed reactor for wood sawdust GA. Nonetheless, the catalyst Fe/CaO was not as efficient in CO2 capture and GA. Fe impregnation led to increased production, as it inhibits the deactivation of CaO.
Some information about hazards related to the catalyst materials is presented further when GSR technology is discussed.
Integrating the enhanced GA method with biorefinery configurations for bio-based goods can assist in the sustainable generation of H2. Furthermore, it offers opportunities for resource recovery and waste management. Further research might enhance the ability to capture and utilize carbon dioxide, aligning with global efforts to decrease GHG emissions and tackle climate change [265].

4.3. The Hydrogen Extraction via Glycerol Steam Reforming and Hazards Related to It

C3H8O3, which is extensively produced as a byproduct in biodiesel production [439], is used in the production of H2 through the glycerol steam reforming (GSR) process [18], ref. [440] based on the stoichiometric point of view. GSR can produce 7 mol of H2 using 1 mol of C3H8O3. Thermodynamic and experimental research indicates that only 6–6.2 mol of H2 can be produced for each mol of C3H8O3 [441,442]. The manufacturing process of H2 relies on the choice of raw materials and techniques.
Current reforming systems suffer from disadvantages such as expensive production, reduced efficiency, GHG emissions, C deposition, and complexity [443].
Silva et al. [444] reported that intensive research regarding GSR thermodynamics, catalysts, reaction mechanisms and kinetics, and new reactor design (sorption-enhanced reactors (SERs) and membrane reactors (MRs)) has been conducted, focusing on enhancing the process efficacy. In their important review, the main challenges and strategies adopted for optimization of the GSR process were discussed, such as the GSR thermodynamic aspects and advances in catalysis and kinetics, as well as GSR performed in SERs and MRs.
Three studies were discovered in the literature concerning hazards associated with the utilization of C3H8O3 (Table 9).
Exposure to C3H8O3 may cause irritation of the skin and eyes. Breathing in Glycer-ol-alpha-Monochlorohydrin may cause irritation in the nose and throat, leading to coughing and wheezing. Exposure to Glycerol-alpha-Monochlorohydrin may lead to feelings of nausea, vomiting, dizziness, lack of coordination, and, in severe cases, even coma [445].
C3H8O3 is flammable and produces irritating or toxic gases when burned. It should not be used near open fires [446].
Ingesting C3H8O3 orally is considered safe for short-term usage. Nevertheless, potential side effects include headaches, dizziness, bloating, nausea, and diarrhea. Applying C3H8O3 to the skin is not harmful. It can cause redness, itching, and burning [447].
SR techniques for generating H2 can also be applied to various other biomass-based materials like vegetable oils, agricultural production waste, C3H8O3, and biomass pyrolysis oil [448].
The process of steam reforming typically involves the utilization of a variety of catalysts.
Traditional SR catalysts are fairly inexpensive, but they are prone to being affected by S-based catalyst poisons.
The production of H2 by GSR is greatly impacted by the catalyst’s ability to break C–H, C–C, and C–O bonds, as well as by the processing conditions. Currently, there is a strong focus on creating an effective catalyst that can efficiently utilize raw C3H8O3 for high performance. Different catalysts using metals such as Pt, Rh, Re, Pd, Ru, Ir, Co, Cu, and Ni were examined. Nonetheless, the advancement of Ni-based catalysts, particularly those utilizing Ni-based alumina, has been more beneficial in recent times. Another intriguing possibility is the utilization of perovskite-type and hydrotalcite-based catalysts [449].
Naranje et al. [450] created and simulated an integrated method for producing biodiesel from used cooking oil while optimizing C3H8O3 by converting it to H2. They discovered that the biodiesel yield reached 92.5%, while the H2 output from the reforming process was approximately 13%.
A key challenge in producing H2 from C3H8O3 is attaining a higher yield. Numerous improvements have been made in addressing this issue, yet only a handful are prepared for market launch [451]. A study was conducted on a compilation of recoveries obtained through the SR method for H2 production from crude C3H8O3, revealing that multiple processes demonstrated recoveries of 3% [452]. The most significant study involved examining a commercial Ni catalyst that enabled a yield of 70% [453]. The majority of processes yielding over 70% are improved by significant quantities of catalysts, including Pt, Ru, Ni, Ce, and various other rare compound catalysts [452]. These need to be improved with various compounds, primarily metal oxides. Nonetheless, considerable effort must be invested to advance technologies for reforming crude C3H8O3 into H2 and their real-world commercialization.

4.3.1. Catalysts

The literature identified four dangers related to the use of Pt and its complexes (Table 9).
While Pt metal itself is non-combustible, finely ground platinum powder can be both flammable and explosive, and toxic fumes are released if it catches fire. Coming into contact with platinum can cause irritation to the skin and eyes. Inhaling it may cause irritation in the nose and throat. Exposure to platinum might lead to a skin allergic reaction [454,455].
As documented in [456], Pt is classified as a flammable solid with hazard code H228.
Contact with H2O can cause Pt powder to react quickly or explosively. Friction, heat, sparks, or flames can all potentially trigger its ignition. The dust or fumes it produces could create explosive mixtures in the air [456].
Pt coordination complexes are capable of causing cancer and damaging genetic material in both mammalian and bacterial cells [457].
Additionally, four risks were identified in studies regarding dangers linked to the utilization of Rh and its substances (Table 9).
Rh is not flammable as a solid but becomes flammable when in dust or powder form, and toxic gases are emitted during a fire. Inhaling Rh powder can affect humans. Skin and eyes may become irritated when exposed to Rh powder. It could trigger a skin reaction. If an allergy emerges, even minimal future contact can result in itching and a skin rash [458].
All compounds containing Rh are extremely poisonous and can induce cancer. They leave a very noticeable mark on the skin. Flammability is a possibility. A dust explosion may happen when in powder or granular form and combined with air [459].
Improperly managed, Rh can pose risks to both human health and the environment. For example, rhodium solutions usually have rhodium sulfate, which is harmful and can lead to serious skin and eye irritation when touched, along with breathing issues if breathed in [460].
Rh is a catalyst and can react with various organic and inorganic substances, potentially leading to fire and explosion danger [461].
Four bits of data were found in the literature concerning risks associated with the usage of Re and its compounds (Table 9).
Exposure to Re may lead to skin irritation. The liquid form could cause skin and eye burns. Following consumption, it could lead to irritation in the gastrointestinal tract. Inhaling it can result in irritation of the respiratory tract [462].
It is a material that is not flammable, but it can self-ignite when exposed to alcohol or similar organic substances. Re dust could lead to slight to mild irritation in the eyes and skin. Inhaling fine Re dust or fumes can cause irritation in the nasal cavity and respiratory tract [463].
The substance causes physical irritation in the gastrointestinal tract. There have been no reports of toxic effects from Re in humans or animals [464].
Contact between Re oxide and flammable materials can result in fire due to its oxidizing properties [465].
Nine literature reviews discovered concerning the risks associated with the utilization of Pd (Table 9).
Pd is a substance with low toxicity levels and is not easily absorbed by the body if consumed. It can lead to skin, eye, or respiratory irritation, as well as skin sensitization. Liquid can result in skin and eye burns.
All compounds with Pd are extremely toxic and can cause cancer. Palladium chloride, for instance, is poisonous and can be dangerous if ingested, inhaled, or absorbed through the skin. It causes harm to the bone marrow, liver, and kidneys of animals in laboratory experiments. It induces irritation.
Pd shows minimal impact on its surroundings. Low concentrations of palladium salts are lethal to the H2O hyacinth, although the majority of plants can withstand levels under 3 ppm [466].
Pd powder is considered a solid that can easily catch fire (H228). It results in irritation to the skin (H315) and serious irritation to the eyes (H319) and can also lead to irritation of the respiratory system (H335) [467].
Contact dermatitis can be induced by Pd alloy [468].
Pd can catch fire when coming into contact with air, especially if it contains absorbed H2. It easily triggers the combustion of flammable solvents when in contact with air. Combustible properties are only found in Pd fine powder or dust. Many compounds of palladium act as oxidizing agents, with some reacting violently with organic substances.
Pd has low toxicity in short-term contact but becomes highly toxic over a longer period, especially at the cellular level in the liver and kidney. Increased Pd levels can be harmful and potentially cancer-causing for mammals.
Continual exposure to Pd particles in dust can cause harm to the blood and respiratory systems. With Pd on C catalysts, the small C particles can cause irritation to the mucous membranes and upper respiratory tract.
Pd on C catalysts become highly flammable when dry and at high temperatures, especially with adsorbed H2 gas. Catalysts made by reducing formaldehyde are not as flammable as those reduced with H2. C particles that are broken down into smaller pieces have the potential to cause a dust explosion.
Catalysts created on supports with a large surface area exhibit high activity and readily initiate ignition of mixtures of H2/air and solvent/air. Because of its high volatility, CH3OH readily catches fire. The use of a catalyst in a H4B solution can trigger the ignition of released H2 [469].
Only two instances of dangers have been discovered in the literature concerning the utilization of Ru and Ir (Table 9).
All Ru compounds are extremely dangerous and can cause cancer. They cause significant staining on the skin. Ru consumed is firmly retained in bones. Ruthenium oxide, also known as RuO4, is extremely dangerous and easily evaporates, so it should be steered clear of [470].
Ru is a solid that can easily catch fire (H228) [471].
Ir is extremely combustible. It has the potential to induce irritation in the eyes. It poses a minimal risk to the skin for standard industrial handling. Ingesting it can lead to irritation of the digestive tract [472].
Extracting and processing Ir has negative environmental impacts. Extracting and processing Ir has a negative impact on ecosystems and adds to carbon emissions [473].
Three literature reviews were discovered concerning the dangers associated with the use of Co and its compounds (Table 9).
Being exposed to Co dust can cause irritation to the skin, eyes, nose, and throat. Co can potentially trigger an allergic reaction similar to asthma. In the event of the latter, being exposed to the future can lead to asthma attacks that result in shortness of breath, wheezing, coughing, and/or chest tightness. Co might lead to problems in the heart, thyroid, liver, and kidneys [474].
Co is a vital cofactor present in the body, commonly found in nutrients like vitamin B12. In large quantities and in its non-organic form, Co can be very harmful. Excessive nutritional supplementation can lead to rare cases of acute toxicity [475].
Soluble Co salts negatively impact cell division, permanently attach to nucleic acids in the cell nucleus, cause chromosome abnormalities in plants, and exhibit weak mutagenic effects in certain in vitro tests involving cultured animal cells, bacteria, and yeast [476].
Eight bits of data were discovered in the literature concerning the dangers associated with the utilization of Cu (Table 9).
Consuming excessive daily doses of Cu for an extended period can result in serious health issues, like kidney and liver damage. Breathing in Cu dust, sprays, or crystals may lead to nose and throat irritation, as well as dizziness and headaches [477].
Cu that is finely divided can ignite or detonate when exposed to air. Toxic fumes are created during a fire.
Exposure to Cu powder may cause skin and eye irritation and burns.
Inhaling Cu can cause irritation in the nose and throat, as well as potentially creating a sore or hole in the septum of the inner nose. Copper can cause headaches, nausea, vomiting, diarrhea, and abdominal pain. Exposure to copper can result in sickness similar to the flu, known as “metal fume fever”. Cu can lead to a skin allergic reaction and impact the function of the liver and kidneys.
As per OSHA, the allowable airborne exposure limit (PEL) is 1 mg/m3 (as Cu dust and mists) and 0.1 mg/m3 (as Cu fume) over an 8 h work shift [478].
Being exposed to elevated levels of copper can have negative effects. Prolonged exposure to copper dust may lead to nose, mouth, and eye irritation, as well as headaches, dizziness, nausea, and diarrhea [479].
Excessive Cu consumption can lead to liver damage, stomach pain, cramps, nausea, diarrhea, and vomiting. Toxic levels of Cu can develop in individuals diagnosed with Wilson’s disease, an uncommon inherited condition [480].
Cu does not degrade in the environment, leading to its accumulation in plants and animals from soil. Only a small number of plants are able to live in soil rich in Cu. Hence, the number of plant species is restricted in the vicinity of Cu-disposing factories [481].
The literature contained two pieces of information about the risks associated with the use of Ni (Table 9).
The most widely used catalyst in reforming reactions is the Ni-based catalyst due to its ready availability, cost-effective nature, and strong catalytic activity. Ni also showed high intrinsic reactivity and was easily dispersed on support materials. Over the years, various methods of production and catalyst design have been discussed in the literature, but none have specifically addressed the advantages, disadvantages, limitations, and difficulties encountered in C3H8O3 reforming reactions catalyzed by Ni-based catalysts.
The activated catalyst Raney Nickel, a 50% slurry in H2O, is capable of self-heating and may potentially ignite (H251). It has the potential to induce an allergic skin response (H317). It is believed to cause cancer (H351). It can cause harm to the organs when there is prolonged or repeated exposure (H372). It is detrimental to under-H2O organisms with enduring consequences (H412) [482].
Carrero et al. [483] reviewed numerous studies comparing catalysts featuring various active phases for H2 generation via SR. It was found that, despite extensive research on Ni catalysts, the exploration of Co catalysts has been relatively limited, even though Co-based catalysts offer excellent catalytic activity at moderate temperatures, enhancing H2 production through the favored WGS reaction. Nonetheless, the primary disadvantage of Co catalysts is their deactivation due to surface oxidation and the sintering of Co metal species. Such a final point is significantly influenced by the selection of the catalytic support since it is noted that cobalt interacts vigorously with Al2O3 and TiO2 carriers, resulting in a high dispersion of Co species; however, the formation of cobalt aluminates and titanates leads to a reduction in the amount of available Co species. In contrast, a less strong interaction between Co and a Si support enhances the reducibility of cobalt oxides but encourages the agglomeration of Co particles throughout the calcination and reduction processes.
As the interaction between the metal and support is crucial for the dispersion and reducibility of metallic species, the large-surface-area feature of mesostructured materials such as SBA-15 should enable achieving superior dispersions in comparison to traditional amorphous silica. Moreover, having a consistent pore-size distribution in SBA-15 might prevent the creation of large Co clusters and the deactivation of catalysts due to metal sintering.

4.3.2. Promotors

Various effects on catalytic performance are induced by diverse promoters (K, Ca, Sr, Ce, La, Cr, Fe) and process conditions. Specifically, Ce, Mg, and La significantly affect catalytic performance when used as promoters. Furthermore, GSR using hydrotalcite- and perovskite-based catalysts showed excellent catalytic activity, along with enhanced thermal stability and resistance to coke formation. Specifically, Ni/LaNi0.9Cu0.1O3 synthesized with perovskite-type supports has displayed high C3H8O3 conversion and adequate H2 selectivity at reduced temperatures. Catalysts similar to hydrotalcite have demonstrated increased stability in catalysis because of their strong resistance to high temperatures and minimal formation of coke [449].
The use of K as a promotor is accompanied by several hazards, as shown in Table 9.
Coming into contact with solid potassium can lead to serious burns. Inhaling potassium fumes can cause irritation in the nose, throat, and lungs, leading to symptoms like sneezing and coughing. Continuous inhalation of K fumes can lead to lesions in the nasal passages. K is a chemical that is both flammable and reactive, which poses risks of fires and explosions [484].
Total K intake should not exceed the recommended amounts. In some cases, too much potassium may cause muscle weakness, confusion, irregular heartbeat, or difficulty breathing [485].
Signs related to neuromuscular dysfunction, such as weakness, paralysis, nausea, vomiting, and diarrhea, have been linked to the excessive intake of K. These symptoms do not always appear before dangerous cardiac arrhythmias occur [486].
The use of Ca as a promotor is accompanied by several hazards (Table 9).
Ca can react violently with H2O, steam, moisture, and strong acids, including hydrochloric, sulfuric, and nitric, to form flammable and explosive H2 gas. Finely divided calcium can ignite in air or in contact with halogens, including chlorine and fluorine [487].
Elevated levels of C in the bloodstream and urine can lead to weak muscle tone, impaired kidney function, decreased phosphate levels, constipation, nausea, weight loss, excessive fatigue, frequent urination, irregular heartbeats, and an increased likelihood of dying from heart issues [488].
The human body requires a large amount of C in CaCO3, not in its pure metallic state. Pure C is highly reactive with H2O and has the potential to cause damage to the tongue and esophagus [489].
CaCO3 is not highly toxic. On the other hand, elevated levels of Ca can lead to severe disruptions in heart rhythm, as well as the formation of kidney stones and harm to kidney function. Long-term excessive usage is typically more severe than a one-time overdose [490].
Three studies in the literature discussed the dangers linked to the utilization of Sr (Table 9).
Inhaling Sr can harm people. Skin and eye irritation may result from it. Extended contact with Sr can potentially impact the heart. High levels of Sr exposure can lead to accumulation in the bones and potentially impact their function [491].
Being exposed to high levels of radioactive Sr can lead to the development of cancer. Leukemia was present in individuals who were exposed to large doses of radioactive strontium. Lab animals also developed leukemia and cancers in their bones, nose, lungs, and skin [492].
Sr is non-combustible but produces flammable gas when exposed to H2O or moist air [493].
Four bits of data were found concerning the dangers associated with the use of Ce and its compounds (Table 9).
Ce is a solid substance that can easily catch fire (H228). It ignites due to friction and combusts in fiery situations. Under conditions of fire, it could potentially react with H2O and release H2 gas. Acid exposure can also produce H2 gas [494].
Exposure to CeO2 can lead to irritation of the eyes and damaged skin. It can also lead to lung irritation. These compounds have varying levels of toxicity, ranging from mild to moderate. In a study on animals, Ce2(CO3)3, CeF3, and CeO2 were found to not be immediately toxic, did not cause skin irritation, and caused only minimal irritation to the eyes. CeCl3 was found to be more toxic in terms of acute effects and was also a strong irritant to the skin [495].
A workplace exposed to Ce is mainly hazardous because of the presence of damps and gases that can be breathed in along with the air. This can result in pulmonary embolisms, particularly with prolonged exposure. Accumulation of Ce in the human body can pose a threat to the liver [496].
Ce NPs showed high levels of toxicity in all the toxicity tests performed (inhibition above 80% at low concentrations in the bioluminescence test and LC50 = 0.012 mg/mL in Daphnia magna assays) [497].
Four studies on the risks associated with utilizing La and its compounds were found (Table 9).
La can ignite when in contact with heat, sparks, or flames. It reacts strongly with acids and can also react with H2O during fire situations, producing flammable H2 gas in both scenarios. Normal handling and the use of solid forms of this material pose minimal health risks. Operations like grinding, melting, or welding can create dangerous dust or fumes that may be inhaled or come into contact with the skin or eyes [498].
La does not pass through the undamaged blood–brain barrier. Common side effects include mild to moderate feelings of sickness, frequent bowel movements, and gas [499].
The use of Fosrenol (La2(CO3)3) medication may cause serious stomach or bowel problems, including blockage or perforation (tear or hole) or severe constipation [500].
Fosrenol can cause blockage of the stomach, intestines, or rectum, which can be very dangerous. The risk is higher in persons with a history of changes to the digestive tract’s anatomy or constipation problems or who are taking medications that can also cause blockage [501].
Six studies in the literature discussed the risks linked to the use of Cr (Table 9).
Being exposed to Cr(VI) can lead to the development of work-related asthma, irritation and harm to the eyes, perforated eardrums, irritation of the respiratory system, damage to the kidneys and liver, congestion and swelling of the lungs, pain in the upper abdomen, irritation and harm to the nose, cancer of the respiratory system, irritation of the skin, and erosion and staining of the teeth. Certain employees may experience an allergic skin response known as allergic contact dermatitis. This is evident when working with liquids or solids that have Cr(VI), such as Portland cement. This type of dermatitis becomes prolonged and worsens with continued contact with the skin. Coming into contact with skin that is not whole can lead to the development of skin ulcers, also known as chrome ulcers. Crusted ulcers in chrome are lesions that are painless and have a pitted ulcer covered with fluid [502].
Continued exposure to Cr(VI) compounds via breathing raises the likelihood of developing lung, nasal, and sinus cancer. Contact with Cr(VI) compounds can lead to severe dermatitis and typically painless skin ulcers. Cr compounds can act as both sensitizers and irritants [503].
Exposure to different oxidation states of Cr results in varying levels of health hazards, with the metal form being less toxic and the hexavalent form being more toxic [504].
The process of Cr plating is linked to various dangers. Cr contains Cr(VI), which is a proven cancer-causing agent. Lead is used in the plating process and can be absorbed through the skin, potentially leading to liver, organ, and brain harm. Cyanide is extremely poisonous. It is utilized during Cr plating and has the potential to be lethal to humans. Additionally, the Cd utilized in the procedure has the potential to result in cancer as well as kidney and lung damage [505].
Cr is a significant pollutant found in many dangerous waste locations globally, such as the Superfund sites in the US [506].
Employees in sectors that utilize Cr have an increased likelihood of experiencing the negative health impacts associated with Cr [507].
Two bits of information were discovered in the literature regarding the utilization of Fe (Table 9).
Fe powder or dust is a solid material that can easily catch fire. It could result in irritation in the eyes and skin due to mechanical reasons. It could lead to abnormalities in the blood. It can also lead to injury in the lungs. Breathing in fumes can result in metal fume fever. It could lead to heart complications and harm the liver. Fe powder, if consumed, can lead to irritation in the gastrointestinal tract accompanied by symptoms such as nausea, vomiting, and diarrhea. Pancreatic damage, diabetes, and cardiac abnormalities can be caused by frequent exposure [508].
Excessive intake of Fe by humans can result in severe symptoms, liver damage, and potentially death. Symptoms progress through different stages, starting with vomiting, diarrhea, and abdominal pain. Liver failure may occur several days later [509].
Table 9. Hazards related to GSR.
Material CategorySubstanceInformation on HazardsRefs.
SubstrateC3H8O3Coming into contact with it can result in skin and eye irritation. Inhaling Glycerol-alpha-Monochlorohydrin may lead to irritation in the nose and throat, resulting in coughing and wheezing. Exposure to Glycerol-alpha-Monochlorohydrin may lead to nausea, vomiting, dizziness, lack of coordination, and potentially coma.
The mitigation of hazards comprises the following measures:
  • Avoid skin contact and eye contact with such material.
  • Wear protective clothing, gloves, and goggles.
  • Use a proper respirator during enhanced exposure to such a material.
[445]
It is flammable (H228) and emits irritating or toxic fumes (or gases) when exposed to fire.
The mitigation of hazards comprises the following measures:
  • It should not be used in the presence of open flames.
  • Wear protective clothing, gloves, and goggles.
  • Provide enough ventilation.
[446]
When taken by mouth, headaches, dizziness, bloating, nausea, and diarrhea might occur. When applied to the skin, it might cause redness, itching, and burning.[447]
Catalyst PtHighly fragmented Pt powder can ignite easily, explode, and emit toxic fumes when burned. Coming into contact with it may cause irritation to the skin and eyes. Inhaling it may cause irritation to the nose and throat. It could lead to a skin rash.
The mitigation of hazards comprises the following measures:
  • Avoid skin contact and eye contact with Pt.
  • Wear protective clothing, gloves, and goggles.
[454,455]
Pt powder is a flammable solid (H228).
Pt powder may react violently or explosively upon contact with H2O. It may be ignited by friction, heat, sparks, or flames. Its dust or fumes may form explosive mixtures in the air.
The mitigation of hazards comprises the following measures:
  • Wear protective clothing, gloves, and goggles.
  • Provide enough ventilation.
  • Eliminate all ignition sources (no smoking, flares, sparks, or flames).
  • Do not touch or walk through spilled material.
  • Stop the leak if you can do so without risk.
[456]
Pt coordination complexes are carcinogenic and genotoxic in mammalian and bacterial cells. [457]
RhIt is flammable when in dust or powder form, and toxic gases are generated during a fire. Breathing in Rh powder can have an impact on humans. Exposure to Rh powder may cause irritation to the skin and eyes. It has the potential to lead to a skin allergic reaction. If an allergy develops, even minimal future exposure can lead to itching and a skin rash.
The mitigation of hazards comprises the following measures:
  • Avoid skin contact and eye contact with Rh.
  • Wear protective clothing, gloves, and goggles.
  • Eliminate all ignition sources (no smoking, flares, sparks, or flames).
  • Provide enough ventilation.
[458]
All Rh compounds are highly toxic and carcinogenic. They stain the skin very strongly. They can be flammable. A dust explosion can occur if the Rh powder or granular form is mixed with air.
Mitigation of hazards:
In addition to those previously mentioned, do not allow the material to be released into the environment.
[459]
Rh, when not managed effectively, can have negative effects on both human health and the environment. Rh solutions, which include Rh2(SO4)3, can be harmful, causing skin and eye irritation and respiratory issues if breathed in.[460]
Rh is a catalyst and can result in a combustible and explosive danger when exposed to various organic and inorganic substances.
Mitigation of hazards: In addition to those previously mentioned, use local exhaust or breathing protection. Remove inappropriate substances from places with Rh present.
[461]
ReRe can lead to skin irritation. Its liquid state has the potential to inflict burns on the skin and eyes. Following consumption, it can lead to irritation in the digestive system. Inhaling it could result in irritation of the respiratory tract. [462]
If exposed to alcohol or similar organic substances, it could spontaneously combust. The Re dust can result in minor to moderate eye and skin irritation. Breathing in fine Re dust or fumes can cause irritation in the nose and lungs.
The mitigation of hazards comprises the following measures:
  • Avoid skin contact and eye contact with Rh.
  • Wear protective clothing, gloves, and goggles.
  • Provide enough ventilation.
  • Use proper respiratory protective equipment.
  • If used as a catalyst, keep the spent catalyst away from combustibles, as they can ignite.
[463]
Re is a flammable solid.
It is a physical irritant to the gastrointestinal tract.
The mitigation of hazards comprises the following measures:
  • Keeping away from heat, hot surfaces, sparks, open flames, and other ignition sources. No smoking is allowed (P210)
  • Grounding/bonding container and receiving equipment (P240).
  • Using explosion-proof electrical/ventilating/lighting/intrinsically safe equipment (P241).
  • Wearing protective gloves/protective clothing/eye protection/face protection (P280).
[464]
Re2O7 is an oxidizer, and its contact with combustible material may cause fire.
Its inhalation may lead to irritation of the respiratory tract. It may lead to irritation of the nose, throat, and lungs and potential chemical burns to mucous membranes.
If swallowed, it may lead to chemical burns in the mouth, throat, and digestive system.
When in contact with skin, it is a strong irritant and corrosive. It may result in intense irritation and chemical burns.
In contact with the eye, it is a corrosive substance and a powerful irritant. It may result in chemical burns to eye tissue and visual disturbances, including blindness.
The mitigation of hazards comprises the following measures:
  • Wear protective clothing, gloves, and goggles.
  • Provide enough ventilation.
  • Use proper respiratory protective equipment.
  • Remove combustible materials from contact with Re.
[465]
Pd When consumed, the body does not absorb Pd well. It can lead to irritation of the skin, eyes, or respiratory tract and can also cause skin sensitization. Liquid has the potential to inflict burns on the skin and eyes.
All compounds containing Pd are extremely harmful and can cause cancer. PdCl2 is poisonous and can cause harm if ingested, breathed in, or taken in through the skin. It results in harm to the bone marrow, liver, and kidneys of lab animals. It is irritating.
Low concentrations of Pd salts can eliminate the H2O hyacinth, while most plants can withstand levels under 3 ppm.
[466]
Powdered Pd is a solid that can catch fire easily (H228). It results in skin irritation (H315) and severe eye irritation (H319), possibly leading to respiratory irritation (H335).
The mitigation of hazards comprises the following measures:
  • P210: Avoid heat, sparks, open flames, and hot surfaces. Smoking is not allowed.
  • P280: Use protective gloves and eye protection.
  • P302+P352: If in contact with skin, rinse thoroughly with ample H2O.
  • P305+P351+P338: If in eyes, rinse carefully with H2O for a few minutes. Take out contact lenses if they are in place and simple to remove. Keep rinsing.
  • P312: Contact a poison center/doctor if you feel sick.
[467]
Solid-state Pd alloys are typically considered non-hazardous. Nonetheless, if the procedure includes grinding, melting, cutting, or any other method that results in the emission of dust or fumes, dangerous quantities of airborne particulates may be produced.
Contact dermatitis can be caused by Pd alloy.
In case of dust or fume generation, the following measures should be taken:
  • Wear protective clothing, gloves, and goggles.
  • Use a proper respirator during enhanced exposure to such a material.
  • Provide enough ventilation.
[468]
Pd powder can catch fire when coming into contact with air, especially if there is adsorbed H2 present. It easily ignites flammable solvents when they are exposed to air.
Pd can catch fire easily in the form of fine powder or dust. Many of Pd’s compounds act as oxidizing agents, and others can react explosively with organic materials.
Pd exhibits high toxicity over an extended period and at the cellular level in the liver and kidney. Elevated levels of Pd can be toxic and potentially cancer-causing for mammals.
Long-term exposure to Pd particles found in dust can cause harmful impacts on the blood and respiratory systems. With Pd/C catalysts, the finely divided carbon can cause irritation to mucous membranes and the upper respiratory tract. Pd/C catalysts with absorbed H2 can ignite easily, especially when devoid of moisture and exposed to high temperatures. Catalysts prepared by reducing CH2O are not as pyrophoric as those reduced with H2. C in a fine powder form has the potential to cause a dust explosion.
Catalysts made on supports with a large surface area are very effective and easily ignite mixtures of H2/air and solvent/air. CH3OH is highly volatile, which makes it prone to easily catch fire. The introduction of a catalyst into a H4B solution could lead to the combustion of the released H2.
[469]
Ru All Ru substances are extremely poisonous and can cause cancer. They leave a very intense stain on the skin. Ru that is consumed is firmly held in bones. RuO4 is extremely dangerous and easily evaporates, so it should be stayed away from.
Mitigation of hazards: Avoid the ingestion of Ru and its contact with skin and eyes.
[470]
Ruthenium is a solid substance that can easily catch fire (H228).
The mitigation of hazards comprises the following measures:
  • P210: Avoid heat/sparks/open flames/hot surfaces. Prohibit smoking.
  • P240: Ground/bond the container and receiving apparatus.
  • P241: Employ explosion-proof electrical, ventilation, lighting, and equipment.
  • P280: Use protective gloves/protective attire/eye safety/facial protection.
  • P370 + P378: In the event of a fire, utilize dry sand, dry chemicals, or alcohol-resistant foam for extinguishing.
[471]
Ir Ir is very combustible. It might lead to irritation in the eyes. When consumed, it can lead to irritation of the gastrointestinal system.
The mitigation of hazards comprises the following measures:
  • P210: Avoid heat, hot surfaces, sparks, open flames, and other sources of ignition. No tobacco use.
  • P305 + P351 + P338: In case of contact with eyes, gently rinse with H2O for several minutes.
  • Take out contact lenses if they are in place and simple to remove. Keep rinsing.
[472,510]
Extracting and processing Ir has negative impacts on the environment.
Ir extraction and processing have a negative impact on ecosystems and add to carbon emissions.
The mitigation of hazards comprises the following measures:
  • Recycling is a method to reduce the effects of Ir shortage. As the catalyst employed in electrolysis does not get exhausted, when the electrolyzer has completed its lifespan, the Ir can be retrieved and utilized in future uses.
  • It is essential to reduce or fully remove the use of Ir in electrolyzers by choosing/studying alternative catalyst materials that offer comparable performance to Ir but at a reduced cost and greater availability to substitute Ir in traditional electrolyzers.
[473]
CoComing into contact with Co dust can cause irritation to the skin, eyes, nose, and throat. Co may trigger an asthma-like allergic reaction, leading to asthma attacks characterized by difficulty breathing, wheezing, coughing, and chest tightness upon subsequent exposure. Co may impact the heart, thyroid, liver, and kidneys.
The mitigation of hazards comprises the following measures:
Limit or avoid contact with Co in all forms.
In case of Co dust generation, take the following measures:
  • Wear protective clothing, gloves, and goggles.
  • Provide enough ventilation.
  • Use proper respiratory protective equipment.
[474]
Excessive amounts of inorganic Co can lead to considerable toxicity. Infrequent occurrence of acute toxicity can be attributed to the excessive intake of nutrients.
Mitigation of hazards: Avoid excessive intake of nutrients with Co.
[475]
Soluble Co salts have a negative impact on cell division, permanently attach to nucleic acids in the nucleus, cause chromosome abnormalities in plants, and show mild mutagenic effects in certain in vitro tests with cultured animal cells, bacteria, and yeast.[476]
CuConsuming high levels of Cu can result in serious health issues, including kidney and liver damage. Inhaling Cu dust, sprays, or crystals can result in nasal and throat irritation, as well as lead to dizziness and headaches.
The mitigation of hazards comprises the following measures:
  • Consistently clean or flush the Cu pipe system to reduce the amount of Cu that enters the H2O. Avoid using acidic H2O. Test whether H2O is acidic or whether copper concentrations in H2O are elevated.
  • Keep copper powders, crystals, or dusts securely stored away from children, pets, or other adults.
  • Keep an eye on Cu consumption if an intake via dietary supplements with Cu is increased to ensure that the recommended amount is not exceeded.
  • When handling Cu, wear the required protective clothing and equipment and consistently adhere to safety protocols.
[477]
Highly fragmented Cu can ignite or burst in the presence of O2.
Toxic fumes are generated during a fire.
Exposure to Cu powder may cause skin and eye irritation and burns.
Breathing Cu can lead to irritation in the nose and throat, possibly resulting in a sore or perforation in the septum of the inner nose. Cu can lead to headaches, nausea, vomiting, diarrhea, and abdominal pain. Exposure to Cu can result in a flu-like sickness known as “metal fume fever”. Cu has the potential to trigger a skin allergy and impact the functioning of the liver and kidneys.
The mitigation of hazards comprises the following measures:
  • Avoid contact with Cu fumes and oxides.
  • Remove oxidizing agents from contact with Cu powder.
  • Provide enough ventilation.
  • When handling Cu powder, wear the required protective clothing and equipment and consistently adhere to safety protocols.
[478]
Being exposed to increased levels of Cu can be damaging. Prolonged exposure to Cu dust can lead to irritation of the nose, mouth, and eyes, as well as headaches, dizziness, nausea, and diarrhea.
It is necessary to avoid prolonged exposure to Cu dust.
[479]
Excessive consumption of Cu regularly can lead to liver damage, abdominal pain, cramps, nausea, diarrhea, and vomiting. Cu toxicity may develop in individuals with Wilson’s disease, an uncommon genetic condition.
The level of Cu in diet should be controlled and Cu overdosing is prohibited.
[480]
Cu does not degrade in the environment, leading to its accumulation in plants and animals from the soil. Only a few plants can thrive on Cu-rich soil. Hence, the presence of Cu-disposing factories restricts plant diversity in the surrounding area.
It is necessary to systematically control the Cu level in the soil.
[481]
NiThe activated catalyst Raney Nickel in a 50% slurry of H2O can spontaneously combust, leading to a potential fire risk (H251). It can result in a skin allergy (H317). There are suspicions that it may lead to cancer (H351). It can also harm organs with long-term or repeated contact (H372). Harming aquatic organisms with lasting consequences (H412) is detrimental.
The mitigation of hazards comprises the following measures:
  • P201: Obtain special instructions before use.
  • P235: Keep cool.
  • P280: Wear protective gloves/protective clothing/eye protection/face protection.
  • P302 + P352: In case of contact with skin, wash with plenty of soap and H2O.
  • P308 + P313: If exposed or concerned, seek medical advice/attention.
  • P420: Store separately.
[482]
Promotor KComing into contact with solid K can result in serious burns. Inhaling K fumes can cause irritation to the nose, throat, and lungs, resulting in sneezing and coughing. Extended exposure to K fumes can lead to ulcers in the inner nasal passages. K is a chemical that is both flammable and reactive, posing risks of fire and explosions.
The mitigation of hazards comprises the following measures:
  • Remove oxidizing agents and H2O from contact with K.
  • Provide enough ventilation.
  • Avoid skin contact and eye contact with K.
  • When handling Cu powder, wear the required protective clothing and equipment and consistently adhere to safety protocols.
[484]
In some cases, too much K may cause muscle weakness, confusion, irregular heartbeat, or difficulty breathing.
The K level in the diet should be controlled.
[485]
Excessive consumption of K led to issues with neuromuscular functioning such as weakness, paralysis, nausea, vomiting, and diarrhea. These symptoms do not always appear before life-threatening heart rhythm disturbances.
K overdosing is prohibited.
[486]
CaCa can have an explosive reaction with H2O, steam, moisture, and potent acids like hydrochloric, sulfuric, and nitric, resulting in the production of flammable H2 gas. Finely powdered Ca can catch fire when exposed to air or when coming into contact with halogens such as Cl and F.
The mitigation of hazards comprises the following measures:
  • Avoid Ca powder contact with air, Cl, and F.
  • Avoid Ca contact with H2O, steam, moisture, and potent acids.
  • When handling Ca powder, wear the required protective clothing and equipment and consistently adhere to safety protocols.
  • Provide enough ventilation.
[487]
High levels of Ca in the bloodstream and urine can lead to weak muscle tone, impaired kidney function, decreased phosphate levels, constipation, nausea, weight loss, severe fatigue, frequent urination, irregular heartbeats, and a significant risk of heart disease-related death.[488]
The human body requires an abundance of Ca in CaCO3, rather than in its pure metallic state. Ca reacts vigorously with H2O and can be harmful to the tongue and esophagus due to its corrosive nature.
It is necessary to avoid direct Ca contact with the tongue and esophagus.
[489]
Elevated levels of Ca can result in severe disruptions in heart rhythm, as well as the formation of kidney stones and the impairment of kidney function. Repeatedly using something for a long time can have worse consequences than taking too much of it at once.
It is necessary to avoid the overconsumption of Ca and CaCO3.
[490]
Sr Inhaling Sr can have an impact on humans. It has the potential to irritate the skin and eyes. Extensive exposure to strontium could impact the heart. High levels of Sr exposure can lead to accumulation in the bones and potentially impact their functionality.
The mitigation of hazards comprises the following measures:
  • Avoid elevated levels of Sr exposure.
  • Avoid contact between Sr and H2O.
  • When handling Sr, wear the required protective clothing and equipment and consistently adhere to safety protocols.
[491]
Exposure to significant levels of radioactive Sr may cause cancer. Leukemia has occurred in humans exposed to substantial amounts of radioactive Sr. Leukemia and cancers of the bone, nose, lung, and skin also occurred in laboratory animals.
It is necessary to avoid elevated levels of radioactive Sr.
[492]
Sr does not burn but produces flammable gas when exposed to H2O or moist air.
It is necessary to avoid Sr contact with H2O or moist air.
[493]
CeCe is a solid that can easily catch fire (H228). It ignites via friction and combusts in fire situations. It could potentially release H2 gas when exposed to H2O during a fire situation. Exposure to acids can produce H2 gas.
The mitigation of hazards comprises the following measures:
  • Do not allow material to be released into the environment.
  • Avoid heat, sparks, flames, and exposure to H2O or moist air.
  • Use suitable respiratory and protective gear.
  • Steer clear of touching skin and eyes.
  • Steer clear of inhaling dust or smoke.
  • Remove all sources of fire.
  • Isolate the spill zone.
[494]
Contact with CeO2 can lead to irritation of the eyes and abraded skin. It can also lead to irritation of the lungs. Compounds of Ce2(CO3)3 display varying degrees of toxicity, ranging from mild to moderate depending on the specific compound. In an animal study, Ce2(CO3)3, CeF3, and CeO2 did not show acute toxicity, exhibited no dermal irritation, and caused minimal eye irritation. CeCl3 showed higher acute toxicity and caused intense irritation to the skin.
The mitigation of hazards comprises the following measures:
  • Use suitable respiratory and protective gear.
  • Keep away from skin and eyes.
  • Avoid inhaling dust or fumes.
  • Remove all sources of flames. Avoid sparks, heat, and fire.
  • Isolate and contain the spill zone.
  • Utilize an appropriate respirator in the presence of elevated concentrations.
  • Wear safety goggles, impermeable gloves, and appropriate protective clothing as required.
  • Manage under a dry inert gas like argon. Ce metal must be kept in well-sealed containers within argon or mineral oil.
[495]
Ce is particularly hazardous in the workplace because of the presence of vapors and gases that can be breathed in along with air. This could lead to pulmonary embolisms, particularly with prolonged exposure. Accumulation in the human body can pose a threat to the liver.
It is necessary to provide enough ventilation and avoid prolonged exposure to Ce and contact Ce with H2O.
[496]
Ce NPs showed high toxicity in all toxicity tests performed (more than 80% inhibition at low concentrations in the bioluminescence test and an LC50 of 0.012 mg/mL in Daphnia magna assays).
It is necessary to avoid the intake of CE NPs.
[497]
La La can become inflammable when exposed to heat, sparks, or flames. It reacts vigorously with acids and may react with H2O under fire conditions, in each case releasing flammable H2 gas. In regular use and handling, solid forms of this substance pose minimal health risks. Additional actions like grinding, melting, or welding can create dangerous dust or fumes that may be breathed in or contact the skin or eyes.
The mitigation of hazards comprises the following measures:
  • Use suitable respiratory and protective gear.
  • Steer clear of contact with skin and eyes.
  • Steer clear of inhaling dust or smoke.
  • Remove all ignition sources.
  • Secure the area affected by the spill.
  • Do not permit entry into drains or discharge into the environment.
[498]
La cannot pass through the unbroken blood–brain barrier. The most frequent negative reactions include slight to moderate nausea, diarrhea, and flatulence.
The La amount in the human body should be controlled, and La overdosing and excessive exposure to La are prohibited.
[499]
The use of Fosrenol (La2(CO3)3) medicine may cause serious stomach or bowel problems, including blockage or perforation (tear or hole) or severe constipation.
The use of Fosrenol should be controlled, and its overdosing is prohibited.
[500]
La compound (Fosrenol) can cause blockage of the stomach, intestines, or rectum, which can be very dangerous. The risk is higher in people with a history of changes to the digestive tract’s anatomy or constipation problems or who are taking medications that can also cause blockage.
The use of Fosrenol should be controlled and carefully selected for each individual.
[501]
CrExposure to Cr(VI) can lead to occupational asthma, eye irritation and damage, perforated eardrums, respiratory irritation, kidney damage, liver damage, pulmonary congestion and edema, upper abdominal pain, nose irritation and damage, respiratory cancer, skin irritation, and erosion and discoloration of the teeth. Some employees may experience an allergic skin reaction known as allergic contact dermatitis. This is evident when dealing with liquids or solids that contain Cr(VI), such as Portland cement. This dermatitis persists for a long time and becomes more intense with frequent contact with the skin. Skin ulcers (chrome ulcers) can be caused by contact with damaged skin. Ulcers on the skin caused by chromium are characterized by crusty, painless sores with a depressed center filled with fluid.
The mitigation of hazards comprises the following measures:
  • Provide enough ventilation.
  • When handling Cr(VI), wear the required protective clothing and equipment and consistently adhere to safety protocols.
  • Limit or avoid exposure to liquids or solids that contain Cr(VI).
[495]
Long-term exposure to Cr(VI) compounds increases the likelihood of developing cancer in the lungs, nasal passages, and sinus cavities. Contact with Cr(VI) compounds can lead to severe dermatitis and typically painless skin ulcers. Cr compounds can act as both sensitizers and irritants.
It is necessary to avoid long-term exposure to Cr(VI) compounds.
[503]
Exposure to different oxidation states of Cr results in varying levels of health hazards, with the metal form being less toxic and the hexavalent form being highly toxic. [504]
The process of Cr plating involves certain risks. Cr contains carcinogenic Cr(VI). The plating process involves Pb, which has the potential to be soaked up through the skin and leads to harm to the liver, organs, and brain. Cyanide is extremely poisonous. It is utilized in the process of Cr plating and has the potential to be lethal to humans. Additionally, Cd utilized during the procedure has the potential to induce cancer as well as issues with kidney and lung functionality.
The mitigation of hazards comprises the following measures:
  • Provide enough ventilation.
  • Use proper protecting respiratory equipment.
  • When dealing with Cr plating, wear the required protective clothing and equipment and consistently adhere to safety protocols.
  • Avoid exposure to toxic cyanide.
[505]
Cr is a significant pollutant found in numerous toxic waste locations globally, such as the Superfund sites in America. [506]
Employees in sectors that utilize Cr are more likely to experience the negative health impacts of the element.
It is necessary to avoid excessive exposure to Cr(VI) compounds
[507]
FeFe powder or dust is a solid that can catch fire easily. It can lead to irritation of the eyes and skin by mechanical means. It can result in abnormalities in the blood. It can also lead to harm in the lungs. Breathing in Fe fumes can lead to metal fume fever. It can lead to heart issues and harm the liver. The ingestion of Fe powder can result in gastrointestinal irritation accompanied by symptoms like nausea, vomiting, and diarrhea. Continuous exposure can lead to damage to the pancreas, diabetes, and abnormal heart function.
The mitigation of hazards comprises the following measures:
  • Avoid heat, sparks, open flames, and hot surfaces. Smoking is prohibited.
  • Ground/bond the container and receiving devices.
  • Utilize electrical, ventilating, and lighting equipment that is explosion-proof.
  • Use protective gloves/protective attire/eye safety gear/face shields.
[508]
Excessive intake of Fe by humans can lead to serious symptoms, liver damage, and possibly death. Signs progress via different stages, starting with vomiting, diarrhea, and abdominal pain. Liver failure may manifest itself several days after the initial onset.
It is necessary to control Fe levels in the diet, and Fe overdosing is prohibited.
[509]
Most information about hazards accompanying GSR is related to Pt, Rh, Re, Pd, and Cu catalysts and Cr promotors. Surprisingly, although Ni-based catalysts have been reported as the ones most often applied in reforming reactions, little information was found about hazards related to their application.
Silva et al. [444] noticed that the GSR technique can effectively transform C3H8O3 into H2, primarily because its scaling up necessitates minimal alterations to existing industrial methods of H2 generation from fossil fuels, which predominantly rely on SR. To improve H2 production through the GSR process, selecting a suitable catalyst is essential. Ni and precious metals such as Pt and Ru have been extensively researched. Although Ni catalysts are less expensive, noble metals exhibit higher activity and stability, enabling operations at reduced temperatures. However, many efforts have been dedicated to finding Ni-based catalysts that match the performance of noble metal materials. The impact of catalyst supports should also be acknowledged, as neutral supports (e.g., SiO2) exhibit greater stability and reduced C deposition. Employing promoters might also be essential to enhance the stability of the catalyst, which is a crucial concern in this area. Therefore, additional studies need to be conducted in this field, particularly focusing on the quest for stable and low-temperature active Ni-based catalysts.
Various mechanisms have been suggested for the GSR reaction (e.g., the Langmuir–Hinshelwood dual-site mechanism involving the molecular adsorption of C3H8O3 and the molecular or dissociative adsorption of H2O). Nonetheless, an agreement on this issue has not been achieved; thus, additional research is necessary. Additionally, because the GSR reaction significantly encourages the creation of carbonaceous deposits, the investigation of coke deposition kinetics has been conducted, with the authors proposing that a Langmuir–Hinshelwood single-site mechanism with the dissociative adsorption of C3H8O3 and molecular adsorption of H2O can explain the coke deposition on a Co-Ni/Al2O3 catalyst. Nevertheless, greater attention on this topic is necessary, as well, to reveal the potential presence of various mechanisms of coke deposition on different types of catalysts.
Even when an effective catalyst and advantageous operating conditions are employed in catalytic GSR within a traditional reactor (e.g., fixed-bed reactor), thermodynamic constraints regarding C3H8O3 conversion and H2 yield remain. To circumvent these limitations, enhanced processes that merge the GSR reaction with the selective removal of CO2 or H2 in a single physical device have emerged as a superb alternative. It has been noted that eliminating CO2 or H2 from the reaction medium moves the thermodynamic equilibrium toward increased C3H8O3 conversions and elevated H2 yields. Furthermore, these processes enable operation at reduced temperatures while achieving comparable or even superior performance compared to traditional reactors at elevated temperatures. Nevertheless, for these processes to be effectively implemented, it is essential to utilize CO2 sorbents that possess strong sorption capacity, stability, and low sorption and regeneration temperatures (e.g., 300–500 °C), alongside H2 perm-selective membranes that demonstrate high H2 selectivity and permeability, as well as significant resistance to embrittlement and poisoning. Currently, hydrotalcite-derived CO2 sorbents (which need reduced sorption and regeneration temperatures) and Pd-based membranes are regarded as potential systems for Sorption-Enhanced Glycerol Steam Reforming (SEGSR) and GSR in MRs, respectively, at lower temperatures (300–400 °C). Furthermore, suitable operating conditions (temperature, H2O/C3H8O3 Feed Ratio (molar) (WGFR), pressure, and Weight Hourly Space Velocity (WHVS)) must be meticulously selected. CO2 emissions can be readily mitigated through SEGSR, but MRs utilizing H2 perm-selective membranes are ineffective in this regard.
Carrero et al. [483] noticed in some reports that adding promoters such as Zr, Ce, and La to Ni-based catalysts can alter the size and distribution of metallic particles, thus affecting their catalytic efficiency in ethanol SR. La2O3 might inhibit metal sintering and reduce coke buildup because oxycarbonate compounds such as La2O2CO3 can interact with C deposits, releasing CO and regenerating La2O3. CeO2 is utilized as a promoter because of its redox characteristics and significant O2 mobility, which can diminish C deposits in SR processes [19]. The inclusion of ZrO2 in the Ni/Al2O3 catalyst demonstrated its ability to prevent metal sintering when exposed to H2O at elevated temperatures; furthermore, ZrO2 enhances steam adsorption, facilitating the transfer of steam from the support to the active metallic sites, which improves the GA of surface hydrocarbons and/or C deposits. Due to the reasons stated above, numerous studies have documented the addition of Ce, Zr, and La to Ni-based catalysts applied in ethanol SR. Nonetheless, the promotional effects of Ce, Zr, and La on Co/SBA-15 samples have been rarely examined. These altered cobalt catalysts have been utilized before in Fischer-Tropsch synthesis, CH3OH decomposition, and benzene oxidation, yet there are no citations regarding their application in GSR.
Carrero et al. [483] examined GSR on Co/SBA-15 and enhanced Co/M/SBA-15 (M: Ce, Zr, La). They found that the addition of promoters such as Zr, Ce, and La on an SBA-15 support, followed by Co impregnation, resulted in smaller Co crystallites, enhancing metal dispersion. In addition, more robust interactions between Co species and M/SBA-15 supports were noted. Due to the inclusion of Zr, La, and primarily Ce, the enhanced catalysts exhibit greater C3H8O3 conversion compared to Co/SBA-15 over 5 h of operation. Moreover, at 600 °C, Co/M/SBA-15 (M: Zr, Ce, or La) catalysts generate greater quantities of H2 compared to Co/SBA-15.
Ghasemi et al. [32] stated that further investigation is required to minimize CO2 emissions and production expenses in the SR process. Economic challenges to SR involve expenses related to the process and catalysts. The enhanced efficiency and prolonged lifespan of the precious metal catalyst must offset the higher cost of each catalyst to tackle these challenges. Additionally, increasing the size of the plant will lead to greater Capital Expenditures (CAPEX) but significantly reduced H2 production expenses.

4.4. Electrochemical Methods

Various methods for transforming biomass into H2 through low-temperature electrochemical conversion have been established [511]. H2 production through electrochemistry from biomass can be accomplished by electro-reforming oxygenated organic compounds [65].
Zhao et al. [512] have shown that merging green H2 production with raw biomass electro-reforming is an effective and scalable approach to resource recovery. H2 can be generated electrochemically from various biomass sources, including agricultural crop remains, forest byproducts, organic municipal solid waste, and animal byproducts [513].

4.4.1. Water Electrolysis

As biomass is composed of H2O in different percentages, H2O can be considered an instance of biomass. Water electrolysis (WE) is a technique for generating H2 from biomass at lower temperatures. It is among the most thoroughly studied techniques [282]. The transformation of biomass into H2 via low-temperature electrolysis has recently attracted interest as an expanding area of research. WE qualifies as a low-C H2 production technique only when most of the electricity powering the electrolyzer is sourced from renewable energy, including hydro, wind, or solar power plants, with related GHG emissions not exceeding approximately 60 g CO2eq/kWh [514].
According to [515], there are two techniques for pure H2O, including alkaline water electrolysis and solid oxide electrolysis.
Alkaline water electrolysis, operating at a commercial scale, is a well-recognized technique where the dimensions of the plant and its specific traits dictate the investment expenses for this process. In 2012, the estimated production expense for such a method was 3.48 USD/kg in Germany and 5.56 USD/kg in the UK. Throughout this procedure, asbestos diaphragms and nickel components serve as electrodes. Consequently, additional research is required to substitute harmful asbestos with alternative environmentally friendly materials [515].
Solid oxide electrolysis presents a highly promising technological approach for effective and widespread H2 production at a large scale. This method works at temperatures ranging from 500 to 850 °C, using H2O as steam. Water splitting is an endothermic reaction, and as the temperature increases, reduced power and voltage are required for dissociation. This method demonstrates great efficacy, lasting stability, low emissions, and an affordable operating cost. The elevated operating temperature is the primary disadvantage, as it leads to longer startup periods and issues with mechanical and chemical compatibility. Additionally, the degradation of electrode polarization resistance presents another challenge at elevated current densities. Investigations must be conducted to reduce these problems in this procedure [515].
During WE (both in alkaline water electrolysis and solid oxide electrolysis), H2O is converted to O2 and H2 at a molar ratio of 1:2 [515].
Excessive O2 can reduce human breathing and heart rate to perilous levels. Excessive O2 may result in O2 toxicity or O2 poisoning [516].
Inhaling pure O2 under high pressure may lead to symptoms like nausea, dizziness, muscle spasms, vision impairment, convulsions, and unconsciousness [517].
O2 can initiate or enhance a fire since it acts as an oxidizing agent.
O2 stored in a tank under pressure can explode if heated.
Exposure to quickly expanding gas can lead to burns or frostbite.
The mitigation of hazards comprises the following measures [518]:
  • Minimize contact with pure O2.
  • Stay away from gas that is expanding quickly. Proper protective gear and attire are essential in the event of exposure.
  • Attempt to heat the frozen areas and obtain medical assistance.
  • Avoid contact with garments and other flammable substances. Ensure that reduction valves, valves, and fittings are kept clean and free of oil and grease.
  • If it is safe, stop the leak in the event of a fire.
  • Shield storage devices from direct sunlight. Keep in a location with good air circulation.
WE is in the commercialized stage, and its cost is 10.3 USD/kg. The process drawback is high capital cost, where the electricity cost is about 80%. A remedy for this is electricity generation from renewable sources. The process efficiency is in the range of 60–80% [519,520,521].
Also, according to [67], biomass can undergo electrochemical conversion. However, the anode reaction is what sets WE apart from biomass electrolysis. Rather than producing gaseous O2 from H2O, the raw material is oxidized. MECs and proton exchange membrane electrolysis cells (PEMECs) are two methods that can be employed to electrolyze biomass [67].
For bio-derived substances like ethanol and C3H8O3, both proton exchange membrane electrolysis cells (PEMECs) and microbial electrolysis cells (MECs) are commonly employed. Electrolysis cannot directly convert polymeric materials like cellulose or wood sawdust. These systems require one or two chambers with an anode/cathode connection. At the anode, organic material undergoes an oxidation process that produces protons (H+). At the cathode, a reduction reaction takes place, allowing H2 generation [67].

4.4.2. Microbial Electrolysis Cells

Microbial electrolysis cells (MECs) consist of an anode and cathode, separated by an ion exchange membrane. In comparison to other electrolysis techniques, it requires significantly less energy and generates a high H2 yield [515].
This method merely involves the generation of H2 via the catalytic activity of microorganisms. Active bacteria facilitate the liberation of protons, electrons, and CO2 from organic substances throughout this process [193]. This technology operates within microbial electrolysis cells (MECs). By utilizing this technology, the soluble organic substances in waste H2O can be converted into storable chemical energy, such as H2 [522]. Microbial electrolysis cells (MECs) utilize a low extra electric current to generate H2, alongside the energy and protons that microbes release when they decompose organic substances [513]. Exo-electrogenic microbes are capable of converting basic acetate and glucose into pure H2 gas. To surpass the thermodynamic obstacle of the electrolysis process, an external voltage needs to be applied to the electrolysis cell. Furthermore, the rate of H2 production continues to be restricted [523]. Improving the rates and outputs of H2 production from fermentation processes by employing different methods, including upgrading microbial strains, optimizing reactor systems, and identifying the most advantageous types of microorganisms to use, are significant fields of research and development [513]. Liu et al. [524] tackled the issue of enhancing rates and yields of H2 production from fermentation processes using several methods, including the optimization of reactor systems by incorporating a dynamic membrane into the anode electrode of the microbial electrochemical system (MES). In contrast to systems lacking dynamic membrane filtration, the incorporation of the dynamic membrane led to enhanced current densities, reduced effluent turbidity, better treatment efficiency, and energy production.
Microbial electrolysis can be accompanied by Cl generation. However, due to the anode’s capacity to generate Cl at an extremely low potential, there is no need to isolate the electrolyte from the Cl, which makes this process more energy-efficient compared to other H2O electrolysis techniques. Additionally, this procedure enhances safety since the pH level remains neutral and O2 production does not occur [525].
Cl is a non-flammable gas; in contact with H2O, it forms a HCl solution. Contact with Cl can cause severe irritation and burns of the skin and eyes and irritate the nose and throat. Inhaling it can irritate the lungs. Contact with liquid Cl can induce frostbite. Cl can trigger an allergy similar to asthma. Being exposed to Cl may result in headaches, dizziness, nausea, and vomiting. Continuous exposure might result in lasting lung harm [526].
The mitigation of hazards comprises the following measures [526]:
  • Avoiding areas with increased Cl concentration.
  • Controlling the Cl concentration in the air.
  • Ensuring the adequate ventilation of rooms.
  • Wearing appropriate protective clothing, gloves, respiratory masks, and goggles, especially in areas with increased Cl concentration.
Pt-, Ni-, and C-based catalysts are applied in microbial electrolysis units to enhance reaction kinetics, H2 production, and cleanliness [515].
Microbial electrolysis is in the developing stage. This process has an efficiency of 78 % [275].

4.4.3. Proton Exchange Membrane Electrolysis Cells

In the realm of proton exchange membrane water electrolysis cells (PEMECs), a durable polysulfonated membrane is utilized. The membrane electrode assembly is an essential part of the cell, comprising a cathode, an anode, and a membrane. Nafion® membranes are the most commonly utilized ones due to their mechanical strength, proton conductivity, and suitable gas permeability [515].
The H2 evolution reaction takes place at the cathode, whereas the O2 evolution reaction happens at the anode. Electrocatalysts for H2 evolution reactions are typically composed of Pt or Pt-based catalysts, whereas electrocatalysts for O2 evolution reactions are generally made of catalysts based on Ir or Ru. This method is regarded as the most favorable approach for generating clean H2, as a 1 MW PEM H2O electrolyzer can yield up to 6 m3/h of H2. Among its advantages are high efficiency, low operating temperatures, affordable maintenance expenses, high current density, straightforward design, and reduced gas permeability [515].
Nevertheless, due to the membranes’ reduced efficiency at elevated temperatures and their limited longevity, this method incurs significant catalyst expenses. Consequently, it is essential to identify membranes that are cost-effective and possess enhanced longevity by utilizing materials suitable for ongoing use [515].
Various catalysts can support various electrolysis techniques. Pt and Ir catalysts are utilized in proton exchange membrane (PEM) electrolysis to improve H2 production at the cathode and O2 generation at the anode reactions. Pt-based catalysts can enhance the efficiency of H2 production to 90.8% in PEMs. Catalysts reduce the energy needed to break H2O apart, thus enhancing the efficiency of H2 production. Ni-Mo-, Ni-Co-, and Fe-based catalysts are utilized in the electrolysis of alkaline H2O. Perovskite-based catalysts are currently under development for this approach, which provides excellent stability and performance. Ni- and perovskite-based catalysts are likewise utilized in solid oxide electrolysis, decreasing energy consumption and enhancing longevity. Co catalysts diminish the operating temperature ranges from 800 °C down to 500–600 °C in solid oxide electrolysis. These are also economical in comparison to the catalyst needed in the PEM procedure [515].

4.4.4. Projects on Electrochemical Techniques

Since biomass components can be transformed into H2 gas via electrochemical cells, choosing the right electrode materials is essential because they directly interact with the biomass-derived fuel and improve electrochemical reactions. Catalysts like Pt, Ni, or other metal compounds can enhance the speed and effectiveness of H2 evolution reactions. The kind and strength of an electrolyte solution influence electrochemical performance, impacting ion conductivity, reaction rates, and the stability of electrodes. Maintaining an optimal pH level is essential for maximizing the efficiency of bio-H2 production. A new chemical electrolytic conversion (CEC) method was created utilizing aqueous polyoxometalate (POM) as a catalyst. This method facilitates the direct release of H2 at low temperatures from natural biomass sources like cellulose, lignin, wood, and grass powder. The unprocessed biomass undergoes oxidation, and electrons move to POM molecules via heat or light exposure. Protons from biomass move to the cathode and get reduced to H2. The energy usage is merely 0.69 kWh per cubic meter of H2 at 0.2 A cm−2 [527]. Considering sustainability, this technology is highly energy-efficient as it operates at low temperatures, allows for various biomass sources, and requires minimal energy consumption. The selected catalyst, polyoxometalate in its H2O-soluble form, is an effective catalyst that can be investigated for additional methods of H2 production [265].
Another study investigated the GA of biomass in a fluidized-bed reactor utilizing Fe/CaO catalysts. The catalysts were created with different mass ratios to enhance the concentrations and yields of syngas. The Fe load notably influenced the composition, textural characteristics, and CO2 absorption abilities. The peak syngas production was obtained with an optimized mass ratio of Fe/CaO at 5%, 26.40 mol/kg of biomass, an 8.69 MJ/kg LHV, and a gasification efficiency of 49.15%. The characterization results also showed the emergence of a Ca2Fe2O5 phase, which was anticipated to enhance tar cracking by inhibiting CaO deactivation [528]. Nevertheless, this stage did not influence gasification and led to a decreased ability to absorb CO2. The gasification process examined in this study is not particularly efficient, although the Ca2Fe2O5 phase could effectively minimize undesired byproducts through tar cracking [183].
Hibino et al. [529] carried out a study to decrease energy usage by directly electrolyzing bread, sawdust, and rice husk at 150 °C. They produced H2 at the anode, designed without precious metals and featuring O2-functionalizing C. The catalytic activity was similar to that of conventional Pt/C anodes. Upon the addition of PO4, waste biomass underwent hydrolysis, enhancing electrolysis. The average yield was 0.25 mg per mg of feedstock. This indicates that traditional noble metal anodes might be substituted with alternative anodes that can be self-produced, as commonly used noble metals such as platinum are costly. The constraints on the non-noble metal utilized could be mitigated by adding phosphoric acid to hydrolyze the biomass waste. The significant H2 output and economical approach suggest the feasibility of this process pathway.

5. Hazards Related to Separation and Purification of Hydrogen

Numerous research investigations have been conducted on H2 purification systems and continue to take place [530,531,532]. H2 purification methods can be physical, such as adsorption and membrane separation, as well as chemical, including catalysis and metal hydride separation [533]. Certain research indicated that absorption is a favored method because it operates at low temperatures and pressure [66,534]. Nonetheless, the expense associated with the purification process continues to be a challenge that needs to be tackled to utilize affordable membrane materials, for example. Research continues, for instance, with new adsorption materials and non-toxic metal hydrides to ensure cost-effectiveness and enhance application tolerance for H2 purification.
Shahbaz et al. [535] discussed biomass processing and conversion methods for H2 generation and analyzed membrane H2 separation systems. They reported that membranes, absorption, and adsorption such as pressure swing adsorption (PSA), temperature swing adsorption (TSA), electrical swing adsorption (ESA), and cryogenic technologies are often applied at an industrial scale for the separation and purification of H2 extracted from biomass.
Amin et al. [536] analyzed the problems and difficulties in separation technologies. Four key technologies, namely, membranes, adsorption processes, metal hydride (MH), and cryogenic processes, were analyzed and examined.
The membrane technology comprised polymeric, mixed-matrix membranes (MMMs), ceramic, zeolite, metallic, and carbon membranes. High performance requires an exceptional blend of permeability and selectivity. Additionally, stronger membranes that are thermally, chemically, and mechanically stable are needed for industrial separation processes. Therefore, polymeric membranes are not the ideal selection based on this criterion because of their inadequate thermal stability. MMMs face challenges with interfacial defects and filler agglomeration that must be resolved before their commercialization. The high production cost of ceramic membranes restricts their use on a commercial level. In the manufacturing of metal membranes, there is an issue related to the reduction in their permeability resulting from the elevated solubility of contaminants. The optimization of the metallic membrane (such as microstructure, heat treatment, and activation techniques) is a present concern that must be considered. Zeolite membranes, like carbon membranes, are fragile and challenging to manufacture. In every kind of membrane, the presence of impurities and multicomponent gas mixtures negatively impacts membrane efficiency, representing a significant constraint on membrane technology for purification [536].
Likewise, the adsorbents employed in adsorption processes possess a greater attraction for impurities (CO2, H2O, NH3, and light and heavy hydrocarbons) and can eliminate nearly all of them. Nonetheless, the primary difficulty lies in the elimination of CO and inert gases like N2 and Ar because of the limited adsorption ability of traditional adsorbents (zeolites and activated carbons). TSA is viewed as a promising method compared to PSA and VSA for enhancing recovery and purity; however, it requires more energy owing to the extra expense of the heating and cooling processes. In the MH process, it is essential to create catalyst-free systems to lower the expenses involved. Moreover, it demands significant heat transfer that diminishes the system’s efficiency. The cryogenic method is a well-established technology that has been functioning for numerous decades. It also includes challenges that require improvement, such as high capital costs and a low H2 purity of 95–98% [536].
Metal hydride reactors, utilizing various metal alloys, play a crucial role in the absorption and desorption processes for purifying H2 from contaminants, essential for maximizing reaction efficiency and attaining high purity levels. The requirements for heat and mass transfer are crucial factors to consider when designing a metal hydride reactor. The separation relies on various factors, such as the reaction kinetics, temperature, pressure of the hydride bed, enthalpy, and cycle time, among others. To address the challenge related to reaction kinetics, incorporating amorphous Ni-Li-B catalysts enhances the reaction kinetics of Al-based alloys [536].
The cryogenic technique is eco-friendly since it avoids chemicals, thus eliminating the generation of secondary pollutants. A significant disadvantage of this approach is its large capital and operational expenses [533,536].

6. Techno-Economic and Environmental Aspects of Renewable-H2 Production Technologies

The evaluation of various technologies used for renewable-H2 extraction from biomass necessitates the consideration of techno-economic aspects such as capital costs, H2 costs, production efficiencies, and technology readiness levels (TRLs) presented in Table 10 and of environmental impacts. For the latter, the Life Cycle Assessment (LCA) methodology for assessing the environmental effects of a product throughout its entire life cycle is commonly used.
Buffi et al. [537] evaluated various methods of H2 generation from biomass, including thermochemical ones (such as PY, liquefaction, and GA) and biological ones (including DbP and i-DbP, the biological WGS reaction, as well as PF and DF). They found that although certain pathways exhibit low TRLs, others, such as steam bio-CH4 and biomass GA, are ready for immediate market adoption.
Table 10. Comparison of different H2 production technologies.
ProcessFeedstockCapital Costs (M-EUR)H2 Cost
(EUR/kg)
Efficiency
(%)
TRLRef.
Biomass PYBiomass + Heat + Steam53.4–3.11.3–2.217–334–5[538]
Biomass GABiomass + H2O149.3–6.41.8–2.135–50 7–8[539]
HT GABiomass + Heat + Steam-1.5–3.270 2–3[540]
DbPSun + H2O + Algae50 USD/m22.1312.2 2–3[541]
i-DbPH2O + Algae135 USD/m21.424.1 2–3
DFBiomass + Anaerobic bacteria-2.5712 4–5
PFSunlight + Biomass-2.838.54–5
ElectrolysisH2O + Electricity-10.360–809[542]
MECWaste H2O + Electricity--67–90<5[542]
PEMECWaste H2O + Electricity--70–807–8 (9)[542]

6.1. Techno-Economical Aspects of Renewable-H2 Production Technologies

The cost of renewable H2 is linked to the technology used for production. In 2021, the levelized cost of H2 (LCOH) produced via NG SR was between 0.92 and 2.8 EUR/kg H2 [543]. According to [543], this method remains the most cost-effective way to produce H2 in many areas globally. The costs of producing green H2 are also connected to the renewable energy source. The estimated LCOH from CH4 SR in the Eurozone for 2022 was 5.7 EUR/kg H2. Various techno-economical aspects of renewable-H2 production technologies, including biological ones and thermochemical ones, have been evaluated in several studies. Hosseinzadeh et al. [544] performed a techno-economic and environmental impact evaluation of key H2 production methods, including dark fermentation, photo-fermentation, solid-state fermentation, microbial electrolysis cells (MECs), gasification, pyrolysis, and plasma processes. From a technological perspective, DF has demonstrated superior performance to other methods. Nonetheless, the combination of DF with PF and MECs has demonstrated superior performance, yielding approximately 1 L H2/g organic waste. In terms of the economic factor, the least expensive H2 production methods are GA and fermentation, costing roughly 2 USD/g and 2.3 USD/g, respectively, followed by plasma at 2.4 USD/g, PY at 2.6 USD/g, MECs at 2.8 USD/g, and PF at 3.5 USD/g. Regarding possible environmental effects, the fermentation method exhibited the least GHG output, measuring 15 kg CO2-eq/kg H2, followed by GA, MECs, and plasma. In terms of possible commercial uses, GA stands out as the most advanced, boasting the highest attainable technology readiness at level 9.

6.1.1. Biological Technologies

Han et al. [545] conducted a techno-economic evaluation of a H2 production method integrating solid-state fermentation with DF. They confirmed the economic viability of the method with a H2 production cost of 2.1 EUR/m3 H2, achieving a payback period of 5 years and an internal rate of return (IRR) of 20.2%.
Hosseinzadeh et al. [544] evaluated the mean H2 production from a DF pilot facility with a processing capability of 8-45 g H2/kg biomass, calculating it at 2.1 EUR/kg H2.
Alam and Nayan [546] introduced a simulation model for renewable-H2 production through the DF of waste-H2O sludge. Their research indicated that H2 can be generated from DF for 10.5 EUR/kg H2 for a biomass processing capacity of 23 t/day, which might be significantly reduced to 5.4 EUR/kg H2 by increasing the capacity to 500 t/day.
Anaerobic digestion (AD) for generating BG/bio-CH4 can facilitate the production of renewable H2 via the reforming of the resultant BG/bio-CH4. Szima et al. [547] calculated an LCOH of 0.15 EUR/Nm3 for a flexible H2 and electricity co-generation facility utilizing the dry reforming of bio-CH4 with minimal CO2 emissions.
A related technological approach to the joint generation of H2 and electricity was examined by Cormos et al. [548], confirming an LCOH expense of 58 EUR/MWh. The authors determined that capital expenses significantly affect LCOH, with BG expenses and plant availability factors following, whereas operating expenses have a lesser effect.
Hajizadeh et al. [549] investigated H2 generation from cow dung by combining psychrophilic AD and dry CH4 reforming. The procedure was refined to achieve the maximum CH4 conversion and the minimum energy usage. The authors’ economic analysis revealed that the cost of H2 production is influenced by the rate of H2 production, where increased production rates lead to reduced production costs. The optimal scenario was identified for a plant capacity of 45.5 kg/h H2, resulting in a H2 production expense of 1.28 EUR/kg H2.
Byun and Han [550] assessed the financial feasibility of employing the AD of food waste combined with bio-CH4 SR to produce renewable H2. The primary cost factor of the biodigester is its capital expense. This cohesive approach enabled a H2 minimum selling price (MSP) of 24.2 EUR/kg H2, influenced by the plant’s capacity. In the optimal scenario of a 2000 t H2/d processing capacity, H2 could be produced at an MSP of 5.5 EUR/kg H2, which is on par with fossil-based H2 production methods.

6.1.2. Thermochemical Technologies

The economic aspects of different biomass-to-biofuel scenarios were analyzed by Anex et al. [551], who concluded that H2 generated through biomass PY possesses the lowest production expense owing to its minimal capital operating cost of 0.53 EUR/kg H2.
Brown et al. [552] analyzed the techno-economics of fast PY of corn stover for H2 production and found that the costs of H2 production (1.9–2.8 EUR/kg H2) were higher than those in earlier studies.
Tan et al. [553] reported that H2 from biomass PY had a cost of 1.64 EUR/kg H2.
Lepage et al. [282] assessed the economic viability of various biomass-derived methods for H2 generation. As stated by these authors, conventional SR of NG seems to be the least expensive choice, with H2 production costs under 0.92 EUR/kg H2, while biomass PY could result in renewable-H2 production costs ranging from 1.17 to 2.37 EUR/kg H2. Generally, elevated H2 production costs (1.1–3.2 EUR/kg H2) occur.
Li et al. [554] examined the generation of H2 and biochar through the pyrolysis of corn straw. The writers indicated that expenses associated with biomass feedstock were the greatest (68%), followed by the costs of catalysts (12%). Employee wages and benefits made up 8% of the overall expenses, whereas electricity constituted 4% of the total costs. With an annual processing capacity of 40,000 tons of corn straw, a potential maximum profit of EUR 805 million and an IRR of 22% over 7.3 years were projected.
Salkuyeh et al. [555] examined the economic factors related to H2 production from biomass GA using two reactor setups: a fluidized bed (FB) and an entrained flow (EF). The authors additionally examined the impact of introducing C capture and liquefaction systems on the expenses associated with H2 production. FB gasification technology enabled a more economical process for H2 production, achieving a H2 MSP of 2.8 EUR/kg H2. The elevated H2 cost for the EF process (3.1 EUR/kg H2) resulted mainly from the increased CAPEX associated with this gasifier type. The incorporation of carbon capture and liquefaction systems caused H2 production expenses to rise by 3% and 11% for the FB and EF processes, respectively.
Shaikh et al. [556] employed an Aspen Plus simulation to evaluate the TEA of a biomass Ca looping GA combined cycle for the simultaneous production of H2 and electricity. The estimated cost of producing H2 was 2.2 EUR/kg H2, with an IRR of 17.43% and a payback duration of 7.35 years. The integrated H2–H2-electricity method seemed to be more financially viable than generating electricity.
Additional studies also examined the techno-economic viability of H2 produced from biomass gasification. For example, Wang et al. [557] indicated production cost rates of 0.9 EUR/kg H2.
Ellofy et al. [67] estimated that a common route for biomass GA and SR and/or WGS with a pressure swing adsorption system (PSA) needs 2.4 TJ of primary energy input per TJ of H2, and for a plant with a H2 output of 139–700 kg/day and a biomass cost of USD 46–80 /dry-ton, the H2 generation cost is in the range of USD 1.77–2.05 /kg.
Al-Qahtani et al. [558] analyzed the economic aspects of H2 generation from biomass GA, assessing the impact of C capture and storage (CCS) technology both in its presence and absence. The authors discovered that incorporating CCS led to a rise in LCOH from 2.2 to 3.4 EUR/kg H2.
Concerning HT processes, the financial assessment of H2 generated from the HTG of soybean straw found an MSP of 1.79 EUR/kg H2 [559].
Cook and Hagen [560] evaluated the economic aspects of three case studies (plants) for H2 production through biomass GA in the United States. The costs of biomass supply and the distance for H2 transportation were identified as the primary factors influencing total production expenses. The optimal situation indicated a minimum H2 transportation cost of 3.19 EUR/kg H2, potentially rising to 3.78 EUR/kg H2 in a less advantageous scenario.

6.1.3. Electrochemical Technologies

Tanyi et al. [561] evaluated the potential to develop a green H2 market in Ghana. The evaluation was focused on biomass GA and photovoltaic-driven WE. The authors estimated that distributed and centralized polymer electrolyte membrane (PEM) electrolysis gave levelized costs of USD 5.56/kg and USD 4.35/kg for H2, respectively, while centralized biomass gasification yields the cheapest H2 cost at USD 2.68/kg.
Shin et al. [562] examined, in an economic assessment, the combinations of three renewable power plant types, including offshore wind, onshore wind, and onshore photovoltaics, alongside two H2O electrolysis types: alkaline water electrolysis (AWE) and polymer electrolyte membrane water electrolysis (PEMWE). The LCOH calculation revealed that the onshore wind-power–AWE scenario presents the lowest LCOH at 7.25 USD/kg, whereas the PV-PEMWE scenario shows the highest LCOH at 13.44 USD/kg.
Vives et al. [563] examined the techno-economic viability of recovering waste heat from multi-MW-scale green hydrogen generation. A 10 MW proton exchange membrane electrolysis system was designed with a heat recovery mechanism integrated with an organic Rankine cycle (ORC) to facilitate the mechanical compression of hydrogen. The technical outcomes show that by utilizing waste heat recovery alongside an ORC, the first-law efficiency of the electrolyzer rises from 71.4% to 98%. The ORC can produce enough energy to compress hydrogen from the electrolyzer’s outlet pressure of 30 bars to 200 bars. A financial analysis was performed to determine the levelized cost of hydrogen (LCOH) of the system and evaluate the practicality of integrating the waste heat recovery with the ORC. The findings indicate that electricity costs are predominant in the LCOH. When electricity costs are low (e.g., dedicated offshore wind energy), the LCOH increases when applying heat recovery. The extra capital and operating expenses related to the ORC raise the LCOH, and these extra costs surpass the savings from eliminating electricity purchases for compression. Conversely, heat recovery and the ORC become appealing and viable when the prices of grid electricity rise.

6.2. Barrier to Commercialization of Renewable-H2 Production Technologies

The H2 economy faces several obstacles to its progress and successful commercialization. Recent information validates the enhanced efficiency, cost-effectiveness, and scalability of technologies for producing green H2. Additionally, the cost of green H2 has decreased significantly [564]. However, according to [565], the global expansion of such an economy faces multiple significant obstacles, such as the lack of a value chain for clean H2, challenges in H2 storage and transport, expensive production, the absence of international standards, and investment risks. H2 generated on a large scale via different methods faces specific techno-economic challenges. Table 11 (based on [32]) presents the obstacles of various H2 conversion TH methods limiting their commercialization. Table 12 (based on [32]) shows such obstacles for biological methods.

6.2.1. Technical Challenges

Barriers to the commercialization of H2 production include lower efficiency and increased costs relative to alternative methods [566]. The production of H2 via fermentation is steadily rising from its early phases as technology advances [567]. To boost the quantity and speed of H2 production, various strategies should be employed at both the genetic and fermentation stages. Through genetic engineering, strains specifically created for H2 production might be developed. The incorporation of H2 production processes enhances the overall efficiency of the entire procedure.
Inoculum pretreatments and increased energy use hinder the commercialization of the DF process. Before DF is brought to market, it is essential to research economic and technical viability to avert significant process hindrances [568]. The drawback of DF is its ability to produce only 4 mol H2/mol of glucose, which continues to pose a major challenge [201]. To ensure that a H2 process is commercially feasible, it is essential to enhance the complete process.
The main issues in thermochemical conversion for H2 production revolve around handling the raw materials and making them ready for subsequent processing. Table 11 illustrates the technological and financial challenges associated with the practical application of H2 TH conversion methods. The main objective of low-temperature GA systems is to produce tar through PY and GA.
The main obstacle in the commercial GA process is due to organic impurities in the produced syngas, resulting in considerable operational difficulties [569]. Moreover, external conditions and the requirement to sustain ideal temperatures within the gasifier, along with the efficient extraction of tar, present significant challenges. Additional challenges comprise inefficient feed delivery, excess metabolites present in reactors, and the reduced conversion efficiency of substrates when dealing with mixed organic waste. These difficulties arise either from the complex characteristics of the substrates or from the lack of microbial communities that can efficiently hydrolyze them [570].
Table 11. Obstacles of various H2 conversion TH methods limiting their commercialization. Based on [32].
Thermochemical Conversion Technical ObstaclesFinancial ObstaclesPotential Strategies for Overcoming These BarriersRef.
GA Energy usage Expense of CO2 [571]
SR--The improved efficiency and longer life of a precious metal catalyst balance the higher cost per catalyst unit experienced in the catalytic process.[572]
GAProblems like corrosion, fouling, and catalyst deactivation, along with the absence of broad industrial acceptance and standardization of the product, can impede the effectiveness of catalyst applications.The requirement for high temperatures leads to substantial capital and operational costs when executing certain procedures.Membrane reactors can improve the efficiency of thermochemical processes by using different H2-production methods.[573]
SCWG-The viability of a project depends on the financial factors related to obtaining algal biomass and the yield produced.Optimization plays a vital role in research to improve fuel production. When a payment is made from a carbon dioxide emitter to an algal conversion plant, the expense of H2 reduces.[413]

6.2.2. Financial Hurdles

The DF process is notably costly in biological H2 production, and much of the research takes place in laboratory settings. Table 12 emphasizes the challenges associated with both the technical and economic facets of various biochemical conversion methods for H2, especially regarding their advancement toward commercial feasibility. Addressing economic obstacles tied to creating affordable photobioreactors and enhancing photosynthesis in DbP and i-DbP are essential goals. A research investigation explored bio-H2 generation using an anaerobic membrane bioreactor, identifying that the main economic challenges are related to the high operational and installation costs, which in turn lead to reduced H2 outputs [574]. The economic assessment of photobiological H2 production is largely conjectural due to the inherently expensive nature of biological H2-production methods [575]. The rate of H2 production in photobiological processes is quite low, rendering it inappropriate for widespread applications. The total costs for H2 production via DF and PF methods were estimated to be between 2.5 and 2.8 USD/kg [180]. A study conducted by Sharma and Kaushik in 2017 indicated that USD 3.70 and USD 18.70 were spent on H2 production in DF and PF, respectively. DF H2 production is less economically feasible than NG reforming due to its higher costs [567].
Challenges in TC conversion processes arise from PSA (pressure swing adsorption) and expensive catalysts, resulting in higher costs for H2 production. While the purification of H2 adds extra costs to the process, it simultaneously lowers biomass expenses and enhances efficiency, resulting in a reduction in the total production costs for H2 [571].
Table 12. Technical and financial obstacles for various biological processes for H2 conversion limiting their commercialization. Based on [32].
Biochemical ProcessTechnical ObstaclesFinancial ObstaclesPotential Strategies for Overcoming Such BarriersRef.
DFEstablishing, constructing, operating, and managing an appropriate bioreactor.The primary factor impacting the expense of bio-H2 is the cost of substrates.Feedback inhibition decreases when dark fermentation and photo-fermentation are integrated.[566]
DFBecause pretreatment methods differ based on the feedstock, conducting pretreatment before fermentation poses a major challenge.Expensive process.Extensive, high-level research to overcome financial and technological challenges.[576]
ADVariations in H2 yield result from differences in biomass, process inhibition, bacteria that utilize H2, high levels of heavy metal ions, optimization challenges, and H2 storage issues.Cost of H2 storing as a liquid. The effectiveness of H2 production can be enhanced by incorporating chemical additives.[577]
DFThermodynamic limitations exist on the quantity of H2 generated through microbial fermentation, in addition to the design and operation of active bioreactors. The primary technological obstacle to the application of DF in practice is its restricted H2 production of 4 mol H2/mol of glucose.Elevated expenses associated with the raw materials.The extraction of energy from the substrate is enhanced when DF is combined with other energy-producing systems.[269]
The process of integrated DF and PF techniquesA key challenge in the pretreatment process is the presence of inhibitory chemicals. The substrate restricts one or both of the processes.Due to the harmful nature of waste-H2O treatment effluents, the costs of processing increase.
The expenses of the procedure are raised in a sequential reactor due to the reactor’s operation and upkeep.
The treatment of DF waste H2O leads to a rise in operating expenses.
Selecting appropriate H2 producers enhances the efficiency of H2 production through genetic or metabolic engineering in the integrated DF and PF process.[578]
PF-Increased production at a higher energy expense. The notable progress in the bio-H2 process can be counterbalanced by metabolic engineering.
By investigating the effects of nutrient restriction and substrate use, scientists discovered the chromosomal genes in microalgae that play a role in boosting H2 production.
Advancements in photobioreactor design should be performed with maximum efficacy.
[579]

6.3. Environmental Impacts of Renewable-H2 Production Technologies

Using the Life Cycle Assessment (LCA) methodology assessing the environmental effect of a product throughout its entire life cycle, an ICCT White Paper [580] assessed the GHG intensity of eight H2 production methods, encompassing biological processes using different feedstocks, along with TC and electrochemical approaches. The research emphasizes that H2 generated from the GA of forestry biomass and H2O electrolysis using renewable energy leads to reduced GHG emissions. On the other hand, H2 obtained from the reforming of bio-CH4, which comes from the AD of waste-H2O sludge or manure, can greatly lower GHG emissions, contingent on CH4 leaks throughout the bio-CH4 creation process. As anticipated, H2 derived from fossil fuels exhibits the greatest GHG intensities among the examined technological pathways, with values surpassing those of the fossil reference.
Camacho et al. [581] conducted an exhaustive LCA of a joint DF/AD waste H2O method for producing H2. The researchers investigated various feedstocks, such as wine molasses combined with wastewater treatment plant (WWTP) sludge, cheese whey, and sugar beet molasses. To establish the system boundaries, cradle-to-gate and gate-to-gate methodologies were utilized, and the subsequent impact categories were examined: CC—climate change; FE—fresh H2O eutrophication; FRS—scarcity of fossil resources; LU—land use; ME—marine eutrophication; TA—terrestrial acidification; TE—terrestrial environment toxicity; and WC—H2O usage. The ecological effect was influenced by the feedstock employed to produce H2. In the cradle-to-gate method and a Midpoint analysis, sugar beet molasses showed the most favorable environmental profile among the feedstocks evaluated, having a reduced impact in four of the eight categories examined. In comparison, cheese whey demonstrated the poorest relative environmental profile. H2 derived from wine molasses and WWTP sludge (9.13 kg CO2/Nm3 H2) and sugar beet molasses (3.56 kg CO2/Nm3 H2) resulted in a smaller C footprint compared to H2 from fossil fuels (12.08 kg CO2/Nm3 H2).
Barghash et al. [582] highlighted the advantages of utilizing solar energy to lessen the environmental impact of H2 production via DF. The GHG emissions for the procedure conducted with solar energy and without it were −1.12 × 10⁴ kg CO2-eq and 3.13 × 10⁴ kg CO2-eq, respectively.
Zheng et al. [583] employed LCA to examine the ecological effects of generating H2 via the fermentation of food waste. Electricity, H2 compression, and the transportation of food waste were the primary environmental factors. The H2 production method examined demonstrated reduced GHG emissions (10.1 kg CO2-eq) in comparison to traditional CH4 SR (10.6 kg CO2-eq) and H2O electrolysis (28.4 kg CO2-eq). The C footprint was greater compared to the gasification of poplar residues (1.5 kg CO2-eq). The LCA for biomass GA does not consider the emissions related to H2 compression.
Ma et al. [584] confirmed the beneficial impact of integrating CCS technologies with H2 production from gasifying corn straw, potentially resulting in negative GHG emissions.
Chen et al. [585] utilized LCA to assess the environmental efficiency of the solar-assisted hydrothermal GA of biomass in a H2 production pilot plant. The primary environmental contributor was the system operation, while the design of the solar concentrator accounted for 78% of the total global warming potential (GWP). Utilizing solar energy for heating rather than electricity led to a 90% decrease in environmental impact.
The environmental impact of biomass GA integrated with chemical looping for H2 production was assessed by Wu et al. [586]. Such a combined procedure was a viable solution to reduce GHG emissions associated with renewable-H2 production, supported by their negative GPW of −15.13 and −17.00 kg CO2-eq when employing air and O2 as gasifying agents, respectively.
Cormos et al. [587] assessed the generation of decarbonized green H2 using Ca-based sorption-enhanced biomass (sawdust) gasification. They discovered that the production of decarbonized green H2 through sorption-enhanced biomass gasification exhibits promising results, such as high overall energy efficiency (around 50%), minimized energy and economic penalties for nearly complete decarbonization (up to 8 net efficiency points), low specific carbon emissions at the system level (below 7 kg/MWh), and negative CO2 emissions for the entire biomass value chain (approximately −518.40 kg/MWh).
Biomass-based raw materials are often used to produce bio-H2 using DF and PF microorganisms. However, they often require purification, and while the impact of individual components present in a combination on the achieved process efficiency is at least initially recognized, the impact of the entire combination is not. Therefore, further studies are needed on this topic [588].
One of the substrates that was exanimated by Polish researchers to produce bio-H2 was tannery shavings, which were converted via DF and are giving promising results [589,590,591]. Other valorization processes like biomass torrefaction under superheated steam combined with the GA process and, for example, coupled with pressurized swing adsorption (PSA) to produce green H2 are the processes currently examined by researchers [592,593,594,595,596].
In summary, these investigations highlight the significance of choosing feedstocks, energy sources, and technological integration for minimizing the environmental effects of H2 production from biomass. Biological techniques, such as DF, differ considerably depending on the feedstock, with certain ones exhibiting reduced impacts. Thermochemical techniques, including biomass GA, significantly benefit from advancements like C capture and solar support, capable of lowering or eliminating GHG emissions. Enhancing these elements is essential for reducing the environmental impact of renewable-H2 generation.

7. Summary

Evaluating various biomass-derived H2 production methods is challenging, primarily due to the significant variation in technologies, feedstocks, operational conditions, scale, and maturity levels, along with associated risks. The hydraulic retention time (HRT), pH, temperature, and eventual substrate pretreatment all significantly influence the optimal route for generating bio-H2.
Both TC methods, including PY, liquefaction, and GA, along with biological methods, can generate H2 from biomass (i.e., DbP or i-DbP, as well as PF and DF). Among the most promising biomass-to-H2 conversion pathways identified, biological methods exhibited superior environmental performance relative to TC methods. The predominant methods for biological H2 production involve DF and PH carried out by strict anaerobes, facultative anaerobes, microalgae, cyanobacteria, and bacteria.
The microorganisms and reactor materials used during bio-photolysis exhibit no or little toxicity. Only Anabaena spp. can produce several kinds of toxins. The expensive ZN0, being a complex medium, is often replaced by media with diverse cheaper substitutes as ingredients instead of the original ones. The resulting toxicity level of the mixtures obtained needs further research.
Hazards accompanying PF utilized for H2 extraction from biomass are more numerous and more complex than for the PF process. Their interaction with the fermentation conditions is influenced by the type of inoculum and substrate. Thus, further research is required for this group.
Combining PF and DF processes enhances the efficiency and sustainability of H2 production. The implementation of such systems is capital-intensive and requires specialized infrastructure.
Biological methods allow for producing renewable H2 with minimal energy use, as they take place at normal pressure and temperature while also assisting in the recycling of organic waste. Biological H2 production methods are less influenced by the size of the plant compared to TC processes, yet they encounter different constraints. The primary disadvantages of biological methods are low H2 production rates and stringent operating conditions, including light intensity, temperature, H2O, pH, O2 exclusion, substrate concentration, and type. According to [39], incorporating metal-based nanoparticles, immobilizing microbes, genetically modifying microorganisms, and optimizing bioreactor design are among the strategies being explored to address these constraints and boost H2 production in biological processes. Even with extensive study in this area, scaling up biological technologies for H2 production largely hinges on creating novel solutions to enhance the efficiency and output of these processes.
The biological methods are currently at a low level of development, mainly on a laboratory scale. The TC ones can already provide a higher yield of produced H2.
Supercritical water GA is more adaptable to various biomass types, including wet biomass (moisture > 35%), like carbohydrates and wood.
A key factor affecting the profitability of a TC plant is the kind of biomass utilized, as its composition affects the energy content and directly influences the H2 production generated. A greater energy content leads to a reduced breakeven point for the facility. The overall expenses of biomass also influence the costs associated with H2 production. Methods for lowering expenses and enhancing profitability and sustainability involve utilizing locally sourced and readily available residual biomass and waste, as well as recognizing synergies with various sectors (such as agro-industry, forestry, and waste management). TC biomass-to-H2 initiatives must also handle economic limitations directly connected to the plant’s processing capabilities. Each technology is linked to a maximum-size plant, beneath which the project is financially infeasible. Generally, economies of scale are relevant, making larger biomass TC processing plants more economical. These processes are context-dependent, so conducting case studies is necessary to obtain a more accurate view of the project’s techno-economic viability.
Considering only the economic aspects, the level of technological advancement, and H2 generation, conventional GA stands out as the best method for producing renewable H2 from biomass so far. HT GA is expected to be the optimal technology for generating H2 from biomass (especially high-moisture feedstocks) soon, as it provides the advantages of efficient and competitively priced H2 production. In general, TC methods provide efficient options for large-scale centralized H2 production, whereas biological processes are better suited for small-scale local generation.
Though only electrolysis and biomass GA have demonstrated effectiveness for the commercial production of H2, they remain inadequate to fulfill the worldwide demand, which is in agreement with the findings of [515].
The most information about hazards related to the implementation of TC processes of biomass was found for GA, then PY, and the least for HT processes.
In case of hazards related to the gases released during H2 extraction from the biomass, catalysts, and promotors used, it is necessary to wear protective clothing, gloves, goggles, and sufficient respiratory protective equipment. It is necessary to avoid zones with elevated levels of toxic gases or material dust. It is necessary to prevent various materials (metals) from contacting an atmosphere containing active gases or vapors or reactive organic and inorganic substances. These depend on the types of considered materials, gases and other substances, and the levels of their tendency to undergo mutual chemical reactions.
The metallic materials used in catalysts in solid form are rather safe; however, their dust or fumes can be created during potential repairing, usually with various grinding operations. Then, proper protective equipment should be provided for workers.
In the case of the use of toxic materials, e.g., Co or Cr(VI), strict requirements must be maintained regarding their limited amounts in catalysts. Their use should be optimized, especially considering costs and catalytic efficacy. In addition, guidelines and good practices should be developed in each case to limit the impact of such materials on workers and other people in the vicinity of biomass processing plants, as well as on the environment.
Most of the hazards found in the literature concerned pure metals used in catalysts. If they are used as compounds with other elements, for example, their oxides, or if hybrid catalysts using several metals are used, then in addition to the hazards characteristic of pure metals, other hazards may also arise, e.g., resulting from metal synergy. All such hazards must be identified early, hence the need for further studies focused on this.
To decrease the environmental impact of metals applied in various catalysts, it is recommended to widely use recycling for spent catalysts, if possible. However, for active materials, such as K, recycling is more difficult and requires the use of more advanced and expensive technologies.
Employees whose diet or medicine taken causes the risk of an excessive number of metals in their body, which can occur in catalysts, should not be exposed to air containing the vapors or dust of such metals. If they must stay in such conditions, they should use protective equipment with a high degree of protection.
GSR is still being developed; however, although Ni-based catalysts are the most popular ones applied in reforming reactions, only a little information was found about hazards related to their application. Many other catalysts and promotors can be potentially utilized; however, their development is accompanied by various emerging risks and hazards, so further studies are needed on these.
TC methods, including GA and GSR, are efficient for H2 generation. Steam gasification is ideal for both wet and dry biomass without the presence of an oxidizing agent. DF is more effective for biological conversion, as it needs less energy. TC treatment is notably more developed than biological treatment regarding scaling possibilities when comparing existing processes. This is in agreement with observations made by [32].
Providing the high-quality H2 needed by an efficient power system requires the development of various efficient separation technologies. The most promising ones amount to four: membranes, adsorption processes, metal hydride (MH), and cryogenic processes. Further studies are needed on this topic (device design, hybrid material arrangement), also relating to other materials.
The determination of hazards related to H2 extraction from biomass methods is fragmentary. The determination of risk matrices (containing the probability of hazard occurrence) and the determination of prevention strategies require additional studies depending not only on the extraction method but also on the size of the plant, its equipment, and the level of training of employees.

Author Contributions

Conceptualization, K.S. and M.W.; methodology, M.W.; software, M.J.N.; validation, K.S. and M.W.; formal analysis, M.W.; investigation, M.J.N. and P.B.; resources, M.J.N. and P.B.; data curation, S.S.; writing—original draft preparation, K.S.; writing—review and editing, S.S.; visualization, M.W.; supervision, S.S.; project administration, S.S.; funding acquisition, S.S. All authors have read and agreed to the published version of the manuscript.

Funding

This research was funded under SH2AMROCK “Sourcing Hydrogen for Alternative Mobility, Realising Opportunities and Creating KnowHow in Ireland”, project nr. 101112039, by Horizon Europe. The research was funded under the project titled “Modeling and Experimental Verification of the Dark Fermentation Process of Tannery Waste” (DWD/5/0397/2021) by the Ministry of Education and Science, Poland.

Institutional Review Board Statement

Not applicable.

Informed Consent Statement

Not applicable.

Data Availability Statement

No new data were created.

Conflicts of Interest

Author Paulina Bandrow was employed by the company BADER Polska Sp. z o.o. All of the authors declare that the research was conducted in the absence of any commercial or financial relationships that could be construed as a potential conflict of interest.

References

  1. Mohanty, M. Green Growth as a Pathway to Sustainable Development. 2015. Available online: https://www.studocu.com/row/document/the-university-of-the-south-pacific-solomon-islands/geography/mohanty-manoranjan-2015-green-growth-as-a-pathway-to-sustainable-development/37836548 (accessed on 9 September 2024).
  2. Song, Y.; Ji, Q.; Du, Y.-J.; Geng, J.-B. The Dynamic Dependence of Fossil Energy, Investor Sentiment and Renewable Energy Stock Markets. Energy Econ. 2019, 84, 104564. [Google Scholar] [CrossRef]
  3. Gladchenko, M.A.; Gaydamaka, S.N.; Kornilov, V.I.; Chernov, V.V.; Kornilova, A.A. Anaerobic Conversion of Waste of Alcohol Production with Animal and Poultry Waste into Methane as a Substrate for Hydrogen Production. Int. J. Hydrogen Energy 2024, 51, 37–48. [Google Scholar] [CrossRef]
  4. Vaidya, P.D.; Lopez-Sanchez, J.A. Review of Hydrogen Production by Catalytic Aqueous-Phase Reforming. ChemistrySelect 2017, 2, 6563–6576. [Google Scholar] [CrossRef]
  5. Pal, D.B.; Singh, A.; Bhatnagar, A. A Review on Biomass Based Hydrogen Production Technologies. Int. J. Hydrogen Energy 2022, 47, 1461–1480. [Google Scholar] [CrossRef]
  6. Capodaglio, A.G. Developments and Issues in Renewable Ecofuels and Feedstocks. Energies 2024, 17, 3560. [Google Scholar] [CrossRef]
  7. Jarosz, Z.; Kapłan, M.; Klimek, K.; Anders, D.; Dybek, B.; Herkowiak, M.; Hołaj-Krzak, J.T.; Syrotyuk, S.; Korobka, S.; Syrotyuk, H.; et al. Evaluation of Biohydrogen Production Depending on the Substrate Used—Examples for the Development of Green Energy. Energies 2024, 17, 2524. [Google Scholar] [CrossRef]
  8. Fasolini, A.; Cucciniello, R.; Paone, E.; Mauriello, F.; Tabanelli, T. A Short Overview on the Hydrogen Production Via Aqueous Phase Reforming (APR) of Cellulose, C6-C5 Sugars and Polyols. Catalysts 2019, 9, 917. [Google Scholar] [CrossRef]
  9. Del Mundo, D.M.N.; Sutheerawattananonda, M. Influence of Fat and Oil Type on the Yield, Physico-Chemical Properties, and Microstructure of Fat, Oil, and Grease (FOG) Deposits. Water Res. 2017, 124, 308–319. [Google Scholar] [CrossRef] [PubMed]
  10. Ganesan, P. Effect of Biomedical Waste Co-Feeding in the Steam Gasification of Indian Palm Kernel Shell in Fluidized Bed Gasifier. Environ. Sci. Pollut. Res. 2022, 29, 36788–36800. [Google Scholar] [CrossRef] [PubMed]
  11. Halba, A.; Arora, P. Pine Needle Gasification–Based Electricity Production: Understanding the Effect of Supply Chain. Environ. Sci. Pollut. Res. 2024, 1–19. [Google Scholar] [CrossRef]
  12. Karthikeyan, P.K.; Bandulasena, H.C.H.; Radu, T. A Comparative Analysis of Pre-Treatment Technologies for Enhanced Biogas Production from Anaerobic Digestion of Lignocellulosic Waste. Ind. Crops Prod. 2024, 215, 118591. [Google Scholar] [CrossRef]
  13. Viswanathan, K.; Wang, S. Experimental Investigation on the Application of Preheated Fish Oil Ethyl Ester as a Fuel in Diesel Engine. Fuel 2021, 285, 119244. [Google Scholar] [CrossRef]
  14. Viswanathan, K.; Ikhsan Taipabu, M.; Wu, W. Novel Petit Grain Bitter Orange Waste Peel Oil Biofuel Investigation in Diesel Engine with Modified Fuel Injection Pressure and Bowl Geometry. Fuel 2022, 319, 123660. [Google Scholar] [CrossRef]
  15. Kuo, P.-C.; Illathukandy, B.; Wu, W.; Chang, J.-S. Plasma Gasification Performances of Various Raw and Torrefied Biomass Materials Using Different Gasifying Agents. Bioresour. Technol. 2020, 314, 123740. [Google Scholar] [CrossRef] [PubMed]
  16. Kuo, C.-M.; Sun, Y.-L.; Lin, C.-H.; Lin, C.-H.; Wu, H.-T.; Lin, C.-S. Cultivation and Biorefinery of Microalgae (Chlorella sp.) for Producing Biofuels and Other Byproducts: A Review. Sustainability 2021, 13, 13480. [Google Scholar] [CrossRef]
  17. Suganya, T.; Varman, M.; Masjuki, H.H.; Renganathan, S. Macroalgae and Microalgae as a Potential Source for Commercial Applications along with Biofuels Production: A Biorefinery Approach. Renew. Sustain. Energy Rev. 2016, 55, 909–941. [Google Scholar] [CrossRef]
  18. Mehrpooya, M.; Ghorbani, B.; Abedi, H. Biodiesel Production Integrated with Glycerol Steam Reforming Process, Solid Oxide Fuel Cell (SOFC) Power Plant. Energy Convers. Manag. 2020, 206, 112467. [Google Scholar] [CrossRef]
  19. Thiyagarajan, S.; Varuvel, E.; Karthickeyan, V.; Sonthalia, A.; Kumar, G.; Saravanan, C.G.; Dhinesh, B.; Pugazhendhi, A. Effect of Hydrogen on Compression-Ignition (CI) Engine Fueled with Vegetable Oil/Biodiesel from Various Feedstocks: A Review. Int. J. Hydrogen Energy 2022, 47, 37648–37667. [Google Scholar] [CrossRef]
  20. Alizadeh, S.M.; Khalili, Y.; Ahmadi, M. Comprehensive Review of Carbon Capture and Storage Integration in Hydrogen Production: Opportunities, Challenges, and Future Perspectives. Energies 2024, 17, 5330. [Google Scholar] [CrossRef]
  21. Health and Safety Authority Hazard and Risk. 2023. Available online: https://www.hsa.ie/eng/topics/hazards/ (accessed on 9 September 2024).
  22. Lu, Y.; Guo, L.; Ji, C.; Zhang, X.; Hao, X.; Yan, Q. Hydrogen Production by Biomass Gasification in Supercritical Water: A Parametric Study. Int. J. Hydrogen Energy 2006, 31, 822–831. [Google Scholar] [CrossRef]
  23. Ozbas, E.E.; Aksu, D.; Ongen, A.; Aydin, M.A.; Ozcan, H.K. Hydrogen Production via Biomass Gasification, and Modeling by Supervised Machine Learning Algorithms. Int. J. Hydrogen Energy 2019, 44, 17260–17268. [Google Scholar] [CrossRef]
  24. Jiang, H.; Wu, Y.; Fan, H.; Ji, J. Hydrogen Production from Biomass Pyrolysis in Molten Alkali. AASRI Procedia 2012, 3, 217–223. [Google Scholar] [CrossRef]
  25. Meramo-Hurtado, S.I.; Puello, P.; Cabarcas, A. Process Analysis of Hydrogen Production via Biomass Gasification under Computer-Aided Safety and Environmental Assessments. ACS Omega 2020, 5, 19667–19681. [Google Scholar] [CrossRef] [PubMed]
  26. PMA Stainless Steel. Safety Data Sheet. 2024. Available online: https://s29571.pcdn.co/wp-content/uploads/2021/01/SDS-Prime-Stainless-Steel-2020.pdf (accessed on 9 October 2024).
  27. HSE Network Managing Health and Safety Risks in Engineering. HSE Network, HSE News, 29 November 2023. Available online: https://www.hse-network.com/managing-health-and-safety-risks-in-engineering/ (accessed on 9 September 2024).
  28. Chen, C.; Reniers, G. Risk Assessment of Processes and Products in Industrial Biotechnology. In Sustainability and Life Cycle Assessment in Industrial Biotechnology; Fröhling, M., Hiete, M., Eds.; Advances in Biochemical Engineering/Biotechnology; Springer International Publishing: Cham, Switzerland, 2018; Volume 173, pp. 255–279. ISBN 978-3-030-47065-4. [Google Scholar]
  29. Eckebrecht, T. Occupational Standards for the Protection of Employees in Biotechnology. Int. Arch. Occup. Environ. Health 2000, 73, S4–S7. [Google Scholar] [CrossRef] [PubMed]
  30. Ghittori, S.; Ferrari, M.; Negri, S.; Serranti, P.; Sacco, P.; Biffi, R.; Imbriani, M. Recenti strategie per la prevenzione e l’analisi dei rischi in ambito occupazionale: Control banding e Sobane [Recent prevention strategies and occupational risk analysis: Control Banding and So-bane]. G. Ital. Med. Lav. Ergon. 2006, 28, 30–43. [Google Scholar] [PubMed]
  31. Ferrari, M.; Colombi, A.; Imbriani, M. Rischio professionale e prevenzione nell’industria bio-tecnologica: Revisione della letteratura [Occupational risk and prevention in the biotech-nology industry: A review]. Med. Lav. 2006, 97, 651–675. [Google Scholar] [PubMed]
  32. Ghasemi, A.; Nikafshan Rad, H.; Akrami, M. Biomass-to-Green Hydrogen: A Review of Techno-Economic-Enviro Assessment of Various Production Methods. Hydrogen 2024, 5, 474–493. [Google Scholar] [CrossRef]
  33. National Grid Energy Explained. What Is Hydrogen? 2023. Available online: https://www.nationalgrid.com/stories/energy-explained/what-is-hydrogen (accessed on 9 September 2024).
  34. Hassan, Q.; Hafedh, S.A.; Mohammed, H.B.; Abdulrahman, I.S.; Salman, H.M.; Jaszczur, M. A Review of Hydrogen Production from Bio-Energy, Technologies and Assessments. Energy Harvest. Syst. 2024, 11, 20220117. [Google Scholar] [CrossRef]
  35. Sindhu, R.; Binod, P.; Pandey, A.; Gnansounou, E. Agroresidue-Based Biorefineries. In Refining Biomass Residues for Sustainable Energy and Bioproducts; Elsevier: Amsterdam, The Netherlands, 2020; pp. 243–258. ISBN 978-0-12-818996-2. [Google Scholar] [CrossRef]
  36. Sivaranjani, R.; Veerathai, S.; Jeoly Jenifer, K.; Sowmiya, K.; Rupesh, K.J.; Sudalai, S.; Arumugam, A. A Comprehensive Review on Biohydrogen Production Pilot Scale Reactor Technologies: Sustainable Development and Future Prospects. Int. J. Hydrogen Energy 2023, 48, 23785–23820. [Google Scholar] [CrossRef]
  37. Morya, R.; Raj, T.; Lee, Y.; Kumar Pandey, A.; Kumar, D.; Rani Singhania, R.; Singh, S.; Prakash Verma, J.; Kim, S.-H. Recent Updates in Biohydrogen Production Strategies and Life–Cycle Assessment for Sustainable Future. Bioresour. Technol. 2022, 366, 128159. [Google Scholar] [CrossRef]
  38. Awasthi, M.K.; Ganeshan, P.; Gohil, N.; Kumar, V.; Singh, V.; Rajendran, K.; Harirchi, S.; Solanki, M.K.; Sindhu, R.; Binod, P.; et al. Advanced Approaches for Resource Recovery from Wastewater and Activated Sludge: A Review. Bioresour. Technol. 2023, 384, 129250. [Google Scholar] [CrossRef] [PubMed]
  39. Rey, J.R.C.; Mateos-Pedrero, C.; Longo, A.; Rijo, B.; Brito, P.; Ferreira, P.; Nobre, C. Renewable Hydrogen from Biomass: Technological Pathways and Economic Perspectives. Energies 2024, 17, 3530. [Google Scholar] [CrossRef]
  40. U.S. Energy Information Administration Biomass Explained. 2024. Available online: https://www.eia.gov/energyexplained/biomass/ (accessed on 9 September 2024).
  41. International Energy Agency (IEA). The Future of Hydrogen; International Energy Agency: Paris, France, 2019. [Google Scholar]
  42. Nicoletti, G.; Arcuri, N.; Nicoletti, G.; Bruno, R. A Technical and Environmental Comparison between Hydrogen and Some Fossil Fuels. Energy Convers. Manag. 2015, 89, 205–213. [Google Scholar] [CrossRef]
  43. Ruiz Pérez, S.; Bohacikova, V. Hydrogen Storage Safety in Urban Settings: Analysing Soci-Etal Risk Using RiskCurves; Gexcon: Bergen, Norway, 2024; Available online: https://www.gexcon.com/blog/hydrogen-storage-safety-in-urban-settings-analysing-societal-risk-using-riskcurves/ (accessed on 9 October 2024).
  44. Neville, A. Power, 1 May 2009. Available online: https://www.powermag.com/lessons-learned-from-a-hydrogen-explosion/ (accessed on 9 October 2024).
  45. Crowl, D.A.; Jo, Y.-D. The Hazards and Risks of Hydrogen. J. Loss Prev. Process Ind. 2007, 20, 158–164. [Google Scholar] [CrossRef]
  46. Barbir, F. Safety Issues of Hydrogen in Vehicles. 2012. Available online: https://api.semanticscholar.org/CorpusID:235432870 (accessed on 9 October 2024).
  47. MineARC System Risks and Safety Hazards of Methane. 2024. Available online: https://minearc.com (accessed on 9 October 2024).
  48. NevadaNano. The Dangers of Methane Gas Poisoning and Exposure. 2024. Available online: https://nevadanano.com (accessed on 9 October 2024).
  49. Airgas USA, LLC. Ethane CAS Number 74-84-0. 2020. Available online: https://www.airgas.com/msds/001183.pdf (accessed on 9 October 2024).
  50. EERE. Safe Use of Hydrogen; Energy Efficiency & Renewable Energy (EERE), Hydrogen and Fuel Cell Technologies Office: Washington, DC, USA, 2024. Available online: https://www.energy.gov/eere/fuelcells/safe-use-hydrogen (accessed on 9 October 2024).
  51. Lenntech Hydrogen—H. Chemical Properties of Hydrogen—Health Effects of Hydrogen—Environmental Effects of Hydrogen. 2024. Available online: https://www.lenntech.com/periodic/elements/h.htm (accessed on 9 October 2024).
  52. Ali, H.; Khan, E.; Ilahi, I. Environmental Chemistry and Ecotoxicology of Hazardous Heavy Metals: Environmental Persistence, Toxicity, and Bioaccumulation. J. Chem. 2019, 2019, 1–14. [Google Scholar] [CrossRef]
  53. Qi, C.; Huang, J.; Wang, B.; Deng, S.; Wang, Y.; Yu, G. Contaminants of Emerging Concern in Landfill Leachate in China: A Review. Emerg. Contam. 2018, 4, 1–10. [Google Scholar] [CrossRef]
  54. Giwa, A.S.; Xu, H.; Chang, F.; Zhang, X.; Ali, N.; Yuan, J.; Wang, K. Pyrolysis Coupled Anaerobic Digestion Process for Food Waste and Recalcitrant Residues: Fundamentals, Challenges, and Considerations. Energy Sci. Eng. 2019, 7, 2250–2264. [Google Scholar] [CrossRef]
  55. Gao, A.; Tian, Z.; Wang, Z.; Wennersten, R.; Sun, Q. Comparison between the Technologies for Food Waste Treatment. Energy Procedia 2017, 105, 3915–3921. [Google Scholar] [CrossRef]
  56. Dixit, R.; Wasiullah, X.; Malaviya, D.; Pandiyan, K.; Singh, U.B.; Sahu, A.; Shukla, R.; Singh, B.P.; Rai, J.P.; Sharma, P.K.; et al. Bioremediation of Heavy Metals from Soil and Aquatic Environment: An Overview of Principles and Criteria of Fundamental Processes. Sustainability 2015, 7, 2189–2212. [Google Scholar] [CrossRef]
  57. Mishra, S.; Bharagava, R.N.; More, N.; Yadav, A.; Zainith, S.; Mani, S.; Chowdhary, P. Heavy Metal Contamination: An Alarming Threat to Environment and Human Health. In Environmental Biotechnology: For Sustainable Future; Sobti, R.C., Arora, N.K., Kothari, R., Eds.; Springer: Singapore, 2019; pp. 103–125. ISBN 978-981-10-7283-3. [Google Scholar]
  58. Khan, A.; Khan, S.; Khan, M.A.; Qamar, Z.; Waqas, M. The Uptake and Bioaccumulation of Heavy Metals by Food Plants, Their Effects on Plants Nutrients, and Associated Health Risk: A Review. Environ. Sci Pollut Res 2015, 22, 13772–13799. [Google Scholar] [CrossRef] [PubMed]
  59. Reddy, A.M.; Kumar, S.G.; Jyothsnakumari, G.; Thimmanaik, S.; Sudhakar, C. Lead Induced Changes in Antioxidant Metabolism of Horsegram (Macrotyloma uniflorum (Lam.) Verdc.) and Bengalgram (Cicer arietinum L.). Chemosphere 2005, 60, 97–104. [Google Scholar] [CrossRef] [PubMed]
  60. Chew, K.W.; Chia, S.R.; Chia, W.Y.; Cheah, W.Y.; Munawaroh, H.S.H.; Ong, W.-J. Abatement of Hazardous Materials and Biomass Waste via Pyrolysis and Co-Pyrolysis for Environmental Sustainability and Circular Economy. Environ. Pollut. 2021, 278, 116836. [Google Scholar] [CrossRef]
  61. Guo, X.; Liu, H.; Zhang, J. The Role of Biochar in Organic Waste Composting and Soil Improvement: A Review. Waste Manag. 2020, 102, 884–899. [Google Scholar] [CrossRef] [PubMed]
  62. Zhou, H.; Meng, H.; Zhao, L.; Shen, Y.; Hou, Y.; Cheng, H.; Song, L. Effect of Biochar and Humic Acid on the Copper, Lead, and Cadmium Passivation During Composting. Bioresour. Technol. 2018, 258, 279–286. [Google Scholar] [CrossRef] [PubMed]
  63. Liang, J.; Yang, Z.; Tang, L.; Zeng, G.; Yu, M.; Li, X.; Wu, H.; Qian, Y.; Li, X.; Luo, Y. Changes in Heavy Metal Mobility and Availability from Contaminated Wetland Soil Remediated with Combined Biochar-Compost. Chemosphere 2017, 181, 281–288. [Google Scholar] [CrossRef] [PubMed]
  64. Nguyen-Thi, T.X.; Nguyen, P.Q.P.; Tran, V.D.; Ağbulut, Ü.; Nguyen, L.H.; Balasubramanian, D.; Tarelko, W.; Bandh, S.A.; Pham, N.D.K. Recent Advances in Hydrogen Production from Biomass Waste with a Focus on Pyrolysis and Gasification. Int. J. Hydrogen Energy 2024, 54, 127–160. [Google Scholar] [CrossRef]
  65. Dolle, C.; Neha, N.; Coutanceau, C. Electrochemical Hydrogen Production from Biomass. Curr. Opin. Electrochem. 2022, 31, 100841. [Google Scholar] [CrossRef]
  66. Chung, Y.T.; Rohani, R.; Mohamad, I.N.; Mastar@Masdar, M.S.; Takriff, M.S. Biohydrogen Purification from Palm Oil Mill Effluent Fermentation for Fuel Cell Application. Malays. J. Anal. Sci. 2019, 23, 80–89. [Google Scholar]
  67. Eloffy, M.G.; Elgarahy, A.M.; Saber, A.N.; Hammad, A.; El-Sherif, D.M.; Shehata, M.; Mohsen, A.; Elwakeel, K.Z. Biomass-to-Sustainable Biohydrogen: Insights into the Production Routes, and Technical Challenges. Chem. Eng. J. Adv. 2022, 12, 100410. [Google Scholar] [CrossRef]
  68. Vernick, D. What Is Green Hydrogen, and How Can It Help Tackle the Climate Crisis? 2024. Available online: https://www.worldwildlife.org/stories/what-is-green-hydrogen-and-how-can-it-help-tackle-the-climate-crisis (accessed on 9 October 2024).
  69. Pirelli. Cars. Hydrogen as a Fuel: The Pros and Cons. 2024. Available online: https://www.pirelli.com/global/en-ww/road/cars/hydrogen-as-a-fuel-the-pros-and-cons-53908/ (accessed on 9 October 2024).
  70. Gupta, U. Critical Challenges in Biohydrogen Production Processes from Organic Feedstocks. 2024. Available online: https://www.linkedin.com/pulse/critical-challenges-biohydrogen-production-processes-utkarsh-zdimc (accessed on 9 October 2024).
  71. Hurwitz, Z.; Bujak, N.; Tapia, M.; Daza, E.; Gischler, C. Key Aspects for Managing the En-Vironmental and Social Risks of Green Hydrogen. Hablemeos De Sostenibilidad Y Cambio Climático 2023. Available online: https://blogs.iadb.org/sostenibilidad/en/key-aspects-for-managing-the-environmental-and-social-risks-of-green-hydrogen/ (accessed on 9 October 2024).
  72. Mullerova, J. Health and Safety Hazards of Biomass Storage. 20 June 2014. Available online: https://www.researchgate.net/profile/Jana-Muellerova-5/publication/273061578_Health_and_Safety_hazards_of_biomass_storage/links/54f60e0f0cf27d8ed71d4cf2/Health-and-Safety-hazards-of-biomass-storage (accessed on 9 October 2024).
  73. Ennis, T. Fire and Explosion Hazards in the Biomass Industries. IChemE Symp. Ser. 2016, 161, 64. Available online: https://www.icheme.org/media/11801/hazards-26-paper-64-fire-and-explosion-hazards-in-the-biomass-industries.pdf (accessed on 9 October 2024).
  74. Márquez-Reyes, L.A.; Sánchez-Saavedra, M.D.P.; Valdez-Vazquez, I. Improvement of Hydrogen Production by Reduction of the Photosynthetic Oxygen in Microalgae Cultures of Chlamydomonas Gloeopara and Scenedesmus Obliquus. Int. J. Hydrogen Energy 2015, 40, 7291–7300. [Google Scholar] [CrossRef]
  75. Torzillo, G.; Scoma, A.; Faraloni, C.; Ena, A.; Johanningmeier, U. Increased Hydrogen Photoproduction by Means of a Sulfur-Deprived Chlamydomonas Reinhardtii D1 Protein Mutant. Int. J. Hydrogen Energy 2009, 34, 4529–4536. [Google Scholar] [CrossRef]
  76. Al- Janabi, S.K.; Barron, A.R.; Shabbani, H.J.K.; Othman, M.R.; Kim, J. Advances in Hydrogen Production from Sustainable Resources through Biological and Thermochemical Pathways: Review and Bibliometric Analysis. Int. J. Hydrogen Energy 2024, 60, 28–45. [Google Scholar] [CrossRef]
  77. Rashid, N.; Lee, K.; Mahmood, Q. Bio-Hydrogen Production by Chlorella Vulgaris under Diverse Photoperiods. Bioresour. Technol. 2011, 102, 2101–2104. [Google Scholar] [CrossRef] [PubMed]
  78. Mona, S.; Kaushik, A.; Kaushik, C.P. Hydrogen Production and Metal-Dye Bioremoval by a Nostoc Linckia Strain Isolated from Textile Mill Oxidation Pond. Bioresour. Technol. 2011, 102, 3200–3205. [Google Scholar] [CrossRef] [PubMed]
  79. Hitam, C.N.C.; Jalil, A.A. A Review on Biohydrogen Production through Photo-Fermentation of Lignocellulosic Biomass. Biomass Conv. Bioref. 2023, 13, 8465–8483. [Google Scholar] [CrossRef]
  80. Zhang, X.; Sherman, D.M.; Sherman, L.A. The Uptake Hydrogenase in the Unicellular Diazotrophic Cyanobacterium Cyanothece Sp. Strain PCC 7822 Protects Nitrogenase from Oxygen Toxicity. J. Bacteriol. 2014, 196, 840–849. [Google Scholar] [CrossRef] [PubMed]
  81. Eroglu, E.; Melis, A. Photobiological Hydrogen Production: Recent Advances and State of the Art. Bioresour. Technol. 2011, 102, 8403–8413. [Google Scholar] [CrossRef] [PubMed]
  82. Javed, M.A.; Zafar, A.M.; Aly Hassan, A.; Zaidi, A.A.; Farooq, M.; El Badawy, A.; Lundquist, T.; Mohamed, M.M.A.; Al-Zuhair, S. The Role of Oxygen Regulation and Algal Growth Parameters in Hydrogen Production via Biophotolysis. J. Environ. Chem. Eng. 2022, 10, 107003. [Google Scholar] [CrossRef]
  83. Rahman, S.N.A.; Masdar, M.S.; Rosli, M.I.; Majlan, E.H.; Husaini, T.; Kamarudin, S.K.; Daud, W.R.W. Overview Biohydrogen Technologies and Application in Fuel Cell Technology. Renew. Sustain. Energy Rev. 2016, 66, 137–162. [Google Scholar] [CrossRef]
  84. Mona, S.; Kumar, S.S.; Kumar, V.; Parveen, K.; Saini, N.; Deepak, B.; Pugazhendhi, A. Green Technology for Sustainable Biohydrogen Production (Waste to Energy): A Review. Sci. Total Environ. 2020, 728, 138481. [Google Scholar] [CrossRef]
  85. New Jersey Department of Health and Senior Services Sulfur CAS Number 7704-34-9. 2011. Available online: https://www.nj.gov/health/eoh/rtkweb/documents/fs/1757.pdf (accessed on 9 October 2024).
  86. Boone, C.; Bond, C.; Cross, A.; Jenkins, J. Sulfur. 2017. Available online: https://npic.orst.edu/factsheets/sulfurgen.html (accessed on 9 October 2024).
  87. Hovensa LLC. Sulfur CAS No. 7704-34-9. 2006. Available online: http://westliberty.edu/health-and-safety/files/2012/08/Sulfur.pdf (accessed on 9 October 2024).
  88. International Chemical Safety Cards (ICSCs) Carbon CAS No.: 7440-44-0 2017. Available online: https://chemicalsafety.ilo.org/dyn/icsc/showcard.display?p_card_id=0702 (accessed on 9 October 2024).
  89. Kossalbayev, B.D.; Tomo, T.; Zayadan, B.K.; Sadvakasova, A.K.; Bolatkhan, K.; Alwasel, S.; Allakhverdiev, S.I. Determination of the Potential of Cyanobacterial Strains for Hydrogen Production. Int. J. Hydrogen Energy 2020, 45, 2627–2639. [Google Scholar] [CrossRef]
  90. Zhang, Y.-H.P.; Sun, J.; Zhong, J.-J. Biofuel Production by in Vitro Synthetic Enzymatic Pathway Biotransformation. Curr. Opin. Biotechnol. 2010, 21, 663–669. [Google Scholar] [CrossRef] [PubMed]
  91. Zhang, Y.-H.P.; Evans, B.R.; Mielenz, J.R.; Hopkins, R.C.; Adams, M.W.W. High-Yield Hydrogen Production from Starch and Water by a Synthetic Enzymatic Pathway. PLoS ONE 2007, 2, e456. [Google Scholar] [CrossRef] [PubMed]
  92. Rollin, J.A.; Tam, T.K.; Zhang, Y.-H.P. New Biotechnology Paradigm: Cell-Free Biosystems for Biomanufacturing. Green Chem. 2013, 15, 1708. [Google Scholar] [CrossRef]
  93. Song, W.; Rashid, N.; Choi, W.; Lee, K. Biohydrogen Production by Immobilized Chlorella Sp. Using Cycles of Oxygenic Photosynthesis and Anaerobiosis. Bioresour. Technol. 2011, 102, 8676–8681. [Google Scholar] [CrossRef]
  94. Sengmee, D.; Cheirsilp, B.; Suksaroge, T.T.; Prasertsan, P. Biophotolysis-Based Hydrogen and Lipid Production by Oleaginous Microalgae Using Crude Glycerol as Exogenous Carbon Source. Int. J. Hydrogen Energy 2017, 42, 1970–1976. [Google Scholar] [CrossRef]
  95. Pyokim, J.; Dukkang, C.; Hyunpark, T.; Sunkim, M.; Junsim, S. Enhanced Hydrogen Production by Controlling Light Intensity in Sulfur-Deprived Chlamydomonas Reinhardtii Culture. Int. J. Hydrogen Energy 2006, 31, 1585–1590. [Google Scholar] [CrossRef]
  96. Bala Amutha, K.; Murugesan, A.G. Biological Hydrogen Production by the Algal Biomass Chlorella Vulgaris MSU 01 Strain Isolated from Pond Sediment. Bioresour. Technol. 2011, 102, 194–199. [Google Scholar] [CrossRef]
  97. Chader, S.; Hacene, H.; Agathos, S.N. Study of Hydrogen Production by Three Strains of Chlorella Isolated from the Soil in the Algerian Sahara. Int. J. Hydrogen Energy 2009, 34, 4941–4946. [Google Scholar] [CrossRef]
  98. Hong, M.E.; Shin, Y.S.; Kim, B.W.; Sim, S.J. Autotrophic Hydrogen Photoproduction by Operation of Carbon-Concentrating Mechanism in Chlamydomonas Reinhardtii under Sulfur Deprivation Condition. J. Biotechnol. 2016, 221, 55–61. [Google Scholar] [CrossRef] [PubMed]
  99. Huesemann, M.H.; Hausmann, T.S.; Carter, B.M.; Gerschler, J.J.; Benemann, J.R. Hydrogen Generation Through Indirect Biophotolysis in Batch Cultures of the Nonheterocystous Nitrogen-Fixing Cyanobacterium Plectonema Boryanum. Appl. Biochem Biotechnol 2010, 162, 208–220. [Google Scholar] [CrossRef] [PubMed]
  100. Vargas, S.R.; Santos, P.V.D.; Giraldi, L.A.; Zaiat, M.; Calijuri, M.D.C. Anaerobic Phototrophic Processes of Hydrogen Production by Different Strains of Microalgae Chlamydomonas sp. FEMS Microbiol. Lett. 2018, 365, fny073. [Google Scholar] [CrossRef]
  101. Vargas, S.R.; Zaiat, M.; Calijuri, M.D.C. Influence of Culture Age, Ammonium and Organic Carbon in Hydrogen Production and Nutrient Removal by Anabaena Sp. in Nitrogen-Limited Cultures. Int. J. Hydrogen Energy 2020, 45, 30222–30231. [Google Scholar] [CrossRef]
  102. Vargas, S.R.; Santos, P.V.D.; Zaiat, M.; Calijuri, M.D.C. Optimization of Biomass and Hydrogen Production by Anabaena Sp. (UTEX 1448) in Nitrogen-Deprived Cultures. Biomass Bioenergy 2018, 111, 70–76. [Google Scholar] [CrossRef]
  103. Raksajit, W.; Satchasataporn, K.; Lehto, K.; Mäenpää, P.; Incharoensakdi, A. Enhancement of Hydrogen Production by the Filamentous Non-Heterocystous Cyanobacterium Arthrospira Sp. PCC 8005. Int. J. Hydrogen Energy 2012, 37, 18791–18797. [Google Scholar] [CrossRef]
  104. Chandrasekaran, R.; Ajeesh, C.P.M.; Sundaramoorthy, B.; Shalini, M.; Siva, R.; Das, R.; Fulzele, D.; Thiagarajan, K. Effect of Modified Zarrouk’s Medium on Growth of Different Spirulina Strains. Walailak J. Sci. Technol. 2016, 13, 67–75. [Google Scholar]
  105. Vargas, S.R.; Zaiat, M.; Calijuri, M.D.C. Chlamydomonas Strains Respond Differently to Photoproduction of Hydrogen and By-Products and Nutrient Uptake in Sulfur-Deprived Cultures. J. Environ. Chem. Eng. 2021, 9, 105930. [Google Scholar] [CrossRef]
  106. Poudyal, R.S.; Tiwari, I.; Koirala, A.R.; Masukawa, H.; Inoue, K.; Tomo, T.; Najafpour, M.M.; Allakhverdiev, S.I.; Veziroğlu, T.N. Hydrogen Production Using Photobiological Methods. In Compendium of Hydrogen Energy; Elsevier: Amsterdam, The Netherlands, 2015; pp. 289–317. ISBN 978-1-78242-361-4. [Google Scholar] [CrossRef]
  107. Cohen, I.; Knopf, J.A.; Irihimovitch, V.; Shapira, M. A Proposed Mechanism for the Inhibitory Effects of Oxidative Stress on Rubisco Assembly and Its Subunit Expression. Plant Physiol. 2005, 137, 738–746. [Google Scholar] [CrossRef] [PubMed]
  108. Melis, A. Photosynthetic H2 Metabolism in Chlamydomonas Reinhardtii (Unicellular Green Algae). Planta 2007, 226, 1075–1086. [Google Scholar] [CrossRef] [PubMed]
  109. Paramesh, K.; Chandrasekhar, T. Improvement of Photobiological Hydrogen Production in Chlorococcum Minutum Using Various Oxygen Scavengers. Int. J. Hydrogen Energy 2020, 45, 7641–7646. [Google Scholar] [CrossRef]
  110. Wei, L.; Yi, J.; Wang, L.; Huang, T.; Gao, F.; Wang, Q.; Ma, W. Light Intensity Is Important for Hydrogen Production in NaHSO3 -Treated Chlamydomonas reinhardtii. Plant Cell Physiol 2017, 58, 451–457. [Google Scholar] [CrossRef]
  111. Surzycki, R.; Cournac, L.; Peltier, G.; Rochaix, J.-D. Potential for Hydrogen Production with Inducible Chloroplast Gene Expression in Chlamydomonas. Proc. Natl. Acad. Sci. USA 2007, 104, 17548–17553. [Google Scholar] [CrossRef] [PubMed]
  112. Bothe, H.; Schmitz, O.; Yates, M.G.; Newton, W.E. Nitrogen Fixation and Hydrogen Metabolism in Cyanobacteria. Microbiol. Mol. Biol. Rev. 2010, 74, 529–551. [Google Scholar] [CrossRef] [PubMed]
  113. Nguyen, A.V.; Toepel, J.; Burgess, S.; Uhmeyer, A.; Blifernez, O.; Doebbe, A.; Hankamer, B.; Nixon, P.; Wobbe, L.; Kruse, O. Time-Course Global Expression Profiles of Chlamydomonas Reinhardtii during Photo-Biological H2 Production. PLoS ONE 2011, 6, e29364. [Google Scholar] [CrossRef] [PubMed]
  114. Dasgupta, C.N.; Jose Gilbert, J.; Lindblad, P.; Heidorn, T.; Borgvang, S.A.; Skjanes, K.; Das, D. Recent Trends on the Development of Photobiological Processes and Photobioreactors for the Improvement of Hydrogen Production. Int. J. Hydrogen Energy 2010, 35, 10218–10238. [Google Scholar] [CrossRef]
  115. MCC MA—Media for Freshwater, Terrestrial, Hot Spring and Salt Water Algae. 2024. Available online: https://mcc.nies.go.jp/02medium-e.html#ma (accessed on 9 October 2024).
  116. US Centers for Disease Control and Prevention. Types of Harmful Algal Blooms. Harmful Algal Bloom (HAB)-Associated Illness. 2024. Available online: https://www.cdc.gov/harmful-algal-blooms/about/types-of-harmful-algal-blooms.html (accessed on 9 October 2024).
  117. US Centres of Disease Control and Prevention (CDC). Harmful Algal Blooms: Contributing Factors and Impacts. Harmful Algal Bloom (HAB)-Associated Illness. 2024. Available online: https://www.cdc.gov/harmful-algal-blooms/about/harmful-algal-blooms-contributing-factors-and-impacts.html (accessed on 9 October 2024).
  118. Rzymski, P.; Niedzielski, P.; Kaczmarek, N.; Jurczak, T.; Klimaszyk, P. The Multidisciplinary Approach to Safety and Toxicity Assessment of Microalgae-Based Food Supplements Following Clinical Cases of Poisoning. Harmful Algae 2015, 46, 34–42. [Google Scholar] [CrossRef]
  119. Aly, S.M.; ElBanna, N.I.; Fathi, M. Chlorella in Aquaculture: Challenges, Opportunities, and Disease Prevention for Sustainable Development. Aquacult. Int. 2024, 32, 1559–1586. [Google Scholar] [CrossRef]
  120. European Parliament and of the Council Regulation (EC) No 1272/2008 of the European Parliament and of the Council of 16 December 2008 on Classification, Labelling and Packaging of Substances and Mixtures, Amending and Repealing Directives 67/548/EEC and 1999/45/EC, and Amending Regulation (EC) No 1907/2006 (Text with EEA Relevance). 2008. Available online: https://eur-lex.europa.eu/eli/reg/2008/1272/oj/eng (accessed on 9 October 2024).
  121. Sigma-Aldrich D-(+)-Glucose. CAS No. 50-99-7. Safety Data Sheet. 2024. Available online: https://www.sigmaaldrich.com/US/en/sds/sigma/g8270 (accessed on 9 October 2024).
  122. Li, L. Features of Serum Bottles. 2023. Available online: https://www.linkedin.com/pulse/features-serum-bottles-jason-wong/ (accessed on 9 October 2024).
  123. Sigma-Aldrich WHEATON Type I Crimp Top Serum Bottle. 2024. Available online: https://www.sigmaaldrich.com/PL/en/product/aldrich/dwk223738 (accessed on 9 October 2024).
  124. LGSonic Algae Problems. Algae Problems. 2024. Available online: https://www.lgsonic.com/algae-problems/ (accessed on 9 October 2024).
  125. Yadav, M.; Sharma, P.; Kushwah, H.; Sandal, N.; Chauhan, M.K. Assessment of the Toxicological Profile of Chlorella (C. Vulgaris) Powder by Performing Acute and Sub-Acute Oral Toxicity Studies in Mice. J. Appl. Phycol. 2022, 34, 363–373. [Google Scholar] [CrossRef]
  126. Zainul Azlan, N.; Abd Ghafar, N.; Mohd Yusof, Y.A.; Makpol, S. Toxicity Study of Chlorella Vulgaris Water Extract on Female Sprague Dawley Rats by Using the Organization for Economic Cooperation and Development (OECD) Guideline 420. J. Appl. Phycol. 2020, 32, 3063–3075. [Google Scholar] [CrossRef]
  127. Cargill Crude Glycerin. Material Safety Data Sheet. 2007. Available online: https://www.cargill.com/doc/1432075994011/glycerin-crude-msds.pdf (accessed on 9 October 2024).
  128. RBFuels Crude Glycerol/Glycerin. CAS No. 56-81-5. Safety Data Sheet. 2015. Available online: http://www.rbfuels.com/wp-content/uploads/2016/09/Crude-Glycerin_RBF-002_Final.pdf (accessed on 9 October 2024).
  129. Murbach, T.S.; Glávits, R.; Endres, J.R.; Hirka, G.; Vértesi, A.; Béres, E.; Szakonyiné, I.P. A Toxicological Evaluation of Chlamydomonas Reinhardtii, a Green Algae. Int. J. Toxicol. 2018, 37, 53–62. [Google Scholar] [CrossRef]
  130. Bohlender Polytetrafluorethylene (PTFE), Sintered. Safety Data Sheet. 2016. Available online: https://www.bola.de/msdb/Englisch/MSDS_PTFE_e.pdf (accessed on 9 October 2024).
  131. Smart Science TAP (Tris-Acetate-Phosphate) Medium. Safety Data Sheet. 2015. Available online: https://phytotechlab.com/mwdownloads/download/link/id/2275 (accessed on 9 October 2024).
  132. Wag! Cornstalk Plant Poisoning in Dogs. 2017. Available online: https://wagwalking.com/condition/cornstalk-plant-poisoning (accessed on 9 October 2024).
  133. Rankel, K. Dracaena Fragrans “Massangeana” (Corn Plant) Is Toxic To Humans. 2024. Available online: https://greg.app/dracaena-elegance-toxic-to-humans/ (accessed on 9 October 2024).
  134. ASPCA Corn Plant. 2024. Available online: https://www.aspca.org/pet-care/animal-poison-control/toxic-and-non-toxic-plants/corn-plant (accessed on 9 October 2024).
  135. 1st BASE Modified BG-11 (Blue-Green) Medium, Premix Powder Biotechnology Grade. Material Safety Data Sheet. 2022. Available online: https://base-asia.com/downloads/products/msds/SDS-7001-10L-Modified-BG-11-Blue-green-Medium-Premix-Powder.pdf (accessed on 9 October 2024).
  136. eChlorial. The 7 Lies about Chlorella: Dangers, Organic, Properties…. eChlorial. 2024. Available online: https://www.echlorial.com/blog/lies-dangers-chlorella/ (accessed on 9 October 2024).
  137. Jelonek, L. Chlorella Side Effects, Benefits, and Contraindications Natu.Care. Natu.Care. 2024. Available online: https://natu.care/uk/plants/chlorella (accessed on 9 October 2024).
  138. Sigma-Aldrich Ethyl Acetate. CAS No. 141-78-6. Safety Data Sheet. 2024. Available online: https://www.sigmaaldrich.com/PL/en/sds/sial/270989 (accessed on 9 October 2024).
  139. Sigma-Aldrich BG11 Broth. 2024. Available online: https://www.sigmaaldrich.com/US/en/product/sial/73816 (accessed on 9 October 2024).
  140. Sigma-Aldrich Starch, from Corn. CAS No. 9005-25-8. Safety Data Sheet. 2024. Available online: https://www.sigmaaldrich.com/DE/de/sds/SIAL/S4180%3Fsrsltid%3DAfmBOoqu8bSMlsamm9ixtAAyt0UazjJTdwiHBMiEvQIUpjbFu7cFo2Is (accessed on 9 October 2024).
  141. Fisher Science Education Starch, Solube, Lab Grade. Safety Data Sheet. 2015. Available online: https://www.fishersci.com/store/msds?partNumber=S25582A&productDescription=STARCH+SOLUBLE+500G&vendorId=VN00115888&countryCode=US&language=en (accessed on 9 October 2024).
  142. Fonseca, A.; Almeida, K.; Tavella, R.; Da Silva Júnior, F.; Dora, C.; Giroldo, D.; Maidana, M.; Muccillo-Baisch, A.L. Evaluation of Acute Toxicity of the Microalgae Pediastrum Boryanum. VITTALLE—Rev. Ciências Saúde. 2016, 8, 90–102. [Google Scholar]
  143. Sigma-Aldrich Diuron (DCMU). CAS No. 330-54-1. Safety Data Sheet. 2024. Available online: https://www.sigmaaldrich.com/PL/en/sds/aldrich/s279013 (accessed on 9 October 2024).
  144. Sigma-Aldrich Borosil Reagent Bottle. 2024. Available online: https://www.sigmaaldrich.com/deepweb/assets/sigmaaldrich/product/documents/671/804/foxx-life-sciences-1500017-1.pdf (accessed on 9 October 2024).
  145. Sigma-Aldrich Duran Laboratory Bottles, with Caps. 2024. Available online: https://www.sigmaaldrich.com/PL/en/product/aldrich/z305227?srsltid=AfmBOorv0ucXzMnHaDtcOOT8WoCktY71P_0gDlfi4tBthSGjucV3fq_w (accessed on 9 October 2024).
  146. Culture Collection of Algae and Protozoa Anabaena sp. 2024. Available online: https://www.ccap.ac.uk/catalogue/strain-1453-30 (accessed on 9 October 2024).
  147. Washington State Department of Health Cyanobacteria Technical Information. Cyanobacterial Toxins and Symptoms. Anabaena spp. 2024. Available online: https://doh.wa.gov/community-and-environment/contaminants/blue-green-algae/technical-information (accessed on 9 October 2024).
  148. Fleurence, J.; Levine, I.A. Antiallergic and Allergic Properties. In Microalgae in Health and Disease Prevention; Elsevier: Amsterdam, The Netherlands, 2018; pp. 307–315. ISBN 978-0-12-811405-6. [Google Scholar] [CrossRef]
  149. Culture Collection of Algae and Protozoa Chlamydomonas sp. 2024. Available online: https://www.ccap.ac.uk/catalogue/strain-11-154 (accessed on 9 October 2024).
  150. Kaushik, A.; Anjana, K. Biohydrogen Production by Lyngbya Perelegans: Influence of Physico-Chemical Environment. Biomass Bioenergy 2011, 35, 1041–1045. [Google Scholar] [CrossRef]
  151. Tiwari, A.; Pandey, A. Cyanobacterial Hydrogen Production—A Step towards Clean Environment. Int. J. Hydrogen Energy 2012, 37, 139–150. [Google Scholar] [CrossRef]
  152. Tamburic, B.; Zemichael, F.W.; Maitland, G.C.; Hellgardt, K. Parameters Affecting the Growth and Hydrogen Production of the Green Alga Chlamydomonas Reinhardtii. Int. J. Hydrogen Energy 2011, 36, 7872–7876. [Google Scholar] [CrossRef]
  153. Loyte, A.; Suryawanshi, J.; Bellala, S.S.K.; Marode, R.V.; Devarajan, Y. Current Status and Obstacles in the Sustainable Synthesis of Biohydrogen from Microalgal Species. Results Eng. 2024, 24, 103455. [Google Scholar] [CrossRef]
  154. Saifuddin, N.; Priatharsini, P. Developments in Bio-Hydrogen Production from Algae: A Review. Res. J. Appl. Sci. Eng. 2016, 12, 968–982. [Google Scholar] [CrossRef]
  155. Mishra, P.; Krishnan, S.; Rana, S.; Singh, L.; Sakinah, M.; Ab Wahid, Z. Outlook of Fermentative Hydrogen Production Techniques: An Overview of Dark, Photo and Integrated Dark-Photo Fermentative Approach to Biomass. Energy Strategy Rev. 2019, 24, 27–37. [Google Scholar] [CrossRef]
  156. Das, S.R.; Basak, N. Molecular Biohydrogen Production by Dark and Photo Fermentation from Wastes Containing Starch: Recent Advancement and Future Perspective. Bioprocess Biosyst. Eng. 2021, 44, 1–25. [Google Scholar] [CrossRef]
  157. Koku, H. Aspects of the Metabolism of Hydrogen Production by Rhodobacter Sphaeroides. Int. J. Hydrogen Energy 2002, 27, 1315–1329. [Google Scholar] [CrossRef]
  158. Akhlaghi, N.; Najafpour-Darzi, G. A Comprehensive Review on Biological Hydrogen Production. Int. J. Hydrogen Energy 2020, 45, 22492–22512. [Google Scholar] [CrossRef]
  159. Ghosh, S.; Dairkee, U.K.; Chowdhury, R.; Bhattacharya, P. Hydrogen from Food Processing Wastes via Photofermentation Using Purple Non-Sulfur Bacteria (PNSB)—A Review. Energy Convers. Manag. 2017, 141, 299–314. [Google Scholar] [CrossRef]
  160. Sakurai, H.; Masukawa, H.; Kitashima, M.; Inoue, K. Photobiological Hydrogen Production: Bioenergetics and Challenges for Its Practical Application. J. Photochem. Photobiol. C Photochem. Rev. 2013, 17, 1–25. [Google Scholar] [CrossRef]
  161. Xu, X.; Zhou, Q.; Yu, D. The Future of Hydrogen Energy: Bio-Hydrogen Production Technology. Int. J. Hydrogen Energy 2022, 47, 33677–33698. [Google Scholar] [CrossRef]
  162. Das, D.; Veziroglu, T. Advances in Biological Hydrogen Production Processes. Int. J. Hydrogen Energy 2008, 33, 6046–6057. [Google Scholar] [CrossRef]
  163. Bundhoo, Z.M.A. Coupling Dark Fermentation with Biochemical or Bioelectrochemical Systems for Enhanced Bio-Energy Production: A Review. Int. J. Hydrogen Energy 2017, 42, 26667–26686. [Google Scholar] [CrossRef]
  164. Basak, N.; Das, D. The Prospect of Purple Non-Sulfur (PNS) Photosynthetic Bacteria for Hydrogen Production: The Present State of the Art. World J. Microbiol. Biotechnol. 2007, 23, 31–42. [Google Scholar] [CrossRef]
  165. Tao, Y. Characteristics of a New Photosynthetic Bacterial Strain for Hydrogen Production and Its Application in Wastewater Treatment. Int. J. Hydrogen Energy 2008, 33, 963–973. [Google Scholar] [CrossRef]
  166. Zhu, H.; Suzuki, T.; Tsygankov, A.A.; Asada, Y.; Miyake, J. Hydrogen Production from Tofu Wastewater by Rhodobacter Sphaeroides Immobilized in Agar Gels. Int. J. Hydrogen Energy 1999, 24, 305–310. [Google Scholar] [CrossRef]
  167. Yetis, M. Photoproduction of Hydrogen from Sugar Refinery Wastewater by Rhodobacter Sphaeroides O.U. 001. Int. J. Hydrogen Energy 2000, 25, 1035–1041. [Google Scholar] [CrossRef]
  168. Tao, Y.; Chen, Y.; Wu, Y.; He, Y.; Zhou, Z. High Hydrogen Yield from a Two-Step Process of Dark- and Photo-Fermentation of Sucrose. Int. J. Hydrogen Energy 2007, 32, 200–206. [Google Scholar] [CrossRef]
  169. Hakobyan, L.; Gabrielyan, L.; Trchounian, A. Biohydrogen by Rhodobacter Sphaeroides during Photo-Fermentation: Mixed vs. Sole Carbon Sources Enhance Bacterial Growth and H2 Production. Int. J. Hydrogen Energy 2019, 44, 674–679. [Google Scholar] [CrossRef]
  170. Fedorov, A.S.; Tsygankov, A.A.; Rao, K.K.; Hall, D.O. Hydrogen Photoproduction by Rhodobacter Sphaeroides Immobilised on Polyurethane Foam. Biotechnol. Lett. 1998, 20, 1007–1009. [Google Scholar] [CrossRef]
  171. Budiman, P.M.; Wu, T.Y. Role of Chemicals Addition in Affecting Biohydrogen Production through Photofermentation. Energy Convers. Manag. 2018, 165, 509–527. [Google Scholar] [CrossRef]
  172. Cheng, J.; Su, H.; Zhou, J.; Song, W.; Cen, K. Microwave-Assisted Alkali Pretreatment of Rice Straw to Promote Enzymatic Hydrolysis and Hydrogen Production in Dark- and Photo-Fermentation. Int. J. Hydrogen Energy 2011, 36, 2093–2101. [Google Scholar] [CrossRef]
  173. García-Sánchez, R.; Ramos-Ibarra, R.; Guatemala-Morales, G.; Arriola-Guevara, E.; Toriz-González, G.; Corona-González, R.I. Photofermentation of Tequila Vinasses by Rhodopseudomonas Pseudopalustris to Produce Hydrogen. Int. J. Hydrogen Energy 2018, 43, 15857–15869. [Google Scholar] [CrossRef]
  174. Yue, T.; Sun, Y.; Zhang, Q.; Jiang, D.; Zhang, Z.; Zhang, H.; Li, Y.; Zhang, Y.; Zhang, T. Enhancement of Biohydrogen Production by Photo-Fermentation of Corn Stover via Visible Light Catalyzed Titanium Dioxide/Activated Carbon Fiber. Bioresour. Technol. 2024, 399, 130459. [Google Scholar] [CrossRef] [PubMed]
  175. Lu, C.; Wang, G.; Zhang, Q.; Yang, X.; Yu, J.; Liu, T.; Petracchini, F.; Zhang, Z.; Sun, Y.; Jiang, D.; et al. Comparison of Biorefinery Characteristics: Photo-Fermentation Biohydrogen, Dark Fermentation Biohydrogen, Biomethane, and Bioethanol Production. Appl. Energy 2023, 347, 121463. [Google Scholar] [CrossRef]
  176. Budiman, P.M.; Wu, T.Y.; Ramanan, R.N.; Jahim, J.M. Improving Photofermentative Biohydrogen Production by Using Intermittent Ultrasonication and Combined Industrial Effluents from Palm Oil, Pulp and Paper Mills. Energy Convers. Manag. 2017, 132, 110–118. [Google Scholar] [CrossRef]
  177. Rezania, S.; Din, M.F.M.; Taib, S.M.; Sohaili, J.; Chelliapan, S.; Kamyab, H.; Saha, B.B. Review on Fermentative Biohydrogen Production from Water Hyacinth, Wheat Straw and Rice Straw with Focus on Recent Perspectives. Int. J. Hydrogen Energy 2017, 42, 20955–20969. [Google Scholar] [CrossRef]
  178. Zhang, T.; Jiang, D.; Zhang, H.; Jing, Y.; Tahir, N.; Zhang, Y.; Zhang, Q. Comparative Study on Bio-Hydrogen Production from Corn Stover: Photo-Fermentation, Dark-Fermentation and Dark-Photo Co-Fermentation. Int. J. Hydrogen Energy 2020, 45, 3807–3814. [Google Scholar] [CrossRef]
  179. Ahmad, A.; Rambabu, K.; Hasan, S.W.; Show, P.L.; Banat, F. Biohydrogen Production through Dark Fermentation: Recent Trends and Advances in Transition to a Circular Bioeconomy. Int. J. Hydrogen Energy 2024, 52, 335–357. [Google Scholar] [CrossRef]
  180. Nikolaidis, P.; Poullikkas, A. A Comparative Overview of Hydrogen Production Processes. Renew. Sustain. Energy Rev. 2017, 67, 597–611. [Google Scholar] [CrossRef]
  181. Chandrasekhar, K.; Lee, Y.-J.; Lee, D.-W. Biohydrogen Production: Strategies to Improve Process Efficiency through Microbial Routes. Int. J. Mol. Sci. 2015, 16, 8266–8293. [Google Scholar] [CrossRef] [PubMed]
  182. Hallenbeck, P.C.; Abo-Hashesh, M.; Ghosh, D. Strategies for Improving Biological Hydrogen Production. Bioresour. Technol. 2012, 110, 1–9. [Google Scholar] [CrossRef]
  183. Li, Y.; Chen, Y.; Wu, J. Enhancement of Methane Production in Anaerobic Digestion Process: A Review. Appl. Energy 2019, 240, 120–137. [Google Scholar] [CrossRef]
  184. Ángel Siles López, J.; Li, Q.; Thompson, I.P. Biorefinery of Waste Orange Peel. Crit. Rev. Biotechnol. 2010, 30, 63–69. [Google Scholar] [CrossRef] [PubMed]
  185. Lepp, P.W.; Brinig, M.M.; Ouverney, C.C.; Palm, K.; Armitage, G.C.; Relman, D.A. Methanogenic Archaea and Human Periodontal Disease. Proc. Natl. Acad. Sci. USA 2004, 101, 6176–6181. [Google Scholar] [CrossRef] [PubMed]
  186. Sogodogo, E.; Drancourt, M.; Grine, G. Methanogens as Emerging Pathogens in Anaerobic Abscesses. Eur. J. Clin. Microbiol. Infect. Dis. 2019, 38, 811–818. [Google Scholar] [CrossRef] [PubMed]
  187. Pimentel, M.; Gunsalus, R.P.; Rao, S.S.; Zhang, H. Methanogens in Human Health and Disease. Am. J. Gastroenterol. Suppl. 2012, 1, 28–33. [Google Scholar] [CrossRef]
  188. Attene-Ramos, M.S.; Wagner, E.D.; Gaskins, H.R.; Plewa, M.J. Hydrogen Sulfide Induces Direct Radical-Associated DNA Damage. Mol. Cancer Res. 2007, 5, 455–459. [Google Scholar] [CrossRef]
  189. Modern Water How Sulfate-Reducing Bacteria Impact Corrosion. 2023. Available online: https://www.modernwater.com/2023/01/25/how-sulfate-reducing-bacteria-impact-corrosion/ (accessed on 9 October 2024).
  190. Druzhinin, V.G.; Matskova, L.V.; Fucic, A. Induction and Modulation of Genotoxicity by the Bacteriome in Mammals. Mutat. Res./Rev. Mutat. Res. 2018, 776, 70–77. [Google Scholar] [CrossRef] [PubMed]
  191. Killingsworth, J.; Sawmiller, D.; Shytle, R.D. Propionate and Alzheimer’s Disease. Front. Aging Neurosci. 2021, 12, 580001. [Google Scholar] [CrossRef]
  192. Sweeney, C. Could a Popular Food Ingredient Raise the Risk for Diabetes and Obesity? The Harvard Gazette, Health, The Dietary Factor, 24 April 2019. Available online: https://news.harvard.edu/gazette/story/2019/04/could-a-popular-food-ingredient-raise-the-risk-for-diabetes-and-obesity/ (accessed on 9 October 2024).
  193. Aziz, M.; Darmawan, A.; Juangsa, F.B. Hydrogen Production from Biomasses and Wastes: A Technological Review. Int. J. Hydrogen Energy 2021, 46, 33756–33781. [Google Scholar] [CrossRef]
  194. Łukajtis, R.; Hołowacz, I.; Kucharska, K.; Glinka, M.; Rybarczyk, P.; Przyjazny, A.; Kamiński, M. Hydrogen Production from Biomass Using Dark Fermentation. Renew. Sustain. Energy Rev. 2018, 91, 665–694. [Google Scholar] [CrossRef]
  195. Luque, R.; Campelo, J.; Clark, J.H. (Eds.) Handbook of Biofuels Production: Processes and Technologies; Woodhead Publishing series in energy 2044-9364; Woodhead Pub: Oxford Philadelphia, PA, USA, 2011; Volume 15, ISBN 978-0-85709-049-2. Available online: https://www.shakes.cz/ebook/978-0-85709-049-2 (accessed on 9 October 2024).
  196. Demirel, B.; Yenigün, O. Two-phase Anaerobic Digestion Processes: A Review. J Chem. Tech. Amp. Biotech. 2002, 77, 743–755. [Google Scholar] [CrossRef]
  197. Van, D.P.; Fujiwara, T.; Leu Tho, B.; Song Toan, P.P.; Hoang Minh, G. A Review of Anaerobic Digestion Systems for Biodegradable Waste: Configurations, Operating Parameters, and Current Trends. Environ. Eng. Res. 2019, 25, 1–17. [Google Scholar] [CrossRef]
  198. Kumar, J.C.R.; Majid, M.A. Renewable Energy for Sustainable Development in India: Current Status, Future Prospects, Challenges, Employment, and Investment Opportunities. Energy Sustain. Soc. 2020, 10, 2. [Google Scholar] [CrossRef]
  199. Aslanzadeh, S.; Rajendran, K.; Taherzadeh, M.J. A Comparative Study between Single- and Two-Stage Anaerobic Digestion Processes: Effects of Organic Loading Rate and Hydraulic Retention Time. Int. Biodeterior. Biodegrad. 2014, 95, 181–188. [Google Scholar] [CrossRef]
  200. Pinkard, B.R.; Gorman, D.J.; Tiwari, K.; Rasmussen, E.G.; Kramlich, J.C.; Reinhall, P.G.; Novosselov, I.V. Supercritical Water Gasification: Practical Design Strategies and Operational Challenges for Lab-Scale, Continuous Flow Reactors. Heliyon 2019, 5, e01269. [Google Scholar] [CrossRef]
  201. Ghimire, A.; Frunzo, L.; Pirozzi, F.; Trably, E.; Escudie, R.; Lens, P.N.L.; Esposito, G. A Review on Dark Fermentative Biohydrogen Production from Organic Biomass: Process Parameters and Use of by-Products. Appl. Energy 2015, 144, 73–95. [Google Scholar] [CrossRef]
  202. Martínez-Merino, V.; Gil, M.J.; Cornejo, A. Biomass Sources for Hydrogen Production. In Renewable Hydrogen Technologies; Elsevier: Amsterdam, The Netherlands, 2013; pp. 87–110. ISBN 978-0-444-56352-1. [Google Scholar] [CrossRef]
  203. Kim, D.-H.; Kim, S.-H.; Kim, K.-Y.; Shin, H.-S. Experience of a Pilot-Scale Hydrogen-Producing Anaerobic Sequencing Batch Reactor (ASBR) Treating Food Waste. Int. J. Hydrogen Energy 2010, 35, 1590–1594. [Google Scholar] [CrossRef]
  204. Kumar, G.; Bakonyi, P.; Sivagurunathan, P.; Kim, S.-H.; Nemestóthy, N.; Bélafi-Bakó, K.; Lin, C.-Y. Enhanced Biohydrogen Production from Beverage Industrial Wastewater Using External Nitrogen Sources and Bioaugmentation with Facultative Anaerobic Strains. J. Biosci. Bioeng. 2015, 120, 155–160. [Google Scholar] [CrossRef] [PubMed]
  205. Yang, Y.; Bu, J.; Tiong, Y.W.; Xu, S.; Zhang, J.; He, Y.; Zhu, M.; Tong, Y.W. Enhanced Thermophilic Dark Fermentation of Hydrogen Production from Food Waste by Fe-Modified Biochar. Environ. Res. 2024, 244, 117946. [Google Scholar] [CrossRef]
  206. Zhao, B.; Yuan, A.; Cao, S.; Dong, Z.; Sha, H.; Song, Z. Advancing Two-Stage Hydrogen Production from Corn Stover via Dark Fermentation: Contributions of Thermally Modified Maifanite to Microbial Proliferation and pH Self-Regulation. Bioresour. Technol. 2024, 403, 130853. [Google Scholar] [CrossRef] [PubMed]
  207. Chantawan, N.; Moungprayoon, A.; Lunprom, S.; Reungsang, A.; Salakkam, A. High-Solid Dark Fermentation of Cassava Pulp and Cassava Processing Wastewater for Hydrogen Production. Int. J. Hydrogen Energy 2022, 47, 40672–40682. [Google Scholar] [CrossRef]
  208. Kazemi, R.; Mirmohamadsadeghi, S.; Amiri, H. Efficient Bio-Hydrogen Production by Dark Co-Fermentation of Food-Rich Municipal Solid Waste and Urban Pruning Wastes of Pine, Cypress, and Berry. Process Saf. Environ. Prot. 2024, 187, 398–407. [Google Scholar] [CrossRef]
  209. Ban, Q.; Wang, J.; Guo, P.; Yue, J.; Zhang, L.; Li, J. Improved Biohydrogen Production by Co-Fermentation of Corn Straw and Excess Sludge: Insights into Biochemical Process, Microbial Community and Metabolic Genes. Environ. Res. 2024, 256, 119171. [Google Scholar] [CrossRef] [PubMed]
  210. Hussien, M.; Jadhav, D.A.; Le, T.T.Q.; Jang, J.H.; Jang, J.K.; Chae, K.J. Tuning Dark Fermentation Operational Conditions for Improved Biohydrogen Yield during Co-Digestion of Swine Manure and Food Waste. Process Saf. Environ. Prot. 2024, 187, 1496–1507. [Google Scholar] [CrossRef]
  211. Singh, H.; Tomar, S.; Qureshi, K.A.; Jaremko, M.; Rai, P.K. Recent Advances in Biomass Pretreatment Technologies for Biohydrogen Production. Energies 2022, 15, 999. [Google Scholar] [CrossRef]
  212. Bilska, A.; Wochna, K.; Habiera, M.; Serwańska-Leja, K. Health Hazard Associated with the Presence of Clostridium Bacteria in Food Products. Foods 2024, 13, 2578. [Google Scholar] [CrossRef]
  213. Government of Canada. Public Health Agency of Canada Pathogen Safety Data Sheets: Infectious Substances—Clostridium spp. 2014. Available online: https://www.canada.ca/en/public-health/services/laboratory-biosafety-biosecurity/pathogen-safety-data-sheets-risk-assessment/clostridium.html (accessed on 9 October 2024).
  214. Ghoddusi, H.B.; Sherburn, R.E.; Aboaba, O.O. Growth Limiting pH, Water Activity, and Temperature for Neurotoxigenic Strains of Clostridium butyricum. ISRN Microbiol. 2013, 2013, 1–6. [Google Scholar] [CrossRef] [PubMed]
  215. TRBA. TRBA 466 Classification of Prokaryotes (Bacteria and Archaea) into Risk Groups. 2010. Available online: https://www.certifico.com/sicurezza-lavoro/documenti-sicurezza/64-documenti-enti/17642-technical-rules-for-biological-agents-trba?tmpl=component (accessed on 9 October 2024).
  216. Li, M.; Ning, P.; Sun, Y.; Luo, J.; Yang, J. Characteristics and Application of Rhodopseudomonas Palustris as a Microbial Cell Factory. Front. Bioeng. Biotechnol. 2022, 10, 897003. [Google Scholar] [CrossRef] [PubMed]
  217. Kumar, A.; Kushwaha, K.K.; Singh, S.; Shivay, Y.S.; Meena, M.C.; Nain, L. Effect of Paddy Straw Burning on Soil Microbial Dynamics in Sandy Loam Soil of Indo-Gangetic Plains. Environ. Technol. Innov. 2019, 16, 100469. [Google Scholar] [CrossRef]
  218. Singh, Y.; Sharma, S.; Kumar, U.; Sihag, P.; Balyan, P.; Singh, K.P.; Dhankher, O.P. Strategies for Economic Utilization of Rice Straw Residues into Value-Added by-Products and Prevention of Environmental Pollution. Sci. Total Environ. 2024, 906, 167714. [Google Scholar] [CrossRef] [PubMed]
  219. Tejeda, A.; Montoya, A.; Sulbarán-Rangel, B.; Zurita, F. Possible Pollution of Surface Water Bodies with Tequila Vinasses. Water 2023, 15, 3773. [Google Scholar] [CrossRef]
  220. Zurita, F.; Tejeda, A.; Montoya, A.; Carrillo, I.; Sulbarán-Rangel, B.; Carreón-Álvarez, A. Generation of Tequila Vinasses, Characterization, Current Disposal Practices and Study Cases of Disposal Methods. Water 2022, 14, 1395. [Google Scholar] [CrossRef]
  221. Mendiola-Rodriguez, T.A.; Ricardez-Sandoval, L.A. Robust Control for Anaerobic Digestion Systems of Tequila Vinasses under Uncertainty: A Deep Deterministic Policy Gradient Algorithm. Digit. Chem. Eng. 2022, 3, 100023. [Google Scholar] [CrossRef]
  222. Díaz-Vázquez, D.; Orozco-Nunnelly, D.A.; Yebra-Montes, C.; Senés-Guerrero, C.; Gradilla-Hernández, M.S. Using Yeast Cultures to Valorize Tequila Vinasse Waste: An Example of a Circular Bioeconomy Approach in the Agro-Industrial Sector. Biomass Bioenergy 2022, 161, 106471. [Google Scholar] [CrossRef]
  223. Cui, Y.; Bai, L.; Li, C.; Du, R. Source and Migration Patterns of Heavy Metals and Human Health Risk Assessment of Heavy Metals in Soil-Corn Straw-Flue Gas System. Environ. Geochem. Health 2023, 45, 8043–8061. [Google Scholar] [CrossRef] [PubMed]
  224. Cai, J.; Zhang, H.; Wu, X.; Liu, Y.; Wu, Y.; Wang, J.; Zhang, C.; Sun, B.; Wu, F. Straw Return Decreases Polycyclic Aromatic Hydrocarbon (PAH) Accumulation in Winter Wheat and Human Health Risk by Enhancing PAH Dissipation in Rhizosphere Soil. Pedosphere 2024, 34, 699–708. [Google Scholar] [CrossRef]
  225. Ventura Foods Palm Oil. Finished Product Safety Data Sheet (SDS). 2020. Available online: https://www.venturafoods.com/wp-content/uploads/2022/01/VF-SDS-Palm-Oil-1.pdf (accessed on 9 October 2024).
  226. Lake Champlain Chocolates Why Is Palm Oil Bad? Lake Champlain Chocolates. 2024. Available online: https://www.lakechamplainchocolates.com/palm-oil/ (accessed on 9 October 2024).
  227. Andreoni, M. Why Palm Oil Is Still a Big Problem? New York Times, Climate, 26 March 2024. Available online: https://www.nytimes.com/2024/03/26/climate/why-palm-oil-is-still-a-big-problem.html (accessed on 9 October 2024).
  228. Mandeep; Gupta, G.K.; Liu, H.; Shukla, P. Pulp and Paper Industry–Based Pollutants, Their Health Hazards and Environmental Risks. Curr. Opin. Environ. Sci. Health 2019, 12, 48–56. [Google Scholar] [CrossRef]
  229. Stronach, S.M.; Rudd, T.; Lester, J.N. Toxic Substances in Anaerobic Digestion. In Anaerobic Digestion Processes in Industrial Wastewater Treatment; Biotechnology Monographs; Springer: Berlin/Heidelberg, Germany, 1986; Volume 2, pp. 71–92. ISBN 978-3-642-71217-3. [Google Scholar] [CrossRef]
  230. Rudziak, P.; Batung, E.; Luginaah, I. The Effects of Gases from Food Waste on Human Health: A Systematic Review. PLoS ONE 2024, 19, e0300801. [Google Scholar] [CrossRef] [PubMed]
  231. University College Cork Risk Assessment for Genetically Modified Micro-Organisms [GMMs] Class 1 & Class 2. 2001. Available online: https://www.ucc.ie/en/media/research/biosafety/GMM_C1.pdf (accessed on 9 October 2024).
  232. Prevent & Protect Enterobacter Cloacae. 2024. Available online: https://prevent-and-protect.com/pathogen/enterobacter-cloacae-en/ (accessed on 9 October 2024).
  233. Ramirez, D.; Giron, M. Enterobacter Infections. In StatPearls; StatPearls Publishing: Treasure Island, FL, USA, 2024. [Google Scholar]
  234. Rinne, C. Factors Affecting Wastewater Characteristics in Beverage Industry: Reduction of Environmental Load and Wastewater Treatment. Master’s Thesis, Lahti University of Technology, Lahti, Finland, 2024. [Google Scholar]
  235. Cornell, T. Supercharge Your Gut Health. 2024. Available online: https://www.sutterhealth.org/health/how-gut-health-affects-weight (accessed on 9 October 2024).
  236. An, J.; Kwon, H.; Kim, Y.J. The Firmicutes/Bacteroidetes Ratio as a Risk Factor of Breast Cancer. JCM 2023, 12, 2216. [Google Scholar] [CrossRef] [PubMed]
  237. Lewis, J. How Does Food Waste Affect the Environment? Earth, 17 October 2022. Available online: https://earth.org/how-does-food-waste-affect-the-environment/ (accessed on 9 October 2024).
  238. Move for Hunger The Environmental Impact of Food Waste. Move for Hunger. 2024. Available online: https://www.send2press.com/wire/profile/move-for-hunger/ (accessed on 9 October 2024).
  239. Godlewska, P.; Ok, Y.S.; Oleszczuk, P. The Dark Side of Black Gold: Ecotoxicological Aspects of Biochar and Biochar-Amended Soils. J. Hazard. Mater. 2021, 403, 123833. [Google Scholar] [CrossRef] [PubMed]
  240. Newman, M. Biochar. Safety Data Sheet. 2019. Available online: https://ariescleantech.com/wp-content/uploads/2020/11/Aries-GREENE284A2-Biochar-Safety-Data-Sheet.pdf (accessed on 9 October 2024).
  241. Gallego-Ramírez, C.; Chica, E.; Rubio-Clemente, A. Life Cycle Assessment of Raw and Fe-Modified Biochars: Contributing to Circular Economy. Materials 2023, 16, 6059. [Google Scholar] [CrossRef]
  242. Environmental Business Specialists MicroStart. Safety Data Sheet. 2021. Available online: https://www.ebsbiowizard.com/wp-content/uploads/2021/11/EBS-SDS-MicroStart%E2%84%A2.pdf (accessed on 9 October 2024).
  243. Tang, R.; Luo, H.; Prommer, H.; Yue, Z.; Wang, W.; Su, K.; Hu, Z.-H. Response of Anaerobic Granular Sludge to Long-Term Loading of Roxarsone: From Macro- to Micro-Scale Perspective. Water Res. 2021, 204, 117599. [Google Scholar] [CrossRef] [PubMed]
  244. FAO and IFAD Strategic Environmental Assessment. An Assessment of the Impact of Cassava Production and Processing on the Environment and Biodiversity. In Proceedings of the Validation Forum on the Global Cassava Development Strategy; Food and Agriculture Organization of the United Nations International Fund for Agricultural Development, Rome, Italy, 26 April 2000; Volume 5. [Google Scholar]
  245. Pereira, I.G.; Vagula, J.M.; Marchi, D.F.; Barão, C.E.; Almeida, G.R.S.; Visentainer, J.V.; Maruyama, S.A.; Santos Júnior, O.O. Easy Method for Removal of Cyanogens from Cassava Leaves with Retention of Vitamins and Omega-3 Fatty Acids. J. Braz. Chem. Soc. 2016, 27, 1290–1296. [Google Scholar] [CrossRef]
  246. Alves, C.A.; Vicente, E.D.; Evtyugina, M.; Vicente, A.; Pio, C.; Amado, M.F.; Mahía, P.L. Gaseous and Speciated Particulate Emissions from the Open Burning of Wastes from Tree Pruning. Atmos. Res. 2019, 226, 110–121. [Google Scholar] [CrossRef]
  247. Singh, A.K.; Kumar, A.; Chandra, R. Environmental Pollutants of Paper Industry Wastewater and Their Toxic Effects on Human Health and Ecosystem. Bioresour. Technol. Rep. 2022, 20, 101250. [Google Scholar] [CrossRef]
  248. Stuart, P. The Advantages and Disadvantages of Anaerobic Digestion as a Renewable Energy Source. 2022. Available online: https://www.maths.tcd.ie/~jlennon/miniprojects/biomass.doc (accessed on 9 October 2024).
  249. Duan, B.; Feng, Q. Comparison of the Potential Ecological and Human Health Risks of Heavy Metals from Sewage Sludge and Livestock Manure for Agricultural Use. Toxics 2021, 9, 145. [Google Scholar] [CrossRef]
  250. Lubentsov, V.; Ozhogova, E.; Lubentsova, E.; Shakhray, E. Selection and Justification of Priority Tasks of Biogas Plant Management Taking into Account Technological Risks. E3S Web Conf. 2021, 285, 04006. [Google Scholar] [CrossRef]
  251. Srivastava, N.; Singh, R.; Lal, B.; Haque, S. Evaluation of Bioprocess Parameters for Pilot Scale Fermentative Biohydrogen Production Using Organic Waste: Environmental Remediation, Techno-Economic Challenges & Future Solutions. Int. J. Hydrogen Energy 2024, S0360319924018986. [Google Scholar] [CrossRef]
  252. Venkata Mohan, S.; Mohanakrishna, G.; Srikanth, S. Biohydrogen Production from Industrial Effluents. In Biofuels: Alternative Feedstocks and Conversion Processes; Pandey, A., Ed.; Academic Press: Oxford, UK; Burlington, MA, USA, 2011; Chapter 22; pp. 499–524. ISBN 978-0-12-385099-7. Available online: https://shop.elsevier.com/books/biofuels/unknown/978-0-12-385099-7 (accessed on 9 October 2024).
  253. Wang, J.; Yin, Y. Influencing Factors for Biohydrogen Production. In Biohydrogen Production from Organic Wastes; Green Energy and Technology; Springer: Singapore, 2017; pp. 197–268. ISBN 978-981-10-4675-9. [Google Scholar] [CrossRef]
  254. Ananthi, V.; Bora, A.; Ramesh, U.; Yuvakkumar, R.; Raja, K.; Ponnuchamy, K.; Muthusamy, G.; Arun, A. A Review on the Technologies for Sustainable Biohydrogen Production. Process Saf. Environ. Prot. 2024, 186, 944–956. [Google Scholar] [CrossRef]
  255. Zhang, H.; Li, J.; Zhang, Q.; Zhu, S.; Yang, S.; Zhang, Z. Effect of Substrate Concentration on Photo-Fermentation Bio-Hydrogen Production Process from Starch-Rich Agricultural Leftovers under Oscillation. Sustainability 2020, 12, 2700. [Google Scholar] [CrossRef]
  256. Aathika, A.R.S.; Kubendran, D.; Yuvarani, M.; Thiruselvi, D.; Amudha, T.; Karthik, P.; Sivanesan, S. Enhanced Biohydrogen Production from Leather Fleshing Waste Co-Digested with Tannery Treatment Plant Sludge Using Anaerobic Hydrogenic Batch Reactor. Energy Sources Part A Recovery Util. Environ. Eff. 2018, 40, 586–593. [Google Scholar] [CrossRef]
  257. Sharma, R.K.; Nazari, M.A.; Haydary, J.; Singh, T.P.; Mandal, S. A Review on Advanced Processes of Biohydrogen Generation from Lignocellulosic Biomass with Special Emphasis on Thermochemical Conversion. Energies 2023, 16, 6349. [Google Scholar] [CrossRef]
  258. Hallenbeck, P.C. Bioenergy from Microorganisms: An Overview. In Microbial Bioenergy: Hydrogen Production; Zannoni, D., De Philippis, R., Eds.; Advances in photosynthesis and respiration; Springer: Dordrecht, The Netherlands; New York, NY, USA, 2014; Volume 38, pp. 3–21. ISBN 978-94-017-8554-9. [Google Scholar] [CrossRef]
  259. Yang, D.; Zhang, Y.; Barupal, D.K.; Fan, X.; Gustafson, R.; Guo, R.; Fiehn, O. Metabolomics of Photobiological Hydrogen Production Induced by CCCP in Chlamydomonas Reinhardtii. Int. J. Hydrogen Energy 2014, 39, 150–158. [Google Scholar] [CrossRef]
  260. Chen, W.; Li, T.; Ren, Y.; Wang, J.; Chen, H.; Wang, Q. Biological Hydrogen with Industrial Potential: Improvement and Prospection in Biohydrogen Production. J. Clean. Prod. 2023, 387, 135777. [Google Scholar] [CrossRef]
  261. McNeely, K.; Xu, Y.; Bennette, N.; Bryant, D.A.; Dismukes, G.C. Redirecting Reductant Flux into Hydrogen Production via Metabolic Engineering of Fermentative Carbon Metabolism in a Cyanobacterium. Appl. Environ. Microbiol. 2010, 76, 5032–5038. [Google Scholar] [CrossRef] [PubMed]
  262. Azwar, M.Y.; Hussain, M.A.; Abdul-Wahab, A.K. Development of Biohydrogen Production by Photobiological, Fermentation and Electrochemical Processes: A Review. Renew. Sustain. Energy Rev. 2014, 31, 158–173. [Google Scholar] [CrossRef]
  263. Singh, A.; Sevda, S.; Abu Reesh, I.; Vanbroekhoven, K.; Rathore, D.; Pant, D. Biohydrogen Production from Lignocellulosic Biomass: Technology and Sustainability. Energies 2015, 8, 13062–13080. [Google Scholar] [CrossRef]
  264. Moon, C.; Jang, S.; Yun, Y.-M.; Lee, M.-K.; Kim, D.-H.; Kang, W.-S.; Kwak, S.-S.; Kim, M.-S. Effect of the Accuracy of pH Control on Hydrogen Fermentation. Bioresour. Technol. 2015, 179, 595–601. [Google Scholar] [CrossRef] [PubMed]
  265. Obiora, N.K.; Ujah, C.O.; Asadu, C.O.; Kolawole, F.O.; Ekwueme, B.N. Production of Hydrogen Energy from Biomass: Prospects and Challenges. Green Technol. Sustain. 2024, 2, 100100. [Google Scholar] [CrossRef]
  266. Willey, J.M.; Sherwood, L.; Woolverton, C.J.; Prescott, L.M.; Willey, J.M. Prescott’s Microbiology, 8th ed.; McGraw-Hill: New York, NY, USA, 2011; ISBN 978-0-07-337526-7. [Google Scholar] [CrossRef]
  267. Giang, T.T.; Lunprom, S.; Liao, Q.; Reungsang, A.; Salakkam, A. Enhancing Hydrogen Production from Chlorella Sp. Biomass by Pre-Hydrolysis with Simultaneous Saccharification and Fermentation (PSSF). Energies 2019, 12, 908. [Google Scholar] [CrossRef]
  268. Wang, J.; Yin, Y. Fermentative Hydrogen Production Using Various Biomass-Based Materials as Feedstock. Renew. Sustain. Energy Rev. 2018, 92, 284–306. [Google Scholar] [CrossRef]
  269. Kumar, G.; Shobana, S.; Nagarajan, D.; Lee, D.-J.; Lee, K.-S.; Lin, C.-Y.; Chen, C.-Y.; Chang, J.-S. Biomass Based Hydrogen Production by Dark Fermentation—Recent Trends and Opportunities for Greener Processes. Curr. Opin. Biotechnol. 2018, 50, 136–145. [Google Scholar] [CrossRef] [PubMed]
  270. Li, S.; Guo, L. Stability and Activity of a Co-Precipitated Mg Promoted Ni/Al2O3 Catalyst for Supercritical Water Gasification of Biomass. Int. J. Hydrogen Energy 2019, 44, 15842–15852. [Google Scholar] [CrossRef]
  271. Asadu, C.O.; Aneke, N.G.; Egbuna, S.O.; Agulanna, A.C. Comparative Studies on the Impact of Bio-Fertilizer Produced from Agro-Wastes Using Thermo-Tolerant Actinomycetes on the Growth Performance of Maize (Zea-Mays) and Okro (Abelmoschus Esculentus). Environ. Technol. Innov. 2018, 12, 55–71. [Google Scholar] [CrossRef]
  272. Asadu, C.O.; Ike, I.S.; Onu, C.E.; Egbuna, S.O.; Onoh, M.; Mbah, G.O.; Eze, C.N. Investigation of the Influence of Biofertilizer Synthesized Using Microbial Inoculums on the Growth Performance of Two Agricultural Crops. Biotechnol. Rep. 2020, 27, e00493. [Google Scholar] [CrossRef] [PubMed]
  273. Yang, Q.; Han, F.; Chen, Y.; Yang, H.; Chen, H. Greenhouse Gas Emissions of a Biomass-Based Pyrolysis Plant in China. Renew. Sustain. Energy Rev. 2016, 53, 1580–1590. [Google Scholar] [CrossRef]
  274. Forest Research Carbon Emissions of Different Fuels. 2024. Available online: https://www.forestresearch.gov.uk/tools-and-resources/fthr/biomass-energy-resources/reference-biomass/facts-figures/carbon-emissions-of-different-fuels/ (accessed on 9 October 2024).
  275. El-Shafie, M.; Kambara, S.; Hayakawa, Y. Hydrogen Production Technologies Overview. J. Power Energy Eng. 2019, 07, 107–154. [Google Scholar] [CrossRef]
  276. Ramdon Safety Protocols in CO2 Handling: Ensuring Workplace Safety and Compliance. 2024. Available online: https://ramdon.com/safety-protocols-in-co2-handling/ (accessed on 9 October 2024).
  277. Zhao, X.-Y.; Ren, J.; Cao, J.-P.; Wei, F.; Zhu, C.; Fan, X.; Zhao, Y.-P.; Wei, X.-Y. Catalytic Reforming of Volatiles from Biomass Pyrolysis for Hydrogen-Rich Gas Production over Limonite Ore. Energy Fuels 2017, 31, 4054–4060. [Google Scholar] [CrossRef]
  278. Dong, L.; Wu, C.; Ling, H.; Shi, J.; Williams, P.T.; Huang, J. Promoting Hydrogen Production and Minimizing Catalyst Deactivation from the Pyrolysis-Catalytic Steam Reforming of Biomass on Nanosized NiZnAlOx Catalysts. Fuel 2017, 188, 610–620. [Google Scholar] [CrossRef]
  279. Zhang, M.; Zhang, C.; Zhu, B.; Wang, C.; Jia, X.; Guan, G.; Zeng, X.; Hu, E.; Han, Z.; Xu, G. Pyrolysis of Biomass to Produce H-Rich Gas Facilitated by Simultaneously Occurring Magnesite Decomposition. Carbon Resour. Convers. 2024, 100265. [Google Scholar] [CrossRef]
  280. Dhyani, V.; Bhaskar, T. A Comprehensive Review on the Pyrolysis of Lignocellulosic Biomass. Renew. Energy 2018, 129, 695–716. [Google Scholar] [CrossRef]
  281. Chen, W.-H.; Farooq, W.; Shahbaz, M.; Naqvi, S.R.; Ali, I.; Al-Ansari, T.; Saidina Amin, N.A. Current Status of Biohydrogen Production from Lignocellulosic Biomass, Technical Challenges and Commercial Potential through Pyrolysis Process. Energy 2021, 226, 120433. [Google Scholar] [CrossRef]
  282. Lepage, T.; Kammoun, M.; Schmetz, Q.; Richel, A. Biomass-to-Hydrogen: A Review of Main Routes Production, Processes Evaluation and Techno-Economical Assessment. Biomass Bioenergy 2021, 144, 105920. [Google Scholar] [CrossRef]
  283. Parthasarathy, P.; Narayanan, K.S. Hydrogen Production from Steam Gasification of Biomass: Influence of Process Parameters on Hydrogen Yield—A Review. Renew. Energy 2014, 66, 570–579. [Google Scholar] [CrossRef]
  284. Jerzak, W.; Acha, E.; Li, B. Comprehensive Review of Biomass Pyrolysis: Conventional and Advanced Technologies, Reactor Designs, Product Compositions and Yields, and Techno-Economic Analysis. Energies 2024, 17, 5082. [Google Scholar] [CrossRef]
  285. Airgas USA, LLC. Nitrogen CAS Number 7727-37-9. 2021. Available online: https://www.airgas.com/msds/001040.pdf (accessed on 9 October 2024).
  286. Naqvi, S.R.; Prabhakara, H.M.; Bramer, E.A.; Dierkes, W.; Akkerman, R.; Brem, G. A Critical Review on Recycling of End-of-Life Carbon Fibre/Glass Fibre Reinforced Composites Waste Using Pyrolysis towards a Circular Economy. Resour. Conserv. Recycl. 2018, 136, 118–129. [Google Scholar] [CrossRef]
  287. Arregi, A.; Lopez, G.; Amutio, M.; Barbarias, I.; Bilbao, J.; Olazar, M. Hydrogen Production from Biomass by Continuous Fast Pyrolysis and In-Line Steam Reforming. RSC Adv. 2016, 6, 25975–25985. [Google Scholar] [CrossRef]
  288. Byrd, A.J.; Kumar, S.; Kong, L.; Ramsurn, H.; Gupta, R.B. Hydrogen Production from Catalytic Gasification of Switchgrass Biocrude in Supercritical Water. Int. J. Hydrogen Energy 2011, 36, 3426–3433. [Google Scholar] [CrossRef]
  289. Kim, J.; Ryu, B.-G.; Kim, B.-K.; Han, J.-I.; Yang, J.-W. Continuous Microalgae Recovery Using Electrolysis with Polarity Exchange. Bioresour. Technol. 2012, 111, 268–275. [Google Scholar] [CrossRef] [PubMed]
  290. Liu, P.; Wang, Y.; Zhou, Z.; Yuan, H.; Zheng, T.; Chen, Y. Effect of Carbon Structure on Hydrogen Release Derived from Different Biomass Pyrolysis. Fuel 2020, 271, 117638. [Google Scholar] [CrossRef]
  291. Fahmy, T.Y.A.; Fahmy, Y.; Mobarak, F.; El-Sakhawy, M.; Abou-Zeid, R.E. Biomass Pyrolysis: Past, Present, and Future. Environ. Dev. Sustain. 2020, 22, 17–32. [Google Scholar] [CrossRef]
  292. Adam, J.; Blazso, M.; Meszaros, E.; Stocker, M.; Nilsen, M.; Bouzga, A.; Hustad, J.; Gronli, M.; Oye, G. Pyrolysis of Biomass in the Presence of Al-MCM-41 Type Catalysts. Fuel 2005, S0016236105000578. [Google Scholar] [CrossRef]
  293. Prasertcharoensuk, P.; Bull, S.J.; Phan, A.N. Gasification of Waste Biomass for Hydrogen Production: Effects of Pyrolysis Parameters. Renew. Energy 2019, 143, 112–120. [Google Scholar] [CrossRef]
  294. Al Arni, S. Comparison of Slow and Fast Pyrolysis for Converting Biomass into Fuel. Renew. Energy 2018, 124, 197–201. [Google Scholar] [CrossRef]
  295. Yue, Y.; Lin, Q.; Irfan, M.; Chen, Q.; Zhao, X. Characteristics and Potential Values of Bio-Oil, Syngas and Biochar Derived from Salsola Collina Pall. in a Fixed Bed Slow Pyrolysis System. Bioresour. Technol. 2016, 220, 378–383. [Google Scholar] [CrossRef] [PubMed]
  296. Cheng, S.; Shu, J.; Xia, H.; Wang, S.; Zhang, L.; Peng, J.; Li, C.; Jiang, X.; Zhang, Q. Pyrolysis of Crofton Weed for the Production of Aldehyde Rich Bio-Oil and Combustible Matter Rich Bio-Gas. Appl. Therm. Eng. 2019, 148, 1164–1170. [Google Scholar] [CrossRef]
  297. Rusin, A.; Stolecka-Antczak, K. Assessment of Syngas Storage Tank Hazards Taking Account of the Domino Effect. Energies 2024, 17, 1857. [Google Scholar] [CrossRef]
  298. Work Safe BC Reducing Risk of Syngas Fires Explosions When Drying Wood Fibre. 2024. Available online: https://www.worksafebc.com/resources/health-safety/hazard-alerts/reducing-risk-of-syngas-fires-explosions-when-drying-wood-fibre%3Flang%3Den%26direct (accessed on 9 October 2024).
  299. Stolecka, K.; Rusin, A. Analysis of Hazards Related to Syngas Production and Transport. Renew. Energy 2020, 146, 2535–2555. [Google Scholar] [CrossRef]
  300. Nandan, A.; Siddiqui, N.A.; Mondal, P.; Chaudhary, K.; Pandey, R. Hazards Associated to Synthesis Gas and Its Mitigation Measures. Res. J. Eng. Tech. 2014, 5, 144–146. [Google Scholar]
  301. Safdari, M.-S.; Amini, E.; Weise, D.R.; Fletcher, T.H. Heating Rate and Temperature Effects on Pyrolysis Products from Live Wildland Fuels. Fuel 2019, 242, 295–304. [Google Scholar] [CrossRef]
  302. Bakhtyari, A.; Makarem, M.A.; Rahimpour, M.R. Hydrogen Production Through Pyrolysis. In Fuel Cells and Hydrogen Production; Lipman, T.E., Weber, A.Z., Eds.; Springer: New York, NY, USA, 2019; pp. 947–973. ISBN 978-1-4939-7788-8. [Google Scholar] [CrossRef]
  303. Liu, S.; Zhu, J.; Chen, M.; Xin, W.; Yang, Z.; Kong, L. Hydrogen Production via Catalytic Pyrolysis of Biomass in a Two-Stage Fixed Bed Reactor System. Int. J. Hydrogen Energy 2014, 39, 13128–13135. [Google Scholar] [CrossRef]
  304. Navarro, R.M.; Sanchez-Sanchez, M.C.; Alvarez-Galvan, M.C.; Fierro, J.L.G.; Al-Zaharani, S.M. Hydrogen Production from Renewables. In Encyclopedia of Inorganic and Bioinorganic Chemistry; Scott, R.A., Ed.; Wiley: Hoboken, NJ, USA, 2011; ISBN 978-1-119-95143-8. [Google Scholar] [CrossRef]
  305. Czernik, S.; Evans, R.; French, R. Hydrogen from Biomass-Production by Steam Reforming of Biomass Pyrolysis Oil. Catal. Today 2007, 129, 265–268. [Google Scholar] [CrossRef]
  306. Arregi, A.; Amutio, M.; Lopez, G.; Bilbao, J.; Olazar, M. Evaluation of Thermochemical Routes for Hydrogen Production from Biomass: A Review. Energy Convers. Manag. 2018, 165, 696–719. [Google Scholar] [CrossRef]
  307. Lan, P.; Xu, Q.; Zhou, M.; Lan, L.; Zhang, S.; Yan, Y. Catalytic Steam Reforming of Fast Pyrolysis Bio-Oil in Fixed Bed and Fluidized Bed Reactors. Chem. Eng. Amp. Technol. 2010, 33, 2021–2028. [Google Scholar] [CrossRef]
  308. Kintek Solution Ltd. The Advantages and Disadvantages of Different Biomass Feedstocks for Pyrolysis. 2024. Available online: https://kindle-tech.com/articles/the-advantages-and-disadvantages-of-different-biomass-feedstocks-for-pyrolysis (accessed on 9 October 2024).
  309. Elsdon, R.; Pal, D. Waste-to-Energy Plant Process Safety Challenges. IChemE Symp. Ser. 2011, 156, 356–360. [Google Scholar]
  310. Ndirangu, S.M.; Liu, Y.; Xu, K.; Song, S. Risk Evaluation of Pyrolyzed Biochar from Multiple Wastes. J. Chem. 2019, 2019, 1–28. [Google Scholar] [CrossRef]
  311. Pang, Y.X.; Foo, D.C.Y.; Yan, Y.; Sharmin, N.; Lester, E.; Wu, T.; Pang, C.H. Analysis of Environmental Impacts and Energy Derivation Potential of Biomass Pyrolysis via Piper Diagram. J. Anal. Appl. Pyrolysis 2021, 154, 104995. [Google Scholar] [CrossRef]
  312. Reza, M.T.; Andert, J.; Wirth, B.; Busch, D.; Pielert, J.; Lynam, J.G.; Mumme, J. Hydrothermal Carbonization of Biomass for Energy and Crop Production. Appl. Bioenergy 2014, 1, 11–29. [Google Scholar] [CrossRef]
  313. Zanon Costa, C.; Falabella Sousa-Aguiar, E.; Peixoto Gimenes Couto, M.A.; Souza De Carvalho Filho, J.F. Hydrothermal Treatment of Vegetable Oils and Fats Aiming at Yielding Hydrocarbons: A Review. Catalysts 2020, 10, 843. [Google Scholar] [CrossRef]
  314. Cao, L.; Yu, I.K.M.; Xiong, X.; Tsang, D.C.W.; Zhang, S.; Clark, J.H.; Hu, C.; Ng, Y.H.; Shang, J.; Ok, Y.S. Biorenewable Hydrogen Production through Biomass Gasification: A Review and Future Prospects. Environ. Res. 2020, 186, 109547. [Google Scholar] [CrossRef] [PubMed]
  315. Rahman, M.M.; Henriksen, U.B.; Ciolkosz, D. Startup Process, Safety and Risk Assessment of Biomass Gasification for off-Grid Rural Electrification. Sci. Rep. 2023, 13, 21395. [Google Scholar] [CrossRef]
  316. Herdin, G.; Robitschko, R.; Klausner, J. Gaseous Emissions Experience of GE Jenbacher with Wood Gas. In Proceedings of the International Workshop of Health, Safety and Environment of Biomass Gasification, Innsbruck, Austria, 28 September 2005; pp. 30–47. [Google Scholar]
  317. San Miguel, G.; Domínguez, M.P.; Hernández, M.; Sanz-Pérez, F. Characterization and Potential Applications of Solid Particles Produced at a Biomass Gasification Plant. Biomass Bioenergy 2012, 47, 134–144. [Google Scholar] [CrossRef]
  318. Kampa, M.; Castanas, E. Human Health Effects of Air Pollution. Environ. Pollut. 2008, 151, 362–367. [Google Scholar] [CrossRef] [PubMed]
  319. CAC. GAS & Instrumentation Carbon Monoxide (CO)—Gas Hazards & Workplace Safety. 2025. Available online: https://cacgas.com.au/blog/carbon-monoxide-co-toxic-gas-workplace-safety/ (accessed on 9 October 2024).
  320. CDC National Institute for Occupational Safety and Health (NIOSH). Workplace Carbon Monoxide Hazards. 2024. Available online: https://www.cdc.gov/niosh/carbon-monoxide/about/index.html (accessed on 9 October 2024).
  321. EPA Sulfur Dioxide Basics. 2024. Available online: https://www.epa.gov/so2-pollution/sulfur-dioxide-basics (accessed on 9 October 2024).
  322. NZ Ministry for the Environment Sulphur Dioxide. 2021. Available online: https://environment.govt.nz/facts-and-science/air/air-pollutants/sulphur-dioxide-and-effects-on-health/ (accessed on 9 October 2024).
  323. Mitra, D.; Basak, R.; Nilanjan, S.; Deepak, P. A Note on Prevention and Control of Sulfur Oxide Polution. Int. J. Eng. Sci. Technol. 2010, 2, 3926–3928. [Google Scholar]
  324. Agency for the Registry of Toxic Substances and Diseases ToxFAQs for Nitrogen Oxides. 2024. Available online: https://www.atsdr.cdc.gov/index.html (accessed on 9 October 2024).
  325. Alves, L.; Holz, L.I.V.; Fernandes, C.; Ribeirinha, P.; Mendes, D.; Fagg, D.P.; Mendes, A. A Comprehensive Review of NOx and N2O Mitigation from Industrial Streams. Renew. Sustain. Energy Rev. 2022, 155, 111916. [Google Scholar] [CrossRef]
  326. Lewtas, J. Air Pollution Combustion Emissions: Characterization of Causative Agents and Mechanisms Associated with Cancer, Reproductive, and Cardiovascular Effects. Mutat. Res./Rev. Mutat. Res. 2007, 636, 95–133. [Google Scholar] [CrossRef] [PubMed]
  327. CARB. Inhalable Particulate Matter and Health (PM2.5 and PM10). 2025. Available online: https://ww2.arb.ca.gov/resources/inhalable-particulate-matter-and-health (accessed on 9 October 2024).
  328. N.Y. Department of Health. Particle Pollution and Health. 2024. Available online: https://www.health.ny.gov/environmental/indoors/air/pmq_a.htm (accessed on 9 October 2024).
  329. Consensus Task Force, E.; Shi, X.; Duan, G. China CDC Key Laboratory of Environment and Population Health, National Institute of Environmental Health, Chinese Center for Disease Control and Prevention, Beijing, China; School of Public Health, Zhengzhou University, Zhengzhou, Henan, China Recommendations of Controlling and Preventing Acute Health Risks of Fine Particulate Matter Pollution—China, 2021. China CDC Wkly. 2022, 4, 329–341. [Google Scholar] [CrossRef]
  330. Luo, X.; Wu, T.; Shi, K.; Song, M.; Rao, Y. Biomass Gasification: An Overview of Technological Barriers and Socio-Environmental Impact. In Gasification for Low-Grade Feedstock; Yun, Y., Ed.; InTech: London, UK, 2018; ISBN 978-1-78923-288-2. [Google Scholar]
  331. Cordella, M.; Torri, C.; Adamiano, A.; Fabbri, D.; Barontini, F.; Cozzani, V. Bio-Oils from Biomass Slow Pyrolysis: A Chemical and Toxicological Screening. J. Hazard. Mater. 2012, 231–232, 26–35. [Google Scholar] [CrossRef] [PubMed]
  332. Chewron Renevable Energy Group REG Bio-Residual Oil®. 2023. Available online: https://www.regi.com/products/other-products/bio-residual-oil (accessed on 9 October 2024).
  333. Shiva Kumar, S.; Himabindu, V. Hydrogen Production by PEM Water Electrolysis—A Review. Mater. Sci. Energy Technol. 2019, 2, 442–454. [Google Scholar] [CrossRef]
  334. Teoh, R.H.; Mahajan, A.S.; Moharir, S.R.; Abdul Manaf, N.; Shi, S.; Thangalazhy-Gopakumar, S. A Review on Hydrothermal Treatments for Solid, Liquid and Gaseous Fuel Production from Biomass. Energy Nexus 2024, 14, 100301. [Google Scholar] [CrossRef]
  335. Nizamuddin, S.; Baloch, H.A.; Griffin, G.J.; Mubarak, N.M.; Bhutto, A.W.; Abro, R.; Mazari, S.A.; Ali, B.S. An Overview of Effect of Process Parameters on Hydrothermal Carbonization of Biomass. Renew. Sustain. Energy Rev. 2017, 73, 1289–1299. [Google Scholar] [CrossRef]
  336. Pallarés, J.; González-Cencerrado, A.; Arauzo, I. Production and Characterization of Activated Carbon from Barley Straw by Physical Activation with Carbon Dioxide and Steam. Biomass Bioenergy 2018, 115, 64–73. [Google Scholar] [CrossRef]
  337. Gollakota, A.R.K.; Kishore, N.; Gu, S. A Review on Hydrothermal Liquefaction of Biomass. Renew. Sustain. Energy Rev. 2018, 81, 1378–1392. [Google Scholar] [CrossRef]
  338. El Bast, M.; Allam, N.; Abou Msallem, Y.; Awad, S.; Loubar, K. A Review on Continuous Biomass Hydrothermal Liquefaction Systems: Process Design and Operating Parameters Effects on Biocrude. J. Energy Inst. 2023, 108, 101260. [Google Scholar] [CrossRef]
  339. Okolie, J.A.; Epelle, E.I.; Nanda, S.; Castello, D.; Dalai, A.K.; Kozinski, J.A. Modeling and Process Optimization of Hydrothermal Gasification for Hydrogen Production: A Comprehensive Review. J. Supercrit. Fluids 2021, 173, 105199. [Google Scholar] [CrossRef]
  340. Nanda, S.; Rana, R.; Hunter, H.N.; Fang, Z.; Dalai, A.K.; Kozinski, J.A. Hydrothermal Catalytic Processing of Waste Cooking Oil for Hydrogen-Rich Syngas Production. Chem. Eng. Sci. 2019, 195, 935–945. [Google Scholar] [CrossRef]
  341. Lee, C.S.; Conradie, A.V.; Lester, E. Review of Supercritical Water Gasification with Lignocellulosic Real Biomass as the Feedstocks: Process Parameters, Biomass Composition, Catalyst Development, Reactor Design and Its Challenges. Chem. Eng. J. 2021, 415, 128837. [Google Scholar] [CrossRef]
  342. Titirici, M.-M.; Antonietti, M. Chemistry and Materials Options of Sustainable Carbon Materials Made by Hydrothermal Carbonization. Chem. Soc. Rev. 2010, 39, 103–116. [Google Scholar] [CrossRef] [PubMed]
  343. Kubo, S. Nanostructured Carbohydrate—Derived Carbonaceous Materials. Tanso 2013, 2013, 232–233. [Google Scholar] [CrossRef]
  344. Pandey, B.; Prajapati, Y.K.; Sheth, P.N. Recent Progress in Thermochemical Techniques to Produce Hydrogen Gas from Biomass: A State of the Art Review. Int. J. Hydrogen Energy 2019, 44, 25384–25415. [Google Scholar] [CrossRef]
  345. Sivaprasad, S.; Manandhar, A.; Shah, A. Hydrothermal Carbonization: Upgrading Waste Biomass to Char. 2021. Available online: https://ohioline.osu.edu/factsheet/fabe-6622 (accessed on 9 October 2024).
  346. Jaruwat, D.; Udomsap, P.; Chollacoop, N.; Fuji, M.; Eiad-ua, A. Effects of Hydrothermal Temperature and Time of Hydrochar from Cattail Leaves. AIP Conf. Proc. 2018, 2010, 020016. [Google Scholar] [CrossRef]
  347. Surup, G.R.; Leahy, J.J.; Timko, M.T.; Trubetskaya, A. Hydrothermal Carbonization of Olive Wastes to Produce Renewable, Binder-Free Pellets for Use as Metallurgical Reducing Agents. Renew. Energy 2020, 155, 347–357. [Google Scholar] [CrossRef]
  348. Zhang, Z.; Zhu, Z.; Shen, B.; Liu, L. Insights into Biochar and Hydrochar Production and Applications: A Review. Energy 2019, 171, 581–598. [Google Scholar] [CrossRef]
  349. Ma, J.; Chen, M.; Yang, T.; Liu, Z.; Jiao, W.; Li, D.; Gai, C. Gasification Performance of the Hydrochar Derived from Co-Hydrothermal Carbonization of Sewage Sludge and Sawdust. Energy 2019, 173, 732–739. [Google Scholar] [CrossRef]
  350. Khoshbouy, R.; Takahashi, F.; Yoshikawa, K. Preparation of High Surface Area Sludge-Based Activated Hydrochar via Hydrothermal Carbonization and Application in the Removal of Basic Dye. Environ. Res. 2019, 175, 457–467. [Google Scholar] [CrossRef] [PubMed]
  351. Gautam, R.; Shyam, S.; Reddy, B.R.; Govindaraju, K.; Vinu, R. Microwave-Assisted Pyrolysis and Analytical Fast Pyrolysis of Macroalgae: Product Analysis and Effect of Heating Mechanism. Sustain. Energy Fuels 2019, 3, 3009–3020. [Google Scholar] [CrossRef]
  352. Wang, T.; Zhai, Y.; Zhu, Y.; Li, C.; Zeng, G. A Review of the Hydrothermal Carbonization of Biomass Waste for Hydrochar Formation: Process Conditions, Fundamentals, and Physicochemical Properties. Renew. Sustain. Energy Rev. 2018, 90, 223–247. [Google Scholar] [CrossRef]
  353. Heidari, M.; Dutta, A.; Acharya, B.; Mahmud, S. A Review of the Current Knowledge and Challenges of Hydrothermal Carbonization for Biomass Conversion. J. Energy Inst. 2019, 92, 1779–1799. [Google Scholar] [CrossRef]
  354. Yang, L.; Lu, C.; Gao, Y.; Lin, Y.; Xu, J.; Xu, H.; Zhang, X.; Wang, M.; Zhao, Y.; Yu, C.; et al. Hydrogen-Rich Gas Production from the Gasification of Biomass and Hydrothermal Carbonization (HTC) Aqueous Phase. Biomass Convers. Bioref. 2023, 13, 1529–1538. [Google Scholar] [CrossRef]
  355. Ender, T.; Ekanthalu, V.S.; Jalalipour, H.; Sprafke, J.; Nelles, M. Process Waters from Hydrothermal Carbonization of Waste Biomasses like Sewage Sludge: Challenges, Legal Aspects, and Opportunities in EU and Germany. Water 2024, 16, 1003. [Google Scholar] [CrossRef]
  356. Usman, M.; Cheng, S.; Boonyubol, S.; Cross, J.S. From Biomass to Biocrude: Innovations in Hydrothermal Liquefaction and Upgrading. Energy Convers. Manag. 2024, 302, 118093. [Google Scholar] [CrossRef]
  357. Pedersen, T.H.; Grigoras, I.F.; Hoffmann, J.; Toor, S.S.; Daraban, I.M.; Jensen, C.U.; Iversen, S.B.; Madsen, R.B.; Glasius, M.; Arturi, K.R.; et al. Continuous Hydrothermal Co-Liquefaction of Aspen Wood and Glycerol with Water Phase Recirculation. Appl. Energy 2016, 162, 1034–1041. [Google Scholar] [CrossRef]
  358. Masoumi, S.; Dalai, A.K. Techno-Economic and Life Cycle Analysis of Biofuel Production via Hydrothermal Liquefaction of Microalgae in a Methanol-Water System and Catalytic Hydrotreatment Using Hydrochar as a Catalyst Support. Biomass Bioenergy 2021, 151, 106168. [Google Scholar] [CrossRef]
  359. Alherbawi, M.; Parthasarathy, P.; Al-Ansari, T.; Mackey, H.R.; McKay, G. Potential of Drop-in Biofuel Production from Camel Manure by Hydrothermal Liquefaction and Biocrude Upgrading: A Qatar Case Study. Energy 2021, 232, 121027. [Google Scholar] [CrossRef]
  360. DeRose, K.; DeMill, C.; Davis, R.W.; Quinn, J.C. Integrated Techno Economic and Life Cycle Assessment of the Conversion of High Productivity, Low Lipid Algae to Renewable Fuels. Algal Res. 2019, 38, 101412. [Google Scholar] [CrossRef]
  361. Mishra, R.K.; Kumar, V.; Kumar, P.; Mohanty, K. Hydrothermal Liquefaction of Biomass for Bio-Crude Production: A Review on Feedstocks, Chemical Compositions, Operating Parameters, Reaction Kinetics, Techno-Economic Study, and Life Cycle Assessment. Fuel 2022, 316, 123377. [Google Scholar] [CrossRef]
  362. Geng, J.; Sun, H. Optimization and Analysis of a Hydrogen Liquefaction Process: Energy, Exergy, Economic, and Uncertainty Quantification Analysis. Energy 2023, 262, 125410. [Google Scholar] [CrossRef]
  363. Gholami, T.; Pirsaheb, M. Review on Effective Parameters in Electrochemical Hydrogen Storage. Int. J. Hydrogen Energy 2021, 46, 783–795. [Google Scholar] [CrossRef]
  364. Yoshida, T.; Matsumura, Y. Gasification of Cellulose, Xylan, and Lignin Mixtures in Supercritical Water. Ind. Eng. Chem. Res. 2001, 40, 5469–5474. [Google Scholar] [CrossRef]
  365. Bircan, S.Y.; Matsumoto, K.; Kitagaw, K. Environmental Impacts of Hydrogen Production by Hydrothermal Gasification of a Real Biowaste. In Gasification for Practical Applications; Yun, Y., Ed.; InTech: London, UK, 2012; ISBN 978-953-51-0818-4. [Google Scholar] [CrossRef]
  366. Antal, M.J.; Allen, S.G.; Schulman, D.; Xu, X.; Divilio, R.J. Biomass Gasification in Supercritical Water. Ind. Eng. Chem. Res. 2000, 39, 4040–4053. [Google Scholar] [CrossRef]
  367. Deniz, I.; Vardar-Sukan, F.; Yüksel, M.; Saglam, M.; Ballice, L.; Yesil-Celiktas, O. Hydrogen Production from Marine Biomass by Hydrothermal Gasification. Energy Convers. Manag. 2015, 96, 124–130. [Google Scholar] [CrossRef]
  368. Aziz, M. Integrated Supercritical Water Gasification and a Combined Cycle for Microalgal Utilization. Energy Convers. Manag. 2015, 91, 140–148. [Google Scholar] [CrossRef]
  369. Kruse, A. Supercritical Water Gasification. Biofuels Bioprod. Biorefin. 2008, 2, 415–437. [Google Scholar] [CrossRef]
  370. Peterson, A.A.; Vogel, F.; Lachance, R.P.; Fröling, M.; Antal, M.J., Jr.; Tester, J.W. Thermochemical Biofuel Production in Hydrothermal Media: A Review of Sub- and Supercritical Water Technologies. Energy Environ. Sci. 2008, 1, 32. [Google Scholar] [CrossRef]
  371. Lu, Y.; Guo, L.; Zhang, X.; Yan, Q. Thermodynamic Modeling and Analysis of Biomass Gasification for Hydrogen Production in Supercritical Water. Chem. Eng. J. 2007, 131, 233–244. [Google Scholar] [CrossRef]
  372. Matsumura, Y. Evaluation of Supercritical Water Gasification and Biomethanation for Wet Biomass Utilization in Japan. Energy Convers. Manag. 2002, 43, 1301–1310. [Google Scholar] [CrossRef]
  373. Ro, K.S.; Cantrell, K.; Elliott, D.; Hunt, P.G. Catalytic Wet Gasification of Municipal and Animal Wastes. Ind. Eng. Chem. Res. 2007, 46, 8839–8845. [Google Scholar] [CrossRef]
  374. Calzavara, Y.; Joussot-Dubien, C.; Boissonnet, G.; Sarrade, S. Evaluation of Biomass Gasification in Supercritical Water Process for Hydrogen Production. Energy Convers. Manag. 2005, 46, 615–631. [Google Scholar] [CrossRef]
  375. Crocker, M. (Ed.) Thermochemical Conversion of Biomass to Liquid Fuels and Chemicals; The Royal Society of Chemistry: London, UK, 2010; ISBN 978-1-84973-035-8. [Google Scholar] [CrossRef]
  376. Jayaraman, K.; Gökalp, I. Pyrolysis, Combustion and Gasification Characteristics of Miscanthus and Sewage Sludge. Energy Convers. Manag. 2015, 89, 83–91. [Google Scholar] [CrossRef]
  377. Kumar, P.; Barrett, D.M.; Delwiche, M.J.; Stroeve, P. Methods for Pretreatment of Lignocellulosic Biomass for Efficient Hydrolysis and Biofuel Production. Ind. Eng. Chem. Res. 2009, 48, 3713–3729. [Google Scholar] [CrossRef]
  378. Cengel, Y.A.; Boles, M.A.; Kanoglu, M. Thermodynamics: An Engineering Approach, 9th ed.; McGraw-Hill: New York, NY, USA, 2019; ISBN 978-981-315-787-3. [Google Scholar]
  379. Elliott, D.C. Catalytic Hydrothermal Gasification of Biomass. Biofuels Bioprod. Bioref. 2008, 2, 254–265. [Google Scholar] [CrossRef]
  380. Matsumura, Y.; Minowa, T.; Potic, B.; Kersten, S.; Prins, W.; Vanswaaij, W.; Vandebeld, B.; Elliott, D.; Neuenschwander, G.; Kruse, A. Biomass Gasification in Near- and Super-Critical Water: Status and Prospects. Biomass Bioenergy 2005, 29, 269–292. [Google Scholar] [CrossRef]
  381. Wei, L.; Xu, S.; Zhang, L.; Liu, C.; Zhu, H.; Liu, S. Steam Gasification of Biomass for Hydrogen-Rich Gas in a Free-Fall Reactor. Int. J. Hydrogen Energy 2007, 32, 24–31. [Google Scholar] [CrossRef]
  382. Erkiaga, A.; Lopez, G.; Amutio, M.; Bilbao, J.; Olazar, M. Influence of Operating Conditions on the Steam Gasification of Biomass in a Conical Spouted Bed Reactor. Chem. Eng. J. 2014, 237, 259–267. [Google Scholar] [CrossRef]
  383. Koppatz, S.; Pfeifer, C.; Hofbauer, H. Comparison of the Performance Behaviour of Silica Sand and Olivine in a Dual Fluidised Bed Reactor System for Steam Gasification of Biomass at Pilot Plant Scale. Chem. Eng. J. 2011, 175, 468–483. [Google Scholar] [CrossRef]
  384. Herguido, J.; Corella, J.; Gonzalez-Saiz, J. Steam Gasification of Lignocellulosic Residues in a Fluidized Bed at a Small Pilot Scale. Effect of the Type of Feedstock. Ind. Eng. Chem. Res. 1992, 31, 1274–1282. [Google Scholar] [CrossRef]
  385. Rodriguez Correa, C.; Kruse, A. Supercritical Water Gasification of Biomass for Hydrogen Production—Review. J. Supercrit. Fluids 2018, 133, 573–590. [Google Scholar] [CrossRef]
  386. Khlifi, S.; Pozzobon, V.; Lajili, M. A Comprehensive Review of Syngas Production, Fuel Properties, and Operational Parameters for Biomass Conversion. Energies 2024, 17, 3646. [Google Scholar] [CrossRef]
  387. Copa Rey, J.R.; Tamayo Pacheco, J.J.; António Da Cruz Tarelho, L.; Silva, V.; Cardoso, J.S.; Silveira, J.L.; Tuna, C.E. Evaluation of Cogeneration Alternative Systems Integrating Biomass Gasification Applied to a Brazilian Sugar Industry. Renew. Energy 2021, 178, 318–333. [Google Scholar] [CrossRef]
  388. Briones-Hidrovo, A.; Copa, J.; Tarelho, L.A.C.; Gonçalves, C.; Pacheco Da Costa, T.; Dias, A.C. Environmental and Energy Performance of Residual Forest Biomass for Electricity Generation: Gasification vs. Combustion. J. Clean. Prod. 2021, 289, 125680. [Google Scholar] [CrossRef]
  389. Luo, Y.; Chen, J. Hydrogen Production from Biomass Steam Gasification: Experiment and Simulation. Chem. Eng. Sci. 2024, 292, 120011. [Google Scholar] [CrossRef]
  390. Shen, Y. Biomass Pretreatment for Steam Gasification toward H2-Rich Syngas Production—An Overview. Int. J. Hydrogen Energy 2024, 66, 90–102. [Google Scholar] [CrossRef]
  391. Li, H.; Chen, Z.; Huo, C.; Hu, M.; Guo, D.; Xiao, B. Effect of Bioleaching on Hydrogen-Rich Gas Production by Steam Gasification of Sewage Sludge. Energy Convers. Manag. 2015, 106, 1212–1218. [Google Scholar] [CrossRef]
  392. Pachapur, V.L.; Kutty, P.; Pachapur, P.; Brar, S.K.; Le Bihan, Y.; Galvez-Cloutier, R.; Buelna, G. Seed Pretreatment for Increased Hydrogen Production Using Mixed-Culture Systems with Advantages over Pure-Culture Systems. Energies 2019, 12, 530. [Google Scholar] [CrossRef]
  393. Gai, C.; Guo, Y.; Liu, T.; Peng, N.; Liu, Z. Hydrogen-Rich Gas Production by Steam Gasification of Hydrochar Derived from Sewage Sludge. Int. J. Hydrogen Energy 2016, 41, 3363–3372. [Google Scholar] [CrossRef]
  394. Niu, Y.; Han, F.; Chen, Y.; Lyu, Y.; Wang, L. Experimental Study on Steam Gasification of Pine Particles for Hydrogen-Rich Gas. J. Energy Inst. 2017, 90, 715–724. [Google Scholar] [CrossRef]
  395. Zhang, B.; Zhang, L.; Yang, Z.; Yan, Y.; Pu, G.; Guo, M. Hydrogen-Rich Gas Production from Wet Biomass Steam Gasification with CaO/MgO. Int. J. Hydrogen Energy 2015, 40, 8816–8823. [Google Scholar] [CrossRef]
  396. Chan, Y.H.; Cheah, K.W.; How, B.S.; Loy, A.C.M.; Shahbaz, M.; Singh, H.K.G.; Yusuf, N.R.; Shuhaili, A.F.A.; Yusup, S.; Ghani, W.A.W.A.K.; et al. An Overview of Biomass Thermochemical Conversion Technologies in Malaysia. Sci. Total Environ. 2019, 680, 105–123. [Google Scholar] [CrossRef] [PubMed]
  397. Barbuzza, E.; Buceti, G.; Pozio, A.; Santarelli, M.; Tosti, S. Gasification of Wood Biomass with Renewable Hydrogen for the Production of Synthetic Natural Gas. Fuel 2019, 242, 520–531. [Google Scholar] [CrossRef]
  398. Kruse, A. Hydrothermal Biomass Gasification. J. Supercrit. Fluids 2009, 47, 391–399. [Google Scholar] [CrossRef]
  399. Huber, G.W.; Dumesic, J.A. An Overview of Aqueous-Phase Catalytic Processes for Production of Hydrogen and Alkanes in a Biorefinery. Catal. Today 2006, 111, 119–132. [Google Scholar] [CrossRef]
  400. Cortright, R.D.; Davda, R.R.; Dumesic, J.A. Hydrogen from Catalytic Reforming of Biomass-Derived Hydrocarbons in Liquid Water. Nature 2002, 418, 964–967. [Google Scholar] [CrossRef] [PubMed]
  401. Tanksale, A.; Beltramini, J.N.; Lu, G.M. A Review of Catalytic Hydrogen Production Processes from Biomass. Renew. Sustain. Energy Rev. 2010, 14, 166–182. [Google Scholar] [CrossRef]
  402. Davda, R.R.; Shabaker, J.W.; Huber, G.W.; Cortright, R.D.; Dumesic, J.A. A Review of Catalytic Issues and Process Conditions for Renewable Hydrogen and Alkanes by Aqueous-Phase Reforming of Oxygenated Hydrocarbons over Supported Metal Catalysts. Appl. Catal. B Environ. 2005, 56, 171–186. [Google Scholar] [CrossRef]
  403. He, L.; Yang, J.; Chen, D. Hydrogen from Biomass. In Renewable Hydrogen Technologies; Elsevier: Amsterdam, The Netherlands, 2013; pp. 111–133. ISBN 978-0-444-56352-1. [Google Scholar] [CrossRef]
  404. Harrison, D.P. Sorption-Enhanced Hydrogen Production: A Review. Ind. Eng. Chem. Res. 2008, 47, 6486–6501. [Google Scholar] [CrossRef]
  405. De Lasa, H.; Salaices, E.; Mazumder, J.; Lucky, R. Catalytic Steam Gasification of Biomass: Catalysts, Thermodynamics and Kinetics. Chem. Rev. 2011, 111, 5404–5433. [Google Scholar] [CrossRef] [PubMed]
  406. Erkiaga, A.; Lopez, G.; Amutio, M.; Bilbao, J.; Olazar, M. Steam Gasification of Biomass in a Conical Spouted Bed Reactor with Olivine and γ-Alumina as Primary Catalysts. Fuel Process. Technol. 2013, 116, 292–299. [Google Scholar] [CrossRef]
  407. Balat, H.; Kırtay, E. Hydrogen from Biomass—Present Scenario and Future Prospects. Int. J. Hydrogen Energy 2010, 35, 7416–7426. [Google Scholar] [CrossRef]
  408. Rennard, D.; French, R.; Czernik, S.; Josephson, T.; Schmidt, L. Production of Synthesis Gas by Partial Oxidation and Steam Reforming of Biomass Pyrolysis Oils. Int. J. Hydrogen Energy 2010, 35, 4048–4059. [Google Scholar] [CrossRef]
  409. Pirez, C.; Fang, W.; Capron, M.; Paul, S.; Jobic, H.; Dumeignil, F.; Jalowiecki-Duhamel, L. Steam Reforming, Partial Oxidation and Oxidative Steam Reforming for Hydrogen Production from Ethanol over Cerium Nickel Based Oxyhydride Catalyst. Appl. Catal. A Gen. 2016, 518, 78–86. [Google Scholar] [CrossRef]
  410. Tóth, M.; Varga, E.; Oszkó, A.; Baán, K.; Kiss, J.; Erdőhelyi, A. Partial Oxidation of Ethanol on Supported Rh Catalysts: Effect of the Oxide Support. J. Mol. Catal. A Chem. 2016, 411, 377–387. [Google Scholar] [CrossRef]
  411. Salge, J.; Deluga, G.; Schmidt, L. Catalytic Partial Oxidation of Ethanol over Noble Metal Catalysts. J. Catal. 2005, 235, 69–78. [Google Scholar] [CrossRef]
  412. Gandia, L.M.; Arzamedi, G.; Dieguez, P.M. Hydrogen from Biomass: Advances in Ther-Mochemical Processes; Elsevier: Amsterdam, The Netherlands, 2013. [Google Scholar]
  413. Kumar, M.; Oyedun, A.O.; Kumar, A. A Comparative Analysis of Hydrogen Production from the Thermochemical Conversion of Algal Biomass. Int. J. Hydrogen Energy 2019, 44, 10384–10397. [Google Scholar] [CrossRef]
  414. Osada, M.; Sato, T.; Watanabe, M.; Shirai, M.; Arai, K. Catalytic Gasification of Wood Biomass in Subcritical and Supercritical Water. Combust. Sci. Technol. 2006, 178, 537–552. [Google Scholar] [CrossRef]
  415. Resende, F.L.P.; Savage, P.E. Effect of Metals on Supercritical Water Gasification of Cellulose and Lignin. Ind. Eng. Chem. Res. 2010, 49, 2694–2700. [Google Scholar] [CrossRef]
  416. Razuan, R.; Chen, Q.; Zhang, X.; Sharifi, V.; Swithenbank, J. Pyrolysis and Combustion of Oil Palm Stone and Palm Kernel Cake in Fixed-Bed Reactors. Bioresour. Technol. 2010, 101, 4622–4629. [Google Scholar] [CrossRef] [PubMed]
  417. Razuan, R.; Finney, K.N.; Chen, Q.; Sharifi, V.N.; Swithenbank, J. Pelletised Fuel Production from Palm Kernel Cake. Fuel Process. Technol. 2011, 92, 609–615. [Google Scholar] [CrossRef]
  418. Razuan, R.; Chen, Q.; Finney, K.N.; Russell, N.V.; Sharifi, V.N.; Swithenbank, J. Combustion of Oil Palm Stone in a Pilot-Scale Fluidised Bed Reactor. Fuel Process. Technol. 2011, 92, 2219–2225. [Google Scholar] [CrossRef]
  419. Güngören Madenoğlu, T.; Boukis, N.; Sağlam, M.; Yüksel, M. Supercritical Water Gasification of Real Biomass Feedstocks in Continuous Flow System. Int. J. Hydrogen Energy 2011, 36, 14408–14415. [Google Scholar] [CrossRef]
  420. Azadi, P.; Farnood, R. Review of Heterogeneous Catalysts for Sub- and Supercritical Water Gasification of Biomass and Wastes. Int. J. Hydrogen Energy 2011, 36, 9529–9541. [Google Scholar] [CrossRef]
  421. Watanabe, M.; Inomata, H.; Arai, K. Catalytic Hydrogen Generation from Biomass (Glucose and Cellulose) with ZrO2 in Supercritical Water. Biomass Bioenergy 2002, 22, 405–410. [Google Scholar] [CrossRef]
  422. Park, K.C.; Tomiyasu, H. Gasification Reaction of Organic Compounds Catalyzed by RuO2 in Supercritical Water. Chem. Commun. 2003, 6, 694–695. [Google Scholar] [CrossRef] [PubMed]
  423. Sınaǧ, A.; Kruse, A.; Schwarzkopf, V. Key Compounds of the Hydropyrolysis of Glucose in Supercritical Water in the Presence of K2 CO3. Ind. Eng. Chem. Res. 2003, 42, 3516–3521. [Google Scholar] [CrossRef]
  424. Sutton, D.; Kelleher, B.; Ross, J.R.H. Review of Literature on Catalysts for Biomass Gasification. Fuel Process. Technol. 2001, 73, 155–173. [Google Scholar] [CrossRef]
  425. Paida, V.R.; Kersten, S.R.A.; Van Der Ham, A.G.J.; Brilman, D.W.F. A Two-Step Approach to the Hydrothermal Gasification of Carbohydrate-Rich Wastes: Process Design and Economic Evaluation. Int. J. Hydrogen Energy 2019, 44, 25524–25541. [Google Scholar] [CrossRef]
  426. Zhang, Y.; Li, L.; Xu, P.; Liu, B.; Shuai, Y.; Li, B. Hydrogen Production through Biomass Gasification in Supercritical Water: A Review from Exergy Aspect. Int. J. Hydrogen Energy 2019, 44, 15727–15736. [Google Scholar] [CrossRef]
  427. Lethner, F.; Timmerer, H. Overview on Risk Assessment of Biomass Gasification Plants. In Proceedings of the International Workshop Health, Safety and Environment of Biomass Gasification, Innsbruck, Austria, 18 September 2005; Furnsinn, S., Buhler, R., Hofbauer, H., Eds.; Graz University of Technology: Graz, Austria, 2005; Volume 3, pp. 106–115. [Google Scholar]
  428. Timmerer, H.; Lethner, F. Explosion Parameters and Explosion Protection in Biomass Gasification Plants. Risk Assessment and Permission Procedure. In Proceedings of the International Workshop Health, Safety and Environment of Biomass Gasification, Innsbruck, Austria, 18 September 2005; Furnsinn, S., Buhler, R., Hofbauer, H., Eds.; Graz University of Technology: Graz, Austria, 2005; Volume 3, pp. 114–127. [Google Scholar]
  429. Yan, F.; Xu, K.; Li, D.; Zhang, X. Hazard Assessment for Biomass Gasification Station Using General Set Pair Analysis. BioResources 2016, 11, 8307–8324. [Google Scholar] [CrossRef]
  430. Chen, G.; Li, W.; Chen, H.; Yan, B. Progress in the Aqueous-Phase Reforming of Different Biomass-Derived Alcohols for Hydrogen Production. J. Zhejiang Univ. Sci. A 2015, 16, 491–506. [Google Scholar] [CrossRef]
  431. Glushkov, D.; Nyashina, G.; Shvets, A.; Pereira, A.; Ramanathan, A. Current Status of the Pyrolysis and Gasification Mechanism of Biomass. Energies 2021, 14, 7541. [Google Scholar] [CrossRef]
  432. Salam, M.A.; Ahmed, K.; Akter, N.; Hossain, T.; Abdullah, B. A Review of Hydrogen Production via Biomass Gasification and Its Prospect in Bangladesh. Int. J. Hydrogen Energy 2018, 43, 14944–14973. [Google Scholar] [CrossRef]
  433. Yao, D.; Hu, Q.; Wang, D.; Yang, H.; Wu, C.; Wang, X.; Chen, H. Hydrogen Production from Biomass Gasification Using Biochar as a Catalyst/Support. Bioresour. Technol. 2016, 216, 159–164. [Google Scholar] [CrossRef] [PubMed]
  434. Shahbaz, M.; Yusup, S.; Inayat, A.; Patrick, D.O.; Ammar, M. The Influence of Catalysts in Biomass Steam Gasification and Catalytic Potential of Coal Bottom Ash in Biomass Steam Gasification: A Review. Renew. Sustain. Energy Rev. 2017, 73, 468–476. [Google Scholar] [CrossRef]
  435. Zhou, L.; Yang, Z.; Wei, D.; Zhang, H.; Lu, W. Application of Fe Based Composite Catalyst in Biomass Steam Gasification to Produce Hydrogen Rich Gas. Front. Chem. 2022, 10, 882787. [Google Scholar] [CrossRef] [PubMed]
  436. Ma, X.; Zhao, X.; Gu, J.; Shi, J. Co-Gasification of Coal and Biomass Blends Using Dolomite and Olivine as Catalysts. Renew. Energy 2019, 132, 509–514. [Google Scholar] [CrossRef]
  437. Chen, F.; Wu, C.; Dong, L.; Vassallo, A.; Williams, P.T.; Huang, J. Characteristics and Catalytic Properties of Ni/CaAlOx Catalyst for Hydrogen-Enriched Syngas Production from Pyrolysis-Steam Reforming of Biomass Sawdust. Appl. Catal. B Environ. 2016, 183, 168–175. [Google Scholar] [CrossRef]
  438. Xu, C.; Chen, S.; Soomro, A.; Sun, Z.; Xiang, W. Hydrogen Rich Syngas Production from Biomass Gasification Using Synthesized Fe/CaO Active Catalysts. J. Energy Inst. 2018, 91, 805–816. [Google Scholar] [CrossRef]
  439. Taipabu, M.I.; Viswanathan, K.; Wu, W.; Nagy, Z.K. Production of Renewable Fuels and Chemicals from Fats, Oils, and Grease (FOG) Using Homogeneous and Heterogeneous Catalysts: Design, Validation, and Optimization. Chem. Eng. J. 2021, 424, 130199. [Google Scholar] [CrossRef]
  440. Dou, B.; Song, Y.; Wang, C.; Chen, H.; Xu, Y. Hydrogen Production from Catalytic Steam Reforming of Biodiesel Byproduct Glycerol: Issues and Challenges. Renew. Sustain. Energy Rev. 2014, 30, 950–960. [Google Scholar] [CrossRef]
  441. Chen, M.; Zhou, Z.; Wang, Y.; Liang, T.; Li, X.; Yang, Z.; Chen, M.; Wang, J. Effects of Attapulgite-Supported Transition Metals Catalysts on Glycerol Steam Reforming for Hydrogen Production. Int. J. Hydrogen Energy 2018, 43, 20451–20464. [Google Scholar] [CrossRef]
  442. Dahdah, E.; Aouad, S.; Gennequin, C.; Estephane, J.; Nsouli, B.; Aboukaïs, A.; Abi-Aad, E. Glycerol Steam Reforming over Ru-Mg-Al Hydrotalcite-Derived Mixed Oxides: Role of the Preparation Method in Catalytic Activity. Int. J. Hydrogen Energy 2018, 43, 19864–19872. [Google Scholar] [CrossRef]
  443. Wang, R.; Rohr, D. Natural Gas Processing Strategies for Large Scale Solid Oxide Fuel Cells; American Chemical Society (ACS): Boston, MA, USA, 2002; Volume 47, pp. 506–507. [Google Scholar]
  444. Silva, J.M.; Soria, M.A.; Madeira, L.M. Challenges and Strategies for Optimization of Glycerol Steam Reforming Process. Renew. Sustain. Energy Rev. 2015, 42, 1187–1213. [Google Scholar] [CrossRef]
  445. New Jersey Department of Health and Senior Services. Glycerol-Alpha-Monochlorohydrin; CAS: Hammonton, NJ, USA, 1999. Available online: https://nj.gov/health/eoh/rtkweb/documents/fs/2453.pdf (accessed on 9 October 2024).
  446. INCHEM IPCS Glycerol CAS No. 56-81-5. 2006. Available online: https://www.inchem.org/documents/icsc/icsc/eics0624.htm (accessed on 9 October 2024).
  447. WebMD Vitamins&Supplements. Glycerol—Uses, Side Effects, and More. 2024. Available online: https://www.webmd.com/vitamins/ai/ingredientmono-4/glycerol (accessed on 9 October 2024).
  448. Busca, G. Critical Aspects of Energetic Transition Technologies and the Roles of Materials Chemistry and Engineering. Energies 2024, 17, 3565. [Google Scholar] [CrossRef]
  449. Ghaffari Saeidabad, N.; Noh, Y.S.; Alizadeh Eslami, A.; Song, H.T.; Kim, H.D.; Fazeli, A.; Moon, D.J. A Review on Catalysts Development for Steam Reforming of Biodiesel Derived Glycerol; Promoters and Supports. Catalysts 2020, 10, 910. [Google Scholar] [CrossRef]
  450. Naranje, V.; Swarnalatha, R.; Batra, O.; Salunkhe, S. Technological Assessment on Steam Reforming Process of Crude Glycerol to Produce Hydrogen in an Integrated Waste Cooking-Oil-Based Biodiesel Production Scenario. Processes 2022, 10, 2670. [Google Scholar] [CrossRef]
  451. Avasthi, K.S.; Reddy, R.N.; Patel, S. Challenges in the Production of Hydrogen from Glycerol—A Biodiesel Byproduct Via Steam Reforming Process. Procedia Eng. 2013, 51, 423–429. [Google Scholar] [CrossRef]
  452. Lin, K.-H.; Chang, A.C.-C.; Lin, W.-H.; Chen, S.-H.; Chang, C.-Y.; Chang, H.-F. Autothermal Steam Reforming of Glycerol for Hydrogen Production over Packed-Bed and Pd/Ag Alloy Membrane Reactors. Int. J. Hydrogen Energy 2013, 38, 12946–12952. [Google Scholar] [CrossRef]
  453. Czernik, S.; French, R.; Feik, C.; Chornet, E. Hydrogen by Catalytic Steam Reforming of Liquid Byproducts from Biomass Thermoconversion Processes. Ind. Eng. Chem. Res. 2002, 41, 4209–4215. [Google Scholar] [CrossRef]
  454. New Jersey Department of Health and Senior Services. Platinum. CAS No 7440-06-4. Hazardous Substances Fact Sheet. 2002. Available online: https://nj.gov/health/eoh/rtkweb/documents/fs/1547.pdf (accessed on 9 October 2024).
  455. Safety Data Sheet. CarlRoth Platinum 98,2-98,7%. CAS No 7440-06-4. 2024. Available online: https://www.carlroth.com/medias/SDB-8408-AU-EN.pdf?context=bWFzdGVyfHNlY3VyaXR5RGF0YXNoZWV0c3wyMzg0NDJ8YXBwbGljYXRpb24vcGRmfGFEUXhMMmhqWlM4NU1UYzRPVEUzTURFeE5EZzJMMU5FUWw4NE5EQTRYMEZWWDBWT0xuQmtaZ3xiNDg3MmY0YjVmOGFhM2EyOGNhMzA5MjcwNmIzYmUxYzE5ODc2ZTY4YmRlNWE3Y2I5YzkwNzNhYWNmYjI3MzI1 (accessed on 9 October 2024).
  456. CAMEO. Chemicals ERG Guide 170. Metals (Powders, Dusts, Shavings, Borings, Turnings, or Cuttings, Etc.). 2024. Available online: https://cameochemicals.noaa.gov/erg_guides/en/Guide_170.pdf (accessed on 9 October 2024).
  457. Gebel, T.; Lantzsch, H.; Pleßow, K.; Dunkelberg, H. Genotoxicity of Platinum and Palladium Compounds in Human and Bacterial Cells. Mutat. Res./Genet. Toxicol. Environ. Mutagen. 1997, 389, 183–190. [Google Scholar] [CrossRef] [PubMed]
  458. New Jersey Department of Health and Senior Services. Rhodium. CAS No 7440-16-6. Hazardous Substances Fact Sheet. 2002. Available online: https://nj.gov/health/eoh/rtkweb/documents/fs/1635.pdf (accessed on 9 October 2024).
  459. Lenntech Rhodium—Rh. Chemical Properties of Rhodium. 2024. Available online: https://www.lenntech.com/periodic/elements/rh.htm (accessed on 9 October 2024).
  460. ProPlate What Environmental and Safety Considerations Are Associated with Rhodium Electroplating? ProPlate. Medical Device. 2024. Available online: https://www.proplate.com/what-environmental-and-safety-considerations-are-associated-with-rhodium-electroplating/ (accessed on 9 October 2024).
  461. INCHEM IPCS Rhodium. Cas No 7440-16-6. 2004. Available online: https://www.inchem.org/documents/icsc/icsc/eics1247.htm (accessed on 9 October 2024).
  462. Lenntech Rhenium—Re. Chemical Properties of Rhenium. 2024. Available online: https://www.lenntech.com/periodic/elements/re.htm (accessed on 9 October 2024).
  463. Rhenium Alloys. Rhenium Powder (99.99%). CAS No 7440-15-5. Material Safety Data Sheet. 2011. Available online: https://rhenium.com/assets/rhenium-powder-sds.pdf (accessed on 9 October 2024).
  464. Oak Ridge National Laboratory. Rhenium. CAS No 7440-15-5. Safety Data Sheet. 2019. Available online: https://www.physics.purdue.edu/primelab/safety/MSDS/SDS/rhenium%20187%20metal%20-%20stable%20isotope.pdf (accessed on 9 October 2024).
  465. Dierks, S. Rhenium Oxide Re2O7. Material Safety Data Sheet. 2012. Available online: https://www.espimetals.com/index.php/msds/630-Rhenium%20Oxide%20Re2O7 (accessed on 9 October 2024).
  466. Lenntech Palladium—Pd. Chemical Properties of Palladium. 2024. Available online: https://www.lenntech.com/periodic/elements/pd.htm (accessed on 9 October 2024).
  467. Carl Roth Palladium ROTI METIC 99,999 % (5N) Powder. CAS Number 7440-05-3. Safety Data Sheet. 2024. Available online: https://www.carlroth.com/medias/SDB-5648-GB-EN.pdf?context=bWFzdGVyfHNlY3VyaXR5RGF0YXNoZWV0c3wyNjM1MDZ8YXBwbGljYXRpb24vcGRmfGFEa3hMMmhpT1M4NU1UZ3hNekV3T1RFd05EazBMMU5FUWw4MU5qUTRYMGRDWDBWT0xuQmtaZ3w0OGFhMjNkMjI3YmY2ZWViNGNjM2RiNTM4ZDBiZjM4YmM3YWYzZDA4YmVkMzEyZjZlMjNkNGM5MzhhNWFhNDgx (accessed on 9 October 2024).
  468. Angstrem Sciences. Palladium Aloy. CAS No 7440-05-3. Material Safety Data Sheet. 2000. Available online: https://louisville.edu/micronano/files/documents/safety-data-sheets-sds/Palladium1.pdf (accessed on 9 October 2024).
  469. ChemicalBook. ChemicalBook. Inorganic Chemistry, 10 September 2019. Available online: https://www.chemicalbook.com/article/palladium-hazard-and-toxicity.htm (accessed on 9 October 2024).
  470. Lenntech Ruthenium—Ru. Chemical Properties of Ruthenium. 2024. Available online: https://www.lenntech.com/periodic/elements/ru.htm (accessed on 9 October 2024).
  471. Sigma-Aldrich. Ruthenium. CAS-No. 7440-18-8. Safety Data Sheet. 2017. Available online: https://www.geneseo.edu/sites/default/files/users/247/Ruthenium.pdf (accessed on 9 October 2024).
  472. Lenntech Iridium—Ir. Chemical Properties of Iridium. 2024. Available online: https://www.lenntech.com/periodic/elements/ir.htm (accessed on 9 October 2024).
  473. McGough, M. Iridium Scarcity Challenges Clean Hydrogen Scale-Up. N. Am. Clean Energy 2023, 9/10. Available online: https://www.nacleanenergy.com/energy-storage/iridium-scarcity-challenges-clean-hydrogen-scale-up (accessed on 9 October 2024).
  474. New Jersey Department of Health and Senior Services. Cobalt. CAS No 7440-48-4. Hazardous Substances Fact Sheet. 2005. Available online: https://www.nj.gov/health/eoh/rtkweb/documents/fs/0520.pdf (accessed on 9 October 2024).
  475. Chen, R.J.; Lee, V.R. Cobalt Toxicity. In StatPearls; StatPearls Publishing: Treasure Island, FL, USA, 2024. [Google Scholar]
  476. Jensen, A.A.; Tuchsen, F. Cobalt Exposure and Cancer Risk. Crit. Rev. Toxicol. 1990, 20, 427–439. [Google Scholar] [CrossRef] [PubMed]
  477. Agency for Toxic Substances and Disease Registry. ToxFAQs for Copper. CAS No. 7440-50-8. 2022. Available online: https://wwwn.cdc.gov/Tsp/ToxFAQs/ToxFAQsDetails.aspx?faqid=205&toxid=37 (accessed on 9 October 2024).
  478. New Jersey Department of Health Copper—Hazardous Substance Fact Sheet. 2016. Available online: https://nj.gov/health/eoh/rtkweb/documents/fs/0528.pdf (accessed on 9 October 2024).
  479. Agency for Toxic Substances and Disease Registry. Copper. CAS No. 7440-50-8. Public Health Statement. 2004. Available online: https://www.atsdr.cdc.gov/toxprofiles/tp132-c1-b.pdf (accessed on 9 October 2024).
  480. National Institutes of Health Copper. Fact Sheet for Consumers. 2022. Available online: https://ods.od.nih.gov/factsheets/Copper-Consumer/ (accessed on 9 October 2024).
  481. Lenntech Copper—Cu. Chemical Properties of Copper. 2024. Available online: https://www.lenntech.com/periodic/elements/cu.htm (accessed on 9 October 2024).
  482. ThermoFisher Scientific Raney Nickel, Activated Catalyst, 50% Slurry in Water. Safety Data Sheet. 2024. Available online: https://www.fishersci.fi/store/msds?partNumber=10172953&countryCode=FI&language=en (accessed on 9 October 2024).
  483. Carrero, A.; Vizcaíno, A.J.; Calles, J.A.; García-Moreno, L. Hydrogen Production through Glycerol Steam Reforming Using Co Catalysts Supported on SBA-15 Doped with Zr, Ce and La. J. Energy Chem. 2017, 26, 42–48. [Google Scholar] [CrossRef]
  484. New Jersey Department of Health and Senior Services Potassium. CAS No. 7440-09-7. Hazardous Substances Fact Sheet. 2003. Available online: https://nj.gov/health/eoh/rtkweb/documents/fs/1555.pdf (accessed on 9 October 2024).
  485. MayoClinic Drugs$Supplements. Potassium Supplement (Oral Route, Parenteral Route). 2007. Available online: https://www.mayoclinic.org/drugs-supplements/potassium-supplement-oral-route-parenteral-route/side-effects/drg-20070753?p=1 (accessed on 9 October 2024).
  486. Oria, M.; Harrison, M.; Stallings, V.A. (Eds.) 5, Potassium: Dietary Reference Intakes for Toxicity. In Dietary Reference Intakes for Sodium and Potassium; National Academies Press: Washington, DC, USA, 2019. [Google Scholar]
  487. New Jersey Department of Health and Senior Services Calcium. CAS No. 7440-70-2. Hazardous Substances Fact Sheet. 2010. Available online: https://www.nj.gov/health/eoh/rtkweb/documents/fs/0309.pdf (accessed on 9 October 2024).
  488. The Office of Dietary Supplements (ODS) of the National Institutes of Health (NIH). Calcium. Fact Sheet for Consumers. 2023. Available online: https://ods.od.nih.gov/factsheets/Calcium-Consumer/ (accessed on 9 October 2024).
  489. Lee, H. Can You Eat Calcium? University of Illinois Urbana-Champaign. The Grainger College of Engineering. Physics Van. 2011. Available online: https://van.physics.illinois.edu/ask/listing/17093 (accessed on 9 October 2024).
  490. MountSinai Calcium Carbonate Overdose. 2023. Available online: https://www.mountsinai.org/health-library/poison/calcium-carbonate-overdose (accessed on 9 October 2024).
  491. New Jersey Department of Health and Senior Services Strontium. CAS No. 7440-24-6. Hazardous Substances Fact Sheet. 1998. Available online: https://nj.gov/health/eoh/rtkweb/documents/fs/1739.pdf (accessed on 9 October 2024).
  492. Agency for Toxic Substances and Disease Registry; Division of Toxicology Strontium. CAS NO. 7440-24-6. Toxicological Profile for Strontium. ToxFAQs. 2004. Available online: https://www.atsdr.cdc.gov/toxfaqs/tfacts159.pdf (accessed on 9 October 2024).
  493. WHO; ILO. Chemical Safety Strontium. CAS No. 7440-24-6. Chemical Safety. 2004. Available online: https://chemicalsafety.ilo.org/dyn/icsc/showcard.display?p_lang=en&p_card_id=1534&p_version=2 (accessed on 9 October 2024).
  494. AmesLaboratory. Cerium. CAS No. 7440-45-1. Safety Data Sheet. 2016. Available online: https://www.ameslab.gov/sites/default/files/inline-files/58_Cerium_SDS.pdf (accessed on 9 October 2024).
  495. ESPI Metals. Cerium Oxide. CAS No. 1306-38-3. Material Safety Data Sheet. 2015. Available online: https://www.espimetals.com/index.php/msds/489-Cerium%20Oxide (accessed on 9 October 2024).
  496. Lenntech Cerium—CE. Chemical Properties of Cerium. 2024. Available online: https://www.lenntech.com/periodic/elements/ce.htm (accessed on 9 October 2024).
  497. García, A.; Espinosa, R.; Delgado, L.; Casals, E.; González, E.; Puntes, V.; Barata, C.; Font, X.; Sánchez, A. Acute Toxicity of Cerium Oxide, Titanium Oxide and Iron Oxide Nanoparticles Using Standardized Tests. Desalination 2011, 269, 136–141. [Google Scholar] [CrossRef]
  498. AmesLaboratory Lanthanum. CAS No. 7439-91-0. Safety Data Sheet. 2016. Available online: https://www.ameslab.gov/sites/default/files/inline-files/57_Lanthanum_SDS.pdf (accessed on 9 October 2024).
  499. Hutchison, A.J.; Wilson, R.J.; Garafola, S.; Copley, J.B. Lanthanum Carbonate: Safety Data after 10 Years. Nephrology 2016, 21, 987–994. [Google Scholar] [CrossRef] [PubMed]
  500. MayoClinic Drugs&Supplements. Lanthanum Carbonate (Oral Route). 2024. Available online: https://www.mayoclinic.org/drugs-supplements/lanthanum-carbonate-oral-route/side-effects/drg-20064467?p=1 (accessed on 9 October 2024).
  501. GoodRx Lanthanum. What Are the Risks and Warnings for Lanthanum (Fosrenol)? 2021. Available online: https://www.goodrx.com/lanthanum/what-is (accessed on 9 October 2024).
  502. U.S. Department of Labor Hexavalent Chromium. Health Effects. Occupational Safety and Health Administration. 2024. Available online: https://www.osha.gov/hexavalent-chromium/health-effects (accessed on 9 October 2024).
  503. Agency for Toxic Substances and Disease Registry Chromium Toxicity. What Are the Physiologic Effects of Chromium Exposure? 2023. Available online: https://www.atsdr.cdc.gov/toxprofiles/tp7.pdf (accessed on 9 October 2024).
  504. Tchounwou, P.B.; Yedjou, C.G.; Patlolla, A.K.; Sutton, D.J. Heavy Metal Toxicity and the Environment. In Molecular, Clinical and Environmental Toxicology; Luch, A., Ed.; Experientia Supplementum; Springer: Basel, Switzerland, 2012; Volume 101, pp. 133–164. ISBN 978-3-7643-8339-8. [Google Scholar] [CrossRef]
  505. PChrome. The Dangers of Traditional Chrome Plating. 2024. Available online: https://pchrome.com/dangers-traditional-chrome-plating/ (accessed on 9 October 2024).
  506. Medeiros, M.G. Elevated Levels of DNA-Protein Crosslinks and Micronuclei in Peripheral Lymphocytes of Tannery Workers Exposed to Trivalent Chromium. Mutagenesis 2003, 18, 19–24. [Google Scholar] [CrossRef] [PubMed]
  507. Agency for Toxic Substances and Disease Registry. Chromium Toxicity. 2011. Available online: https://www.atsdr.cdc.gov/toxprofiles/tp7.pdf (accessed on 9 October 2024).
  508. Fisher Scientific Iron. CAS No. 7439-89-6. Material Safety Data Sheet. 2007. Available online: https://www.fishersci.com/store/msds?partNumber=AC197815000&productDescription=IRON%2C+POWDER%2C-70+MESH+99%25&vendorId=VN00032119&countryCode=US&language=en (accessed on 9 October 2024).
  509. O’Malley, G.F.; O’Malley, R. Iron Poisoning. MSD Manual Consumer Version. 2022. Available online: https://www.msdmanuals.com/home/injuries-and-poisoning/poisoning/iron-poisoning (accessed on 9 October 2024).
  510. CDH Iridium CAS No.: 7439-88-5. 2024. Available online: https://www.cdhfinechemical.com/images/product/msds/51_147563125_IRIDIUM-CASNO-7439-88-5-MSDS.pdf (accessed on 9 October 2024).
  511. Liu, W.; Liu, C.; Gogoi, P.; Deng, Y. Overview of Biomass Conversion to Electricity and Hydrogen and Recent Developments in Low-Temperature Electrochemical Approaches. Engineering 2020, 6, 1351–1363. [Google Scholar] [CrossRef]
  512. Zhao, H.; Lu, D.; Wang, J.; Tu, W.; Wu, D.; Koh, S.W.; Gao, P.; Xu, Z.J.; Deng, S.; Zhou, Y.; et al. Raw Biomass Electroreforming Coupled to Green Hydrogen Generation. Nat. Commun. 2021, 12, 2008. [Google Scholar] [CrossRef] [PubMed]
  513. United States Department of Energy. Hydrogen Production: Biomass Gasification. 2020. Available online: https://www.energy.gov/eere/fuelcells/hydrogen-production-biomass-gasification (accessed on 9 October 2024).
  514. Reigstad, G.A.; Roussanaly, S.; Straus, J.; Anantharaman, R.; De Kler, R.; Akhurst, M.; Sunny, N.; Goldthorpe, W.; Avignon, L.; Pearce, J.; et al. Moving toward the Low-Carbon Hydrogen Economy: Experiences and Key Learnings from National Case Studies. Adv. Appl. Energy 2022, 8, 100108. [Google Scholar] [CrossRef]
  515. Ariful Islam, M.; Chowdhury, A.; Jahan, I.; Farrok, O. Mitigation of Environmental Impacts and Challenges during Hydrogen Production. Bioresour. Technol. 2025, 415, 131666. [Google Scholar] [CrossRef]
  516. Cleveland Clinic Oxygen Treatment. 2022. Available online: https://my.clevelandclinic.org/health/treatments/23194-oxygen-therapy (accessed on 9 October 2024).
  517. New Jersey Department of Health and Senior Services. Oxygen CAS Number 7782-44-7. 2007. Available online: https://nj.gov/health/eoh/rtkweb/documents/fs/1448.pdf (accessed on 9 October 2024).
  518. Airgas USA, LLC. Oxygen CAS Number 7782-44-7. 2020. Available online: https://www.airgas.com/msds/001043.pdf (accessed on 9 October 2024).
  519. Bhandari, R.; Trudewind, C.A.; Zapp, P. Life Cycle Assessment of Hydrogen Production via Electrolysis—A Review. J. Clean. Prod. 2014, 85, 151–163. [Google Scholar] [CrossRef]
  520. Chi, J.; Yu, H. Water Electrolysis Based on Renewable Energy for Hydrogen Production. Chin. J. Catal. 2018, 39, 390–394. [Google Scholar] [CrossRef]
  521. Wang, T.; Cao, X.; Jiao, L. PEM Water Electrolysis for Hydrogen Production: Fundamentals, Advances, and Prospects. Carb Neutrality 2022, 1, 21. [Google Scholar] [CrossRef]
  522. Chen, J.; Xu, W.; Wu, X.; Jiaqiang, E.J.; Lu, N.; Wang, T.; Zuo, H. System Development and Environmental Performance Analysis of a Pilot Scale Microbial Electrolysis Cell for Hydrogen Production Using Urban Wastewater. Energy Convers. Manag. 2019, 193, 52–63. [Google Scholar] [CrossRef]
  523. Li, Y.; Liu, W.; Zhang, Z.; Du, X.; Yu, L.; Deng, Y. A Self-Powered Electrolytic Process for Glucose to Hydrogen Conversion. Commun Chem 2019, 2, 67. [Google Scholar] [CrossRef]
  524. Liu, F.; Moustafa, H.; Hassouna, M.S.E.-D.; He, Z. Enhancing the Performance of a Microbial Electrochemical System with Carbon-Based Dynamic Membrane as Both Anode Electrode and Filtration Media. Environ. Sci. Water Res. Technol. 2021, 7, 870–878. [Google Scholar] [CrossRef]
  525. Dange, P.; Pandit, S.; Jadhav, D.; Shanmugam, P.; Gupta, P.K.; Kumar, S.; Kumar, M.; Yang, Y.-H.; Bhatia, S.K. Recent Developments in Microbial Electrolysis Cell-Based Biohydrogen Production Utilizing Wastewater as a Feedstock. Sustainability 2021, 13, 8796. [Google Scholar] [CrossRef]
  526. New Jersey Department of Health and Senior Services. Chlorine CAS No.: 7782-50-5. 2015. Available online: https://nj.gov/health/eoh/rtkweb/documents/fs/0367.pdf (accessed on 9 October 2024).
  527. Liu, W.; Cui, Y.; Du, X.; Zhang, Z.; Chao, Z.; Deng, Y. High Efficiency Hydrogen Evolution from Native Biomass Electrolysis. Energy Environ. Sci. 2016, 9, 467–472. [Google Scholar] [CrossRef]
  528. Yang, L.; Liu, W.; Zhang, Z.; Du, X.; Gong, J.; Dong, L.; Deng, Y. Hydrogen Evolution from Native Biomass with Fe3+/Fe2+ Redox Couple Catalyzed Electrolysis. Electrochim. Acta 2017, 246, 1163–1173. [Google Scholar] [CrossRef]
  529. Hibino, T.; Kobayashi, K.; Ito, M.; Ma, Q.; Nagao, M.; Fukui, M.; Teranishi, S. Efficient Hydrogen Production by Direct Electrolysis of Waste Biomass at Intermediate Temperatures. ACS Sustain. Chem. Eng. 2018, 6, 9360–9368. [Google Scholar] [CrossRef]
  530. Murugan, A.; Brown, A.S. Review of Purity Analysis Methods for Performing Quality Assurance of Fuel Cell Hydrogen. Int. J. Hydrogen Energy 2015, 40, 4219–4233. [Google Scholar] [CrossRef]
  531. Rahimpour, M.R.; Samimi, F.; Babapoor, A.; Tohidian, T.; Mohebi, S. Palladium Membranes Applications in Reaction Systems for Hydrogen Separation and Purification: A Review. Chem. Eng. Process. Process Intensif. 2017, 121, 24–49. [Google Scholar] [CrossRef]
  532. Wang, H.; Wang, X.; Meng, B.; Tan, X.; Loh, K.S.; Sunarso, J.; Liu, S. Perovskite-Based Mixed Protonic–Electronic Conducting Membranes for Hydrogen Separation: Recent Status and Advances. J. Ind. Eng. Chem. 2018, 60, 297–306. [Google Scholar] [CrossRef]
  533. Aasadnia, M.; Mehrpooya, M.; Ghorbani, B. A Novel Integrated Structure for Hydrogen Purification Using the Cryogenic Method. J. Clean. Prod. 2021, 278, 123872. [Google Scholar] [CrossRef]
  534. Nor Azira, A.M.; Umi Aisah, A. Purification of Biohydrogen from Fermentation Gas Mixture Using Two-Stage Chemical Absorption. E3S Web Conf. 2019, 90, 01012. [Google Scholar] [CrossRef]
  535. Shahbaz, M.; Al-Ansari, T.; Aslam, M.; Khan, Z.; Inayat, A.; Athar, M.; Naqvi, S.R.; Ahmed, M.A.; McKay, G. A State of the Art Review on Biomass Processing and Conversion Technologies to Produce Hydrogen and Its Recovery via Membrane Separation. Int. J. Hydrogen Energy 2020, 45, 15166–15195. [Google Scholar] [CrossRef]
  536. Amin, M.; Butt, A.S.; Ahmad, J.; Lee, C.; Azam, S.U.; Mannan, H.A.; Naveed, A.B.; Farooqi, Z.U.R.; Chung, E.; Iqbal, A. Issues and Challenges in Hydrogen Separation Technologies. Energy Rep. 2023, 9, 894–911. [Google Scholar] [CrossRef]
  537. Buffi, M.; Prussi, M.; Scarlat, N. Energy and Environmental Assessment of Hydrogen from Biomass Sources: Challenges and Perspectives. Biomass Bioenergy 2022, 165, 106556. [Google Scholar] [CrossRef]
  538. Vuppaladadiyam, A.K.; Vuppaladadiyam, S.S.V.; Awasthi, A.; Sahoo, A.; Rehman, S.; Pant, K.K.; Murugavelh, S.; Huang, Q.; Anthony, E.; Fennel, P.; et al. Biomass Pyrolysis: A Review on Recent Advancements and Green Hydrogen Production. Bioresour. Technol. 2022, 364, 128087. [Google Scholar] [CrossRef] [PubMed]
  539. Sánchez-Bastardo, N.; Schlögl, R.; Ruland, H. Methane Pyrolysis for Zero-Emission Hydrogen Production: A Potential Bridge Technology from Fossil Fuels to a Renewable and Sustainable Hydrogen Economy. Ind. Eng. Chem. Res. 2021, 60, 11855–11881. [Google Scholar] [CrossRef]
  540. Gutiérrez Ortiz, F.J. Biofuel Production from Supercritical Water Gasification of Sustainable Biomass. Energy Convers. Manag. X 2022, 14, 100164. [Google Scholar] [CrossRef]
  541. Kayfeci, M.; Keçebaş, A.; Bayat, M. Hydrogen Production. In Solar Hydrogen Production; Elsevier: Amsterdam, The Netherlands, 2019; pp. 45–83. ISBN 978-0-12-814853-2. [Google Scholar] [CrossRef]
  542. Patonia, A.; Poudineh, R. Cost-Competitive Green Hydrogen: How to Lower the Cost of Electrolysers? 2022. Available online: https://www.researchgate.net/publication/365188839_Cost-competitive_green_hydrogen_how_to_lower_the_cost_of_electrolysers (accessed on 9 October 2024).
  543. IEA. Global Hydrogen Review. 2023. Available online: https://www.iea.org/reports/global-hydrogen-review-2023 (accessed on 9 October 2024).
  544. Hosseinzadeh, A.; Zhou, J.L.; Li, X.; Afsari, M.; Altaee, A. Techno-Economic and Environmental Impact Assessment of Hydrogen Production Processes Using Bio-Waste as Renewable Energy Resource. Renew. Sustain. Energy Rev. 2022, 156, 111991. [Google Scholar] [CrossRef]
  545. Han, W.; Yan, Y.; Gu, J.; Shi, Y.; Tang, J.; Li, Y. Techno-Economic Analysis of a Novel Bioprocess Combining Solid State Fermentation and Dark Fermentation for H2 Production from Food Waste. Int. J. Hydrogen Energy 2016, 41, 22619–22625. [Google Scholar] [CrossRef]
  546. Alam, M.; Nayan, N.F.; Fatema Nayan, N. Techno-Economic Assessment of Biohydrogen Production from Dark Fermentation of Wastewater Sludge. 2024. Available online: https://www.researchgate.net/publication/378002057_Techno-Economic_Assessment_of_Biohydrogen_Production_from_Dark_Fermentation_of_Wastewater_Sludge (accessed on 9 October 2024).
  547. Szima, S.; Cormos, C.-C. Techno—Economic Assessment of Flexible Decarbonized Hydrogen and Power Co-Production Based on Natural Gas Dry Reforming. Int. J. Hydrogen Energy 2019, 44, 31712–31723. [Google Scholar] [CrossRef]
  548. Cormos, C.-C.; Cormos, A.-M.; Petrescu, L.; Dragan, S. Techno-Economic Assessment of Decarbonized Biogas Catalytic Reforming for Flexible Hydrogen and Power Production. Appl. Therm. Eng. 2022, 207, 118218. [Google Scholar] [CrossRef]
  549. Hajizadeh, A.; Mohamadi-Baghmolaei, M.; Cata Saady, N.M.; Zendehboudi, S. Hydrogen Production from Biomass through Integration of Anaerobic Digestion and Biogas Dry Reforming. Appl. Energy 2022, 309, 118442. [Google Scholar] [CrossRef]
  550. Byun, J.; Han, J. Economic Feasible Hydrogen Production System from Carbohydrate-Rich Food Waste. Appl. Energy 2023, 340, 121044. [Google Scholar] [CrossRef]
  551. Anex, R.P.; Aden, A.; Kazi, F.K.; Fortman, J.; Swanson, R.M.; Wright, M.M.; Satrio, J.A.; Brown, R.C.; Daugaard, D.E.; Platon, A.; et al. Techno-Economic Comparison of Biomass-to-Transportation Fuels via Pyrolysis, Gasification, and Biochemical Pathways. Fuel 2010, 89, S29–S35. [Google Scholar] [CrossRef]
  552. Brown, T.R.; Thilakaratne, R.; Brown, R.C.; Hu, G. Techno-Economic Analysis of Biomass to Transportation Fuels and Electricity via Fast Pyrolysis and Hydroprocessing. Fuel 2013, 106, 463–469. [Google Scholar] [CrossRef]
  553. Tan, E.C.D.; Marker, T.L.; Roberts, M.J. Direct Production of Gasoline and Diesel Fuels from Biomass via Integrated Hydropyrolysis and Hydroconversion Process—A Techno-economic Analysis. Environ. Prog. Sustain. Energy 2014, 33, 609–617. [Google Scholar] [CrossRef]
  554. Li, X.; Chen, Z.; Liu, P.; Wang, Z.; Sun, T.; Wu, S.; Wu, Y.; Lei, T. Oriented Pyrolysis of Biomass for Hydrogen-Rich Gas and Biochar Production: An Energy, Environment, and Economic Assessment Based on Life Cycle Assessment Method. Int. J. Hydrogen Energy 2024, 62, 979–993. [Google Scholar] [CrossRef]
  555. Salkuyeh, Y.K.; Saville, B.A.; MacLean, H.L. Techno-Economic Analysis and Life Cycle Assessment of Hydrogen Production from Different Biomass Gasification Processes. Int. J. Hydrogen Energy 2018, 43, 9514–9528. [Google Scholar] [CrossRef]
  556. Shaikh, A.R.; Wang, Q.; Han, L.; Feng, Y.; Sharif, Z.; Li, Z.; Cen, J.; Kumar, S. Techno-Economic Analysis of Hydrogen and Electricity Production by Biomass Calcium Looping Gasification. Sustainability 2022, 14, 2189. [Google Scholar] [CrossRef]
  557. Wang, Y.; Li, G.; Liu, Z.; Cui, P.; Zhu, Z.; Yang, S. Techno-Economic Analysis of Biomass-to-Hydrogen Process in Comparison with Coal-to-Hydrogen Process. Energy 2019, 185, 1063–1075. [Google Scholar] [CrossRef]
  558. Al-Qahtani, A.; Parkinson, B.; Hellgardt, K.; Shah, N.; Guillen-Gosalbez, G. Uncovering the True Cost of Hydrogen Production Routes Using Life Cycle Monetisation. Appl. Energy 2021, 281, 115958. [Google Scholar] [CrossRef]
  559. Okolie, J.A.; Nanda, S.; Dalai, A.K.; Kozinski, J.A. Techno-Economic Evaluation and Sensitivity Analysis of a Conceptual Design for Supercritical Water Gasification of Soybean Straw to Produce Hydrogen. Bioresour. Technol. 2021, 331, 125005. [Google Scholar] [CrossRef] [PubMed]
  560. Cook, B.; Hagen, C. Techno-Economic Analysis of Biomass Gasification for Hydrogen Production in Three US-Based Case Studies. Int. J. Hydrogen Energy 2024, 49, 202–218. [Google Scholar] [CrossRef]
  561. Tanyi, R.J.; Mensah, L.D.; Ntiamoah, A.; Quansah, D.A.; Adaramola, M.S. Techno-Economic Assessment of Hydrogen Production in Ghana through PV Electrolysis and Biomass Gasification. Oxf. Open Energy 2024, 3, oiae014. [Google Scholar] [CrossRef]
  562. Shin, H.; Jang, D.; Lee, S.; Cho, H.-S.; Kim, K.-H.; Kang, S. Techno-Economic Evaluation of Green Hydrogen Production with Low-Temperature Water Electrolysis Technologies Directly Coupled with Renewable Power Sources. Energy Convers. Manag. 2023, 286, 117083. [Google Scholar] [CrossRef]
  563. María Villarreal Vives, A.; Wang, R.; Roy, S.; Smallbone, A. Techno-Economic Analysis of Large-Scale Green Hydrogen Production and Storage. Appl. Energy 2023, 346, 121333. [Google Scholar] [CrossRef]
  564. Zainal, B.S.; Ker, P.J.; Mohamed, H.; Ong, H.C.; Fattah, I.M.R.; Rahman, S.M.A.; Nghiem, L.D.; Mahlia, T.M.I. Recent Advancement and Assessment of Green Hydrogen Production Technologies. Renew. Sustain. Energy Rev. 2024, 189, 113941. [Google Scholar] [CrossRef]
  565. Agyekum, E.B.; Nutakor, C.; Agwa, A.M.; Kamel, S. A Critical Review of Renewable Hydrogen Production Methods: Factors Affecting Their Scale-Up and Its Role in Future Energy Generation. Membranes 2022, 12, 173. [Google Scholar] [CrossRef] [PubMed]
  566. Ren, N.-Q.; Zhao, L.; Chen, C.; Guo, W.-Q.; Cao, G.-L. A Review on Bioconversion of Lignocellulosic Biomass to H2: Key Challenges and New Insights. Bioresour. Technol. 2016, 215, 92–99. [Google Scholar] [CrossRef] [PubMed]
  567. Hsu, C.-W.; Lin, C.-Y. Using Social Network Analysis to Examine the Technological Evolution of Fermentative Hydrogen Production from Biomass. Int. J. Hydrogen Energy 2016, 41, 21573–21582. [Google Scholar] [CrossRef]
  568. Bundhoo, M.A.Z.; Mohee, R. Inhibition of Dark Fermentative Bio-Hydrogen Production: A Review. Int. J. Hydrogen Energy 2016, 41, 6713–6733. [Google Scholar] [CrossRef]
  569. González, J.F.; Román, S.; Bragado, D.; Calderón, M. Investigation on the Reactions Influencing Biomass Air and Air/Steam Gasification for Hydrogen Production. Fuel Process. Technol. 2008, 89, 764–772. [Google Scholar] [CrossRef]
  570. Chandrasekhar, K.; Venkata Mohan, S. Bio-Electrohydrolysis as a Pretreatment Strategy to Catabolize Complex Food Waste in Closed Circuitry: Function of Electron Flux to Enhance Acidogenic Biohydrogen Production. Int. J. Hydrogen Energy 2014, 39, 11411–11422. [Google Scholar] [CrossRef]
  571. Sara, H.R.; Enrico, B.; Mauro, V.; Andrea, D.C.; Vincenzo, N. Techno-Economic Analysis of Hydrogen Production Using Biomass Gasification -A Small Scale Power Plant Study. Energy Procedia 2016, 101, 806–813. [Google Scholar] [CrossRef]
  572. Nemitallah, M.A.; Alnazha, A.A.; Ahmed, U.; El-Adawy, M.; Habib, M.A. Review on Techno-Economics of Hydrogen Production Using Current and Emerging Processes: Status and Perspectives. Results Eng. 2024, 21, 101890. [Google Scholar] [CrossRef]
  573. Liu, Y.; Lin, R.; Man, Y.; Ren, J. Recent Developments of Hydrogen Production from Sewage Sludge by Biological and Thermochemical Process. Int. J. Hydrogen Energy 2019, 44, 19676–19697. [Google Scholar] [CrossRef]
  574. Aslam, M.; Ahmad, R.; Yasin, M.; Khan, A.L.; Shahid, M.K.; Hossain, S.; Khan, Z.; Jamil, F.; Rafiq, S.; Bilad, M.R.; et al. Anaerobic Membrane Bioreactors for Biohydrogen Production: Recent Developments, Challenges and Perspectives. Bioresour. Technol. 2018, 269, 452–464. [Google Scholar] [CrossRef]
  575. Show, K.Y.; Lee, D.J.; Tay, J.H.; Lin, C.Y.; Chang, J.S. Biohydrogen Production: Current Perspectives and the Way Forward. Int. J. Hydrogen Energy 2012, 37, 15616–15631. [Google Scholar] [CrossRef]
  576. Soares, J.F.; Confortin, T.C.; Todero, I.; Mayer, F.D.; Mazutti, M.A. Dark Fermentative Biohydrogen Production from Lignocellulosic Biomass: Technological Challenges and Future Prospects. Renew. Sustain. Energy Rev. 2020, 117, 109484. [Google Scholar] [CrossRef]
  577. Khan, M.A.; Ngo, H.H.; Guo, W.; Liu, Y.; Zhang, X.; Guo, J.; Chang, S.W.; Nguyen, D.D.; Wang, J. Biohydrogen Production from Anaerobic Digestion and Its Potential as Renewable Energy. Renew. Energy 2018, 129, 754–768. [Google Scholar] [CrossRef]
  578. Rai, P.K.; Singh, S.P. Integrated Dark- and Photo-Fermentation: Recent Advances and Provisions for Improvement. Int. J. Hydrogen Energy 2016, 41, 19957–19971. [Google Scholar] [CrossRef]
  579. Rashid, N.; Rehman, M.S.U.; Memon, S.; Ur Rahman, Z.; Lee, K.; Han, J.-I. Current Status, Barriers and Developments in Biohydrogen Production by Microalgae. Renew. Sustain. Energy Rev. 2013, 22, 571–579. [Google Scholar] [CrossRef]
  580. Zhou, Y.; Swidler, D.; Searle, S.; Baldino, C. Life-Cycle Greenhouse Gas Emissions of Bio-Methane and Hydrogen Pathways in the European Union. 2021. Available online: https://theicct.org/sites/default/files/publications/lca-biomethane-hydrogen-eu-oct21.pdf (accessed on 9 October 2024).
  581. Camacho, C.I.; Estévez, S.; Conde, J.J.; Feijoo, G.; Moreira, M.T. Dark Fermentation as an Environmentally Sustainable WIN-WIN Solution for Bioenergy Production. J. Clean. Prod. 2022, 374, 134026. [Google Scholar] [CrossRef]
  582. Barghash, H.; AlRashdi, Z.; Okedu, K.; Desmond, P. Life-Cycle Assessment Study for Bio-Hydrogen Gas Production from Sewage Treatment Plants Using Solar PVs. Energies 2022, 15, 8056. [Google Scholar] [CrossRef]
  583. Zheng, X.; Wang, J.; Huang, J.; Xu, X.; Tang, J.; Hou, P.; Han, W.; Li, H. Environmental Impact Assessment of a Combined Bioprocess for Hydrogen Production from Food Waste. Waste Manag. 2024, 173, 152–159. [Google Scholar] [CrossRef] [PubMed]
  584. Ma, Z.; Liu, X.; Li, G.; Qiu, X.; Yao, D.; Zhu, Z.; Wang, Y.; Gao, J.; Cui, P. Energy Consumption, Environmental Performance, and Techno-Economic Feasibility Analysis of the Biomass-to-Hydrogen Process with and without Carbon Capture and Storage. J. Environ. Chem. Eng. 2021, 9, 106752. [Google Scholar] [CrossRef]
  585. Chen, J.; Xu, W.; Zuo, H.; Wu, X.; Jiaqiang, E.; Wang, T.; Zhang, F.; Lu, N. System Development and Environmental Performance Analysis of a Solar-Driven Supercritical Water Gasification Pilot Plant for Hydrogen Production Using Life Cycle Assessment Approach. Energy Convers. Manag. 2019, 184, 60–73. [Google Scholar] [CrossRef]
  586. Wu, D.; Gao, Z.; Wu, S.; Xiao, R. Negative Net Global Warming Potential Hydrogen Production through Biomass Gasification Combined with Chemical Looping: Environmental and Economic Assessments. Int. J. Hydrogen Energy 2024, 66, 24–32. [Google Scholar] [CrossRef]
  587. Cormos, C.-C. Decarbonized Green Hydrogen Production by Sorption-Enhanced Biomass Gasification: An Integrated Techno-Economic and Environmental Evaluation. Int. J. Hydrogen Energy 2024, 95, 592–603. [Google Scholar] [CrossRef]
  588. Honarmandrad, Z.; Kucharska, K.; Gębicki, J. Processing of Biomass Prior to Hydrogen Fermentation and Post-Fermentative Broth Management. Molecules 2022, 27, 7658. [Google Scholar] [CrossRef] [PubMed]
  589. Chojnacka, K.; Skrzypczak, D.; Mikula, K.; Witek-Krowiak, A.; Izydorczyk, G.; Kuligowski, K.; Bandrów, P.; Kułażyński, M. Progress in Sustainable Technologies of Leather Wastes Valorization as Solutions for the Circular Economy. J. Clean. Prod. 2021, 313, 127902. [Google Scholar] [CrossRef]
  590. Rostocki, A.; Obraniak, A.; Bandrow, P.; Wachulak, M.; Olejnik, T.; Bartyzel, J.; Ławińska, K.; Modrzewski, R.; Szufa, S.; Orczykowska, M. Granulation of Waste Tannery Shavings. Technol. I Jakość Wyr. 2023, 68, 202–228. [Google Scholar] [CrossRef]
  591. Wrzesińska-Jędrusiak, E.; Czarnecki, M.; Kazimierski, P.; Bandrów, P.; Szufa, S. The Circular Economy in the Management of Waste from Leather Processing. Energies 2023, 16, 564. [Google Scholar] [CrossRef]
  592. Romanowska-Duda, Z.; Piotrowski, K.; Szufa, S.; Sklodowska, M.; Naliwajski, M.; Emmanouil, C.; Kungolos, A.; Zorpas, A.A. Valorization of Spirodela Polyrrhiza Biomass for the Production of Biofuels for Distributed Energy. Sci. Rep. 2023, 13, 16533. [Google Scholar] [CrossRef] [PubMed]
  593. Unyay, H.; Piersa, P.; Perendeci, N.A.; Wielgosinski, G.; Szufa, S. Valorization of Anaerobic Digestate: Innovative Approaches for Sustainable Resource Management and Energy Production—Case Studies from Turkey and Poland. Int. J. Green Energy 2024, 21, 1928–1943. [Google Scholar] [CrossRef]
  594. Szufa, S.; Piersa, P.; Junga, R.; Błaszczuk, A.; Modliński, N.; Sobek, S.; Marczak-Grzesik, M.; Adrian, Ł.; Dzikuć, M. Numerical Modeling of the Co-Firing Process of an in Situ Steam-Torrefied Biomass with Coal in a 230 MW Industrial-Scale Boiler. Energy 2023, 263, 125918. [Google Scholar] [CrossRef]
  595. Szufa, S.; Piersa, P.; Adrian, Ł.; Sielski, J.; Grzesik, M.; Romanowska-Duda, Z.; Piotrowski, K.; Lewandowska, W. Acquisition of Torrefied Biomass from Jerusalem Artichoke Grown in a Closed Circular System Using Biogas Plant Waste. Molecules 2020, 25, 3862. [Google Scholar] [CrossRef] [PubMed]
  596. Szufa, S.; Wielgosiński, G.; Piersa, P.; Czerwińska, J.; Dzikuć, M.; Adrian, Ł.; Lewandowska, W.; Marczak, M. Torrefaction of Straw from Oats and Maize for Use as a Fuel and Additive to Organic Fertilizers—TGA Analysis, Kinetics as Products for Agricultural Purposes. Energies 2020, 13, 2064. [Google Scholar] [CrossRef]
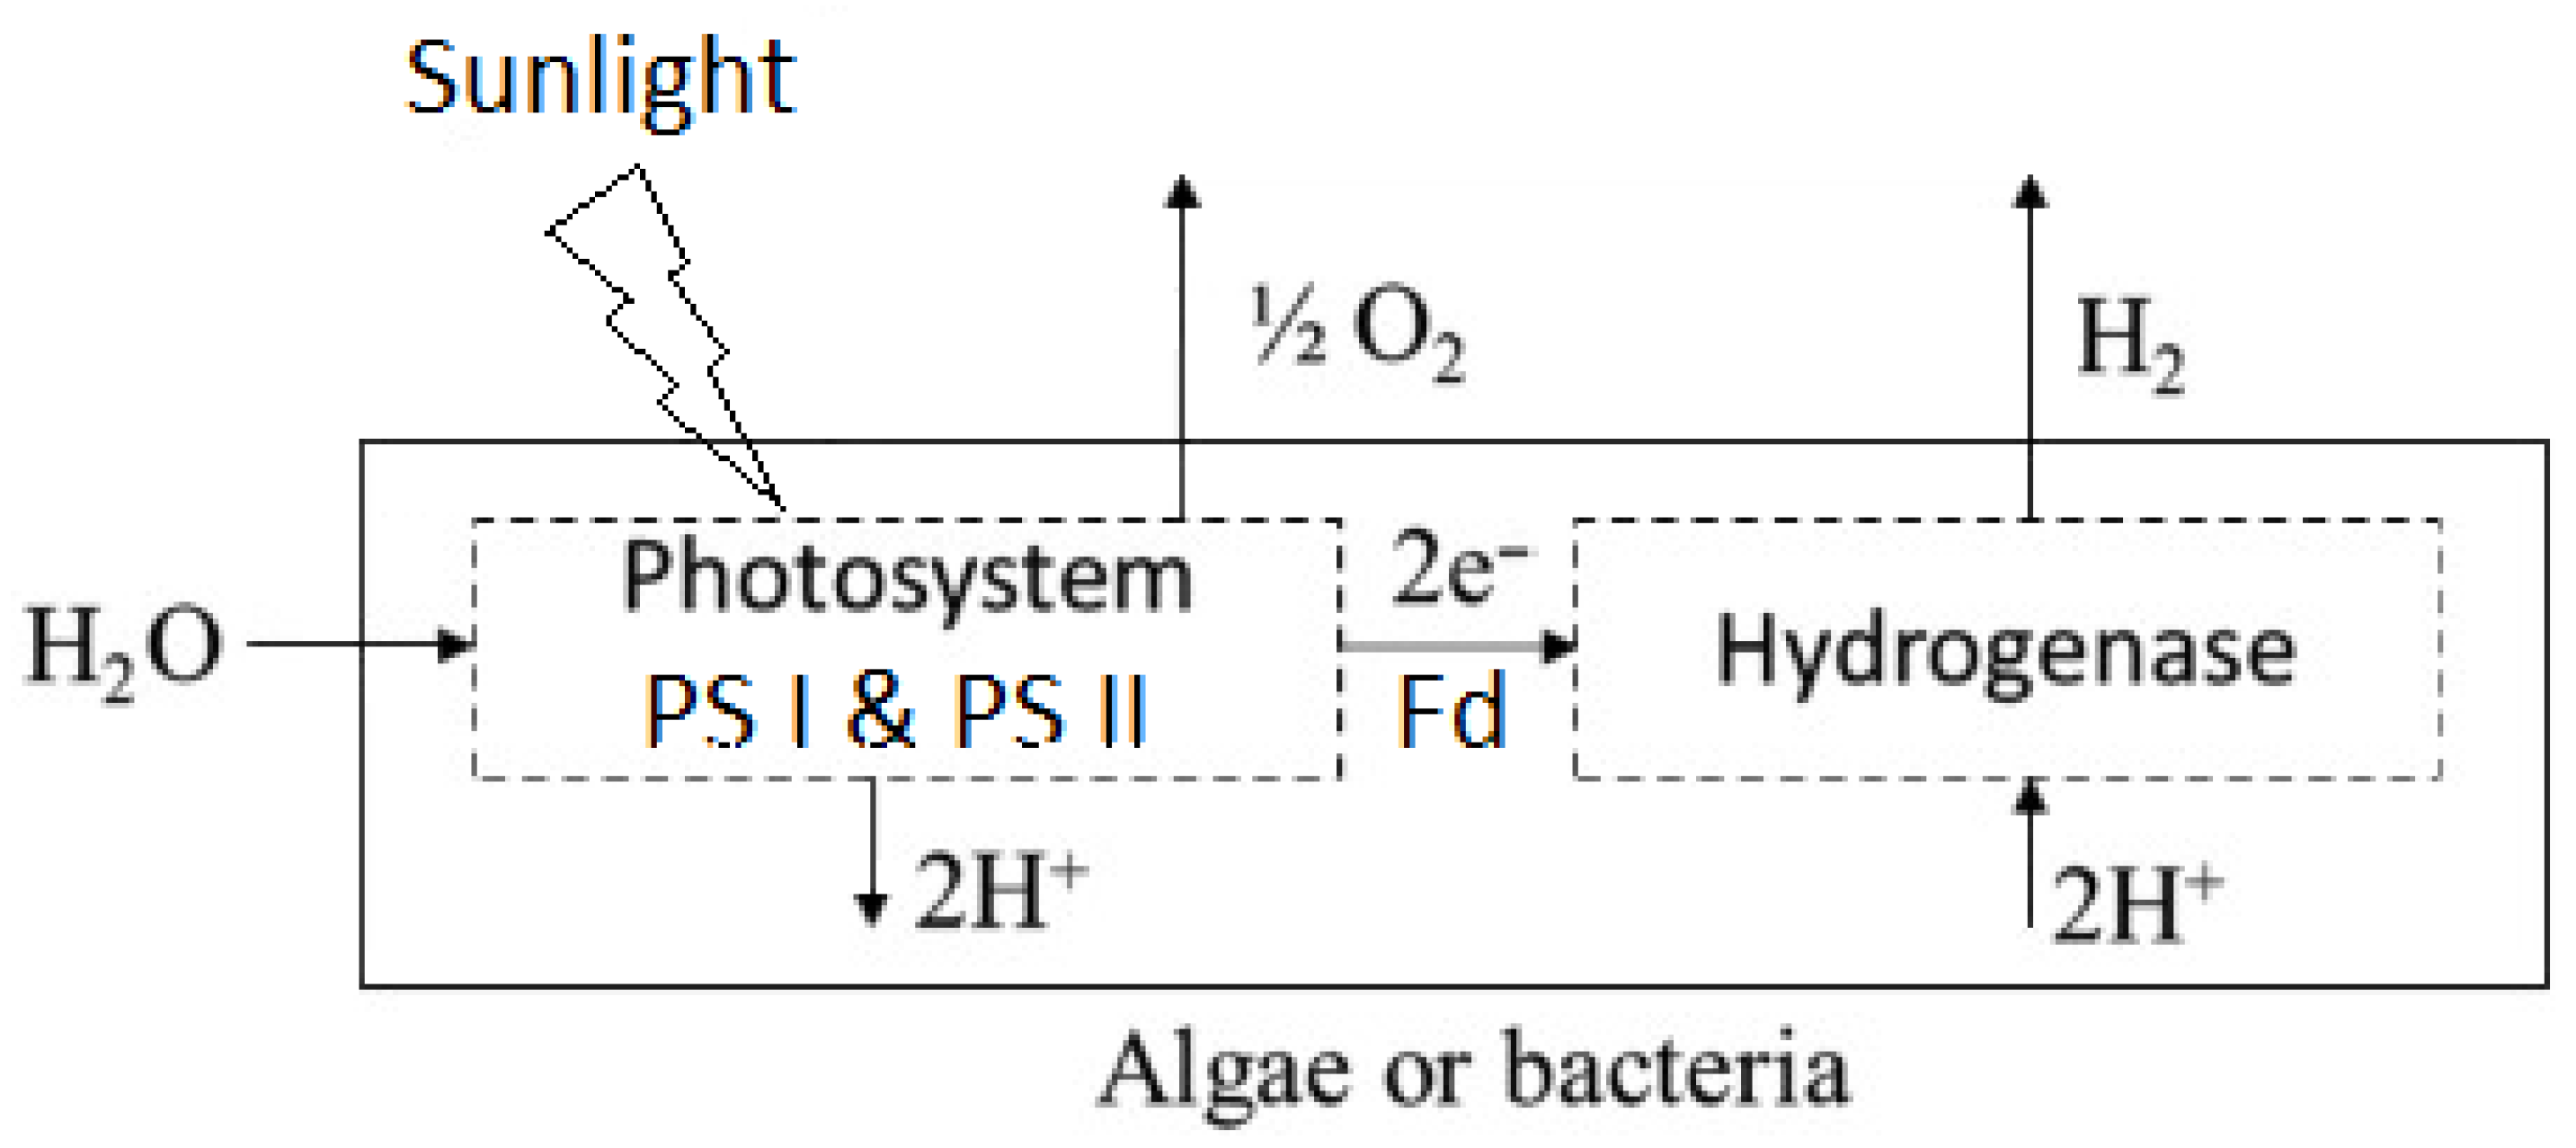
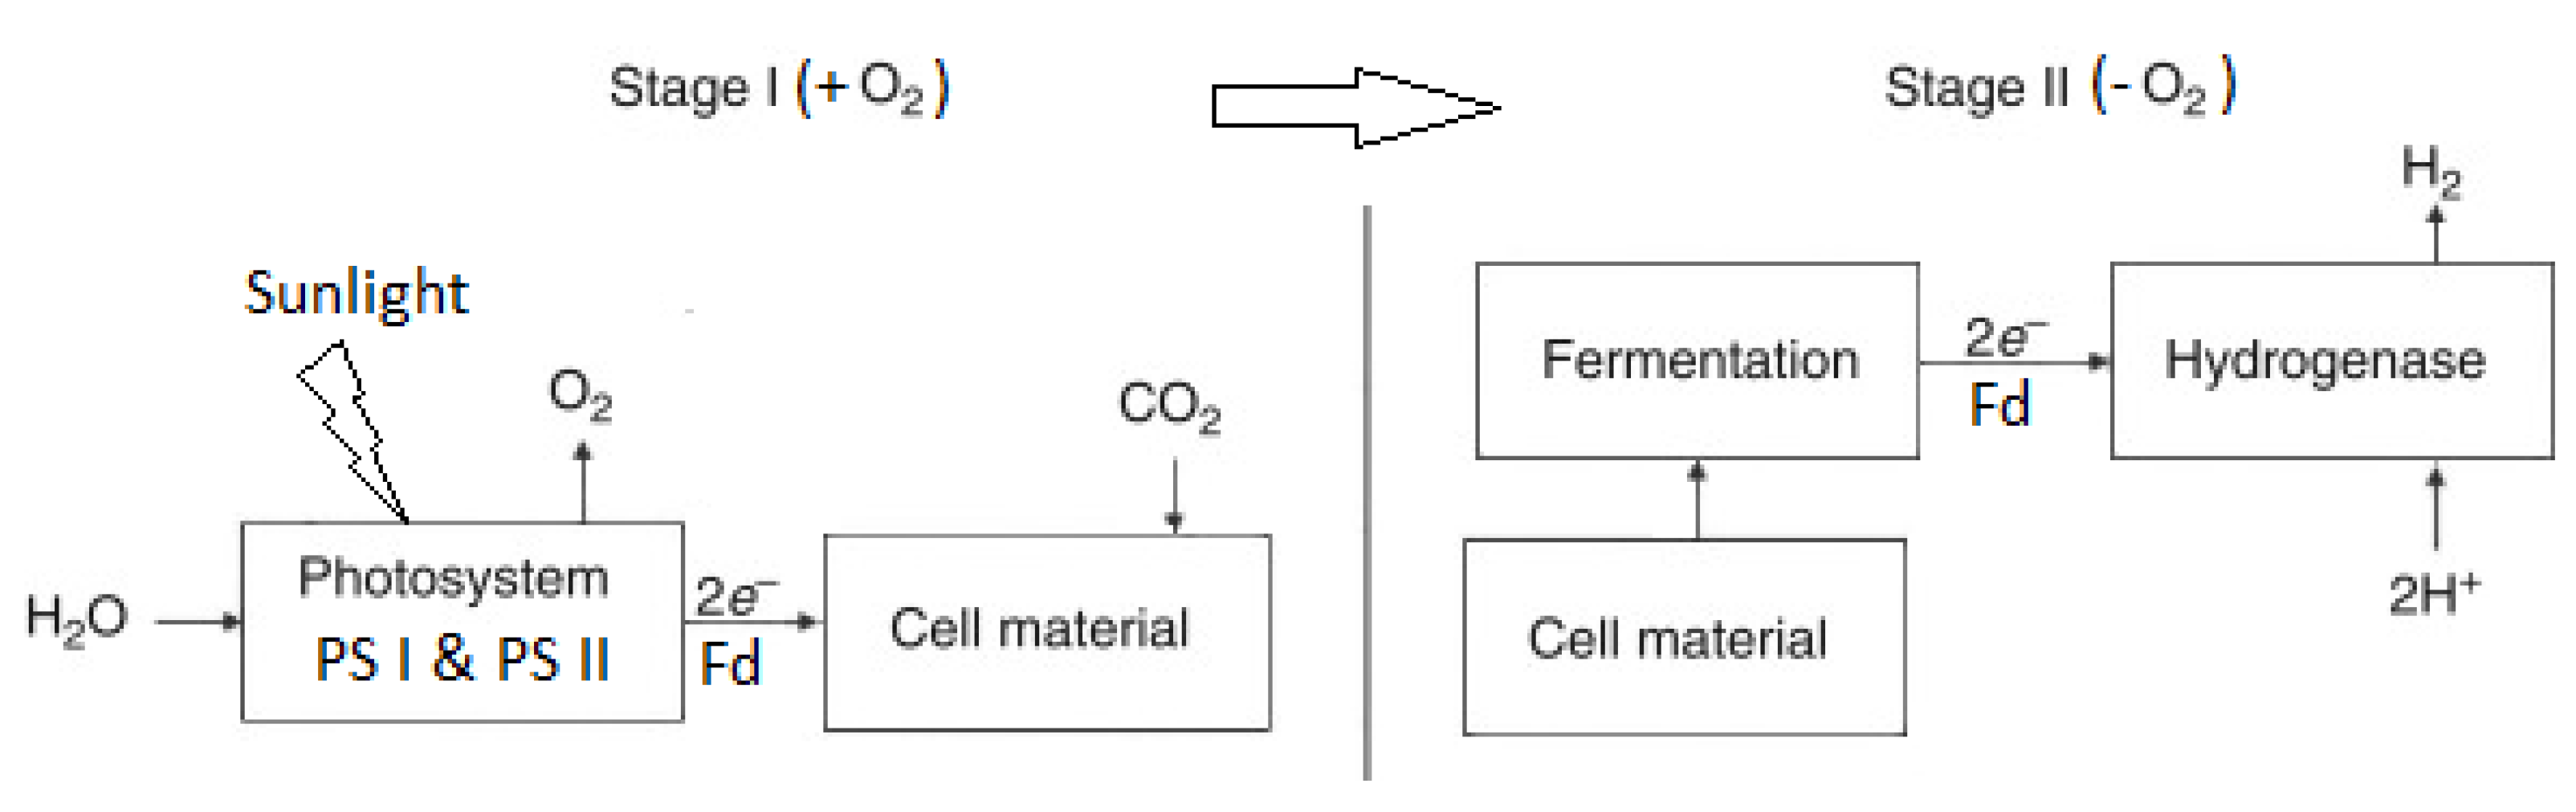
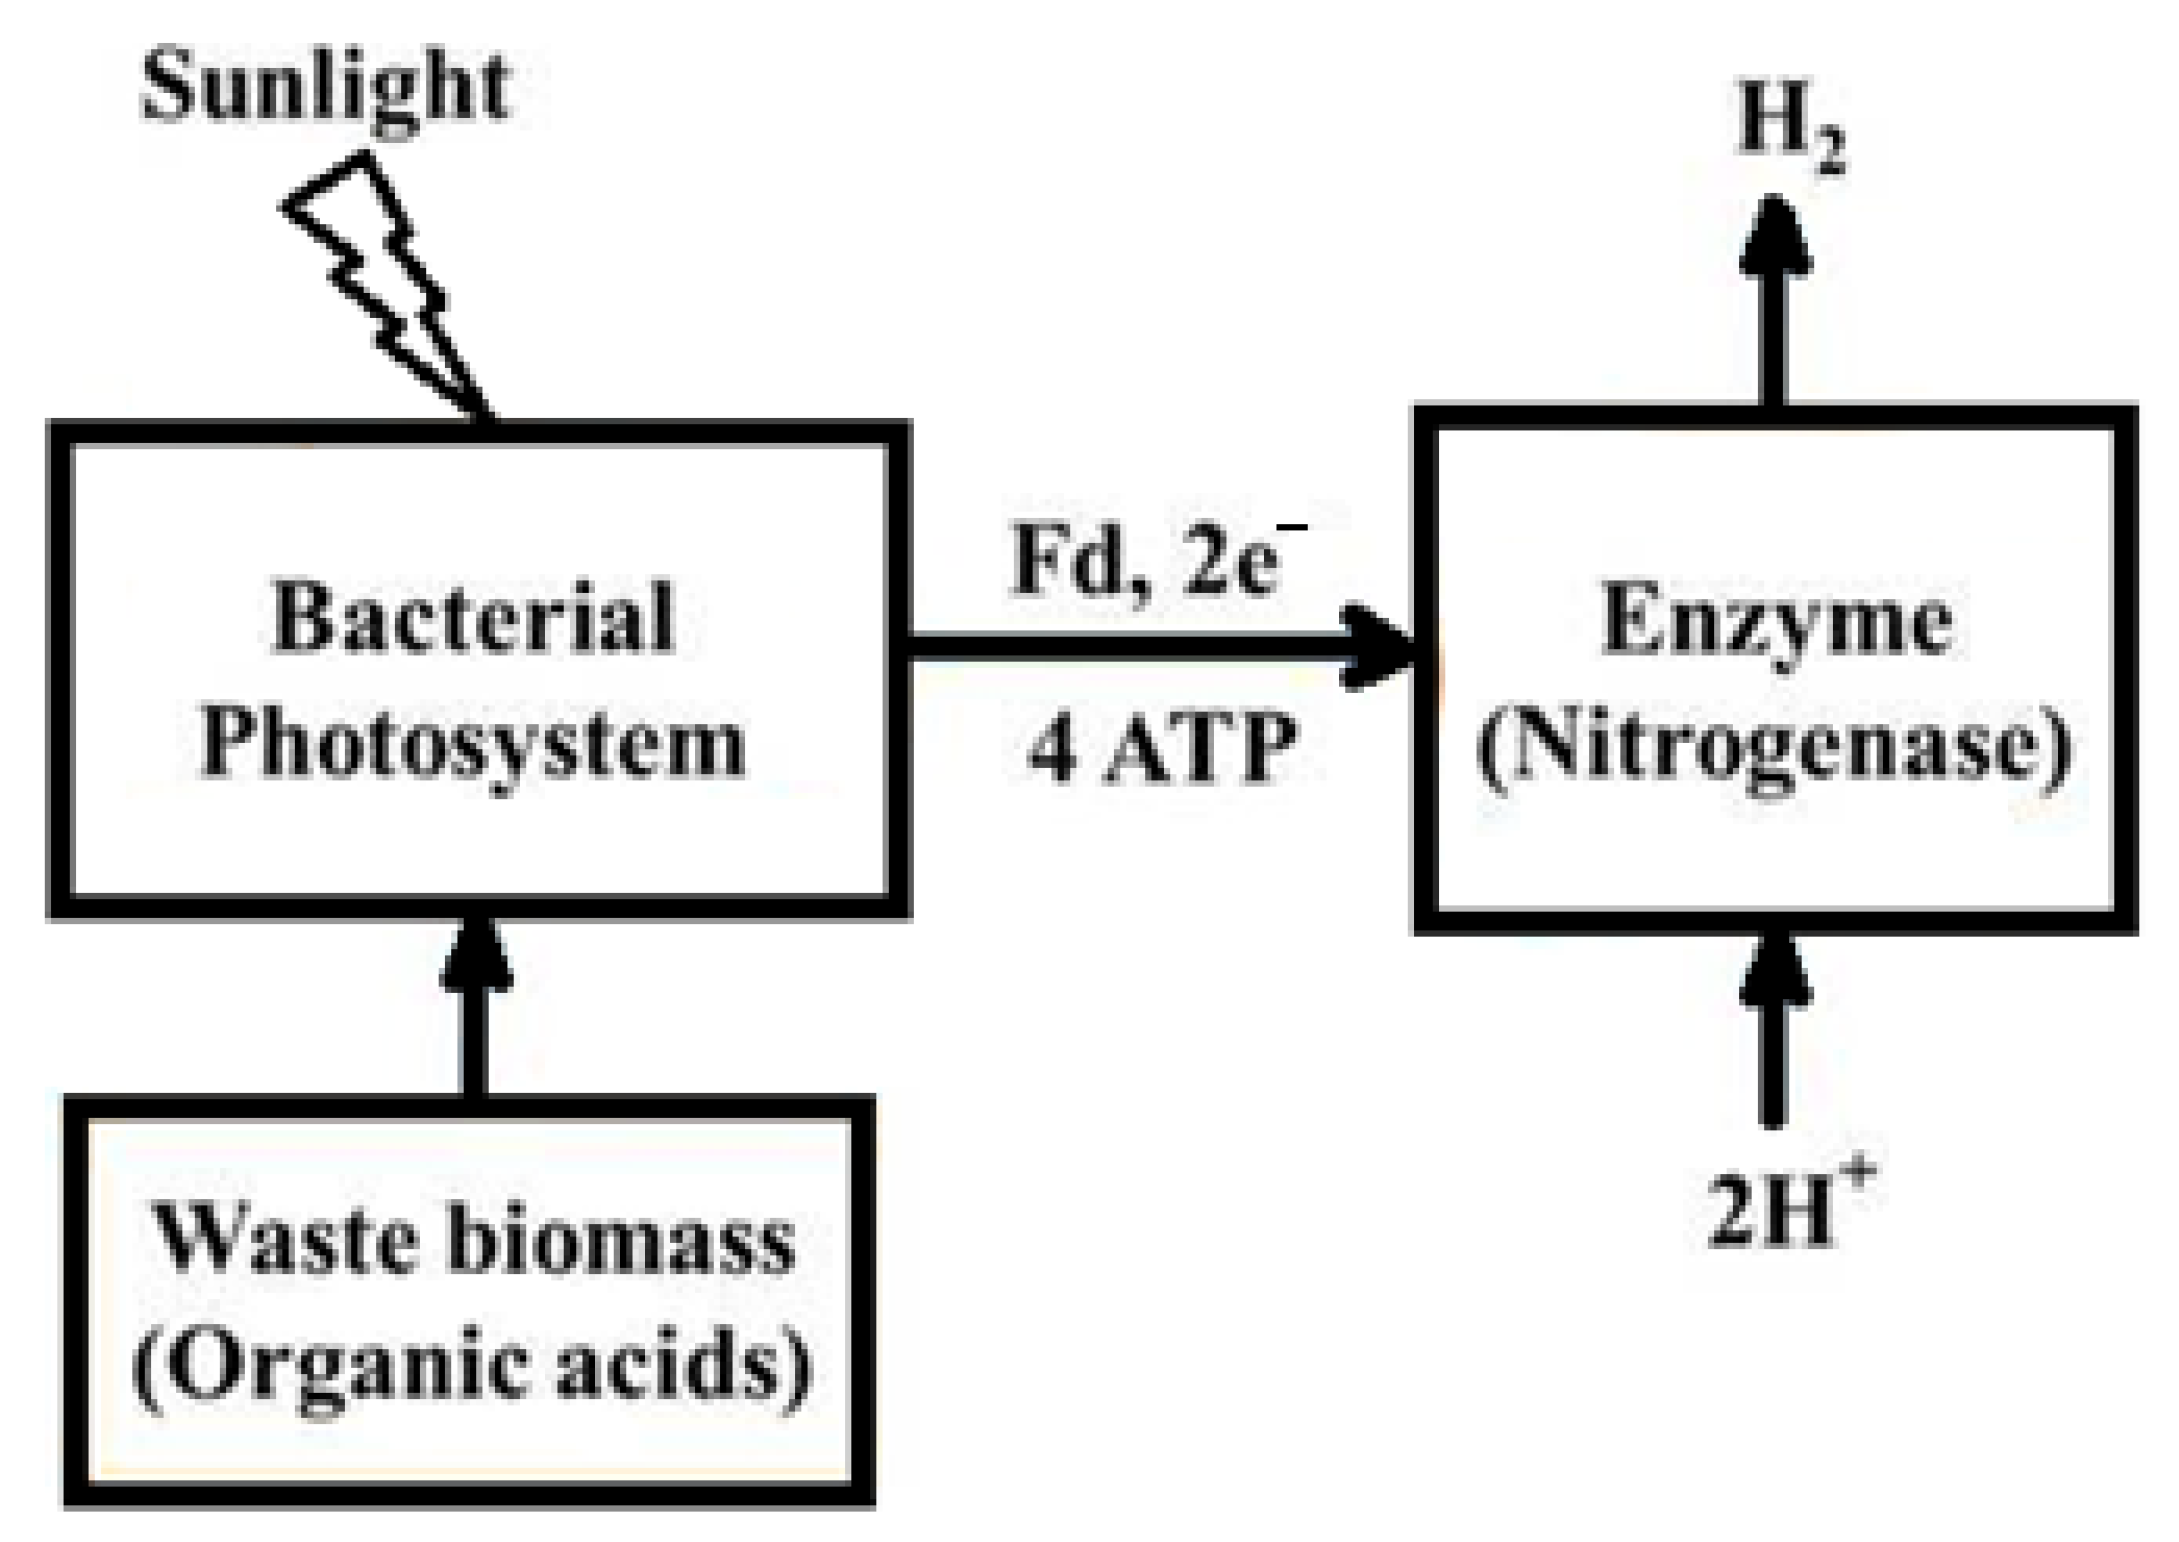
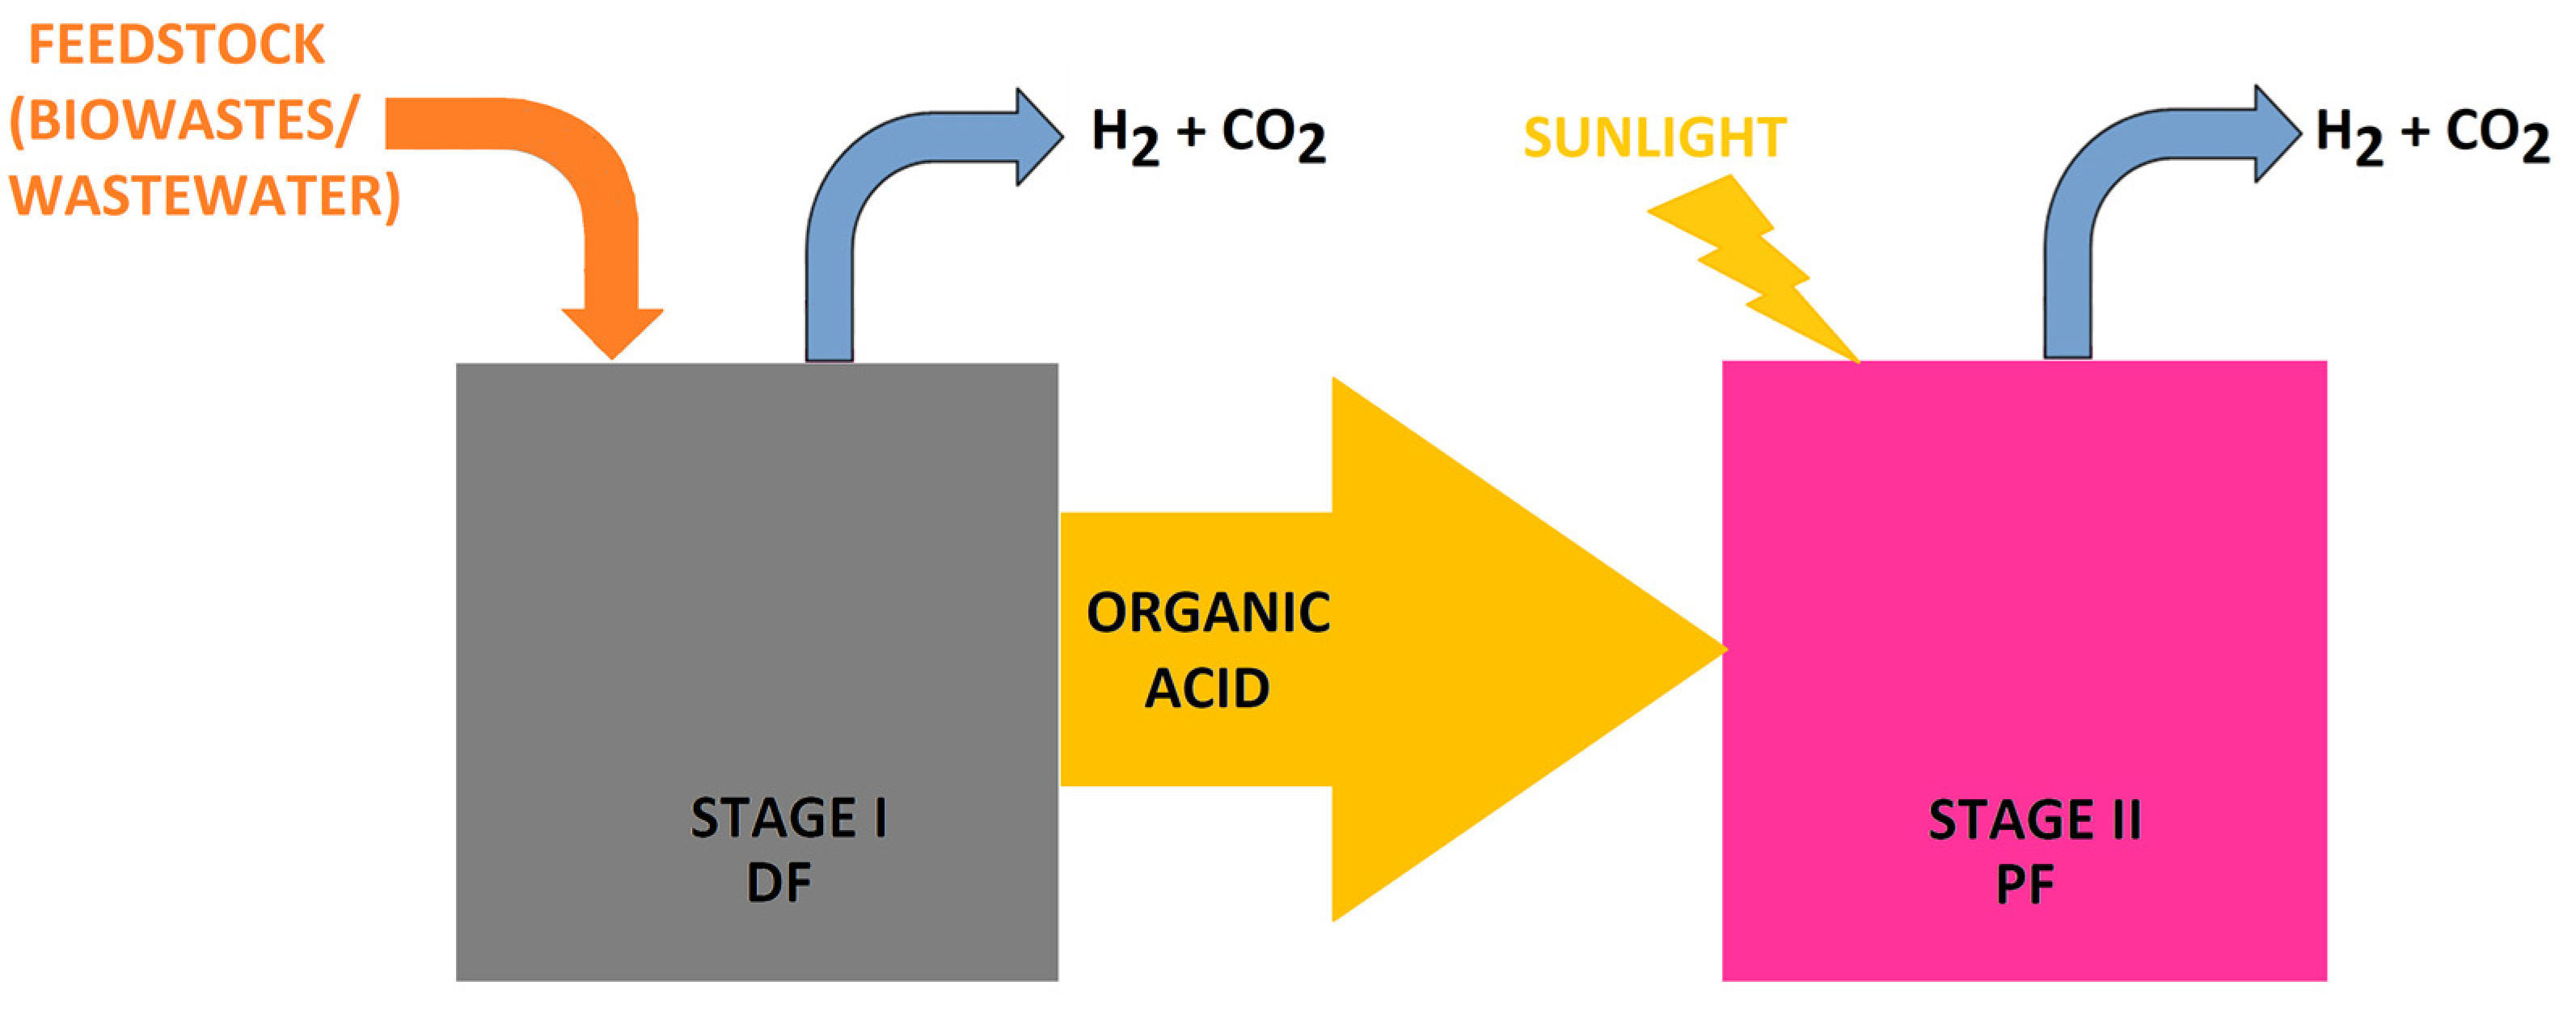
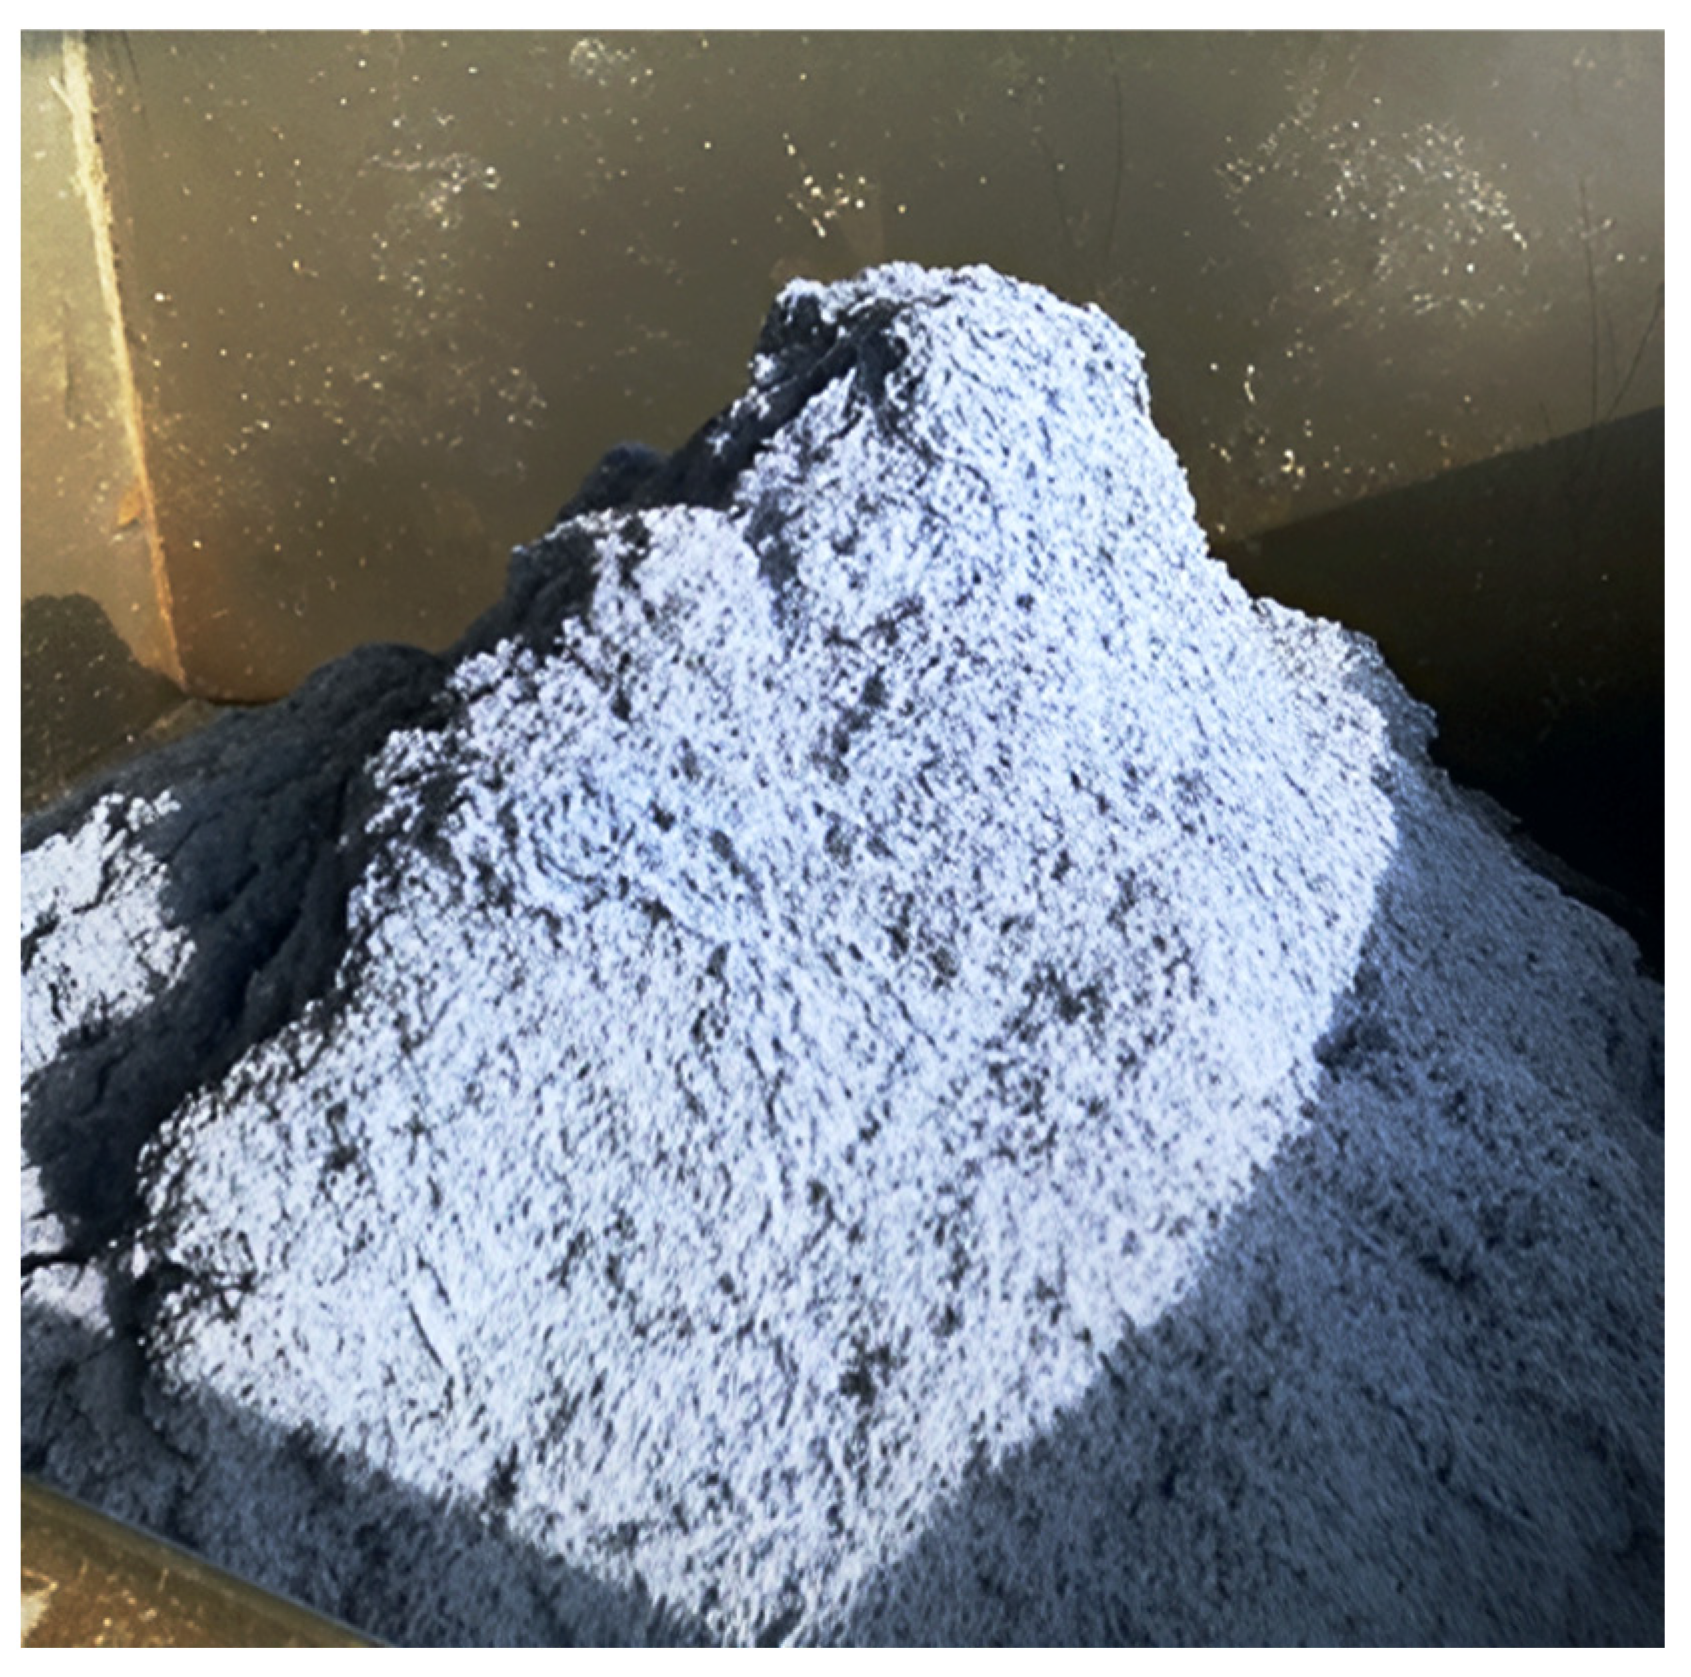
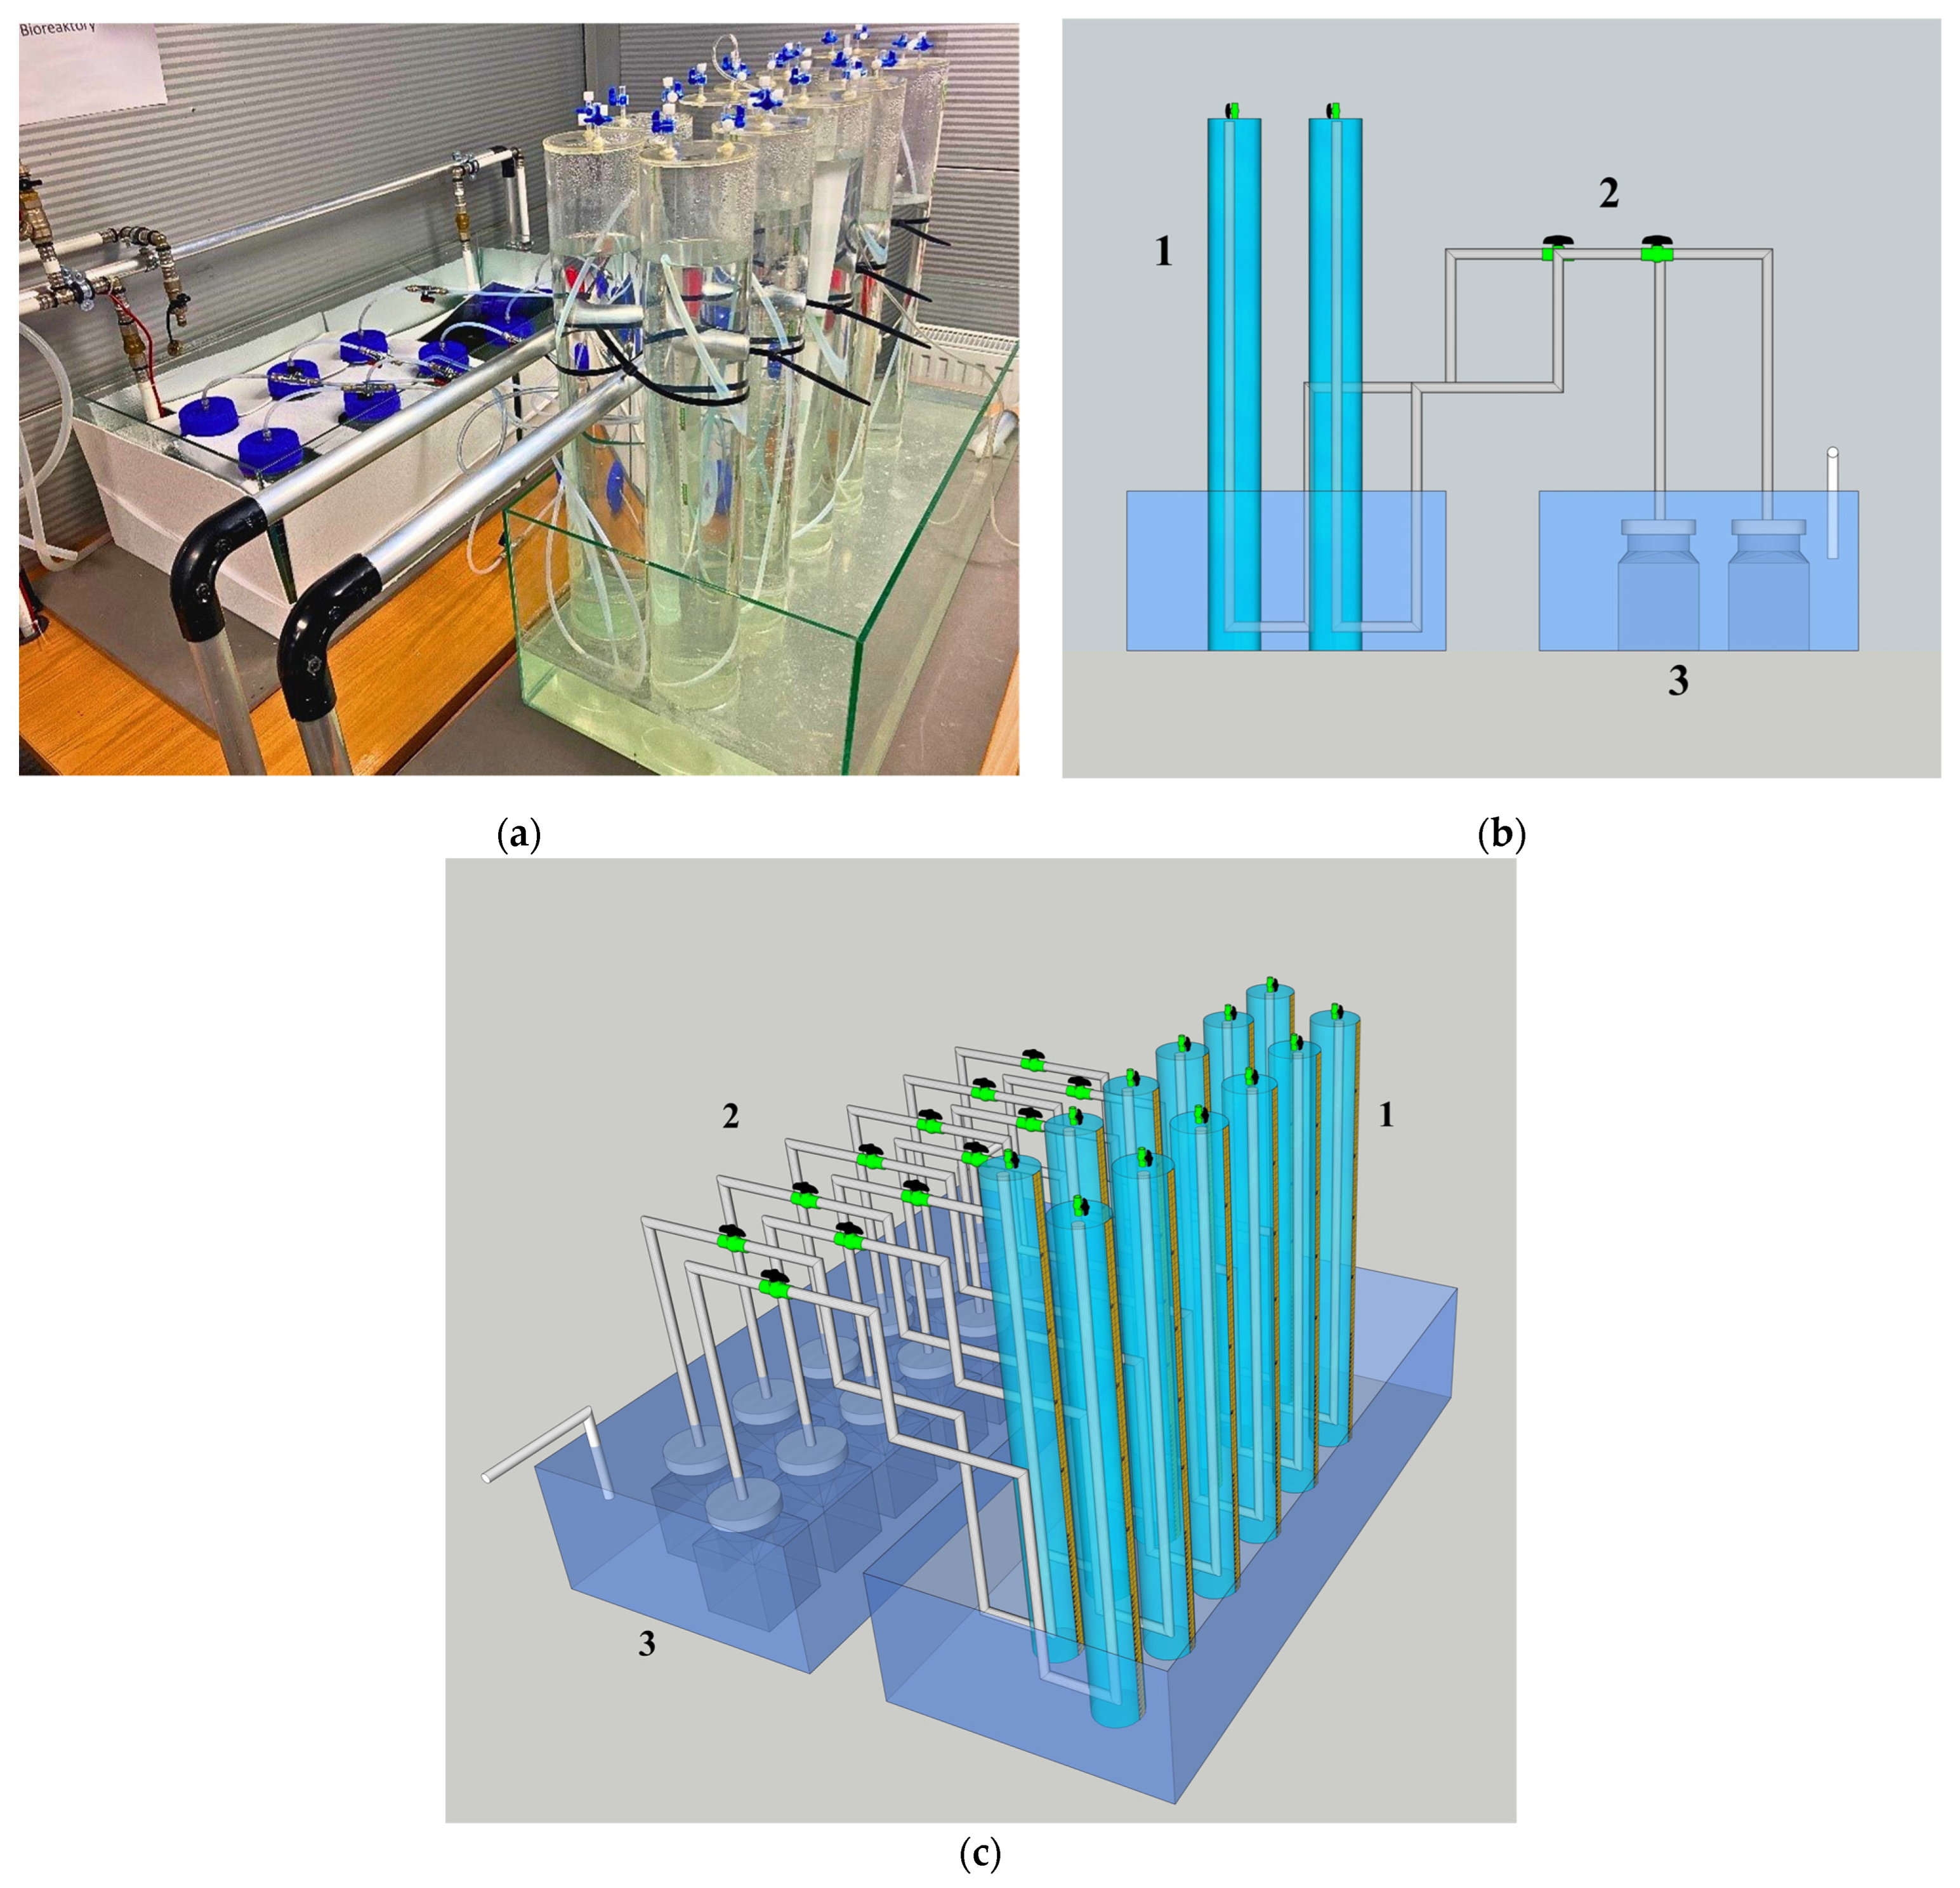
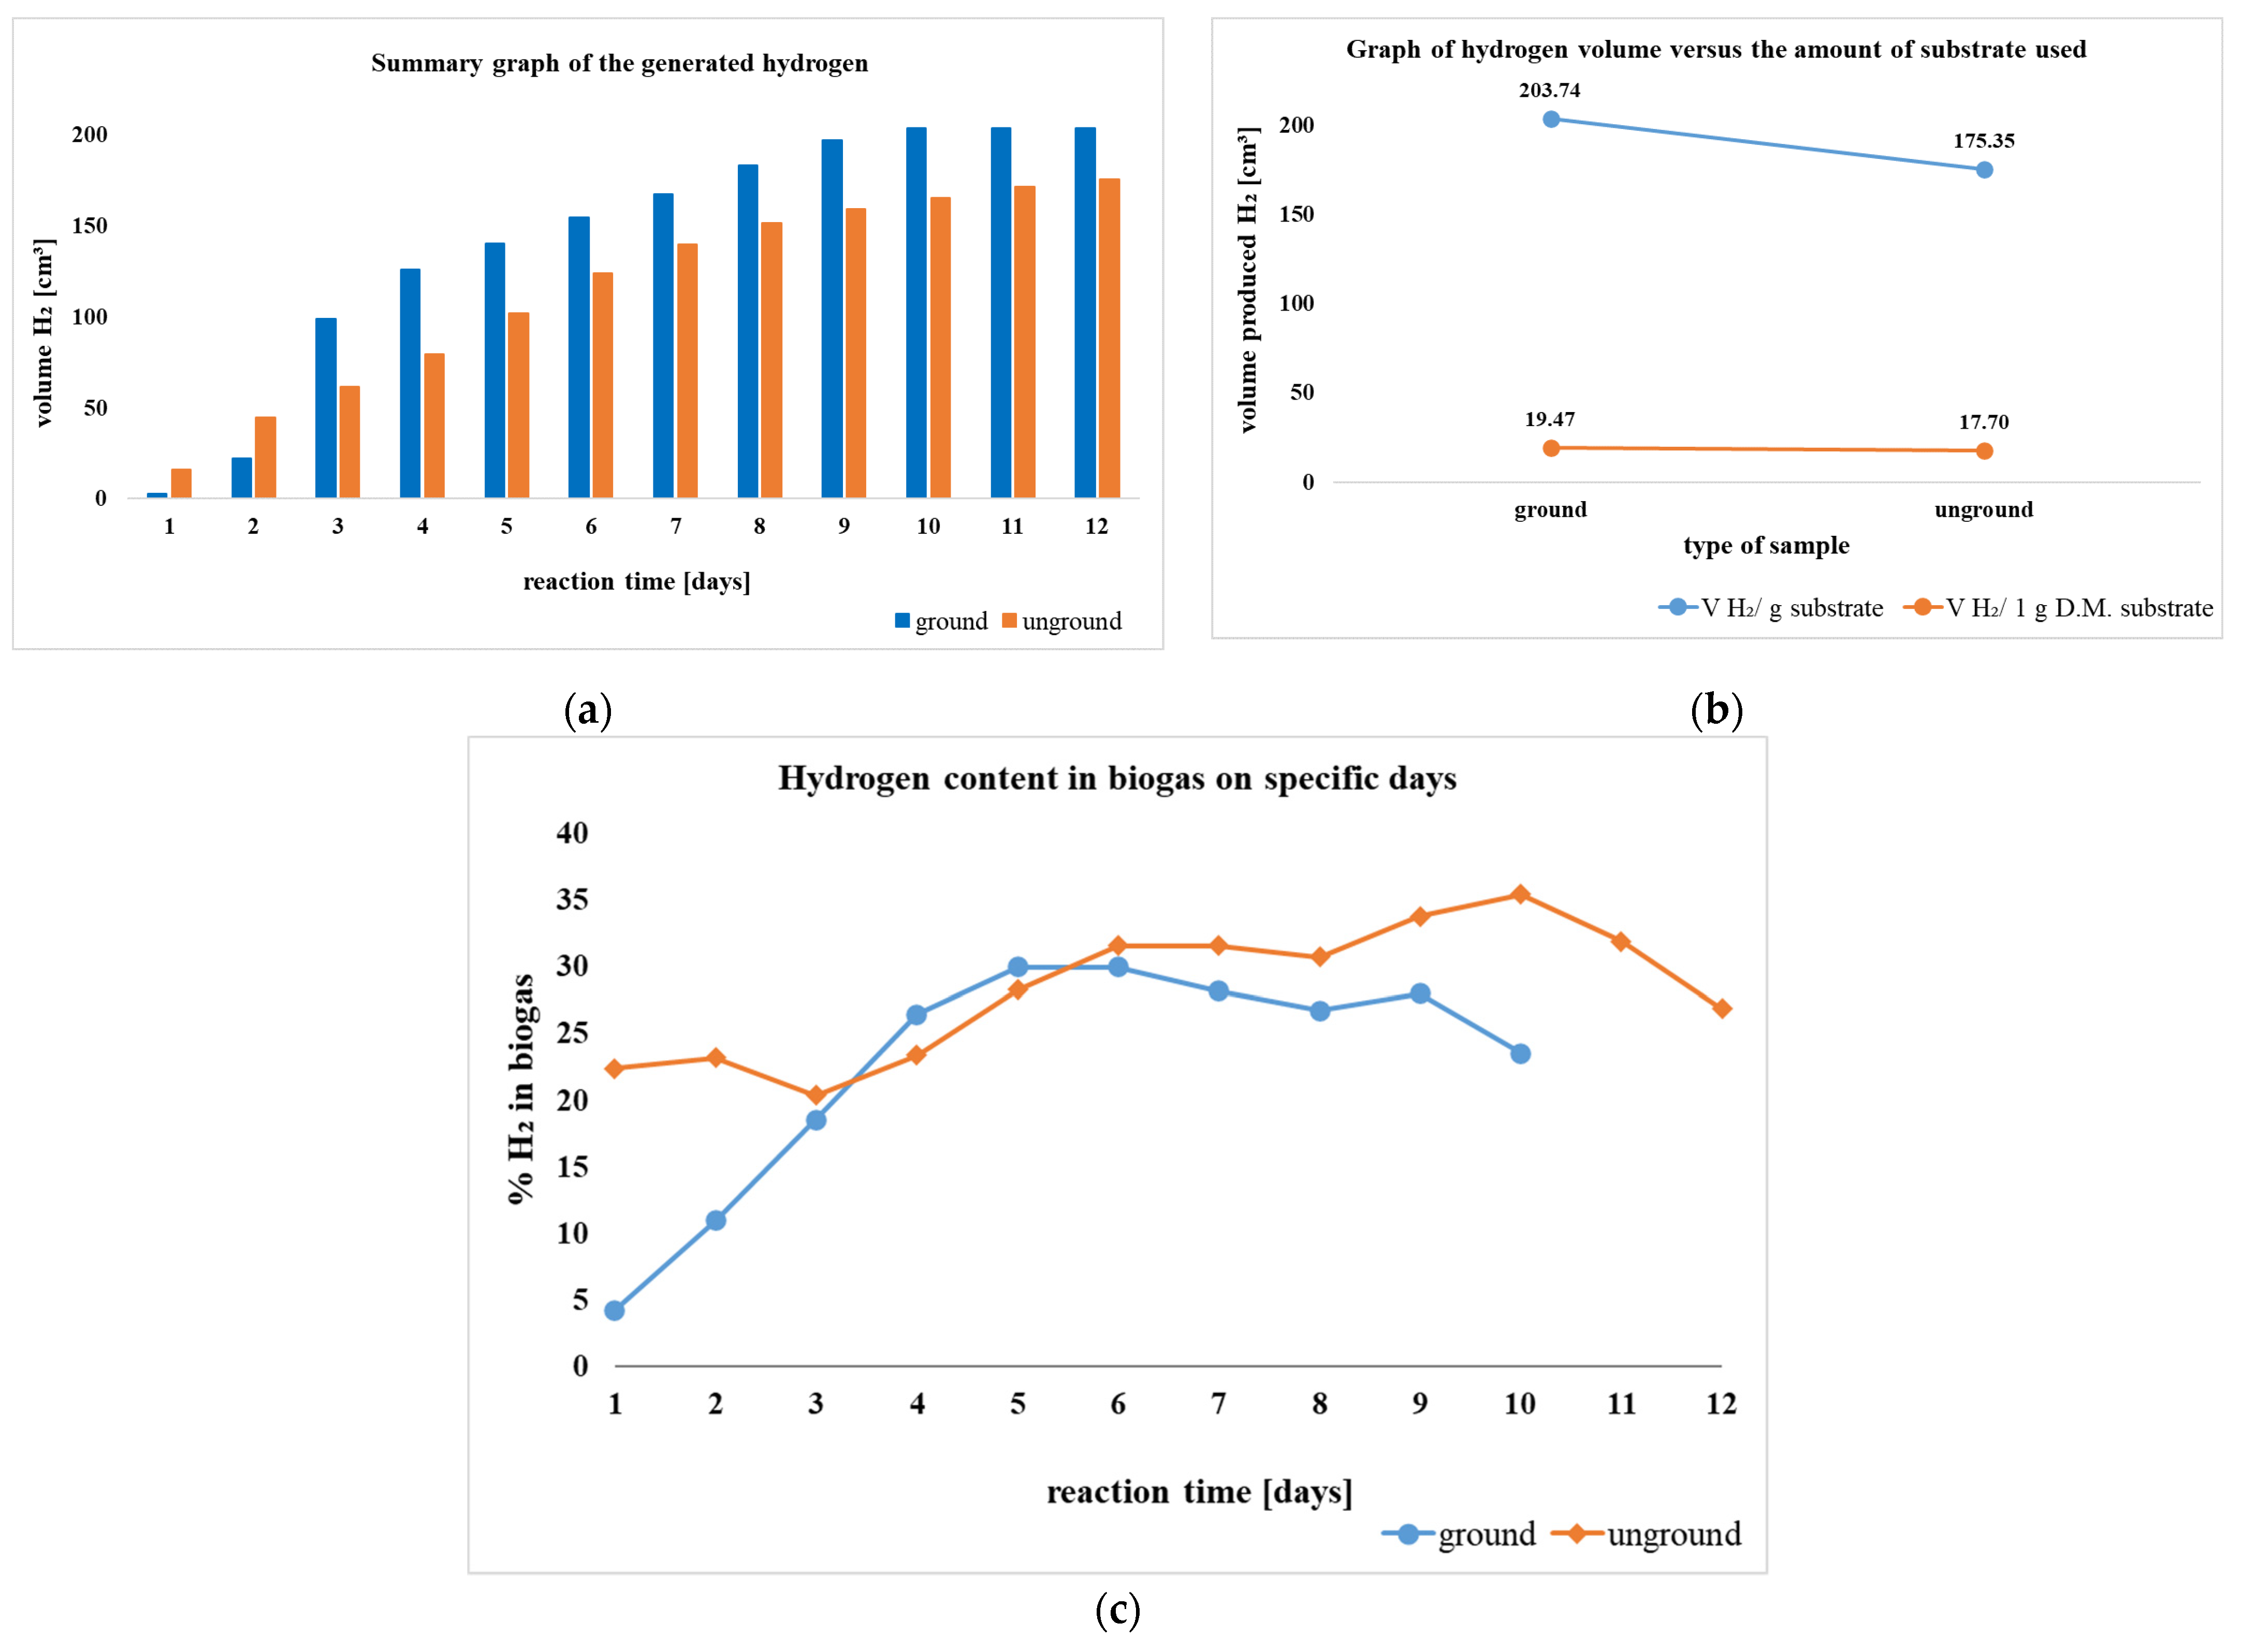
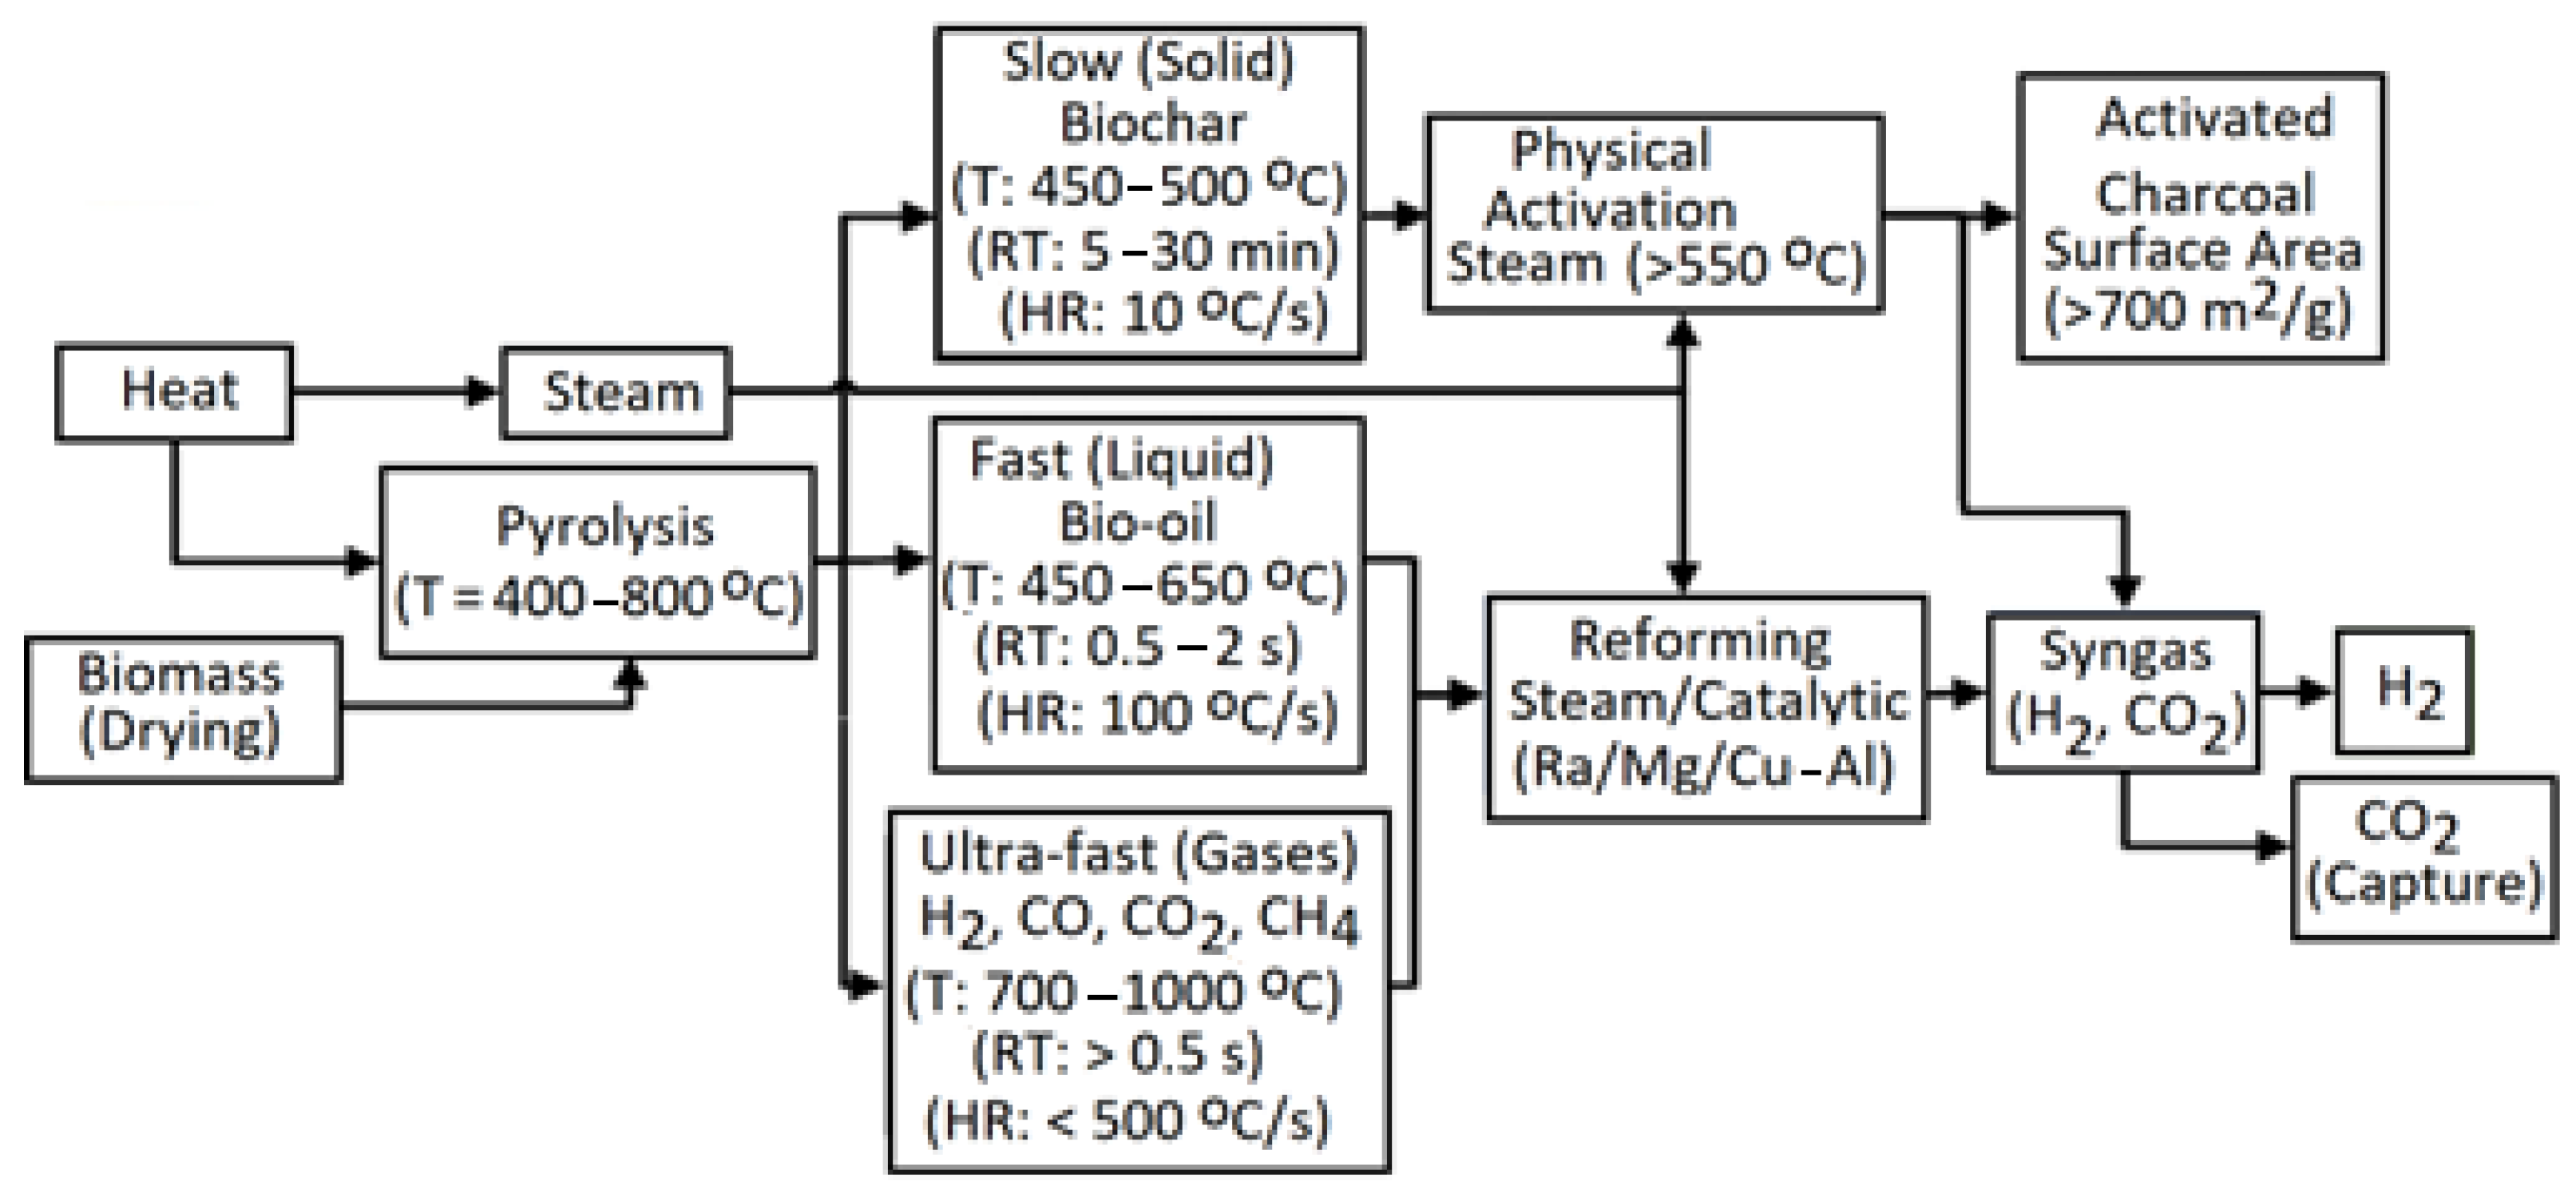
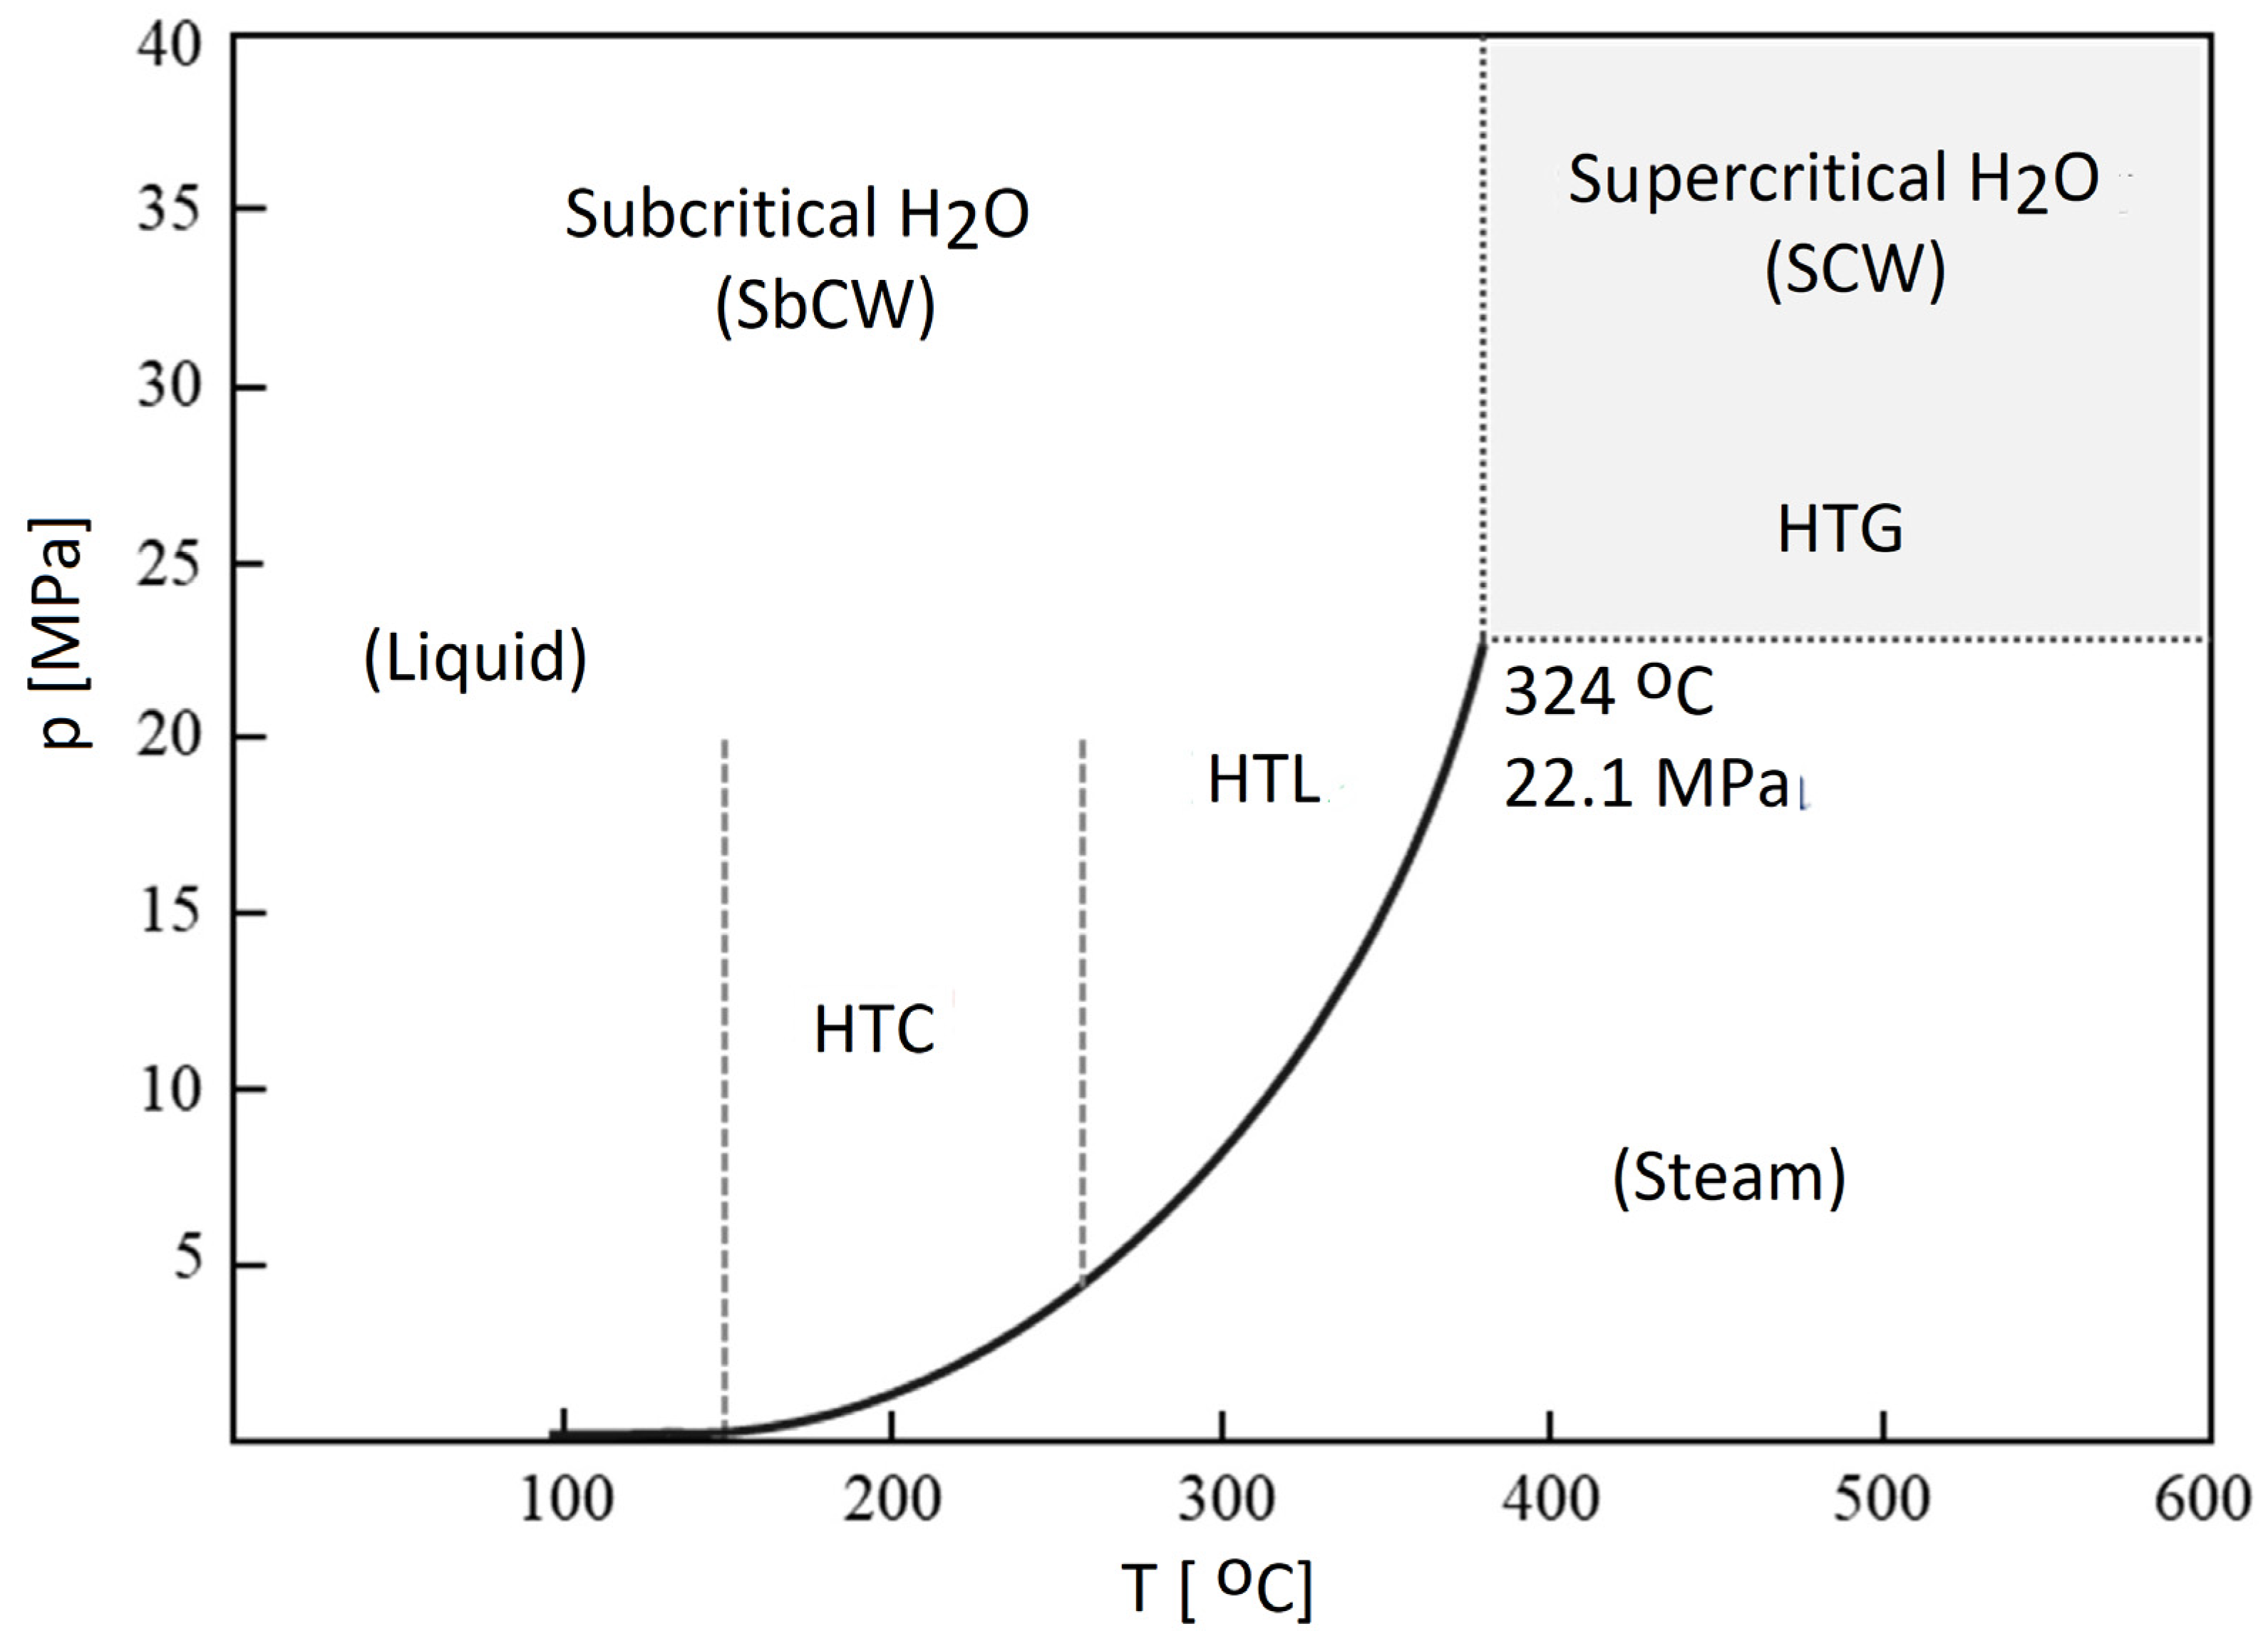
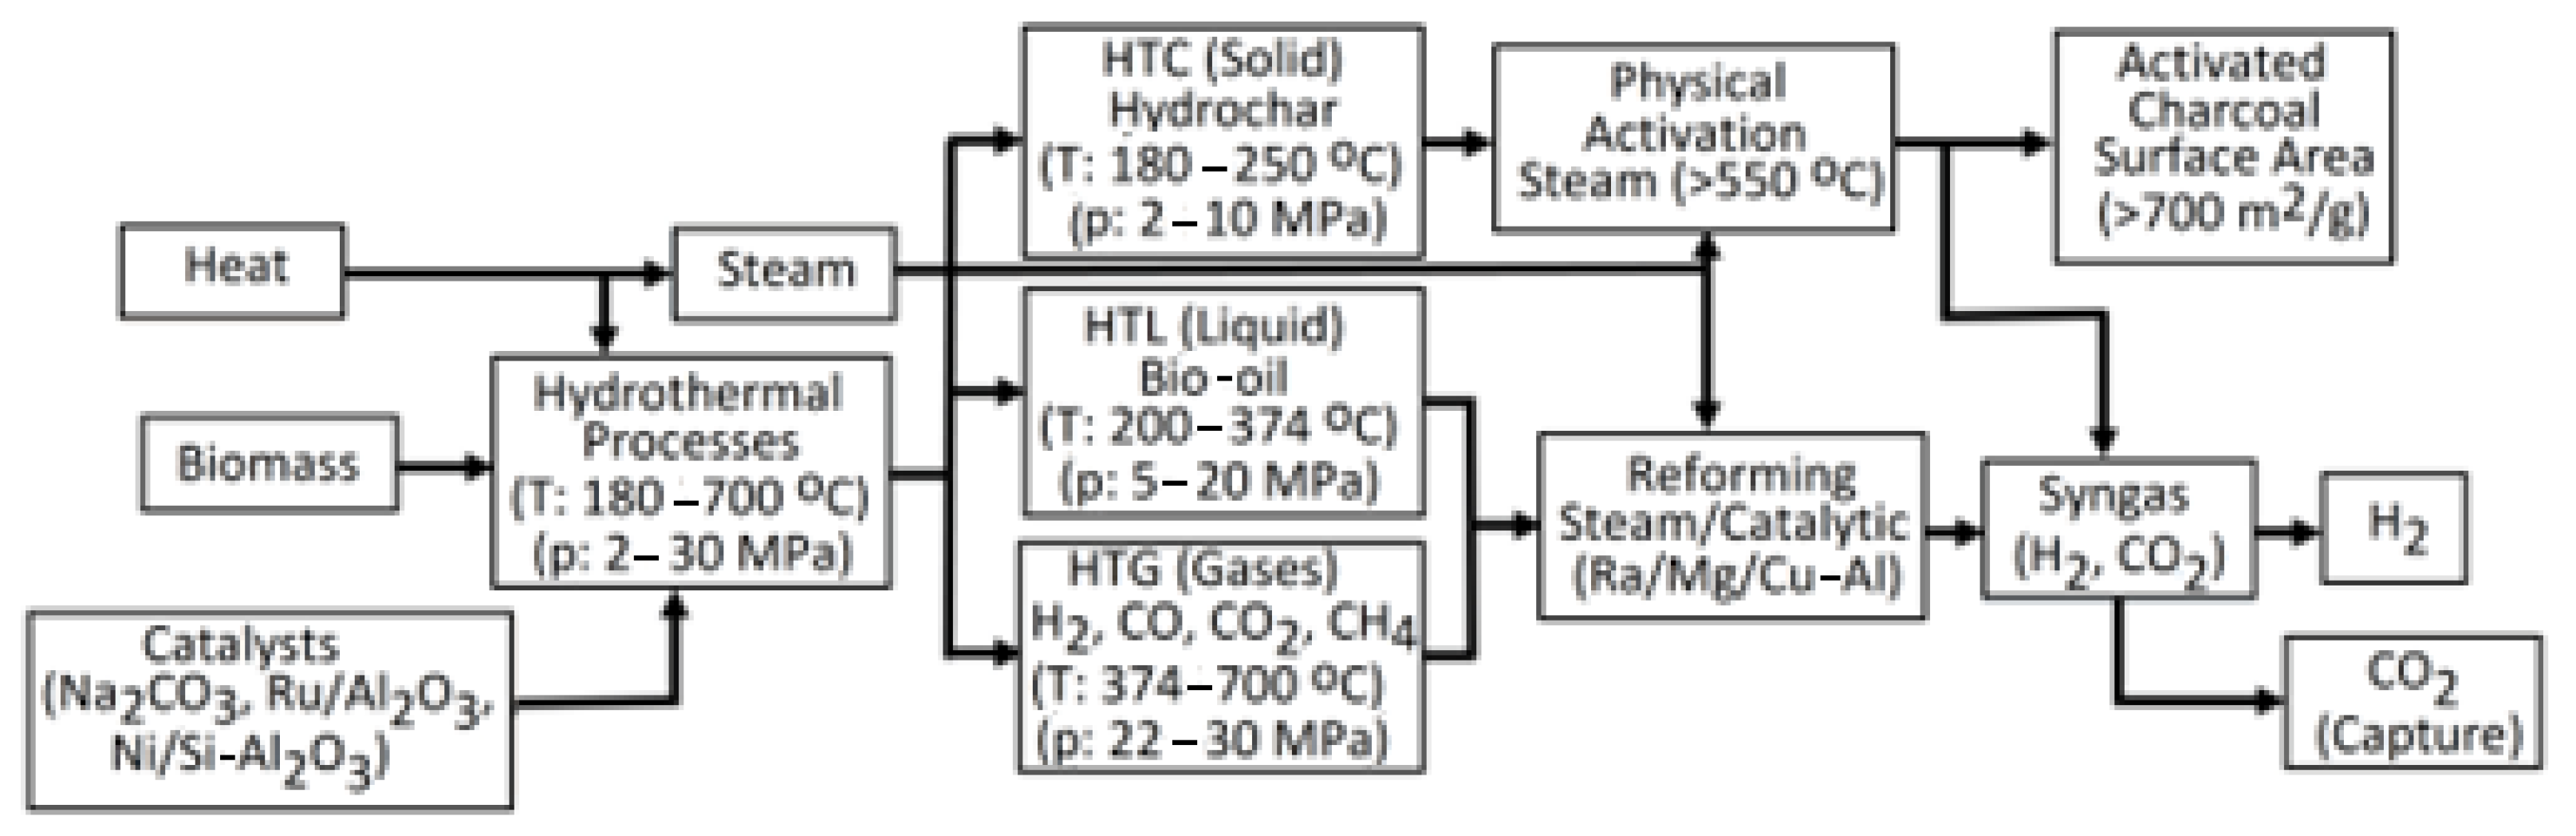
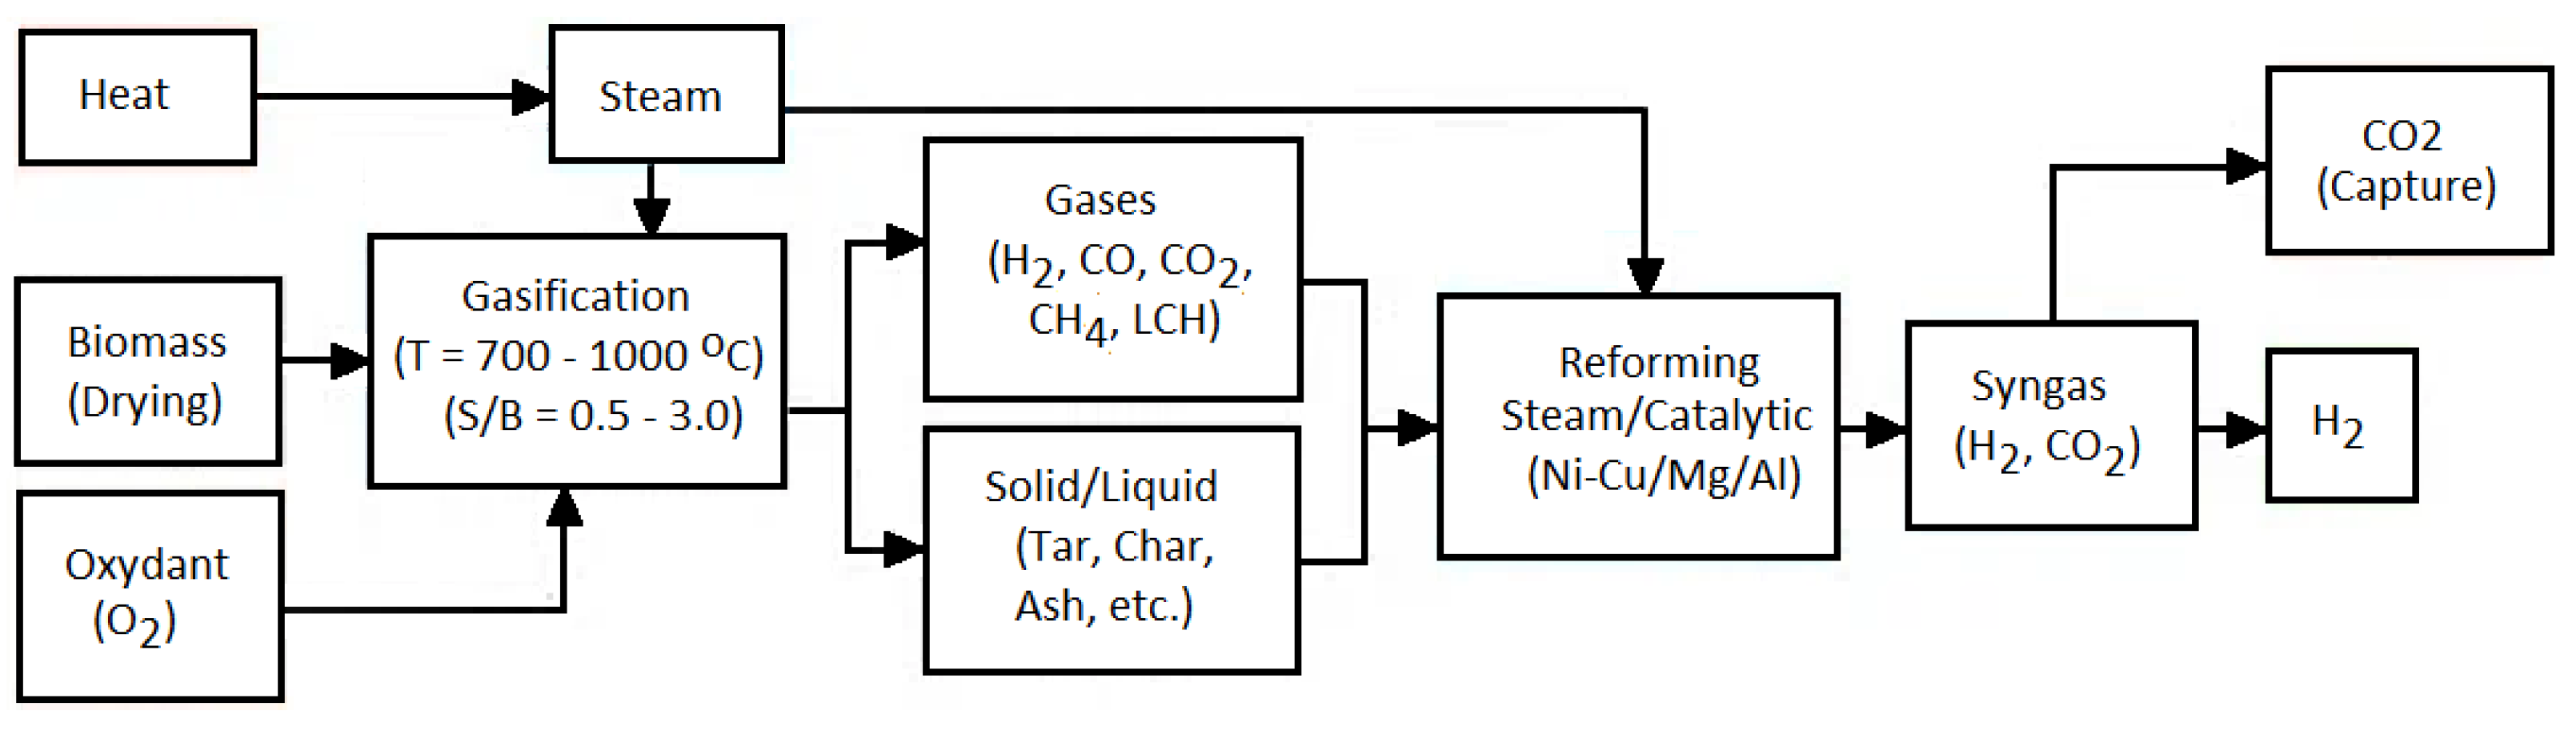
Figure 1. Methods for separating H2 from biomass (based on [39]).
Molecules 30 00565 g001
Figure 2. The flowchart of DbP (based on [76]).
Molecules 30 00565 g002
Figure 3. The flowchart of i-DbP.
Molecules 30 00565 g003
Figure 4. The flowchart of PF (based on [156]).
Molecules 30 00565 g004
Figure 5. The flowchart of DF (based on [180]).
Molecules 30 00565 g005
Figure 6. A two-stage bioreactor with integrated DF and PF systems.
Molecules 30 00565 g006
Figure 7. Chrome shaving waste—main substrate in dark fermentation.
Molecules 30 00565 g007
Figure 8. The installation used for the DF process: (a) Actual appearance of the installation; (b) installation scheme—plane view; (c) installation scheme—perspective view. 1. System to perform gas measurement; 2. A gas flow system from the reactors to the measurement system; 3. reactors with a temperature control system.
Molecules 30 00565 g008
Figure 9. A comparison of the efficiency of generated H2 and the H2 content in BG in an experiment with mixing: (a) a summary graph of the generated H2; (b) a graph of H2 volume versus the amount of substrate used; (c) H2 content in BG on specific days.
Molecules 30 00565 g009
Figure 10. A comparison of the effectiveness of generated H2 and the H2 content in BG in an experiment with grinding: (a) a summary graph of the generated H2; (b) a graph of H2 volume versus the amount of substrate used; (c) H2 content in BG on specific days.
Molecules 30 00565 g010
Figure 11. The flowchart of PF (based on [39]).
Molecules 30 00565 g011
Figure 12. The phase diagram of H2O with the regions of HT processes, delineating the conditions for hydrothermal carbonization (HTC), hydrothermal liquefaction (HTL), and hydrothermal gasification (HTG). Based on [39].
Molecules 30 00565 g012
Figure 13. The renewable-H2 production process performed via biomass HT processes (based on [39]).
Molecules 30 00565 g013
Figure 14. The flowchart of GA (based on [39]).
Molecules 30 00565 g014
Table 5. Pros and cons of biological methods used for H2 extraction from biomass.
Methods Pros Cons
DbPHigh efficacy, renewable, and sustainableO2 sensitivity of H2ase, low catalyst availability
i-DbPSeparation of H2 and O2 generation, utilization of both H2ase and N2aseLow efficacy, environmental sensitivity
PFUses a wide range of organic substrates, sustainableGreat energy expense, O2 sensitivity of N2ase
DFEndless generation, wide substrate availability, cheapLow substrate conversion efficacy, occurrence of H2 consumers, volatile fatty acid drainage
ISIncreased biomass conversionCapital-intensive, needs specialized framework
Table 7. Comparison of GA techniques based on the used oxidizing agent. Based on [67].
Oxidizing Agent in GY TechniqueO2AirSteam
ProductsCO, H2, LHC (CH4, C2H4), CO2N2, CO, H2, CO2, LHC (CH4, C2H4), H2OH2, CO, CO2, LHC (CH4, C2H4)
Tar [g/kg]2.2–463.7–61.960–95
Average H2/(steam–O2 mixture) ratio40%15%40%
H2/CO ratio10.751.6
Heating Value [MJ/Nm3]12–284–710–18
Pros
  • Exothermic oxidation generates heat for GA.
  • Higher syngas quality
  • Higher heating value
  • Higher Cold-Gas efficacy
  • Less tar and char
  • Simple
  • Availability
  • Least expense
  • Exothermic oxidation generates heat for GA.
  • Less tar and char
  • Higher syngas quality
  • Higher heating value
  • Higher Cold-Gas efficacy
  • Higher H2 content
  • Less CO2
Cons
  • High capital and operating expenses for air separation unit
  • Energy demand for air separation unit
  • High CO2 generation
  • High N2 content
  • Gas dilution with N2
  • Lowest syngas quality
  • Lowest heating value
  • Lowest Cold-Gas-Efficiency
  • Inappropriate to some applications
  • High CO2 production
  • External heat supply needed to maintain the temperature
  • Relatively high tar and char
  • Energy and expense of steam generation
  • Excess steam is favorable but lowers the reactor operating temperature
  • Expense of dual separate reactors
Disclaimer/Publisher’s Note: The statements, opinions and data contained in all publications are solely those of the individual author(s) and contributor(s) and not of MDPI and/or the editor(s). MDPI and/or the editor(s) disclaim responsibility for any injury to people or property resulting from any ideas, methods, instructions or products referred to in the content.

