
WO3−x/WS2 Nanocomposites for Fast-Response Room Temperature Gas Sensing

 , , , , and
Abstract
1. Introduction
2. Results and Discussion
3. Experimental Section
4. Conclusions
Supplementary Materials
Author Contributions
Funding
Institutional Review Board Statement
Informed Consent Statement
Data Availability Statement
Conflicts of Interest
References
- Khorramifar, A.; Karami, H.; Lvova, L.; Kolouri, A.; Łazuka, E.; Piłat-Rożek, M.; Łagód, G.; Ramos, J.; Lozano, J.; Kaveh, M. Environmental Engineering Applications of Electronic Nose Systems Based on MOX Gas Sensors. Sensors 2023, 23, 5716. [Google Scholar] [CrossRef]
- Chen, X.; Leishman, M.; Bagnall, D.; Nasiri, N. Nanostructured Gas Sensors: From Air Quality and Environmental Monitoring to Healthcare and Medical Applications. Nanomaterials 2021, 11, 1927. [Google Scholar] [CrossRef] [PubMed]
- Moshnikov, V.A.; Gracheva, I.E.; Kuznezov, V.V.; Maximov, A.I.; Karpova, S.S.; Ponomareva, A.A. Hierarchical nanostructured semiconductor porous materials for gas sensors. J. Non-Cryst. Solids 2010, 356, 2020–2025. [Google Scholar] [CrossRef]
- Liu, J.; Lv, J.; Xiong, H.; Wang, Y.; Jin, G.; Zhai, Z.; Fu, C.; Zhang, Q. Size effect and comprehensive mathematical model for gas-sensing mechanism of SNO2 thin film gas sensors. J. Alloys Compd. 2022, 898, 162875. [Google Scholar] [CrossRef]
- Staerz, A.; Weimar, U.; Barsan, N. Current state of knowledge on the metal oxide based gas sensing mechanism. Sens. Actuators B Chem. 2022, 358, 131531. [Google Scholar] [CrossRef]
- Liu, J.; Zhang, L.; Fan, J.; Zhu, B.; Yu, J. Triethylamine gas sensor based on Pt-functionalized hierarchical ZnO microspheres. Sens. Actuators B Chem. 2021, 331, 129425. [Google Scholar] [CrossRef]
- Nagmani; Pravarthana, D.; Tyagi, A.; Jagadale, T.C.; Prellier, W.; Aswal, D.K. Highly sensitive and selective H2S gas sensor based on TiO2 thin films. Appl. Surf. Sci. 2021, 549, 149281. [Google Scholar] [CrossRef]
- Tian, X.; Cui, X.; Lai, T.; Ren, J.; Yang, Z.; Xiao, M.; Wang, B.; Xiao, X.; Wang, Y. Gas sensors based on TiO2 nanostructured materials for the detection of hazardous gases: A review. Nano Mater. Sci. 2021, 3, 390–403. [Google Scholar] [CrossRef]
- Kang, Y.; Yu, F.; Zhang, L.; Wang, W.; Chen, L.; Li, Y. Review of ZnO-based nanomaterials in gas sensors. Solid State Ion. 2021, 360, 115544. [Google Scholar] [CrossRef]
- Ge, W.; Jiao, S.; Chang, Z.; He, X.; Li, Y. Ultrafast Response and High Selectivity toward Acetone Vapor Using Hierarchical Structured TiO2 Nanosheets. ACS Appl. Mater. Interfaces 2020, 12, 13200–13207. [Google Scholar] [CrossRef]
- Jian, Y.; Hu, W.; Zhao, Z.; Cheng, P.; Haick, H.; Yao, M.; Wu, W. Gas Sensors Based on Chemi-Resistive Hybrid Functional Nanomaterials. Nano-Micro Lett. 2020, 12, 71. [Google Scholar] [CrossRef]
- Zhang, D.; Yang, Z.; Yu, S.; Mi, Q.; Pan, Q. Diversiform metal oxide-based hybrid nanostructures for gas sensing with versatile prospects. Coord. Chem. Rev. 2020, 413, 213272. [Google Scholar] [CrossRef]
- Li, Q.; Zeng, W.; Li, Y. Metal oxide gas sensors for detecting NO2 in industrial exhaust gas: Recent developments. Sens. Actuators B Chem. 2022, 359, 131579. [Google Scholar] [CrossRef]
- Kumar, R.; Liu, X.; Zhang, J.; Kumar, M. Room-Temperature Gas Sensors Under Photoactivation: From Metal Oxides to 2D Materials. Nano-Micro Lett. 2020, 12, 164. [Google Scholar] [CrossRef]
- Das, S.; Mojumder, S.; Saha, D.; Pal, M. Influence of major parameters on the sensing mechanism of semiconductor metal oxide based chemiresistive gas sensors: A review focused on personalized healthcare. Sens. Actuators B Chem. 2022, 352, 131066. [Google Scholar] [CrossRef]
- Nalimova, S.S.; Shomakhov, Z.V.; Gerasimova, K.V.; Punegova, K.N.; Guketlov, A.M.; Kalmykov, R.M. Gas-sensitive composite nanostructures based on zinc oxide for detecting organic solvent vapors. Phys. Chem. Asp. Study Clust. Nanostructures Nanomater. 2022, 14, 678–687. [Google Scholar] [CrossRef]
- Kondratev, V.M.; Morozov, I.A.; Vyacheslavova, E.A.; Kirilenko, D.A.; Kuznetsov, A.; Kadinskaya, S.A.; Nalimova, S.S.; Moshnikov, V.A.; Gudovskikh, A.S.; Bolshakov, A.D. Silicon Nanowire-Based Room-Temperature Multi-environment Ammonia Detection. ACS Appl. Nano Mater. 2022, 5, 9940–9949. [Google Scholar] [CrossRef]
- Bobkov, A.; Luchinin, V.; Moshnikov, V.; Nalimova, S.; Spivak, Y. Impedance Spectroscopy of Hierarchical Porous Nanomaterials Based on por-Si, por-Si Incorporated by Ni and Metal Oxides for Gas Sensors. Sensors 2022, 22, 1530. [Google Scholar] [CrossRef] [PubMed]
- Korotcenkov, G. Current Trends in Nanomaterials for Metal Oxide-Based Conductometric Gas Sensors: Advantages and Limitations. Part 1: 1D and 2D Nanostructures. Nanomaterials 2020, 10, 1392. [Google Scholar] [CrossRef] [PubMed]
- Isaac, N.A.; Pikaar, I.; Biskos, G. Metal oxide semiconducting nanomaterials for air quality gas sensors: Operating principles, performance, and synthesis techniques. Mikrochim. Acta 2022, 189, 196. [Google Scholar] [CrossRef]
- Wang, Z.; Zhu, L.; Sun, S.; Wang, J.; Yan, W. One-Dimensional Nanomaterials in Resistive Gas Sensor: From Material Design to Application. Chemosensors 2021, 9, 198. [Google Scholar] [CrossRef]
- Nalimova, S.S.; Moshnikov, V.A.; Shomakhov, Z.V.; Kondratev, V.M. Gas Sensors Based on Nanostructures of Binary and Ternary Oxide Systems. J. Russ. Univ. Radioelectron. 2024, 27, 105–118. [Google Scholar] [CrossRef]
- Röck, F.; Barsan, N.; Weimar, U. Electronic nose: Current status and future trends. Chem. Rev. 2008, 108, 705–725. [Google Scholar] [CrossRef] [PubMed]
- Bobkov, A.; Varezhnikov, A.; Plugin, I.; Fedorov, F.S.; Trouillet, V.; Geckle, U.; Sommer, M.; Goffman, V.; Moshnikov, V.; Sysoev, V. The Multisensor Array Based on Grown-On-Chip Zinc Oxide Nanorod Network for Selective Discrimination of Alcohol Vapors at Sub-ppm Range. Sensors 2019, 19, 4265. [Google Scholar] [CrossRef] [PubMed]
- Solomatin, M.A.; Radovic, M.; Petrunin, A.A.; Kirilenko, D.A.; Varezhnikov, A.S.; Dubourg, G.; Vasilkov, M.Y.; Bainyashev, A.M.; Nesterovic, A.; Kiselev, I.; et al. Towards electronic smelling of ketones and alcohols at sub- and low ppms by pinky-sized on-chip sensor array with SNO2 mesoporous layer gradually engineered by near IR-laser. Chem. Eng. J. 2023, 474, 145934. [Google Scholar] [CrossRef]
- Das, S.; Jayaraman, V. SnO2: A comprehensive review on structures and gas sensors. Prog. Mater. Sci. 2014, 66, 112–255. [Google Scholar] [CrossRef]
- Zhu, L.; Zeng, W. Room-temperature gas sensing of ZnO-based gas sensor: A review. Sens. Actuators A Phys. 2017, 267, 242–261. [Google Scholar] [CrossRef]
- Wu, K.; Debliquy, M.; Zhang, C. Room temperature gas sensors based on Ce doped TiO2 nanocrystals for highly sensitive NH3 detection. Chem. Eng. J. 2022, 444, 136449. [Google Scholar] [CrossRef]
- Dong, C.; Zhao, R.; Yao, L.; Ran, Y.; Zhang, X.; Wang, Y. A review on WO3 based gas sensors: Morphology control and enhanced sensing properties. J. Alloys Compd. 2020, 820, 153194. [Google Scholar] [CrossRef]
- Wang, X.; Wang, T.; Si, G.; Li, Y.; Zhang, S.; Deng, X.; Xu, X. Oxygen vacancy defects engineering on Ce-doped α-Fe2O3 gas sensor for reducing gases. Sens. Actuators B Chem. 2020, 302, 127165. [Google Scholar] [CrossRef]
- Bonardo, D.; Septiani, N.L.W.; Amri, F.; Estananto; Humaidi, S.; Suyatman; Yuliarto, B. Review—Recent Development of WO3 for Toxic Gas Sensors Applications. J. Electrochem. Soc. 2021, 168, 107502. [Google Scholar] [CrossRef]
- Barathy, T.R.; Yadav, P.K.; Mondal, A.; Ajitha, B.; Jarugala, J.; Kumar Reddy, Y.A. High porosity and oxygen vacancy enriched WO3−x thin films for room temperature hydrogen gas sensors. Int. J. Hydrogen Energy 2024, 50, 878–888. [Google Scholar] [CrossRef]
- Zeng, Q.; Cui, Y.; Zhu, L.; Yao, Y. Increasing oxygen vacancies at room temperature in SNO2 for enhancing ethanol gas sensing. Mater. Sci. Semicond. Process. 2020, 111, 104962. [Google Scholar] [CrossRef]
- Rao, M.C.; Hussain, O.M. Optical Properties of Vacuum Evaporated WO3 Thin Films. Res. J. Chem. Sci. 2011, 1, 76–80. [Google Scholar]
- Mai, M.; Ma, X.; Zhou, H.; Ye, M.; Li, T.; Ke, S.; Lin, P.; Zeng, X. Effect of oxygen pressure on pulsed laser deposited WO3 thin films for photoelectrochemical water splitting. J. Alloys Compd. 2017, 722, 913–919. [Google Scholar] [CrossRef]
- Hingangavkar, G.M.; Navale, Y.H.; Nimbalkar, T.M.; Mulik, R.N.; Patil, V.B. Hydrothermally engineered WO3 nanoflowers: A selective detection towards toxic NO2 gas. Sens. Actuators B Chem. 2022, 371, 132584. [Google Scholar] [CrossRef]
- Imran, M.; Kim, E.-B.; Kwak, D.-H.; Akhtar, M.S.; Ameen, S. Controlled Growth of WO3 Pyramidal Thin Film via Hot-Filament Chemical Vapor Deposition: Electrochemical Detection of Ethylenediamine. Chemosensors 2021, 9, 257. [Google Scholar] [CrossRef]
- Guo, X.; Ding, Y.; Liang, C.; Du, B.; Zhao, C.; Tan, Y.; Shi, Y.; Zhang, P.; Yang, X.; He, Y. Humidity-activated H2S sensor based on SnSe2/WO3 composite for evaluating the spoilage of eggs at room temperature. Sens. Actuators B Chem. 2022, 357, 131424. [Google Scholar] [CrossRef]
- Zou, Z.; Zhao, Z.; Zhang, Z.; Tian, W.; Yang, C.; Jin, X.; Zhang, K. Room-Temperature Optoelectronic Gas Sensor Based on Core-Shell g-C3N4@WO3 Heterocomposites for Efficient Ammonia Detection. Anal. Chem. 2023, 95, 2110–2118. [Google Scholar] [CrossRef] [PubMed]
- Duong, V.T.; Nguyen, C.T.; Luong, H.B.; Nguyen, D.C.; Nguyen, H.L. Ultralow-detection limit ammonia gas sensors at room temperature based on MWCNT/WO3 nanocomposite and effect of humidity. Solid State Sci. 2021, 113, 106534. [Google Scholar] [CrossRef]
- Nam, B.; Ko, T.-K.; Hyun, S.-K.; Lee, C. Sensitivities of a 6:4 (by molar ratio) ZnO/WO3 composite nanoparticle sensor to reducing and oxidizing gases. Appl. Surf. Sci. 2020, 504, 144104. [Google Scholar] [CrossRef]
- Barbosa, M.S.; Barbosa, D.N.; Da Silva, R.A.; Orlandi, M.O. NO2-sensing proprieties of WS2/WO3 heterostructures obtained by hydrothermal treatment of tungsten oxide seed materials. Chem. Phys. Lett. 2023, 812, 140269. [Google Scholar] [CrossRef]
- Verma, A.; Yadav, B.C. 2D/2D Nanostructured System Based on WO3/WS2 for Acetone Sensor and Breath Analyzer. ACS Appl. Nano Mater. 2023, 6, 5493–5507. [Google Scholar] [CrossRef]
- Han, Y.; Liu, Y.; Su, C.; Chen, X.; Li, B.; Jiang, W.; Zeng, M.; Hu, N.; Su, Y.; Zhou, Z.; et al. Hierarchical WS2 –WO3 Nanohybrids with P-N Heterojunctions for NO2 Detection. ACS Appl. Nano Mater. 2021, 4, 1626–1634. [Google Scholar] [CrossRef]
- Bhattacharyya, P.; Acharyya, D. Impact of Device Configurations on Sensing Performance of WS2 -Based Gas Sensors: A Review. IEEE Sens. J. 2021, 21, 22414–22425. [Google Scholar] [CrossRef]
- Tang, H.; Li, Y.; Sokolovskij, R.; Sacco, L.; Zheng, H.; Ye, H.; Yu, H.; Fan, X.; Tian, H.; Ren, T.-L.; et al. Ultra-High Sensitive NO2 Gas Sensor Based on Tunable Polarity Transport in CVD-WS2/IGZO p-N Heterojunction. ACS Appl. Mater. Interfaces 2019, 11, 40850–40859. [Google Scholar] [CrossRef]
- Sebastian, A.; Pendurthi, R.; Choudhury, T.H.; Redwing, J.M.; Das, S. Benchmarking monolayer MoS2 and WS2 field-effect transistors. Nat. Commun. 2021, 12, 693. [Google Scholar] [CrossRef]
- Bin Rafiq, M.K.S.; Amin, N.; Alharbi, H.F.; Luqman, M.; Ayob, A.; Alharthi, Y.S.; Alharthi, N.H.; Bais, B.; Akhtaruzzaman, M. WS2: A New Window Layer Material for Solar Cell Application. Sci. Rep. 2020, 10, 771. [Google Scholar] [CrossRef]
- Sheng, Y.; Chen, T.; Lu, Y.; Chang, R.-J.; Sinha, S.; Warner, J.H. High-Performance WS2 Monolayer Light-Emitting Tunneling Devices Using 2D Materials Grown by Chemical Vapor Deposition. ACS Nano 2019, 13, 4530–4537. [Google Scholar] [CrossRef]
- Yan, X.; Zhao, Q.; Chen, A.P.; Zhao, J.; Zhou, Z.; Wang, J.; Wang, H.; Zhang, L.; Li, X.; Xiao, Z.; et al. Vacancy-Induced Synaptic Behavior in 2D WS2 Nanosheet-Based Memristor for Low-Power Neuromorphic Computing. Small 2019, 15, e1901423. [Google Scholar] [CrossRef]
- Zuo, X.; Dai, H.; Zhang, H.; Liu, J.; Ma, S.; Chen, X. A peptide-WS2 nanosheet based biosensing platform for determination of β-secretase and screening of its inhibitors. Analyst 2018, 143, 4585–4591. [Google Scholar] [CrossRef] [PubMed]
- Mishra, R.K.; Kumar, V.; Le Trung, G.; Choi, G.J.; Ryu, J.W.; Mane, S.M.; Shin, J.C.; Kumar, P.; Lee, S.H.; Gwag, J.S. WS2 Nanorod as a Remarkable Acetone Sensor for Monitoring Work/Public Places. Sensors 2022, 22, 8609. [Google Scholar] [CrossRef]
- Chang, X.; Xu, S.; Liu, S.; Wang, N.; Sun, S.; Zhu, X.; Li, J.; Ola, O.; Zhu, Y. Highly sensitive acetone sensor based on WO3 nanosheets derived from WS2 nanoparticles with inorganic fullerene-like structures. Sens. Actuators B Chem. 2021, 343, 130135. [Google Scholar] [CrossRef]
- Perrozzi, F.; Emamjomeh, S.M.; Paolucci, V.; Taglieri, G.; Ottaviano, L.; Cantalini, C. Thermal stability of WS2 flakes and gas sensing properties of WS2/WO3 composite to H2, NH3 and NO2. Sens. Actuators B: Chem. 2017, 243, 812–822. [Google Scholar] [CrossRef]
- Liang, Z.; Zhang, X.; Yang, J.; Cheng, Y.; Hou, H.; Hussain, S.; Liu, J.; Qiao, G.; Liu, G. Facile fabrication of nanoflower-like WO3/WS2 heterojunction for highly sensitive NO2 detection at room temperature. J. Hazard. Mater. 2023, 443, 130316. [Google Scholar] [CrossRef] [PubMed]
- Simon Patrick, D.; Bharathi, P.; Kamalakannan, S.; Archana, J.; Navaneethan, M.; Krishna Mohan, M. Confined oxidation of 2D WS2 nanosheets forming WO3/WS2 nanocomposites for room temperature NO2 gas sensing application. Appl. Surf. Sci. 2024, 642, 158554. [Google Scholar] [CrossRef]
- Ansari, H.R.; Kordrostami, Z.; Mirzaei, A. In-vehicle wireless driver breath alcohol detection system using a microheater integrated gas the sensor is based on Sn-doped CuO nanostructures. Sci. Rep. 2023, 13, 7136. [Google Scholar] [CrossRef] [PubMed]
- Li, J.; Wang, L.; Cheng, X.; Luo, D.; Huang, B.; Sun, S.; Li, X.; Yang, Z. Low-temperature and high-sensitivity Au-decorated thin-walled SnO2 nanotubes sensor for ethanol detection. Mater. Today Commun. 2023, 37, 107217. [Google Scholar] [CrossRef]
- Zhang, C.; He, X.; Zhou, Y.; Xu, J.; Zheng, Z.; Bian, Y.; Debliquy, M. Highly sensitive and stable yolk-shell Bi2MoO6 gas sensor for ppb-level isopropanol detection. Sens. Actuators B Chem. 2024, 401, 135059. [Google Scholar] [CrossRef]
- Li, W.; Xu, H.; Wang, A.; Cheng, X.; Shi, J.; Zhong, A.; Ma, Y.; Zhang, L.; Fan, Z.; Xu, F. Insitu controllable synthesis of MoO3 nanoflakes and its temperature-dependent dual selectivity for detection of ethanol and isopropanol. Sens. Actuators B Chem. 2024, 408, 135548. [Google Scholar] [CrossRef]
- Madhavi, V.; Kondaiah, P.; Hussain, O.M.; Uthanna, S. Structural, optical and electrochromic properties of RF magnetron sputtered WO3 thin films. Phys. B Condens. Matter 2014, 454, 141–147. [Google Scholar] [CrossRef]
- Shooshtari, M.; Salehi, A.; Vollebregt, S. Effect of temperature and humidity on the sensing performance of TiO2 nanowire-based ethanol vapor sensors. Nanotechnology 2021, 32, 325501. [Google Scholar] [CrossRef] [PubMed]
- Marikutsa, A.; Rumyantseva, M.; Konstantinova, E.A.; Gaskov, A. The Key Role of Active Sites in the Development of Selective Metal Oxide Sensor Materials. Sensors 2021, 21, 2554. [Google Scholar] [CrossRef]
- Sun, L.; Xu, H.; Cheng, Z.; Zheng, D.; Zhou, Q.; Yang, S.; Lin, J. A heterostructured WS2/WSe2 catalyst by heterojunction engineering towards boosting hydrogen evolution reaction. Chem. Eng. J. 2022, 443, 136348. [Google Scholar] [CrossRef]
- Yan, M.; Li, G.; Guo, C.; Guo, W.; Ding, D.; Zhang, S.; Liu, S. WO3−x sensitized TiO2 spheres with full-spectrum-driven photocatalytic activities from UV to near infrared. Nanoscale 2016, 8, 17828–17835. [Google Scholar] [CrossRef]
- Di Paola, A.; Palmisano, L.; Venezia, A.M.; Augugliaro, V. Coupled Semiconductor Systems for Photocatalysis. Preparation and Characterization of Polycrystalline Mixed WO3/WS2 Powders. J. Phys. Chem. B 1999, 103, 8236–8244. [Google Scholar] [CrossRef]
- Chastain, J. (Ed.) Handbook of X-Ray Photoelectron Spectroscopy: A Reference Book of Standard Spectra for Identification and Interpretation of XPS Data, Reprint of the 1992 version; Physical Electronics, Inc.: Eden Prairie, MN, USA, 1995; ISBN 0-9648124-1-X. [Google Scholar]
- Wang, X.; Meng, X.; Zhu, Y.; Gao, W. Design of ultrahigh-response gas sensor based on Pd-WO3/WS2 ternary nanocomposites for ultrafast hydrogen detection. Sens. Actuators B Chem. 2024, 401, 134991. [Google Scholar] [CrossRef]
- Koçak, Y.; Akaltun, Y.; Gür, E. Magnetron sputtered WS2; optical and structural analysis. J. Phys. Conf. Ser. 2016, 707, 12028. [Google Scholar] [CrossRef]
- Shpak, A.P.; Korduban, A.M.; Kulikov, L.M.; Kryshchuk, T.V.; Konig, N.B.; Kandyba, V.O. XPS studies of the surface of nanocrystalline tungsten disulfide. J. Electron Spectrosc. Relat. Phenom. 2010, 181, 234. [Google Scholar] [CrossRef]
- Mohamedkhair, A.K.; Drmosh, Q.A.; Qamar, M.; Yamani, Z.H. Tuning Structural Properties of WO3 Thin Films for Photoelectrocatalytic Water Oxidation. Catalysts 2021, 11, 381. [Google Scholar] [CrossRef]
- Song, Z.; Liu, J.; Liu, Q.; Yu, X.; Zhang, W.; Wang, Y.; Huang, Z.; Zang, J.; Liu, H. Enhanced H2S gas sensing properties based on SnO2 quantum wire/reduced graphene oxide nanocomposites: Equilibrium and kinetics modeling. Sens. Actuators B Chem. 2017, 249, 632–638. [Google Scholar] [CrossRef]
- Walker, J.; Karnati, P.; Akbar, S.A.; Morris, P.A. Selectivity mechanisms in resistive-type metal oxide heterostructural gas sensors. Sens. Actuators B Chem. 2022, 355, 131242. [Google Scholar] [CrossRef]
- Spagnoli, E.; Krik, S.; Fabbri, B.; Valt, M.; Ardit, M.; Gaiardo, A.; Vanzetti, L.; Della Ciana, M.; Cristino, V.; Vola, G.; et al. Development and characterization of WO3 nanoflakes for selective ethanol sensing. Sens. Actuators B Chem. 2021, 347, 130593. [Google Scholar] [CrossRef]
- Chen, D.; Hou, X.; Wen, H.; Wang, Y.; Wang, H.; Li, X.; Zhang, R.; Lu, H.; Xu, H.; Guan, S. The enhanced alcohol-sensing response of ultrathin WO3 nanoplates. Nanotechnology 2010, 21, 035501. [Google Scholar] [CrossRef]
- Ahmad, M.Z.; Sadek, A.Z.; Ou, J.Z.; Yaacob, M.H.; Latham, K.; Wlodarski, W. Facile synthesis of nanostructured WO3 thin films and their characterization for ethanol sensing. Mater. Chem. Phys. 2013, 141, 912–919. [Google Scholar] [CrossRef]
- Lim, J.-C.; Jin, C.; Choi, M.S.; Kim, M.Y.; Kim, S.; Choi, S.-M.; Baek, S.-H.; Lee, K.H.; Kim, H.-S. Synthesis, morphology, characterisation, and ethanol gas sensing of hierarchical flower-like Co-doped WO3 nanoplates by solvothermal route. Ceram. Int. 2021, 47, 20956–20964. [Google Scholar] [CrossRef]
- Xiao, J.; Che, Y.; Lv, B.; Benedicte, M.-C.; Feng, G.; Sun, T.; Song, C. Synthesis of WO3 Nanorods and Their Excellent Ethanol Gas-Sensing Performance. Mater. Res. 2021, 24, e20200434. [Google Scholar] [CrossRef]
- Liu, T.; Liu, J.; Hao, Q.; Liu, Q.; Jing, X.; Zhang, H.; Huang, G.; Wang, J. Porous tungsten trioxide nanolamellae with uniform structures for high-performance ethanol sensing. CrystEngComm 2016, 18, 8411–8418. [Google Scholar] [CrossRef]
- Govindharaj, K.; Manoharan, M.; Muthumalai, K.; Poovarasan, S.; Haldorai, Y.; Kumar, R.T.R. Humidity-independent highly sensitive propanol detection based on tin oxide-decorated mixed-phase tungsten oxide. J. Mater. Sci. Mater. Electron. 2023, 34, 1782. [Google Scholar] [CrossRef]
- Wu, Y.; Liu, Z.; Chen, J.; Cai, X.; Na, P. Hydrothermal fabrication of hyacinth flower-like WS2 nanorods and their photocatalytic properties. Mater. Lett. 2017, 189, 282–285. [Google Scholar] [CrossRef]
- Li, Z.; Huang, Y.; Zhang, S.; Chen, W.; Kuang, Z.; Ao, D.; Liu, W.; Fu, Y. A fast response & recovery H2S gas sensor based on α-Fe2O3 nanoparticles with ppb level detection limit. J. Hazard. Mater. 2015, 300, 167–174. [Google Scholar] [CrossRef] [PubMed]
- Li, Y.; Chen, N.; Deng, D.; Xing, X.; Xiao, X.; Wang, Y. Formaldehyde detection: SnO2 microspheres for formaldehyde gas sensor with high sensitivity, fast response/recovery and good selectivity. Sens. Actuators B Chem. 2017, 238, 264–273. [Google Scholar] [CrossRef]
- Freddi, S.; Marzuoli, C.; Pagliara, S.; Drera, G.; Sangaletti, L. Targeting biomarkers in the gas phase through a chemoresistive electronic nose based on graphene functionalized with metal phthalocyanines. RSC Adv. 2023, 13, 251. [Google Scholar] [CrossRef]


| Sensing Material | Target Gas/Concentration | Response, Ra/Rg | Working Temperature, °C | Response Time, s | Recovery Time, s | Reference |
|---|---|---|---|---|---|---|
| WO3 nanoflakes | Ethanol/5ppm | 7.5 | 250 | 9 min 40 s | 21 min | [77] |
| WO3 nanoplates | Ethanol/10 ppm | 8 | 300 | 4 s | 10 s | [61] |
| Nanostructured WO3 thin films | Ethanol/100 ppm | 8 | 400 | 12 s | 56 s | [78] |
| Hierarchical flower-like co-doped WO3 nanoplates | Ethanol/100 ppm | 2.3 | 250 | - | - | [79] |
| WO3 nanorods | Ethanol/100 ppm | 26.48 | 160 | 1 s | 30 s | [62] |
| Porous WO3 nanolamellae | Ethanol/10 ppm | 11 | 200 | 8.5 s | 6.5 s | [63] |
| SnO2-decorated WO3 structures | Propanol/50 ppm | 242% | 275 | 150 s | 150 s | [80] |
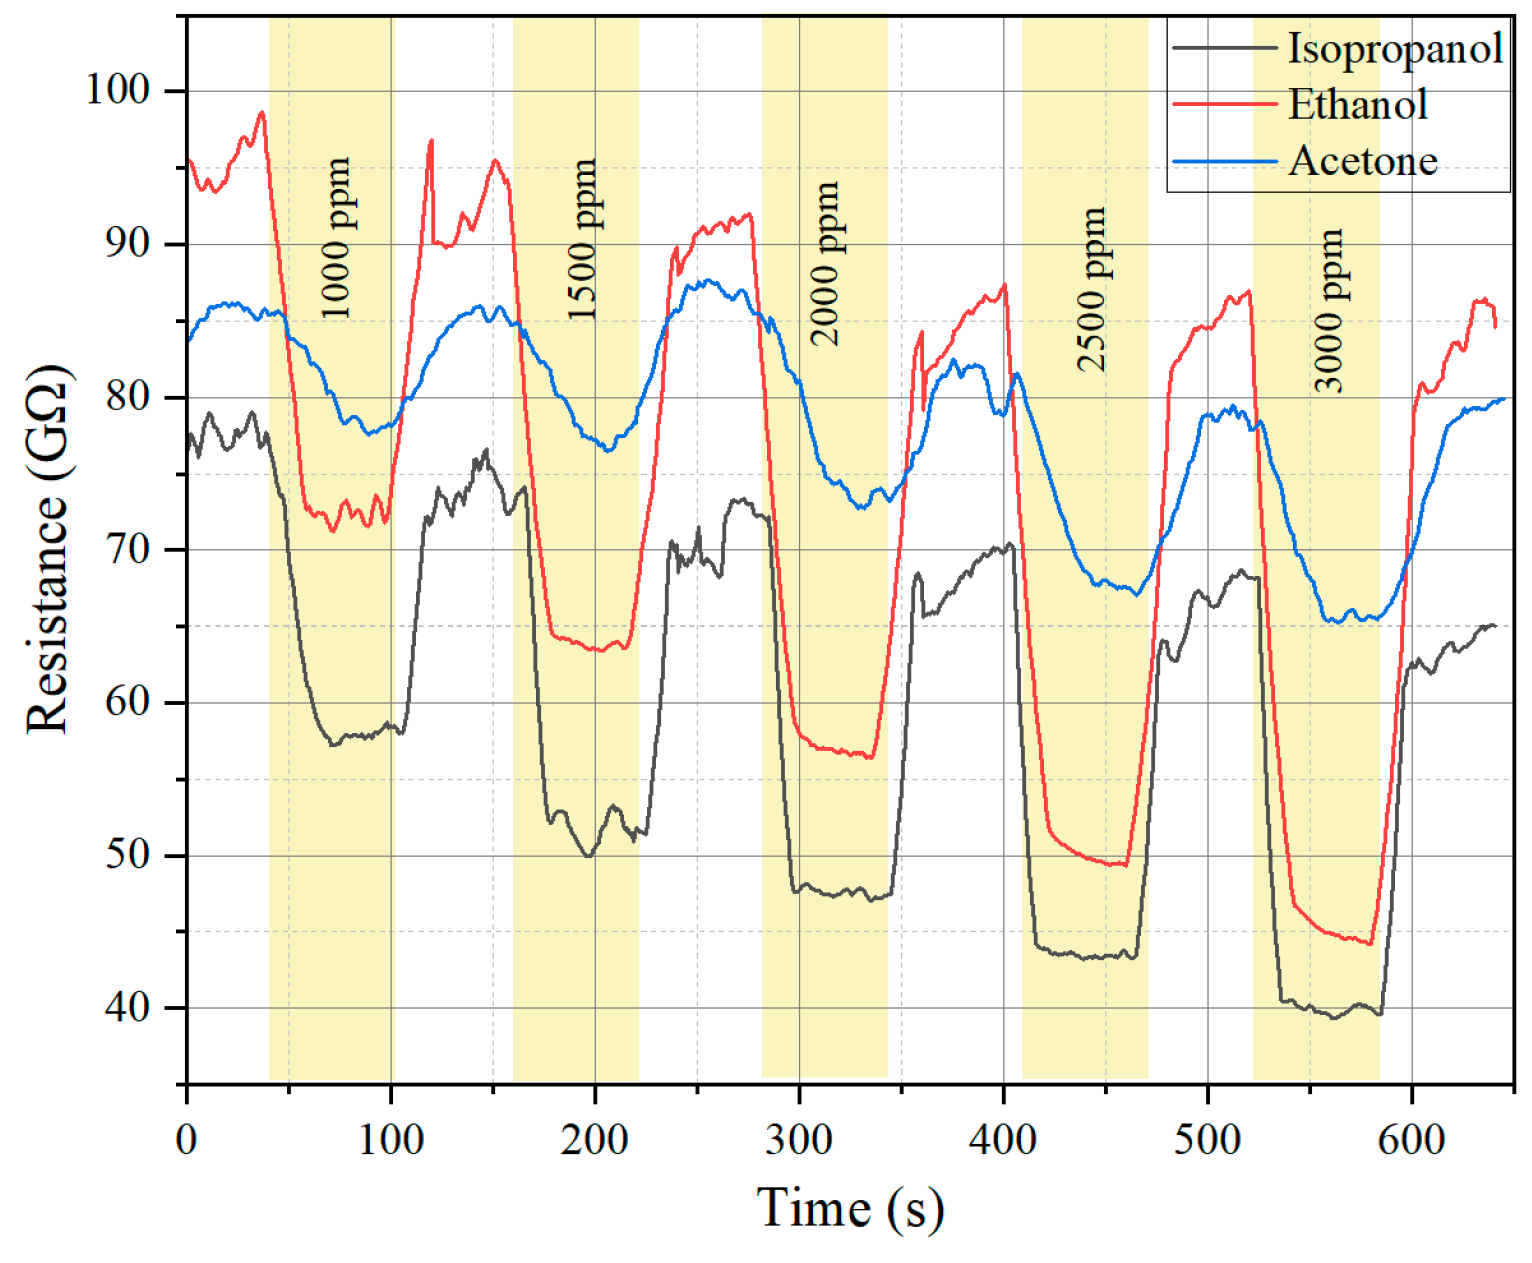
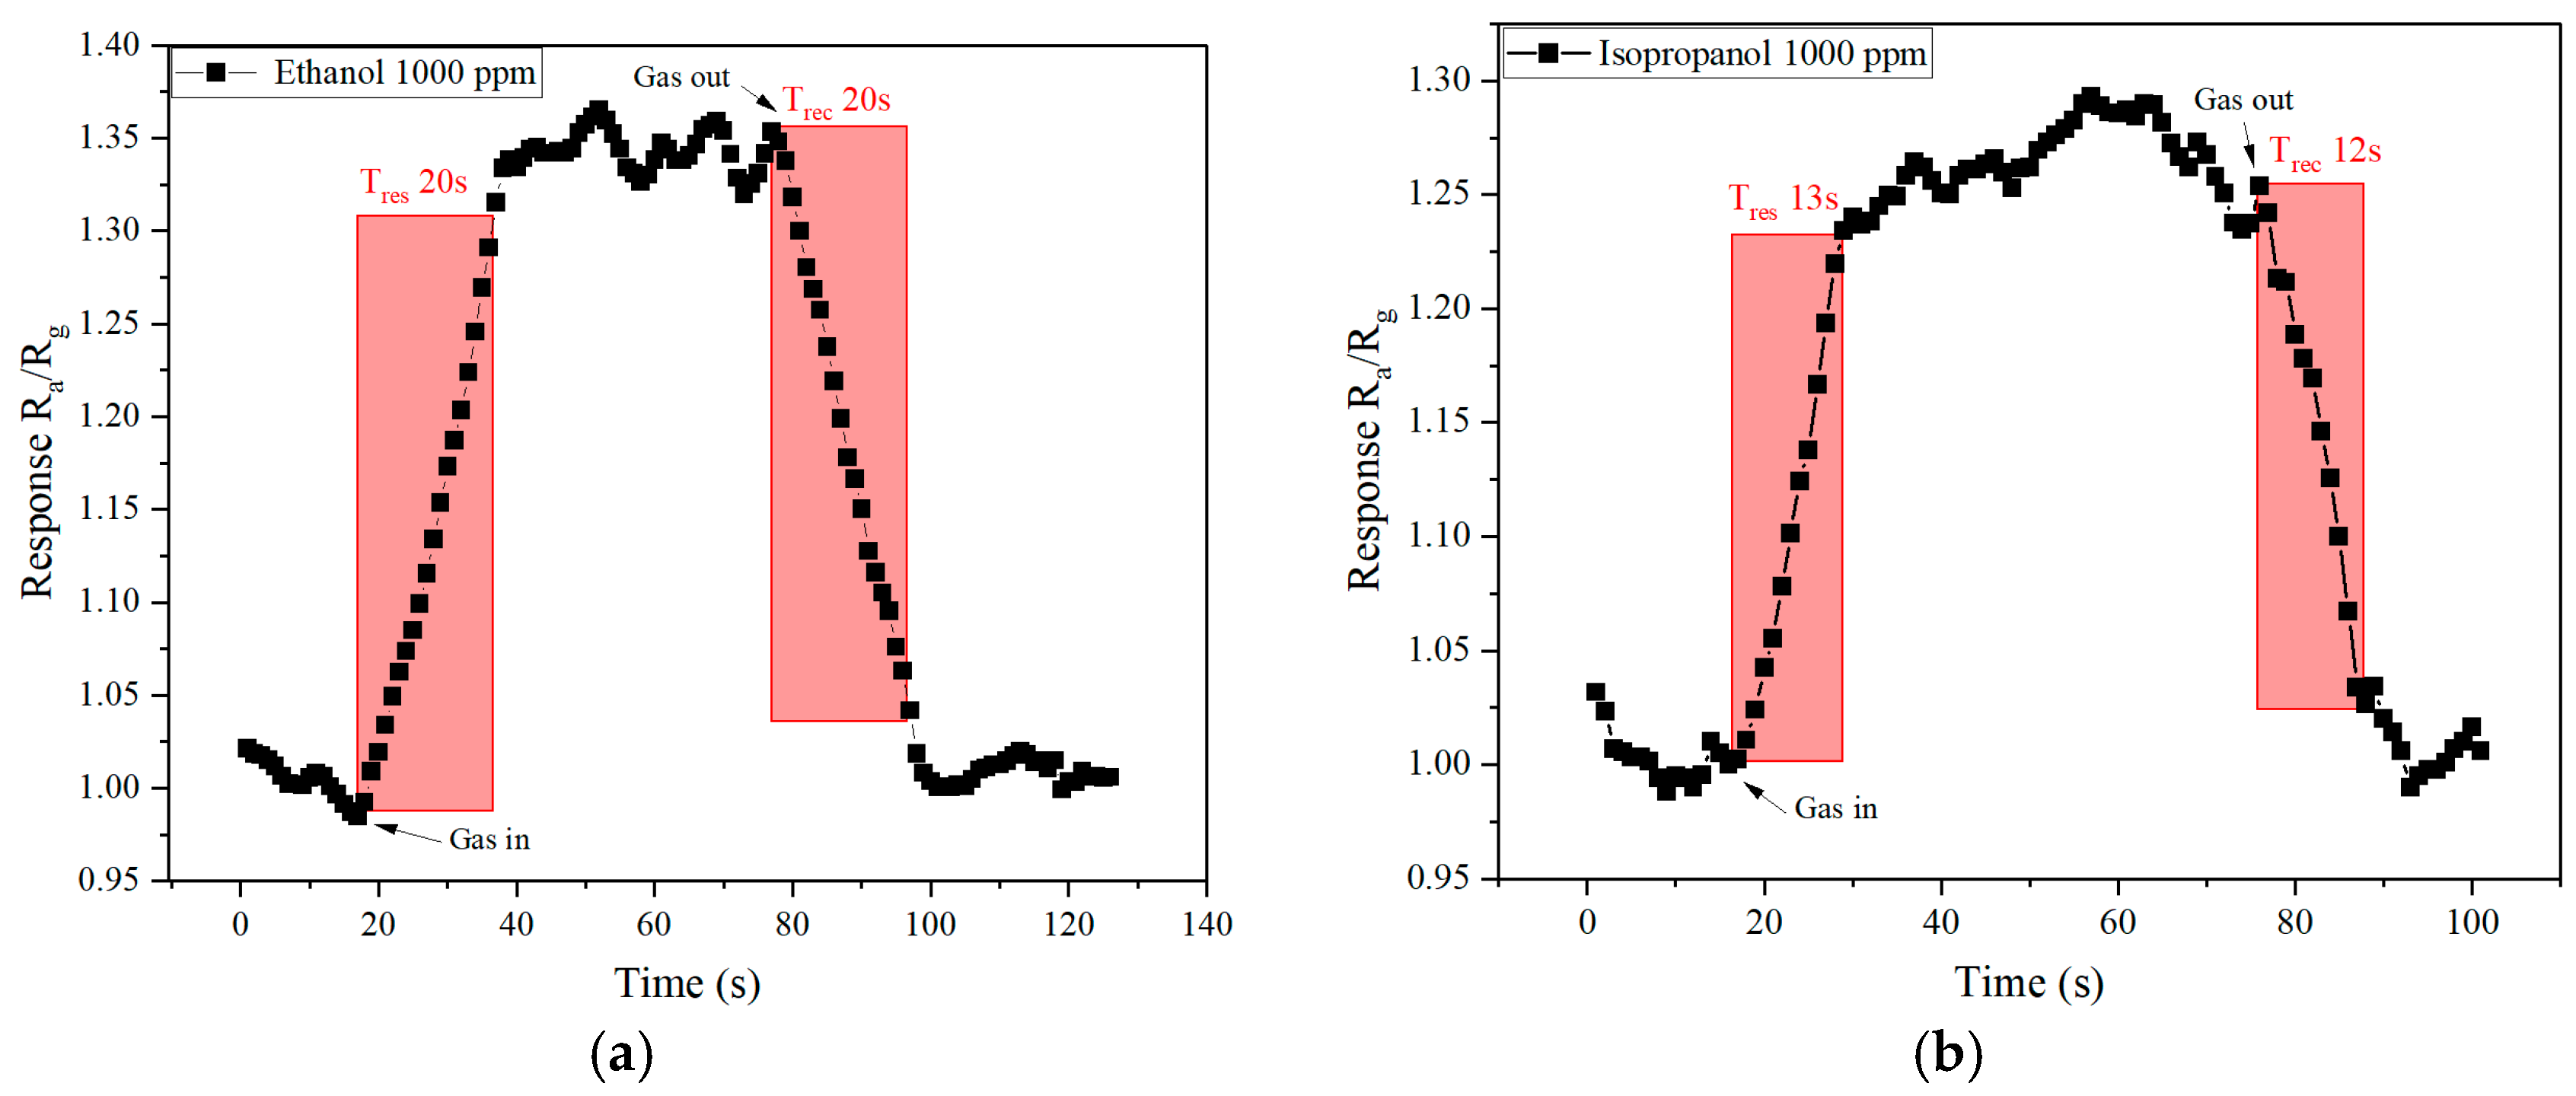
| WO3−x/WS2 nanocomposites | Ethanol/1000 ppm | 1.35 | Room temperature | 20 s | 20 s | This work |
| Isopropanol/1000 ppm | 1.25 | 13 s | 12 s |
Disclaimer/Publisher’s Note: The statements, opinions and data contained in all publications are solely those of the individual author(s) and contributor(s) and not of MDPI and/or the editor(s). MDPI and/or the editor(s) disclaim responsibility for any injury to people or property resulting from any ideas, methods, instructions or products referred to in the content. |
© 2025 by the authors. Licensee MDPI, Basel, Switzerland. This article is an open access article distributed under the terms and conditions of the Creative Commons Attribution (CC BY) license (https://creativecommons.org/licenses/by/4.0/).
Share and Cite
Nalimova, S.S.; Shomakhov, Z.V.; Zyryanova, O.D.; Kondratev, V.M.; Bui, C.D.; Gurin, S.A.; Moshnikov, V.A.; Zhilenkov, A.A. WO3−x/WS2 Nanocomposites for Fast-Response Room Temperature Gas Sensing. Molecules 2025, 30, 566. https://doi.org/10.3390/molecules30030566
Nalimova SS, Shomakhov ZV, Zyryanova OD, Kondratev VM, Bui CD, Gurin SA, Moshnikov VA, Zhilenkov AA. WO3−x/WS2 Nanocomposites for Fast-Response Room Temperature Gas Sensing. Molecules. 2025; 30(3):566. https://doi.org/10.3390/molecules30030566
Chicago/Turabian StyleNalimova, Svetlana S., Zamir V. Shomakhov, Oksana D. Zyryanova, Valeriy M. Kondratev, Cong Doan Bui, Sergey A. Gurin, Vyacheslav A. Moshnikov, and Anton A. Zhilenkov. 2025. "WO3−x/WS2 Nanocomposites for Fast-Response Room Temperature Gas Sensing" Molecules 30, no. 3: 566. https://doi.org/10.3390/molecules30030566
APA StyleNalimova, S. S., Shomakhov, Z. V., Zyryanova, O. D., Kondratev, V. M., Bui, C. D., Gurin, S. A., Moshnikov, V. A., & Zhilenkov, A. A. (2025). WO3−x/WS2 Nanocomposites for Fast-Response Room Temperature Gas Sensing. Molecules, 30(3), 566. https://doi.org/10.3390/molecules30030566