Article

Biologically Active Peptides from Corn Gluten Meal Improve Microbiota Disorders Caused by Helicobacter pylori Infection in Mice

1
Heilongjiang Provincial Key Laboratory of Corn Deep Processing Theory and Technology, College of Food and Bioengineering, Qiqihar University, Qiqihar 161006, China
2
College of Food Science, Heilongjiang Bayi Agricultural University, Daqing 163319, China
*
Authors to whom correspondence should be addressed.
Molecules 2025, 30(3), 705; https://doi.org/10.3390/molecules30030705
Submission received: 27 December 2024 / Revised: 28 January 2025 / Accepted: 3 February 2025 / Published: 5 February 2025
(This article belongs to the Special Issue Active Ingredients in Functional Foods and Their Impact on Health)

Abstract

:
This study investigated the potential effects of corn protein activity peptides (CPAPs) on inflammation response levels and gastrointestinal microbiota in Helicobacter pylori (H. pylori) infection mice. CPAPs significantly up-regulated the mRNA expression of the anti-inflammatory factor IL-10 and down-regulated the mRNA expression of the pro-inflammatory factors TGF-β, TLR4, MyD88, and NF-κB, indicating that CPAPs may antagonize H. pylori-induced inflammatory responses by inhibiting NF-κB signaling pathways. Through the intervention of CPAPs, H. pylori colonization in the stomach was significantly reduced. Additionally, the structural composition of the gastrointestinal microbiota improved, with an increase in abundance and diversity. These changes positively regulate gastrointestinal microbiota disorders in mice. In addition, the PICRUST function prediction of intestinal microbiota revealed that CPAPs may prevent or reduce metabolic disorders brought about by H. pylori, which improve biometabolic pathways by modulating intestinal microbiota composition. In conclusion, these findings suggest that CPAPs may prevent or mitigate metabolic disorders induced by H. pylori, offering theoretical support for the development of corn-protein-based functional foods.

1. Introduction

Helicobacter pylori (H. pylori) has gained increasing attention in recent years as a potent pathogen. The global prevalence of H. pylori infection varies greatly from country to country, with the current research showing that approximately 50% of the population is infected with H. pylori [1]. Studies have found a correlation between H. pylori infection and gastric diseases such as peptic ulcers, mucosal lymphoma, and stomach cancer [2]. The World Health Organization has reached a consensus on the dangers of H. pylori and classified it as a class I carcinogen [3]. For the eradication of H. pylori, triple and quadruple therapies are most commonly used. Antibiotic treatment regimens can also induce corresponding side effects such as antibiotic-induced diarrhea and gastrointestinal microbiota disorders [4]. In addition, antibiotic therapy can lead to resistance in H. pylori, resulting in less effective treatment and further health complications [5].
Many studies have found that H. pylori infection also changes the structural composition of the gastrointestinal microbiota and triggers the microecological balance of the gastrointestinal microbiota, which not only affects nutrient absorption but also leads to a variety of related diseases [6]. Some non-antibiotic food-active substances from natural sources, such as polyphenols from cranberries [7], peptides [8], and water-soluble polysaccharides from okra [9], have been shown to antagonize H. pylori infection, which mainly inhibits H. pylori adhesion and colonization, and reduce gastric inflammation, but the effects of these substances on the gastrointestinal microbiota are unknown as of yet.
A large number of corn polypeptides can be found through hydrolytic corn proteins in proper condition. These peptides are easy to take in and have various biological functions such as showing antioxidant activity, promoting ethanol metabolism, and being antihypertensive and hypoglycemic [10,11,12,13]. In our previous study, we found that corn-protein-derived peptides (CPAPs) could significantly inhibit H. pylori adhesion to GES-1 cells in vitro and could reduce the colonization of H. pylori in the stomach in mice and alleviate the inflammatory response in vivo [14]. However, it is not clear whether they have a regulating effect on the gastrointestinal microbiota disorder caused by H. pylori infection. The intervention with active peptides has been found to positively impact the structure of the gut microbiota [15,16,17]. Therefore, we speculated that CPAPs could improve gastrointestinal microbiota disorders induced by H. pylori infection.
In this study, CPAPs were gavaged to intervene in H. pylori infection and we analyzed the mRNA expression of inflammatory factors in the gastric mucosa. The regulatory effects of CPAPs on gastrointestinal microbiota disorders were systematically analyzed by 16S rRNA sequencing. This study uncovered novel functions of CPAPs, laying the groundwork for the development of related functional foods.

2. Results and Discussion

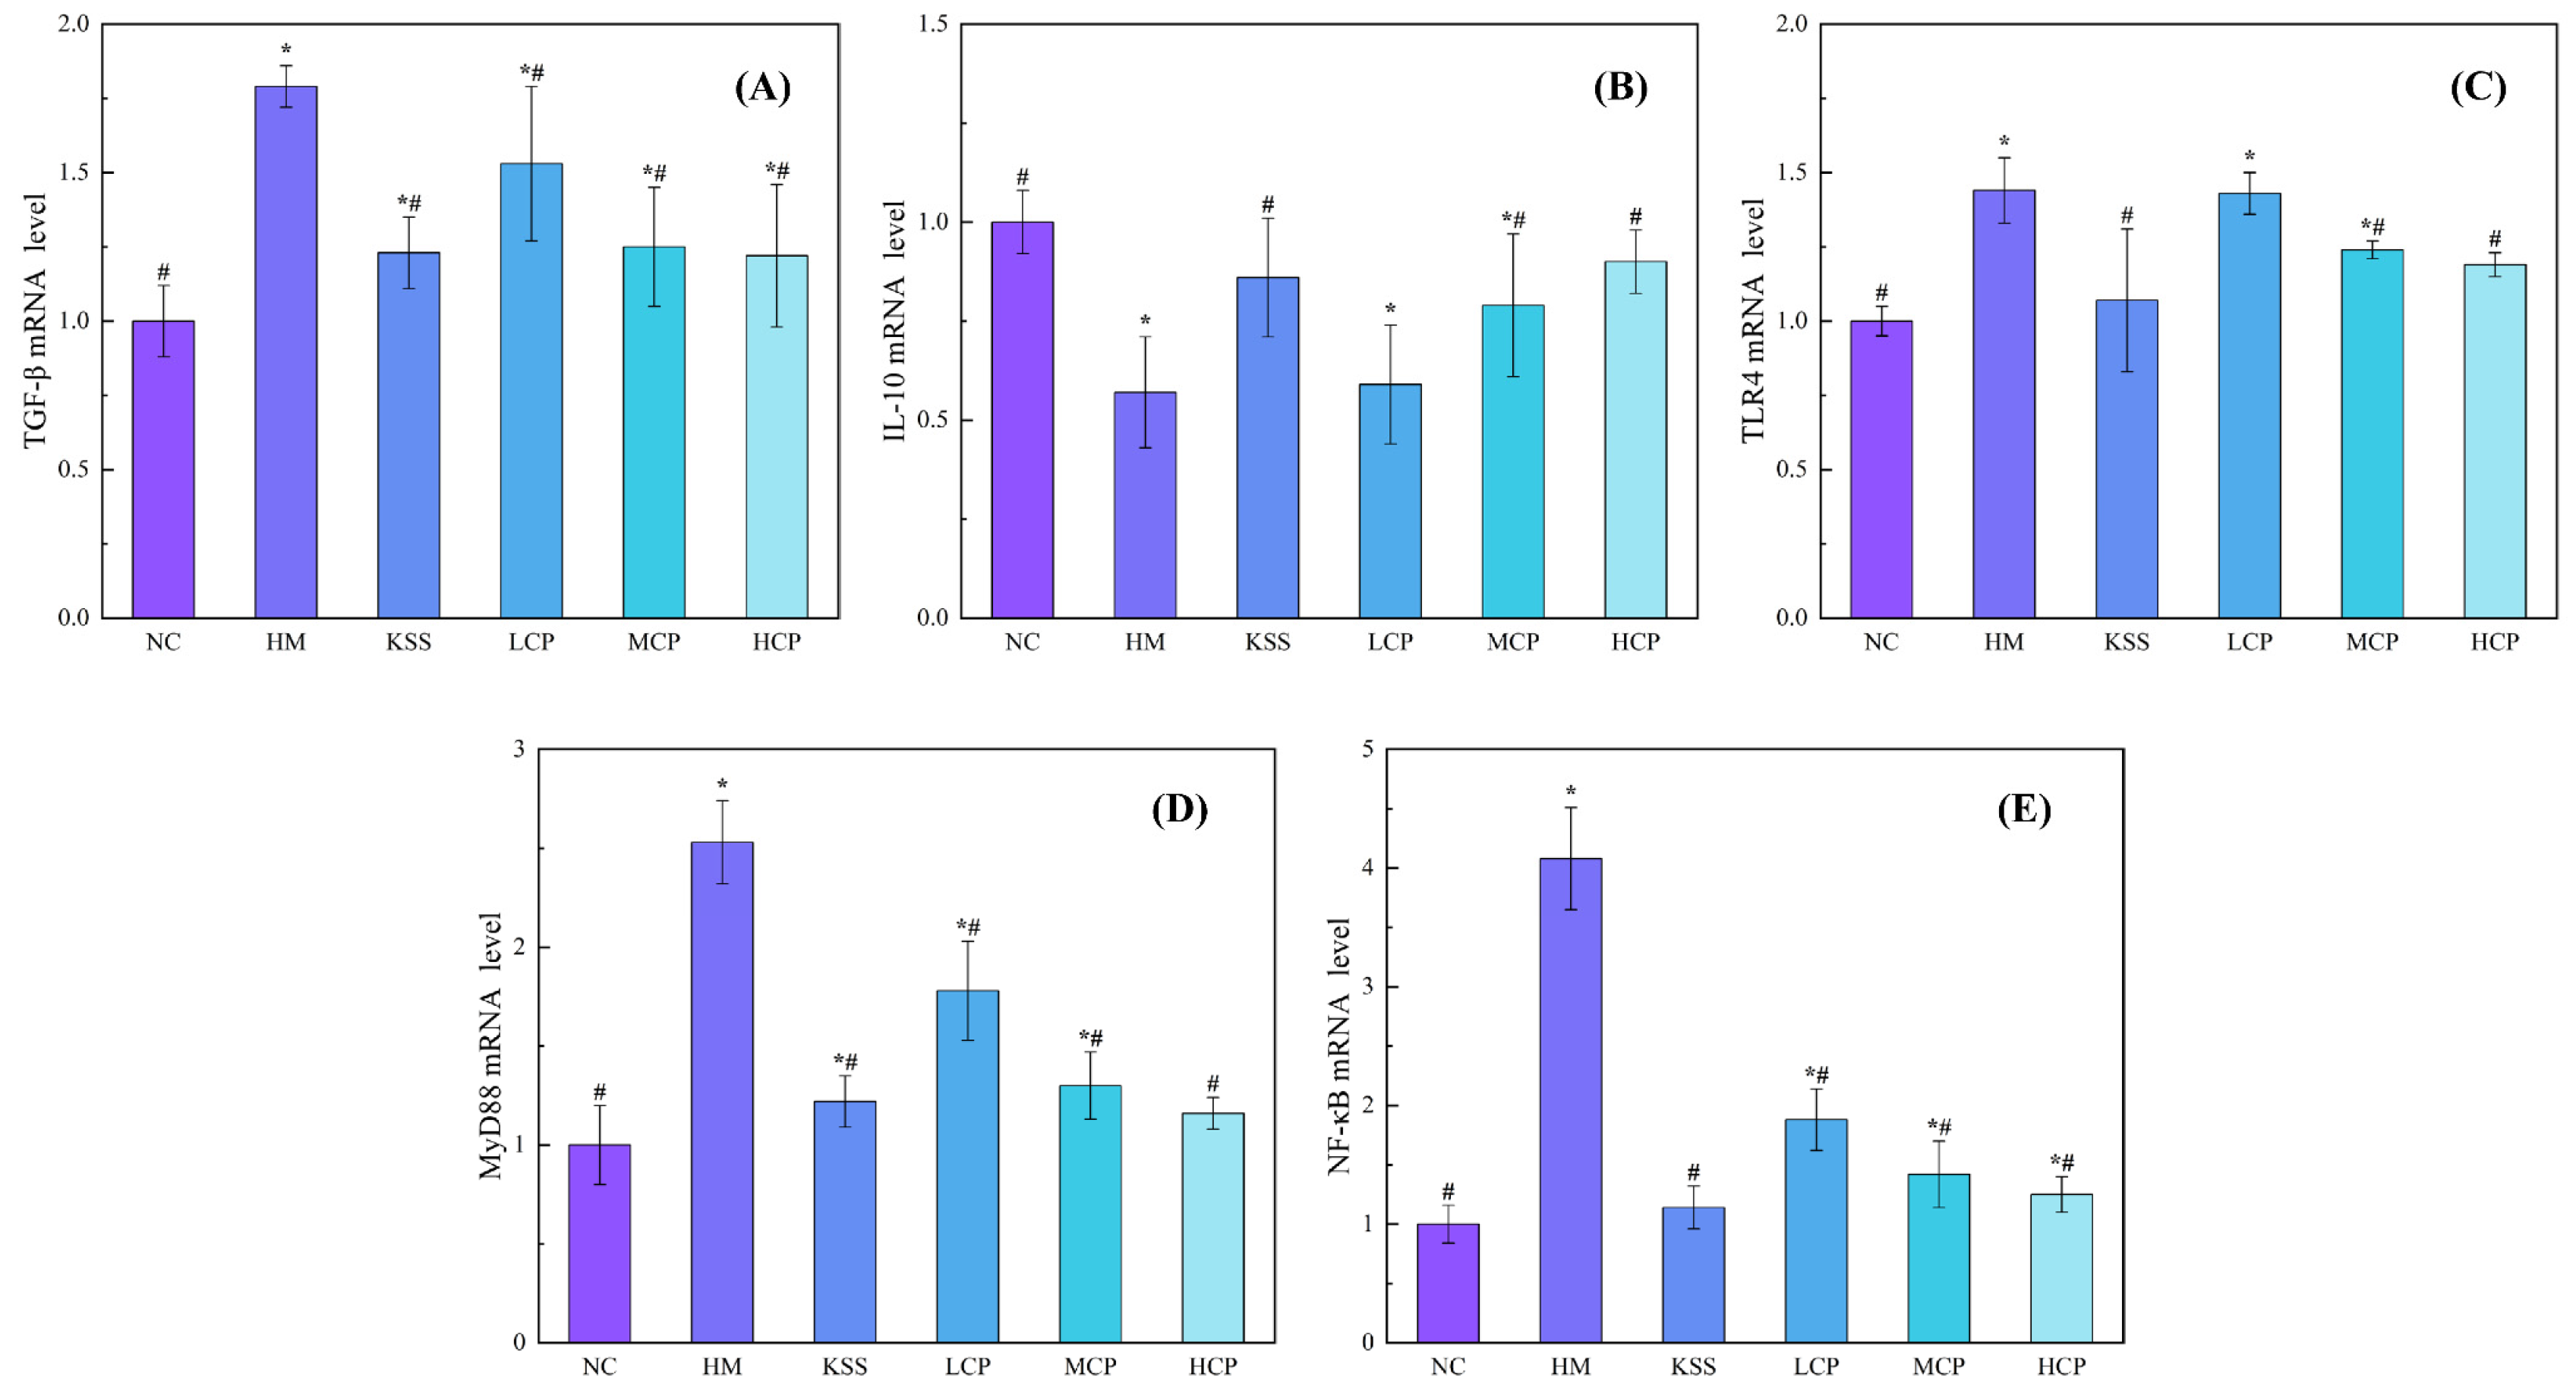
2.1. Effects of CPAP Intervention on mRNA Expression Levels of Inflammatory Factors in Gastric Mucosal

Helicobacter pylori adheres to the gastric mucosa, releasing virulence factors that cause gastric mucosal damage [14]. In order to further analyze the antagonistic effect of CPAPs on gastric mucosal damage induced by H. pylori infection in mice, the mRNA expression levels of five key inflammatory factors were assayed.
Transforming growth factor-β (TGF-β) is an important immunomodulatory factor in the body that can inhibit the proliferation and differentiation of immunoreactive cells in the body and thus affect the production of cytokines and antibodies [18]. Studies had revealed a significant increase in TGF-β expression in the gastric tissues of patients infected with H. pylori [3]. However, following treatment, the expression of TGF-β in these tissues decreased. In addition, the expression of TGF-β is also related to the development of gastric cancer [19]. As shown in Figure 1A, compared with the normal control group (NC), the mRNA expression level of TGF-β factor was significantly up-regulated in the H. pylori model group (HM) (p < 0.05), indicating that H. pylori infection was able to stimulate the gastric mucosal epithelial cells, inducing an increase in the secretion of TGF-β and resulting in the local immune deficiency in the gastric mucosa, which led H. pylori to evade the immune clearance reaction and gain the opportunity to survive in vivo. After CPAP intervention, with an increase in the CPAP intervention dose, the TGF-β mRNA expression level in the gastric mucosa was significantly down-regulated (p < 0.05), and there was no significant difference compared with the normal group (p > 0.05). These results showed that the intervention of CPAPs could significantly down-regulate the mRNA expression of TGF-β factor in the gastric mucosa, increase the immune clearance function against H. pylori, reduce the inflammatory response, and alleviate the damage response of gastric mucosal.
Interleukin-10 (IL-10) is an intracellular anti-inflammatory factor that can inhibit the production of inflammatory factors and thus inhibit the inflammatory response. As shown in Figure 1B, compared with the NC group, the mRNA expression level of IL-10 in the gastric mucosa of the HM group was significantly down-regulated (p < 0.05), indicating that the H. pylori infection increased the inflammatory response, which led to a decrease in the expression of the anti-inflammatory factor, which was consistent with the results reported in the literature [20]. Compared with the HM group, IL-10 expression in gastric tissues was significantly up-regulated after CPAP intervention (p < 0.05) and showed a dose-dependent effect with an increase in the CPAP dose. Under the intervention of CPAPs at a dose of 600 mg/kg·bw, there was no significant difference in IL-10 expression level compared with the NC group. The results showed that CPAP intervention could significantly up-regulate IL-10 mRNA expression levels (p < 0.05) and then inhibit the occurrence of the gastric mucosal inflammatory response.
The pattern recognition receptor Toll-like receptor 4 (TLR4) present on the surfaces of gastric mucosal epithelial cells can specifically recognize the virulence factors LPS and CagA, which are released by H. pylori [21]. The complex formed by the combination of the two can activate the immune response of the body, which in turn promotes the increase in the aggregation of the key regulatory molecule myeloid differential protein88 (MyD88) and the formation of the TLR4/MyD88 complex. Through the activation of the nuclear transcription factor-κB (NF-κB) signaling pathway cascade, it promotes an excessive increase in the NF-κB content and contributes to the inflammatory response of the gastric mucosal [22]. The results of the effects of CPAPs on the expression of TLR4, MyD88, and NF-κB in gastric mucosa are shown in Figure 1C–E. Compared with the NC group, the mRNA expression levels of TLR4, MyD88, and NF-κB of the HM group were significantly up-regulated (p < 0.05), and these were 1.44, 2.53, and 4.08 times higher than those of the NC group, respectively, indicating that the H. pylori infection induced an increase in the mRNA expression level of TLR4 in the gastric mucosa, which led to an increase in the expression of MyD88 and NF-κB, activating the NF-κB signaling pathway, resulting in active inflammatory factor anabolism. Tong et al. also found that the NF-κB signaling pathway was activated via H. pylori infection, leading to an increase in the content of TLR4 and MyD88 [23]. Compared with the HM group, CPAP intervention could significantly down-regulate the mRNA expression levels of TLR4, MyD88, and NF-κB (p < 0.05), and the mRNA expression levels of TLR4, MyD88, and NF-κB in the CPAP group were gradually reduced with an increase in the CPAP intervention dose. Among them, there were no significant differences in TLR4, MyD88, and NF-κB expression levels in the high-dose group compared with those in the NC group (p > 0.05). These results indicated that CPAP intervention could reduce TLR4 production by decreasing the amount of H. pylori colonization in the stomach and then inhibit the increases in the expressions of MyD88 and NF-κB, inhibiting the activation of the NF-κB signaling pathway and alleviating the H. pylori-infection-induced gastric mucosal damage.
Based on our previous study [14], CPAPs inhibit H. pylori colonization in the gastric mucosa. This protective effect likely occurs through multiple mechanisms: inhibiting H. pylori adhesion, reducing TGF-β expression, and enhancing gastric mucosal immune function, thereby increasing H. pylori clearance. In addition, by inhibiting the formation of the TLR4/MyD88 complex, which in turn inhibits the activation of the NF-κB signaling pathway, it down-regulates the content of pro-inflammatory factors and up-regulates the content of anti-inflammatory factors, which alleviates the gastric mucosal damage response caused by H. pylori.

2.2. Regulatory Effect of CPAPs on Gastric Microbiota Disorders by H. pylori Infection

Several studies have indicated that H. pylori infection can lead to disruptions in the gastrointestinal microbiota, and these disturbances are closely linked to the progression of various diseases [24]. Previous experimental research has demonstrated that CPAPs are capable of reducing H. pylori colonization in the stomach, subsequently alleviating oxidative stress and inflammatory responses in the gastric mucosa [14]. Nevertheless, the specific regulatory effect of CPAPs on gastrointestinal microbiota imbalances resulting from H. pylori infection remains unexplored. Consequently, this study aimed to investigate the role of CPAPs in regulating gastrointestinal microbiota disorders. In addition, in this study, we mainly wanted to explore the regulatory effect of CPAP on gastrointestinal microflora disturbance induced by H. pylori infection. Under normal circumstances, H. pylori infection causes the disruption of the gastrointestinal microflora. At present, triple antibiotic therapy is mainly used in the clinical treatment of H. pylori infection, so we chose antibiotics as a positive control. This comparison could also compare the effects of active peptides and antibiotics on gastrointestinal microflora.

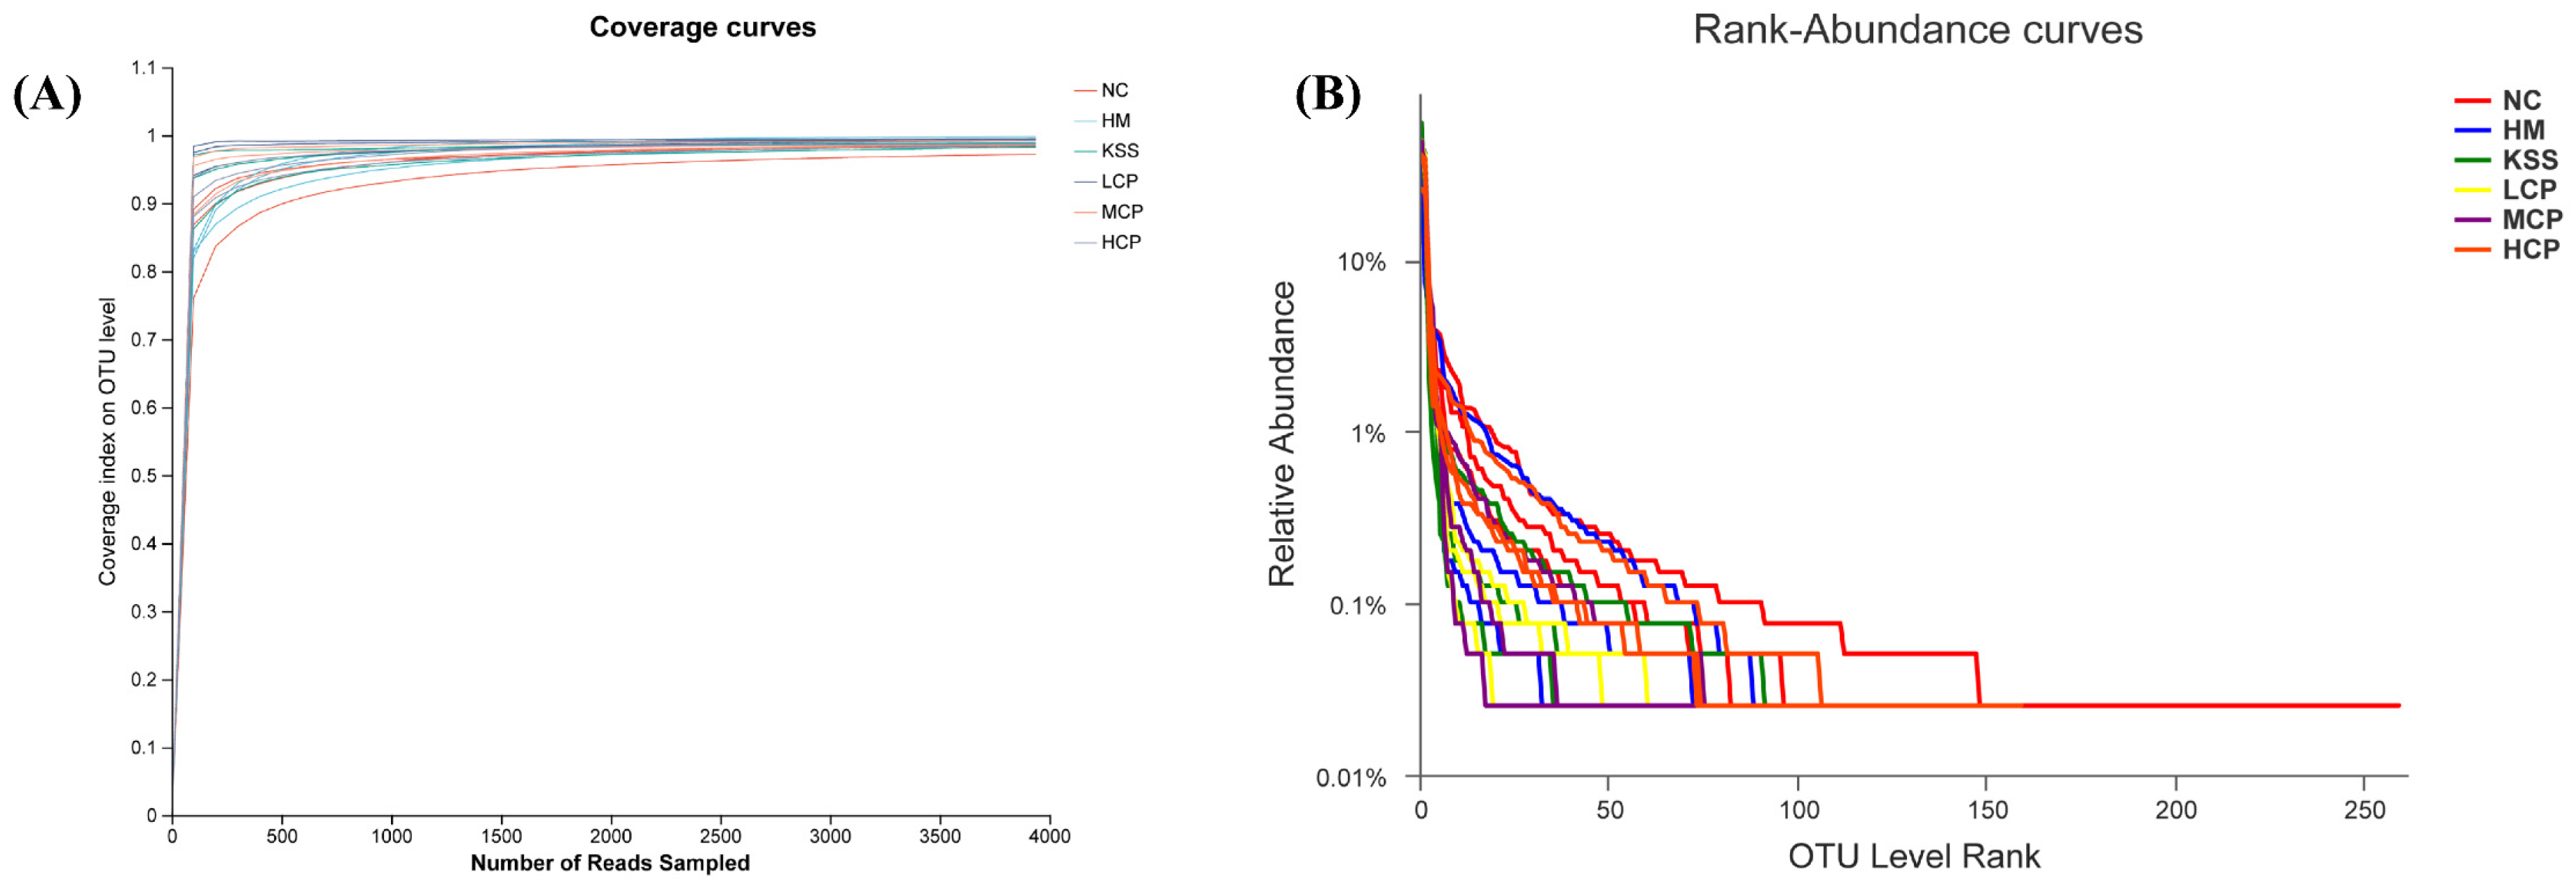
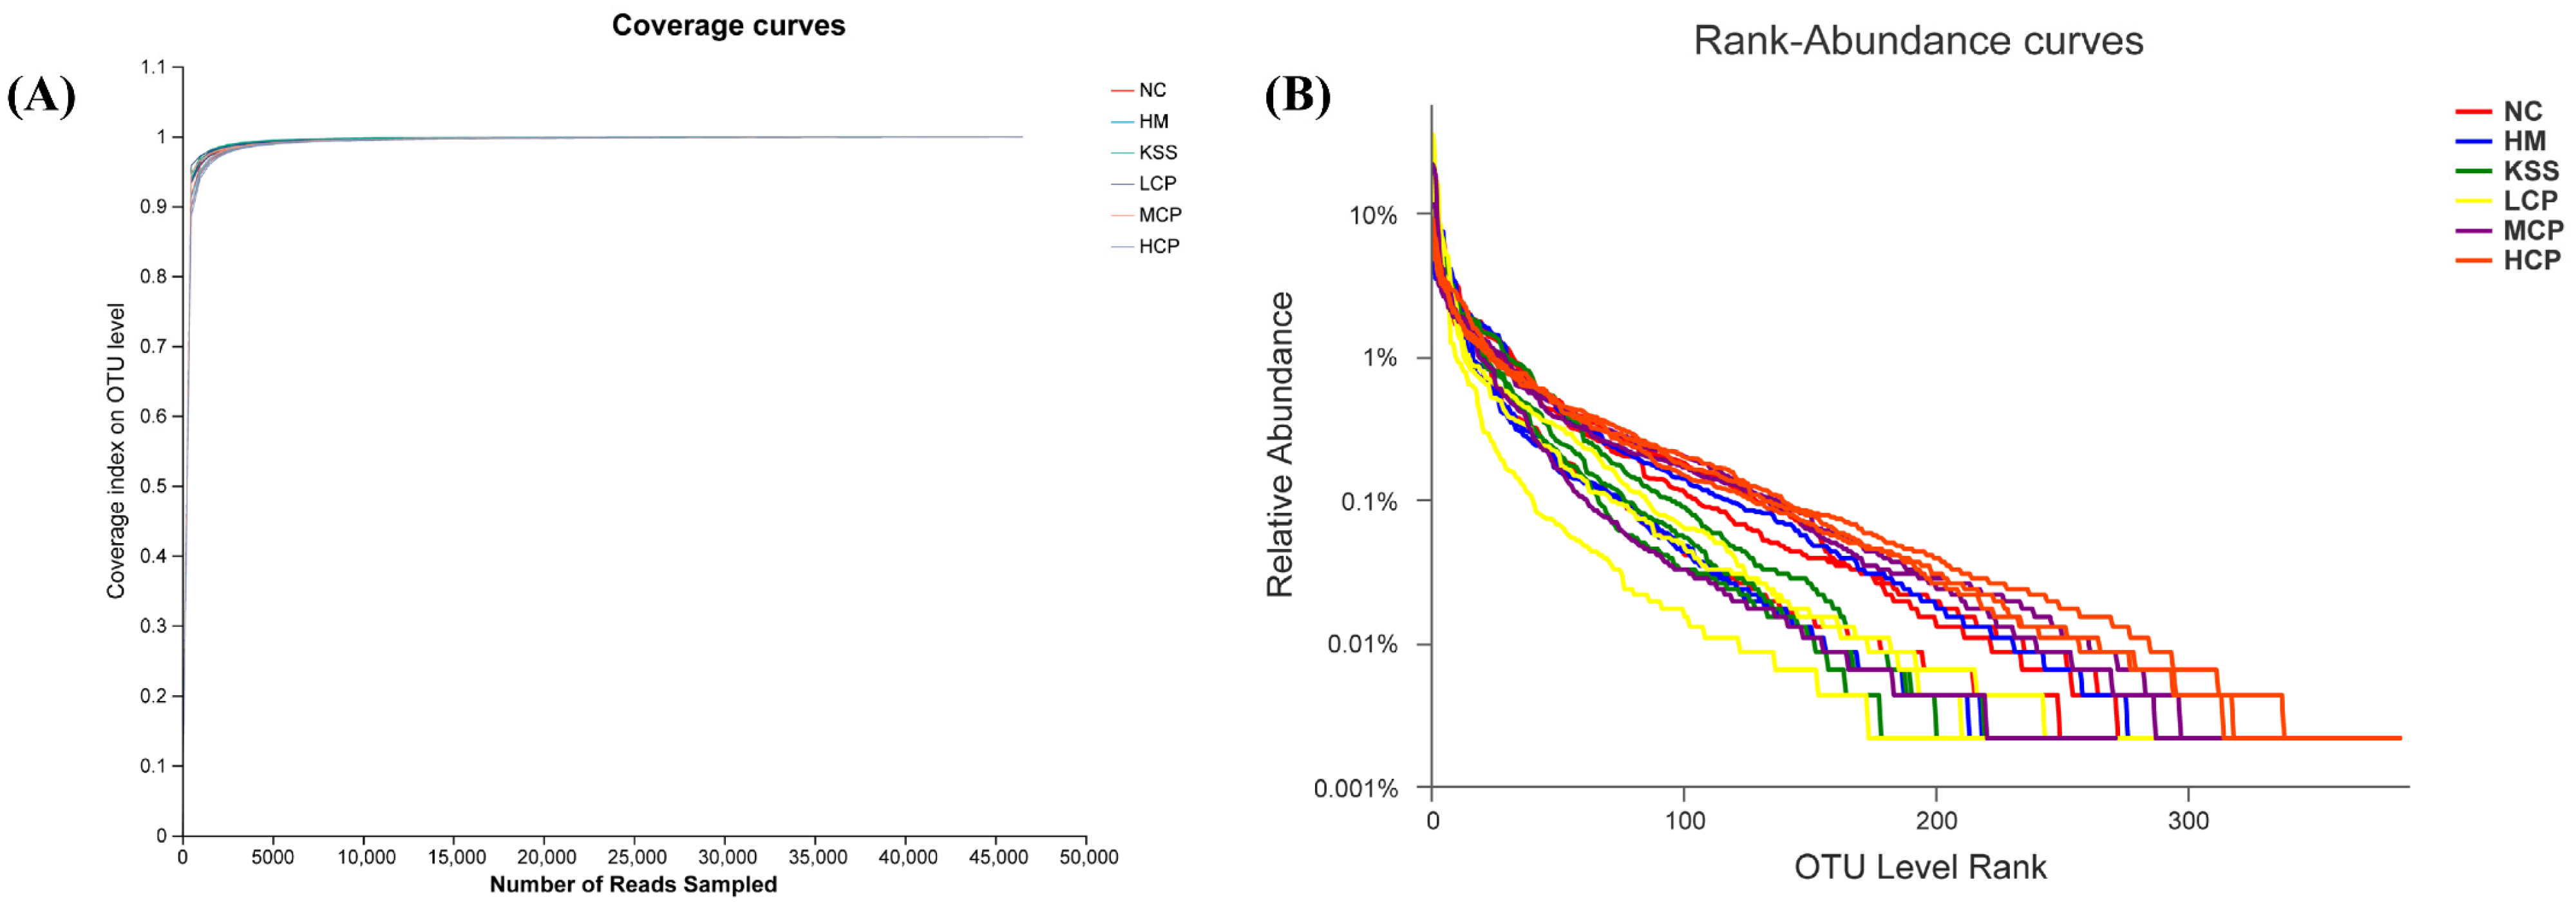
2.2.1. Species Diversity Correlation Curve Analysis of the Gastric Microbiota

The dilution curve serves primarily to assess species abundance in samples, facilitating comparisons of species diversity across varying amounts of sequencing data. Additionally, it provides an indication of the adequacy of the sequencing data volume for the samples [25]. The steepness on the curve’s left side signifies a higher diversity of species identified through sequencing. As the curve flattens, it suggests that adequate sequencing data have been obtained, indicating a reasonable data volume. Further data mining is likely to yield only a limited number of new OTUs. Conversely, if the curve remains uneven, it suggests the potential for discovering more new OTUs through continued sequencing. As illustrated in Figure 2A, with an increasing sequencing volume, the dilution curves for different sample groups gradually flatten, indicating broader sequencing depth and richer species coverage. This demonstrates the reasonableness and reliability of the sequencing results, accurately reflecting the samples’ actual state and suitability for further analysis and research.
The Rank-Abundance curve serves as a method to assess sample diversity. It involves sorting the OTUs within the sample based on their relative abundance, from highest to lowest, obtaining a sorting number, and plotting the curve using this number as the horizontal coordinate and the relative percentage of sequences within each OTU as the vertical coordinate [26]. The Rank-Abundance curve provides a visual representation of species abundance and uniformity within the samples. The width of the curve indicates species richness while its smoothness reflects the evenness of species distribution. With an increase in the number of stomach microorganisms, their relative abundance gradually declined (Figure 2B). When the relative abundance in the samples dropped below 0.1% in the study, the curves became straighter and entered a plateau phase, indicating a higher diversity of microorganisms in the mouse stomach contents. Meanwhile, the curve reached the plateau period more gently, indicating better microbial homogeneity. The highest species abundance was found in the NC group and the lowest in the KSS and HM groups, indicating that both H. pylori infection and antibiotic intake decreased the species abundance of microorganisms in the stomach and that the microbial species abundance could be regulated by a certain dose of CPAP intervention. The overall trend of the samples in each group was flat, indicating a good species distribution uniformity.

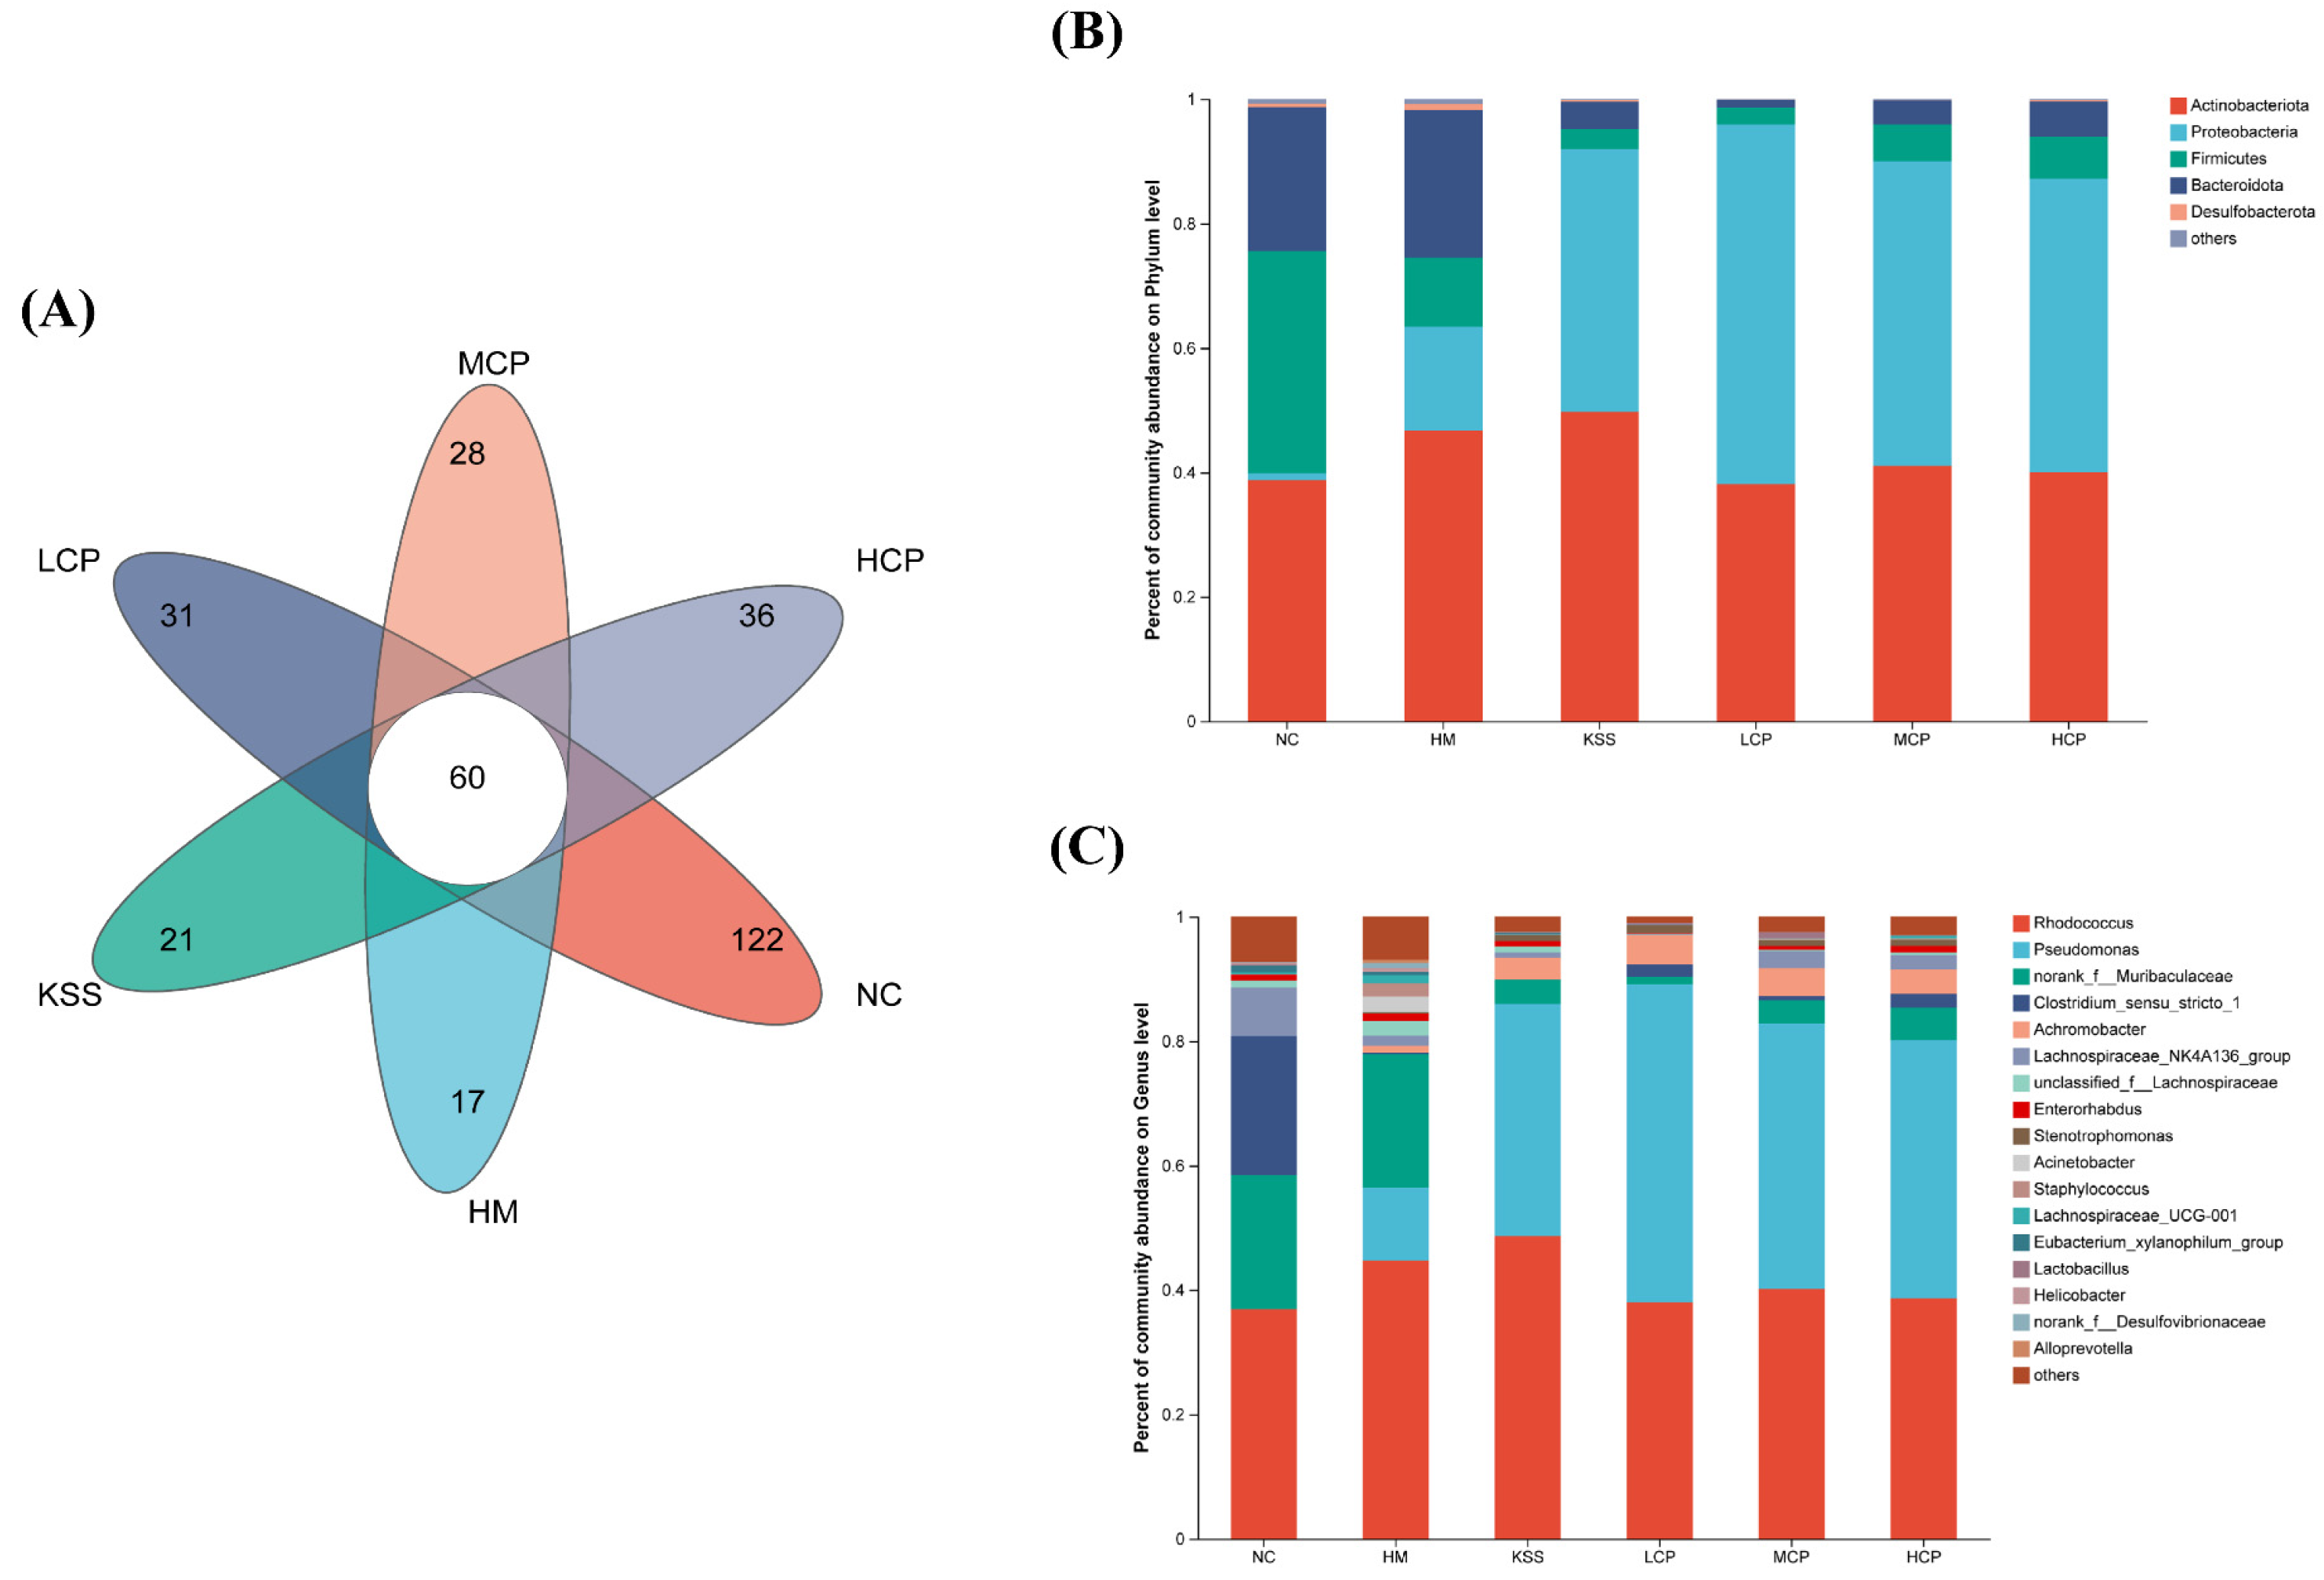
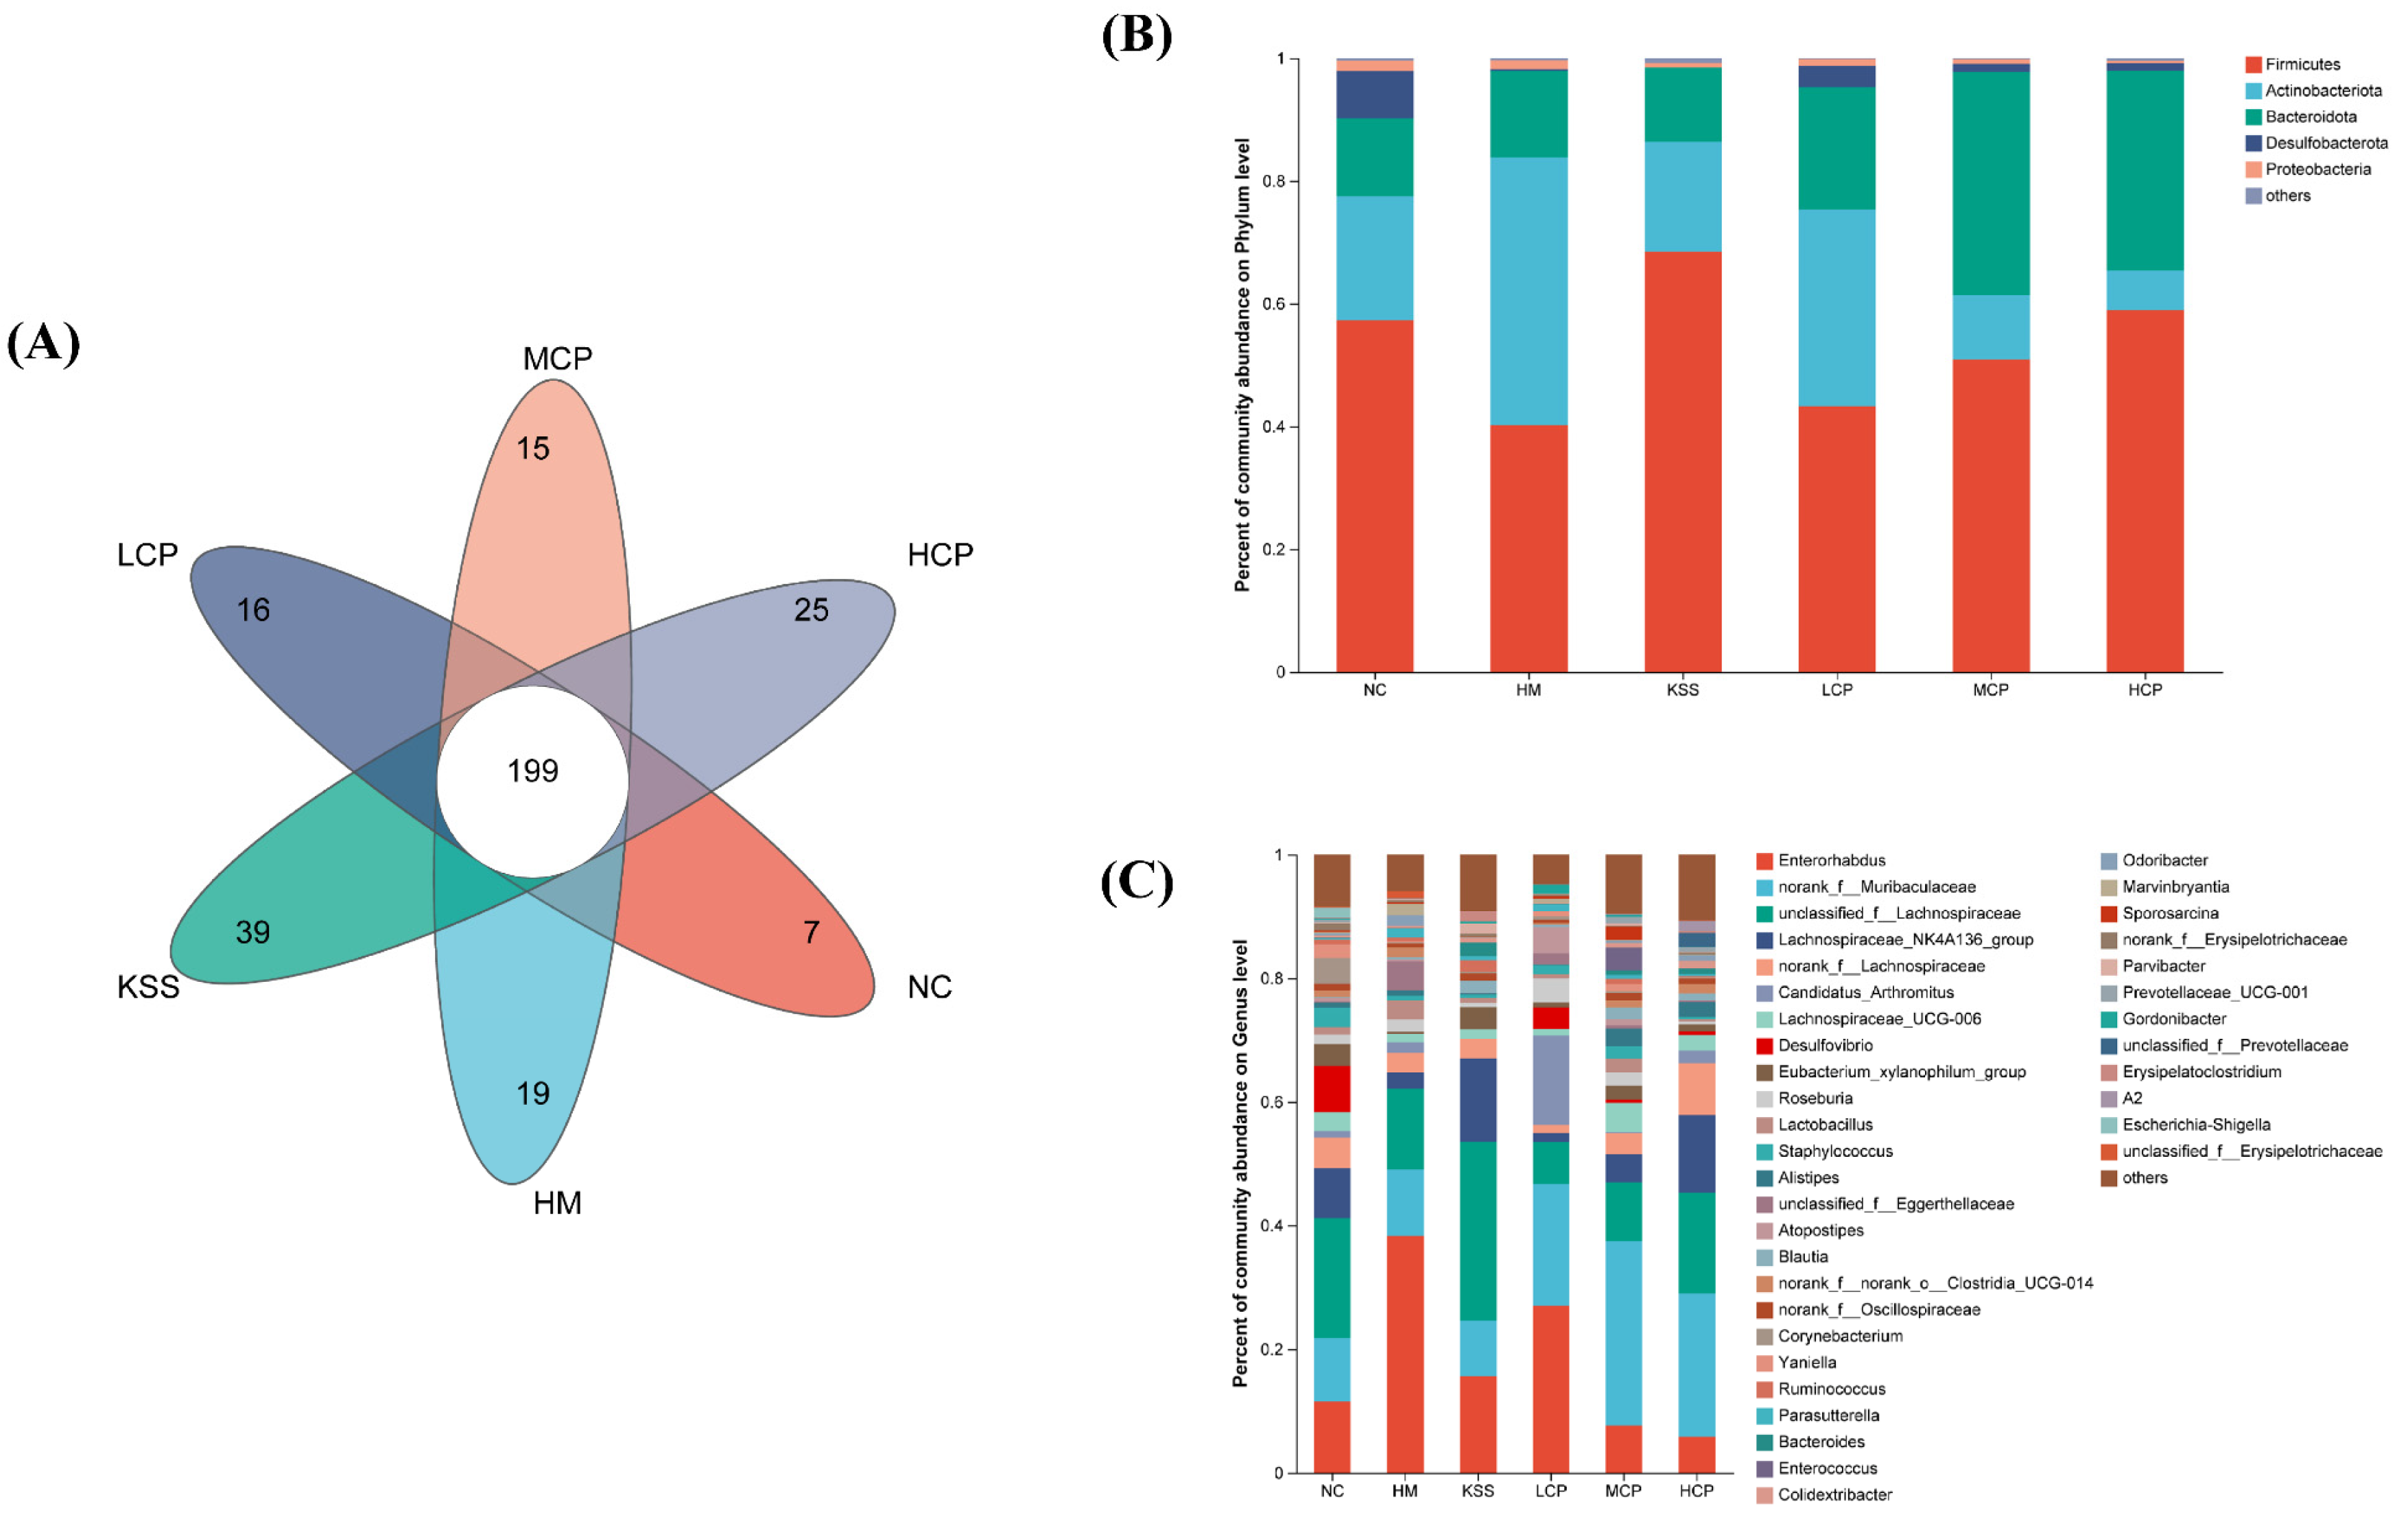
2.2.2. OTUs and Community Composition Analysis of the Gastric Microbiota

A Venn diagram was obtained by the comparative analysis of OTUs between group samples. The Venn diagram illustrates the number of shared and unique OTUs among different sample groups, and it was created after homogenizing all samples. As shown in Figure 3A, there were variations in the numbers and types of OTUs among the samples of each group. The total number of OTUs across all groups amounted to 60. Specifically, the NC, HM, KSS, LCP, MCP, and HCP groups uniquely possessed 122, 17, 21, 31, 28, and 36 OTUs, respectively. The subjects in the NC group exhibited the highest number of OTUs in their stomachs whereas the HM and KSS groups showed the lowest, aligning with the findings from the species diversity correlation curve. These results indicated that after H. pylori infection, the species composition of stomach microorganisms in the HM group changed significantly compared to the NC group, and the number of OTUs was significantly reduced. The results are consistent with what Yang et al. reported [27]. Compared with the HM group, CPAP intervention effectively alleviated the reduction in the number of gastric microbial OTUs, with the highest number of OTUs being in the HCP group, which was still significantly different from the NC group. In addition, antibiotic intake was also able to significantly reduce the number of OTUs of the gastric microorganisms in mice. The results indicated that the reduction in the number of OTUs of the gastric microorganisms in mice could be alleviated by a certain dose of CPAP intervention.
The community composition of gastric microbiota was analyzed at the phylum level. As shown in Figure 3B, there were five phyla with relative abundance above 1%, namely Actinobacteriota, Proteobacteria, Firmicutes, Bacteroidota, and Desulfobacteria. Firmicutes and Bacteroidota are the dominant beneficial bacteria in the body, and changes in their abundance have been associated with the pathogenesis of obesity, gastrointestinal cancers, diabetes, and other diseases [28]. Firmicutes species mainly take proteins and carbohydrates as nutrients and hydrolyze the two to produce butyric acid, which inhibits the proliferation of intestinal cancer cells [29]. Bacteroidota mainly takes polysaccharides, bile acids, and steroids as the main nutrients and generates propionic acid, acetic acid, and other short-chain fatty acids for nutrient absorption. At the same time, these short-chain fatty acids can also inhibit the TNF-α release [30]. Proteobacteria mainly include a variety of pathogenic bacteria that are prone to gastrointestinal disease [28]. In addition, it was found that the number of Firmicutes specimens was significantly up-regulated and the number of Bacteroidota specimens was significantly down-regulated in the obese population [31]. Significant changes in the relative abundance of Firmicutes were observed in the HM group compared to the NC group, with a 25.70% decrease in the relative abundance of Firmicutes and no significant change in the relative abundance of Bacteroidota, suggesting that infection with H. pylori is capable of significantly altering the species composition of the gastric microbiota at the phylum level, specifically through a decrease in the number of beneficial bacteria and an increase in the number of harmful bacteria. Compared with the HM group, the gastric microbiota disorders caused by H. pylori infection could be improved, and the structure of the microbiota could be regulated by the intervention of different doses of CPAPs, so that the composition of the microbiota tended to the NC group. The community structure of the gastric microbiota in the KSS group was also significantly different from that of the NC group, which showed that the intake of antibiotics still leads to the structural disorganization of the gastric microbiota.
The genus is the smallest unit that can be accurately recognized in 16S sequencing and is the unit in the body that has its regulatory role. Therefore, the community composition of the gastric microbiota was analyzed at the genus level. As shown in Figure 3C, there were 17 genera with a relative abundance greater than 1%, and the main dominant bacteria at the genus level included g_Rhodococcus, g_Pseudomonas, and norank_f_Muribaculacea. Compared with the NC group, the content of Clostridium_sensu_stricto_1, Pseudomonas, and Helicobacter in the HM group was significantly decreased, indicating that H. pylori infection led to the disorganization of the gastric microbiota structure in the mice, and g_Pseudomonas, g_Helicobacter, and other harmful bacteria increased, which was consistent with previous studies reported [29], in which increases in the levels of g_Helicobacter in the stomach were directly related to the modeling gavage H. pylori. Compared with the HM group, the content of g_Rhodococcus and g_Helicobacter was significantly reduced by CPAP intervention. CPAP intervention inhibited the colonization of H. pylori in the stomach, which was manifested by a significant reduction in the number of Helicobacter genera in the stomach. Saresella et al. found a positive correlation between the number of Lachnospiraceae_NK4A136_group specimens and the number of anti-inflammatory immune cells in the body [32]. Compared with the NC group, the Lachnospiraceae_NK4A136_group content in the HM group was significantly reduced. In contrast, the Lachnospiraceae_NK4A136_group was significantly increased in the CPAP groups (p < 0.05), and the body’s anti-inflammatory level was increased. This was consistent with the elevated anti-inflammatory factors in the CPAP-group gastric mucosa and also consistent with our previous study [14]. Based on the genus level, gastric microbiota community analysis showed that CPAPs could inhibit the adhesion and colonization of H. pylori, reducing H. pylori levels in the stomach, which was consistent with our previous in vitro study. In summary, the CPAP intervention can improve the structure of gastric microbiota community composition, increase the number of beneficial bacteria and reduce the number of harmful bacteria, and improve the structural disorder of gastric microbiota caused by H. pylori infection.

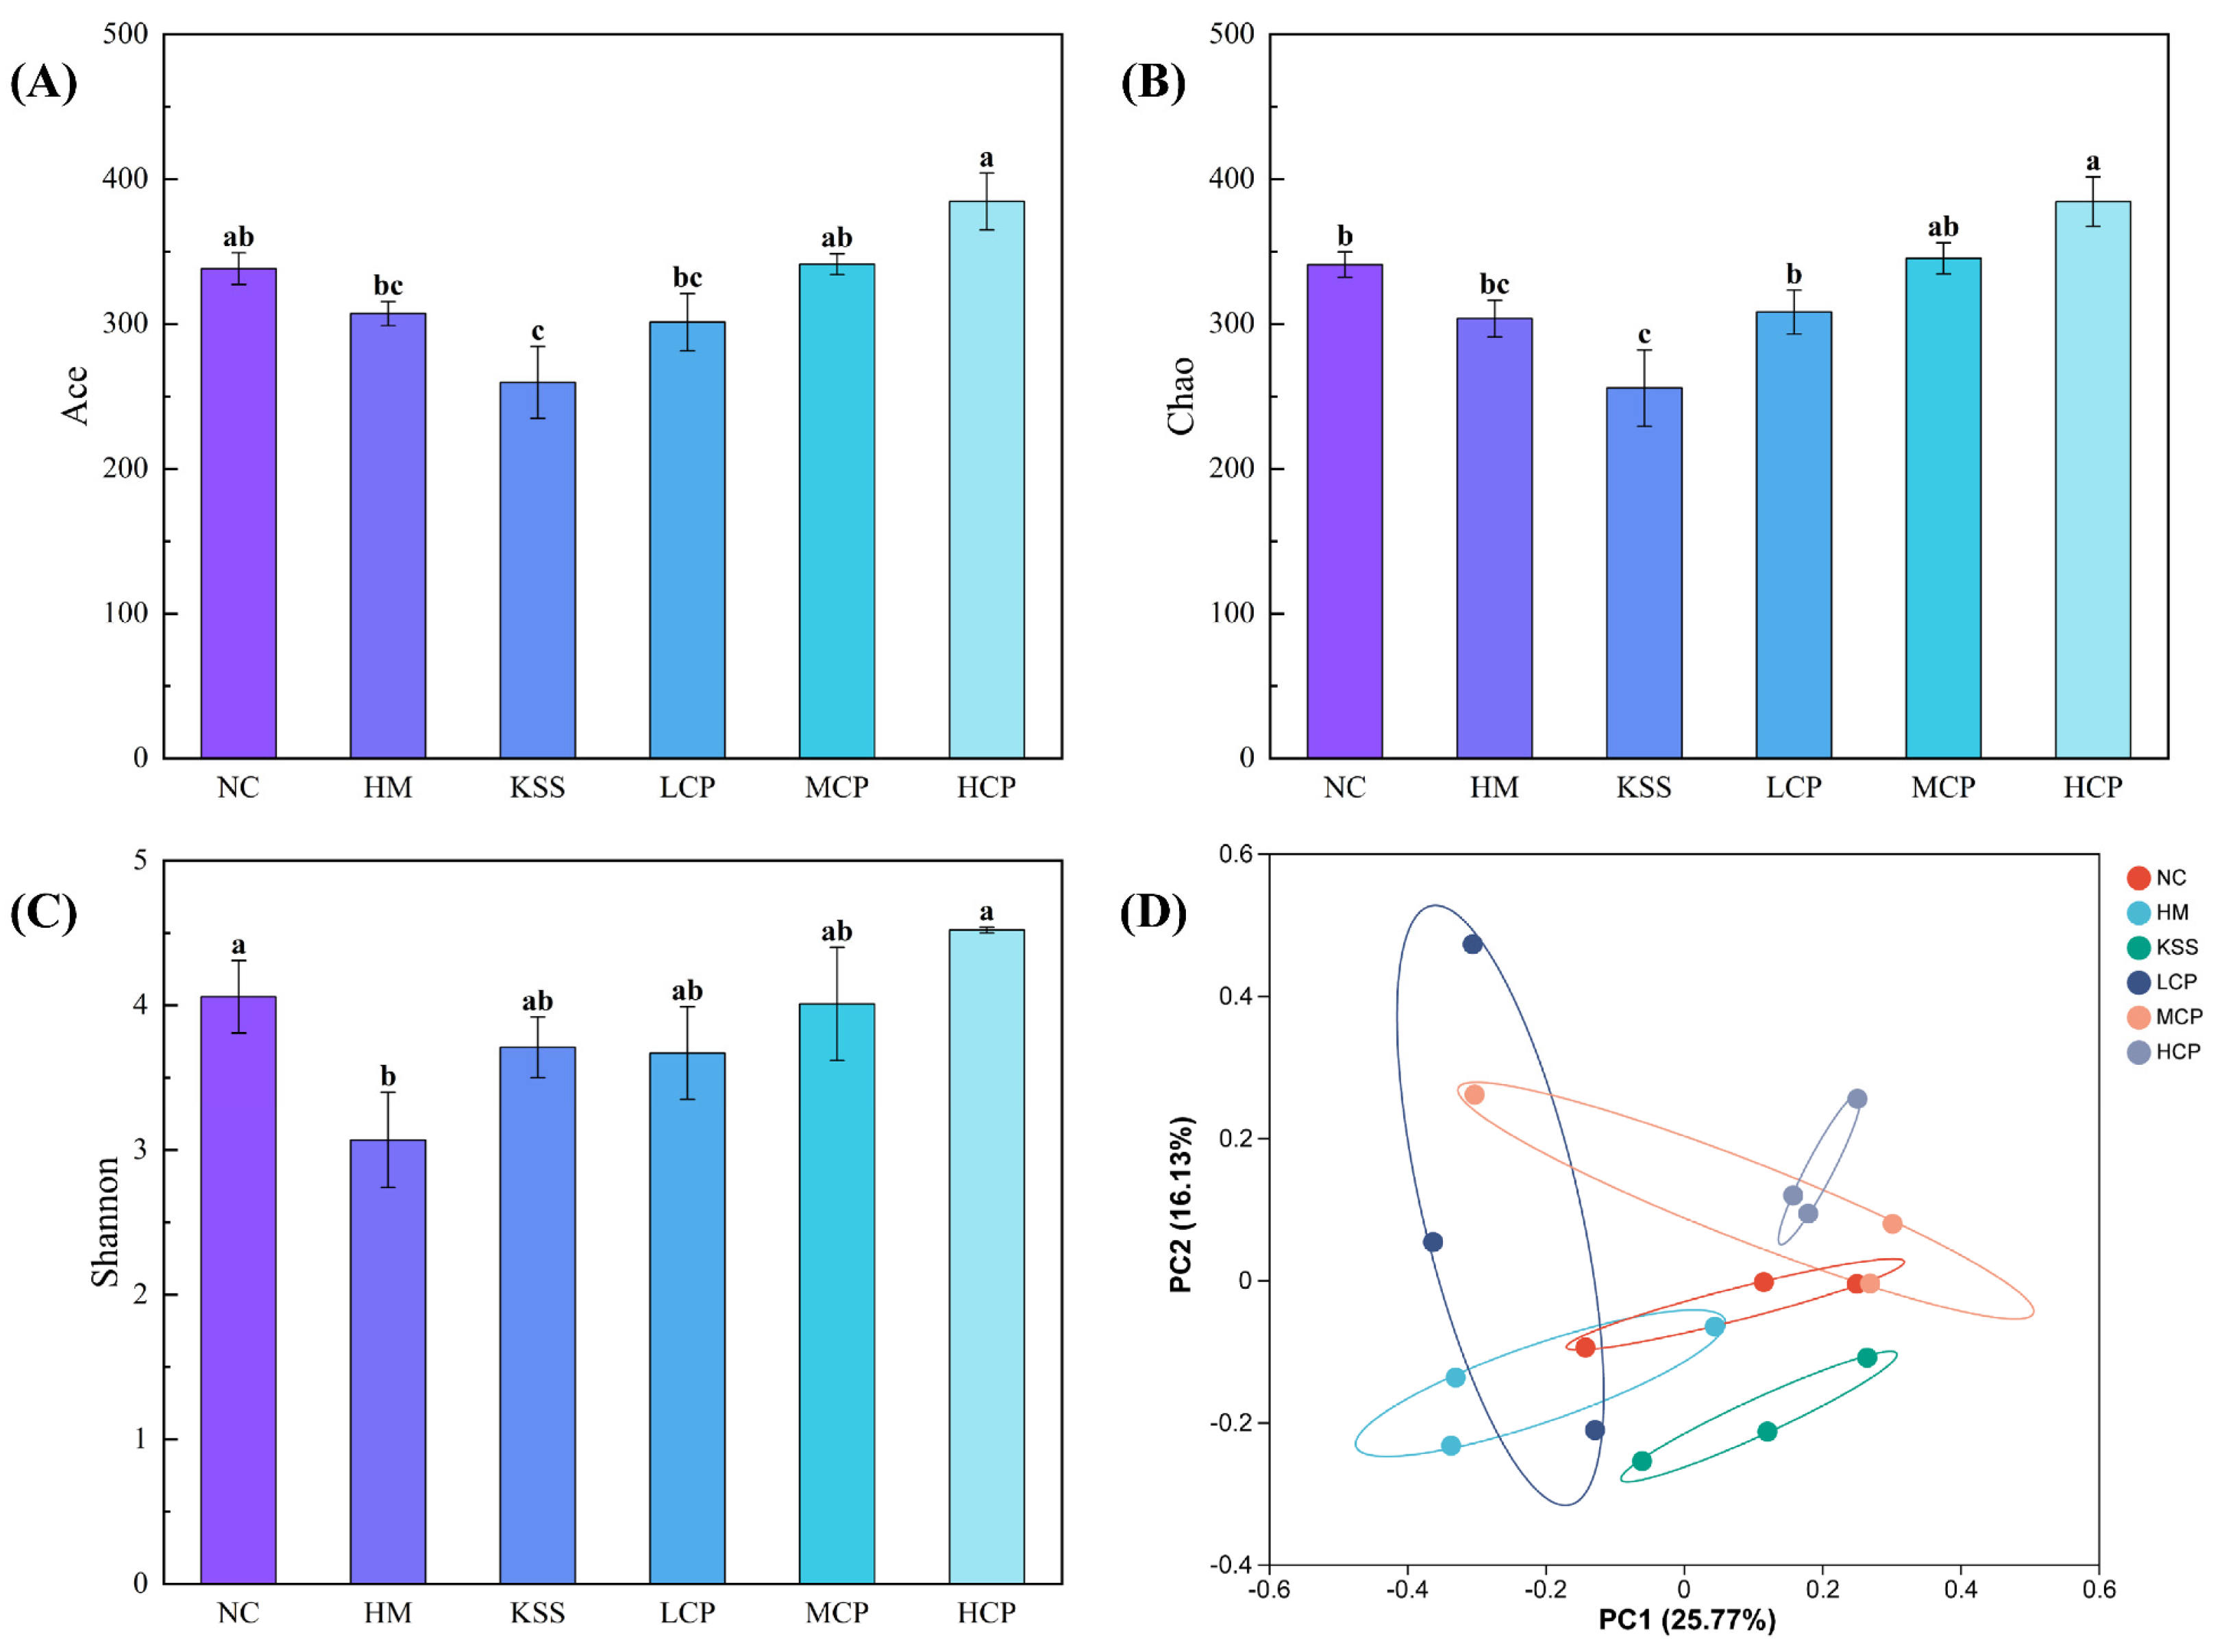
2.2.3. Microbiota Diversity Analysis of the Gastric Microbiota

The Shannon index is used to reflect the biodiversity of microbial species. The Ace index is mainly used to estimate the number of OTUs contained, and it is often used to estimate the total number of OTUs in samples. The Chao index is an algorithm that uses the chao1 algorithm to estimate the number of OTUs contained in a sample, and it is often used to estimate the total number of species in samples. Unlike the Ace algorithm, the larger the Chao index, the greater the number of OTUs, indicating a higher species richness in the samples [33]. Compared with the NC group, the richness indices Ace and Chao, and the diversity index Shannon, were significantly decreased in the HM group (p < 0.05), indicating that H. pylori infection caused a substantial decrease in species richness and microbial diversity in the gastric microbiota, leading to structural disorders (Figure 4A–C). Compared with the HM group, the diversity index Shannon, richness index Ace, and Chao index increased after intervention with different doses of CPAPs, and the indices showed a dose-dependent significant increase with an increase in the CPAP dose (p < 0.05). The high dose of CPAP intervention could not restore the species richness and microbial diversity to the normal level, but it was close to that of the NC group. This indicates that CPAP intervention can significantly restore the species richness and microbial diversity of gastric microbiota and regulate the structure. Compared with the HM group, the KSS group showed a decrease in the diversity index Shannon and an increase in the richness indices Ace and Chao, indicating that antibiotic intake could reduce microbial diversity and significantly increase the richness within the gastric microbiota.
Principal Coordinate Analysis (PCoA) is a method to analyze the similarity of or difference between research data through visualization. After sorting through a series of eigenvectors and eigenvalues and selecting the eigenvalues that are mainly in the top rankings, differences between different sample groups can be observed through PCoA. As shown in Figure 4D, the cumulative variance contributions of the first two principal components were 53.44% and 15.50%, respectively. The HM and NC groups were separated, indicating significant differences in species composition between the two groups. The CPAPs and the KSS group were clearly demarcated from the HM group, suggesting that the microbial community structure was clearly differentiated between groups. LCP, MCP, and HCP had intersecting sections, representing a gradual increase in community composition with an increasing CPAP dose. In conclusion, based on the analysis of the β-diversity results of gastric flora, CPAP intervention can significantly regulate the microbiota diversity in a positive direction.

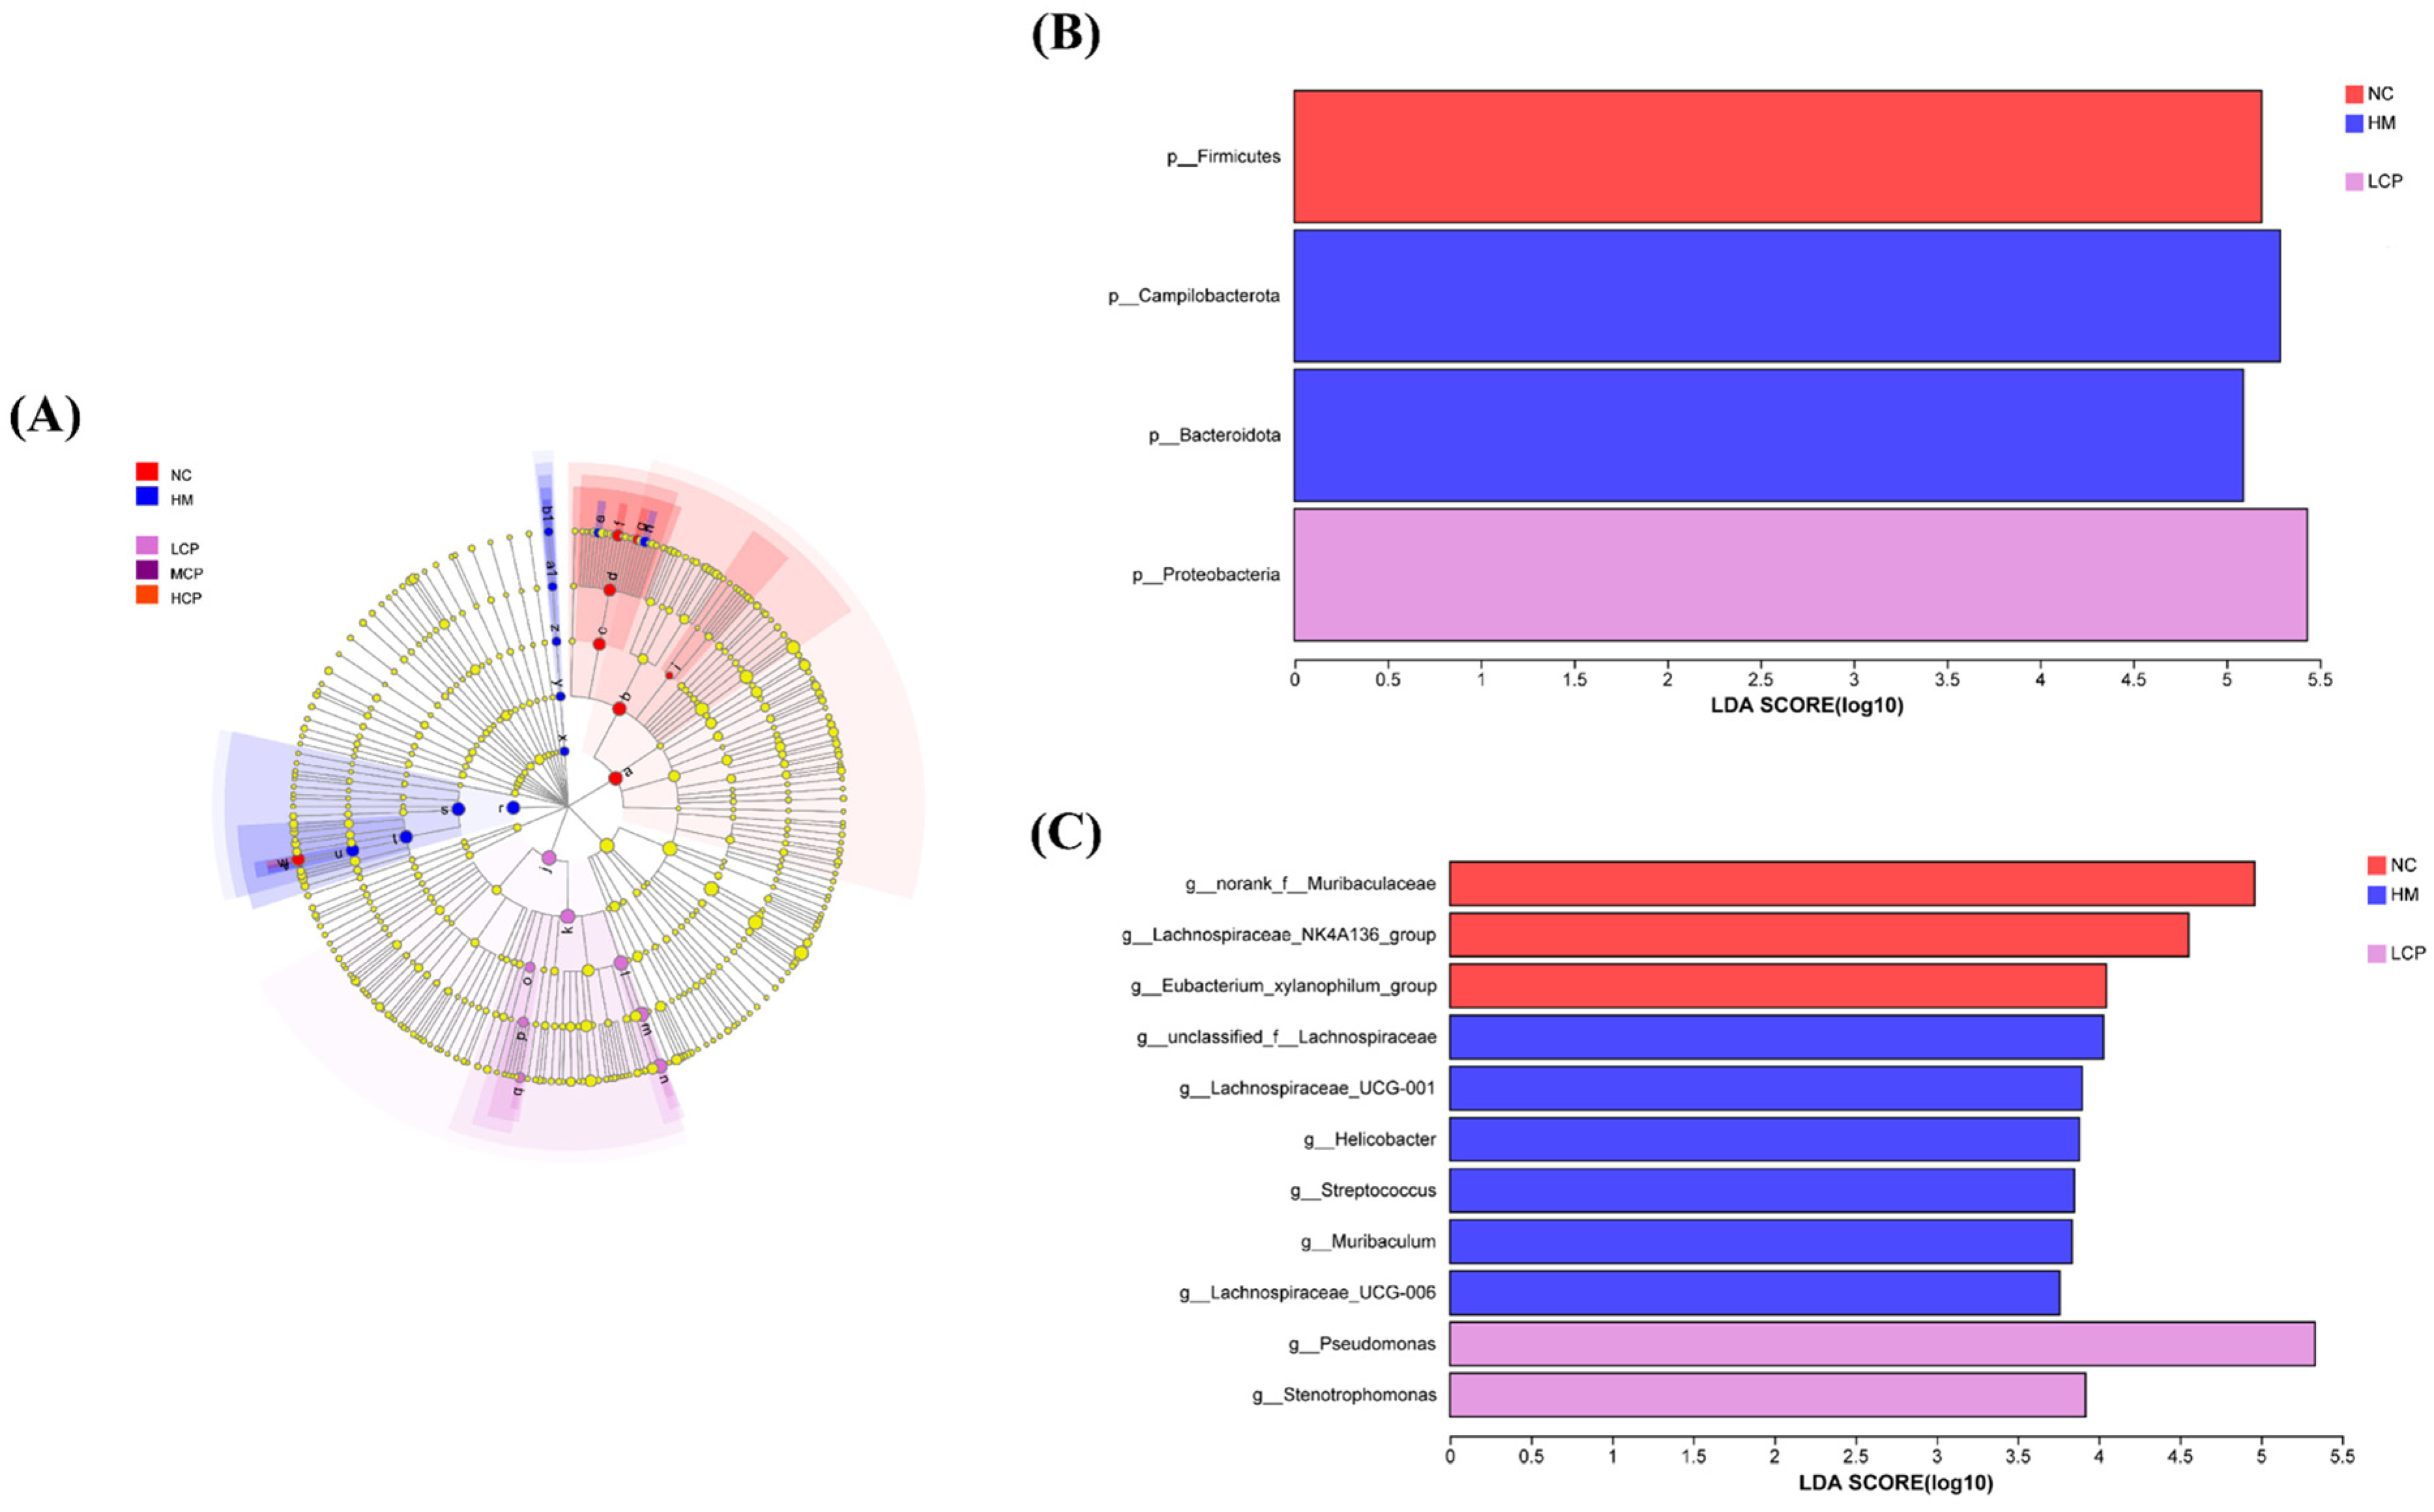
2.2.4. Microbial Community Biomarker Analysis Based on LEfSe

To further analyze biomarkers with significant differences in relative abundance between groups, LEfSe was used to identify the enrichment and changes in the microbial communities of various populations between groups. As shown in Figure 5, the total number of taxonomic classes with LAD values above 2.0 was 28. At the phylum level, Firmicutes was significantly enriched in the NC group (LDA > 5.0), Campilobacterota and Bacteroidota were significantly enriched in the HM group (LDA > 5.0), and Proteobacteria were significantly enriched in the LCP group (LDA > 5.0).
At the genus level, the HM group had the most characteristic communities, the NC group had the second most, the LCP group had the least characteristic communities, and the remaining groups had no characteristic communities. The NC groups norank_f_Muribaculaceae, Lachnospiraceae_NK4A136_group, and Eubacterium_xylanophilum_group were significantly enriched (LDA > 4.0), and the HM groups unclassified_f_Lachnospiraceae (LDA > 4.0), Lachnospiraceae_UCG-001, g_Helicobacter, g_Streptococcus, g_Muribaculum, and Lachnospiraceae_UCG-006 were significantly enriched (LDA > 3.5). Pseudomonas (LDA > 5.0) and Stenotrophomonas (LDA > 3.5) were significantly enriched in the LCP group. The above communities can be considered as potential biomarkers for each group. The abundance of g_Helicobacter, g_Streptococcus, g_Muribaculum, unclassified_f_Lachnospiraceae, and Lachnospiraceae_UCG-006 in the HM group was significantly higher than that in the NC group, and it is hypothesized that the high abundance of these microorganisms is directly related to H. pylori infection. Some studies had also found that g_Helicobacter and g_Muribaculum were important markers by the model infection group, which was consistent with the present study results [24,26]. In addition, g_Helicobacter was one of the potential markers in the HM group, which was consistent with the fact that the HM group was infected, resulting in an increase in the number of H. pylori specimens. g_Helicobacter was not seen in the remaining groups, further suggesting that CPAP intervention had significantly reduced H. pylori colonization. Taken together, the results analyzed above indicate that CPAP intervention had a positive effect on H. pylori-induced gastric microbiota dysbiosis.

2.3. Regulatory Effect of CPAPs on Intestinal Microbiota Disorders by H. pylori Infection

2.3.1. Species Diversity Correlation Curve Analysis of the Intestinal Microbiota

The gastric microbiota has been studied more extensively owing to H. pylori colonizing the gastric mucosa. However, disturbances in the gastric microbiota also affect the intestinal microbiota, and the relationship between intestinal microbiota and disease development is more important. It has been found that H. pylori infection is not only able to cause disorders of gastric microbiota but also has an important effect on the structural composition of intestinal microbiota [34,35]. Therefore, we further analyzed the regulatory effect of CPAPs on intestinal microbiota disorders by H. pylori infection. As shown in Figure 6, as the number of intestinal microbiota in each group increased, their relative abundance gradually decreased. When the relative abundance in the samples was lower than 0.1%, the curve tended to be straight and entered into the plateau period, and most of the samples contained pairs of OTUs in the range of 200 to 300, indicating that the microbial abundance in the intestinal contents of mice in each group was high. At the same time, the curve arrived at the plateau period in a relatively flat manner, indicating that microbial uniformity was better. The highest species richness was found in the HCP group while the lowest was found in the KSS and HM groups, suggesting that H. pylori infection and antibiotic intake could reduce the species abundance of microorganisms in the intestine and that intervention with a certain dose of CPAPs could regulate the abundance of microorganisms in the intestine.

2.3.2. OTUs and Community Composition Analysis of the Intestinal Microbiota

As shown in Figure 7A, there were differences between the numbers and types of OTUs in the samples of each group. The total number of OTUs in all groups was 199, and the NC, HM, KSS, LCP, MCP, and HCP groups uniquely had OTUs of 7, 19, 39, 16, 15, and 25 each, respectively, suggesting that after the mice were infected by H. pylori, the species composition of intestinal microorganisms in the HM group was significantly changed compared to that in the NC group. Compared with the HM group, the number of unique OTUs in the LCP and MCP groups decreased significantly, and the number of unique OTUs in the HCP increased slightly, indicating that a certain dose of CPAP intervention could significantly change the species composition of intestinal microorganisms and that the intake of antibiotics could significantly change the structures of intestinal microorganisms in mice.
At the phylum level, there were five phyla with relative abundance above 1%, and the dominant phylum species were the same in each group, but the compositions differed among the groups. Compared with the NC group, the relative abundance of Firmicutes and Actinobacteriota in the HM group underwent significant changes, in which the relative abundance of Firmicutes decreased by 29.96% and the relative abundance of Actinobacteriota increased by 23.30%. There was no significant change in the relative abundance of Bacteroidota, suggesting that H. pylori infection can significantly change the species composition of intestinal microbiota in mice, resulting in decreases in the number of beneficial bacteria and increases in the number of harmful bacteria. This finding was consistent with previous reports in the literature [36,37]. Meanwhile, the ratio of Firmicutes/Bacteroidota in the HM group was significantly reduced by 37.48%, indicating that H. pylori infection may lead to a disproportionate ratio of Firmicutes and Bacteroidota in the intestine. Compared with the HM group, the relative abundance of Firmicutes and Bacteroidota in each dose group increased with increasing doses of CPAP intervention by 7.53%, 27.52%, and 45.00% and 26.30%, 76.09%, and 84.13%, respectively. The relative abundance of Actinobacteriota and Proteobacteria showed a significant decrease, for which the HCP group had the best effect, and the relative abundance of various bacterial phyla was basically restored to the normal level, which indicated that the CPAP intervention could effectively improve the structural disorder of the intestinal microbiota induced by the infection of H. pylori.
From the genus-level analysis, there were 37 genera with a relative abundance greater than 1% in mice’s intestinal microbiota, and there were three dominant organisms mainly by the genus level, Enterorhabdus, norank_f_Muribaculaceae, and unclassified_f_Lachnospiraceae. The genus Enterobacteriaceae includes Shigella, Salmonella, Klebsiella, Rubella, and Enterobacteriaceae, most of which belong to the genus of pathogenic bacteria [38,39]. Lachnospiraceae is a probiotic bacterium in the intestinal that ferments glucose to produce formic acid, lactic acid, acetic acid, and ethanol [40,41]. Compared with the NC group, the relative abundance of Enterorhabdus in the HM group increased significantly, and the relative abundance of Lachnospiraceae and norank_f_Muribaculaceae decreased, indicating that H. pylori infection resulted in the disorganization of the intestinal microbiota, the relative abundance of beneficial bacteria such as g_Lachnospiraceae decreased, and the relative abundance of pathogenic bacteria g_Enterorhabdus increased substantially. Compared with the HM group, the relative abundance of g_Enterorhabdus in the CPAP group was significantly reduced by 29.32%, 79.84% and 84.81%. Several studies have found that food-borne actives can improve the gastrointestinal microbiota induced by H. pylori infection by modulating the microbial community structure [42,43,44]. Meanwhile, the results indicated that the CPAP intervention would significantly improve the relative abundance of different genera induced by H. pylori infection, inhibit the proliferation of pathogenic bacteria, and stabilize the species diversity of intestinal microbiota and that its regulatory effect was related to its dose.

2.3.3. Microbiota Divers

Compared with the NC group, the richness indices Ace and Chao, and the diversity index Shannon, were significantly decreased in the HM group (p < 0.05), indicating that the species richness and microbial diversity in the intestinal microbiota were substantially reduced after H. pylori infection, leading to structural disorders of the intestinal microbiota. As shown in Figure 8, compared with the HM group, the diversity index Shannon and richness indices Ace and Chao increased after intervention by different doses of CPAPs, and the indices showed a dose-dependent significant increase with increases in the CPAP dose (p < 0.05). The Shannon, Ace, and Chao indices could be restored to the normal level in the MCP group, and the levels of the three indices in the HCP group were higher than those in the NC group, but there was no significant difference, which indicated that the CPAP intervention could significantly restore the species richness and microbial diversity of the intestinal microbiota. Compared with the HM group, the diversity index Shannon of the KSS group was significantly higher, and the richness indices Ace and Chao were significantly lower than those of the HM group, indicating that antibiotic intake could increase the microbial diversity within the intestinal microbiota of mice, and the richness was significantly reduced (p > 0.05). The improvement of microbial community diversity in the gastrointestinal tract may be one of the mechanisms of CPAP action.
As shown in Figure 8D, the cumulative variance contributions of the first two principal components were 25.77% and 16.13%, respectively. The HM and NC groups were clearly separated, indicating significant differences in species composition. Compared with the distance between the NC and HM groups, the distance between the CPAP (LCP, MCP, and HCP) and NC groups was significantly shorter, indicating that the structure of the intestinal microbiota composition tended to the NC group by CPAP intervention. Among them, the MCP and HCP groups showed the best effect, which was closer to the NC group, while the LCP and KSS groups showed some differences.

2.3.4. Microbial Community Biomarker Analysis Based on LEfSe of the Intestinal Microbiota

At the phylum level, Desulfobacterota was significantly enriched in the NC group (LDA > 4.5) and Patescibacteria was significantly enriched in the KSS group (LDA > 4.5), whereas in other groups, no community was enriched (Figure 9). At the genus level, the KSS group had the most characterized communities, the HM and LCP groups had the second most, and the NC, MCP, and HCP groups had the least. The NC group was significantly enriched in g_Desulfovibrio (LDA > 4.5) and g_Yaniella (LDA > 4.0). The HM group was significantly enriched in unclassified_f_Eggerthellaceae (LDA > 4.0), unclassified_f_Erysipelotrichaceae, and g_Streptococcus (LDA > 3.5), and these were closely related to intestinal-type changes [45]. The KSS groups unclassified_f_Lachnospiraceae (LDA > 5.0), Lachnospiraceae_NK4A136_group (LDA > 4.5), Eubacterium_xylanophilum_group (LDA > 4.0), Candidatus_Saccharimonas, and GCA-900066575 (LDA > 3.5) were significantly enriched, as were the LCP groups Candidatus_Arthromitus (LDA > 4.5), Atopostipes (LDA > 4.0), and norank_f_Eggerthellaceae (LDA > 3.5). Enterococcus (LDA > 4.0) and Prevotellaceae_UCG-001 (LDA > 3.5) were significantly enriched in the MCP group. The HCP group g_Family_XIII_AD3011_group (LDA > 3.5) and norank_f_norank_o_RF39 (LDA > 3.0) were significantly enriched. The above groups can be considered potential biomarkers for each group. We found that the anti-H. pylori effects of CPAPs were closely related to the changes in Enterococcus and Candidatus_Arthromitus. These results suggest that the CPAP intervention had a positive effect on H. pylori-induced intestinal microbiota dysbiosis in mice.

2.3.5. Predictive Analysis of the Intestinal Microbiota Function

To explore the impact of intestinal microbiota function on community shifts, we conducted a functional prediction analysis of the gut microbial community utilizing PICRUST. Referring to the KEGG database, we discovered notable alterations in the function of the intestinal microbial community subsequent to H. pylori infection. At level 1 (Table 1), in comparison to the NC group, the HM group exhibited a considerable rise in the relative abundance of genes pertaining to genetic information processing (p < 0.05), alongside a substantial reduction in the relative abundance of genes linked to environmental information processing and cellular transformation processes (p < 0.05). At level 2 (Table 2), in contrast to the NC group, the HM group demonstrated a marked increase in the relative abundance of genes associated with energy metabolism, translation, replication and repair, nucleotide metabolism, protein folding, and sorting and degradation, as well as infectious disease-causing bacteria (p < 0.05). Conversely, there was a significant decrease in the abundance of genes related to membrane transport, cofactor and vitamin metabolism, prokaryotic cellular communities, lipid metabolism, cellular activity, the endocrine system, aging, and transport and catabolism.
The abundance of genes involved in genetic information processing and cellular transformation processes was primarily enhanced by CPAP intervention, aligning with its capability to improve the outcomes of gastric mucosal epithelial cell injury. Compared with the HM group, in terms of human diseases, CPAP intervention significantly decreased the abundance of genes related to cardiovascular diseases (p < 0.05). Regarding metabolic pathways, it considerably augmented the abundance of genes involved in lipid metabolism, endocrinology, transport, and catabolism and decreased the abundance of genes related to energy metabolism and nucleotide metabolism (p < 0.05). In terms of other pathways, CPAP intervention notably augmented the abundance of genes involved in membrane transport, cellular community—prokaryotes, cellular activity, and aging. Moreover, it significantly diminished the abundance of genes associated with various processes such as translation, replication and repair, folding, and sorting and degradation, as well as those linked to infectious-disease bacteria and transcription (p < 0.05).
Alterations in the intestinal microbiota, particularly those possessing specialized functions, will undoubtedly modify the functional landscape of the entire intestinal microbiota. In this study, predicted microbial functions revealed that H. pylori infection altered biometabolic pathways. Conversely, CPAPs enhanced biometabolic pathways by adjusting intestinal microbiota composition. This functional prediction implies that CPAPs have the potential to prevent or mitigate metabolic disturbances induced by H. pylori.
Collectively, these findings demonstrate that H. pylori infection notably disrupted the structure of the gastrointestinal microbiota in mice, resulting in a chaotic response primarily marked by reduced levels of beneficial bacteria and an elevation in harmful bacteria levels. With the intervention of CPAPs, the level of H. pylori colonization in the stomach can be significantly decreased, the structural composition of the gastrointestinal microbiota can be enhanced, and the abundance and diversity can be increased, thereby positively regulating the disorders of the gastrointestinal microbiota in mice. In addition, the PICRUST function prediction of intestinal microbiota revealed that CPAPs may prevent or reduce metabolic disorders brought about by H. pylori. It is hypothesized that the regulatory impact of CPAPs on gastrointestinal microbiota disorders could be one of the underlying mechanisms through which they counteract H. pylori-induced gastric damage.
In addition, according to the maximum dose of 600 mg/kg·bw in this experiment, the human body weight was calculated as 70 kg, which is equivalent to the maximum effective dose of 5.5 g/day for humans.

3. Materials and Methods

3.1. Materials and Chemicals

H. pylori 43504 was obtained from American Type Culture Collect (ATCC, Manassas, VA, USA). Corn gluten meal (CGM) was obtained from FuFeng Development Co., Ltd., (Qiqihar, Heilongjiang, China). Neutrase 0.8 L (21,000 U/mL, determined using the lowry method) was bought from Novo Nordisk (Bagsvaerd, Denmark). Total RNA Kit II R6934 was purchased from Omega Bio-Tek Co., Ltd., (Norcross, GA, USA). PrimeScript™ IV 1st strand cDNA Synthesis Mix 6215 was bought from Takara Biomedical Co., Ltd., (Beijing, China). PowerUp™ SYBR™ Green Master Mix was obtained from Thermo Fisher Scientific (Waltham, MA, USA).

3.2. CPAP Preparation
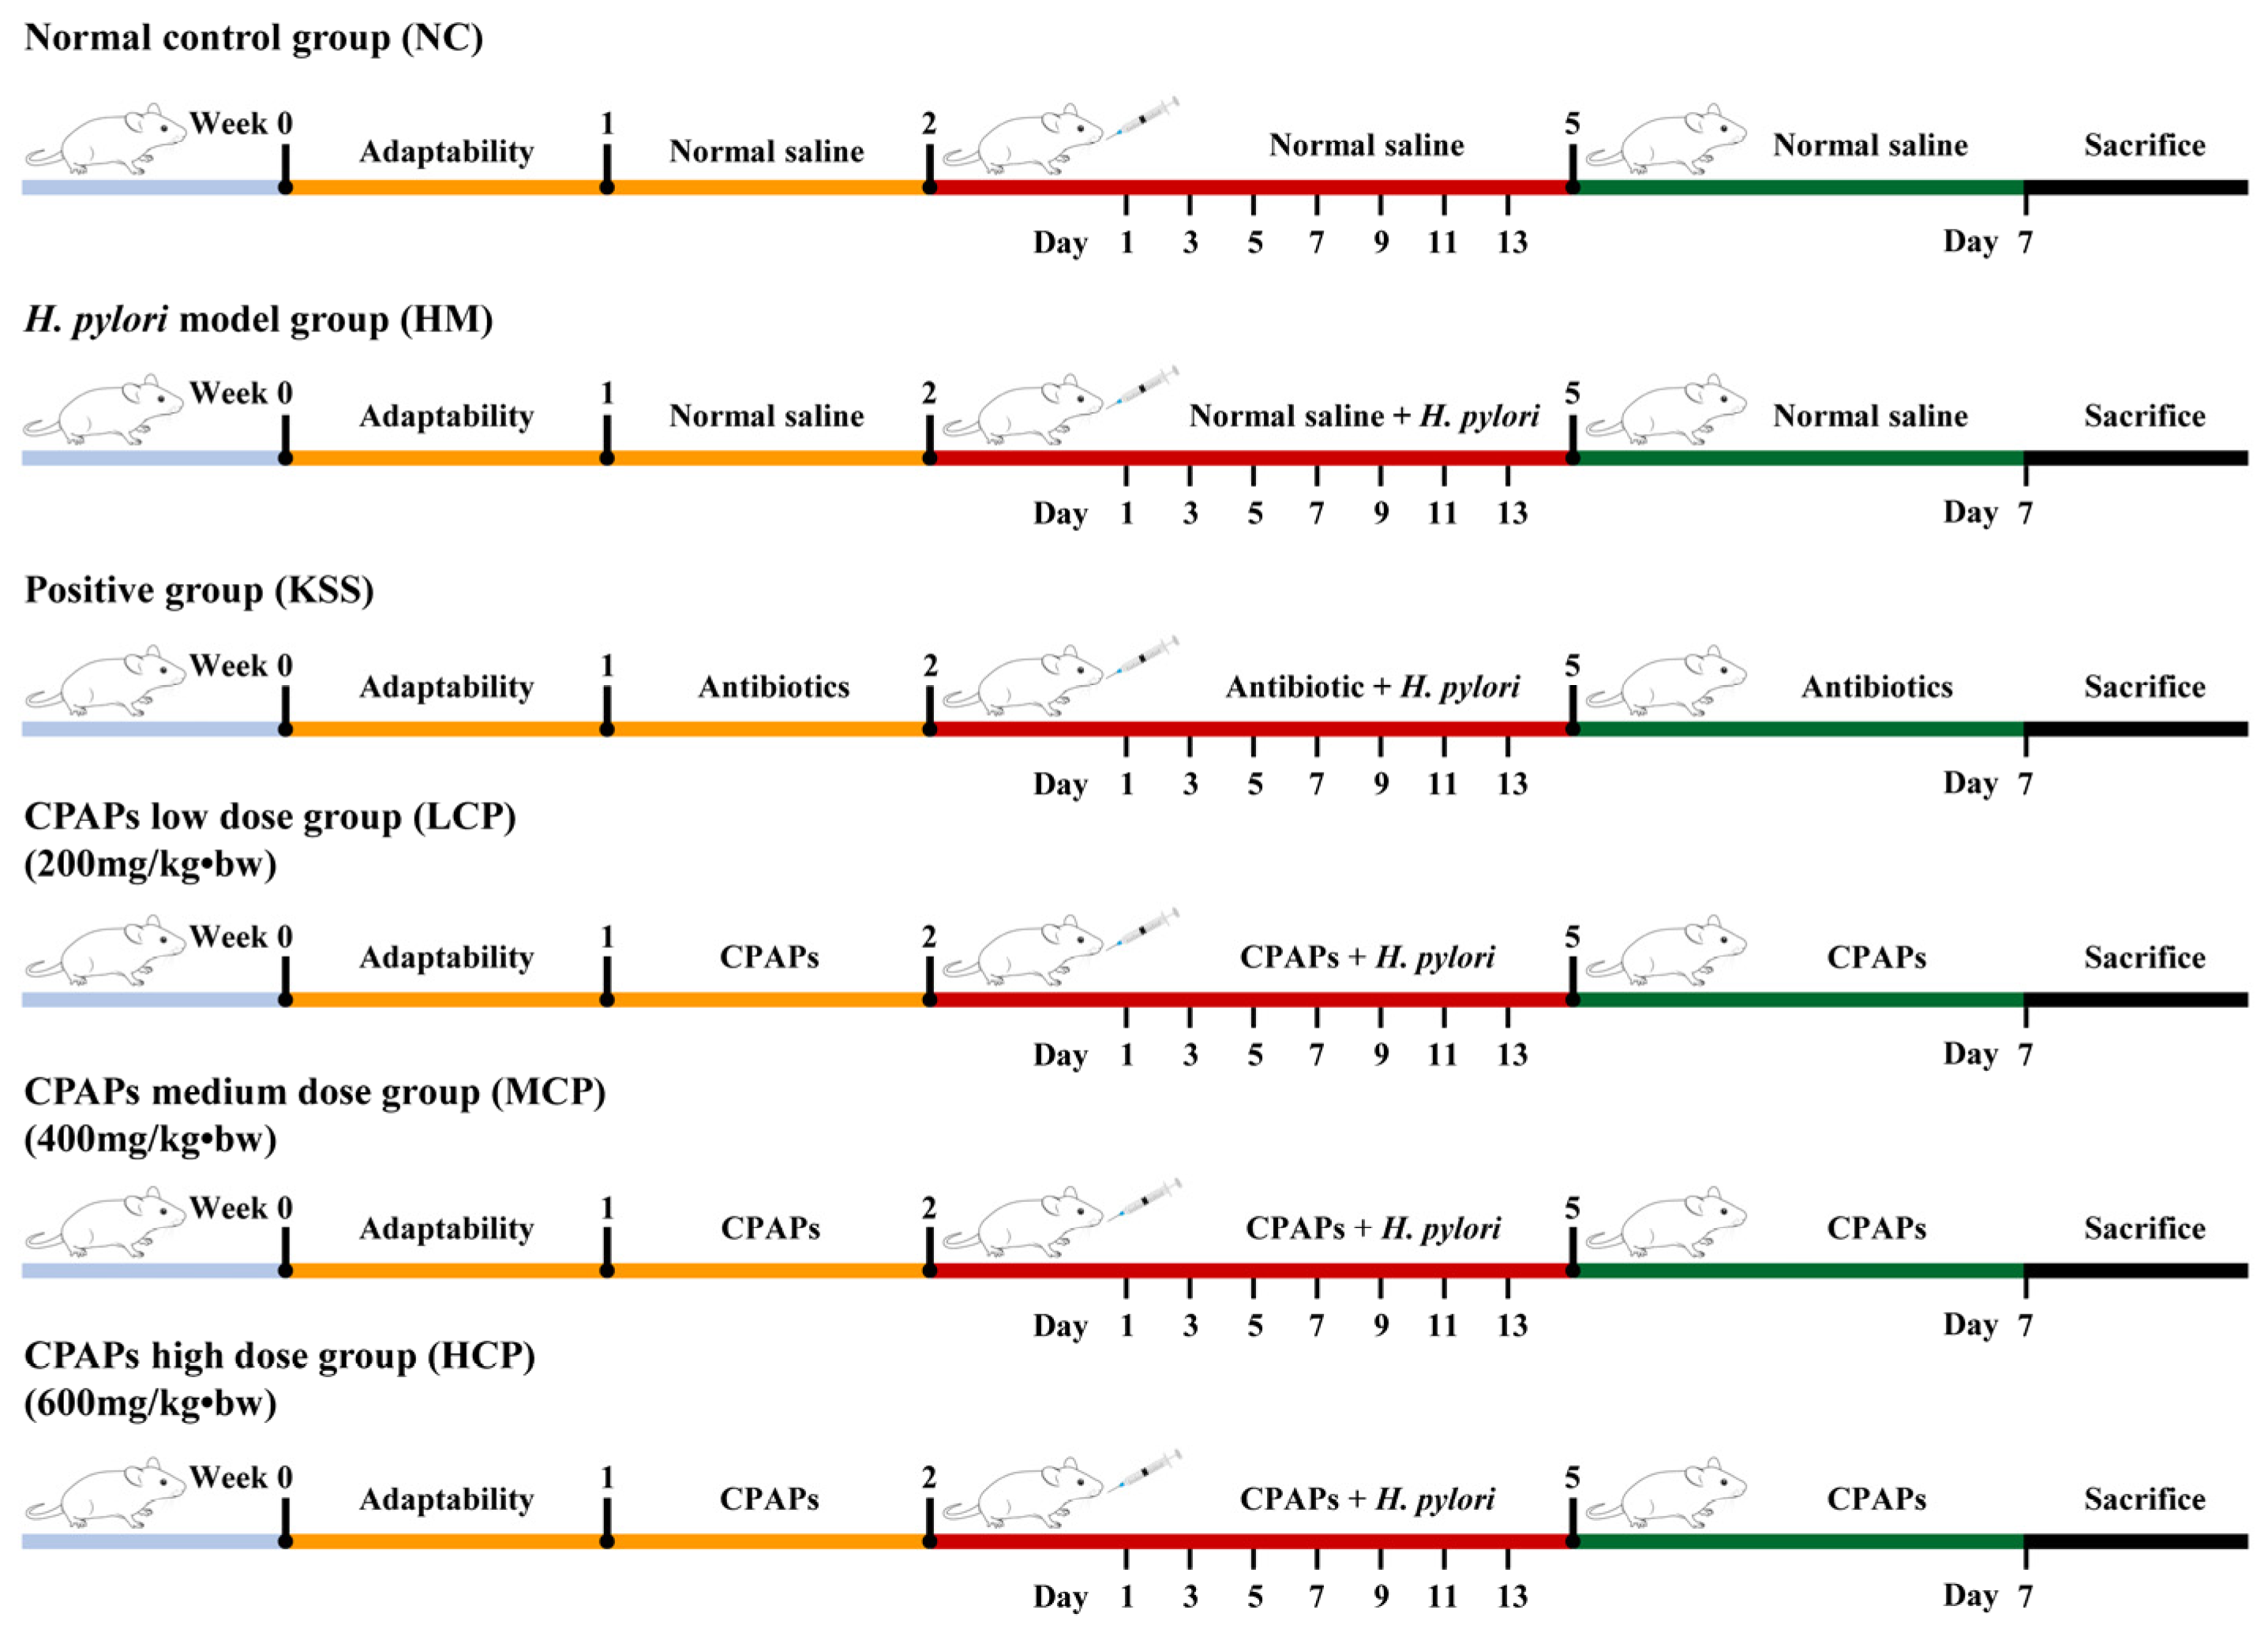
CPAPs were prepared according to our previously reported study [46]. First, CGM was pretreated by extrusion expansion and starch removal. The pretreated CGM was prepared as a suspension at 15% (w/v), and the pH of the suspension was adjusted to 7.0 with 0.5 M HCl, and the temperature was adjusted to 45 °C. The neutral protease enzyme addition was 400 U/g, and the hydrolysis time was 2 h. After the hydrolysis reaction, the suspension was heated to 95 °C for 10 min and centrifuged at 1000 r/min for 15 min, and the supernatant was freeze-dried (CPAPs). CPAPs are mixtures of peptides.

3.3. In Vivo Assay

Forty-eight male KM mice (six weeks old) were purchased from the Changchun Yisi Experimental Animal Research Center (Changchun, China, SCXK (ji)-2018-0007), and were specifically pathogen-free. The animal experiment was approved by the Animal Ethics Committee of the College of Food and Bioengineering, Qiqihar University. The mice were maintained by the Qiqihar University Regulations on Animal Experimentation (Approval No. 2023-002). These mice were allowed to feed and drink freely during the experiment.
The animal experiment plan is shown in Figure 10. The mice were randomly divided into six groups: the normal control group (NC); the H. pylori model group (HM); CPAP groups with low (200 mg/kg·bw, LCP), medium (400 mg/kg·bw, MCP), and high (600 mg/kg·bw, HCP) doses; and the positive antibiotic group (14.25 mg/kg amoxicillin + 7.15 mg/kg Clarithromycin + 14.2 mg/kg Metronidazole, KSS). As shown in Figure 10, seven days of adaptive feeding were required. At the beginning of the experiment, the normal and model groups were given normal saline (0.3 mL), the positive control group was given antibiotics (0.3 mL), and the CPAP groups were given different doses of CPAPs. From the third week of the experiment, the groups continued to be given different doses of CPAPs; the normal and model groups were given normal saline, and also started to be given H. pylori solution every other day for a total of 7 times (0.4 mL, about 109 cfu/mL). Then we continued the experiment for a week, as in the beginning. After the last dose, the mice were fasted overnight and anesthetized by pentobarbital sodium, and the stomachs and intestines of the mice were collected. The samples were frozen at −80 °C for analysis.

3.4. qRT-PCR Assay

Stomach samples from each group of mice were taken for total RNA extraction. Total RNA was extracted using Omega Tissue Total RNA Kit II (R6934) and then reverse-transcribed to cDNA using the PrimeScript™ IV 1st strand cDNA Synthesis Mix 6215 and analyzed in QuantStudio Real-Time Fluorescence Quantitative PCR System (Waltham, MA, USA). For data normalization, β-actin was used as a reference gene; the values of each group were calculated using the 2−ΔΔCt method. Then, we made calculations to obtain the mean value of the NC group; based on the mean value of the NC group, all groups were normalized, and the NC group was normalized to 1. The dispersion of all groups was calculated according to the normalized values of each group, and all results were expressed as means ± standard deviations (SD). The forward and reverse primers for each gene are shown in Table 3. All reactions were run three times.

3.5. Analysis of Gastrointestinal Microbiota by 16S rRNA Gene Sequencing

3.5.1. DNA Extraction and Concentration Determination

The samples (the stomachs and intestines) of each group were placed on ice and melted, then DNA extraction reagents were added to be mixed well and extracted evenly and centrifuged at 10,000 r/min for 5 min. The DNA concentration was determined by the NanoDrop2000 Micro Nucleic Acid Analyzer (Waltham, MA, USA), DNA purity was analyzed by 1% agarose gel electrophoresis at the same time, and the brightness of DNA was observed. It was judged whether the extracted DNA met the quality standard.

3.5.2. PCR Amplification and Library Construction

TransGen AP221-02: TransStart Fastpfu DNA Polymerase, 20 μL reaction system was used for PCR amplification assay. In the PCR tube, 4 μL of 5 × FastPfu Buffer, 2 μL of 2.5 mM dNTPs, 0.8 μL of Forward Primer (5 μM), 0.8 μL of Reverse Primer (5 μM), 0.4 μL of FastPfu Polymerase, 0.2 μL of BSA, and 10 ng of template DNA were made up to 20 μL with ddH2O. Forward Primer 338F: ACTCCTACGGGGAGGCAGCAG; Reverse Primer 806R: GGACTACHVGGGGTWTCTAAT. PCR reaction parameters: denaturation of the samples at 95 °C for 3 min, the number of cycles was 35, and the single-cycle conditions were as follows—95 °C hold for 30 s, 55 °C hold for 30 s, and 72 °C hold for 45 s. The purity of the PCR products was detected by 2% agarose gel electrophoresis, and the concentration of PCR products was determined by the NanoDrop2000 Micro Nucleic Acid Analyzer (Waltham, MA, USA). PCR libraries were constructed, and DNA fragment sequences were obtained using the Illumina MiSeq sequencing platform (Waltham, MA, USA). The species diversity of each group of samples was analyzed in the Majorbio Cloud platform (www.majorbio.com), including species diversity, community composition, microbiota diversity analysis (α-diversity and β-diversity), microbial community biomarker analysis (LEfSe), and functional predictive analysis (PICRUST and KEGG).

3.6. Statistical Analysis

All results were expressed as means ± standard deviations (SD), and statistical comparisons were performed using one-way analysis of variance (ANOVA), and Duncan’s test was used as a post hoc test following ANOVA. The species diversity of each group of samples was analyzed in the Majorbio Cloud platform (www.majorbio.com), including species diversity, community composition, microbiota diversity analysis (α-diversity and β-diversity), microbial community biomarker analysis (LEfSe), and functional predictive analysis (PICRUST and KEGG). Different lowercase letters represent significant differences (p < 0.05). SPSS Statistics 26 (SPSS Inc., Chicago, IL, USA) was used to analyze the data.

4. Conclusions

In the H. pylori-infected mouse model, CPAPs can inhibit the formation of the TLR4/MyD88 complex, which in turn inhibits the activation of the NF-κB signaling pathway, leading to the down-regulation of pro-inflammatory factors and up-regulation of anti-inflammatory factors. Consequently, this alleviates the gastric mucosal damage response induced by H. pylori. Additionally, CPAPs effectively enhance the structural composition of the gastrointestinal microbiota by promoting the proliferation of beneficial bacteria and significantly inhibiting the growth of pathogenic bacteria. This promotes the microecological balance of the gastrointestinal tract and plays a crucial role in antagonizing H. pylori infection. In the future, we will use multi-omics combined technology to reveal the mechanism of CPAPs against H. pylori infection from the perspective of gastrointestinal microorganisms and metabolite analysis.

Author Contributions

G.L.: conceptualization, investigation, methodology, formal analysis, writing—original draft, and funding acquisition. Y.X.: writing—review and editing, data analysis, and investigation. Q.W.: data analysis, formal analysis, and visualization. Z.M.: formal analysis, data analysis, and investigation. X.L.: writing—review and editing, methodology, and funding acquisition. X.Z.: resources, writing—review and editing, and experimental design. All authors have read and agreed to the published version of the manuscript.

Funding

This study was funded by the Heilongjiang Province Natural Science Foundation (No. PL2024C039), Young Talents of Basic Research in Universities of Heilongjiang Province (No. YQJH2024271), New Era Longjiang Excellent Doctoral Dissertation Project (No. LJYXL2023-023), plant food processing technology characteristic discipline project (No. YSTSXK202405), and Heilongjiang Province basic scientific research operating expenses scientific research projects (No. 145309115).

Institutional Review Board Statement

The animal experiment was approved by the Animal Ethics Committee of the College of Food and Bioengineering, Qiqihar University. The mice were maintained in accordance with the Qiqihar University Regulations on Animal Experimentation (Approval No. 2023-002).

Informed Consent Statement

Not applicable.

Data Availability Statement

Data will be made available on request.

Conflicts of Interest

The authors declare no competing financial interests.

References

  1. Sgamato, C.; Rocco, A.; Compare, D.; Priadko, K.; Romano, M.; Nardone, G. Exploring the Link between Helicobacter pylori, Gastric Microbiota and Gastric Cancer. Antibiotics 2024, 13, 484. [Google Scholar] [CrossRef] [PubMed]
  2. Park, J.M.; Lee, W.H.; Seo, H.; Oh, J.Y.; Lee, D.Y.; Kim, S.J.; Hahm, K.B. Microbiota changes with fermented kimchi contributed to either the amelioration or rejuvenation of Helicobacter pylori-associated chronic atrophic gastritis. J. Clin. Biochem. Nutr. 2021, 69, 98–110. [Google Scholar] [CrossRef] [PubMed]
  3. Huang, Y.; Ding, Y.; Xu, H.; Shen, C.; Chen, X.; Li, C. Effects of sodium butyrate supplementation on inflammation, gut microbiota, and short-chain fatty acids in Helicobacter pylori-infected mice. Helicobacter 2021, 26, e12785. [Google Scholar] [CrossRef] [PubMed]
  4. Fayed, B.; Jagal, J.; Cagliani, R.; Kedia, R.A.; Elsherbeny, A.; Bayraktutan, H.; Khoder, G.; Haider, M. Co-administration of amoxicillin-loaded chitosan nanoparticles and inulin: A novel strategy for mitigating antibiotic resistance and preserving microbiota balance in Helicobacter pylori treatment. Int. J. Biol. Macromol. 2023, 253, 126706. [Google Scholar] [CrossRef] [PubMed]
  5. Teng, G.; Liu, Y.; Wu, T.; Wang, W.; Wang, H.; Hu, F. Efficacy of Sucralfate-Combined Quadruple Therapy on Gastric Mucosal Injury Induced by Helicobacter pylori and Its Effect on Gastrointestinal Flora. BioMed Res. Int. 2020, 2020, 4936318. [Google Scholar] [CrossRef] [PubMed]
  6. Yang, Y.; Sheu, B. Metabolic Interaction of Helicobacter pylori Infection and Gut Microbiota. Microorganisms 2016, 4, 15. [Google Scholar] [CrossRef]
  7. Burger, O.; Weiss, E.; Sharon, N.; Tabak, M.; Neeman, I.; Ofek, I. Inhibition of Helicobacter pylori Adhesion to Human Gastric Mucus by a High-Molecular-Weight Constituent of Cranberry Juice. Crit. Rev. Food Sci. 2002, 42, 279–284. [Google Scholar] [CrossRef]
  8. Li, G.; Liu, X.; Wang, Q.; Miao, Z.; Zheng, X. Anti-adhesive activity peptides against Helicobacter pylori from corn protein: Properties, identification, structural characterization and molecular docking in vitro and in silico. Food Biosci. 2024, 59, 104267. [Google Scholar] [CrossRef]
  9. Messing, J.; Thöle, C.; Niehues, M.; Shevtsova, A.; Glocker, E.; Borén, T.; Hensel, A. Antiadhesive Properties of Abelmoschus esculentus (Okra) Immature Fruit Extract against Helicobacter pylori Adhesion. PLoS ONE 2014, 9, e84836. [Google Scholar] [CrossRef]
  10. Liu, X.; Song, C.; Chen, J.; Liu, X.; Ren, J.; Zheng, X. Preparation and evaluation of new glycopeptides obtained by proteolysis from corn gluten meal followed by transglutaminase-induced glycosylation with glucosamine. Foods 2020, 9, 555. [Google Scholar] [CrossRef]
  11. Jiang, Y.; Zhang, M.; Lin, S.; Cheng, S. Contribution of specific amino acid and secondary structure to the antioxidant property of corn gluten proteins. Food Res. Int. 2018, 105, 836–844. [Google Scholar] [CrossRef] [PubMed]
  12. Wang, X.; Liu, X.; Zheng, X.; Qu, Y. Preparation of corn glycopeptides and evaluation of their antagonistic effects on alcohol-induced liver injury in rats. J. Funct. Foods 2020, 66, 103776. [Google Scholar] [CrossRef]
  13. Zhou, C.; Ma, H.; Ding, Q.; Lin, L.; Yu, X.; Luo, L.; Yagoub, A. Ultrasonic pretreatment of corn gluten meal proteins and neutrase: Effect on protein conformation and preparation of ACE (angiotensin converting enzyme) inhibitory peptides. Food Bioprod. Process. 2013, 91, 665–671. [Google Scholar] [CrossRef]
  14. Li, G.; Liu, X.; Miao, Z.; Hu, N.; Zheng, X. Preparation of Corn Peptides with Anti-Adhesive Activity and Its Functionality to Alleviate Gastric Injury Induced by Helicobacter pylori Infection In Vivo. Nutrients 2023, 15, 3467. [Google Scholar] [CrossRef]
  15. Li, W.; Li, H.; Zhang, Y.; Zhang, C.; Zhang, J.; Liu, X. Differences in the gut microbiota composition of rats fed with soybean protein and their derived peptides. J. Food Sci. 2021, 86, 5452–5465. [Google Scholar] [CrossRef]
  16. Feng, Z.; Wei, Y.; Xu, Y.; Zhang, R.; Li, M.; Qin, H.; Gu, R.; Cai, M. The anti-fatigue activity of corn peptides and their effect on gut bacteria. J. Sci. Food Agric. 2021, 102, 3456–3466. [Google Scholar] [CrossRef]
  17. Ashaolu, T.J. Soy bioactive peptides an the gut microbiota modulation. Appl. Microbiol. Biotechnol. 2020, 104, 9009–9017. [Google Scholar] [CrossRef]
  18. Zhang, S.; Huang, Z.; Li, Q.; Zheng, X.; Liu, J. Two-stage solid-state fermentation to increase the nutrient value of corn processing waste and explore its efficacy as a feed protein source. Food Chem. X 2024, 23, 101656. [Google Scholar] [CrossRef]
  19. Han, H.; Lim, J.W.; Kim, H. Astaxanthin Inhibits Helicobacter pylori-induced Inflammatory and Oncogenic Responses in Gastric Mucosal Tissues of Mice. J. Cancer Prev. 2020, 25, 244–251. [Google Scholar] [CrossRef]
  20. Zhou, Q.; Xue, B.; Gu, R.; Li, P.; Gu, Q. Lactobacillus plantarum ZJ316 Attenuates Helicobacter pylori-Induced Gastritis in C57BL/6 Mice. J. Agric. Food Chem. 2021, 69, 6510–6523. [Google Scholar] [CrossRef]
  21. Wu, S.; Cui, W.; Zhou, Q.; Liang, Y.; Wu, D.; Xu, Y.; Li, P.; Gu, Q. Phenyl lactic acid alleviates Helicobacter pylori infection in C57BL/6 mice. Food Funct. 2023, 14, 5032–5047. [Google Scholar] [CrossRef] [PubMed]
  22. Yang, X.; Yang, L.; Pan, D.; Liu, H.; Xia, H.; Wang, S.; Sun, G. Wheat peptide protects against ethanol-induced gastric mucosal damage through downregulation of TLR4 and MAPK. J. Funct. Foods 2020, 75, 104271. [Google Scholar] [CrossRef]
  23. Tong, X.; Li, B.; Li, J.; Li, L.; Zhang, R.; Du, Y.; Zhang, Y. Polyethylene microplastics cooperate with Helicobacter pylori to promote gastric injury and inflammation in mice. Chemosphere 2022, 288, 132579. [Google Scholar] [CrossRef] [PubMed]
  24. Zhou, Q.; Qureshi, N.; Xue, B.; Xie, Z.; Li, P.; Gu, Q. Preventive and therapeutic effect of Lactobacillus paracasei ZFM54 on Helicobacter pylori-induced gastritis by ameliorating inflammation and restoring gastric microbiota in mice model. Front. Nutr. 2022, 9, 972569. [Google Scholar] [CrossRef]
  25. Huang, R.; Xie, J.; Liu, X.; Shen, M. Sulfated modification enhances the modulatory effect of yam polysaccharide on gut microbiota in cyclophosphamide-treated mice. Food Res. Int. 2021, 145, 110393. [Google Scholar] [CrossRef]
  26. Yu, J.; Chen, Z.; Zhou, Q.; Li, P.; Wu, S.; Zhou, T.; Gu, Q. Exopolysaccharide from Lacticaseibacillus paracasei alleviates gastritis in Helicobacter pylori-infected mice by regulating gastric microbiota. Front. Nutr. 2024, 11, 1426358. [Google Scholar] [CrossRef]
  27. Yang, H.; Lin, Y.; Ma, Y.; Li, J.; Li, J.; Huo, Z.; Yang, P.; Zhang, C. Screening Probiotics for Anti-Helicobacter pylori and Investigating the Effect of Probiotics on Patients with Helicobacter pylori Infection. Foods 2024, 13, 1851. [Google Scholar] [CrossRef]
  28. Li, J.; Chen, C.; Yang, H.; Yang, X. Tea polyphenols regulate gut microbiota dysbiosis induced by antibiotic in mice. Food Res. Int. 2021, 141, 110153. [Google Scholar] [CrossRef]
  29. Chen, Z.; Tang, Z.; Li, W.; Deng, X.; Yu, L.; Yang, J.; Liu, J.; Cheng, Y.; Huang, W.; Guo, X.; et al. Weizmannia coagulans BCF-01: A novel gastrogenic probiotic for Helicobacter pylori infection control. Gut Microbes. 2024, 16, 2313770. [Google Scholar] [CrossRef]
  30. Chang, L.; Zhuang, J.; Meng, F.; Wang, C.; Shen, Z.; Jiang, X. Preparation and In Vitro Evaluation of Marine Oligosaccharide Coated Microcapsules Containing Probiotics and Their Regulatory Effect on Animal Intestinal Flora. Food Sci. 2019, 40, 142–150. [Google Scholar] [CrossRef]
  31. Li, M.; Yan, J.; Zhu, Y.; WeI, Y.; Cai, M.; Gu, R. Regulatory Effect of Whey Protein and Pea Protein on Mice with Intestinal Flora Disorder Caused by Antibiotics. J. Chin. Inst. Food Sci. Technol. 2021, 21, 86–95. [Google Scholar] [CrossRef]
  32. Saresella, M.; Mendozzi, L.; Rossi, V.; Mazzali, F.; Piancone, F.; LaRosa, F.; Marventano, I.; Caputo, D.; Felis, G.E.; Clerici, M. Immunological and Clinical Effect of Diet Modulation of the Gut Microbiome in Multiple Sclerosis Patients: A Pilot Study. Front. Immunol. 2017, 8, 1391. [Google Scholar] [CrossRef] [PubMed]
  33. Tao, Z.; Han, J.; Fang, J. Helicobacter pylori infection and eradication: Exploring their impacts on the gastrointestinal microbiota. Helicobacter 2020, 25, e12754. [Google Scholar] [CrossRef] [PubMed]
  34. Li, J.; Peng, F.; Huang, H.; Xu, X.; Guan, Q.; Xie, M.; Xiong, T. Characterization, mechanism and in vivo validation of Helicobacter pylori antagonism by probiotics screened from infants’ feces and oral cavity. Food Funct. 2024, 15, 1170–1190. [Google Scholar] [CrossRef]
  35. Ge, H.; Cai, Z.; Chai, J.; Liu, J.; Liu, B.; Yu, Y.; Liu, J.; Zhang, T. Egg white peptides ameliorate dextran sulfate sodium-induced acute colitis symptoms by inhibiting the production of pro-inflammatory cytokines and modulation of gut microbiota composition. Food Chem. 2021, 360, 129981. [Google Scholar] [CrossRef]
  36. Pan, M.; Wan, C.; Xie, Q.; Huang, R.; Tao, X.; Shah, N.P.; Wei, H. Changes in gastric microbiota induced by Helicobacter pylori infection and preventive effects of Lactobacillus plantarum ZDY 2013 against such infection. J. Dairy Sci. 2016, 99, 970–981. [Google Scholar] [CrossRef]
  37. Zhang, X.; Lai, Y.; Zhang, L.; Chen, Z.; Zhao, J.; Wang, S.; Li, Z. Chitosan-modified molybdenum selenide mediated efficient killing of Helicobacter pylori and treatment of gastric cancer. Int. J. Biol. Macromol. 2024, 275, 133599. [Google Scholar] [CrossRef]
  38. Zhang, S.; Ma, Y.; Feng, Y.; Wang, C.; Zhang, D. Potential effects of mung bean protein and a mung bean protein–polyphenol complex on oxidative stress levels and intestinal microflora in aging mice. Food Funct. 2022, 13, 186–197. [Google Scholar] [CrossRef]
  39. Filaly, H.E.; Outlioua, A.; Medyouf, H.; Guessous, F.; Akarid, K. Targeting IL-1β in Patients with Advanced Helicobacter Pylori Infection: A Potential Therapy for Gastric Cancer. Future Microbiol. 2022, 17, 633–641. [Google Scholar] [CrossRef]
  40. Hu, J.; Tian, X.; Wei, T.; Wu, H.; Lu, J.; Lyu, M.; Wang, S. Anti-Helicobacter pylori Activity of a Lactobacillus sp. PW-7 Exopolysaccharide. Foods 2021, 10, 2453. [Google Scholar] [CrossRef]
  41. Chen, X.; Chen, C.; Fu, X. Dendrobium officinale Polysaccharide Alleviates Type 2 Diabetes Mellitus by Restoring Gut Microbiota and Repairing Intestinal Barrier via the LPS/TLR4/TRIF/NF-kB Axis. J. Agric. Food Chem. 2023, 71, 11929–11940. [Google Scholar] [CrossRef] [PubMed]
  42. Zhao, F.; Yan, L.; Wang, P.; Zhang, K.; Hu, S. Influence of helicobacter pylori on composition and function of gastric microbiota in patients with chronic non-atrophic gastritis. Heliyon 2024, 10, e31472. [Google Scholar] [CrossRef] [PubMed]
  43. Yu, Y.; Wu, L.; Sun, X.; Gu, Q.; Zhou, Q. Effect of Lactobacillus plantarum ZFM4 in Helicobacter pylori-infected C57BL/6 mice: Prevention is better than cure. Front. Cell. Infect. Microbiol. 2024, 13, 1320819. [Google Scholar] [CrossRef] [PubMed]
  44. Trautmann, D.; Suazo, F.; Torres, K.; Simón, L. Antitumor Effects of Resveratrol Opposing Mechanisms of Helicobacter pylori in Gastric Cancer. Nutrients 2024, 16, 2141. [Google Scholar] [CrossRef] [PubMed]
  45. Singh, S.; Sharma, R.K.; Malhotra, S.; Pothuraju, R.; Shandilya, U.K. Lactobacillus rhamnosus NCDC17 ameliorates type-2 diabetes by improving gut function, oxidative stress and inflammation in high-fat-diet fed and streptozotocintreated rats. Benef. Microbes 2017, 8, 243–256. [Google Scholar] [CrossRef]
  46. Li, G.; Liu, X.; Miao, Z.; Zheng, X. Purification and structural characterization of three novel anti-adhesive peptides against Helicobacter pylori from corn gluten meal. J. Funct. Foods 2024, 112, 105992. [Google Scholar] [CrossRef]
Figure 1. CPAPs modulate the inflammatory cytokine mRNA expression level of gastric mucosa. (A) Transforming growth factor-β (TGF-β) mRNA expression levels; (B) Interleukin-10 (IL-10) mRNA expression levels; (C) Toll-like receptor 4 (TLR4) mRNA expression levels; (D) Myeloid differential protein88 (MyD88) mRNA expression levels; (E) Nuclear transcription factor-κB (NF-κB) mRNA expression levels. * denotes significant difference from NC group (p < 0.05); # denotes significant difference from HM group (p < 0.05). NC group: normal control group, HM group: H. pylori model group, KSS group: positive group, LCP group: CPAPs with low dose (200 mg/kg·bw), MCP group: CPAPs with medium dose (400 mg/kg·bw), and HCP group: CPAPs with high dose (600 mg/kg·bw).
Molecules 30 00705 g001
Figure 2. Analysis of species diversity correlation curve of the gastric microbiota. (A) Dilution curve: the dilution curve is mainly used to evaluate the abundance of species in the samples. (B) Rank-Abundance curve: a Rank-Abundance curve is a way to analyze the diversity of a sample. NC group: normal control group, HM group: H. pylori model group, KSS group: positive group, LCP group: CPAPs with low dose (200 mg/kg·bw), MCP group: CPAPs with medium dose (400 mg/kg·bw), and HCP group: CPAPs with high dose (600 mg/kg·bw).
Molecules 30 00705 g002
Figure 3. OTUs and community composition analysis of the gastric microbiota. (A) Venn diagrams. The relative abundance of the gastric microbiota at phylum level (B) and genus level (C). NC group: normal control group, HM group: H. pylori model group, KSS group: positive group, LCP group: CPAPs with low dose (200 mg/kg·bw), MCP group: CPAPs with medium dose (400 mg/kg·bw), and HCP group: CPAPs with high dose (600 mg/kg·bw).
Molecules 30 00705 g003
Figure 4. Microbiota diversity analysis of the gastric microbiota. (A) Ace index; (B) Chao index; (C) Shannon index; (D) PCoA analysis. Different lowercase letters represent significant differences (p < 0.05). NC group: normal control group, HM group: H. pylori model group, KSS group: positive group, LCP group: CPAPs with low dose (200 mg/kg·bw), MCP group: CPAPs with medium dose (400 mg/kg·bw), and HCP group: CPAPs with high dose (600 mg/kg·bw).
Molecules 30 00705 g004
Figure 5. Analysis of evolutionary branching based on LEfSe and the LDA score was 3.0 (A) at phylum level (B) and genus level (C) of the gastric microbiota. LEfSe was used to identify the enrichment and changes in microbial communities of various populations between groups. NC group: normal control group, HM group: H. pylori model group, KSS group: positive group, LCP group: CPAPs with low dose (200 mg/kg·bw), MCP group: CPAPs with medium dose (400 mg/kg·bw), and HCP group: CPAPs with high dose (600 mg/kg·bw).
Molecules 30 00705 g005
Figure 6. Analysis of species diversity correlation curve of the intestinal microbiota. (A) Dilution curve: the dilution curve is mainly used to evaluate the abundance of species in the samples. (B) Rank-Abundance curve: a Rank-Abundance curve is a way to analyze the diversity of a sample. NC group: normal control group, HM group: H. pylori model group, KSS group: positive group, LCP group: CPAPs with low dose (200 mg/kg·bw), MCP group: CPAPs with medium dose (400 mg/kg·bw), and HCP group: CPAPs with high dose (600 mg/kg·bw).
Molecules 30 00705 g006
Figure 7. Venn diagrams analysis of the intestinal microbiota (A). The relative abundance of the intestinal microbiota at phylum level (B) and genus level (C). NC group: normal control group, HM group: H. pylori model group, KSS group: positive group, LCP group: CPAPs with low dose (200 mg/kg·bw), MCP group: CPAPs with medium dose (400 mg/kg·bw), and HCP group: CPAPs with high dose (600 mg/kg·bw).
Molecules 30 00705 g007
Figure 8. Microbiota diversity analysis of the intestinal microbiota. (A) Ace index; (B) Chao index; (C) Shannon index; (D) PCoA analysis. Different lowercase letters represent significant differences (p < 0.05). NC group: normal control group, HM group: H. pylori model group, KSS group: positive group, LCP group: CPAPs with low dose (200 mg/kg·bw), MCP group: CPAPs with medium dose (400 mg/kg·bw), and HCP group: CPAPs with high dose (600 mg/kg·bw).
Molecules 30 00705 g008
Figure 9. Analysis of evolutionary branching based on LEfSe and the LDA score was 3.0 (A) at phylum level (B) and genus level (C) of the intestinal microbiota. LEfSe was used to identify the enrichment and changes in microbial communities of various populations between groups. NC group: normal control group, HM group: H. pylori model group, KSS group: positive group, LCP group: CPAPs with low dose (200 mg/kg·bw), MCP group: CPAPs with medium dose (400 mg/kg·bw), and HCP group: CPAPs with high dose (600 mg/kg·bw).
Molecules 30 00705 g009
Figure 10. Animal experiment plan. From week 1 to week 2, mice were treated with normal saline, antibiotics, and CPAPs by gavage. From week 3 to week 4, the above substances were continuously administered by gavage, and except for the control group, other groups were given H. pylori by gavage every other day. Then we continued the experiment for a week, as in the beginning. After the last dose, the mice were fasted overnight and anesthetized, and the stomachs and intestines of the mice were collected. The samples were frozen at −80 °C for analysis.
Molecules 30 00705 g010
Table 1. Functional prediction analysis of intestinal microbiota (level 1).
KEGG PathwayNCHMKSSLCPMCPHCP
Metabolism76.61 ± 1.02 a77.12 ± 0.56 a75.30 ± 2.32 a76.82 ± 1.00 a75.79 ± 0.17 a76.07 ± 0.23 a
Genetic Information Processing7.98 ± 0.07 b8.70 ± 0.42 a9.33 ± 1.14 ab8.23 ± 0.04 b8.15 ± 0.08 b7.99 ± 0.10 b
Environmental Information Processing6.68 ± 0.35 ab6.11 ± 0.42 b6.31 ± 0.32 b6.16 ± 0.51 ab6.75 ± 0.12 b7.10 ± 0.50 a
Cellular Processes4.16 ± 0.45 ab3.62 ± 0.36 ab4.27 ± 0.65 b4.08 ± 0.42 a4.55 ± 0.05 ab4.35 ± 0.11 ab
Human Diseases2.96 ± 0.15 a2.91 ± 0.10 a3.19 ± 0.47 a3.07 ± 0.12 a3.11 ± 0.03 a2.96 ± 0.06 a
Organismal Systems1.58 ± 0.03 a1.50 ± 0.09 a1.59 ± 0.13 a1.65 ± 0.06 a1.65 ± 0.04 a1.53 ± 0.10 a
Different lowercase letters represent significant differences (p < 0.05). NC group: normal control group, HM group: H. pylori model group, KSS group: positive group, LCP group: CPAPs with low dose (200 mg/kg·bw), MCP group: CPAPs with medium dose (400 mg/kg·bw), HCP group: CPAPs with high dose (600 mg/kg·bw), and KEGG: Kyoto Encyclopedia of Genes and Genomes.
Table 2. Functional prediction analysis of intestinal microbiota (level 2).
KEGG PathwayNCHMKSSLCPMCPHCP
Energy metabolism4.18 ± 0.20 b4.96 ± 0.56 a4.58 ± 0.55 ab4.18 ± 0.28 b4.05 ± 0.03 b4.15 ± 0.11 b
Membrane transport4.11 ± 0.34 ab3.54 ± 0.47 b3.54 ± 0.41 b3.65 ± 0.50 b4.18 ± 0.11 ab4.52 ± 0.43 a
Metabolism of cofactors and vitamins3.96 ± 0.03 a3.79 ± 0.02 ab3.61 ± 0.26 b3.93 ± 0.10 a3.87 ± 0.04 a3.85 ± 0.07 a
Translation3.36 ± 0.05 b3.73 ± 0.20 ab3.99 ± 0.51 a3.48 ± 0.02 b3.43 ± 0.04 b3.34 ± 0.05 b
Replication and repair2.98 ± 0.06 b3.24 ± 0.12 ab3.53 ± 0.51 a3.08 ± 0.05 b3.11 ± 0.04 b3.03 ± 0.04 b
Nucleotide metabolism2.65 ± 0.05 b2.76 ± 0.06 a2.71 ± 0.03 ab2.76 ± 0.05 a2.72 ± 0.03 ab2.68 ± 0.07 ab
Signal transduction2.57 ± 0.03 b2.57 ± 0.08 b2.78 ± 0.12 a2.51 ± 0.04 b2.56 ± 0.05 b2.58 ± 0.07 b
Cellular community—prokaryotes2.25 ± 0.19 ab1.94 ± 0.18 c1.97 ± 0.15 c2.10 ± 0.11 bc2.27 ± 0.04 ab2.39 ± 0.14 a
Lipid metabolism1.84 ± 0.06 ab1.72 ± 0.05 b1.92 ± 0.21 ab1.96 ± 0.15 a1.84 ± 0.01 ab1.76 ± 0.06 ab
Folding, sorting, and degradation1.47 ± 0.02 c1.57 ± 0.08 ab1.59 ± 0.09 a1.49 ± 0.04 bc1.45 ± 0.01 c1.45 ± 0.02 c
Metabolism of other amino acids1.24 ± 0.08 ab1.27 ± 0.05 ab1.38 ± 0.12 a1.31 ± 0.13 ab1.20 ± 0.00 b1.18 ± 0.02 b
Cell motility0.98 ± 0.24 ab0.78 ± 0.13 b1.34 ± 0.50 a0.93 ± 0.32 ab1.25 ± 0.08 ab1.03 ± 0.09 ab
Infectious disease: bacterial0.69 ± 0.01 b0.73 ± 0.04 ab0.91 ± 0.26 a0.69 ± 0.03 b0.71 ± 0.03 b0.64 ± 0.02 b
Endocrine system0.57 ± 0.02 ab0.51 ± 0.07 bc0.47 ± 0.06 c0.60 ± 0.04 a0.59 ± 0.02 ab0.56 ± 0.04 ab
Aging0.28 ± 0.05 ab0.25 ± 0.01 ab0.30 ± 0.05 a0.30 ± 0.04 ab0.27 ± 0.01 ab0.24 ± 0.00 b
Environmental adaptation0.21 ± 0.01 ab0.20 ± 0.01 ab0.26 ± 0.06 a0.23 ± 0.01 ab0.23 ± 0.01 ab0.20 ± 0.02 b
Transport and catabolism0.19 ± 0.02 ab0.17 ± 0.03 b0.19 ± 0.06 ab0.27 ± 0.05 a0.24 ± 0.03 ab0.19 ± 0.06 ab
Transcription0.17 ± 0.01 b0.19 ± 0.01 ab0.21 ± 0.04 a0.17 ± 0.01 b0.16 ± 0.01 b0.16 ± 0.00 b
Cardiovascular disease0.15 ± 0.01 b0.17 ± 0.01 a0.14 ± 0.02 ab0.15 ± 0.01 ab0.16 ± 0.00 ab0.16 ± 0.01 ab
Neurodegenerative disease0.12 ± 0.01 a0.11 ± 0.00 ab0.13 ± 0.00 a0.14 ± 0.02 a0.12 ± 0.00 ab0.10 ± 0.01 b
Different lowercase letters represent significant differences (p < 0.05). NC group: normal control group, HM group: H. pylori model group, KSS group: positive group, LCP group: CPAPs with low dose (200 mg/kg·bw), MCP group: CPAPs with medium dose (400 mg/kg·bw), HCP group: CPAPs with high dose (600 mg/kg·bw), and KEGG: Kyoto Encyclopedia of Genes and Genomes.
Table 3. Primer information of qRT-PCR experiment.
GeneForwardReverseGene ID
β-actinATCCGGACCCTCCATTGTCAGCCATGCCAATCTCGTCTT11461
TGF-βACCTCGACACCGACTACTGCTTACTCTTGCGGAAGTCGATGT21812
IL-10CGGGAGCTGAGGGTGAAGTGAAGAAGCGGTGACAGC16153
TLR4GTTCCTGCTGAAATCCCAAATATGGATGTGGCACCTTGAA21898
MyD88TGATGCCTTCATCTGCTACTGTCCCTCCGACACCTTCTTTCT17874
NF-κBGTGTGAAGAAACGGGAACTGGGCACGGTTGTCATAGATGG18033
Disclaimer/Publisher’s Note: The statements, opinions and data contained in all publications are solely those of the individual author(s) and contributor(s) and not of MDPI and/or the editor(s). MDPI and/or the editor(s) disclaim responsibility for any injury to people or property resulting from any ideas, methods, instructions or products referred to in the content.

