
Hydroxide and Hydrophobic Tetrabutylammonium Ions at the Hydrophobe–Water Interface


Abstract
:
1. Introduction
1.1. Hydrophobic Water Interfaces
1.1.1. Air–Water Interface
1.1.2. Teflon–Water Interface
1.1.3. Surface Tension
1.1.4. On-Water Catalysis
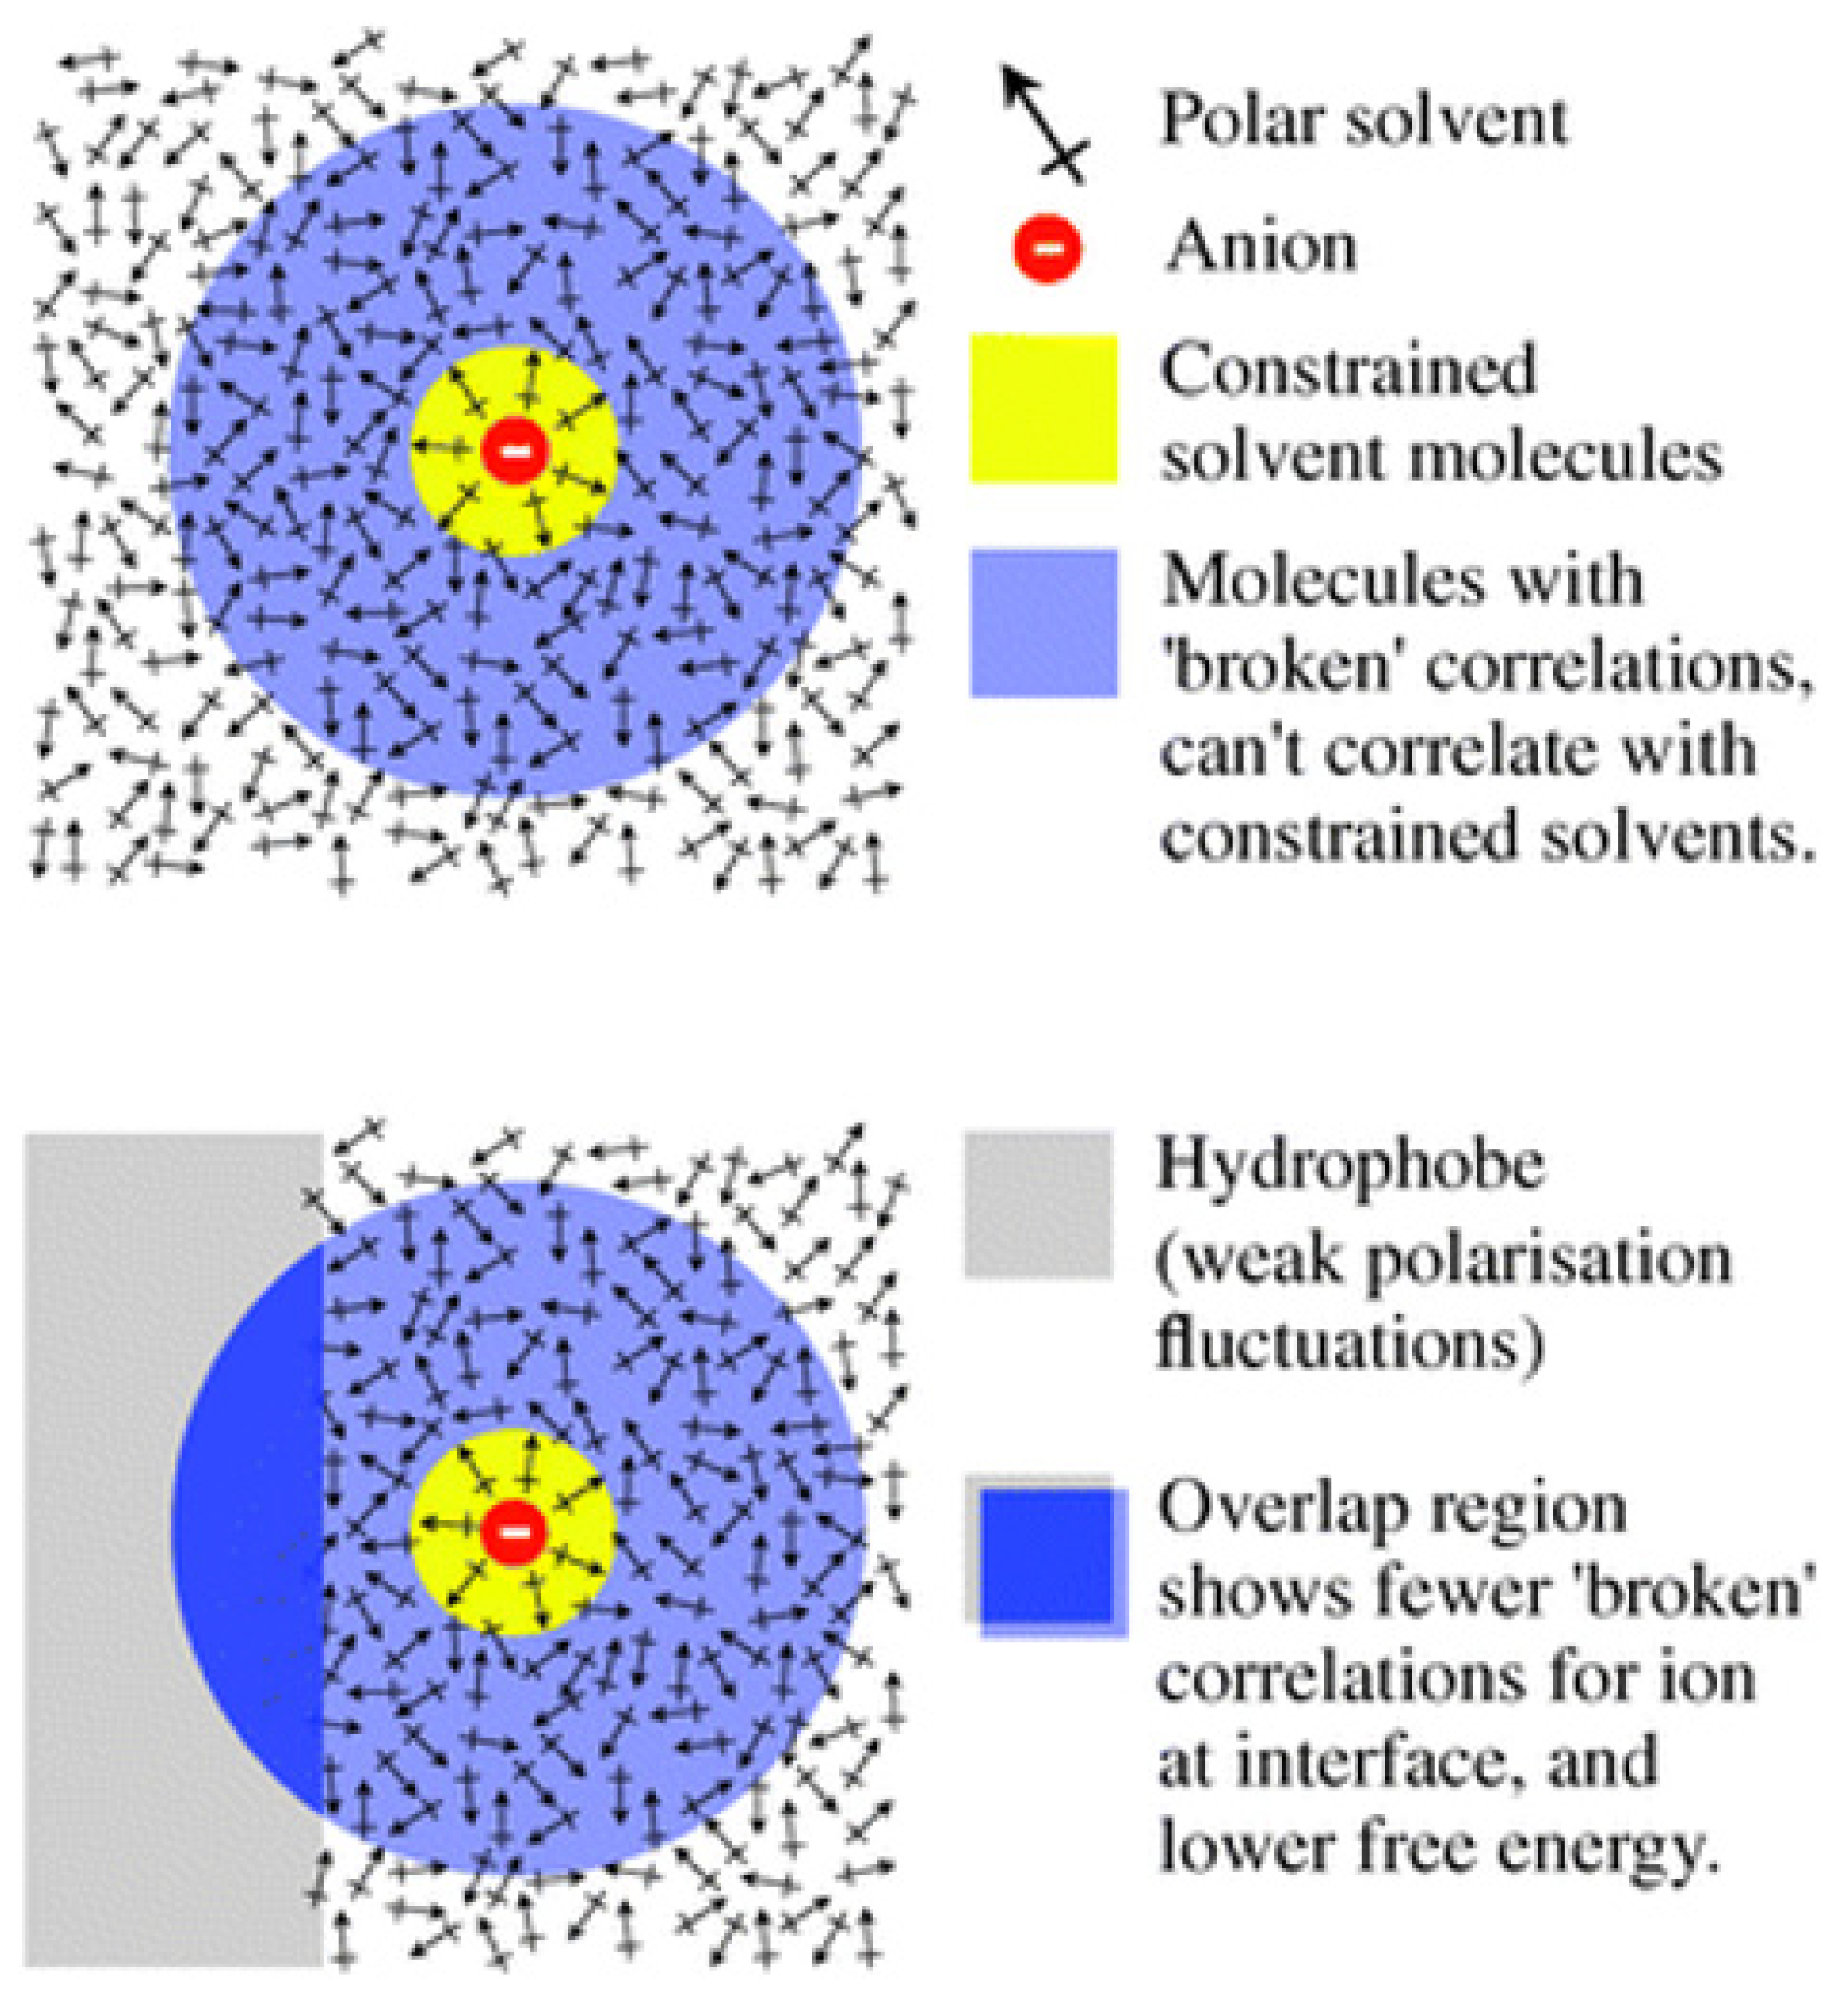
1.2. Fluctuation Mechanism
2. Results
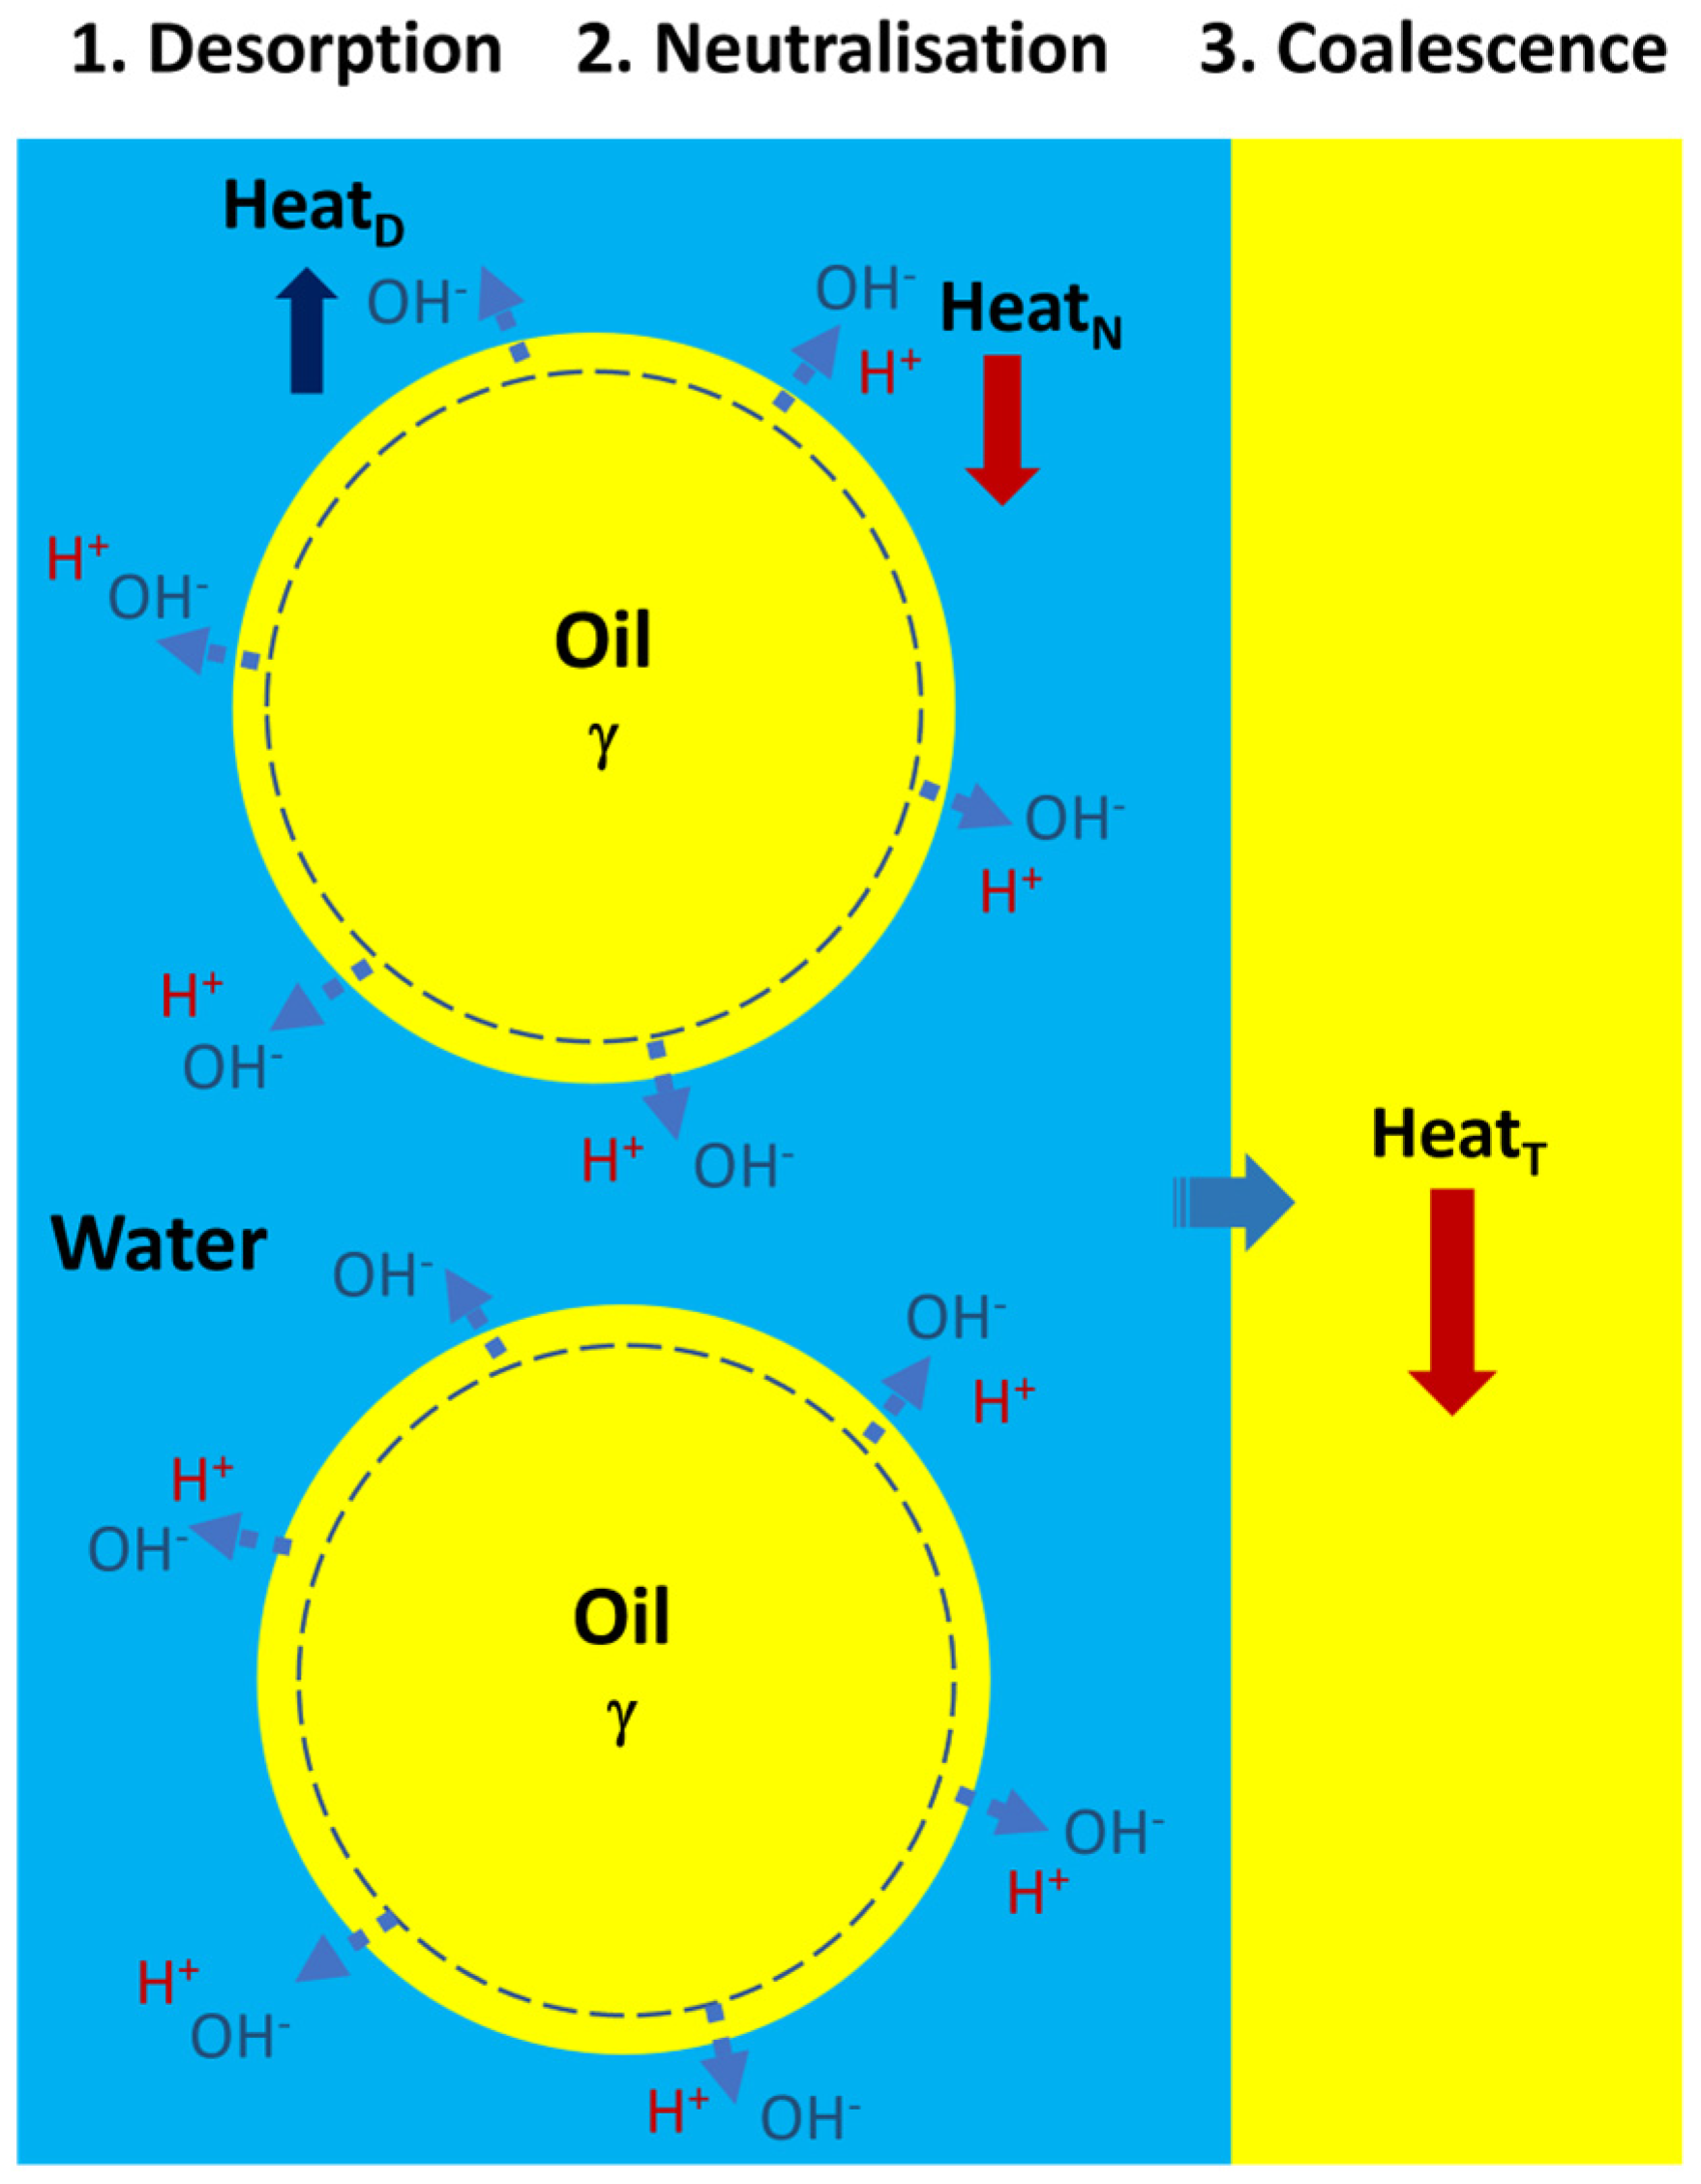
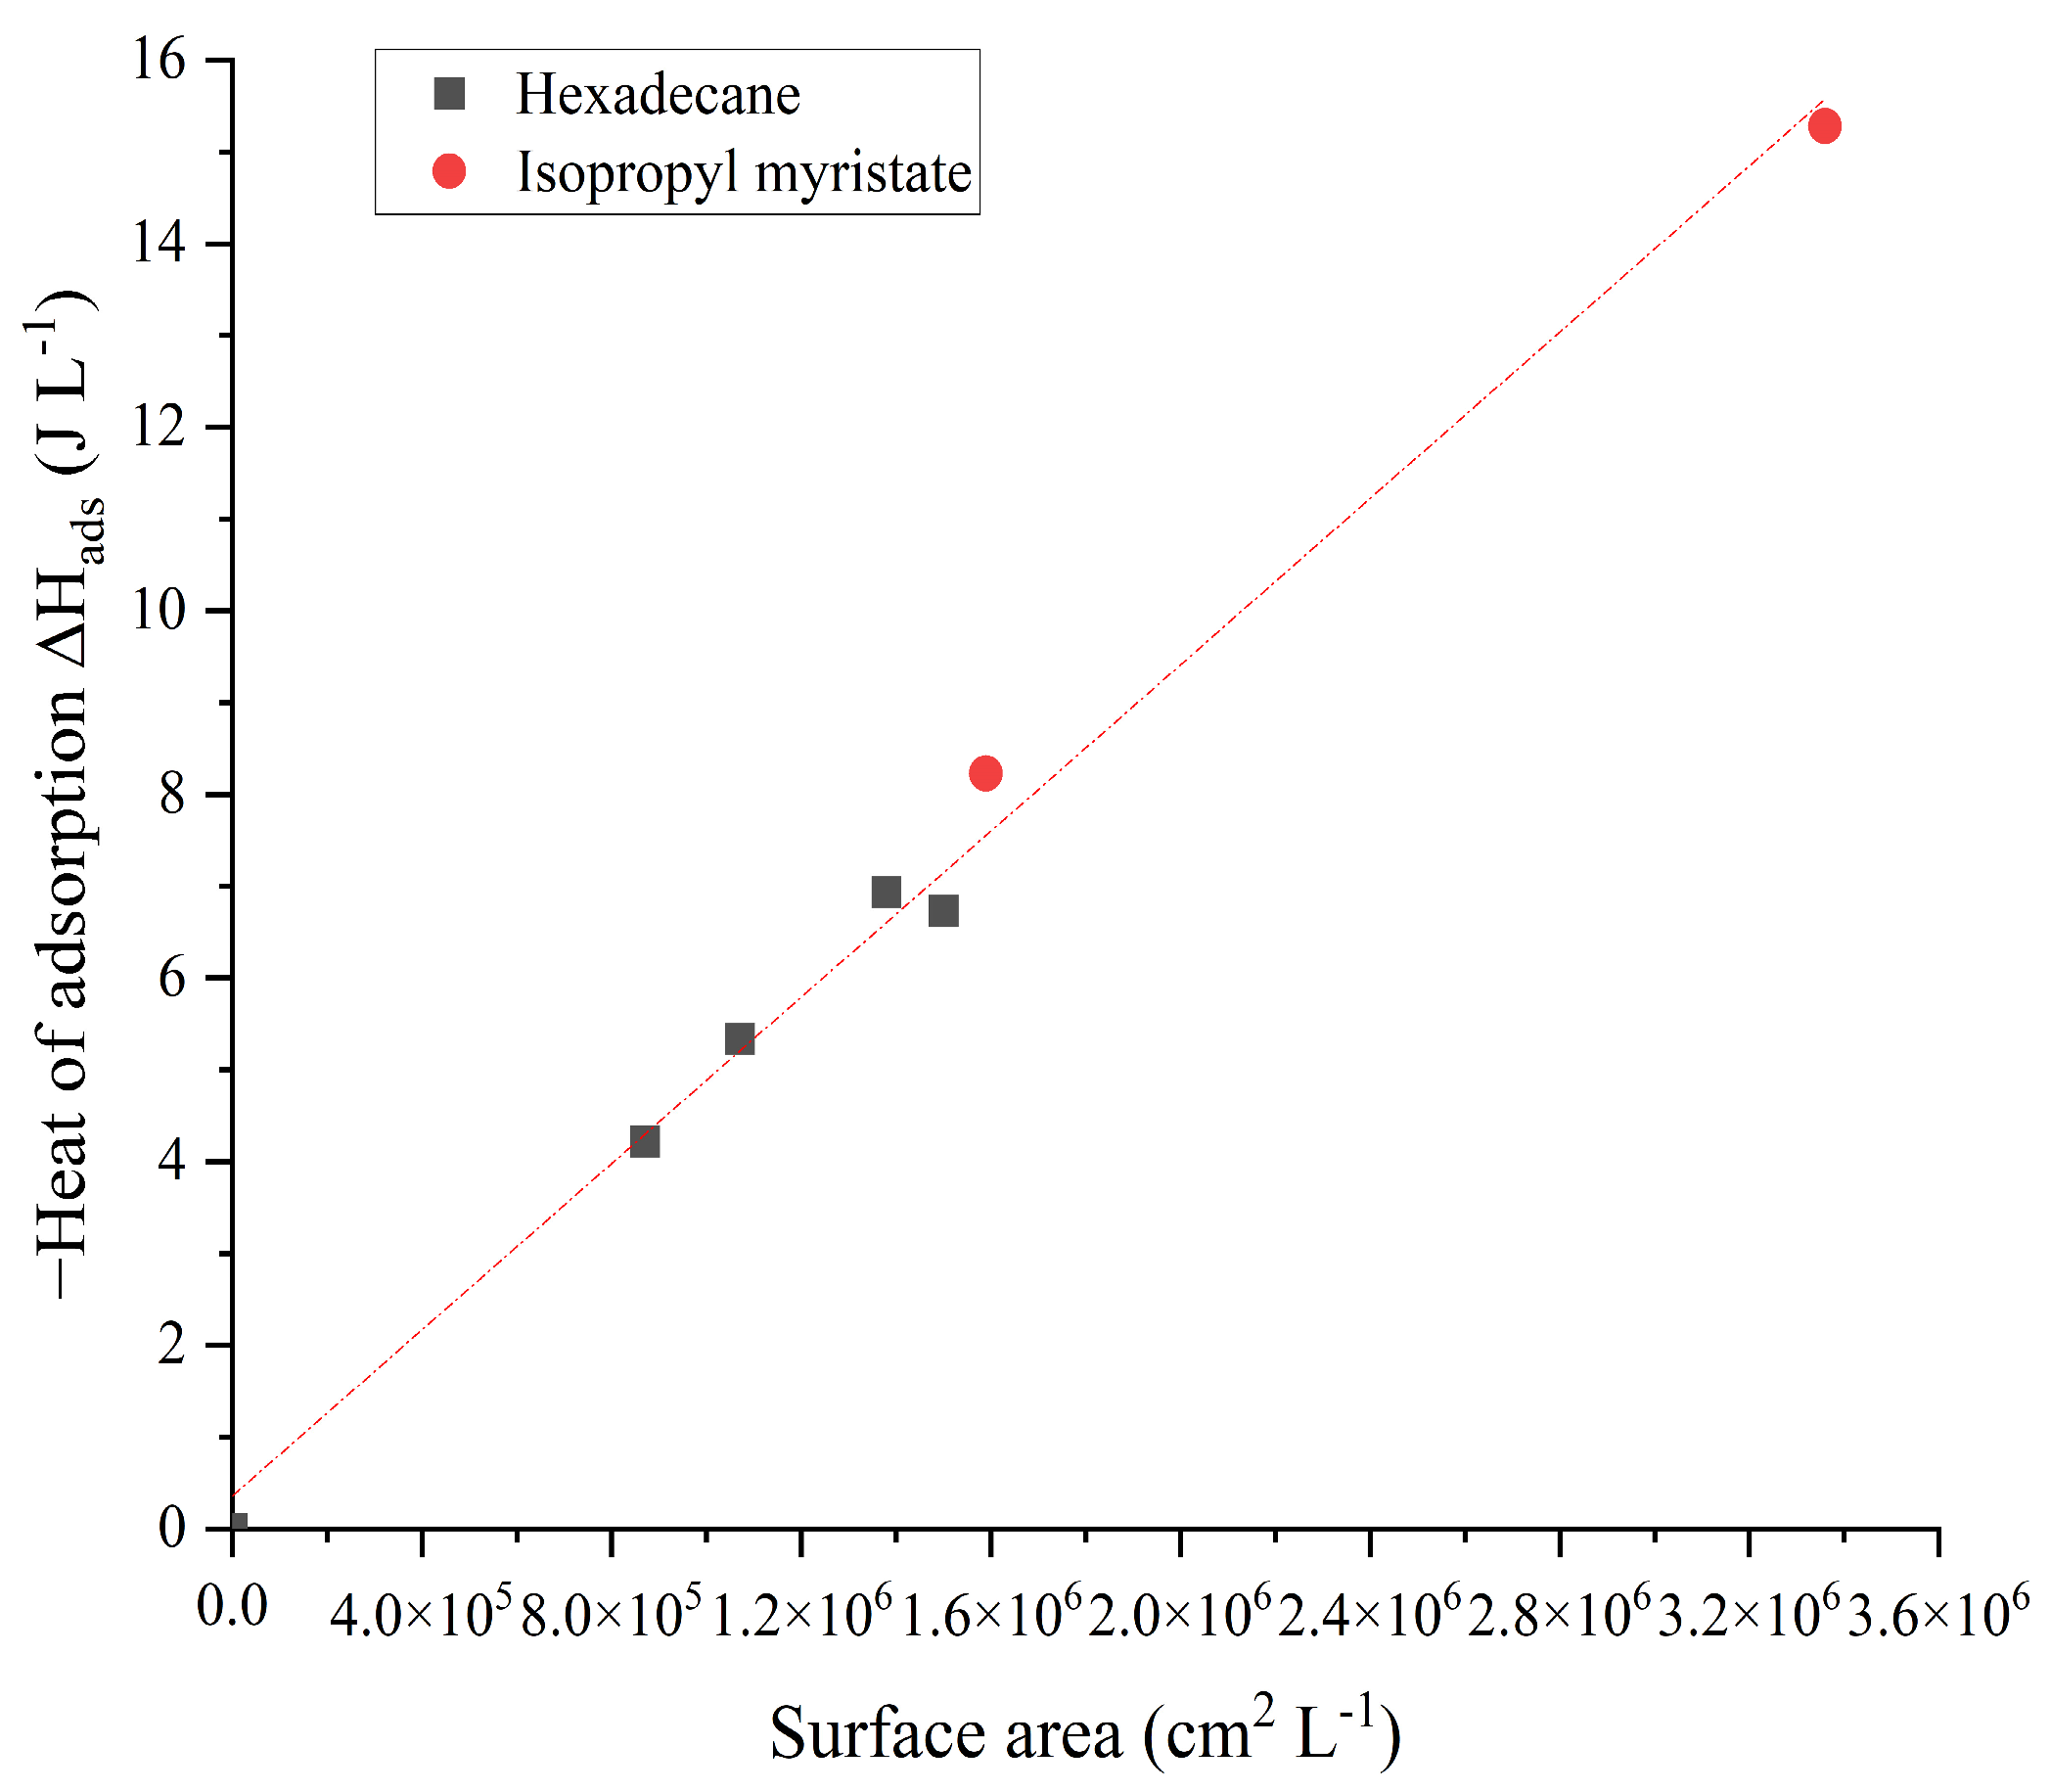
2.1. Thermochemistry of Pristine Emulsions
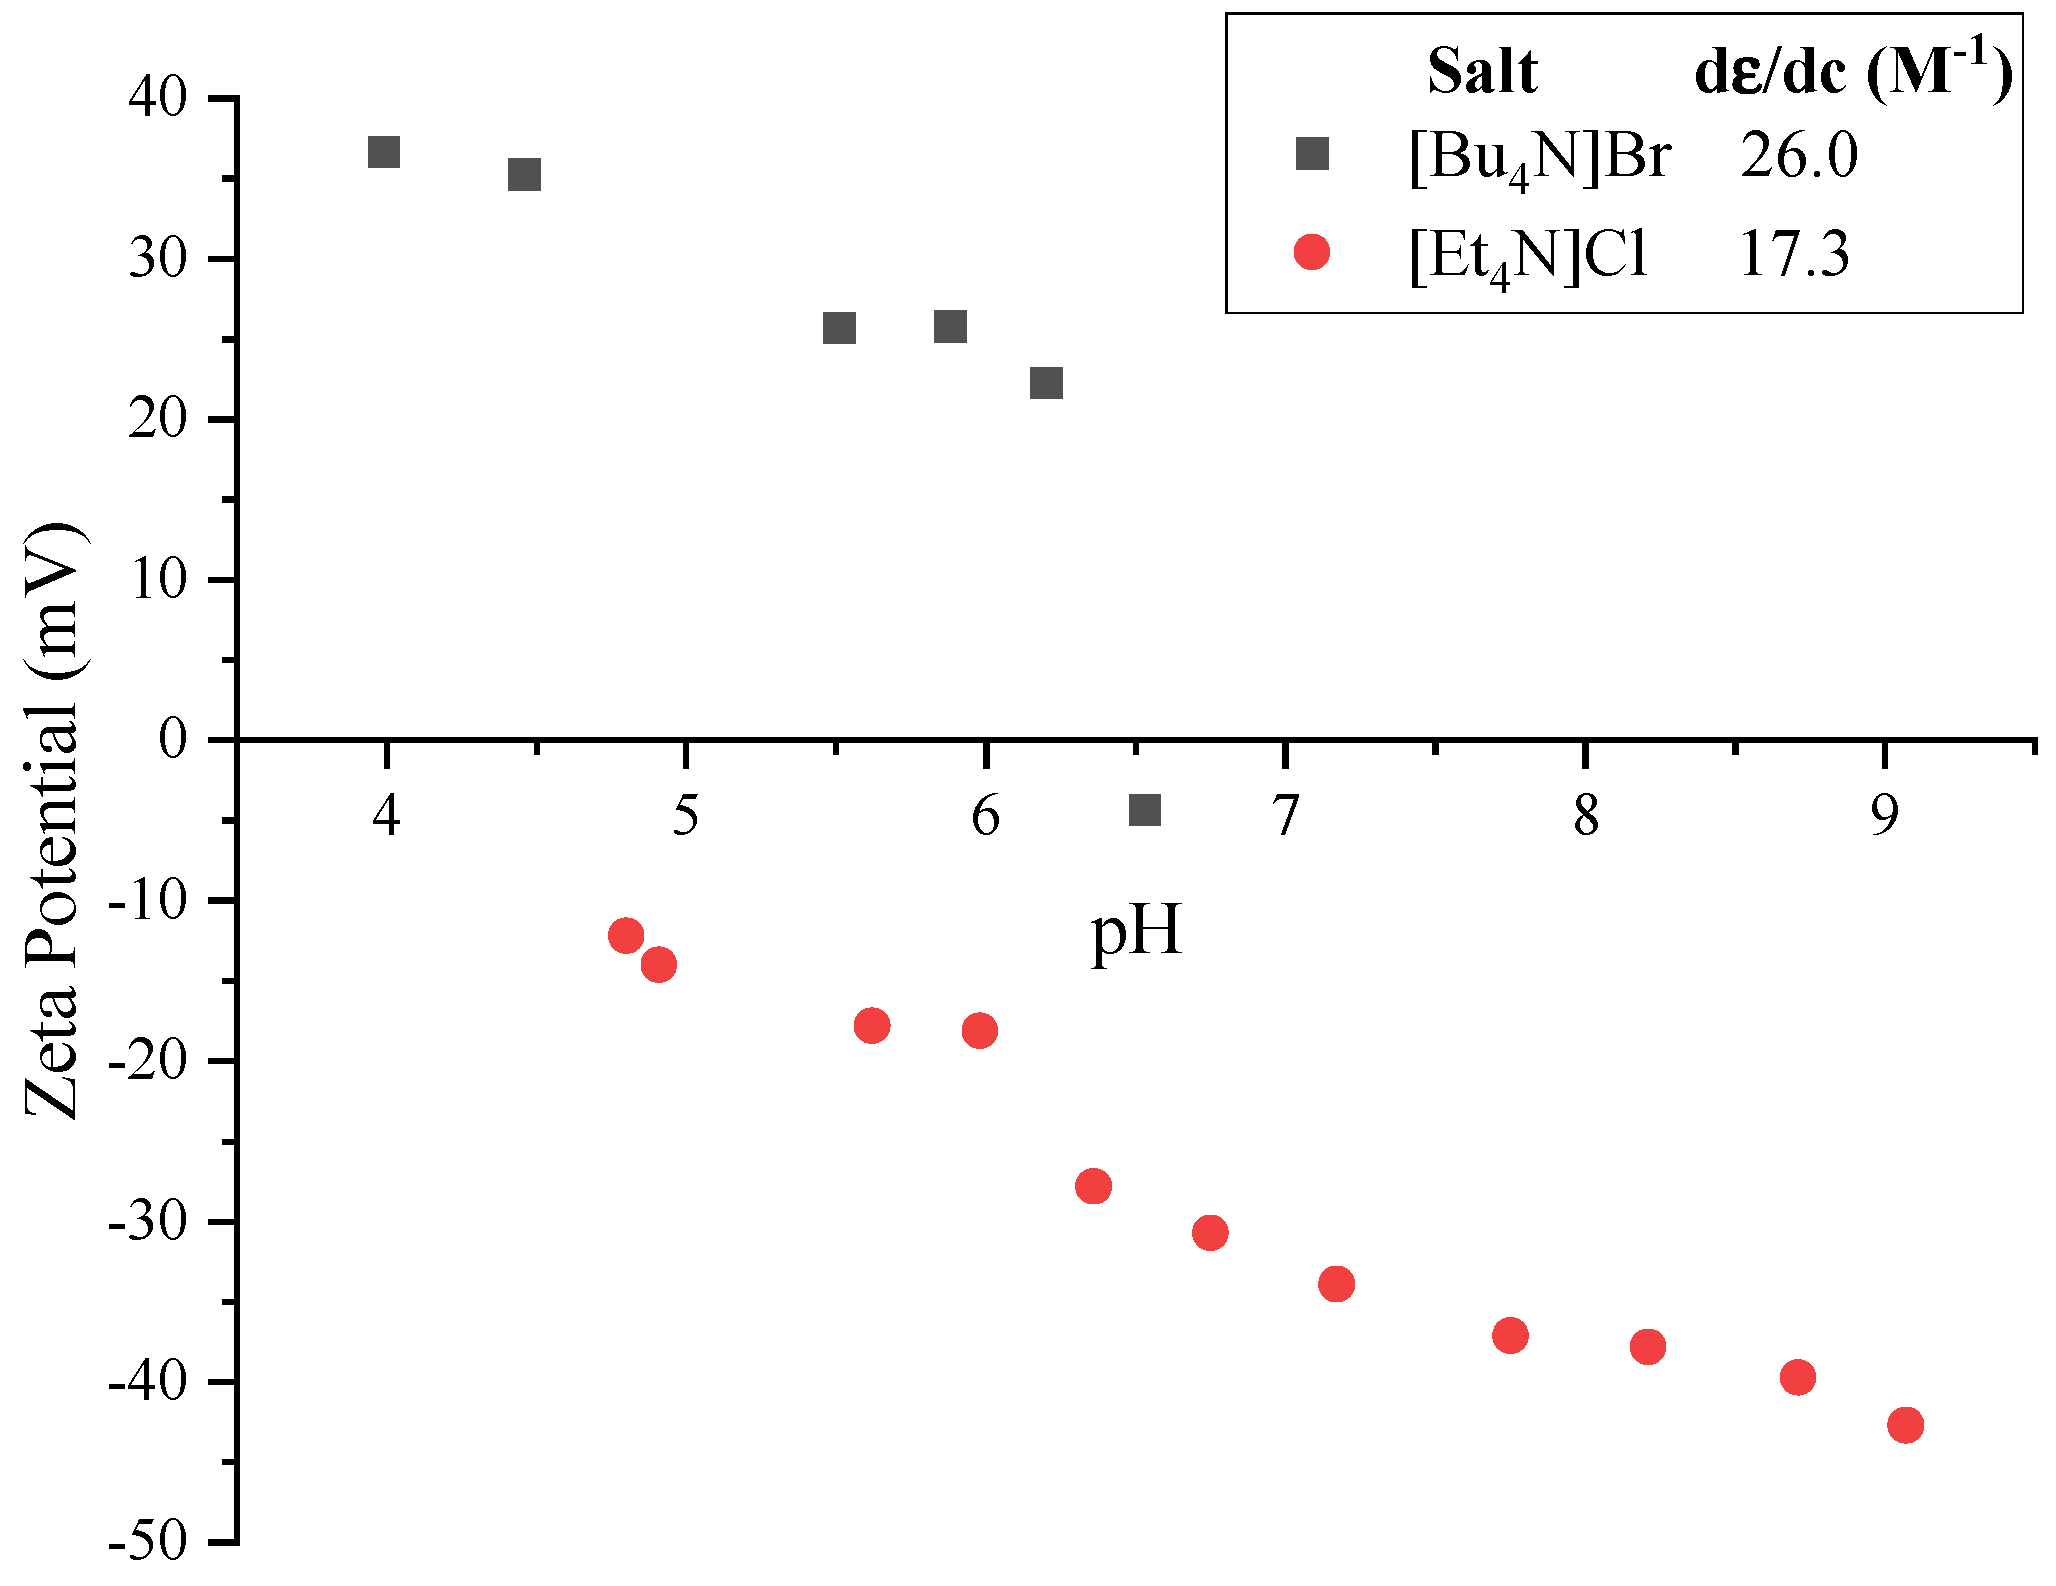
2.2. Adsorption of Alkylammonium Salts
3. Discussion
3.1. Importance of the Hydroxide Ion
3.2. Hydrophobic Ions
4. Materials and Methods
5. Conclusions
Author Contributions
Funding
Institutional Review Board Statement
Informed Consent Statement
Data Availability Statement
Acknowledgments
Conflicts of Interest
References
- Quincke, G. Ueber Die Fortführung Materieller Theilchen Durch Strömende Elektricität. Ann. Phys. 1861, 189, 513–598. [Google Scholar] [CrossRef]
- Lewis, W.C.M. The Electric Charge at an Oil-Water Interface. Trans. Faraday Soc. 1937, 33, 708–713. [Google Scholar] [CrossRef]
- Carruthers, J.C. The Electrophoresis of Certain Hydrocarbons and Their Simple Derivatives as a Function of pH. Trans. Faraday Soc. 1938, 34, 300–307. [Google Scholar] [CrossRef]
- Marinova, K.G.; Alargova, R.G.; Denkov, N.D.; Velev, O.D.; Petsev, D.N.; Ivanov, I.B.; Borwankar, R.P. Charging of Oil-Water Interfaces Due to Spontaneous Adsorption of Hydroxyl Ions. Langmuir 1996, 12, 2045–2051. [Google Scholar] [CrossRef]
- Beattie, J.K. The Intrinsic Charge on Hydrophobic Microfluidic Substrates. Lab Chip 2006, 6, 1409–1411. [Google Scholar] [CrossRef] [PubMed]
- Feldman, K.; Hahner, G.; Spencer, N.D.; Harder, P.; Grunze, M. Probing Resistance to Protein Adsorption of Oligo(ethylene glycol)-Terminated Self-Assembled Monolayers by Scanning Force Microscopy. J. Am. Chem. Soc. 1999, 121, 10134–10141. [Google Scholar] [CrossRef]
- Stubenrauch, C.; Schlarmann, J.; Strey, R. A Disjoining Pressure Study of n-Dodecyl-β-D-Maltoside Foam Films. Phys. Chem. Chem. Phys. 2002, 4, 4504–4513. [Google Scholar] [CrossRef]
- Dickinson, W. The Effect of PH upon the Electrophoretic Mobility of Emulsions of Certain Hydrocarbons and Aliphatic Halides. Trans. Faraday Soc. 1941, 37, 140–148. [Google Scholar] [CrossRef]
- Dukhin, A.; Xu, R. A New Approach to Explaining Nano-Bubbles Paradoxical Longevity. Colloids Surf. A Physiochem. Eng. Asp. 2024, 700, 134805. [Google Scholar] [CrossRef]
- Xiong, H.; Lee, J.K.; Zare, R.N.; Min, W. Strong Electric Field Observed at the Interface of Aqueous Microdroplets. J. Phys. Chem. Lett. 2020, 11, 7423–7428. [Google Scholar] [CrossRef] [PubMed]
- Beattie, J.K.; Djerdjev, A.M. The Pristine Oil/Water Interface: Surfactant-Free Hydroxide-Charged Emulsions. Angew. Chem. Int. Ed. 2004, 43, 3568–3571. [Google Scholar] [CrossRef] [PubMed]
- Li, M.; Ma, X.; Eisener, J.; Pfeiffer, P.; Ohl, C.-D.; Sun, C. How Bulk Nanobubbles Are Stable over a Wide Range of Temperatures. J. Colloid Interface Sci. 2021, 596, 184–198. [Google Scholar] [CrossRef]
- Reddy, S.R.; Fogler, H.S. Emulsion Stability of Acoustically Formed Emulsions. J. Phys. Chem. 1980, 84, 1570–1575. [Google Scholar] [CrossRef]
- Iyota, H.; Krastev, R. Equilibrium Thickness of Foam Films and Adsorption of Ions at Surfaces: Water and Aqueous Solutions of Sodium Chloride, Hydrochloric Acid, and Sodium Hydroxide. J. Colloid Interface Sci. 2020, 565, 405–415. [Google Scholar] [CrossRef]
- Karakashev, S.I.; Grozev, N.A. The law of parsimony and the negative charge of the bubbles. Coatings 2020, 10, 1003. [Google Scholar] [CrossRef]
- Yang, S.; Chen, M.; Su, Y.; Xu, J.; Wu, X.; Tia, C. Stabilisation of hydroxide ions at the interface of a hydrophobic monolayer on water via reduced proton transfer. Phys. Rev. Lett. 2020, 125, 156803. [Google Scholar] [CrossRef] [PubMed]
- Gan, W.; Wei, W.; Yang, F.; Hu, D.; Fang, H.; Lan, Z.; Yuan, Q. The Behavior of Hydroxide and Hydronium Ions at the Hexadecane-Water Interface Studied with Second Harmonic Generation and Zeta Potential Measurements. Soft Matter 2017, 13, 7962–7968. [Google Scholar] [CrossRef]
- Vácha, R.; Buch, V.; Milet, A.; Devlin, J.P.; Jungwirth, P. Autoionization at the Surface of Neat Water: Is the Top Layer pH Neutral, Basic, or Acidic? Phys. Chem. Chem. Phys. 2007, 9, 4736–4747. [Google Scholar] [CrossRef]
- Winter, B.; Faubel, M.; Vácha, R.; Jungwirth, P. Behavior of Hydroxide at the Water/Vapor Interface. Chem. Phys. Lett. 2009, 474, 241–247. [Google Scholar] [CrossRef]
- Mamatkulov, S.I.; Allolio, C.; Netz, R.R.; Bonthuis, D.J. Orientation-Induced Adsorption of Hydrated Protons at the Air-Water Interface. Angew. Chem. Int. Ed. 2017, 56, 15846–15851. [Google Scholar] [CrossRef]
- Buch, V.; Milet, A.; Vácha, R.; Jungwirth, P.; Devlin, J.P. Water Surface Is Acidic. Proc. Natl. Acad. Sci. USA 2007, 104, 7342–7347. [Google Scholar] [CrossRef]
- Manciu, M.; Ruckenstein, E. Ions near the Air/Water Interface. II: Is the Water/Air Interface Acidic or Basic? Predictions of a Simple Model. Colloids Surf. A Physicochem. Eng. Asp. 2012, 404, 93–100. [Google Scholar] [CrossRef]
- Baer, M.D.; Kuo, I.-F.W.; Tobias, D.J.; Mundy, C.J. Toward a Unified Picture of the Water Self-Ions at the Air-Water Interface: A Density Functional Theory Perspective. J. Phys. Chem. B 2014, 118, 8364–8372. [Google Scholar] [CrossRef]
- Bai, C.; Herzfeld, J. Surface Propensities of the Self-Ions of Water. Surface Propensities of the Self-Ions of Water. ACS Cent. Sci. 2016, 2, 225–231. [Google Scholar] [CrossRef]
- Kudin, K.N.; Car, R. Why are Water-Hydrophobic Interfaces Charged? J. Am. Chem. Soc. 2008, 130, 3915–3919. [Google Scholar] [CrossRef]
- Tian, C.; Shen, Y. Structure and Charging of Hydrophobic Material/Water Interfaces Studied by Phase-Sensitive Sum-Frequency Vibrational Spectroscopy. Proc. Natl. Acad. Sci. USA 2009, 106, 15148–15153. [Google Scholar] [CrossRef] [PubMed]
- Poli, E.; Jong, K.H.; Hassanali, A. Charge Transfer as a Ubiquitous Mechanism in Determining the Negative Charge at Hydrophobic Interfaces. Nat. Commun. 2020, 11, 901. [Google Scholar] [CrossRef]
- Samson, J.-S.; Scheu, R.; Smolentsev, N.; Rick, S.W.; Roke, S. Sum Frequency Spectroscopy of the Hydrophobic Nanodroplet/Water Interface: Absence of Hydroxyl Ion and Dangling OH Bond Signatures. Chem. Phys. Lett. 2014, 615, 124–131. [Google Scholar] [CrossRef]
- Pullanchery, S.; Kulik, S.; Rehl, B.; Hassanali, A.; Roke, S. Charge Transfer across C–H···O Hydrogen Bonds Stabilizes Oil Droplets in Water. Science 2021, 374, 1366–1370. [Google Scholar] [CrossRef]
- Perrin, L.; Desobry-Banon, S.; Gillet, G.; Desobry, S. Review of High-Frequency Ultrasounds Emulsification Methods and Oil/Water Interfacial Organization in Absence of Any Kind of Stabiliser. Foods 2022, 11, 2194. [Google Scholar] [CrossRef] [PubMed]
- Beattie, J.K. The Intrinsic Charge at the Hydrophobe/Water Interface. In Colloid Stability; Tadros, T.F., Ed.; Wiley-VCH: Weinheim, Germany, 2010; Volume 2, Chapter 5; pp. 153–164. [Google Scholar]
- Preocanin, T.; Selmani, A.; Lindqvist-Reis, P.; Heberling, F.; Kallay, N.; Lutzenkirchen, N. Surface Charge at Teflon/Aqueous Solution of Potassium Chloride Interfaces. J. Colloids Surf. A 2012, 412, 120–128. [Google Scholar] [CrossRef]
- Beattie, J.K.; Djerdjev, A.M.; Gray-Weale, A.; Kallay, N.; Lutzenkirchen, N.; Preocanin, T.; Selmani, A. pH and the Surface Tension of Water. J. Colloid Interface Sci. 2014, 422, 54–57. [Google Scholar] [CrossRef] [PubMed]
- Hauner, I.M.; Deblais, A.; Beattie, J.K.; Kellay, H.; Bonn, D. The Dynamic Surface Tension of Water. J. Phys. Chem. Lett. 2017, 8, 1599–1603. [Google Scholar] [CrossRef] [PubMed]
- Narayan, S.; Muldoon, J.; Finn, M.G.; Fokin, V.V.; Kolb, H.C.; Sharpless, K.B. “On Water”: Unique Reactivity of Organic Compounds in Aqueous Suspension. Angew. Chem. Int. Ed. 2005, 44, 3275–3279. [Google Scholar] [CrossRef]
- Chanda, A.; Fokin, V.V. Organic Synthesis “On Water”. Chem. Rev. 2009, 109, 725–748. [Google Scholar] [CrossRef]
- Gray-Weale, A.; Beattie, J.K. An Explanation for the Charge on Water’s Surface. Phys. Chem. Chem. Phys. 2009, 11, 10994–11005. [Google Scholar] [CrossRef]
- Beattie, J.K.; McErlean, C.S.P.; Phippen, C.B.W. The Mechanism of On-Water Catalysis. Chem. A Eur. J. 2010, 16, 8972–8974. [Google Scholar] [CrossRef]
- Yamaguchi, S.; Kundu, A.; Sen, P.; Tahara, T. Communication: Quantitative Estimate of the Water Surface pH using Heterodyne Detected Electronic Sum Frequency Generation. J. Chem. Phys. 2012, 137, 151101. [Google Scholar] [CrossRef]
- Buchner, R.; Holzl, C.; Stauber, J.; Barthel, J. Dielectric Spectroscopy of Ion-Pairing and Hydration in Aqueous Tetra-n-alkylammonium Halide Solutions. Phys. Chem. Chem. Phys. 2002, 4, 2169–2179. [Google Scholar] [CrossRef]
- Buchner, R.; Hefter, G.T.; May, P.M. Dielectric Relaxation of Aqueous NaCl Solutions. J. Phys. Chem. A 1999, 103, 1–9. [Google Scholar] [CrossRef]
- Tamaki, K. Surface Activity of Tetra-n-alkylammonium Halides in Aqueous Solutions. Bull. Chem. Soc. Jpn. 1974, 47, 2764–2767. [Google Scholar] [CrossRef]
- Creux, P.; Lachaise, J.; Graciaa, A.; Beattie, J.K.; Djerdjev, A.M. Strong Specific Hydroxide Ion Binding at the Pristine Oil/Water and Air/Water Interfaces. J. Phys. Chem. B 2009, 113, 14146–14150. [Google Scholar] [CrossRef]
- Beattie, J.K.; Creux, P.; Grey-Weale, A. Sodium Fluoride at the Air/Water Interface. Aust. J. Chem. 2011, 64, 1580–1582. [Google Scholar] [CrossRef]
- Lileev, A.S.; Loginova, D.V.; Lyashchenko, A.K. Dielectric Properties of Aqueous Hydrochloric Acid Solutions. Mendeleev Commun. 2007, 17, 364–365. [Google Scholar] [CrossRef]
- Chen, M.; Zheng, L.; Santra, B.; Ko, H.-Y.; DiStasio, R.A., Jr.; Klein, M.L.; Car, R.; Wu, X. Hydroxide Diffuses Slower than Hydronium in Water Because its Solvated Structure Inhibits Correlated Proton Transfer. Nat. Chem. 2018, 10, 413–419. [Google Scholar] [CrossRef]
- Stoyanov, E.S.; Stoyanova, I.V.; Reed, C.A. The Unique Nature of H+ in Water. Chem. Sci. 2011, 2, 462–467. [Google Scholar] [CrossRef]
- Cheng, J.; Hoffmann, M.R.; Colussi, A.J. Anion Fractionation and Reactivity at Air/Water: Methanol Interfaces. Implications for the Origin of Hofmeister Effects. J. Phys. Chem. B Lett. 2008, 112, 7157–7161. [Google Scholar] [CrossRef]
- Cheng, J.; Vecitis, C.D.; Hoffmann, M.R.; Colussi, A.J. Experimental Anion Affinities for the Air/Water Interface. J. Phys. Chem. B Lett. 2006, 110, 25598–25602. [Google Scholar] [CrossRef]
- Creux, P.; Lachaise, J.; Graciaa, A.; Beattie, J.K. Specific Cation Effects at the Hydroxide-Charged Air/Water Interface. J. Phys. Chem. C 2007, 111, 3753–3755. [Google Scholar] [CrossRef]
- Fawcett, W.R.; Tikanen, A.C. Role of Solvent Permittivity in Estimation of Electrolyte Activity Coefficients on the Basis of the Mean Spherical Approximation. J. Phys. Chem. 1996, 100, 4251–4255. [Google Scholar] [CrossRef]
- Marcus, Y.; Hefter, G.; Pang, T.-S. Ionic Partial Molar Volumes in Non-Aqueous Solvents. J. Chem. Soc. Faraday Trans. I 1994, 90, 1899–1903. [Google Scholar] [CrossRef]
- Winter, B.; Weber, R.; Schmidt, P.M.; Hertel, I.V.; Faubel, M.; Vrbka, L.; Jungwirth, P. Molecular Structure of Surface-Active Salt Solutions: Photoelectron Spectroscopy and Molecular Dynamics Simulations of Aqueous Tetrabutylammonium Iodide. J. Phys. Chem. B 2004, 108, 14558–14564. [Google Scholar] [CrossRef]
- Petersen, P.B.; Saykally, R.J. Is the Liquid Water Surface Basic or Acidic? Macroscopic vs. Molecular-scale Investigations. Chem. Phys. Lett. 2008, 458, 255–261. [Google Scholar] [CrossRef]
- Buchner, R.; Hefter, G.T.; May, P.M.; Sipos, P. Dielectric Relaxation of Dilute NaOH, NaAl(OH)4, and NaB(OH)4. J. Phys. Chem. B 1999, 103, 11186–11190. [Google Scholar] [CrossRef]
- Schmitt, U.W.; Voth, G.A. The Compute Simulation of Proton Transport in Water. J. Chem. Phys. 1999, 111, 9361–9381. [Google Scholar] [CrossRef]
- Healy, T.W.; Fuerstenau, D.W. The Isoelectric Point/Point-of Zero-Charge of Interfaces Formed by Aqueous Solutions and Nonpolar Solids, Liquids, and Gases. J. Colloid Interface Sci. 2007, 309, 183–188. [Google Scholar] [CrossRef] [PubMed]
- Schchipunov, Y.A. Hydrophobic and Electrostatic Interactions in Adsorption of Surface-Active Substances. Tetraalkylammonium Salts. Adv. Colloid Interface Sci. 1987, 28, 135–195. [Google Scholar] [CrossRef]
- Chandler, D. Interfaces and the Driving Force of Hydrophobic Assembly. Nature 2005, 437, 640–647. [Google Scholar] [CrossRef]
- Djerdjev, A.M.; Beattie, J.K. Electroacoustic and Ultrasonic Attenuation Measurements of Droplet Size and Zeta Potential of Alkane-in-Water Emulsions: Effects of Oil Solubility and Composition. Phys. Chem. Chem. Phys. 2008, 10, 4843–4852. [Google Scholar] [CrossRef] [PubMed]


| System | [Bu4N]Br (mM) | pH | K (S m−1) | μ (10−8 m2 V−1 s−1) | ζ (mV) |
|---|---|---|---|---|---|
| TBAB | 0.20 | 6.00 | 0.0052 | +2.54 | +41 |
| 0.40 | 0.0075 | +2.79 | +46 | ||
| 0.60 | 0.0096 | +2.89 | +48 | ||
| 1.00 | 0.0138 | +3.01 | +49 | ||
| 4.00 | 0.0563 | +3.38 | +52 | ||
| TBAB/TBAOH | 0.20 | 3.99 | 0.0069 | +2.24 | +36.7 |
| 4.46 | 0.0064 | +2.12 | +35.3 | ||
| 5.51 | 0.0067 | +1.20 | +25.7 | ||
| 5.88 | 0.0068 | +0.92 | +25.8 | ||
| 6.20 | 0.0092 | +0.29 | +22.3 | ||
| 6.53 | 0.0145 | −0.16 | −4.3 | ||
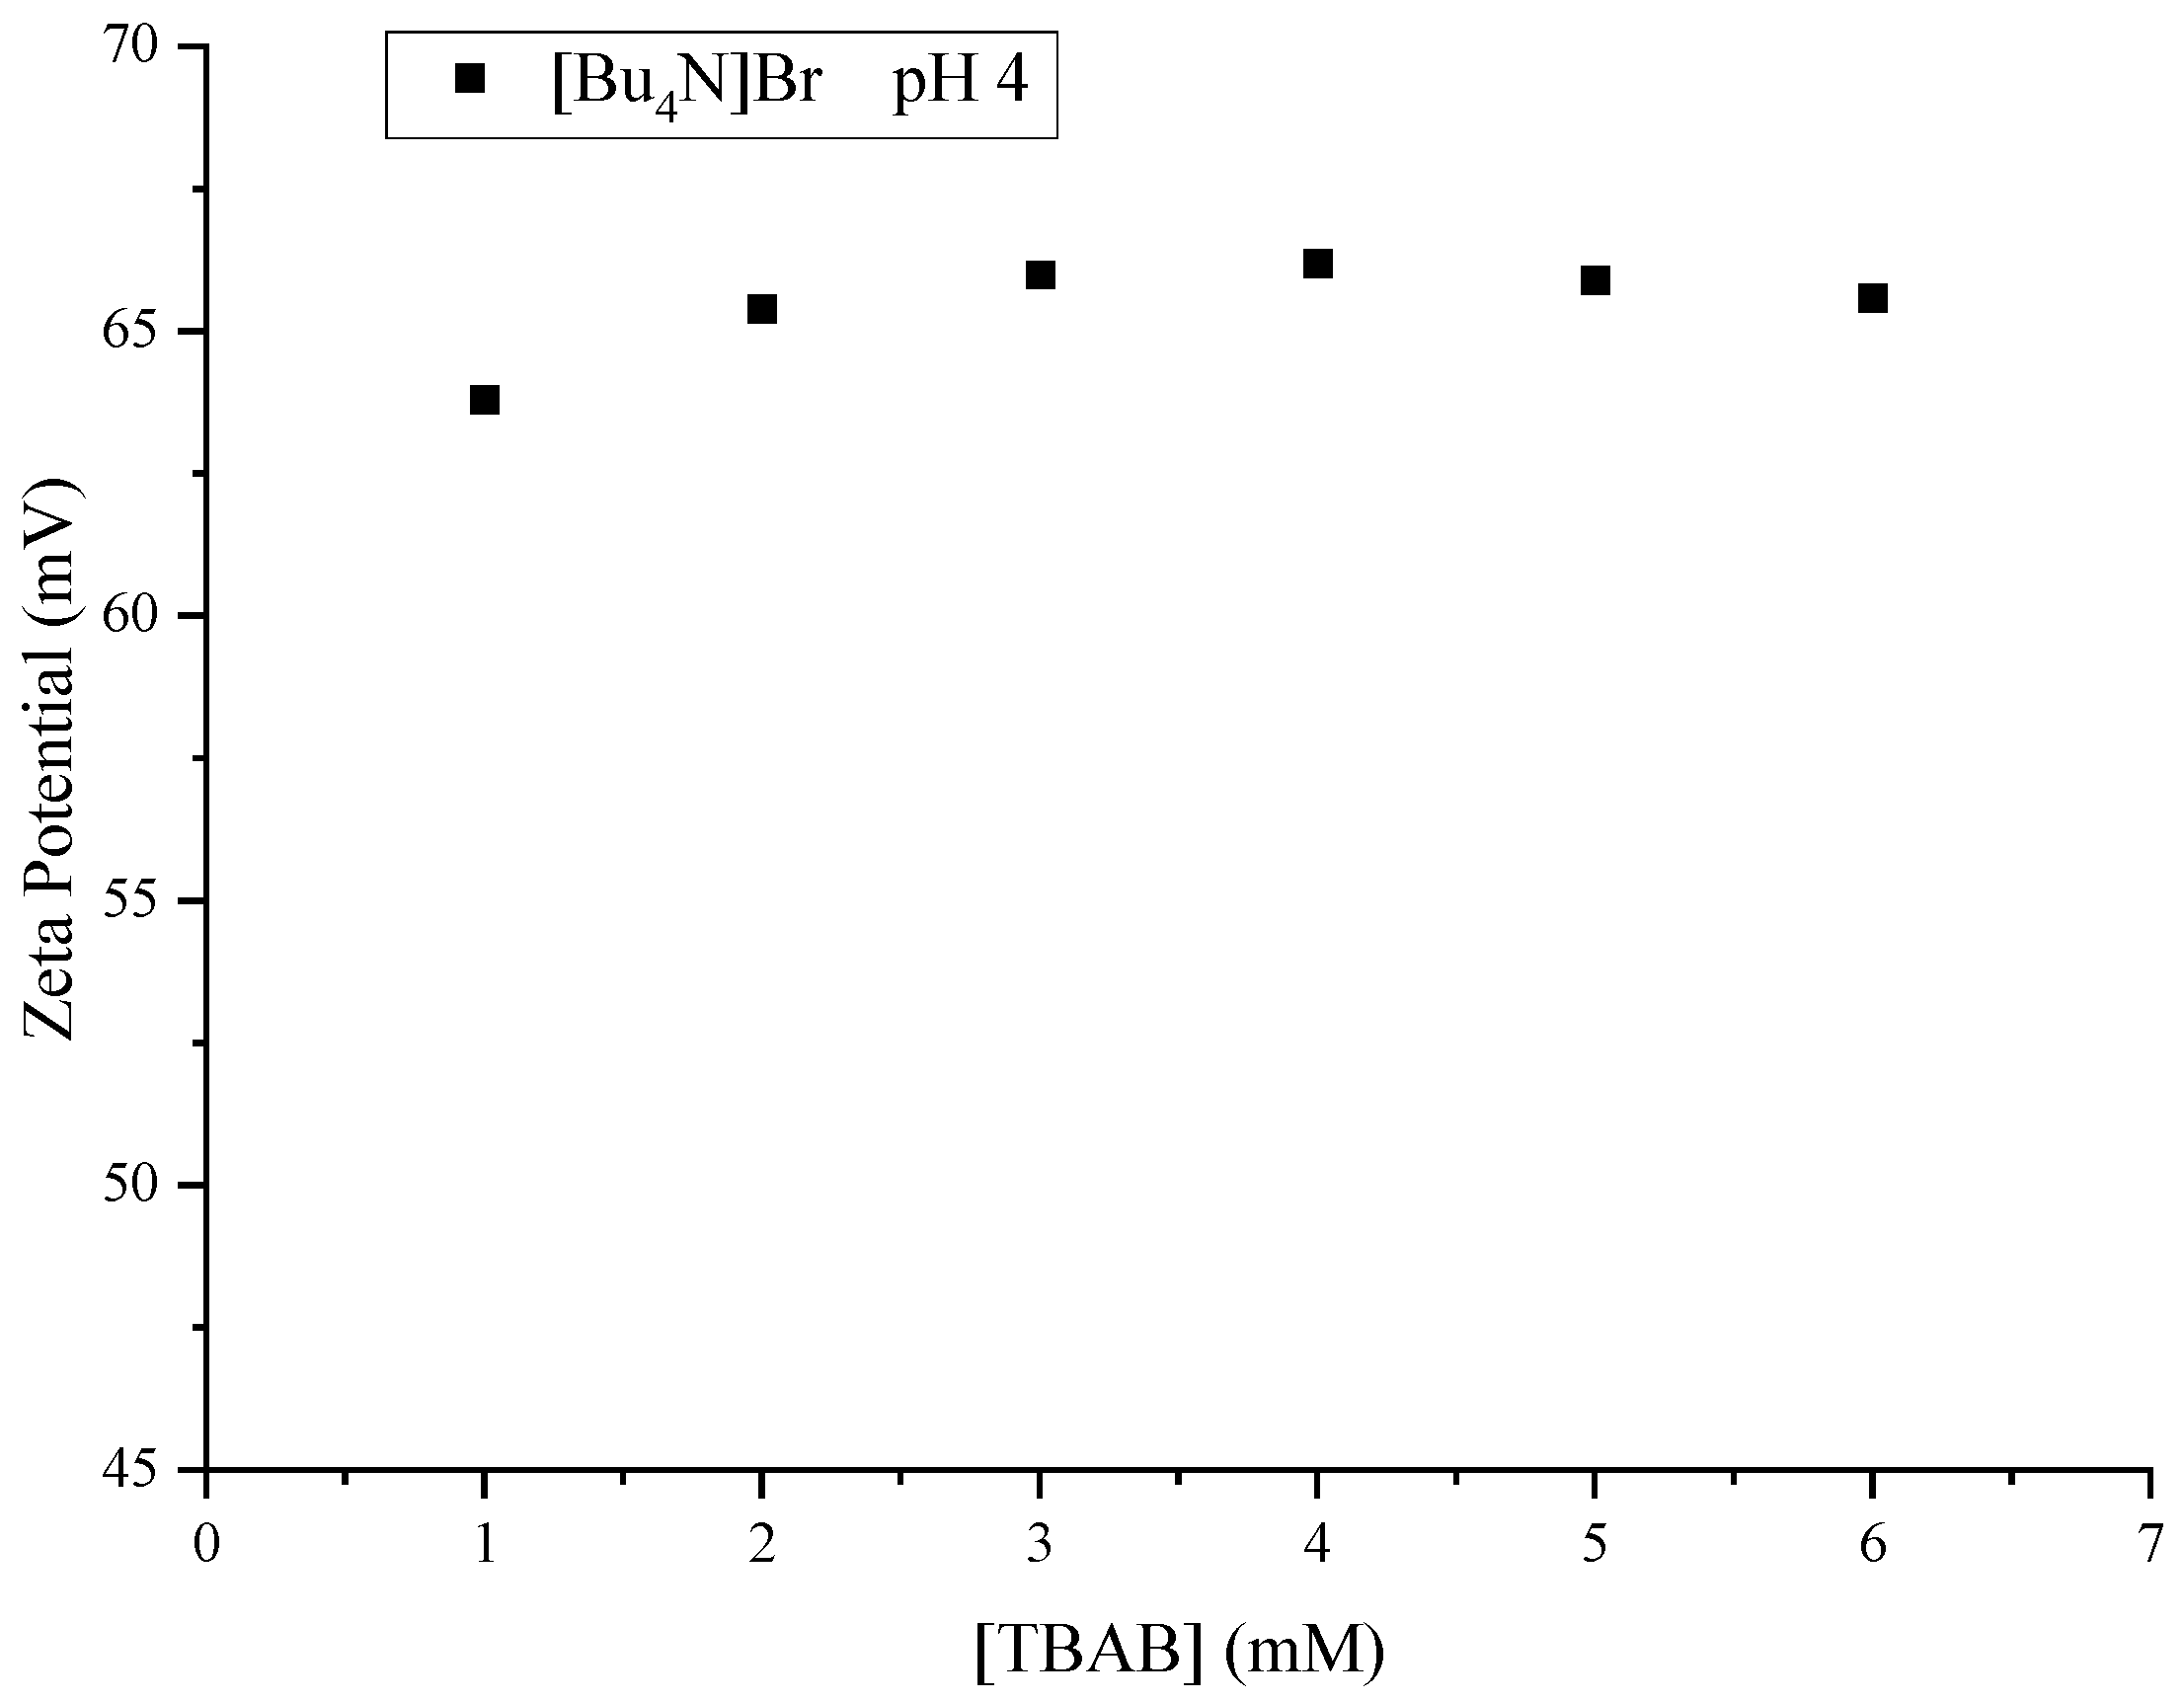
| TBAB | 1.00 | 4.13 | 0.0161 | +4.00 | +63.8 |
| 2.00 | 3.98 | 0.0272 | +4.23 | +65.4 | |
| 3.00 | 4.02 | 0.0372 | +4.23 | +66.0 | |
| 4.00 | 4.05 | 0.0467 | +4.30 | +66.2 | |
| 5.00 | 4.06 | 0.0558 | +4.26 | +65.9 | |
| 6.00 | 4.07 | 0.0645 | +4.19 | +65.6 |
| System | pH | K (S m−1) | μ (10−8 m2 V−1 s−1) | ζ (mV) |
|---|---|---|---|---|
| TEAC/HCl | 9.07 | 0.0137 | −2.77 | −42.7 |
| 8.71 | 0.0133 | −2.69 | −39.7 | |
| 8.21 | 0.0131 | −2.51 | −37.8 | |
| 7.75 | 0.0130 | −2.42 | −37.1 | |
| 7.17 | 0.0131 | −2.27 | −33.9 | |
| 6.75 | 0.0133 | −2.06 | −30.7 | |
| 6.36 | 0.0135 | −1.86 | −27.8 | |
| 5.98 | 0.0141 | −1.19 | −18.1 | |
| 5.62 | 0.0142 | −0.98 | −17.8 | |
| 4.91 | 0.0150 | −0.49 | −14.0 | |
| 4.80 | 0.0149 | −0.42 | −12.2 |
| Oil | d (nm) | d15–d85 (nm) | Surface Area (cm2 L−1) | −Heatexp * (J L−1) | −HeatN (J L−1) | −HeatT (J L−1) | +HeatA (J L−1) |
|---|---|---|---|---|---|---|---|
| Hexadecane | 2000 | 1300–3077 | 8.7 × 10⁵ | 5.21 | 2.76 | 6.67 | −4.22 |
| 1331 | 991–1789 | 1.07 × 10⁶ | 6.26 | 3.40 | 8.20 | −5.34 | |
| 1345 | 844–2144 | 1.38 × 10⁶ | 8.02 | 4.38 | 10.58 | −6.94 | |
| 940 | 706–1250 | 1.50 × 10⁶ | 9.52 | 4.76 | 11.50 | −6.73 | |
| IPM | 760 | 722–800 | 1.59 × 10⁶ | 4.04 | 5.05 | 7.23 | −8.23 |
| 580 | 355–949 | 3.36 × 10⁶ | 10.65 | 10.66 | 15.27 | −15.28 |
Disclaimer/Publisher’s Note: The statements, opinions and data contained in all publications are solely those of the individual author(s) and contributor(s) and not of MDPI and/or the editor(s). MDPI and/or the editor(s) disclaim responsibility for any injury to people or property resulting from any ideas, methods, instructions or products referred to in the content. |
© 2025 by the authors. Licensee MDPI, Basel, Switzerland. This article is an open access article distributed under the terms and conditions of the Creative Commons Attribution (CC BY) license (https://creativecommons.org/licenses/by/4.0/).
Share and Cite
Djerdjev, A.M.; Beattie, J.K. Hydroxide and Hydrophobic Tetrabutylammonium Ions at the Hydrophobe–Water Interface. Molecules 2025, 30, 785. https://doi.org/10.3390/molecules30040785
Djerdjev AM, Beattie JK. Hydroxide and Hydrophobic Tetrabutylammonium Ions at the Hydrophobe–Water Interface. Molecules. 2025; 30(4):785. https://doi.org/10.3390/molecules30040785
Chicago/Turabian StyleDjerdjev, Alex M., and James K. Beattie. 2025. "Hydroxide and Hydrophobic Tetrabutylammonium Ions at the Hydrophobe–Water Interface" Molecules 30, no. 4: 785. https://doi.org/10.3390/molecules30040785
APA StyleDjerdjev, A. M., & Beattie, J. K. (2025). Hydroxide and Hydrophobic Tetrabutylammonium Ions at the Hydrophobe–Water Interface. Molecules, 30(4), 785. https://doi.org/10.3390/molecules30040785