Abstract
Strong-aroma type Baijiu and its diluted samples were characterized through descriptive analysis. Significant changes were observed in four (ethanol, Jiao-aroma, fruity, and grain) of the nine aroma attributes, primarily attributed to variations in ethanol concentration rather than other compounds. The thresholds of 40 compounds in aqueous solutions with alcohol concentrations of 20%, 30%, 40%, 50%, and 60% were measured using three-alternative forced-choice tests. The thresholds of 30 compounds were significantly positively correlated with ethanol concentration. The thresholds of 40 compounds were affected by ethanol concentration to varying degrees, with changes ranging from 2 to 692 times. Due to the varying degrees of alcohol influence on the compound threshold, the aroma profile of diluted Baijiu sample is different from the original Baijiu sample.
1. Introduction
Ethanol is the most abundant flavor compound in alcoholic beverages, particularly in distilled spirits. Chinese Baijiu, a type of distilled spirit, typically has an ethanol concentration of 50–60% ABV (alcohol by volume) [,]. With the change of consumer demand and the development of internationalization of Baijiu, the trend towards lower alcohol content has become a key direction for Chinese Baijiu industry development, resulting in ethanol concentration of Baijiu ranging from 20 to 50% ABV. For example, the 39% ABV strong-aroma type Baijiu from Yibin Wuliangye Co., Ltd. (Yibin, China) has garnered widespread attention and recognition. Previous studies have shown that ethanol concentration plays an important role in shaping the aroma profile of alcoholic beverages [,,,,]. Most studies [,] have focused on the alcoholic beverages with alcohol by volume lower than 40%, such as beer, wine, and whiskey. To produce low-alcohol Baijiu that appeals to a broader consumer base, it is very important to explore the change of flavor perception during the dilution process of Baijiu.
The release of aroma compounds is influenced by ethanol concentration, which changes the volatilization of these compounds in the headspace [,,,,,,]. When the concentration of ethanol changes, the structure of the liquid water/ethanol matrix will change, which affects the hydrogen bonding state and the solubility of compounds in the solution, ultimately leading to changes in the volatilization of these compounds []. In addition, the pungent smell of ethanol can affect the threshold of the compounds [,]. Exploring how ethanol concentration affects the thresholds of aroma compounds is also crucial for gaining a comprehensive understanding of changes in aroma perception. It is well known that an increase in ethanol concentration will lead to a higher threshold for aroma compounds. Guth first proved that the threshold of compounds in ethanol aqueous solution is 10–312 times higher than in water []. While the thresholds of compounds have been measured in different ethanol aqueous solutions [,,,], these threshold data were obtained from different laboratories using different methods. To the best of our knowledge, very few literatures have systematically studied the effect of ethanol concentration on compound thresholds. Additionally, the range of alcohol content studied is quite narrow. Thus, research on the effect of alcohol content on compound threshold remains relatively blank. Due to the effect of ethanol on compound release and threshold, aroma perception is also influenced by the ethanol concentration [,,,,,]. Research exploring the effects of ethanol concentration on the aroma perception of distilled spirits is very important, given the wide range of ethanol concentration, from 40% ABV (usually in the distilled spirits neat) to 20% ABV (commonly found in the diluted distilled spirits before consumption) []. However, related research in Baijiu is scarce, and the majority of studies were focused on wine or wine model systems [,,,].
To sum up, the objectives of this study are: (I) to characterize the aroma profile of the origin Baijiu sample and its diluted samples using DA to investigate the effect of ethanol on flavor perception; and (II) to measure the thresholds of 40 important aroma compounds in aqueous solutions with alcohol concentrations of 20%, 30%, 40%, 50%, and 60% by a three-alternative forced-choice (3-AFC) test to analyze the causes of changes in aroma profiles.
2. Results
2.1. Effect of Dilution on Sensory Profile of Baijiu Samples
The profile of original Baijiu and diluted Baijiu was studied by descriptive analysis (DA) to characterize the change in aroma perception during diluting. When the Baijiu samples were diluted, both the ethanol content and other substances concentrations changed. To study which factor mainly affects the perception of Baijiu, the sample N-30E was added in the study. N-30E was diluted with an aqueous 61.8% ABV solution using the same dilution ratio as N-30. This means that N-30E and N had the same ethanol content but different other substances concentrations, while N-30E and N had different ethanol contents but the same other substances concentrations.
2.1.1. Assessment of Panel Performance
After discussion by the panel, a total of nine aroma attributes were determined to describe the aroma profile of Baijiu samples, including fruity, ethanol, sweet, jiao-aroma, sour, green, grain, bran, and musty. As shown in Table 1, each aroma attribute was defined. These attributes can not only describe the aroma profile of samples but also reflect the difference in aroma between samples.

Table 1.
List of aroma attributes, definitions, references, and reference scores for the descriptive analysis.
In order to ensure the reliability of the result (Table S1), the performance of the panel was assessed for each sensory attribute separately []. Thus, as shown in Table 2, an Analysis of Variance (ANOVA) was performed on each sensory attribute. In general, there are three main effects and three interaction effects. The results of dilution sample effect, dilution sample and panelist (D-P) interaction, dilution samples, and session (D-S) interaction are of utmost importance, as they indicate whether the panel can consistently (repeatably) and consensually (agreeably) differentiate the products (discrimination) []. With p > 0.05, the D-P interaction and D-S interaction are not significant, indicating that there is consensus among the panelists for all aroma attributes, and the panel is repeatable from one session to another. Thus, the panel evaluated the samples consistently and consensually. Based on the repeatability and consistency of the panel, the dilution sample effect of ethanol, Jiao-aroma, fruity, and grain attributes was significant (p < 0.05), which means four of the nine aroma attributes were significantly different. Thus, the four attributes were chosen for the further study.
Table 2.
Analysis of variance (ANOVA) F-ratios for amora attributes of Chinese strong-aroma Baijiu a.
2.1.2. Changes in Aroma Attribute Intensity During Dilution
Figure 1A,B illustrated the trends in the intensity changes in the four aroma attributes with significant changes. During the dilution process with ultrapure water (Figure 1A), the ethanol aroma is most affected by dilution, while the grain aroma is least affected. As the dilution ratio increases, the intensity of fruity aroma and Jiao-aroma first rises and then decreases. The Jiao-aroma is a characteristic aroma in strong-aroma type Baijiu and is rarely perceived in other alcoholic beverages. Thus, there are currently no studies reporting on the change in its aroma intensity during dilution. While some studies have proved that the fruity attribution is affected by ethanol content [,]. But the trend observed here does not fully align with previous research, which shows higher fruity attributes in lower ethanol content solutions. This discrepancy may be due to the previous study being conducted under a different alcohol content (0–20% ABV). In addition, the grain aroma showed an upward trend, while the ethanol aroma exhibited a downward trend.
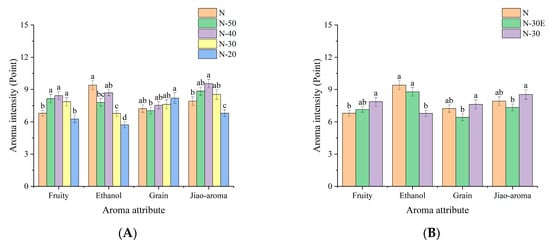
Figure 1.
Column chart of the intensity of aroma attribute in N, N-50, N-40, N-30 and N-20 (A), and N, N-30E and N-30 (B) (a–d: Superscripts of the same letter within an attribute indicate no significant difference by Fisher’s least significant difference (LSD) test at α = 0.05).
The samples of N and N-30E contain the same ethanol concentration but differ in the concentration of other substances, while the samples of N-30E and N-30 contain the same concentration of other substances but differ in ethanol concentration. Comparing the three samples (Figure 1B), it can be found that when the ethanol concentration remained constant and the other substances concentrations decreased, the intensity of each aroma attribute did not change significantly. However, when the other substances concentrations remained unchanged and the ethanol concentration decreased, the intensity of the ethanol aroma decreased significantly, while the intensity of the grain aroma and Jiao-aroma increased significantly. This indicated that the change in the concentration of other substances had a lower effect on the intensity of aroma attribute intensity than the change in ethanol concentration. A decrease in ethanol concentration led to a decrease in the compound threshold, thereby enhancing the aroma intensity of aroma compounds. While a decrease in the concentration of other substances reduced the aroma intensity perceived by panelists []. The interaction of these two effects resulted in the unpredictable change in aroma attributes. However, because different aroma compounds are affected by the two effects differently, there are also differences in the change of aroma attributes presented by aroma compounds.
Correlation analysis was carried out on the four aroma attributes, ethanol concentration, and the concentration of other substances. The results are shown in Figure 2A; ethanol concentration was significantly positively correlated with ethanol aroma and significantly negatively correlated with grain aroma. There was no significant correlation between other substances concentrations and any aroma attribute.
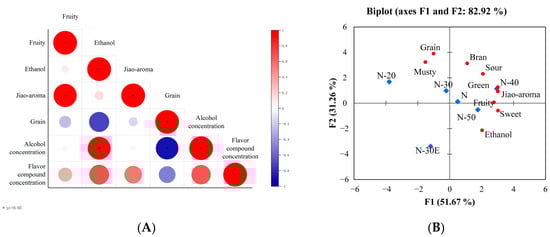
Figure 2.
The Spearman correlation heatmap between four aroma attributes, ethanol concentration, and other substances concentration (A); The PCA bi-plot generated from the sensory descriptors (B).
In order to further clarify the difference in aroma characteristics of the samples, principal component analysis (PCA) was conducted as shown in Figure 2B. The first two principal component factors collectively explain 82.92% of the total variance. The aroma profile of samples N-50, N-40, and N-30, diluted with ultrapure water to 50%, 40%, and 30% ABV, is similar to that of the original sample N. In contrast, the aroma profile of sample N-20 was quite different from that of sample N, with a stronger unpleasant smell (musty aroma). Perpète demonstrated that increasing ethanol concentration can reduce unpleasant flavor [].
A total of four of the nine aroma attributes evaluated changed significantly during dilution, which was mainly caused by the change in ethanol concentration, rather than the concentration of other substances. As shown in Figure 3, the overall aroma profile does not change dramatically, which may explain why strong-aroma style Baijiu is the most popular low-alcohol Baijiu on the market. Because of this, it is crucial to pay attention to aroma properties with significant changes. Because this is a key factor in distinguishing the aroma of high and low alcohol Baijiu. For example, when the strong aroma style Baijiu is diluted and ethanol content is 60% to 50 (v/v), it is unnecessary to care about all these four aroma contributes, because there are only two attributes (fruity and ethanol aroma) that are significant. Thus, it will reduce the workload when the producer blends the low alcohol finish Baijiu. Based on the change of aroma intensity, the perception of aroma compounds was not equally affected by changes in ethanol concentration. Therefore, in order to elucidate the causes of changes in aroma profile, the next step of this study will be to explore how changes in ethanol concentration affect aroma perception.
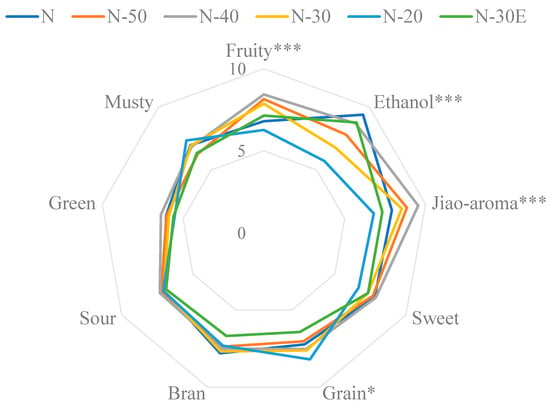
Figure 3.
The radar chart of the aroma profile change of Baijiu during dilution. * represent p < 0.05; *** represent p < 0.001.
2.2. Effect of Ethanol on the Aroma Perception
2.2.1. Effect of Ethanol on the Threshold of Aroma Compounds
When the concentration of a compound is constant, the threshold value will affect the aroma contribution of the compound. Flavor compounds exhibit different aroma thresholds in aqueous solutions with different ethanol levels [,]. The systematic measurement of compound thresholds in aqueous solutions with different ethanol levels is useful for analyzing the cause of the influence of ethanol concentration on aroma perception.
In this study, a total of 40 compounds with aroma contributions in Baijiu were selected for research. Some of these are skeleton components, such as alcohols, acids, and esters, while others are present in lower concentrations but have very low thresholds, such as lactones, aldehydes, ketones, and sulfur compounds. All of them play an important role in Baijiu’s profile.
Following the alcohol content design of DA in 2.1, the thresholds of 40 compounds were determined in aqueous solutions with 60%, 50%, 40%, 30%, and 20% ABV. The result of the threshold was shown in Table 3. The thresholds of compounds generally showed an upward trend as ethanol concentration increased. According to the Pearson correlation analysis, a total of 30 compounds showed a significant positive correlation between the thresholds and ethanol concentration, while 10 compounds showed no significant correlations. These include ethyl acetate, ethyl hexanoate, ethyl heptanoate, 1-pentanol, 1-hexanol, damascenone, 1-nonanal, γ-dodecalactone, dimethyl trisulfide, and (±)-geosmin. The scatter plots of thresholds ratio for these 10 compounds in aqueous solutions at 5 ethanol levels were shown in Figure 4. It is noted that the thresholds of 6 compounds (including 1-pentanol, 1-hexanol, damascenone, 1-nonanal, γ-dodecalactone, and dimethyl trisulfide) showed a downward trend when the ethanol concentration increased, primarily within the 50% to 60% ABV range (indicated by green lines in Figure 4). This may differ from conventional understanding, but the trend was observed in Liu’s study []. When the ethanol content increased from 46% to 60% ABV, the thresholds of butyric acid and tetramethylpyrazine decreased. In addition, the thresholds for these 10 compounds increased dramatically in the range from 40% to 50% ABV or from 50% to 60% ABV, as indicated by the red lines in Figure 4.
Table 3.
Thresholds of 40 compounds in 5 ethanol levels.
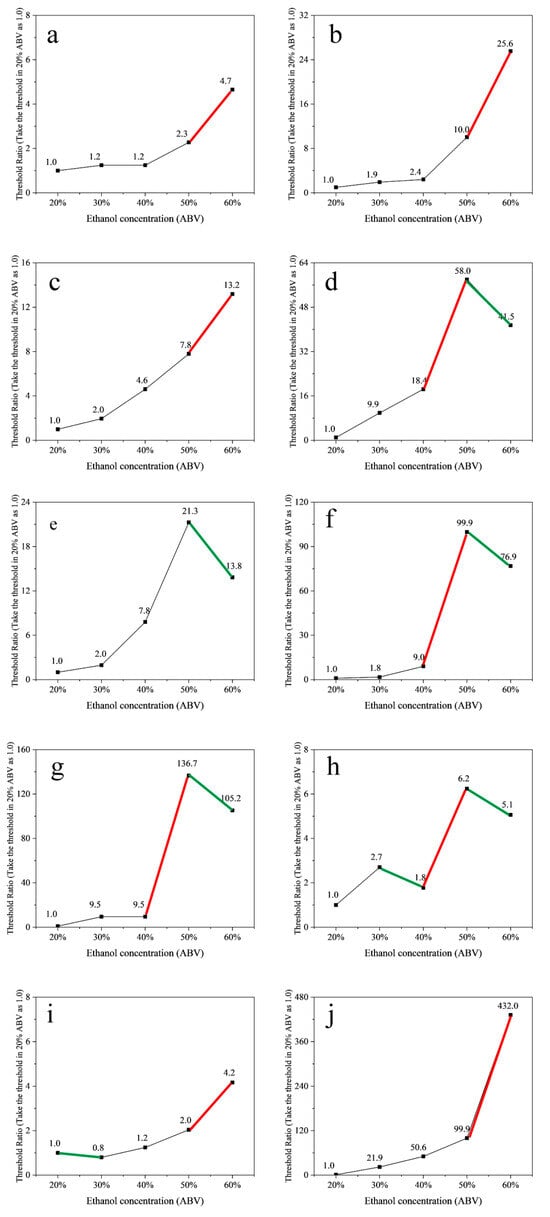
Figure 4.
Scatter plots of thresholds ratio in five ethanol levels of ethyl acetate (a), ethyl hexanoate (b), ethyl heptanoate (c), 1-pentanol (d), 1-hexanol (e), damascenone (f), 1-nonanal (g), γ-dodecalactone (h), dimethyl trisulfide (i), and (±)-geosmin (j). (The red line presents a downward trend in the threshold when the alcohol content increased, and the green line the interval in which the threshold for each compound is sharply increased).
The esters studied in this study are all straight-chain ethyl ester compounds, which mainly exhibit fruity and floral aromas. At each ethanol concentration level, as the carbon chain length increased, the thresholds of esters initially showed a decreasing trend, followed by an increasing trend (except for ethyl caprylate) (Table 3). Ethyl acetate has the highest threshold value among this series of compounds. The short-chain ethyl ester compound has strong polarity and high solubility in solution, which makes it more difficult to volatilize from the solution. Therefore, its threshold value is high. As the carbon chain length increases, the hydrophobicity of the compound increases, which reduces its solubility and makes it more volatile. Therefore, the threshold shows a downward trend. When the carbon chain continues to increase, the molecular weight and boiling point also increase, making it more difficult to volatilize. Thus, the threshold shows an upward trend []. Ethyl valerate has the lowest threshold due to its moderate carbon chain length and molecular weight, as well as its low solubility []. When the alcohol content increased from 20% to 60%, the ratio of the maximum threshold to the minimum threshold for ethyl acetate, ethyl propionate, ethyl butyrate, and ethyl heptanoate was smallest, and the ratio was about 5.0. The largest ratio was observed for ethyl hexanoate, with a ratio of 25.6, followed by ethyl nonanoate with a ratio of 20.0. The remaining three compounds have a ratio of about 13.0 (Table S2).
The acids studied in this study are all straight-chain fatty acid compounds, which present off-odors (such as cellar mud, sour, and sweat odor) at high concentration and pleasant aromas (such as fruity and sweet aromas) at low concentration. Similar to straight-chain ethyl ester compounds, acetic acid has the highest threshold, while valeric acid has the lowest threshold at the same alcohol concentration. In addition, the change of the threshold value from acetic acid to heptanoic acid also showed a trend of first decreasing and then increasing. However, the threshold of octanoic acid and decanoic acid showed a decreasing trend, which is worth studying. Butyric acid is the compound whose threshold is least affected by ethanol concentration. The threshold of propionic acid is most affected by the change of ethanol concentration, and the threshold value in aqueous 60% ABV solution is 20.5 times that in aqueous 20% ABV solution (Table S2).
Alcohols are one of the skeleton components in Baijiu. Their thresholds are generally higher than 1 mg/L, mainly showing floral, fruity, and ethanol aromas. While enols, unlike saturated alcohols, have a relatively low threshold of just a few micrograms per liter. Among the eight alcohol compounds measured in Table S2, the compound with the largest threshold change is 1-pentanol, followed by linalool, 1-hexanol, and 2-butanol. Different from other compounds, the thresholds of four compounds, including 1-pentanol, 3-methyl-1-butanol, 1-hexanol, and linalool, were higher in aqueous 50% ABV solutions than in aqueous 60% ABV solutions. This may be due to the high alcohol content benefiting the perception of these four compounds.
In addition to esters, acids, and alcohols, the threshold of 16 compounds with low thresholds was measured, such as aldehydes, ketones, lactones, and sulfur-containing compounds (Table 3). Aldehydes and ketones mainly present green, floral, and fruity. Lactones are mainly present in creamy, coconut, and fruity. And sulfides are mainly peculiar smells. Compared with other compounds at the same concentration, these compounds have a greater contribution to the aroma profile of Baijiu due to their lower thresholds. Therefore, it is of great significance to study the variation law of these compound threshold changes with the change of ethanol concentration.
The thresholds of these 16 compounds were generally more affected by ethanol concentration than the skeleton components. The range of the threshold value of bis-(2-methyl-3-furyl)-disulfide was the largest, and the ratio of the highest threshold to the lowest threshold was 691.8 times, followed by (±)-geosmin of 432.0 times.
Preliminary studies have shown that increasing ethanol concentration enhances pungent odors in alcoholic beverages, making aroma compounds more difficult to perceive []. Therefore, the thresholds of compounds tend to rise as ethanol concentration increases. However, by systematically measuring the compound thresholds at different ethanol concentrations in this study, it was found that the thresholds of certain compounds decreased as the ethanol concentration increased. It is speculated that within some specific ethanol concentration ranges, the pungent smell of ethanol may enhance the perception of compounds with the similar aroma.
Different compounds have different threshold changes with the change in ethanol concentration due to their different physicochemical properties and sensory properties. Among the 40 compounds tested, 30 compounds showed a significant positive correlation between the threshold and the ethanol concentration, while 10 compounds had no significant correlations. There were also differences in the degree to which the thresholds of different compounds were affected by ethanol concentration. When the ethanol concentration changed from 20% to 60% ABV, the threshold of butyric acid changed by only 2.3 times, while bis-(2-methyl-3-furyl)-disulfide changed by 691.8 times. Aroma compounds contribute to different aroma attributes, and the change rule of the threshold value of each aroma compound plays an important role in the change of the aroma attributes in Baijiu. Especially for these compounds with significant differences in threshold variation, they may result in significant changes in the aroma profile. Thus, the compounds with huge threshold changes need to be focused on when the strong-aroma style Baijiu is diluted. But it does not mean that the compounds with slight variation need not be focused. The aroma attributions contributed by the compounds with significant differences in threshold can be amplified during the dilution; as a result, the aroma attributions contributed by the compounds with slight differences in threshold can be suppressed during the dilution. And the relationship needs to be further studied; this will be discussed by using OAV (odor activity value).
2.2.2. Effect of Threshold on the Aroma Profile in Baijiu
After the Baijiu sample was diluted, both the concentration of ethanol and other aroma compounds decreased. The decrease in alcohol content enhances aroma perception, while the decrease in aroma compound concentration inhibits aroma perception. As a result, each aroma attribute does not all show a gradient descent trend.
When the Baijiu was diluted with water, the content of alcohol and aroma compounds changed regularly. However, the thresholds of aroma compounds changed irregularly, which led to the change in the aroma compounds’ OAV changing differently (Table 4). And in order to show the change of compounds aroma contribution, a total of 14 compounds, including ethyl propionate, ethyl heptanoate, ethyl caprylate, ethyl caprate, propionic acid, butyric acid, valeric acid, hexanoic acid, 2-methyl-1-butanol, 1-hexanol, linalool, damascenone, (±)-geosmin, and 4-ethyl-2-methoxyphenol, were used as examples in this study. And their concentrations in Baijiu were referred to previous studies [,]. As shown in Table S3, when the Baijiu sample was diluted by ultrapure water from 50% to 30% ABV, the concentration of each compound gradually decreased. However, due to the different properties of each compound, the threshold of each compound is affected by the ethanol concentration to varying degrees, resulting in different changes in the OAV of each compound. The OAV% of each compound was calculated by dividing the OAV of each compound by the total OAV, which can, to some extent, represent the contribution rate of each substance’s aroma. As shown in Figure 5, the compound with the highest aroma contribution in 30% ABV was damascenone instead of ethyl heptanoate in 50% ABV. Additionally, the profile of the aroma contribution changed as well. In the 50% ABV, the aroma contributions of 11 compounds were relatively balanced. However, in the 30% ABV, the aroma contributions of damascenone were extremely higher than others, which were up to 38%. When the Baijiu was diluted with water, the role of compounds in the aroma profile of Baijiu changed, leading to irregular variations in the intensities of aroma attributes in Baijiu.
Table 4.
The change of compound OAV during dilution.
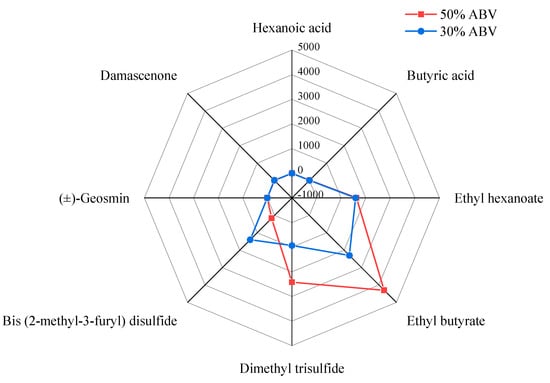
Figure 5.
The effect of dilution on OAV.
3. Discussion
In this study, a descriptive analysis of strong-aroma type Baijiu sample and its diluted samples was performed. A total of four of the nine aroma attributes evaluated changed significantly, mainly due to changes in ethanol concentration rather than the concentrations of other substance compounds. The 3-AFC method was used to systematically investigate the effect of ethanol concentration (60%, 50%, 40%, 30%, 20% ABV) on the thresholds of 40 compounds. Among them, the threshold of 30 compound threshold was significantly positively correlated with ethanol concentration. Further analysis found that the thresholds of different compounds were affected to different degrees by ethanol concentration, and the ratios of the threshold of a compound in aqueous 60% ABV solution versus aqueous 20% ABV solution ranged from 2 to 692 times. This difference indicates that the aroma contribution of each aroma compound will change during dilution, which may be one of the key factors for the irregular changes in aroma attribute intensity.
4. Materials and Methods
4.1. Reagents and Standards
All standards of the aroma compounds used in the study were chromatographic grade with a purity of ≥97%. The following compounds were purchased from Sigma Aldrich in Shanghai, China: Ethyl acetate, Ethyl propionate, Ethyl valerate, Ethyl heptanoate, Ethyl caprylate, Ethyl caprate, Acetic acid, Propionic acid, Heptanoic acid, Octanoic acid, Decanoic acid, 2-Butanol, 1-Pentanol, Linalool, 1-Nonanal, β-Lonone, Fema 3377, γ-Dodecalactone, γ-Decalactone, γ-Valerolactone, γ-Octanoic Lactone, γ-Nonanolactone, Furfuryl mercaptan, Bis-(2-methyl-3-furyl)-disulfide And 4-Ethyl-2-Methoxyphenol. The following compounds were obtained from Aladdin in Shanghai, China: Ethyl Butyrate, Ethyl Hexanoate, Butyric Acid, Valeric Acid, Hexanoic Acid, Ethyl Nonanoate, 1-Propanol, 1-Butanol, 2-Methyl-1-Butanol, 3-Methyl-1-Butanol, 1-Hexanol, Damascenone, FEMA 3377, Dimethyl trisulfide, 3-(Methylthio)propionaldehyde, and (±)-Geosmin. Ethanol (High Performance Liquid Chromatography-grade, 99.9%) was purchased from J&K Scientific in Shanghai, China. Water was purified by the Milli-Q water purification system (Millipore, Bedford, MA, USA).
4.2. Samples, Model System, and Sensory Reference Preparation
A commercially available strong-aroma Baijiu, designated as N, was purchased at a local market with the ethanol concentration of 61.8% ABV. As shown in Figure 6, a total of five dilutions of the Baijiu sample were prepared, including four dilutions with ultrapure water to 50% ABV (N-50), 40% ABV (N-40), 30% ABV (N-30), and 20% ABV (N-20), as well as a dilution (N-30E) with an aqueous 61.8% ABV solution using the same dilution ratio as N-30. The aqueous 61.8% solution was prepared by diluting ethanol with ultrapure water. All samples were prepared fresh (no more than 24 h) before the test and stored at 26 °C.
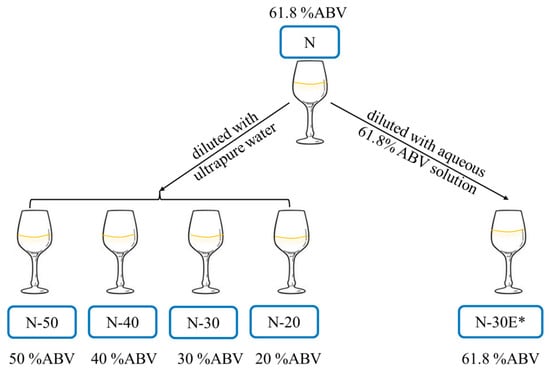
Figure 6.
Schematic diagram of Baijiu samples preparation (* N-30E was diluted with aqueous 61.8% ABV solution using the same dilution ratio as N-30).
Attribute references were prepared prior to evaluation (within 24 h) and placed into 30 mL lidded plastic cups, labeled with the reference identity. The detailed list, including all attributes, definitions, references, and reference scores, is shown in Table 1.
4.3. Descriptive Analysis
4.3.1. Panel
A total of ten panelists (four males and six females, aged 22–35 years) from Jiangnan University were recruited as candidates for the descriptive analysis panel. The panelists were selected based on their health status, interest, availability, and experience with tasting Baijiu, as assessed through an initial test.
4.3.2. Training
On the first day of training, the panelists learned about the concept of the DA method used in the study []. During the first six sessions (1 h each) of the training, a dilution series of samples labeled with random codes was provided to help generate aroma terms and references. A list of terms was collected from previous research to aid in the generation of aroma terms []. Based on the group discussion, the panel confirmed the terms, defined each term precisely, and determined appropriate reference (Table 1).
Then, panelists spent two sessions (1 h each) determining the reference intensities of each term. The references were scaled using a 15-point scale. Panelists spent nine sessions practicing the scoring of Baijiu samples, using the references as anchor points for the scale to ensure panel uniformity. The scores from the training sessions were shown to the panelists so that they could identify and correct any attributes they had rated inconsistently compared to the other panelists. The performance of the panel was assessed using R Studio to evaluate the repeatability, stability, and consistency.
4.3.3. Sample Evaluation
The panelists smelled all Baijiu samples over three sessions (1 h each), with the samples presented in triplicates. A 10 mL sample was served in standard Baijiu tasting glasses, covered with glass petri dishes, and coded with random three-digit codes. The sample order was randomized for the panel. The tests were carried out in an individual booth maintained at 26 °C. The references were provided to all panelists upon arrival, and they were encouraged to smell all references before the test. Panelists were free to reevaluate any reference at any time during the test.
4.4. Threshold Determination
Olfactory thresholds of 40 aroma compounds in aqueous solutions of 60%, 50%, 40%, 30%, and 20% ABV were measured by 25 panelists. Panelists were informed about the nature of the compounds, and standard solutions were presented to them before the test. The panelists performed 3-AFC tests []. Each compound in each alcohol concentration level comprised nine forced-choice tests, with increasing concentrations differentiated by a factor of 3.0. Each test included one sample with increasing concentrations of the compound and two blank aqueous ethanol solutions. The initial concentrations of compounds were determined by the pre-test. The results of the 3-AFC tests were statistically analyzed using the best estimate threshold (BET) [].
4.5. Statistical Analysis
R Studio was employed to evaluate the performance of the panel. Principle component analysis (PCA) biplot was conducted using XLSTAT software (version 2014). Column chart, scatter plots, and Spearman correlation heatmap were visualized with Origin2022b.
Supplementary Materials
The following supporting information can be downloaded at: https://www.mdpi.com/article/10.3390/molecules30040933/s1, Table S1: Mean intensity rating for Baijiu samples; Table S2: Thresholds ratio of compounds in 5 ethanol levels; Table S3: The change of concentration, threshold, OAV and OAV ratio in Baijiu during dilution.
Author Contributions
Conceptualization, J.L. and S.C.; methodology, J.L. and S.C.; software, J.L.; validation, J.Z., D.Z. and Y.X.; formal analysis, J.L.; data curation, J.L.; writing—original draft preparation, J.L.; writing—review and editing, S.C.; supervision, J.Z., D.Z. and Y.X.; project administration, S.C.; funding acquisition, S.C. All authors have read and agreed to the published version of the manuscript.
Funding
This work was supported by the National Key R&D Program of China [grant 2022YFD2101201], the National Natural Science Foundation of China [grant 32172331], and the National First-class Discipline Program of Light Industry Technology and Engineering [grant QGJC20230301].
Institutional Review Board Statement
The study was conducted in accordance with the Declaration of Helsinki, and approved by the Ethics Committee from the School of Biotechnology at Jiangnan University (No. JNU20210618IRB05).
Informed Consent Statement
Informed consent was obtained from all subjects involved in the study.
Data Availability Statement
All experimental data acquired are reported in the manuscript.
Conflicts of Interest
Author Jialing Lu, Jia Zheng, Dong Zhao was employed by the company Flavor Science Innovation Center, Technology Research Center, Wuliangye Yibin Co., Ltd. The remaining authors declare that the research was conducted in the absence of any commercial or financial relationships that could be construed as a potential conflict of interest.
References
- Fan, W.L.; Qian, M.C. Identification of aroma compounds in Chinese “Yanghe Daqu” liquor by normal phase chromatography fractionation followed by gas chromatography olfactometry. Flavour Fragr. J. 2006, 21, 333–342. [Google Scholar] [CrossRef]
- Jin, G.; Zhu, Y.; Xu, Y. Mystery behind Chinese liquor fermentation. Trends Food Sci. Technol. 2017, 63, 18–28. [Google Scholar] [CrossRef]
- Williams, A.A. Flavour effects of ethanol in alcoholic beverages. Flavour Ind. 1972, 3, 604–607. [Google Scholar]
- Williams, A.A.; Rosser, P.R. Aroma enhancing effects of ethanol. Chem. Senses 1981, 2, 149–153. [Google Scholar] [CrossRef]
- Perpete, P.; Collin, S. Influence of beer ethanol content on the wort flavour perception. Food Chem. 2000, 71, 379–385. [Google Scholar] [CrossRef]
- Clark, R.A.; Hewson, L.; Bealin-Kelly, F.; Hort, J. The Interactions of CO2, Ethanol, Hop Acids and Sweetener on Flavour Perception in a Model Beer. Chemosens. Percept. 2011, 4, 42–54. [Google Scholar] [CrossRef]
- Ickes, C.M.; Cadwallader, K.R. Effect of ethanol on flavor perception of Rum. Food Sci. Nutr. 2018, 6, 912–924. [Google Scholar] [CrossRef]
- Petrozziello, M.; Asproudi, A.; Guaita, M.; Borsa, D.; Motta, S.; Panero, L.; Bosso, A. Influence of the matrix composition on the volatility and sensory perception of 4-ethylphenol and 4-ethylguaiacol in model wine solutions. Food Chem. 2014, 149, 197–202. [Google Scholar] [CrossRef]
- Villamor, R.R.; Evans, M.A.; Mattinson, D.S.; Ross, C.F. Effects of ethanol, tannin and fructose on the headspace concentration and potential sensory significance of odorants in a model wine. Food Res. Int. 2013, 50, 38–45. [Google Scholar] [CrossRef]
- Robinson, A.L.; Ebeler, S.E.; Heymann, H.; Boss, P.K.; Solomon, P.S.; Trengove, R.D. Interactions between Wine Volatile Compounds and Grape and Wine Matrix Components Influence Aroma Compound Headspace Partitioning. J. Agric. Food Chem. 2009, 57, 10313–10322. [Google Scholar] [CrossRef]
- Aznar, M.; Tsachaki, M.; Linforth, R.S.T.; Ferreira, V.; Taylor, A.J. Headspace analysis of volatile organic compounds from ethanolic systems by direct APCI-MS. Int. J. Mass Spectrom. 2004, 239, 17–25. [Google Scholar] [CrossRef]
- Athes, V.; Lillo, M.P.Y.; Bernard, C.; Perez-Correa, R.; Souchon, I. Comparison of experimental methods for measuring infinite dilution volatilities of aroma compounds in water/ethanol mixtures. J. Agric. Food Chem. 2004, 52, 2021–2027. [Google Scholar] [CrossRef] [PubMed]
- Tsachaki, M.; Aznar, M.; Linforth, R.S.T.; Taylor, A.J. Dynamics of flavour release from ethanolic solutions. In Developments in Food Science; Bredie, W.L.P., Petersen, M.A., Eds.; Elsevier: Amsterdam, The Netherlands, 2006; Volume 43, pp. 441–444. [Google Scholar]
- Boothroyd, E.L.; Linforth, R.S.T.; Cook, D.J. Effects of Ethanol and Long-Chain Ethyl Ester Concentrations on Volatile Partitioning in a Whisky Model System. J. Agric. Food Chem. 2012, 60, 9959–9966. [Google Scholar] [CrossRef] [PubMed]
- Wang, Z.; Ickes, C.; Cadwallader, K. Influence of Ethanol on Flavor Perception in Distilled Spirits. In Sex, Smoke, and Spirits: The Role of Chemistry; ACS Publications: Washington, DC, USA, 2019; pp. 277–290. [Google Scholar]
- Liu, M.; Xu, Z.; Zhong, Q.; Liu, C.; Li, X.; Yuan, X.; Xu, Z.; Xiong, Z. Comparison of the threshold determination method for Chinese liquor (Baijiu) flavor substances. J. Chin. Inst. Food Sci. Technol. 2018, 18, 253–260. [Google Scholar] [CrossRef]
- Grosch, W. Evaluation of the key odorants of foods by dilution experiments, aroma models and omission. Chem. Senses 2001, 26, 533–545. [Google Scholar] [CrossRef] [PubMed]
- Poisson, L.; Schieberle, P. Characterization of the key aroma compounds in an American Bourbon whisky by quantitative measurements, aroma recombination, and omission studies. J. Agric. Food Chem. 2008, 56, 5820–5826. [Google Scholar] [CrossRef] [PubMed]
- Pineau, B.; Barbe, J.-C.; Van Leeuwen, C.; Dubourdieu, D. Which impact for beta-damascenone on red wines aroma? J. Agric. Food Chem. 2007, 55, 4103–4108. [Google Scholar] [CrossRef] [PubMed]
- Lee, K.Y.M.; Paterson, A.; Piggott, J.R.; Richardson, G.D. Perception of whisky flavour reference compounds by Scottish distillers. J. Inst. Brew. 2000, 106, 203–208. [Google Scholar] [CrossRef]
- Lee, K.Y.M.; Paterson, A.; Piggott, J.R.; Richardson, G.D. Measurement of thresholds for reference compounds for sensory profiling of Scotch whisky. J. Inst. Brew. 2000, 106, 287–294. [Google Scholar] [CrossRef]
- Deleris, I.; Saint-Eve, A.; Guo, Y.; Lieben, P.; Cypriani, M.-L.; Jacquet, N.; Brunerie, P.; Souchon, I. Impact of Swallowing on the Dynamics of Aroma Release and Perception during the Consumption of Alcoholic Beverages. Chem. Senses 2011, 36, 701–713. [Google Scholar] [CrossRef][Green Version]
- Le Berre, E.; Atanasova, B.; Langlois, D.; Etievant, P.; Thomas-Danguin, T. Impact of ethanol on the perception of wine odorant mixtures. Food Qual. Prefer. 2007, 18, 901–908. [Google Scholar] [CrossRef]
- King, E.S.; Dunn, R.L.; Heymann, H. The influence of alcohol on the sensory perception of red wines. Food Qual. Prefer. 2013, 28, 235–243. [Google Scholar] [CrossRef]
- Goldner, M.C.; Zamora, M.C.; Di Leo Lira, P.; Gianninoto, H.; Bandoni, A. Effect of ethanol level in the perception of aroma attributes and the detection of volatile compounds in red wine. J. Sens. Stud. 2009, 24, 243–257. [Google Scholar] [CrossRef]
- Jones, P.R.; Gawel, R.; Francis, I.L.; Waters, E.J. The influence of interactions between major white wine components on the aroma, flavour and texture of model white wine. Food Qual. Prefer. 2008, 19, 596–607. [Google Scholar] [CrossRef]
- Escudero, A.; Campo, E.; Farina, L.; Cacho, J.; Ferreira, V. Analytical characterization of the aroma of five premium red wines. Insights into the role of odor families and the concept of fruitiness of wines. J. Agric. Food Chem. 2007, 55, 4501–4510. [Google Scholar] [CrossRef]
- Polster, J.; Schieberle, P. Structure-odor correlations in homologous series of alkanethiols and attempts to predict odor thresholds by 3D-QSAR studies. J Agric Food Chem 2015, 63, 1419–1432. [Google Scholar] [CrossRef] [PubMed]
- Lê, S.; Worch, T. Analyzing Sensory Data with R; Chapman & Hall/CRC: Boca Raton, FL, USA, 2015. [Google Scholar]
- Ickes, C.M.; Cadwallader, K.R. Effects of ethanol on flavor perception in alcoholic beverages. Chemosens. Percept. 2017, 10, 119–134. [Google Scholar] [CrossRef]
- Fan, W.; Xu, Y. Determination of odor thresholds of volatile aroma compounds in Baijiu by a forced-choice ascending concentration series method of limits. Liquor Mak. 2011, 38, 80–84. [Google Scholar]
- Zhang, X.; Wang, C.; Wang, L.; Chen, S.; Xu, Y. Optimization and validation of a head space solid-phase microextraction-arrow gas chromatography-mass spectrometry method using central composite design for determination of aroma compounds in Chinese liquor (Baijiu). J. Chromatogr. A 2019, 1610, 460584. [Google Scholar] [CrossRef]
- Wang, L.; Fan, S.; Yan, Y.; Yang, L.; Chen, S.; Xu, Y. Characterization of Potent Odorants Causing a Pickle-like Off-Odor in Moutai-Aroma Type Baijiu by Comparative Aroma Extract Dilution Analysis, Quantitative Measurements, Aroma Addition, and Omission Studies. J. Agric. Food Chem. 2020, 68, 1666–1677. [Google Scholar] [CrossRef]
- ISO 8586-2012; Sensory Analysis-General Guidelines for the Selection, Training and Monitoring of Selected Assessors and Expert Sensory Assessors. ISO: Geneva, Switzerland, 2012.
- He, Y.; Liu, Z.; Qian, M.; Yu, X.; Xu, Y.; Chen, S. Unraveling the chemosensory characteristics of strong-aroma type Baijiu from different regions using comprehensive two-dimensional gas chromatography-time-of-flight mass spectrometry and descriptive sensory analysis. Food Chem. 2020, 331, 127335. [Google Scholar] [CrossRef]
- ISO 13301; Sensory Analysis–Methodology General Guidance for Measuring Odour, Flavour and Test Detection Thresholds by a Three-Alternative Forced Choice (3-AFC) Procedure. ISO: Geneva, Switzerland, 2018.
- ASTM E1432-19; Standard Practice for Defining and Calculating Individual and Group Sensory Thresholds from Forced-Choice Data Sets of Intermediate Size. ATSM: West Conshohocken, PA, USA, 2019. [CrossRef]
Disclaimer/Publisher’s Note: The statements, opinions and data contained in all publications are solely those of the individual author(s) and contributor(s) and not of MDPI and/or the editor(s). MDPI and/or the editor(s) disclaim responsibility for any injury to people or property resulting from any ideas, methods, instructions or products referred to in the content. |
© 2025 by the authors. Licensee MDPI, Basel, Switzerland. This article is an open access article distributed under the terms and conditions of the Creative Commons Attribution (CC BY) license (https://creativecommons.org/licenses/by/4.0/).