Article

The Effectiveness of Liquid-Phase Microextraction of Beta-Blockers from Aqueous Matrices for Their Analysis by Chromatographic Techniques

by
Mihail Simion Beldean-Galea
1,2,*,
Mihaela-Cătălina Herghelegiu
1,2,*,
Vlad-Alexandru Pănescu
1,2,
Jérôme Vial
3,
Maria Concetta Bruzzoniti
4 and
Maria-Virginia Coman
2
1
Faculty of Environmental Science and Engineering, Babeș-Bolyai University, 30 Fântânele Str., RO-400294 Cluj-Napoca, Romania
2
“Raluca Ripan” Institute for Research in Chemistry, Babeş-Bolyai University, 30 Fântânele Str., RO-400294 Cluj-Napoca, Romania
3
Chemistry, Biology and Innovation Department, École Supérieure de Physique et de Chimie Industrielles ESPCI Paris PSL, 10 Rue Vauquelin, 75005 Paris, France
4
Department of Chemistry, University of Turin, Via P. Giuria 5, 10125 Turin, Italy
*
Authors to whom correspondence should be addressed.
Molecules 2025, 30(5), 1016; https://doi.org/10.3390/molecules30051016
Submission received: 24 January 2025 / Revised: 19 February 2025 / Accepted: 19 February 2025 / Published: 22 February 2025
(This article belongs to the Special Issue Green Chemistry Approaches to Analysis and Environmental Remediation)

Abstract

:
Beta-blockers are pharmaceuticals used to treat cardiovascular diseases such as hypertension, angina pectoris, and arrhythmia. Due to high consumption, they are continuously released into the environment, being detected in many aqueous matrices. The aim of this research is to test the effectiveness of two green liquid-phase microextraction procedures, such as dispersive liquid–liquid microextraction (DLLME) and solidification of floating organic droplet microextraction (SFOME) for the selective extraction of eight beta-blockers (atenolol, nadolol, pindolol, acebutolol, metoprolol, bisoprolol, propranolol, and betaxolol) from aqueous matrices for their analysis by gas chromatography (GC) or liquid chromatography (LC). The influence of extraction parameters, such as the type and volume of extraction and disperser solvents, and ionic strength were studied. The developed extraction procedures provide a good enrichment factor for six compounds (61.22–243.97), good extraction recovery (53.04–92.1%), and good sample cleaning for both extraction procedures. Good limits of detection (0.13 to 0.69 µg/mL for GC and 0.07 to 0.15 µg/mL for HPLC) and limits of quantification (0.39 to 2.10 µg/mL for GC and 0.20 to 0.45 µg/mL for LC) were obtained. The developed procedures were successfully applied to the analysis of selected beta-blockers in wastewater samples, proving their applicability to the real samples.

1. Introduction

Beta-blockers are widely prescribed pharmaceuticals for the treatment of cardiovascular diseases [1,2]. Cardiovascular diseases are a group of diseases of the heart and blood vessels, such as hypertension, angina pectoris, myocardial infarction, heart failure, and arrhythmia, being a common cause of mortality in all countries [3,4]. These pharmaceuticals block beta-adrenergic receptors, preventing the binding of adrenaline and noradrenaline, which leads to a decrease in heart rate, cardiac output, and implicitly, a diminish in blood pressure [5]. In addition to their beneficial effects on humans, beta-blockers are illegally used in horse racing [6] and in sports such as archery, billiards, and golf, being banned by the World Anti-Doping Agency [5,7,8]. They are also used to prevent stress and death in animals during transport to slaughterhouses [1]. The consumption of beta-blocker drugs in Romania has increased in the last 20 years [9]. The most commonly used beta-blockers for the treatment of cardiovascular diseases are propranolol, metoprolol, sotalol, atenolol, and bisoprolol [1]. Following excretion, beta-blockers are removed into the sewage system from where they reach the wastewater treatment plant and then proceed into the aquatic environment [10]. Iancu et al. [11] found the following concentrations of beta-blockers in wastewater from Romania from the influent: atenolol 29–623 ng/L, bisoprolol 5.1–309 ng/L, betaxolol 6.2–144 ng/L, propranolol 7.0–52.5 ng/L and from the effluent: atenolol 17–300 ng/L, bisoprolol 2.8–170 ng/L, betaxolol 3.1–40 ng/L, propranolol 5.1–41 ng/L. Alder et al. [12] found concentrations of atenolol between LOQ–83 ± 27 ng/L, sotalol between LOQ–52 ± 13 ng/L, metoprolol between LOQ–36 ± 13 ng/L, and propranolol between LOQ–8 ± 1 ng/L in river water from Switzerland. Concerns about the presence of these pharmaceuticals in the aquatic environment are growing due to their harmful effects on organisms [4,10,13] and their belonging to the class of Endocrine Disrupting Compounds, since they can disrupt testosterone levels in male organisms [7].
The presence of beta-blockers at trace concentration levels in aquatic environments requires the development of sensitive, reliable, and rapid methods for their detection. The most used method for the extraction of these pharmaceuticals from aqueous matrices involves solid phase extraction (SPE) [1,8,11,14]. However, the practicality of the SPE method is overshadowed by the use of a large amount of organic solvent and sample, the fact that it generates waste, the extraction cartridge being single use, it is expensive and time-consuming, and that the final extract must be concentrated to obtain a high enrichment factor. To overcome these problems, in recent years, miniaturized techniques have been developed to replace classical extraction techniques. Among these microextraction techniques are solid-phase microextraction (SPME) [15,16], stir-bar sorptive extraction (SBSE) [17,18], fabric-phase sorbent extraction (FPSE) [19,20], µQuEChERS (micro, quick, easy, cheap, effective, rugged, and safe) [21,22], single-drop microextraction (SDME) [23,24], hollow-fiber liquid-phase microextraction (HF-LPME) [25,26], dispersive liquid–liquid microextraction (DLLME) [27], and solidification of floating organic droplet microextraction (SFOME) [28,29]. Dispersive liquid–liquid microextraction has attracted considerable attention due to its advantages, which include low solvent and sample consumption, minimal waste production, cost-effectiveness, simplicity, rapidity, and high enrichment factors [2,30].
DLLME is a tertiary extraction system that consists of the liquid sample, the extraction solvent, and a cosolvent (dispersant or dispersion solvent), which plays a role in facilitating the dispersion of microdroplets of extraction solvent in the aqueous sample [31]. The appropriate mixture of extraction solvent and dispersant is introduced into the aqueous sample and stirred, resulting in the dispersion of small droplets of extraction solvent in the sample, which increases the contact surface between the aqueous sample and the extraction solvent, reducing the extraction time and increasing the enrichment factors [28,29]. The mixture is centrifuged, and the compounds of interest are found in the sedimented phase [31] (in the case of organic solvents that are heavier than water, such as in chloroform or dichloromethane [3]) or in the upper part for solvents lighter than water [32]. In the case of using 1-undecanol or 2-dodecanol, after centrifugation, the sample is placed in an ice-water bath to solidify the extraction solvent which is then collected, melted at room temperature, and analyzed by various chromatographic techniques [29]. The extraction performance is influenced by the type of extraction solvents and dispersants, their volumes [30], and other experimental conditions, such as sample pH or ionic strength [33], requiring different optimization procedures.
Despite all the advantages offered by these miniaturized extraction techniques, the use of SFOME or DLLME for the extraction of beta-blockers from water samples is scarce [27,29]. Generally, these extraction methods are applied to biological samples [3,5,23,34,35].
To fill these gaps, the present research aims to test the effectiveness of two green dispersive liquid–liquid microextraction procedures (DLLME and SFOME) for the selective extractions of eight beta-blockers (atenolol, nadolol, pindolol, acebutolol, metoprolol, bisoprolol, propranolol, and betaxolol) from aqueous matrices for their analysis by liquid chromatography or gas chromatography, the most widely used analytical methods for the analysis of the selected compounds. Moreover, the developed DLLME-GC-MS and SFOME-LC-PDA methods were then successfully applied to the analysis of these drugs in wastewater samples to verify their applicability to real samples.

2. Results

2.1. Optimization of DLLME and SFOME Conditions

For the optimization of DLLME and SFOME procedures we considered our previous works [33,36,37,38] in which we used 1-undecanol and chloroform as the most suitable solvents for extraction and acetonitrile as the dispersion solvent.
For a better comparison of the extraction method performance, we used the same protocol for both SFOME and DLLME. The protocol used is as follows: A volume of 10 mL of distilled water alkalinized to pH 11 with a NaOH solution was placed in a 15 mL polypropylene conical tube, and then the water sample was spiked with 1000 ng of each pharmaceutical product. The obtained sample was then optimized for the extraction protocol under different extraction conditions using a 23 full factorial experimental design. The relative extraction recovery (ER) of the studied pharmaceutical products from each experiment was used to express the extraction efficiency and to optimize the extraction conditions.
For both the DLLME and SFOME protocols, a total of eight experiments (23) were performed using different values of the three variables (volume of extraction solvent (X1) and dispersant (X2) and amount of salt (X3)) at minimum (−1), maximum (+1), and three experiments at the medium setpoint (0), respectively. Tables S1 and S2 of the Supplementary Materials present all the extraction recovery data obtained for each experiment performed. Table S3 provides the experimental conditions of each protocol used in experiments 1 to 11. Each data set (for DLLME and SFOME) was used to simultaneously optimize the extraction conditions using desirability functions (Supplementary Materials, Figures S1 and S2).
The relationship between response Y (extraction recovery) and the three independent variables—X1, X2, and X3—can be mathematical modeled by a linear polynomial equation [39], as follows:
Y = β 0 + β 1 X 1 + β 2 X 2 + β 3 X 3 + β 12 X 1 X 2 + β 13 X 1 X 3 + β 23 X 2 X 3 + β 123 X 1 X 2 X 3
where β 0 is a constant; β 1 , β 2 , and β 3 are linear coefficients; and β 12 , β 13 , β 23 , and β 123 are interaction coefficients.
The values of the coefficients of the polynomial equation can have positive values indicating a positive effect on the extraction recovery or negative values indicating a negative effect. The magnitude of these effects can be observed in Supplementary Tables S4 and S5, which include the significance levels of the factors and their interactions both for DLLME and SFOME.
For SFOME, the predicted optimal conditions have the following coded values: +1 for the dispersant volume, +1 for the salt amount, and +1 for the extraction solvent volume (Supplementary Materials Figure S1). These coded values correspond to the following experimental conditions: salt amount (NaCl): 2 g, dispersant volume (acetonitrile): 250 µL, and extraction solvent volume (1-undecanol): 100 µL.
For DLLME, the optimal conditions predicted by the model were in coded values: +1 for the dispersant volume, +1 for the salt amount, and 0 for the extraction solvent volume (Supplementary Materials Figure S2), which correspond to the following experimental conditions: salt amount (NaCl): 2 g, dispersant volume (acetonitrile): 250 µL, and extraction solvent volume (chloroform): 75 µL.
A summary of the maximum, minimum, and optimal extraction recoveries obtained by simulation for each compound in SFOME and DLLME is presented in Table 1.
Since the conditions predicted by the model are optimal theoretical conditions for their use in practical experiments, it is necessary that they be experimentally validated.

2.2. Validation of SFOME-LC-PDA Method

The DLLME-SFO-LC-PDA method was validated in terms of linearity, sensitivity (LOD and LOQ), intra-day precision (repeatability, %RSD) and inter-day precision (%RSD), and accuracy (recovery) in accordance with the International Committee for Harmonization (ICH) criteria [40].
The linearity of the method was evaluated based on the calibration curve created by plotting the peak area of the analyte versus the analyte concentration. For this, three replicates of different standard mixtures made by successive dilutions of the stock solution were injected in the range of 1.56 and 50 µg/mL of each compound. Good linearities were obtained for all analytes, with correlation coefficients (R2) greater than 0.995 (Table 2).
The sensitivity was determined in terms of limit of detection (LOD) and limit of quantification (LOQ) by statistical approaches using standard deviation (SD) of the regression line and the slope (S) each the calibration curve, using the following mathematical formulas: LOD = 3.3 × SD/S, LOQ = 10 × SD/S, according to ICH [40].
The instrument limits of detection for the beta-blockers were between 0.07 and 0.13 µg/mL and the instrument limits of quantification were between 0.20 and 0.45 µg/mL (Table 2).
The accuracy was expressed by the extraction recovery of analytes from the spiked water sample. The optimal SFOME parameters predicted by the model were used. Thus, a volume of 10 mL of Milli-Q water, alkalinized to pH 11 with a solution of 0.1 molar of NaOH, was spiked with 1000 ng of each selected compound. After adding 2 g of NaCl, a mixture containing 100 µL of 1-undecanol as an extraction solvent, and 250 µL acetonitrile as a disperser was added to the samples, followed by centrifugation for 5 min at 5000 rpm.
The obtained results were between 59.99 and 87.55% for all studied pharmaceuticals, except for atenolol and nadolol, for which the recoveries were 14.71 and 29.85%, respectively (Table 2).
The intra- and inter-day precision were evaluated by relative standard deviations (RSD%) on Milli-Q water samples spiked with 1000 ng of each pharmaceutical. The obtained RSD% values were below 4.87% for the intra-day precision and below 6.38% for the inter-day precision for all the pharmaceuticals tested (Table 2), thus agreeing with the requirements of the method validation procedures for compounds in the µg/mL concentration range.
The enrichment factors were calculated (Equation (2)) based on the ratio of analyte concentration in the collected organic phase and the initial concentration of the analyte in the liquid sample. The results showed that the developed SFOME protocol provided an EF between 61.22 and 89.34, except for atenolol and nadolol, for which the EF was 15.01 and 30.46, respectively (Table 2), higher than the EFs obtained by [23,29,35].

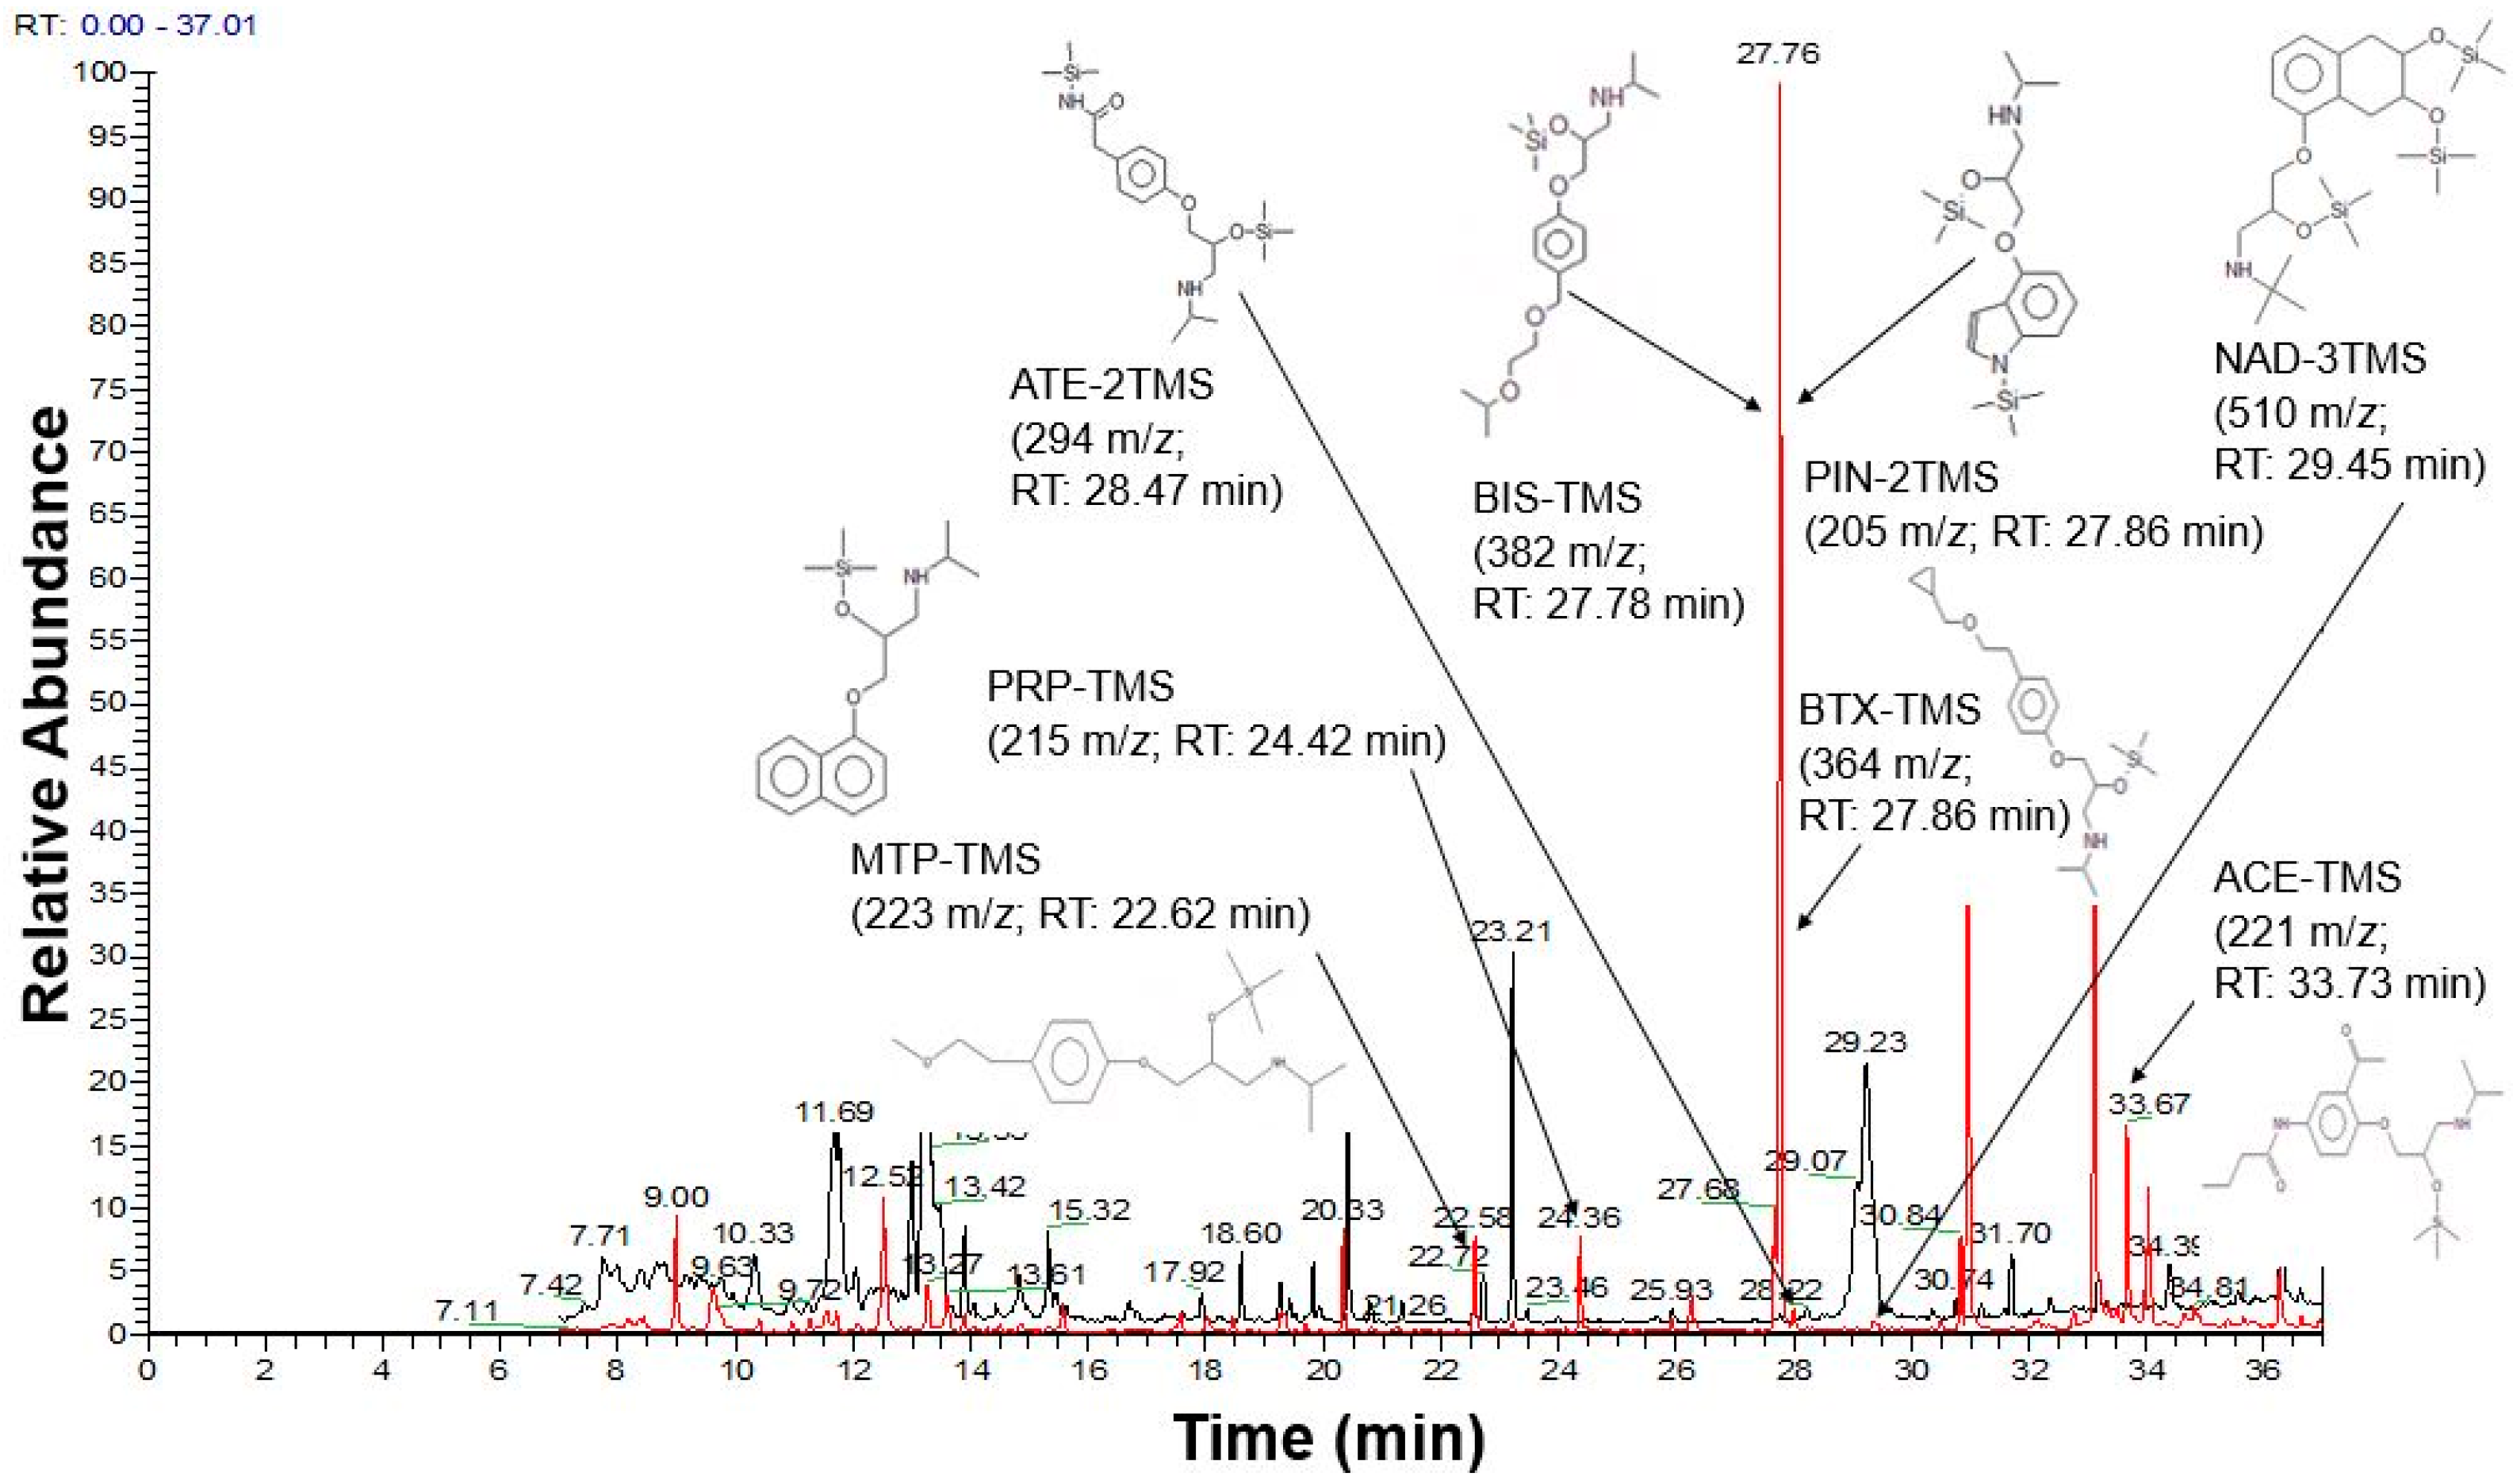
2.3. Validation of DLLME-GC-MS Method

The DLLME-GC-MS method was also validated according to ICH [40]. Linearity of the method was tested for the concentrations of the studied pharmaceuticals between 1.25 µg/mL and 100 µg/mL. The method has a good linearity with R over 0.998, low LODs and LOQs in the range of µg/mL, but higher relative standard deviations (RSD) (6.47–12.60%) for intra- and inter-day precision compared with SFOME-LC-PDA method (Table 3).
The extraction recovery range between 53.04 and 92.1% for all studied pharmaceuticals, except for atenolol and nadolol, for which the recoveries were <LOQ and 3.14%, respectively, while the enrichment factors (EF) were between 198.89 and 243.97, except for atenolol and nadolol, for which the EF was not estimated and 11.79, respectively (Table 3). The higher EF obtained in DLLME compared to SFOME is due to the fact that the volume of extraction solvent collected in DLLME was 40 µL compared to 75 µL in SFOME.

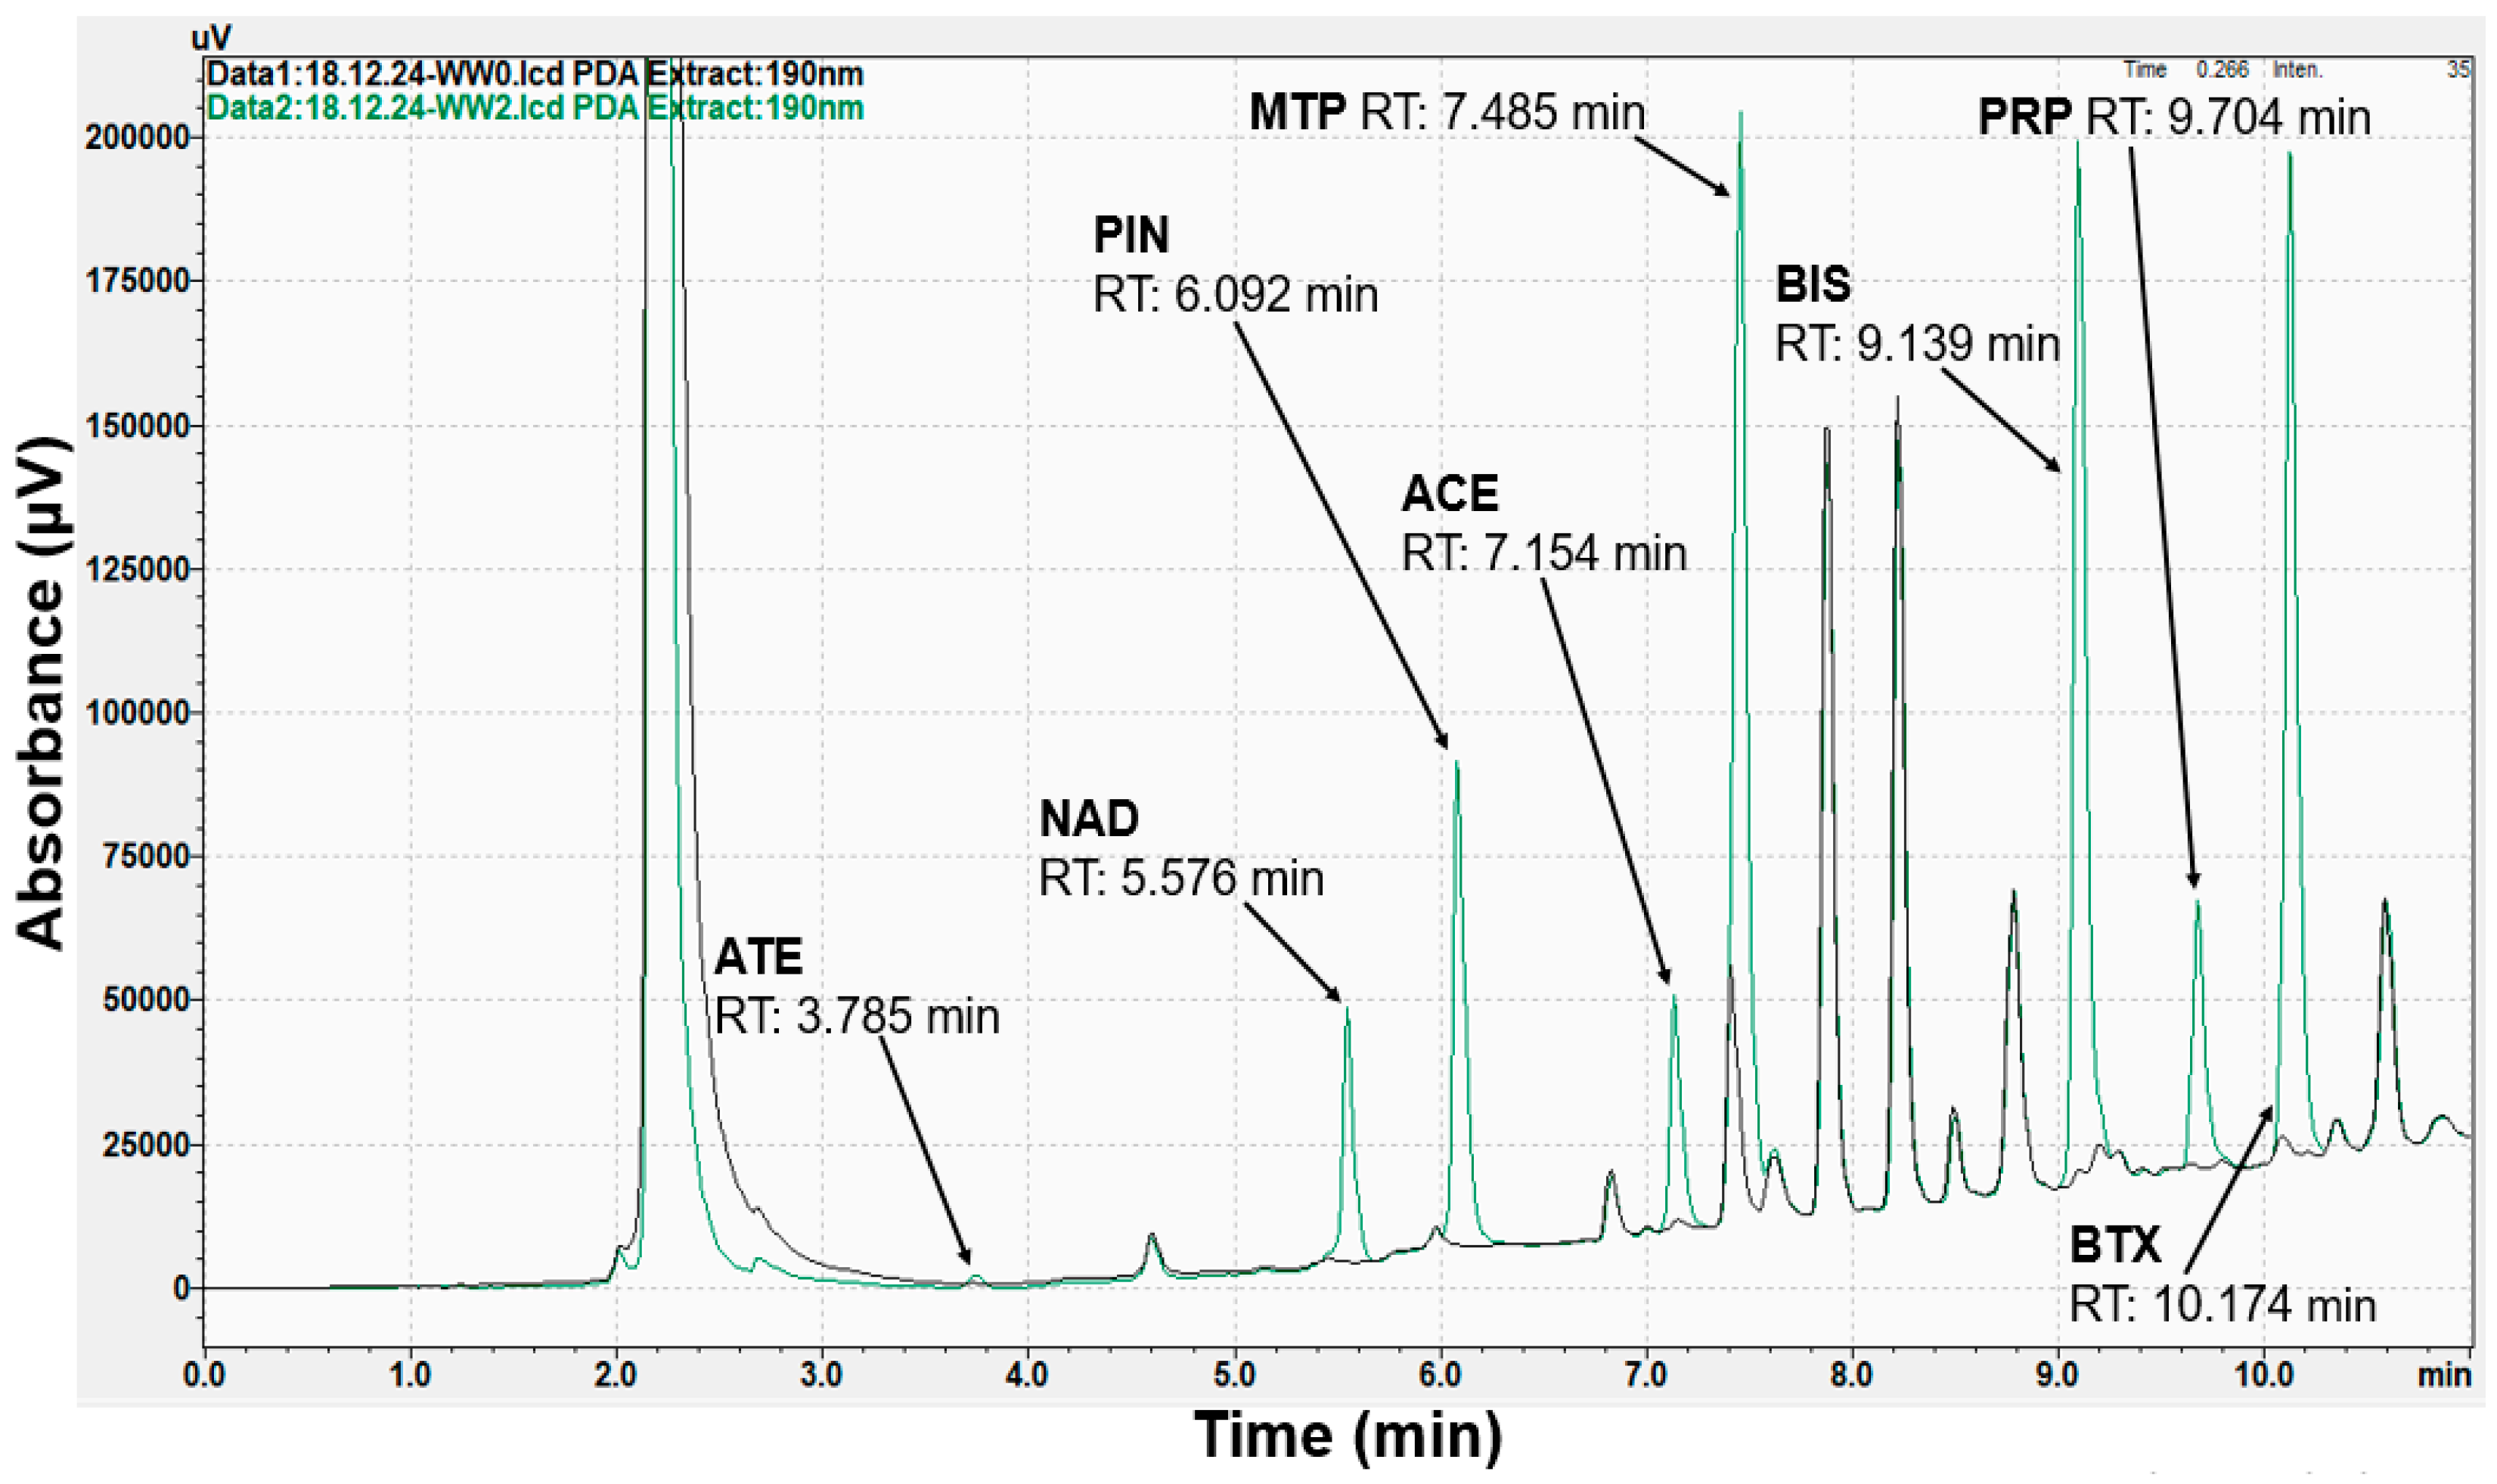
2.4. Analysis of Wastewater

The applicability of the proposed SFOME and DLLME protocols for the analysis of selected beta-blockers in wastewater was tested. For this purpose, 10 mL of wastewater was spiked with 625 ng of selected compounds and subjected to the extraction protocols described above. Before extraction, the wastewater samples were filtered with a 0.45 µm nylon white membrane filter to remove suspended particles.
Three experiments were performed for each extraction protocol, and subsequently, the enrichment factors and extraction recoveries were calculated. No significant interferences were observed in wastewater samples, indicating that the optimized sample preparation can eliminate most of the matrix components.
The HPLC-PDA chromatograms related to the non-spiked and spiked wastewater sample are shown in Figure 1 and the GC-MS chromatograms in Figure 2.
The results obtained for SFOME-LC-PDA of wastewater (Table 4) showed reasonable extraction recovery values ranging from 58.94 to 86.40%, except for atenolol (1.58%) and nadolol (19.20%).
For DLLME-GC-MS the results obtained on wastewater show extraction recovery values ranging from 63.34 to 82.13%. Atenolol was not detected, while for nadolol the recovery was 3.95% (Table 4).
By comparing the results obtained for SFOME-LC-PDA and DLLME-GC-MS of wastewater it can be seen that both extraction methods give adequate extraction for six of the eight selected beta-blockers. For atenolol and nadolol, none of the proposed protocols provide good extraction recoveries.
When comparing GC-MS and LC-PDA chromatographic methods, each method offers some advantages and disadvantages that are important to consider.
While GC-MS offers high specificity by using MS in compound identification and uses gases as a mobile phase that does not produce waste, this method is limited to the analysis of compounds with low boiling points and which are stable under thermal treatments. For compounds with high boiling points or unstable under thermal treatments, such as beta-blockers, the analysis involves an additional derivatization step that often requires reagents with high toxicity and can introduce additional errors in the quantification of target compounds. This can be seen in Table 3, where the precision has higher RSD% values compared to the LC method.
In contrast, the LC-PDA method allows the analysis of compounds in a wide range of polarities and offers the advantage of analyzing the extract as it results from the extraction, without any processing, but the method produces waste from the analysis consisting of the mobile phases used and has a lower specificity compared to GC-MS.
However, if we consider that the PDA detector can provide additional compound identification using UV spectra at different wavelengths, we can assume that this method offers better conditions for the analysis of selected compounds and, at the same time, a more environmentally friendly alternative in terms of sample processing.

2.5. Comparison with Other Studies

The SFOME and DLLME performances obtained in this study were compared with other sample preparation approaches for the microextraction of beta-blockers and are given in Table 5. The performances were evaluated in terms of sample volume, volume of extraction solvent, LOQ, and ER.
As can be observed in Table 5, our developed extraction protocol can provide satisfactory performance, comparable to others used for the microextractions of beta-blockers from different matrices. It is worth noting that, in general, these microextractions are applied to a small number of compounds (maximum five [3]), while in our study eight pharmaceutical compounds were analyzed simultaneously. Since our extraction method has a low LOQ, a small amount of extraction solvent, and a good recovery of over 58.94%, we can affirm that the proposed protocols fulfill the requirements for a green method of extraction.

3. Materials and Methods

3.1. Chemicals and Reagents

The reference substances of the studied pharmaceuticals (atenolol, nadolol, pindolol, acebutolol, metoprolol, bisoprolol, propranolol, and betaxolol) were purchased from Sigma-Aldrich (Steinheim, Germany). The molecular structure and some physicochemical properties of the studied pharmaceuticals are presented in Supplementary Materials (Table S6).
Stock standard solutions of individual compounds (nadolol, pindolol, acebutolol, metoprolol, propranolol, and betaxolol), at a concentration of 1000 µg/mL each, were prepared in methanol, while solutions of atenolol and bisoprolol were prepared in acetonitrile.
All prepared stock standards were stored at 4 °C in the dark until analysis. Acetonitrile and methanol of HPLC grade, 1-undecanol, sodium chloride, monopotassium phosphate, sodium hydroxide, chloroform, and n-hexane were all purchased from Merck (Darmstadt, Germany). The derivatization agent N,O-bis(trimethylsilyl)trifluoroacetamide (BSTFA) with 1% trimethylchlorosilane (TMCS) was purchased from Cerilliant (Round Rock, TX, USA).
Milli-Q water was prepared using a Milli-Q-Plus ultrapure water system (Millipore, Milford, MA, USA). For the centrifugation of the samples, an Eppendorf centrifuge, model 5804 R (Eppendorf, Wien, Austria) was used, and a lab oven Memmert UFE 400 (Memmert, Schwabach, Germany) was used for the derivatization procedure.

3.2. Instrumentation

HPLC analyses were carried out using Shimadzu equipment (SLC-40D) with a photodiode detector (SPD-M40). LabSolution software (Version 5.101) was used for the control of the instrument and data acquisition. The separation of the studied pharmaceuticals was performed on a Kinetex C18 (250 × 4.6 mm, 5 µm; Phenomenex, Torrance, CA, USA) column with a flow rate of 1.0 mL/min and an oven temperature of 40 °C. The injection volume was 20 µL. The gradient elution program (acetonitrile (ACN) and KH2PO4 25 mM) was used starting at 10% ACN, increasing to 40% ACN for 8 min, increasing to 50% ACN for 2 min, and then a 1 min increase to 80% ACN, and held for 7 min, with an equilibrium time between analyses of 8 min. The analysis time is 18 min. The specific UV wavelengths used for PDA detection were as follows: atenolol, nadolol, metoprolol, bisoprolol, betaxolol—190 nm; pindolol—205 nm; acebutolol—231 nm; propranolol—223 nm.
GC–MS analyses were carried out using a Focus GC equipment with a DSQ II mass spectrometer (single quadrupole) controlled by XCalibur software (v3.0.63, Thermo Electron Corp.) and TriPlus Autosampler (Thermo Electron Corporation, Waltham, MA, USA). The separation of the studied pharmaceuticals was performed on HP-5MS (30 m × 0.25 mm, 0.25 µm; Thermo Fisher Scientific, Norristown, PA, USA) column; the carrier gas was Helium (purity 99.999%) at a flow rate of 1 mL/min. The column temperature was initially set at 100 °C, and then raised by 5 °C/min to 250 °C, and from 250 °C to 300 °C by increments of 10 °C/min. The GC inlet temperature was 310 °C and the transfer line temperature was kept at 300 °C. The ionization was performed in the electron impact mode (70 eV, ion source temperature 220 °C) and the acquisition of mass spectra was performed by scanning from 100 to 550 m/z to obtain the mass spectra of the studied pharmaceuticals. The quantification was performed by selected ion monitoring (SIM) mode and comparison of relative retention times (RT): metoprolol (223 m/z, RT: 22.64 min), propranolol (215 m/z, RT: 24.43 min), pindolol (205 m/z, RT: 27.86 min), bisoprolol (382 m/z, RT: 27.78 min), betaxolol (364 m/z, RT: 27.86 min), atenolol (294 m/z, RT: 28.47 min), nadolol (510 m/z, RT: 29.45 min), acebutolol (221 m/z, RT: 33.73 min).
Due to their polarity, our pharmaceuticals were analyzed as derivative compounds. The derivatization protocol was performed with 100 µL BSTFA with 1% TMCS, for 1 h at 100 °C, according to our previous study [41].

3.3. Extraction by SFOME and DLLME Protocol

The SFOME extraction protocol was performed as follows: A volume of 10 mL of distilled water, alkalized to pH 11, was introduced into a 15 mL polypropylene centrifuge tube. Each sample was spiked with 1000 ng of each drug (ATE, PIN, NAD, ACE, PRP, BTX, MTP), to which 2 g of NaCl were added, followed by vigorous shaking of the mixture until the salt dissolved. A total of 350 µL of a mixture consisting of 100 µL 1-undecanol and 250 µL acetonitrile were added, shaken, and then centrifuged for 5 min at 4000 rpm. After centrifugation to separate the two phases, the polypropylene tube was cooled in an ice-water bath for 15 min to solidify the 1-undecanol. The 1-undecanol was collected with a spatula and transferred to a conical flask. After melting the extract at room temperature, a volume of 20 µL was directly injected into the HPLC-PDA for analysis.
The DLLME extraction protocol was performed as follows: a volume of 10 mL of distilled water, alkalized to pH 11, was introduced into a 15 mL polypropylene centrifuge tube. Each sample received 1000 ng of each drug (ATE, PIN, NAD, ACE, PRP, BTX, MTP), to which 2 g of NaCl was added, followed by vigorous stirring of the mixture until the salt dissolved. Then, 325 µL of a mixture consisting of 75 µL chloroform and 250 µL acetonitrile was added, stirred, and then centrifuged for 5 min at 4000 rpm. After centrifugation, a drop of chloroform formed at the bottom of the tube, was collected, evaporated to dryness under a nitrogen stream, and was subjected to the derivatization protocol with BSTFA with 1% TMCS. The derivatized mixture was evaporated to dryness and redissolved in n-hexane and injected into GC-MS.

3.4. Enrichment Factor and Extraction Recovery

To evaluate the performance of the extraction method, the enrichment factor (EF) and relative extraction recovery (ER%) were calculated using the following equations [3,31]:
E F = C c o l C a q
E R % = n c o l n a q × 100 = C c o l × V c o l C a q × V a q × 100
where Ccol is the analyte concentration in the collected organic phase; Caq is the initial concentration of the analyte in the liquid sample; ncol is the total amount of analyte extracted in the collected organic phase; naq is the total amount of analyte in the liquid sample; and Vcol and Vaq represent the volume of the collected organic phase and the volume of the liquid sample, respectively [31,38].
Following the Document SANTE 11312/2021 guidelines, the recovery must be within the range 70–120%, with an associated repeatability RSD ≤ 20% [42].

3.5. Statistical Approach Used for DLLME and SFOME Optimization

To achieve the best experimental conditions, a multivariate experimental design approach is considered in many cases [23,27,29].
Using statistical and mathematical criteria, the interaction effects resulting from the simultaneous variation in decisive factors and responses are observed, in order to maximize the extraction efficiency [27,43].
To realize the experimental design, first of all, the factors that influence the process are selected to produce the best experimental response. They are selected either from previous experience or from specialized literature. The factors are given levels, indicated by the numbers −1, 0, and +1 or other signs, depending on the software used. Level +1 is assigned to the factor that optimally meets the objective, –1 is assigned to the factor that does not meet the objective, and 0 is the average level of the factor [43].
The advantage of using a multivariate experimental design approach, if the factors are selected correctly, is saving time and money [43].
In the present work, a 23 experimental design with a triplicate center point (0) was selected, with two levels (−1 and +1) for each factor. The factors studied were the amount of sodium chloride (X1), the volume of the dispersion solvent (acetonitrile, X2), and the volume of the extraction solvent (1-undecanol for SFOME and chloroform for DLLME, X3). The minimum, central, and maximum values assigned to the factors are shown in the following table (Table 6).
The desirability function was used to simultaneously optimize the experimental conditions to obtain the best recovery. It combines the individual responses into a composite function, where the factors decisively involved give the desired response [39].
The statistical software package JMP14 (SAS Institute, Cary, NC, USA) was used for statistical modeling.

3.6. Sample Collection

The wastewater sample was collected from the influent of the wastewater treatment plant from Cluj-Napoca, Romania, during a 24 h period. The composite sample was collected in a clean polypropylene flask, kept at 4 °C in the dark, transported to the laboratory, and stored in the freezer until analysis.

4. Conclusions

In the present research work, we propose fast, simple, and green SFOME and DLLME protocols for the simultaneous extraction and analysis of eight beta-blockers from wastewater samples, which were optimized and validated.
A 23 experimental design with a triplicate center point (0) was used to optimize the extraction protocols, which reduced the number of experiments in the optimization steps.
A pertinent comparison between the advantages and disadvantages of the two chromatographic methods applied to the analysis of selected beta-blockers is provided.
The developed SFOME-LC-PDA protocol provides a satisfactory enrichment factor (60.14–88.16, except for atenolol (1.61) and nadolol (19.60)) and good extraction recovery (58.94–86.40%, except for atenolol (1.58%) and nadolol (19.20)) when the protocol was applied to the analysis of selected beta-blockers in wastewater samples.
For DLLME-GC-MS, the results obtained on wastewater provide an enrichment factor ranging from 190.03 to 246.38, except for atenolol, which was not detected, and nadolol, which has an EF of 11.85. The extraction recovery ranged from 63.34 to 82.13% for six of the eight compounds with the mention that atenolol was not detected, while for nadolol the recovery was 3.95%.
Although the SFOME-LC-PDA method is fast, both in terms of analysis time (18 min) and preparation of extracts for analysis (20 min), it has lower enrichment factors compared to the DLLME-GC-MS method.
The DLLME-GC-MS method, on the other hand, requires a longer analysis time (37 min), and in addition to the extraction time (20 min), it requires more than 1 h for derivatization of the compounds.
However, we can state that the methods developed by us show much better results compared to the experimental work carried out worldwide so far. The proposed microextraction protocols are easy to apply in any laboratory, use small volumes of sample and organic solvent, and have a short extraction time, being an appropriate and environmentally friendly alternative to traditional extraction techniques.
Even if the proposed protocols do not provide an adequate degree of extraction for all eight selected compounds, we can say that the information presented in this paper and the results obtained for the six compounds out of the eight selected in the study can constitute a starting point for the future optimization of other green extraction methods that can provide satisfactory results for all eight compounds.

Supplementary Materials

The following supporting information can be downloaded at: https://www.mdpi.com/article/10.3390/molecules30051016/s1. Table S1: The set code value of factors used in each SFOME experiment and the values of extraction recovery (%) obtained for each of the studied pharmaceuticals; Table S2: The set code value of factors used in each DLLME experiment and the values of extraction recovery (%) obtained for each of the studied pharmaceuticals;.Table S3: The experimental conditions of each protocol of experiments; Table S4: The magnitude of the effects and the significance level for the factors and their interactions for the SFOME protocol; Table S5: The magnitude of the effects and the significance level for the factors and their interactions for the DLLME protocol; Table S6: The molecular structure and some physico-chemical properties of the studied pharmaceuticals; Figure S1: The optimal conditions predicted by model, minimum, maximum and optimum extraction recovery values, and the value of desirability function for the SFOME protocol; Figure S2: The optimal conditions predicted by model, minimum, maximum and optimum extraction recovery values, and the value of desirability function for the DLLME protocol.

Author Contributions

Conceptualization, M.S.B.-G.; methodology, M.S.B.-G., M.-C.H., J.V. and M.C.B.; validation, M.-C.H. and M.S.B.-G.; formal analysis, M.-C.H. and V.-A.P.; investigation, M.-C.H. and M.S.B.-G.; resources, M.S.B.-G.; data curation, M.S.B.-G., M.-C.H., M.C.B. and J.V.; writing—original draft, M.-C.H., M.S.B.-G. and M.-V.C.; writing—review and editing, M.S.B.-G., J.V., M.C.B. and M.-V.C.; supervision, M.S.B.-G.; funding acquisition, M.S.B.-G. All authors have read and agreed to the published version of the manuscript.

Funding

This work is part of the doctoral studies, Babeș-Bolyai University, Environmental Science Doctoral School Cluj-Napoca, Romania, and the APC was funded by Research-Competitiveness-Excellence Support Programs of Babeș-Bolyai University under grants no: AGC35592-AGC35596/19.11.2024.

Institutional Review Board Statement

Not applicable.

Informed Consent Statement

Not applicable.

Data Availability Statement

Data are contained within the article and Supplementary Materials.

Conflicts of Interest

The authors declare no conflicts of interest.

Abbreviations

The following abbreviations are used in this manuscript:
DLLMEDispersive Liquid–Liquid Microextraction
SFOMESolidification Of Floating Organic Droplet Microextraction
GCGas Chromatography
LCLiquid Chromatography
GC–MSGas Chromatography coupled with Mass Spectrometry
HPLC–PDAHigh-Performance Liquid Chromatography with Photodiode Array Detector
LOQLimit of Detection
LODLimit of Quantification
SPESolid-Phase Extraction
SPMESolid-Phase Microextraction
SBSEStir-Bar Sorptive Extraction
FPSEFabric-Phase Sorbent Extraction
µQuEChERSMicro Quick, Easy, Cheap, Effective, Rugged, and Safe
SDMESingle-Drop Microextraction
HF-LPMEHollow-Fiber Liquid-Phase Microextraction
ATEAtenolol
NADNadolol
PINPindolol
ACEAcebutolol
METMetoprolol
BISBisoprolol
PRPPropranolol
BTXBetaxolol
RSDRelative Standard Deviation
SDStandard Deviation
Sthe Slope of each the Calibration Curve
ICHInternational Committee for Harmonization
EFEnrichment Factor
EREnrichment Recovery
BSTFAN,O-bis(trimethylsilyl)trifluoroacetamide
TMCSTrimethylchlorosilane
TMStrimethylsilyl
DLLME-SFODispersive Liquid–Liquid Microextraction based on Solidification pf Floating Organic Droplet
VA DLPME-SFODVortex Assisted Dispersive Liquid-Phase Microextraction with Solidification of Floating Organic Droplet
TDLLMETandem Dispersive Liquid–Liquid Microextraction
AALLME-SFODAir-Assisted Liquid–Liquid Microextraction with Solidification of Floating Organic Droplet
ACNAcetonitrile
MSMass Spectrometry
PDAPhotodiode Array Detector
USAUnited States of America

References

  1. Xu, J.; Sun, H.; Zhang, Y.; Alder, A.C. Occurrence and Enantiomer Profiles of Β-Blockers in Wastewater and a Receiving Water Body and Adjacent Soil in Tianjin, China. Sci. Total Environ. 2019, 650, 1122–1130. [Google Scholar] [CrossRef]
  2. Yıldırım, S.; Sellitepe, H.E. Vortex Assisted Liquid-Liquid Microextraction based on in Situ Formation of a Natural Deep Eutectic Solvent by Microwave Irradiation for the Determination of Beta-Blockers in Water Samples. J. Chromatogr. A 2021, 1642, 462007. [Google Scholar] [CrossRef] [PubMed]
  3. Jouyban, A.; Sorouraddin, M.H.; Farajzadeh, M.A.; Somi, M.H.; Fazeli-Bakhtiyari, R. Determination of Five Antiarrhythmic Drugs in Human Plasma by Dispersive Liquid–Liquid Microextraction and High-Performance Liquid Chromatography. Talanta 2015, 134, 681–689. [Google Scholar] [CrossRef]
  4. Zhang, K.; Zhao, Y.; Fent, K. Cardiovascular Drugs and Lipid Regulating Agents in Surface Waters at Global Scale: Occurrence, Ecotoxicity and Risk Assessment. Sci. Total Environ. 2020, 729, 138770. [Google Scholar] [CrossRef]
  5. Nisyriou, S.; Zacharis, C.K. Microextraction-Based Techniques for the Determination of Beta-Blockers in Biological Fluids: A Review. Separations 2025, 12, 14. [Google Scholar] [CrossRef]
  6. Lee, H.-B.; Sarafin, K.; Peart, T.E. Determination of β-blockers and β2-agonists in Sewage by Solid-Phase Extraction and Liquid Chromatography–Tandem Mass Spectrometry. J. Chromatogr. A 2007, 1148, 158–167. [Google Scholar] [CrossRef]
  7. Maszkowska, J.; Stolte, S.; Kumirska, J.; Łukaszewicz, P.; Mioduszewska, K.; Puckowski, A.; Caban, M.; Wagil, M.; Stepnowski, P.; Białk-Bielińska, A. Beta-Blockers in the Environment: Part II. Ecotoxicity study. Sci. Total Environ. 2014, 493, 1122–1126. [Google Scholar] [CrossRef]
  8. Gonçalves, R.; Ribeiro, C.; Cravo, S.; Cunha, S.C.; Pereira, J.A.; Fernandes, J.O.; Afonso, C.; Tiritan, M.E. Multi-Residue Method for Enantioseparation of Psychoactive Substances and Beta Blockers by Gas Chromatography–Mass Spectrometry. J. Chromatogr. B 2019, 1125, 121731. [Google Scholar] [CrossRef]
  9. Pană, M.; Crăciun, P.; Nicolae, C.; Tăerel, A.-E.; Lupuliasa, D. The Cardiovascular Market in Romania During 1998–2017 Period—Analysis and Evolution. Farmacia 2019, 67, 922–930. [Google Scholar] [CrossRef]
  10. Yi, M.; Sheng, Q.; Sui, Q.; Lu, H. β-Blockers in the Environment: Distribution, Transformation, and Ecotoxicity. Environ. Poll. 2020, 266, 115269. [Google Scholar] [CrossRef] [PubMed]
  11. Iancu, V.-I.; Radu, G.-L.; Scutariu, R. A New Analytical Method for the Determination of Beta-Blockers and one Metabolite in the Influents and Effluents of Three Urban Wastewater Treatment Plants. Anal. Methods 2019, 11, 4668–4680. [Google Scholar] [CrossRef]
  12. Alder, A.C.; Schaffner, C.; Majewsky, M.; Klasmeier, J.; Fenner, K. Fate of β-Blocker Human Pharmaceuticals in Surface Water: Comparison of Measured and Simulated Concentrations in The Glatt Valley Watershed, Switzerland. Water Res. 2010, 44, 936–948. [Google Scholar] [CrossRef]
  13. Godoy, A.A.; Kummrow, F.; Pamplin, P.A.Z. Occurrence, Ecotoxicological Effects and Risk Assessment of Antihypertensive Pharmaceutical Residues in the Aquatic Environment—A Review. Chemosphere 2015, 138, 281–291. [Google Scholar] [CrossRef] [PubMed]
  14. Hernando, D.; Gomez, M.J.; Aguera, A.; Fernandez-Alba, A.R. LC-MS Analysis of Basic Pharmaceuticals (Beta-Blockers and Anti-Ulcer Agents) in Wastewater and Surface Water. TrAC Trends Anal. Chem. 2007, 26, 581–594. [Google Scholar] [CrossRef]
  15. Gil García, M.D.; Canada Canada, F.; Culzonia, M.J.; Vera-Candioti, L.; Siano, G.G.; Goicoechea, H.C.; Martínez Galera, M. Chemometric Tools Improving the Determination of Anti-Inflammatory and Antiepileptic Drugs in River and Wastewater by Solid-Phase Microextraction and Liquid Chromatography Diode Array Detection. J. Chromatogr. A 2009, 1216, 5489–5496. [Google Scholar] [CrossRef]
  16. Unceta, N.; Sampedro, M.C.; Bakar, N.K.A.; Gómez-Caballero, A.; Goicolea, M.A.; Barrio, R.J. Multi-Residue Analysis of Pharmaceutical Compounds in Wastewaters by Dual Solid-Phase Microextraction Coupled to Liquid Chromatography Electrospray Ionization Ion Trap Mass Spectrometry. J. Chromatogr. A 2010, 1217, 3392–3399. [Google Scholar] [CrossRef] [PubMed]
  17. Mao, X.; He, M.; Chen, B.; Hu, B. Membrane Protected C18 Coated Stir Bar Sorptive Extraction Combined with High Performance Liquid Chromatography-Ultraviolet Detection for the Determination of Non-Steroidal Anti-Inflammatory Drugs in Water Samples. J. Chromatogr. A 2016, 1472, 27–34. [Google Scholar] [CrossRef]
  18. Arismendi, D.; Becerra-Herrera, M.; Cerrato, I.; Richter, P. Simultaneous Determination of Multiresidue and Multiclass Emerging Contaminants in Waters by Rotating-Disk Sorptive Extraction–Derivatization Gas Chromatography/Mass Spectrometry. Talanta 2019, 201, 480–484. [Google Scholar] [CrossRef] [PubMed]
  19. Kalaboka, M.; Chrimatopoulos, C.; Jiménez-Holgado, C.; Boti, V.; Sakkas, V.; Albanis, T. Exploring the Efficiency of UHPLC-Orbitrap MS for the Determination of 20 Pharmaceuticals and Acesulfame K in Hospital and Urban Wastewaters with the Aid of FPSE. Separations 2020, 7, 46. [Google Scholar] [CrossRef]
  20. Misolas, A.; Sleiman, M.; Sakkas, V. Application of Fabric Phase Sorptive Extraction as a Green Method for the Analysis of 10 Anti-Diabetic Drugs in Environmental Water Samples. Molecules 2024, 29, 4834. [Google Scholar] [CrossRef] [PubMed]
  21. Berlioz-Barbier, A.; Baudot, R.; Wiest, L.; Gust, M.; Garric, J.; Cren-Olivé, C.; Buleté, A. MicroQuEChERS–Nanoliquid Chromatography–Nanospray–Tandem Mass Spectrometry for the Detection and Quantification of Trace Pharmaceuticals in Benthic Invertebrates. Talanta 2015, 132, 796–802. [Google Scholar] [CrossRef]
  22. Wicht, A.J.; Heye, K.; Schmidt, A.; Oehlmann, J.; Huhn, C. The Wastewater Micropollutant Carbamazepine in Insectivorous Birds—An Exposure Estimate. Anal. Bioanal. Chem. 2022, 414, 4909–4917. [Google Scholar] [CrossRef]
  23. Farhadi, K.; Hatami, M.; Forough, M.; Molaei, R. Dispersive Liquid–Liquid Microextraction of Propranolol Enantiomers from Human Plasma Based on the Solidification of a Floating Organic Droplet. Bioanalysis 2013, 5, 701–710. [Google Scholar] [CrossRef]
  24. Kiszkiel-Taudul, I.; Starczewska, B. Single Drop Microextraction Coupled with Liquid Chromatography-Tandem Mass Spectrometry (SDME-LC-MS/MS) for Determination of Ranitidine in Water Samples. Microchem. J. 2019, 145, 936–941. [Google Scholar] [CrossRef]
  25. Ramos Payán, M.; Bello López, M.Á.; Fernández-Torres, R.; Callejón Mochón, M.; Gómez Ariza, J.L. Application of Hollow Fiber-Based Liquid-Phase Microextraction (HF-LPME) for the Determination of Acidic Pharmaceuticals in Wastewaters. Talanta 2010, 82, 854–858. [Google Scholar] [CrossRef] [PubMed]
  26. Mlunguza, N.Y.; Ncube, S.; Mahlambi, P.N.; Chimuka, L.; Madikizela, L.M. Determination of Selected Antiretroviral Drugs in Wastewater, Surface Water and Aquatic Plants Using Hollow Fibre Liquid Phase Microextraction and Liquid Chromatography—Tandem Mass Spectrometry. J. Hazard. Mater. 2020, 382, 121067. [Google Scholar] [CrossRef] [PubMed]
  27. Hemmati, M.; Asghari, A.; Bazregar, M.; Rajabi, M. Rapid Determination of Some Beta-Blockers in Complicated Matrices by Tandem Dispersive Liquid-Liquid Microextraction Followed by High Performance Liquid Chromatography. ABC 2016, 408, 8163–8176. [Google Scholar] [CrossRef]
  28. Hryniewicka, M.; Starczewska, B.; Gołębiewska, A. Determination of Budesonide and Sulfasalazine in Water and Wastewater Samples Using DLLME-SFO-HPLC-UV Method. Water 2019, 11, 1581. [Google Scholar] [CrossRef]
  29. AlSalem, H.S.; Algethami, K.F.; Ali, M.A.; Mansour, F.R. Development of an Ecofriendly Dispersive Liquid Phase Microextraction Method for The Preconcentration of Β-Blockers in Waste and Environmental Samples. Microchem. J. 2024, 205, 111279. [Google Scholar] [CrossRef]
  30. Notardonato, I.; Avino, P. Dispersive Liquid–Liquid Micro Extraction: An Analytical Technique Undergoing Continuous Evolution and Development—A Review of the Last 5 Years. Separations 2024, 11, 203. [Google Scholar] [CrossRef]
  31. Rezaee, M.; Assadi, Y.; Milani Hosseini, M.-R.; Aghaee, E.; Ahmadi, F.; Berijani, S. Determination of Organic Compounds in Water Using Dispersive Liquid–Liquid Microextraction. J. Chromatogr. A 2006, 1116, 1–9. [Google Scholar] [CrossRef] [PubMed]
  32. Leong, M.-I.; Huang, S.-D. Dispersive Liquid–Liquid Microextraction Method based on Solidification of Floating Organic Drop Combined with Gas Chromatography with Electron-Capture or Mass Spectrometry Detection. J. Chromatogr. A 2008, 1211, 8–12. [Google Scholar] [CrossRef] [PubMed]
  33. Beldean-Galea, M.S.; Coman, V.; Thiébaut, D.; Vial, J. Determination of Four Acidic Nonsteroidal Anti-Inflammatory Drugs in Wastewater Samples by Dispersive Liquid-Liquid Microextraction Based on Solidification of Floating Organic Droplet and High-Performance Liquid Chromatography. J. Sep. Sci. 2015, 38, 641–648. [Google Scholar] [CrossRef] [PubMed]
  34. Zamani-Kalajahi, M.; Fazeli-Bakhtiyari, R.; Amiri, M.; Golmohammadi, A.; Afrasiabi, A.; Khoubnasabjafari, M.; Jouyban, A. Dispersive Liquid–Liquid Microextraction based on Solidification of Floating Organic Droplet Followed by Spectrofluorimetry for Determination of Carvedilol in Human Plasma. Bioanalysis 2013, 5, 437–448. [Google Scholar] [CrossRef]
  35. Farahmand, F.; Ghasemzadeh, B.; Naseri, A. Air-Assisted Liquid–Liquid Microextraction Using Floating Organic Droplet Solidification for Simultaneous Extraction and Spectrophotometric Determination of some Drugs in Biological Samples Through Chemometrics Methods. Spectrochim. Acta—A. Mol. Biomol. Spectrosc. 2018, 188, 72–79. [Google Scholar] [CrossRef]
  36. Beldean-Galea, M.S.; Klein, R.; Coman, M.-V. Simultaneous Determination of Four Nonsteroidal Anti-Inflammatory Drugs and Three Estrogen Steroid Hormones in Wastewater Samples by Dispersive Liquid–Liquid Microextraction based on Solidification of Floating Organic Droplet and HPLC. J. AOAC Int. 2020, 103, 392–398. [Google Scholar] [CrossRef] [PubMed]
  37. Beldean-Galea, M.S.; Vial, J.; Thiébaut, D.; Coman, M.-V. Analysis of Multiclass Organic Pollutant in Municipal Landfill Leachate by Dispersive Liquid-Liquid Microextraction and Comprehensive Two-Dimensional Gas Chromatography Coupled with Mass Spectrometry. Environ. Sci. Pollut. Res. 2020, 27, 9535–9546. [Google Scholar] [CrossRef] [PubMed]
  38. Herghelegiu, M.C.; Pănescu, V.A.; Bocoș-Bințințan, V.; Coman, R.-T.; Berg, V.; Lyche, J.L.; Bruzzoniti, M.C.; Beldean-Galea, M.S. Simultaneous Determination of Steroids and Nsaids, Using DLLME-SFO Extraction and HPLC Analysis, in Milk and Eggs Collected from Rural Roma Communities in Transylvania, Romania. Molecules 2024, 29, 96. [Google Scholar] [CrossRef] [PubMed]
  39. Candioti, L.V.; De Zan, M.M.; Cámara, M.S.; Goicoeche, H.C. Experimental Design and Multiple Response Optimization. Using the Desirability Function in Analytical Methods Development. Talanta 2014, 124, 123–138. [Google Scholar] [CrossRef]
  40. Validation of Analytical Procedures: Text and Methodology, Q2(R1). 2005. Available online: https://www.ema.europa.eu/en/documents/scientific-guideline/ich-q2r2-guideline-validation-analytical-procedures-step-5-revision-1_en.pdf (accessed on 18 November 2024).
  41. Herghelegiu, M.-C.; Ernault, A.; Beldean-Galea, M.S.; Coman, M.-V. HPLC-PDA versus GC-MS in the Analysis of Paracetamol and Non-Steroidal Anti-Inflammatory Drugs in Wastewater. Stud. Univ. Babes-Bolyai Chem. 2023, 68, 19–35. [Google Scholar] [CrossRef]
  42. European Commission. Analytical Quality Control and Method Validation Procedures for Pesticide Residues Analysis in Food and Feed SANTE 11312/2021 v2. 2021. Available online: https://food.ec.europa.eu/system/files/2023-11/pesticides_mrl_guidelines_wrkdoc_2021-11312.pdf (accessed on 15 November 2024).
  43. Mousavi, L.; Tamiji, Z.; Khoshayand, M.R. Applications and Opportunities of Experimental Design for the Dispersive Liquid–Liquid Microextraction Method—A Review. Talanta 2018, 190, 335–356. [Google Scholar] [CrossRef]
Figure 1. HPLC-PDA chromatograms obtained at 190 nm of wastewater (black color) and spiked wastewater samples (green color); ATE–atenolol, NAD–nadolol, PIN–pindolol, ACE–acebutolol, MTP–metoprolol, BIS–bisoprolol, PRP–propranolol, BTX–betaxolol.
Molecules 30 01016 g001
Figure 2. Total ion GC chromatograms of wastewater (black color) and spiked wastewater sample (red color); ATE–TMS–atenolol–TMS, NAD–TMS–nadolol–TMS, PIN–TMS–pindolol–TMS, ACE–TMS–acebutolol–TMS, MTP–TMS–metoprolol–TMS, BIS–TMS–bisoprolol–TMS, PRP–TMS–propranolol, BTX–TMS–betaxolol–TMS.
Molecules 30 01016 g002
Table 1. Maximum, minimum, and optimum extraction recoveries obtained by simulation.
Beta-BlockersAbbreviationExtraction Recovery (%)
SFOMEDLLME
MinimumMaximumOptimumMinimumMaximumOptimum
AtenololATE3.2413.948.59---
NadololNAD8.3424.9116.625.318.516.91
PindololPIN37.1084.8860.9964.58110.0787.32
AcebutololACE26.2573.0349.64−14.78134.9760.10
MetoprololMTP40.1494.5967.3698.82161.62130.22
BisoprololBIS45.56119.4682.5199.69181.6469.94
PropranololPRP67.42136.69102.05106.36151.00128.68
BetaxololBTX65.94134.52100.23 82.79152.40117.59
“-“ not identified.
Table 2. The performances of the SFOME-LC-PDA method.
Beta-BlockersCalibration Curve EquationSDR2LOD (µg/mL)LOQ (µg/mL)Precision (RSD%)ER (%)EF
Intra-Inter-
ATEy = 168,393x + 180,1715764.510.99830.110.342.646.2314.7115.01
NADy = 119,820x + 194,4652386.550.99910.070.202.912.3729.8530.46
PINy = 73,452x + 116,1742877.820.99630.130.393.934.4568.7970.20
ACEy = 72,148x + 22,0662612.560.99980.120.361.232.3759.9961.22
MTPy = 130,487x + 203,8075902.370.99500.150.454.355.0274.5076.02
BISy = 130,628x + 142,3985005.230.99740.130.380.732.7381.4583.11
PRPy = 131,203x + 32,4565322.120.99980.130.414.846.3886.8188.58
BTXy = 127,756x + 107,5224001.820.99810.100.314.876.1087.5589.34
Table 3. The performances of the DLLME-GC-MS method.
Derivatized Beta-BlockersCalibration Curve EquationSDR2LOD (µg/mL)LOQ (µg/mL)Precision (RSD%)ER (%)EF
Intra-Inter-
ATE-2TMSy = 341,497x + 79,56727,525.770.99950.270.81----
NAD–3TMSy = 2E + 06x – 995,40292,698.550.99990.150.467.3810.743.1411.79
PIN-2TMSy = 567,017x + 191,180118,922.340.99830.692.1012.3613.5953.04198.89
ACE-TMSy = 219,605x – 332,1878649.250.99990.130.398.3311.0856.89212.75
MTP-TMSy = 2E + 06x + 2E + 06182,859.840.99840.300.9110.3411.1778.91220.91
BIS-TMSy = 637,676x – 181,11647,182.950.99970.240.7412.6014.2692.1243.97
PRP-TMSy = 2E + 06x + 2E + 06188,228.140.99840.310.948.8211.4871.6212.75
BTX-TMSy = 531,846x + 4113.835,621.760.99810.220.6712.4414.9174.6217.17
“-“ not estimated.
Table 4. The performances of the developed SFOME and DLLME protocol applied to wastewater.
Beta-BlockersSFOMEDLLME
Spiked Amount (ng)WastewaterER (%)EFSpiked Amount (ng)WastewaterER (%)EF
InitialFoundInitialFound
ATE6250.69 10.751.581.61625ndnd--
NAD6.06128.5419.2019.600.0429.643.9511.85
PIN5.36421.2865.2266.550.04475.0763.34190.03
ACE1.67377.5458.9460.14nd494.6765.96197.87
MTP117.87554.9068.5369.921.28599.5679.94239.82
BIS17.14550.4083.6185.32nd615.7882.10246.31
PRP7.04558.0486.4088.160.20540.5672.07216.22
BTX17.03553.6484.1485.86nd615.9482.13246.38
“nd” not detected; “-“ not calculated.
Table 5. Comparison between the proposed SFOME and DLLME with other microextractions of beta-blockers.
Beta-BlockersMethodMatrixSample Volume (mL)Extraction Solvent (mL)LOQ (µg/mL)ER (%)EFRef.
metoprolol, propranolol, carvedilol, diltiazem, verapamilDLLMEplasma0.66100 µL dichloromethane0.007–0.0194.4–10.833–82[3]
racemic propranololDLLME-SFOplasma0.540 µL of 1-undecanol0.0513.3–13.016.7–16.2[23]
metoprolol, propranololTDLLMEplasma, wastewater10103 µL of 1,2-dichloroethane and 45 µL of aqueous extractant phase with pH value of 2.00.028–0.00334–4575–100[27]
atenolol,
acebutolol,
bisoprolol, betaxolol
VA DLPME-SFODriver water, wastewater550 µL of dodecanol0.01–0.07-23–55[29]
carvedilolDLLME-SFOplasma175 µL of 1-undecanol0.04 1--[34]
atenolol,
propranolol, carvedilol
AALLME-SFODurine1125 µL of 1-dodecanol and 160 µL of water with 1000 mg/L Triton X-1000.26–0.3064.22–94.5711.24–16.55[35]
atenolol, nadolol, pindolol, acebutolol, metoprolol, bisoprolol, propranolol, betaxololSFOMEwastewater10100 µL of 1-undecanol0.20–0.4558.94–86.4060.92–88.16This study.
DLLME75 µL chloroform0.39–1.2363.34–82.13190.03–246.38
1 Lower limit of quantification. “-” no data available.
Table 6. Minimum, central, and maximum values of the factors used to create experimental design.
FactorsValues for DLLME and SFOME
Lowest (–1)Central Point (0)Highest (+1)
NaCl (g) (X1)0.51.252
Disperser (µL) (X2)100175250
Extractant (µL) (X3)5075100
Disclaimer/Publisher’s Note: The statements, opinions and data contained in all publications are solely those of the individual author(s) and contributor(s) and not of MDPI and/or the editor(s). MDPI and/or the editor(s) disclaim responsibility for any injury to people or property resulting from any ideas, methods, instructions or products referred to in the content.

