Article

Physicochemical Characteristics, Antioxidant Properties, and Identification of Bioactive Compounds in Australian Stingless Bee Honey Using High-Performance Thin-Layer Chromatography

by
Mariana Mello dos Santos
1,
Tomislav Sostaric
1,
Lee Yong Lim
1,2 and
Cornelia Locher
1,2,*
1
Centre for Optimisation of Medicines, Division of Pharmacy, School of Allied Health, The University of Western Australia, Crawley, WA 6009, Australia
2
Institute for Paediatric Perioperative Excellence, The University of Western Australia, Crawley, WA 6009, Australia
*
Author to whom correspondence should be addressed.
Molecules 2025, 30(6), 1223; https://doi.org/10.3390/molecules30061223
Submission received: 5 February 2025 / Revised: 6 March 2025 / Accepted: 7 March 2025 / Published: 9 March 2025

Abstract

:
This study investigates the physiochemical properties, chemical composition, and antioxidant activity of Australian stingless bee honey blends from two bee species, Tetragonula carbonaria and Tetragonula hockingsi, harvested in Burpengary East, Queensland at different times of the year. The moisture content of the honey samples ranged from 26.5% to 30.0%, total soluble solids from 70.0 to 73.5° Brix, and pH from 3.57 to 4.19. The main sugars identified were trehalulose (13.9 to 30.3 g/100 g), fructose (12.9 to 32.3 g/100 g), and glucose (4.80 to 23.7 g/100 g). The total phenolic content (TPC), measured using the Folin–Ciocalteu assay, ranged from 26.1 to 58.6 mg of gallic acid equivalents/100 g. The antioxidant activity was investigated with the 2,2-diphenyl-1-picrylhydrazyl (DPPH) assay, with values ranging from 1.39 to 6.08 mmol of Trolox equivalents/kg. Antioxidant constituents were determined using a High-Performance Thin-Layer Chromatography (HPTLC)-DPPH assay. The HPTLC-DPPH analysis revealed that honey samples collected in May 2022 contained the highest number of antioxidant compounds. Some constituents were identified using an HPTLC-derived database and also quantified utilising HPTLC analysis. Lumichrome was present in all honey samples, while luteolin and kaempferide were detected only in some. Kaempferol or isorhamnetin was also found to be present, although a definitive distinction between these two chemically closely related compounds could not be made by HPTLC analysis. The results showed that honey produced by Tetragonula hockingsi and Tetragonula carbonaria shares similar properties and composition when harvested at the same time, with only minor differences in moisture, fructose, and glucose content.

Graphical Abstract

1. Introduction

Traditional medicine has been practiced for thousands of years, with honey being one of the oldest and most valued treatments for various human diseases [1]. Honey produced by the European honeybee, Apis mellifera, has been extensively studied, revealing significant antibacterial and antioxidant properties. These properties are linked to anti-inflammatory, anticancer, and anti-aging effects [2].
Along with honey derived from European honeybees (Apis mellifera), Australia also produces stingless bee honey, known as sugarbag, which has a rich history of medicinal use among First Nations peoples. However, unlike Apis mellifera honey, research on the bioactivities of Australian stingless bee honey remains limited.
There are approximately 500 species of stingless bee distributed throughout the tropical and subtropical regions of the world, including Australia, Africa, Latin America, and Southeast Asia [3]. These bees play a crucial role as pollinators for native flora and also contribute significantly to the pollination of various crops [4]. Stingless bee products are considered to be superior sources of biologically active compounds, such as phenolic compounds, compared to European honeybee products. This advantage is largely attributed to the rich vegetation in the tropical and subtropical regions where stingless bees can be found [5].
Phytochemicals, particularly phenolic acids and flavonoids, may be present in only small amounts in honey, yet they significantly influence its unique flavour, appearance, and bioactivity. These compounds may exhibit a range of beneficial effects, including antioxidant, anticancer, anti-inflammatory, antibacterial, and antiviral activities [6]. Consequently, they contribute to the notable health benefits of honey. For example, research has shown a strong correlation between the phenolic contents of honey and its antioxidant capacity [7,8].
Given the sparsity of data on the benefits of Australian stingless bee honey, this study aims to determine the physicochemical properties as well as to identify and quantify constituents in stingless bee honey samples from Australia, using a High-Performance Thin-Layer Chromatography (HPTLC)-derived database of mainly phenolic compounds [9]. It also assesses the antioxidant capacity of the honeys and determines the contribution of various constituents to their overall antioxidant activity using an HPTLC-DPPH assay. In order for this study to reflect the typical characteristics of stingless bee honey from this particular region, rather than analysing individual samples, honey blends were used for the various analyses [10,11].

2. Results and Discussion

2.1. Physicochemical Parameters

The physicochemical characteristics (moisture, pH, soluble solids, and sugar profile) of the honey blends were evaluated, and the results are shown in Table 1.
The average moisture content of the honey blends was 28.0 ± 1.36%, which is higher than that typically found in Apis mellifera honey, where it is usually below 20% [12]. This elevated water content may be attributed to the tropical and humid environment where the stingless bees collect nectar [13]. These moisture levels are consistent with findings from other studies on stingless bee honey in various countries. For instance, Alvarez-Suarez et al. [14] reported an average moisture content of 28.62% for Cuban stingless bee honey, while Biluca et al. [13] found a moisture content of 31% for stingless bee honey from Brazil. The highest moisture content was found in the honey collected in May and produced by Tetragonula hockingsi (30.0 ± 0.0577%), while the lowest moisture content was observed in the honey produced by Tetragonula carbonaria and harvested in November (26.5 ± 0.000%). It was also noted that, when comparing Tetragonula carbonaria and Tetragonula hockingsi honey harvested in the same month, T. hockingsi consistently exhibited a slightly higher moisture content.
The average soluble solids content of the stingless bee honey blends analysed was found to be 72.1 ± 1.36 °Brix, with Tetragonula hockingsi honey collected in May (70.0 ± 0.0577 °Brix) exhibiting the lowest °Brix value, and Tetragonula carbonaria honey harvested in November (73.5 ± 0.000 °Brix) showing the highest. T. carbonaria honey consistently displayed higher °Brix values compared to T. hockingsi honey when harvested in the same month. °Brix values reflect the sugar content in honey and are influenced by factors such as floral sources and environmental conditions [15,16]. They are also important indicators of potential adulteration [16,17]. Due to its higher water content and lower total sugar percentage, stingless bee honey typically exhibits lower °Brix values compared to Apis mellifera honey, which usually has values above 75 [15,17]. The °Brix values observed in this study are consistent with previous findings for Brazilian stingless bee honey, which reported values ranging from 71.1 to 74.7 [15].
The honey blends analysed showed an acidic pH, ranging between 3.57 and 4.19. The lowest pH was observed in the sample TH-May, while the sample TH-Nov exhibited the highest value. The pH of honey can be influenced by the floral origin of the nectar collected by the bees [18]. Additionally, bees’ mandibular secretions, the concentrations of various acids, and the presence of minerals such as calcium, sodium, and potassium can also affect pH [18,19]. The average pH of all blends analysed was 3.87 ± 0.244, which is consistent with pH values reported for stingless bee honey from Brazil (3.80) [13], Malaysia (3.29) [20], and Thailand (3.60) [3].
Carbohydrates, in the form of simple sugars, are the dominant components of honey [21]. Traditionally, fructose and glucose have been recognised as the main sugars in honey [22]. However, recent studies have identified trehalulose as a significant sugar present in stingless bee honey [23]. As shown in Table 1, there were notable statistical differences in carbohydrate levels among the stingless bee honey blends analysed. The fructose contents ranged from 12.9 g/100 g to 32.3 g/100 g, with an average of 24.9 ± 7.27 g/100 g. The glucose levels varied between 4.80 g/100 g and 23.7 g/100 g, with a mean value of 15.4 ± 7.74 g/100 g. Trehalulose was detected in all samples, ranging from 13.9 g/100 g to 30.3 g/100 g, with an average of 19.6 ± 6.52 g/100 g. Interestingly, both honey samples harvested in May exhibited the highest trehalulose levels, while also having the lowest concentrations of fructose and glucose. This suggests a potential seasonal variation in the sugar composition of stingless bee honey. Tetragonula hockingsi also exhibited higher fructose and glucose levels than Tetragonula carbonaria when harvested in the same month.

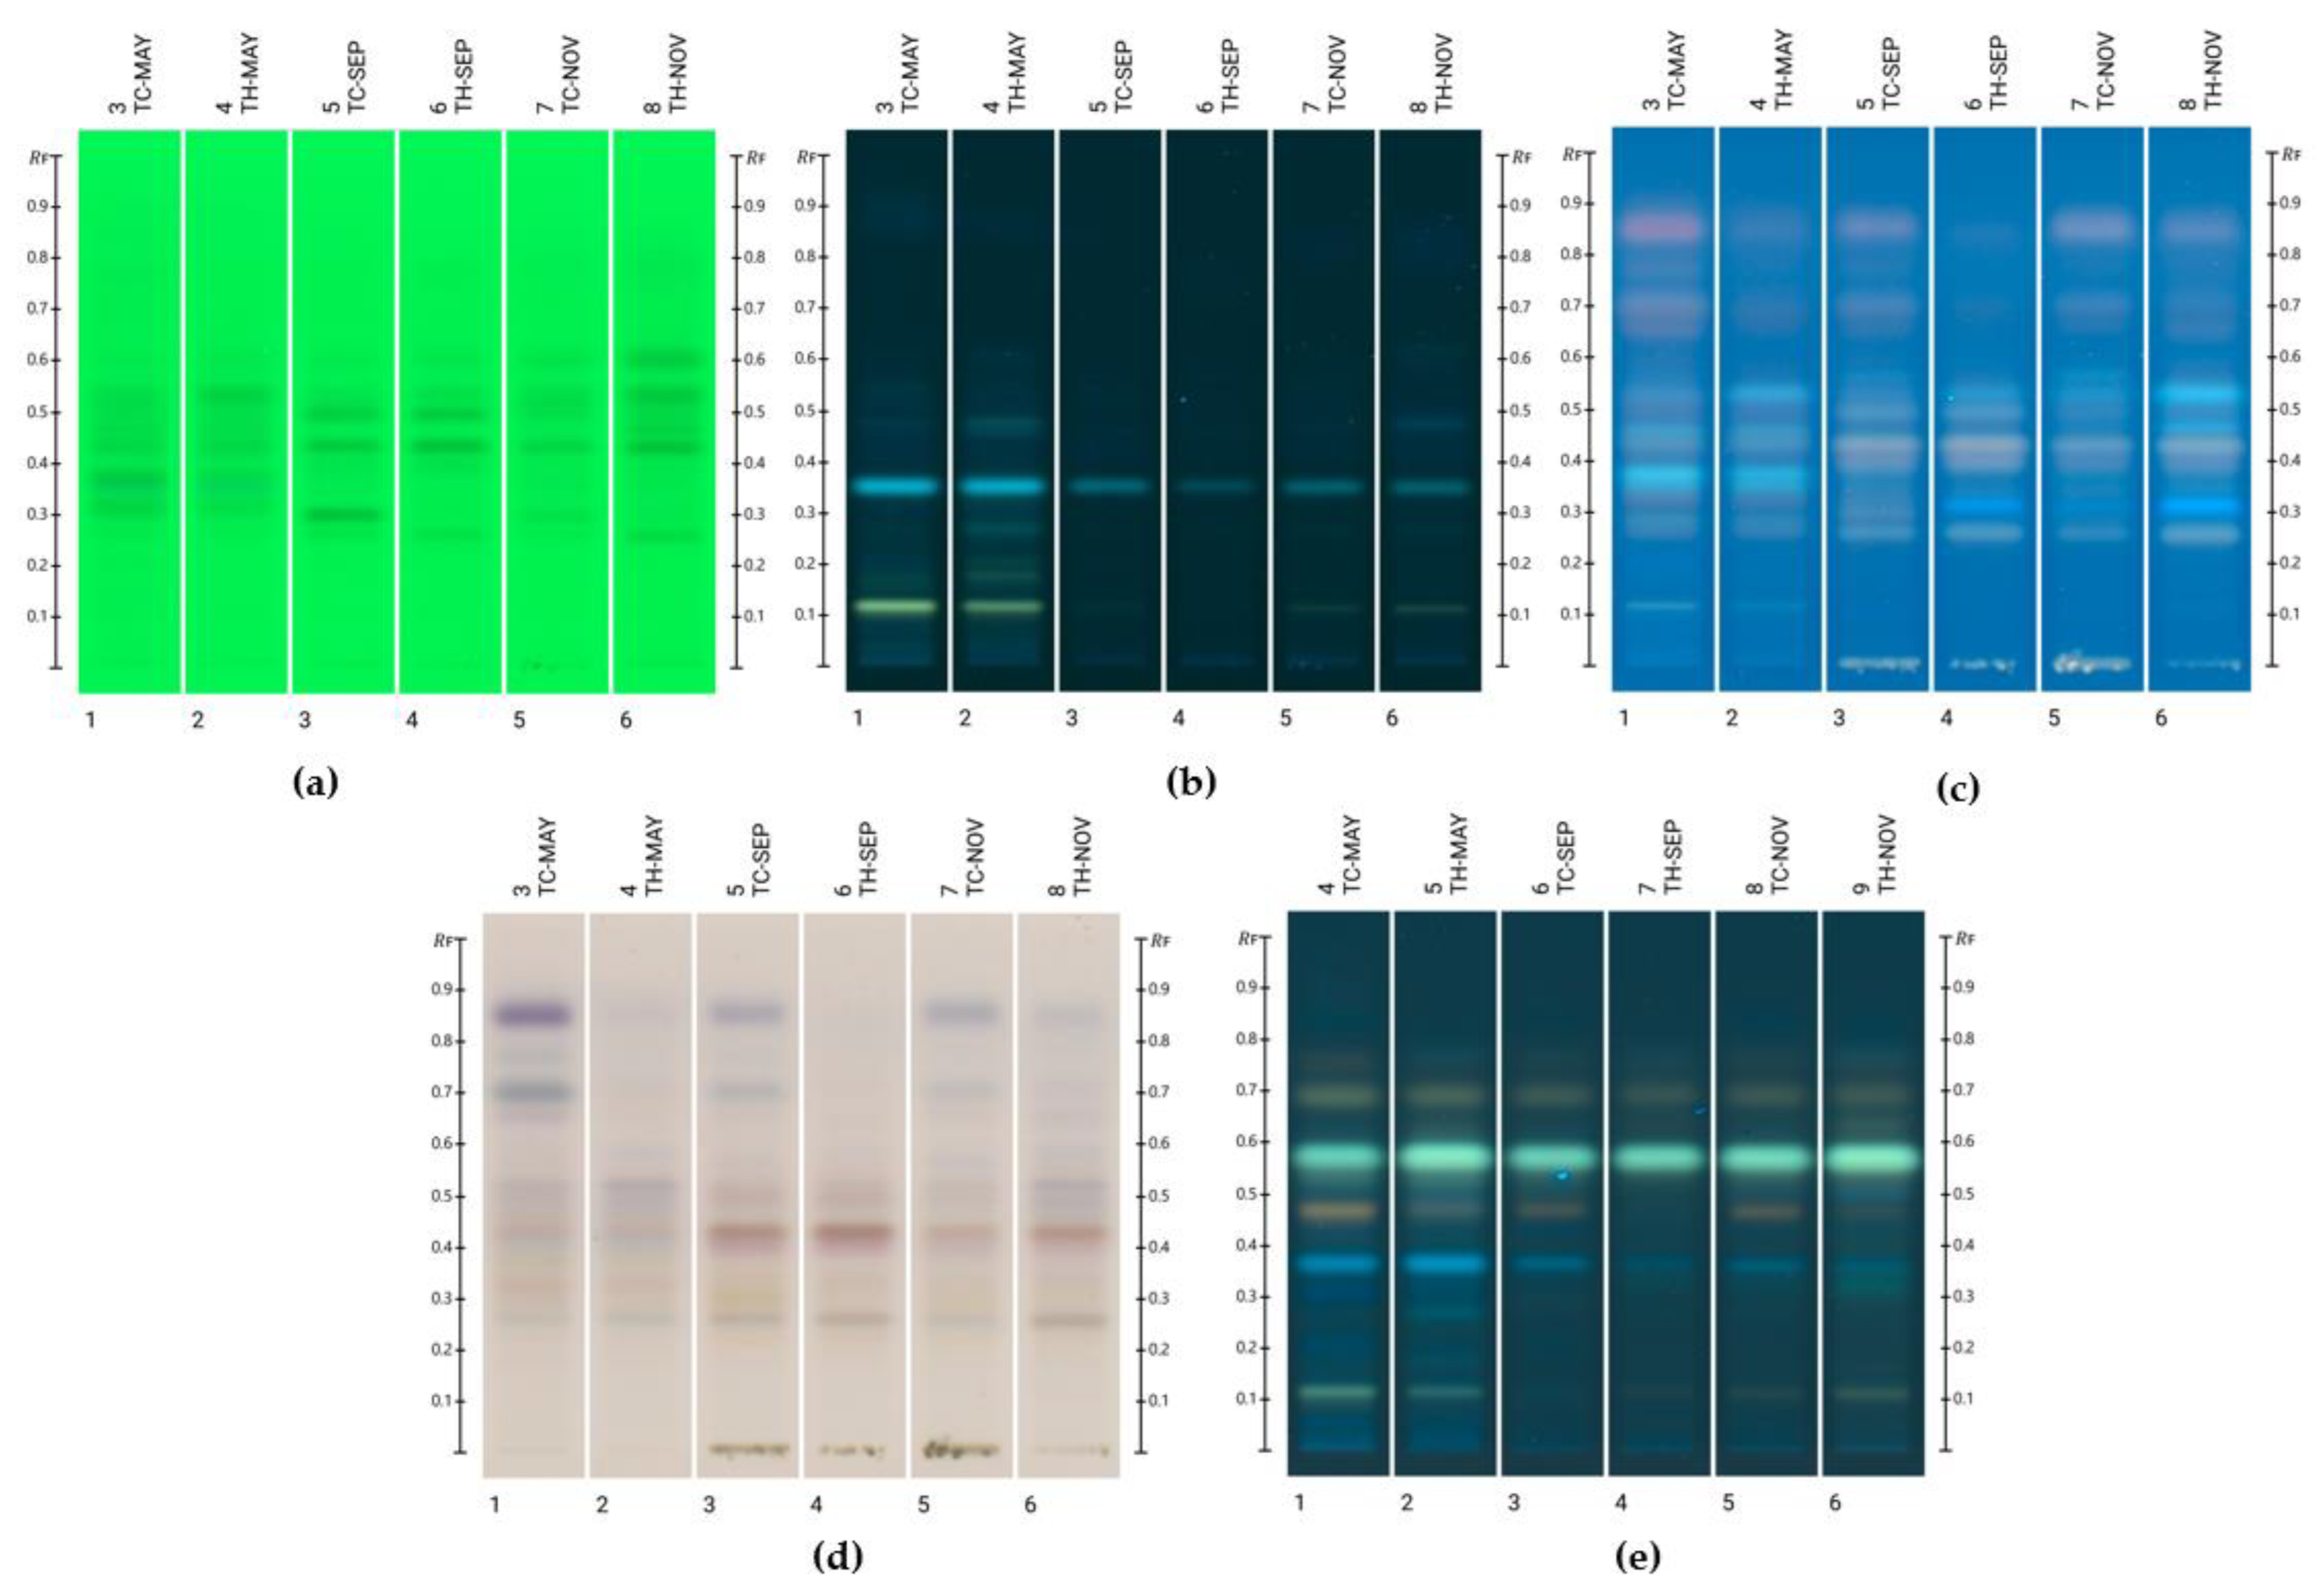
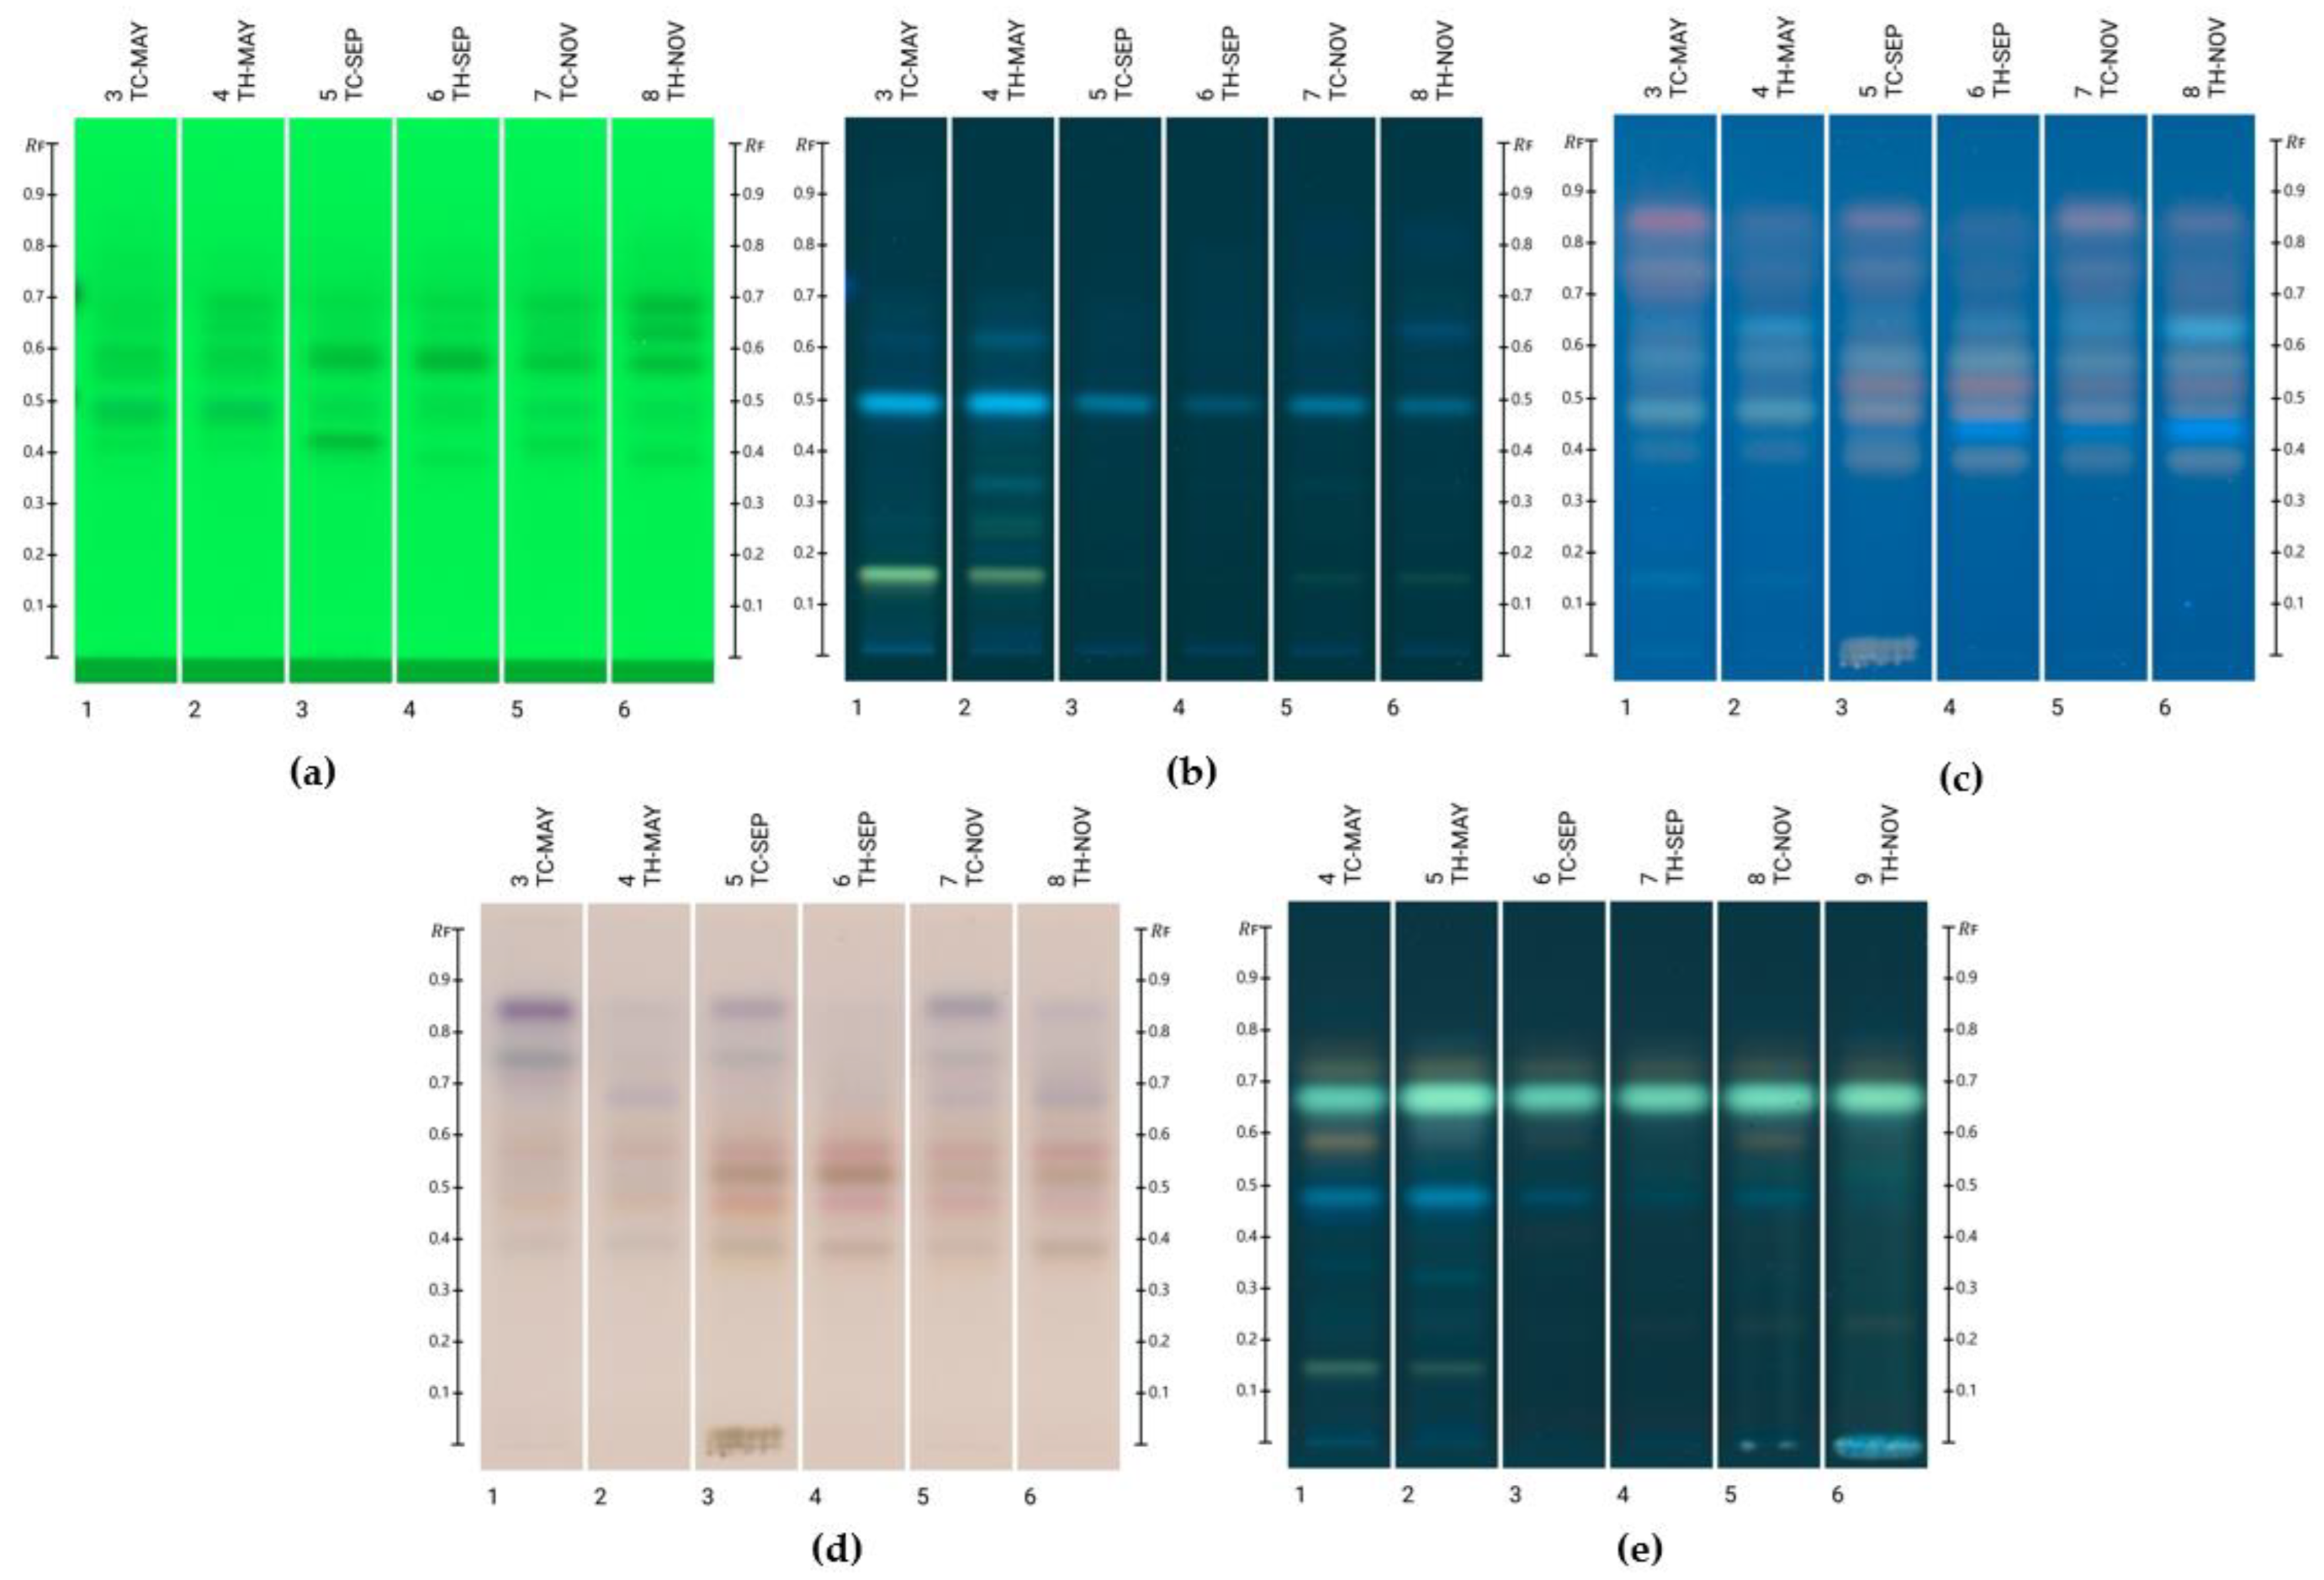
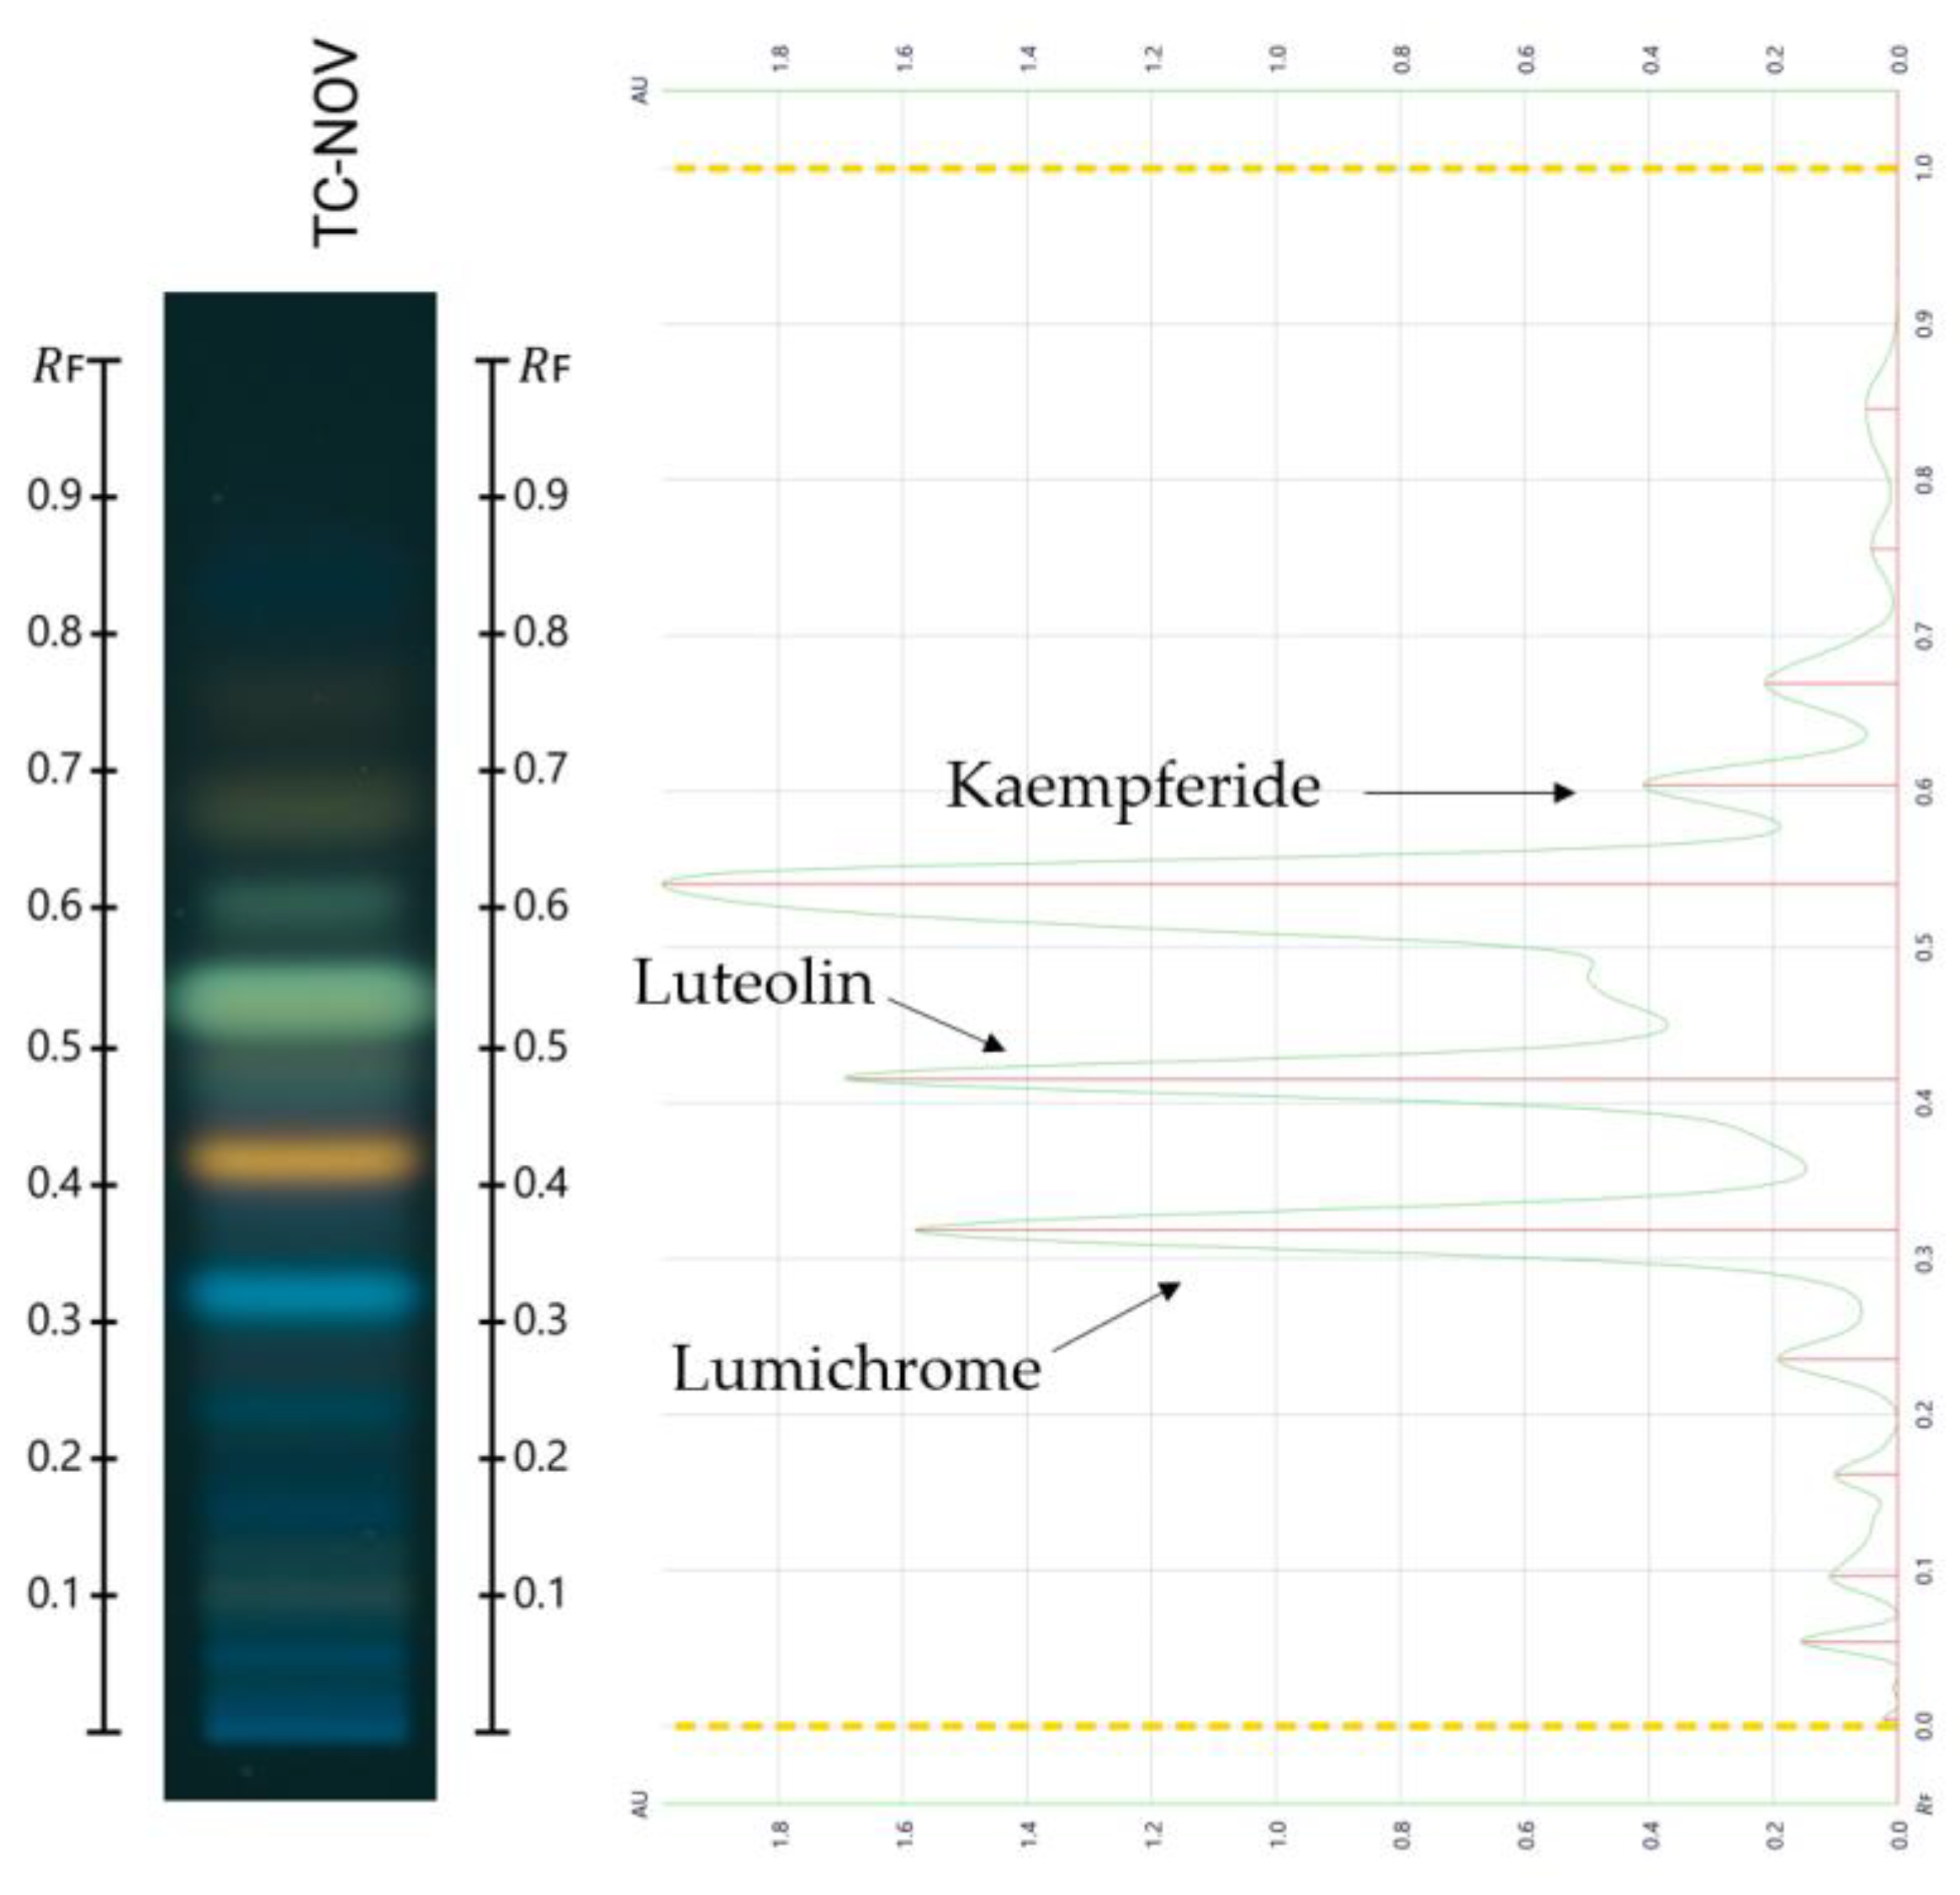
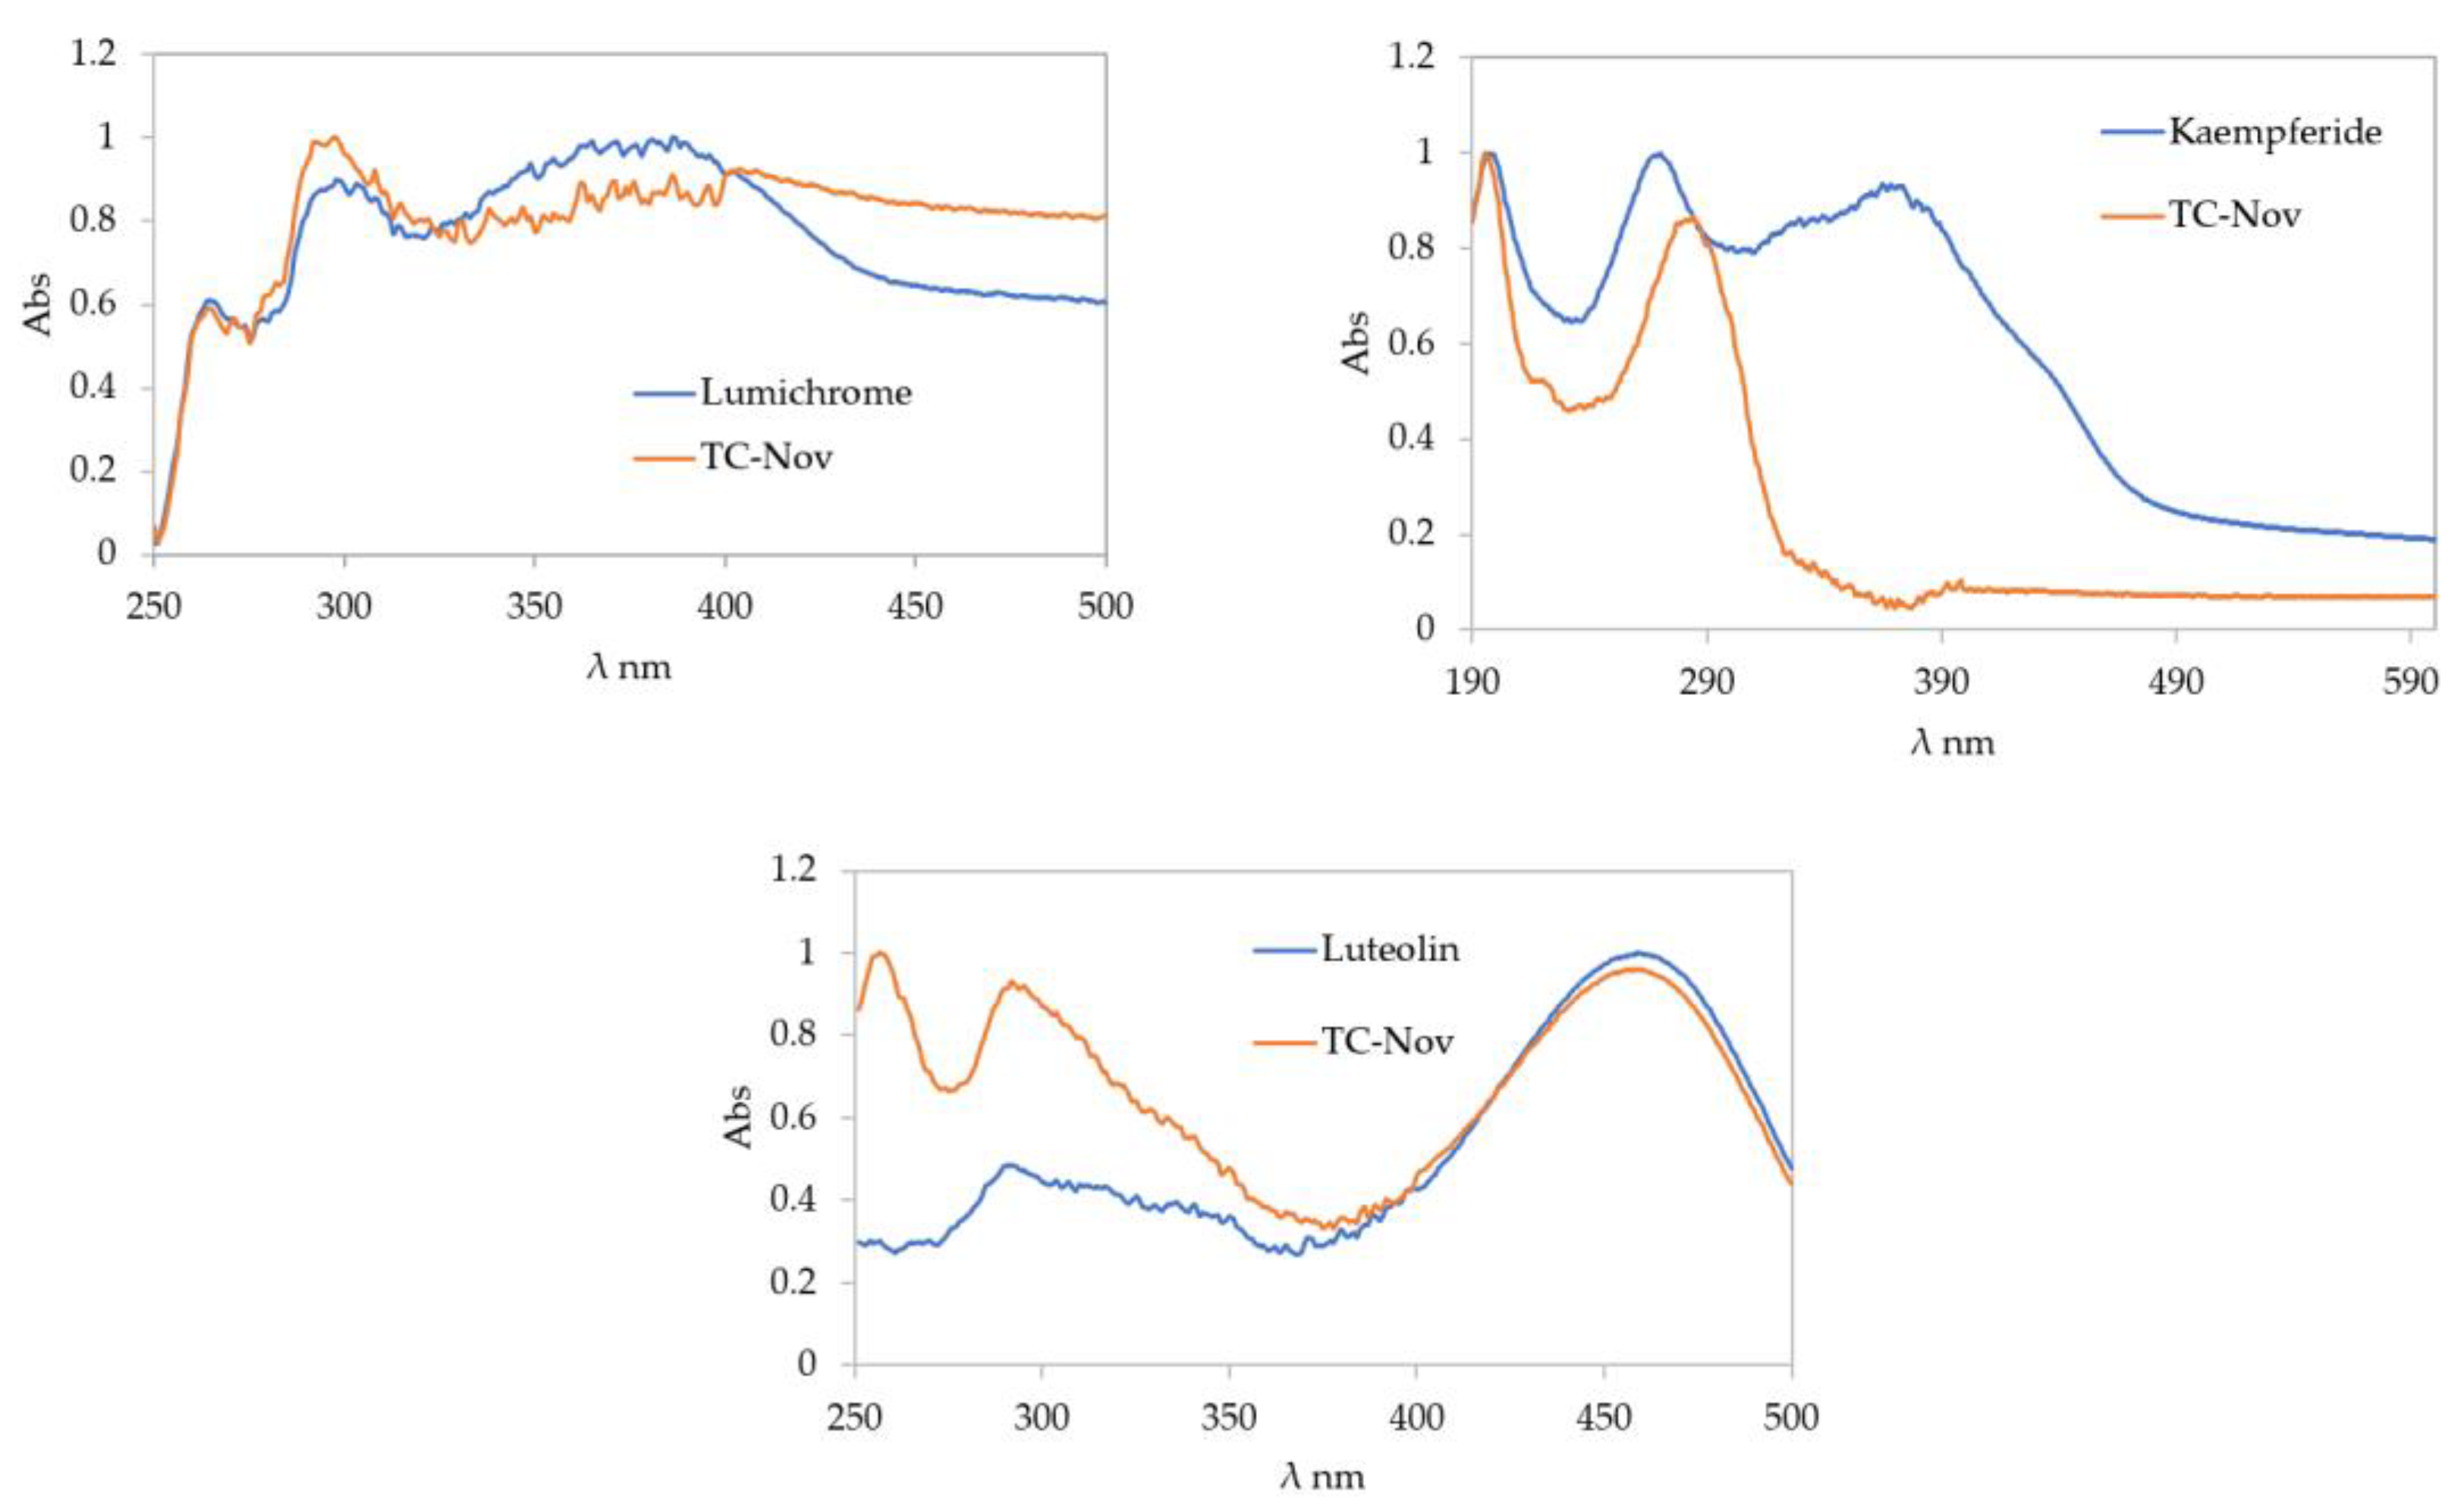
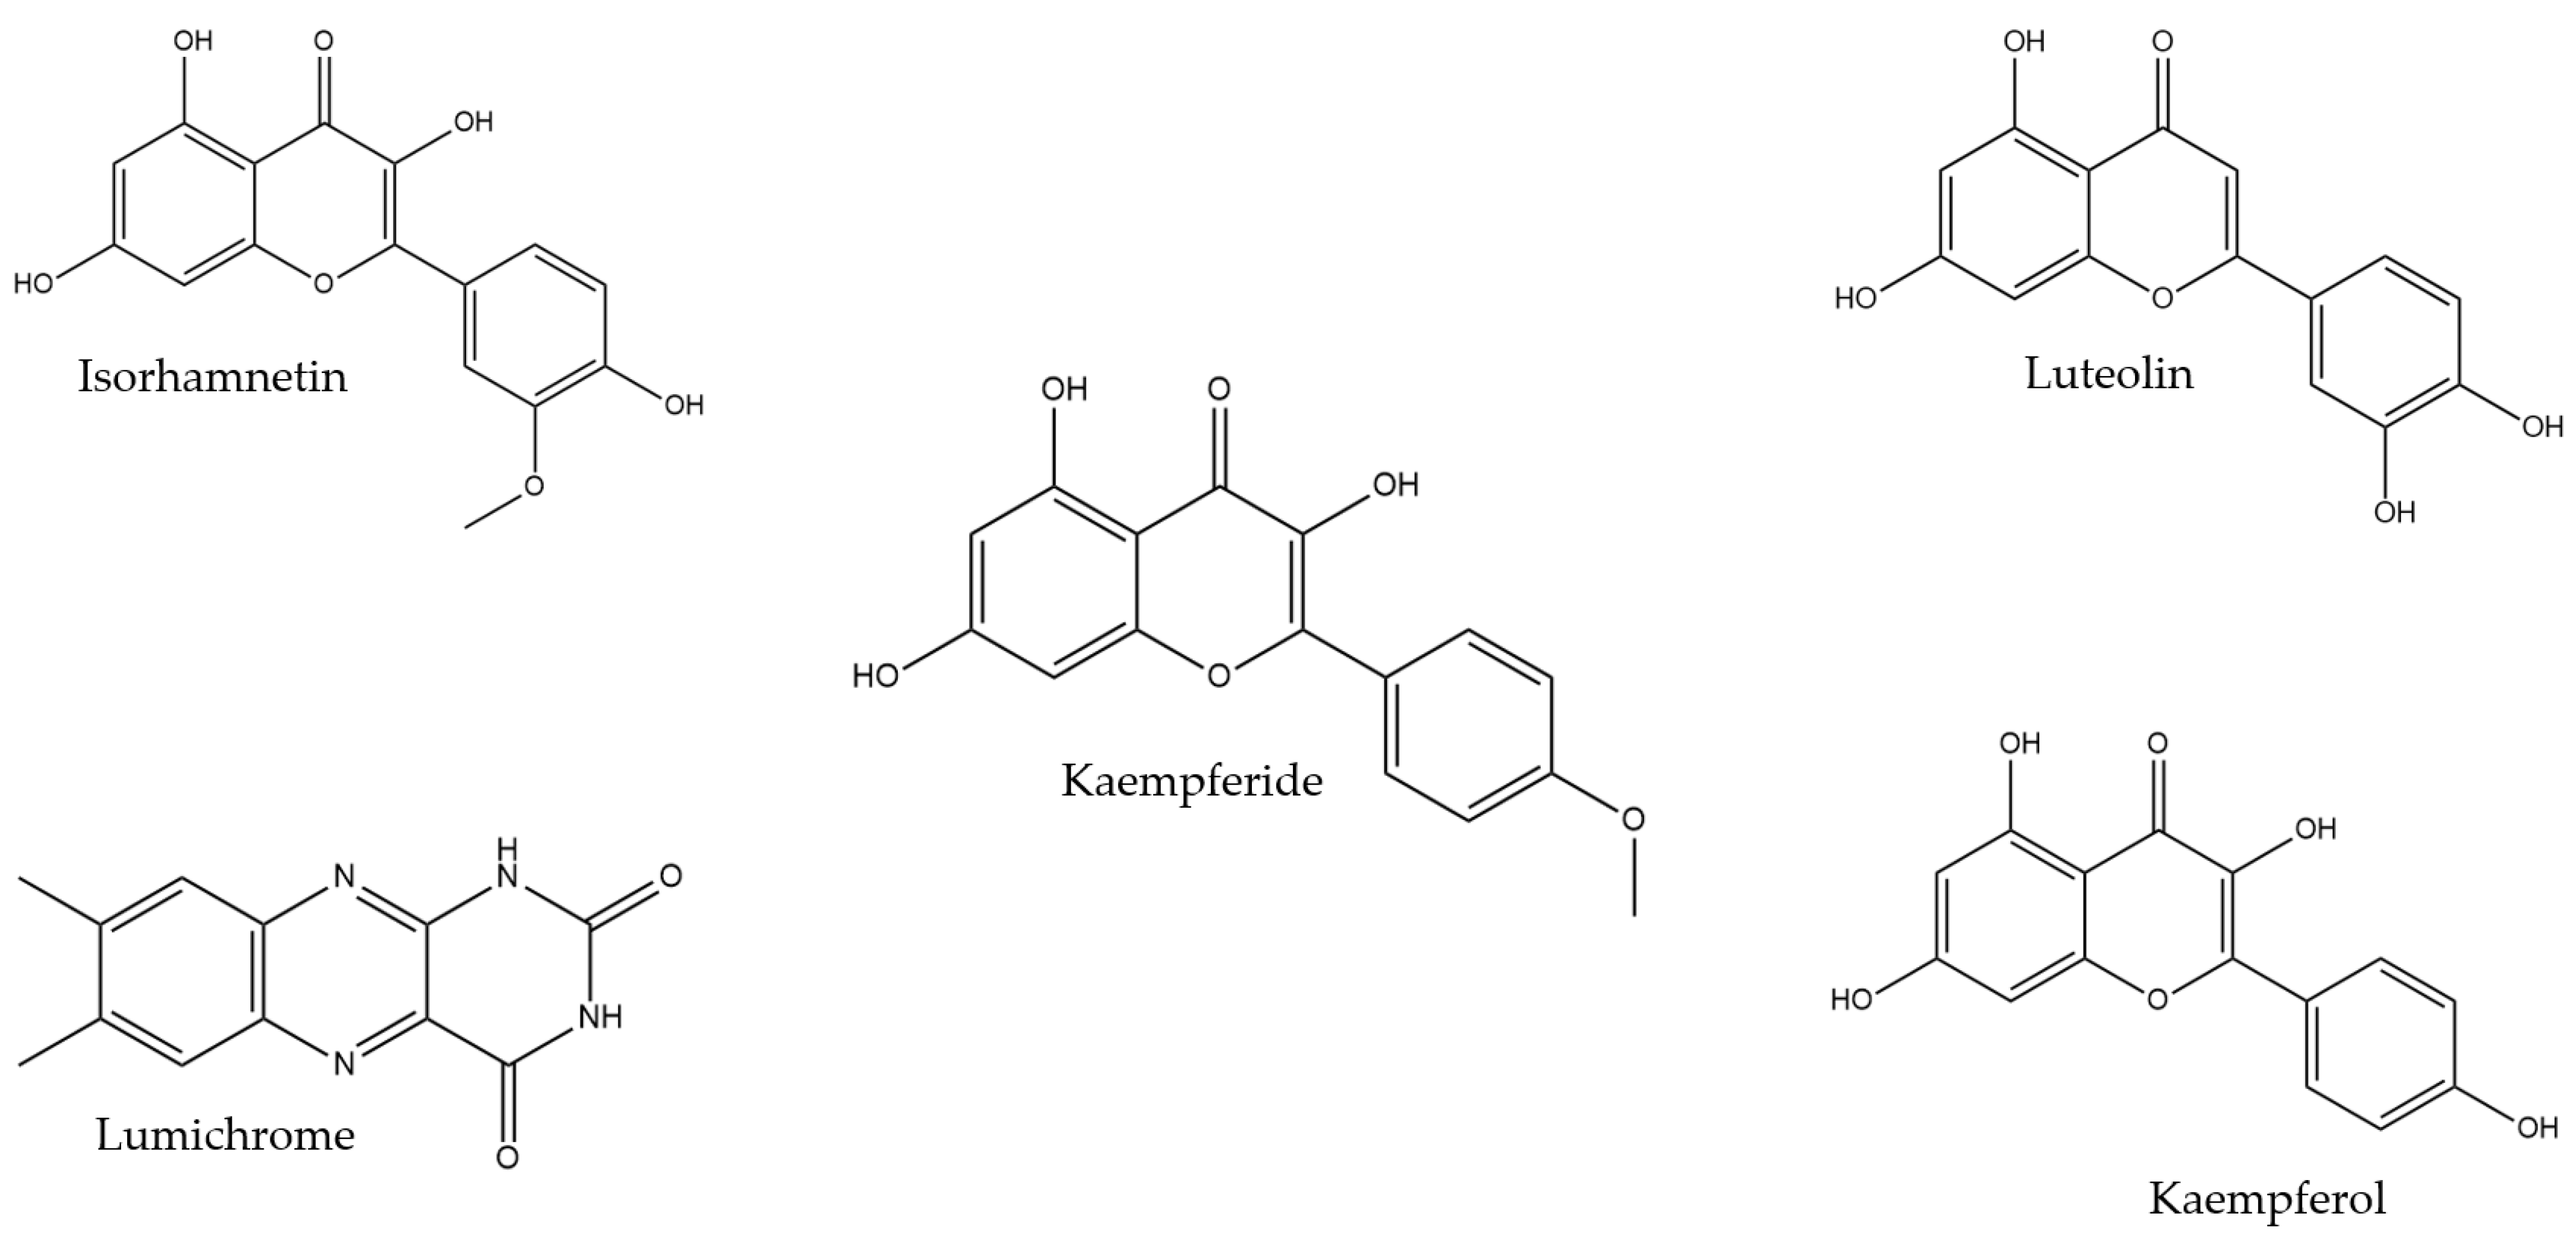
2.2. Compound Identification

Compounds were identified using blended honey samples rather than individual ones, as this provided a more accurate representation of the honey’s typical chemical composition. Multivariate data analysis was employed to examine the obtained HPTLC-derived fingerprints of individual honey samples and to detect patterns, helping to determine the best blending strategy [10]. The results showed a strong correlation between the fingerprints and the respective harvest months of the samples.
Unknown bands in the honey blends were identified using an HPTLC database developed by Lawag et al. [9]. Rf and RGB values, along with fluorescence and UV-Vis spectra of bands of interest (absorbance (AU) > 0.05), were recorded and compared to the database’s standards. The HPTLC fingerprints generated using the two mobile phases, toluene/ethyl acetate/formic acid (6:5:1 and 2:8:1), are presented in Figure 1 and Figure 2, respectively.
Initially, the mobile phase toluene/ethyl acetate/formic acid (6:5:1) was employed to screen for potential hits. Once these were identified, the second mobile phase—toluene/ethyl acetate/formic acid (2:8:1)—was used to confirm the identification of the compounds.
Following the validated screening approach developed for the HPTLC database, the following compounds were identified with the mobile phase toluene/ethyl acetate/formic acid (6:5:1): lumichrome (Rf 0.32), luteolin (Rf 0.42), and kaempferide (Rf 0.61). For another band at Rf 0.53, two possible matches—kaempferol and isorhamnetin—were found. However, due to their very similar Rf values, RGB values, and λmax, distinguishing between them using this HPTLC-based methodology was not possible. Further analyses using different mobile phases or alternative analytical techniques, such as liquid chromatography–mass spectrometry, would be required. Figure 3 and Figure 4 present the chromatograms and spectral overlays, respectively, for the sample TC-Nov. Chromatograms for the other investigated honey blends are provided in the Supplementary Materials (Figure S1). Figure 5 shows the chemical structures of all matched compounds.
Bioactive compounds in honey play a significant role in its health benefits. For example, lumichrome, which has also been found in Australian stingless bee honey from New South Wales [24], has demonstrated anticancer properties [25]. Luteolin has also been identified in stingless bee honey from Brazil [26,27], Cuba [14], and Ecuador [17]. This flavonoid is recognised for its anticancer effects, promoting apoptosis, inducing cell-cycle arrest, and inhibiting metastasis and angiogenesis in various cancer cell lines, including breast, colon, pancreatic, and lung cancers, among others [28,29]. Additionally, luteolin has been shown to possess anti-photoaging and anti-inflammatory properties, aiding in the reduction of psoriasis [30]. Kaempferide exhibits a range of pharmacological effects, including antitumour and anti-inflammatory activity, oxidative stress relief, and anti-hypertension properties [31,32,33].
Although the fingerprints of the honey blends revealed several bands, only a few could be confirmed using the database. This may be because the database was established based mainly on phenolic compounds found in European bee honey, which might not necessarily be present to the same extent in stingless bee honey. In fact, the limited number of matches against the database supports the theory that stingless bees access different flora, resulting in a unique constituent profile distinctly different to that of European bee honey [5,34].

2.3. Compound Quantification

Table 2 summarises the quantification of the identified compounds in the respective stingless bee honey blends. Lumichrome was detected in all honey blends, with its concentration ranging from 0.786 µg/g in TC-Nov to 3.99 µg/g in TH-May. Luteolin was also present in all samples except for TH-Sep, with the highest concentration observed in TC-May (1.01 µg/g) and the lowest in TH-Nov (0.338 µg/g). Kaempferide was found only in TH-May, TH-Sep, TC-Nov, and TH-Nov, with levels ranging from 0.387 µg/g in TH-Sep to 1.97 µg/g in TH-May.
This variation in the composition of the stingless bee honey samples can be attributed to several factors. Plants produce nectar that is used for honey production, and it is likely that bioactive nectar compounds that are synthesised are transferred into the honey. Therefore, the source of the nectar can influence the honey’s chemical composition. These compounds act as protective agents for plants against environmental stressors such as temperature fluctuations, light exposure, water content, UV radiation, and mineral nutrient deficiencies. As a result, variations in these compounds can occur due to the plant’s exposure to different environmental conditions, resulting in changes in its nectar composition over time and, with them, changes in the chemical profile of the honey [35,36].
Moreover, different bee species might have their own floral preferences, which will also cause variations in the chemical profile of the honey [36].

2.4. Total Phenolic Content and Antioxidant Activity

Stingless bee honey is recognised as a rich source of bioactive compounds, particularly phenolics, which play a key role in its antioxidant properties [37]. Table 3 shows the total phenolic content (TPC) and DPPH radical scavenging activity of the honey blends analysed.
The TPC in the six honey blends ranged from 26.1 to 58.6 mg of gallic acid equivalents (GAE)/100 g, with an average of 37.7 ± 12.0 mg of GAE/100 g. These findings confirm that stingless bee honey contains significant levels of phenolics, although these levels may vary due to factors such as the stingless bee species involved in its production, environmental conditions, flower availability, and climate [37].
The DPPH radical scavenging activity ranged from 1.39 to 6.08 mmol TE/kg, with an average of 3.48 ± 1.67 mmol TE/kg. A strong correlation (0.971) was observed between DPPH antioxidant activity and TPC, confirming the important role of phenolic compounds in the antioxidant capacity of stingless bee honey.

2.5. HPTLC-DPPH Antioxidant Activity

While the total DPPH assay is widely used to assess the overall antioxidant activity of natural products, its primary advantage when used in combination with HPTLC analysis is the ability to identify which specific constituents contribute to the honey’s total antioxidant activity. In brief, in this method, the RGB value of each band, generated automatically by the HPTLC software (visionCats v3.1, CAMAG, Muttenz, Switzerland) after the application of the DPPH reagent, is converted into an individual hue value. The thus-obtained hue values are used to semi-quantitatively express the radical scavenging activity of individual bands with reference to the respective activity of a gallic acid standard solution [2,38] (Table 4).
Figure 6 shows the fingerprints obtained after HPTLC-DPPH analysis of the various honey blends. As previously mentioned, DPPH has a dark purple colour that changes to yellow upon exposure to antioxidant constituents. The intensity of the resulting yellow band is thus a reflection of the antioxidant strength of the respective honey extract constituent.
None of the samples showed bands with ‘high’ activity, defined as 66.7–100.0% RSA, but some bands with radical scavenging activity between 33.4 and 66.6% exerted ‘medium’ antioxidant activity. Interestingly, it was found that samples from both bee species collected in May exhibited the highest number of bands with antioxidant activity, which is consistent with the findings of this study’s TPC determination and the DPPH assay to capture total antioxidant activity. The May samples had the highest total phenolic contents and showed the strongest antioxidant activity in the DPPH assay, reinforcing the link between phenolic compounds and antioxidant properties. It could also be observed that all samples seemed to share two common antioxidant bands, with Rf values around 0.54 and 0.68. While two of the identified constituents, kaempferide (Rf 0.61) and luteolin (Rf 0.42), did not seem to contribute any notable antioxidant activity to the investigated honey blends, the contribution of lumichrome (Rf 0.31) could be semi-quantitatively assessed as ‘low’ (0–33% RSA) using HPTLC-DPPH analysis in the honey blends harvested in May. The two constituents contributing the highest antioxidant activity (Rf 0.48 and Rf 0.54) remain chemically unidentified, although, as mentioned earlier in Section 2.2 of this study, the compound at Rf 0.54 is likely to be either kaempferol or isorhamnetin, but further analysis is required to confirm the exact identity of this highly antioxidant constituent.

3. Materials and Methods

3.1. Chemicals and Reagents

The chemicals and reagents were obtained from the following suppliers: trehalulose (Biosynth Carbosynth, Staad, Switzerland); 2-aminoethyl diphenylborinate, fructose, sucrose, ethanol, and sodium carbonate anhydrous (Chem-Supply Pty Ltd., Port Adelaide, SA, Australia); anhydrous sodium acetate, glucose, gallic acid, and phosphoric acid (Ajax Finechem Pvt Ltd.s., Cheltenham, VIC, Australia); boric acid (Pharma Scope, Welshpool, WA, Australia); maltose, Trolox, Folin–Ciocalteu Phenol reagent 2N, and vanillin (Sigma-Aldrich, St. Louis, MO, USA); diphenylamine (the British Drug Houses Ltd., London, UK); aniline (Fluka AG, Buchs, Switzerland); 2,2-diphenyl-1-picrylhydrazyl (DPPH) (Thermo Fisher Scientific, Ward Hill, MA, USA); toluene (APS Chemicals, Sydney, NSW, Australia); 4,5,7-trihydroxyflavanone (Alfa Aesar, Lancashire, UK); ethyl acetate, formic acid and sulfuric acid 98 % (Ajax Finechem, Wollongong, NSW, Australia); polyethylene glycol 400 (PharmAust, Welshpool, WA, Australia); kaempferide (Angene International Ltd., Nanjing, China); kaempferol and luteolin (Combi-Blocks Inc., San Diego, CA, USA); lumichrome (Sigma Aldrich, Castle Hill, NSW, Australia); isorhamnetin (Wuhan ChemFaces Biochemical, Wuhan, Hubei, China); and methanol and dichloromethane (Merck KGaA, Darmstadt, Germany).
Silica gel 60 F254 HPTLC glass plates (20 cm × 10 cm) were sourced from Merck KGaA (Darmstadt, Germany).

3.2. Honey Samples

Thirty-two stingless bee honey samples were directly sourced from a local beekeeper in Burpengary East, Queensland, Australia (Table 5). The samples, collected from two bee species—Tetragonula carbonaria (n = 26) and Tetragonula hockingsi (n = 6)—were harvested in May (n = 12), September (n = 10), and November (n = 10) of 2022 and stored at 4 °C until use.

3.3. Sample Preparation

To better represent typical constituent patterns and characteristics, honey blends were prepared. For this, the HPTLC fingerprints of individual honey samples were analysed and, based on the results of multivariate data analysis of these fingerprints [10], pooled samples were prepared by mixing equal amounts of individual samples obtained from the same bee species and at the same harvest period, resulting in a final weight of 10 g of the respective blend, as shown in Table 6. All subsequent analyses were conducted using the honey blends rather than the individual samples.

3.4. Physicochemical Analysis

3.4.1. Soluble Solids (°Brix) and Moisture Content

To measure the total soluble solids in the honey blends, a small amount of each sample, at room temperature, was placed on the prism of a digital refractometer (Hanna Instruments, HI96801, Woonsocket, RI, USA). The results, expressed in °Brix [39], were used to calculate the honey moisture content as (100%—°Brix).

3.4.2. pH

The pH of the honey solution was measured at room temperature using a pH meter (Oakton, pH 700, Singapore). The testing solution was prepared by dissolving 1 g of honey in 7.5 mL of deionised water [39].

3.4.3. Sugar Profile

For the determination and quantitative analysis of the main sugars present in the honey samples, High-Performance Thin-Layer Chromatography (HPTLC) was used. To quantify the main sugars, standard solutions of trehalulose (200 µg/mL), glucose (250 µg/mL), and fructose (250 µg/mL) were prepared in 50% aqueous methanol, and calibration curves were generated for trehalulose (100–800 ng/band), fructose (250–1250 ng/band), and glucose (250–1250 ng/band).
Honey solutions were prepared at 1 mg/mL concentrations in 50% aqueous methanol and separated with a mobile phase consisting of 1-butanol, 2-propanol, and aqueous boric acid (5 mg/mL) at a 30:50:10 volume ratio [40,41].
Both standards and honey solutions (1 to 5 µL) were applied to the HPTLC plates using a semi-automated applicator (Linomat 5; CAMAG, Muttenz, Switzerland) at 40 nL/s, with bands placed 8.0 mm from the bottom and 20.2 mm from the side edges of the plate. The bands measured 8.0 mm, with 11.4 mm gaps between them.
The plates were developed over a distance of 85 mm using 10 mL of the mobile phase in a saturated and activated automated development chamber (ADC2, CAMAG, Muttenz, Switzerland), at 33% relative humidity and room temperature. The chamber was saturated for 60 min, followed by 5 min pre-conditioning of the plates with the mobile phase.
After development with the mobile phase, the plates were dried for 5 min. To enhance band visualisation, 2 mL of derivatisation reagent was applied. The reagent was prepared by dissolving 2 g of diphenylamine and 2 mL of aniline in 80 mL of methanol, followed by the addition of 10 mL of 85% phosphoric acid, and then diluted to a final volume of 100 mL with methanol. The reagent was sprayed using a TLC derivatiser (CAMAG Derivatiser, Muttenz, Switzerland) (yellow nozzle—level 5).
After spraying, the plates were heated at 115 °C for 10 min using a TLC Plate Heater III (CAMAG, Muttenz, Switzerland) and allowed to cool to room temperature. Once cooled, images of the plates were taken under transmission white (T-white) light [40,41] with the HPTLC imaging device (TLC Visualiser 2, CAMAG, Muttenz, Switzerland) and analysed using HPTLC software (visionCATS v3.1, CAMAG, Muttenz, Switzerland).
The analysis was carried out in triplicate, and the results were expressed as the mean sugar content (in grams) per 100 g of honey ± standard deviation.

3.5. Identification of Compounds in Honey

For the identification of compounds in the stingless bee honey blends, a validated screening approach against an HPTLC-derived database was adopted for all bands of interest [2,9]. For this, organic extracts needed to be prepared by dissolving approximately 1 g of each honey blend in 2 mL of deionised water, followed by three extractions using 5 mL of dichloromethane. After extraction, the combined organic layers were evaporated at 35 °C and kept at 4 °C until analysis. Before HPTLC analysis, the organic extracts were re-dissolved in 100 µL of dichloromethane. A standard reference solution of 4,5,7-trihydroxyflavanone (0.5 mg/mL in methanol) was used for comparison during the analysis.
The chromatographic separation was conducted using two different mobile phase compositions: mixtures of toluene, ethyl acetate, and formic acid at 6:5:1 (v/v/v) and at 2:8:1 (v/v/v) [39]. The HPTLC plate was then prepared by applying 5 µL of the organic honey extracts and 4 µL of the reference standard in 8 mm bands, positioned 8 mm from the edge of the plate. These applications were carried out using a semi-automated HPTLC system (Linomat 5, CAMAG, Muttenz, Switzerland) at a rate of 150 nL/s. The plates were subsequently developed in a saturated and activated (33% relative humidity) automated chamber (ADC2, CAMAG, Muttenz, Switzerland) at room temperature, with the separation progressing up to a distance of 70 mm. Once developed, the plates were visualised using a TLC Visualiser 2 (CAMAG, Muttenz, Switzerland) under three different conditions: 254 nm, 366 nm, and white light.
Derivatisation reagents were applied to enhance the bands’ visibility, with vanillin–sulfuric acid (VSA) and natural product–PEG (NP-PEG) employed for this purpose. For NP-PEG derivatisation, the plates were first sprayed with 3 mL of 1% NP reagent using a green nozzle (level 3) and dried at 40 °C for 5 min on a TLC Plate Heater III (CAMAG, Muttenz, Switzerland). They were then sprayed with 5% PEG reagent using a blue nozzle (level 2), dried again at 40 °C for 5 min, and subsequently the image was taken at 366 nm. Preparation of the NP reagent involved dissolving 1 g of 2-aminoethyl diphenylborinate in 100 mL of methanol, while the PEG reagent was made by dissolving 5 g of PEG 400 in 100 mL of ethanol (96%). For VSA derivatisation, 3 mL of 1% vanillin–sulfuric acid was applied using a yellow nozzle (level 3), with the plates heated at 115 °C (TLC Plate Heater III, CAMAG, Muttenz, Switzerland) for 3 min and allowed to cool for 2 min before visualisation at 366 nm and under white light. The VSA reagent was prepared by dissolving 1 g of vanillin in 100 mL of ethanol (96%), followed by the slow addition of 2 mL of sulfuric acid (98%).
Images of the chromatographic plates were taken using the TLC Visualiser 2 (CAMAG, Muttenz, Switzerland) and analysed using HPTLC software (visionCATS v3.1, CAMAG, Muttenz, Switzerland). Additional scans were performed on the TLC Scanner 4 (CAMAG, Muttenz, Switzerland) in UV-Vis mode (190–900 nm) and fluorescence mode (190–380 nm), both after development and following derivatisation with each reagent. The data generated, such as Rf values, colour hues, and λmax in both UV-Vis and fluorescence modes, were matched against 107 standards in the HPTLC-derived database, following a validated screening protocol. Spectral overlay analysis was conducted to confirm potential matches [9].

3.6. Quantification of Identified Compounds in Honey

The quantification of compounds in the honey blends employed the same chromatographic methods and sample preparation as described in Section 3.5 [2]. Calibration curves were established for each standard by preparing methanolic solutions at a concentration of 100 µg/mL. The volume of honey sample applied, ranging from 4 to 27 µL, was adjusted to ensure that the compound concentrations were within the calibration curve range.
Compounds were quantified at their specific λmax using the evaluation feature of the VisionCATS software (v3.1, CAMAG, Muttenz, Switzerland). The analysis was carried out in triplicate, and the results were reported as the average amount of compound (in µg) per 1 g of honey ± standard deviation.

3.7. Antioxidant Activity

3.7.1. Total Phenolic Content (TPC)

The total phenolic contents in the honey blends were assessed using the colorimetric Folin–Ciocalteu method, based on a published methodology [42], with slight modifications. To prepare an artificial honey solution, 21.63 g of fructose, 18.13 g of glucose, 1.00 g of maltose, and 0.75 g of sucrose were mixed with 8.50 g of water [43]. A 40% (w/v) aqueous solution of the artificial honey was then prepared. A standard curve was created by mixing 100 µL of gallic acid solutions, with concentrations ranging from 0.06 mg/mL to 0.18 mg/mL, with an equal volume of the 40% (w/v) artificial honey solution.
For the assay, aliquots of 200 µL of an aqueous honey solution (20% w/v) were mixed with 1 mL of diluted Folin–Ciocalteu reagent (prepared by diluting 1 mL of the reagent with 30 mL of deionised water) and 800 µL of a 0.75% Na2CO3 solution. The mixture was left to incubate in the dark for 2 h. Absorbance measurements were taken at 760 nm using a spectrophotometer (Agilent Technologies, Cary 60 UV-Vis Spectrophotometer, Santa Clara, CA, USA). Meanwhile, 100 µL of deionised water spiked with 100 µL of artificial honey (40% w/v) was used as a blank.
The total phenolic content was calculated using the formula provided in Equation (1), and all analyses were performed in triplicate. The results were expressed as the mean gallic acid equivalents (GAE) per 100 g of honey, alongside the corresponding standard deviation.
T P C ( m g G A E ) = ( Δ A b s i n t e r c e p t ) / s l o p e

3.7.2. Total DPPH (2,2-Diphenyl-1-Picrylhydrazyl) Radical Scavenging Assay

The antioxidant capacity of the honey samples was assessed using the DPPH radical scavenging assay, following the protocol described in [44], including some modifications (as described in [2]).
Honey samples were dissolved in water at a concentration of 20% (w/v), and 10 µL of each solution was mixed with 290 µL of a DPPH reagent mixture in a 96-well microplate (Greiner Bio-One 96-well Microplate Flat Bottom). The DPPH reagent was prepared by mixing a 0.130 mM methanolic solution of DPPH with an aqueous acetate buffer (100 mM, pH 5.5) at a 19:10 (v/v) ratio. Trolox standard solutions, ranging from 100 to 600 µM, were prepared after adjusting their pH to 7.0 and used to construct the assay’s calibration curve.
The reaction mixture was left in the dark for 2 h, after which absorbance was recorded at 520 nm using a POLARstar Optima Microplate Reader (BMG Labtech, Allmendgrün, Ortenberg, Germany). The DPPH antioxidant activity was calculated using Equation (2) as follows:
D P P H ( µ M   T r o l o x ) = ( Δ A b s i n t e r c e p t ) / s l o p e
Each sample was analysed in triplicate, with the average DPPH activity reported as mmol of Trolox equivalents (TE) per kg of honey ± standard deviation.

3.7.3. HPTLC-DPPH Analysis

For the HPTLC-DPPH analysis, the same chromatographic conditions and honey sample preparation as outlined in Section 3.5 were employed. A volume of 7 µL of each honey blend extract, along with 2 µL of a methanolic gallic acid solution (0.5 mg/mL), was applied to the HPTLC plates.
The chromatographic separation was performed using a mobile phase of toluene, ethyl acetate, and formic acid (6:5:1, v/v/v). To enhance the bands’ visualisation, the plates were sprayed with 3 mL of a 0.4% DPPH solution in an ethanol/methanol mixture (1:1 v/v), using a green nozzle set to level 3 [2,45,46]. The plates were then left in the dark for 2 h. Images of the plates were recorded under white light, and the bands were scanned at 517 nm.
The colour of each band was recorded as an RGB value and subsequently converted into hue values to semi-quantitatively assess the antioxidant activity of each band [9].
Gallic acid was used as a positive control, resulting in a maximum hue value of 40° (yellow colour). The obtained hue values were used to calculate the DPPH radical scavenging activity (% DPPH RSA) of bands of interest using a previously reported equation (Equation (3) [9,47]:
% D P P H R S A = H ° S + H ° P H ° P + H ° G × 100
where H°G is the hue value of gallic acid, ΔH°P is the hue value of unreacted DPPH on the plate (n = 10), and H°S is the hue value of the band of interest. The respective band’s % DPPH RSA was then categorised as indicated in Table 7.

3.8. Statistical Analysis

One-way analysis of variance (ANOVA) followed by Tukey’s post hoc test was used to compare the means, when applicable. Differences between means at the 95% (p < 0.05) confidence level were considered statistically significant. The IBM SPSS Statistical Package (v29.0.0.0) was used to conduct the statistical analyses.

4. Conclusions

This study investigated the physicochemical properties, chemical composition, and antioxidant activity of Australian stingless bee honey from two species, T. carbonaria and T. hockingsi, across different times of the year. The results indicated an acidic pH for all samples, with higher moisture content and lower °Brix values compared to Apis mellifera honey. The sugar profile revealed trehalulose, fructose, and glucose as the main sugars, with the samples collected in May showing the highest trehalulose levels and the lowest fructose and glucose levels. The findings of this study also demonstrate that the Tetragonula hockingsi honeys had slightly higher moisture contents, as well as fructose and glucose levels, compared to Tetragonula carbonaria honeys when harvested in the same month. However, overall, both types of honey were found to have very similar physicochemical properties. Using an HPTLC-based database of 107 mainly phenolic compounds, lumichrome was identified in all honey samples, while luteolin and kaempferide were detected with varying prevalence. Either kaempferol or isorhamnetin could also be detected, although a final differentiation between the two was not possible with the chosen analytical approach. The limited number of identified compounds in this study was likely due to the database’s focus on constituents identified in European bee-derived honey, which highlights the need for a more targeted approach to stingless bee honey. Additionally, HPTLC-DPPH analysis revealed that honeys produced in May had higher numbers of compounds contributing to antioxidant activity. These samples also had the highest total phenolic contents and exhibited the strongest antioxidant activity in the DPPH total antioxidant activity assay, reinforcing the correlation between phenolic compounds and antioxidant properties, and highlighting the influence of harvest time on bioactivity. This study offers valuable insight into the unique composition of Australian stingless bee honey, and it is the first to use HPTLC analysis for identifying and quantifying compounds in these honey samples. However, further research is necessary to chemically identify more of the still-unknown constituents in these honeys, particularly those that contribute significantly to its antioxidant activity, and to expand the understanding of their bioactive potential.

Supplementary Materials

The following supporting information can be downloaded at https://www.mdpi.com/article/10.3390/molecules30061223/s1: Figure S1: HPTLC chromatograms of honey samples TC-May (a), TH-May (b), TC-Sep (c), TH-Sep (d), TC-Nov (e), and TH-Nov (f), using the mobile phase toluene/ethyl acetate/formic acid (6:5:1). Chromatograms obtained prior to derivatisation at 254 and 366 nm (A), after derivatisation with VSA at 366 nm and white light (B), and after derivatisation with NP-PEG at 366 nm (C).

Author Contributions

Conceptualisation, M.M.d.S. and C.L.; methodology, M.M.d.S. and T.S.; software, M.M.d.S. validation, M.M.d.S.; formal analysis, M.M.d.S.; investigation, M.M.d.S.; resources, C.L.; data curation, M.M.d.S.; writing—original draft preparation, M.M.d.S.; writing—review and editing, T.S., L.Y.L. and C.L.; visualisation, M.M.d.S.; supervision, L.Y.L. and C.L.; project administration, M.M.d.S. All authors have read and agreed to the published version of the manuscript.

Funding

This research received no external funding.

Institutional Review Board Statement

Not applicable.

Informed Consent Statement

Not applicable.

Data Availability Statement

The original contributions presented in this study are included in the article; further inquiries can be directed to the corresponding author.

Acknowledgments

The authors would like to thank Sam Poulsen of Tetra Native Bee Honey for supplying the stingless bee honey samples and sharing valuable insights into native beekeeping practices. This research was carried out while the author was in receipt of a scholarship for international research fees from the University of Western Australia.

Conflicts of Interest

The authors declare no conflicts of interest.

References

  1. Mandal, M.D.; Mandal, S. Honey: Its medicinal property and antibacterial activity. Asian Pac. J. Trop. Biomed. 2011, 1, 154–160. [Google Scholar] [CrossRef] [PubMed]
  2. Lawag, I.L.; Islam, M.K.; Sostaric, T.; Lim, L.Y.; Hammer, K.; Locher, C. Antioxidant activity and phenolic compound identification and quantification in western australian honeys. Antioxidants 2023, 12, 189. [Google Scholar] [CrossRef]
  3. Chuttong, B.; Chanbang, Y.; Sringarm, K.; Burgett, M. Physicochemical profiles of stingless bee (Apidae: Meliponini) honey from South East Asia (Thailand). Food Chem. 2016, 192, 149–155. [Google Scholar] [CrossRef] [PubMed]
  4. Slaa, E.J.; Sánchez Chaves, L.A.; Malagodi-Braga, K.S.; Hofstede, F.E. Stingless bees in applied pollination: Practice and perspectives. Apidologie 2006, 37, 293–315. [Google Scholar] [CrossRef]
  5. Al-Hatamleh, M.A.I.; Boer, J.C.; Wilson, K.L.; Plebanski, M.; Mohamud, R.; Mustafa, M.Z. Antioxidant-Based Medicinal Properties of Stingless Bee Products: Recent Progress and Future Directions. Biomolecules 2020, 10, 923. [Google Scholar] [CrossRef]
  6. Ávila, S.; Beux, M.R.; Ribani, R.H.; Zambiazi, R.C. Stingless bee honey: Quality parameters, bioactive compounds, health-promotion properties and modification detection strategies. Trends Food Sci. Technol. 2018, 81, 37–50. [Google Scholar] [CrossRef]
  7. Nguyen, H.T.L.; Panyoyai, N.; Kasapis, S.; Pang, E.; Mantri, N. Honey and its role in relieving multiple facets of atherosclerosis. Nutrients 2019, 11, 167. [Google Scholar] [CrossRef]
  8. Biluca, F.C.; da Silva, B.; Caon, T.; Mohr, E.T.B.; Vieira, G.N.; Gonzaga, L.V.; Vitali, L.; Micke, G.; Fett, R.; Dalmarco, E.M.; et al. Investigation of phenolic compounds, antioxidant and anti-inflammatory activities in stingless bee honey (Meliponinae). Food Res. Int. 2020, 129, 108756. [Google Scholar] [CrossRef]
  9. Lawag, I.L.; Sostaric, T.; Lim, L.Y.; Hammer, K.; Locher, C. The Development and Application of a HPTLC-Derived Database for the Identification of Phenolics in Honey. Molecules 2022, 27, 6651. [Google Scholar] [CrossRef]
  10. Mello dos Santos, M.; Jacobs, C.; Vinsen, K.; Islam, M.K.; Sostaric, T.; Lim, L.Y.; Locher, C. Profiling of Australian Stingless Bee Honey Using Multivariate Data Analysis of High-Performance Thin-Layer Chromatography Fingerprints. Chemosensors 2025, 13, 30. [Google Scholar] [CrossRef]
  11. Islam, M.K.; Sostaric, T.; Lim, L.Y.; Hammer, K.; Locher, C. Development of an HPTLC-based dynamic reference standard for the analysis of complex natural products using Jarrah honey as test sample. PLoS ONE 2021, 16, e0254857. [Google Scholar] [CrossRef]
  12. Food and Agriculture Organization. Codex. 2022. Available online: https://www.fao.org/fao-who-codexalimentarius/codex-texts/list-standards/tr/ (accessed on 13 November 2024).
  13. Biluca, F.C.; Braghini, F.; Gonzaga, L.V.; Costa, A.C.O.; Fett, R. Physicochemical profiles, minerals and bioactive compounds of stingless bee honey (Meliponinae). J. Food Compos. Anal. 2016, 50, 61–69. [Google Scholar] [CrossRef]
  14. Alvarez-Suarez, J.M.; Giampieri, F.; Brenciani, A.; Mazzoni, L.; Gasparrini, M.; González-Paramás, A.M.; Santos-Buelga, C.; Morroni, G.; Simoni, S.; Forbes-Hernández, T.Y.; et al. Apis mellifera vs Melipona beecheii Cuban polifloral honeys: A comparison based on their physicochemical parameters, chemical composition and biological properties. LWT Food Sci. Technol. 2018, 87, 272–279. [Google Scholar] [CrossRef]
  15. Sousa, J.M.B.d.; Souza, E.L.d.; Marques, G.d.; Benassi, M.d.T.; Gullón, B.; Pintado, M.M.; Magnani, M. Sugar profile, physicochemical and sensory aspects of monofloral honeys produced by different stingless bee species in Brazilian semi-arid region. LWT Food Sci. Technol. 2016, 65, 645–651. [Google Scholar] [CrossRef]
  16. Habib, H.M.; Al Meqbali, F.T.; Kamal, H.; Souka, U.D.; Ibrahim, W.H. Physicochemical and biochemical properties of honeys from arid regions. Food Chem. 2014, 153, 35–43. [Google Scholar] [CrossRef] [PubMed]
  17. Guerrini, A.; Bruni, R.; Maietti, S.; Poli, F.; Rossi, D.; Paganetto, G.; Muzzoli, M.; Scalvenzi, L.; Sacchetti, G. Ecuadorian stingless bee (Meliponinae) honey: A chemical and functional profile of an ancient health product. Food Chem. 2009, 114, 1413–1420. [Google Scholar] [CrossRef]
  18. Biluca, F.C.; Braghini, F.; Campos Ferreira, G.; Costa dos Santos, A.; Baggio Ribeiro, D.H.; Valdemiro Gonzaga, L.; Vitali, L.; Amadeu Micke, G.; Carolina Oliveira Costa, A.; Fett, R. Physicochemical parameters, bioactive compounds, and antibacterial potential of stingless bee honey. J. Food Process. Preserv. 2021, 45, e15127. [Google Scholar] [CrossRef]
  19. da Silva, P.M.; Gauche, C.; Gonzaga, L.V.; Costa, A.C.O.; Fett, R. Honey: Chemical composition, stability and authenticity. Food Chem. 2016, 196, 309–323. [Google Scholar] [CrossRef]
  20. Shamsudin, S.; Selamat, J.; Sanny, M.; Abd Razak, S.-B.; Jambari, N.N.; Mian, Z.; Khatib, A. Influence of origins and bee species on physicochemical, antioxidant properties and botanical discrimination of stingless bee honey. Int. J. Food Prop. 2019, 22, 239–264. [Google Scholar] [CrossRef]
  21. Nordin, A.; Sainik, N.Q.A.V.; Chowdhury, S.R.; Saim, A.B.; Idrus, R.B.H. Physicochemical properties of stingless bee honey from around the globe: A comprehensive review. J. Food Compos. Anal. 2018, 73, 91–102. [Google Scholar] [CrossRef]
  22. Solayman, M.; Islam, M.A.; Paul, S.; Ali, Y.; Khalil, M.I.; Alam, N.; Gan, S.H. Physicochemical properties, minerals, trace elements, and heavy metals in honey of different origins: A comprehensive review. Comp. Rev. Food Sci. Food Saf. 2016, 15, 219–233. [Google Scholar] [CrossRef] [PubMed]
  23. Fletcher, M.T.; Hungerford, N.L.; Webber, D.; Carpinelli de Jesus, M.; Zhang, J.; Stone, I.S.J.; Blanchfield, J.T.; Zawawi, N. Stingless bee honey, a novel source of trehalulose: A biologically active disaccharide with health benefits. Sci. Rep. 2020, 10, 12128. [Google Scholar] [CrossRef]
  24. Massaro, C.F.; Shelley, D.; Heard, T.A.; Brooks, P. In vitro antibacterial phenolic extracts from “sugarbag” pot-honeys of Australian stingless bees (Tetragonula carbonaria). J. Agric. Food Chem. 2014, 62, 12209–12217. [Google Scholar] [CrossRef]
  25. Chantarawong, W.; Kuncharoen, N.; Tanasupawat, S.; Chanvorachote, P. Lumichrome Inhibits Human Lung Cancer Cell Growth and Induces Apoptosis via a p53-Dependent Mechanism. Nutr. Cancer 2019, 71, 1390–1402. [Google Scholar] [CrossRef] [PubMed]
  26. da Silva, I.A.A.; da Silva, T.M.S.; Camara, C.A.; Queiroz, N.; Magnani, M.; de Novais, J.S.; Soledade, L.E.B.; Lima, E.d.O.; de Souza, A.L.; de Souza, A.G. Phenolic profile, antioxidant activity and palynological analysis of stingless bee honey from Amazonas, Northern Brazil. Food Chem. 2013, 141, 3552–3558. [Google Scholar] [CrossRef] [PubMed]
  27. Oliveira, R.G.d.; Jain, S.; Luna, A.C.; Freitas, L.d.S.; Araújo, E.D.d. Screening for quality indicators and phenolic compounds of biotechnological interest in honey samples from six species of stingless bees (Hymenoptera: Apidae). Food Sci. Technol. 2017, 37, 552–557. [Google Scholar] [CrossRef]
  28. Imran, M.; Rauf, A.; Abu-Izneid, T.; Nadeem, M.; Shariati, M.A.; Khan, I.A.; Imran, A.; Orhan, I.E.; Rizwan, M.; Atif, M.; et al. Luteolin, a flavonoid, as an anticancer agent: A review. Biomed. Pharmacother. 2019, 112, 108612. [Google Scholar] [CrossRef]
  29. Seelinger, G.; Merfort, I.; Wölfle, U.; Schempp, C.M. Anti-carcinogenic effects of the flavonoid luteolin. Molecules 2008, 13, 2628–2651. [Google Scholar] [CrossRef]
  30. Rivera-Yañez, C.R.; Ruiz-Hurtado, P.A.; Mendoza-Ramos, M.I.; Reyes-Reali, J.; García-Romo, G.S.; Pozo-Molina, G.; Reséndiz-Albor, A.A.; Nieto-Yañez, O.; Méndez-Cruz, A.R.; Méndez-Catalá, C.F.; et al. Flavonoids Present in Propolis in the Battle against Photoaging and Psoriasis. Antioxidants 2021, 10, 2014. [Google Scholar] [CrossRef]
  31. Song, B.; Niu, W.; Zhang, S.; Hao, M.; Li, Y.; Chen, Q.; Li, S.; Tong, C. A mechanistic review of the pharmacological aspects of Kaempferide as a natural compound. Heliyon 2024, 10, e38243. [Google Scholar] [CrossRef]
  32. Tang, H.; Zeng, Q.; Tang, T.; Wei, Y.; Pu, P. Kaempferide improves glycolipid metabolism disorder by activating PPARγ in high-fat-diet-fed mice. Life Sci. 2021, 270, 119133. [Google Scholar] [CrossRef] [PubMed]
  33. Chandrababu, G.; Varkey, M.; Devan, A.R.; Anjaly, M.V.; Unni, A.R.; Nath, L.R. Kaempferide exhibits an anticancer effect against hepatocellular carcinoma in vitro and in vivo. Naunyn Schmiedeberg’s Arch. Pharmacol. 2023, 396, 2461–2467. [Google Scholar] [CrossRef]
  34. Abd Jalil, M.A.; Kasmuri, A.R.; Hadi, H. Stingless bee honey, the natural wound healer: A review. Ski. Pharmacol. Physiol. 2017, 30, 66–75. [Google Scholar] [CrossRef] [PubMed]
  35. Kaškonienė, V.; Venskutonis, P.R. Floral markers in honey of various botanical and geographic origins: A review. Compr. Rev. Food Sci. Food Saf. 2010, 9, 620–634. [Google Scholar] [CrossRef] [PubMed]
  36. Biluca, F.C.; de Gois, J.S.; Schulz, M.; Braghini, F.; Gonzaga, L.V.; Maltez, H.F.; Rodrigues, E.; Vitali, L.; Micke, G.A.; Borges, D.L.G.; et al. Phenolic compounds, antioxidant capacity and bioaccessibility of minerals of stingless bee honey (Meliponinae). J. Food Compos. Anal. 2017, 63, 89–97. [Google Scholar] [CrossRef]
  37. Ávila, S.; Hornung, P.S.; Teixeira, G.L.; Malunga, L.N.; Apea-Bah, F.B.; Beux, M.R.; Beta, T.; Ribani, R.H. Bioactive compounds and biological properties of Brazilian stingless bee honey have a strong relationship with the pollen floral origin. Food Res. Int. 2019, 123, 1–10. [Google Scholar] [CrossRef]
  38. Achenbach, J.; Deyerling, N.; Mello Dos Santos, M.; Sultana, S.; Islam, M.K.; Locher, C. Physicochemical Properties, Antioxidant Activity, and High-Performance Thin-Layer Chromatography Profiling of Propolis Samples from Western Australia. Plants 2024, 13, 1919. [Google Scholar] [CrossRef]
  39. Islam, M.K.; Lawag, I.L.; Sostaric, T.; Ulrich, E.; Ulrich, D.; Dewar, T.; Lim, L.Y.; Locher, C. Australian Honeypot Ant (Camponotus inflatus) Honey-A Comprehensive Analysis of the Physiochemical Characteristics, Bioactivity, and HPTLC Profile of a Traditional Indigenous Australian Food. Molecules 2022, 27, 2154. [Google Scholar] [CrossRef]
  40. Islam, M.K.; Sostaric, T.; Lim, L.Y.; Hammer, K.; Locher, C. A validated method for the quantitative determination of sugars in honey using high-performance thin-layer chromatography. JPC J. Planar Chromatogr. 2020, 33, 489–499. [Google Scholar] [CrossRef]
  41. Mello dos Santos, M.; Jacobs, C.; Islam, M.K.; Lim, L.Y.; Locher, C. Validation of a high-performance thin-layer chromatography method for the quantitative determination of trehalulose. JPC J. Planar Chromatogr. 2023, 36, 201–210. [Google Scholar] [CrossRef]
  42. Liberato, M.d.C.C.; de Morais, S.M.; Siqueira, S.M.C.; de Menezes, J.E.S.A.; Ramos, D.N.; Machado, L.K.A.; Magalhães, I.L. Phenolic content and antioxidant and antiacetylcholinesterase properties of honeys from different floral origins. J. Med. Food 2011, 14, 658–663. [Google Scholar] [CrossRef] [PubMed]
  43. Lawag, I.L.; Nolden, E.S.; Schaper, A.A.M.; Lim, L.Y.; Locher, C. A Modified Folin-Ciocalteu Assay for the Determination of Total Phenolics Content in Honey. Appl. Sci. 2023, 13, 2135. [Google Scholar] [CrossRef]
  44. Karabagias, I.K.; Louppis, A.P.; Karabournioti, S.; Kontakos, S.; Papastephanou, C.; Kontominas, M.G. Characterization and geographical discrimination of commercial Citrus spp. honeys produced in different Mediterranean countries based on minerals, volatile compounds and physicochemical parameters, using chemometrics. Food Chem. 2017, 217, 445–455. [Google Scholar] [CrossRef] [PubMed]
  45. Islam, M.K.; Sostaric, T.; Lim, L.Y.; Hammer, K.; Locher, C. Antioxidant HPTLC-DPPH Fingerprinting of Honeys and Tracking of Antioxidant Constituents Upon Thermal Exposure. Foods 2021, 10, 357. [Google Scholar] [CrossRef] [PubMed]
  46. Islam, M.K.; Sostaric, T.; Lim, L.Y.; Hammer, K.; Locher, C. Development and validation of an HPTLC–DPPH assay and its application to the analysis of honey. JPC J. Planar Chromatogr. 2020, 33, 301–311. [Google Scholar] [CrossRef]
  47. Deyerling, N.; Achenbach, J.; dos Santos, M.M.; Locher, C. Physicochemical Properties, Antioxidant Activity and Phytochemical Profiling of Australian Tetragonula carbonaria Cerumen. J. Chromatogr. Open 2024, 100164. [Google Scholar] [CrossRef]
Figure 1. HPTLC fingerprints of honey blends using the mobile phase toluene/ethyl acetate/formic acid (6:5:1) at (a) 254 nm prior to derivatisation, (b) 366 nm prior to derivatisation, (c) 366 nm after derivatisation with VSA, (d) white light after derivatisation with VSA, and (e) 366 nm after derivatisation with NP-PEG.
Molecules 30 01223 g001
Figure 2. HPTLC fingerprints of honey blends using the mobile phase toluene/ethyl acetate/formic acid (2:8:1) at (a) 254 nm prior to derivatisation, (b) 366 nm prior to derivatisation, (c) 366 nm after derivatisation with VSA, (d) white light after derivatisation with VSA, and (e) 366 nm after derivatisation with NP-PEG.
Molecules 30 01223 g002
Figure 3. HPTLC chromatogram of the sample TC-Nov obtained with the mobile phase toluene/ethyl acetate/formic acid (6:5:1) after derivatisation with NP-PEG at 366 nm.
Molecules 30 01223 g003
Figure 4. Spectral overlay of unknown bands in the sample TC-Nov using the mobile phase toluene/ethyl acetate/formic acid (6:5:1).
Molecules 30 01223 g004
Figure 5. Chemical structure of the compounds identified in Australian stingless bee honey (generated using ChemDraw version 23.1.2, PerkinElmer Informatics, Inc., Waltham, MA, USA).
Molecules 30 01223 g005
Figure 6. HPTLC-DPPH plate image of all honey blends.
Molecules 30 01223 g006
Table 1. Physicochemical parameters of the honey blends.
Honey BlendpHMoisture (%w/w)Soluble Solids (°Brix)Trehalulose (g/100 g)Fructose (g/100 g)Glucose (g/100 g)
TC-May3.73 ± 0.0265 a27.0 ± 0.153 a73.0 ± 0.153 a 30.3 ± 1.41 a12.9 ± 0.666 a4.80 ± 0.380 a
TH-May3.57 ± 0.0451 b30.0 ± 0.0577 b70.0 ± 0.0577 b24.3 ± 0.611 b19.9 ± 0.265 b7.29 ± 0.216 b
TC-Sep3.77 ± 0.00577 a28.0 ± 0.0577 c72.0 ± 0.0577 c18.8 ± 0.888c25.8 ± 0.961 c15.8 ± 0.231 c
TH-Sep4.14 ± 0.0100 c29.1 ± 0.0577 d70.9 ± 0.0577 d14.4 ± 0.395 d30.1 ± 0.650 d20.5 ± 0.420 d
TC-Nov3.93 ± 0.0208 d26.5 ± 0.000 e73.5 ± 0.000 e13.9 ± 0.784 d28.5 ± 0.309 d20.5 ± 0.307 d
TH-Nov4.19 ± 0.0265 c27.1 ± 0.0577 a72.9 ± 0.0577 a15.8 ± 1.21 d32.3 ± 0.530 e23.7 ± 1.18 e
Values are expressed as the mean ± standard deviation. Different superscript letters in the same column denote significant differences (ANOVA, p < 0.05).
Table 2. Quantification of identified compounds in the honey blends (µg/g, n = 3).
Honey SampleLumichromeLuteolinKaempferide
TC-May3.74 ± 0.479 a1.01 ± 0.159 aND
TH-May3.99 ± 0.659 a0.631 ± 0.0425 b,c1.97 ± 0.052 a
TC-Sep0.830 ± 0.0258 b0.576 ± 0.0635 bND
TH-Sep1.20 ± 0.166 bND0.387 ± 0.0211 b
TC-Nov0.786 ± 0.172 b0.804 ± 0.0827 c0.522 ± 0.0652 c
TH-Nov1.37 ± 0.170 b0.338 ± 0.0462 d0.875 ± 0.0795 d
Values are expressed as the mean ± standard deviation. Different superscript letters in the same column denote significant differences (ANOVA, p < 0.05). ND—not detected.
Table 3. Total phenolic content (TPC) and DPPH radical scavenging assay of the Australian stingless bee honey blends.
Honey BlendTPC (mg GAE/100 g)DPPH (mmol TE/Kg)
TC-May44.7 ± 0.861 a4.57 ± 0.282 a
TH-May58.6 ± 3.47 b6.08 ± 0.105 b
TC-Sep29.5 ± 0.429 c,d2.49 ± 0.131 c
TH-Sep26.1 ± 0.662 c1.39 ± 0.282 d
TC-Nov33.8 ± 1.60 d3.59 ± 0.0849 e
TH-Nov33.2 ± 1.70 d2.73 ± 0.0366 c
Values are expressed as the mean ± standard deviation. Different superscript letters in the same column denote significant differences (ANOVA, p < 0.05).
Table 4. Percentage DPPH RSA antioxidant activity of individual bands.
SampleRfCompound MatchHue Value [°]%RSACategory
TC-May0.113-329.614.9+
0.315Lumichrome335.121.5+
0.375-330.916.5+
0.477-333.419.5+
0.543-336.222.9+
0.683-338.625.8+
TH-May0.115-323.47.41+
0.311Lumichrome331.817.6+
0.374-325.39.70+
0.448-342.530.5+
0.480-352.442.5++
0.539-359.050.4++
0.580-332.518.4+
0.684-334.721.1+
TC-Sep0.541-328.113.1+
0.684-321.75.35+
TH-Sep0.545-324.18.25+
TC-Nov0.546-330.516.0+
0.681-326.310.9+
TH-Nov0.121-323.77.77+
0.479-332.518.4+
0.536-353.143.3++
0.683-332.518.4+
0.758-332.318.2+
Table 5. Honey samples.
Bee SpeciesSampleHarvest Date
Tetragonula carbonariaC1May 2022
C2
C3
C4
C5
C6
C7
C8
C9
C10
Tetragonula hockingsiH1May 2022
H2
Tetragonula carbonariaC13September 2022
C14
C15
C16
C17
C18
C19
C20
Tetragonula hockingsiH5September 2022
H6
Tetragonula carbonariaC21November 2022
C22
C23
C24
C25
C26
C27
C28
Tetragonula hockingsiH7November 2022
H8
Table 6. Honey blends.
Honey BlendBee SpeciesHarvest Date
TC-May (n = 10)Tetragonula carbonariaMay 2022
TH-May (n = 2)Tetragonula hockingsiMay 2022
TC-Sep (n = 8)Tetragonula carbonariaSeptember 2022
TH-Sep (n = 2)Tetragonula hockingsiSeptember 2022
TC-Nov (n = 8)Tetragonula carbonariaNovember 2022
TH-Nov (n = 2)Tetragonula hockingsiNovember 2022
Table 7. Categories of antioxidant activity for individual bands based on DPPH % RSA.
% DPPH RSACategoryInference
0.0%0No activity
1.0–33.3%+Low activity
33.4–66.6%++Medium activity
66.7–100.0%+++High activity
Disclaimer/Publisher’s Note: The statements, opinions and data contained in all publications are solely those of the individual author(s) and contributor(s) and not of MDPI and/or the editor(s). MDPI and/or the editor(s) disclaim responsibility for any injury to people or property resulting from any ideas, methods, instructions or products referred to in the content.

