
Removal of Butyl Mercaptan from Gas Streams by Reactive Adsorption

 , , ,
, , , 
Abstract
:1. Introduction
2. Results and Discussion
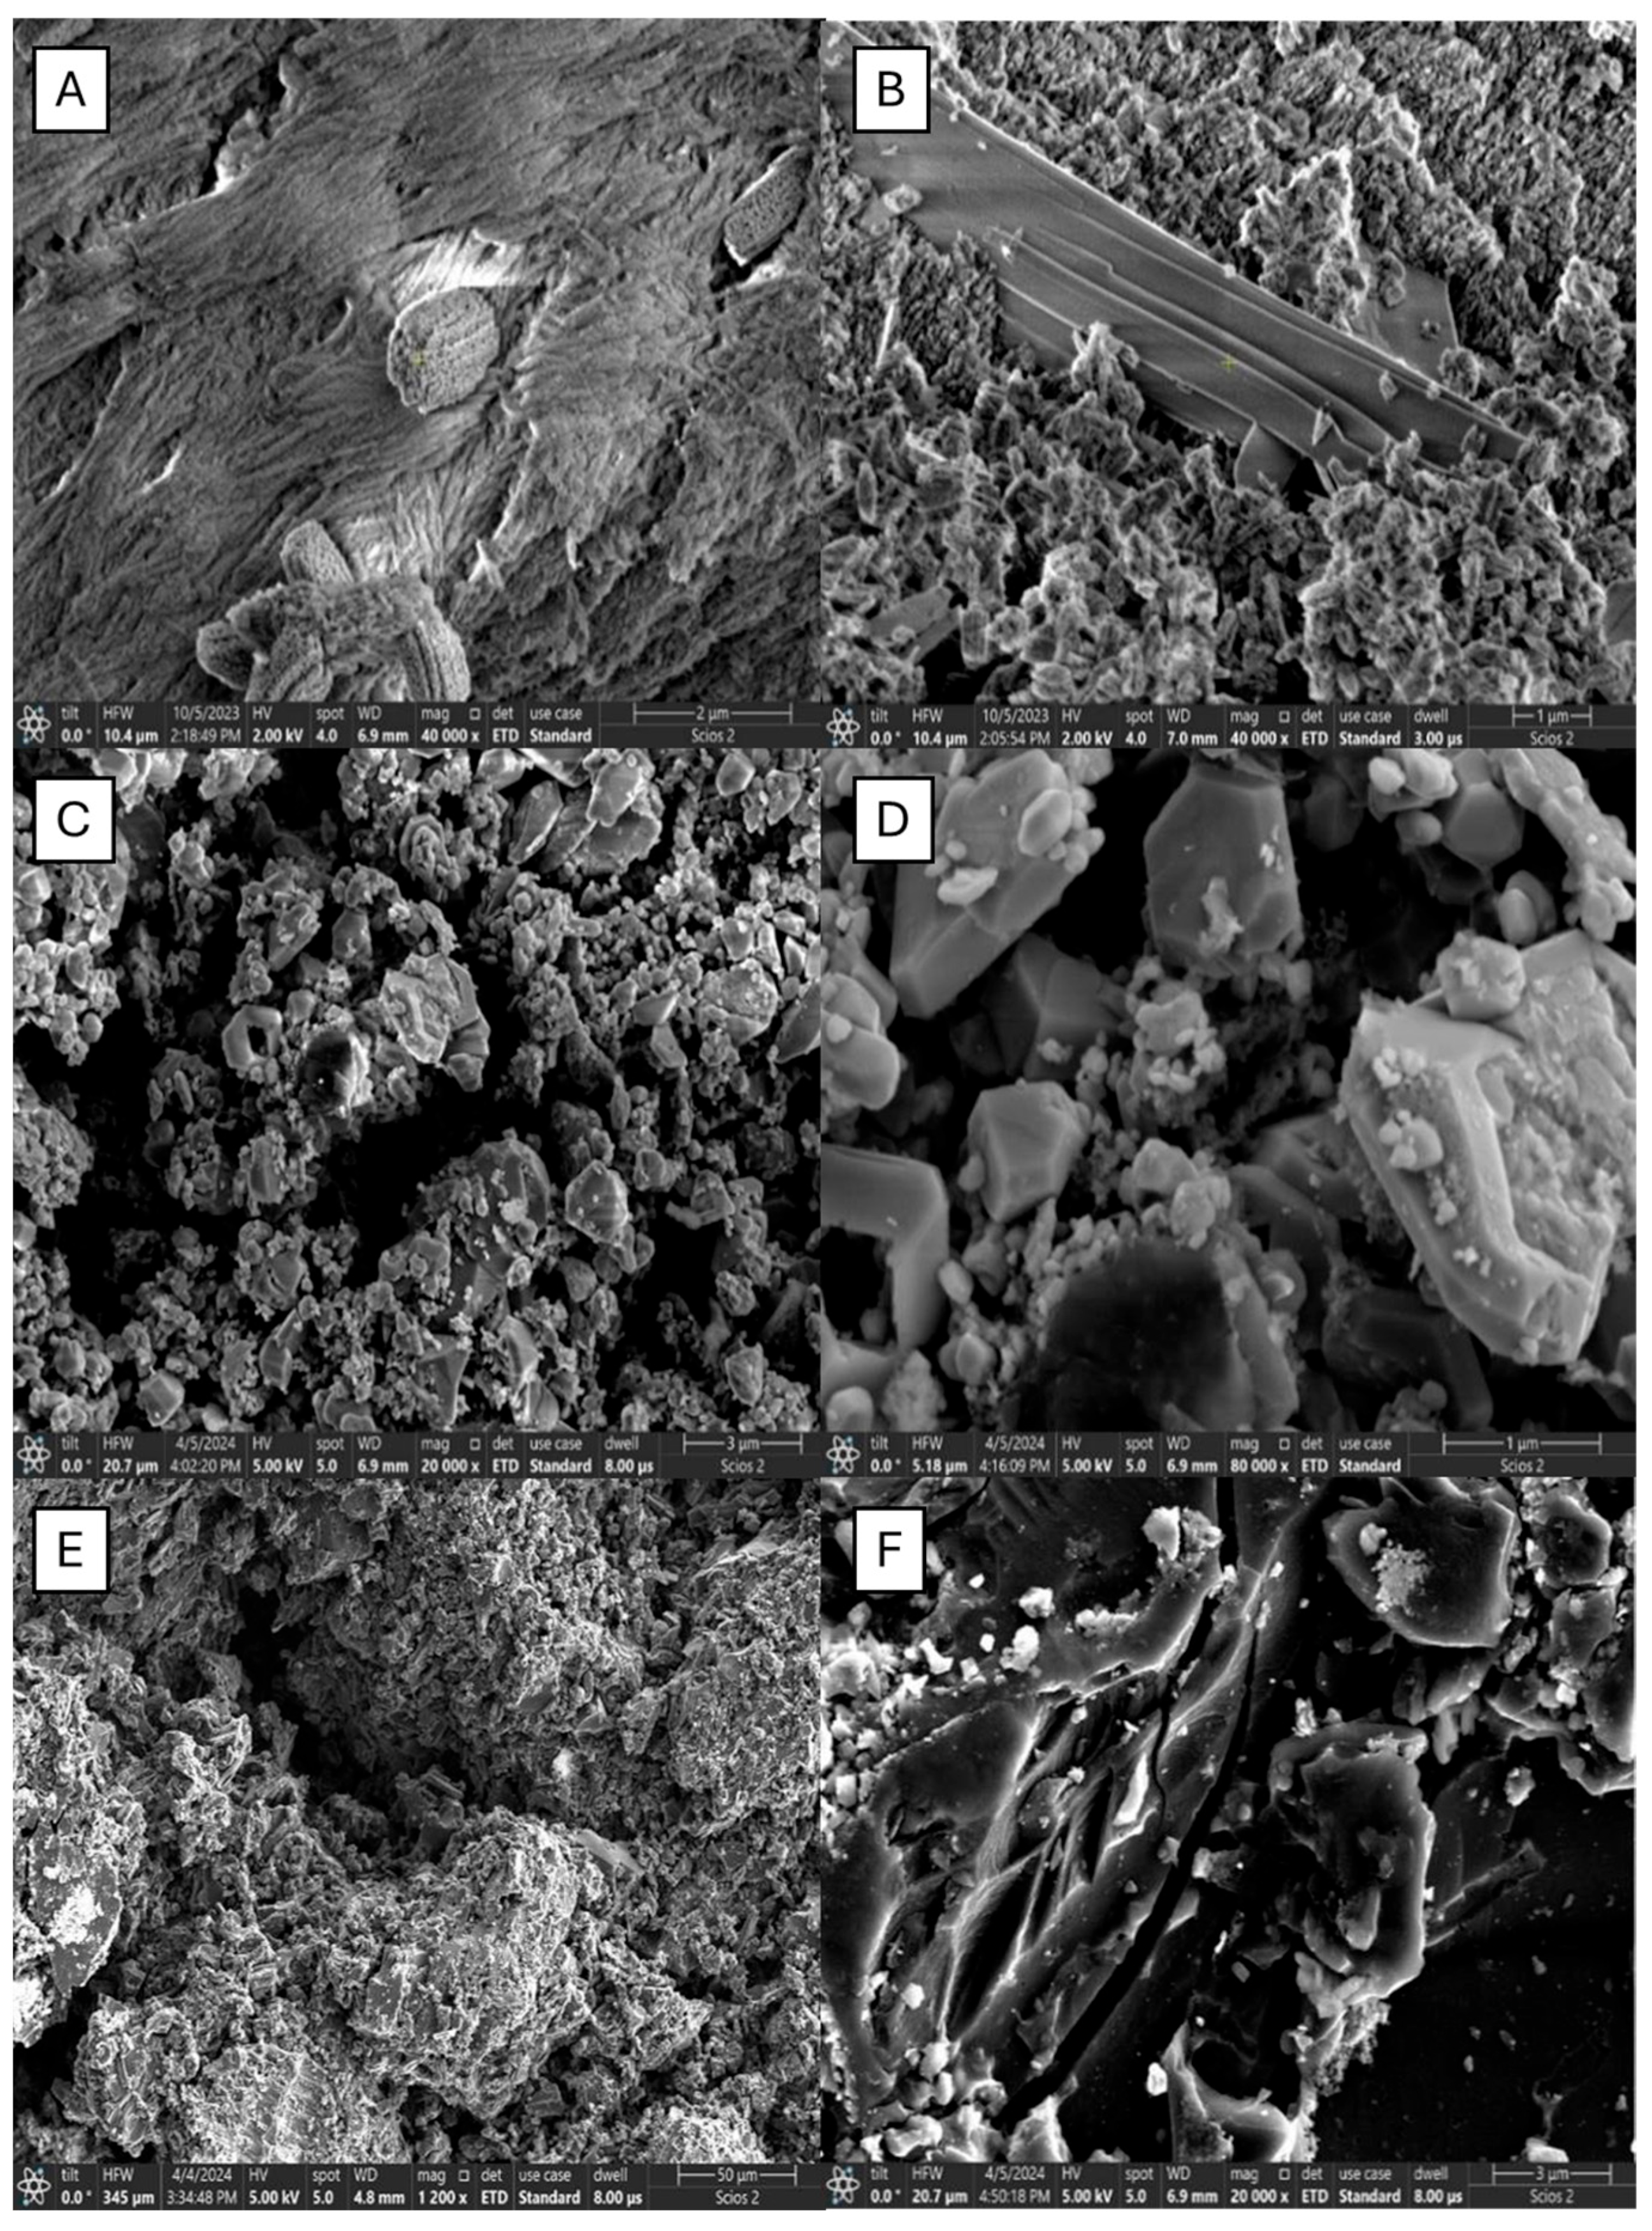
2.1. SEM Analysis
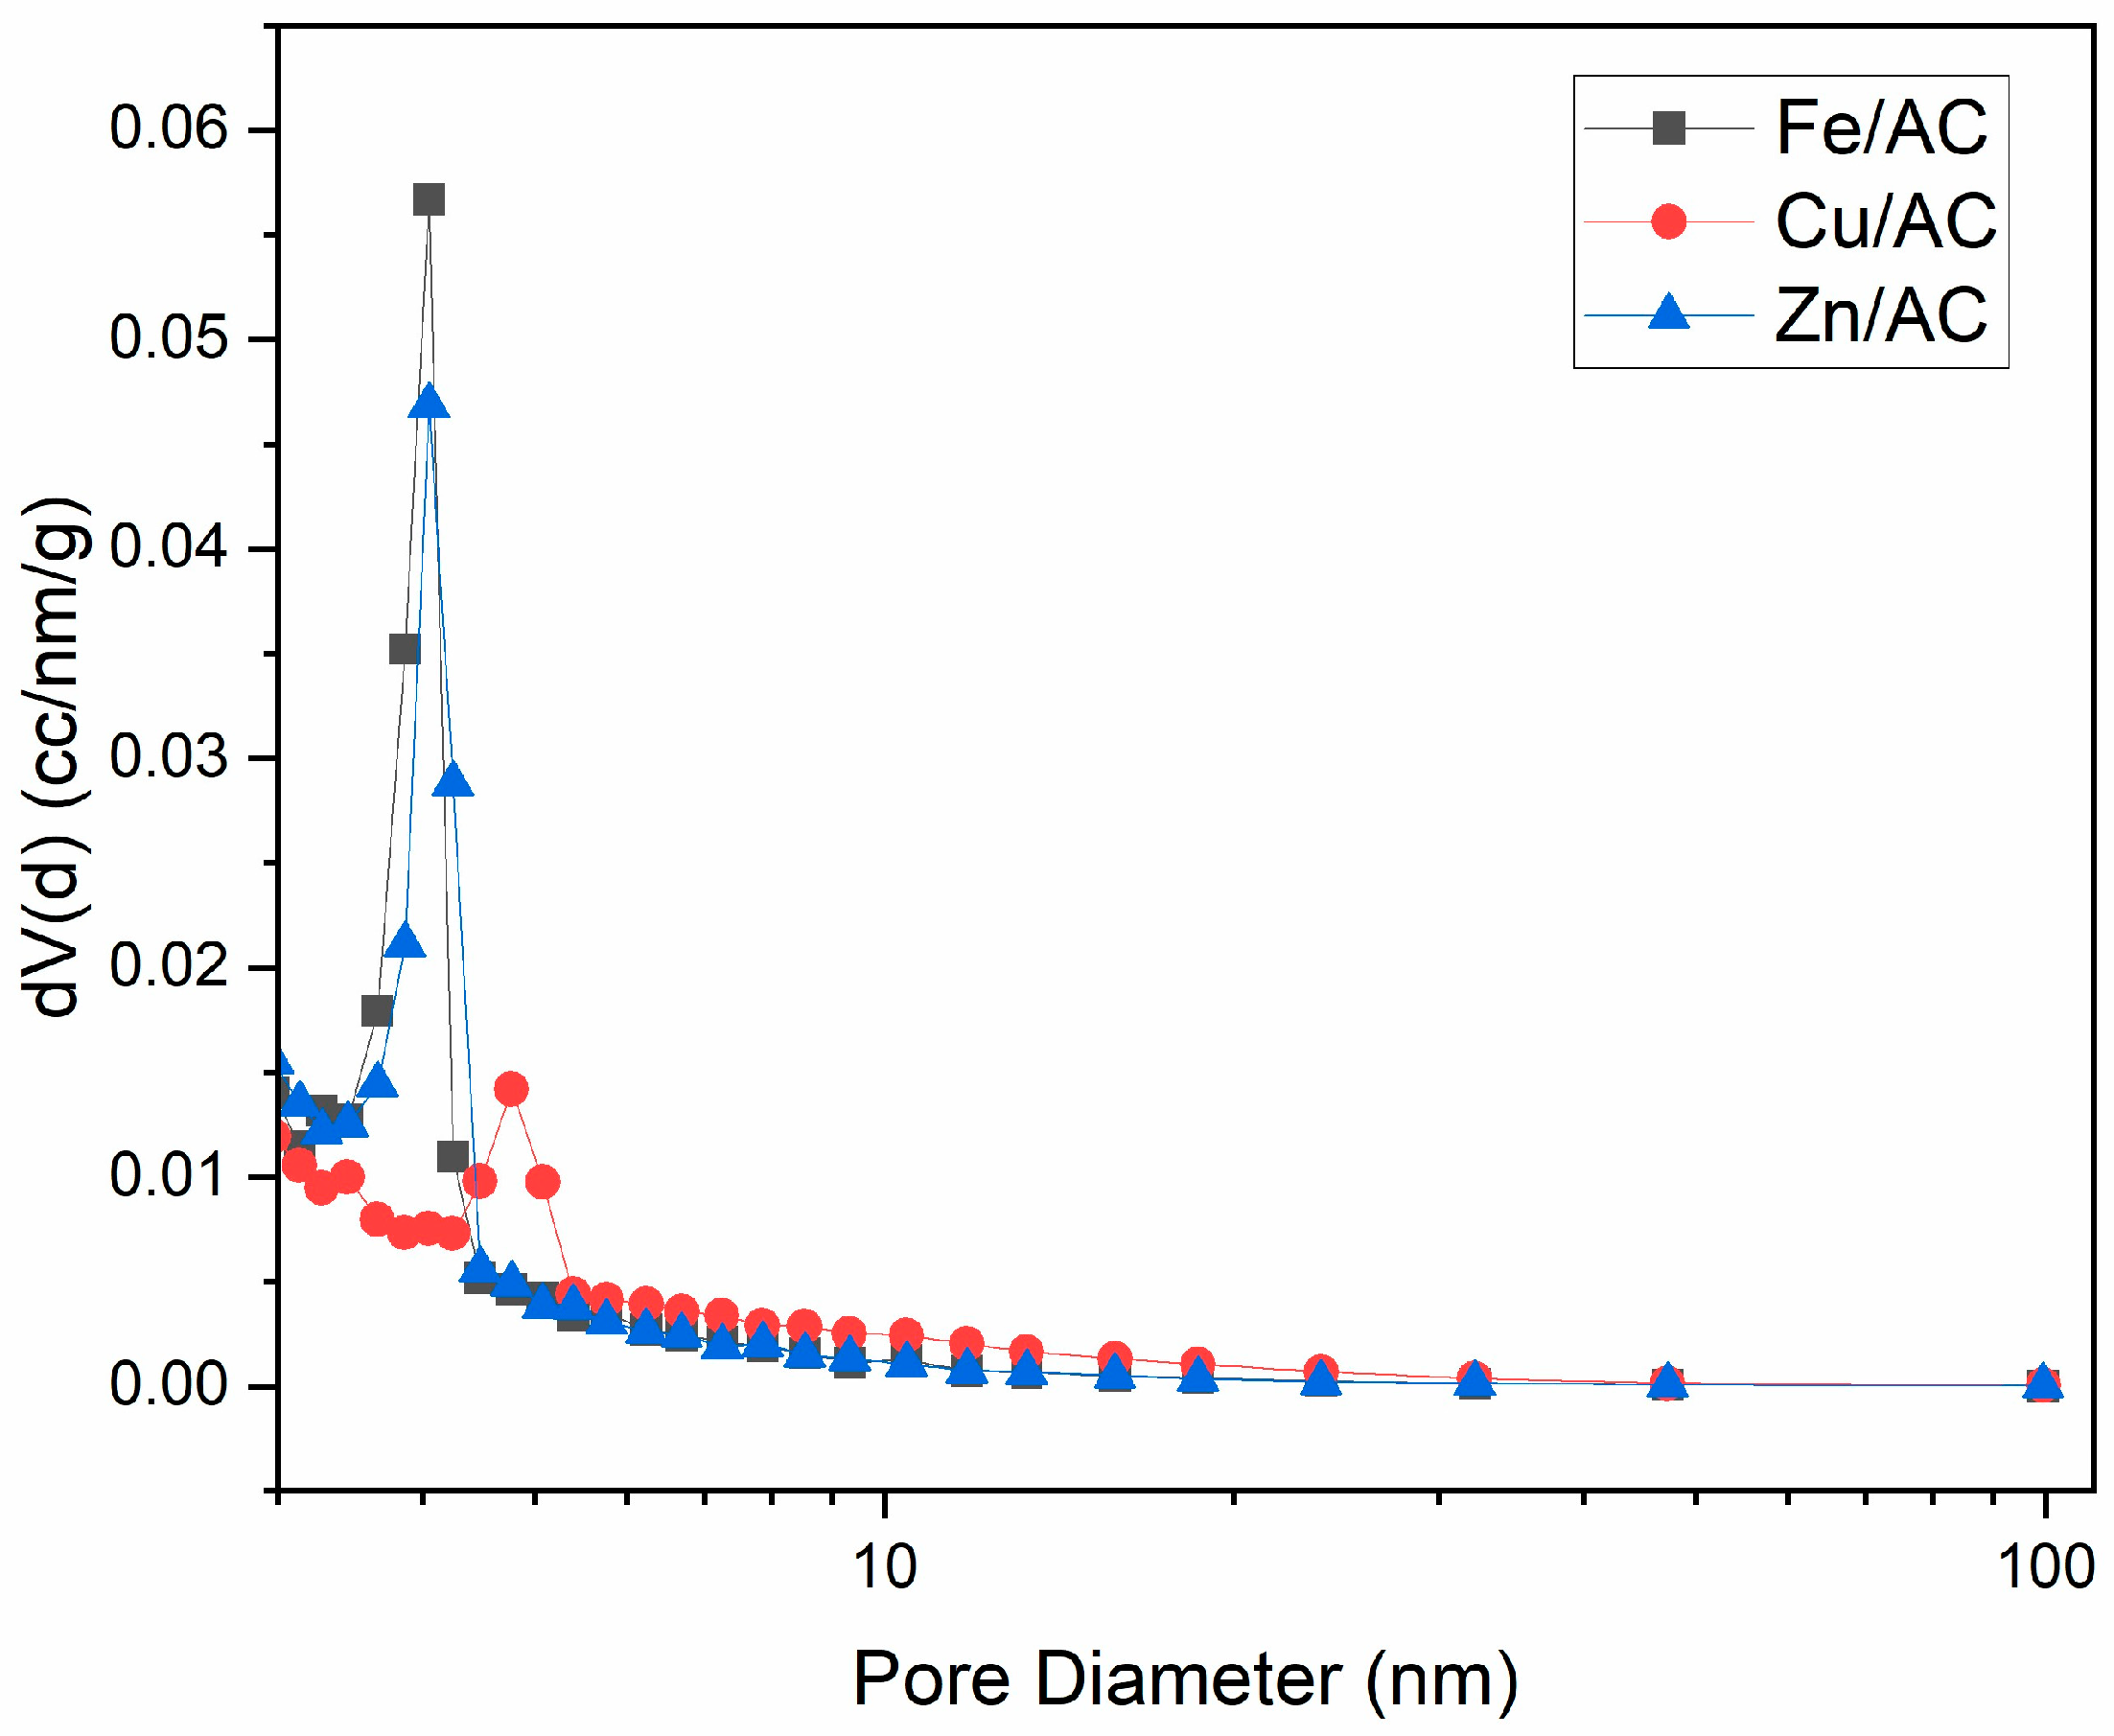
2.2. Textural Characteristics
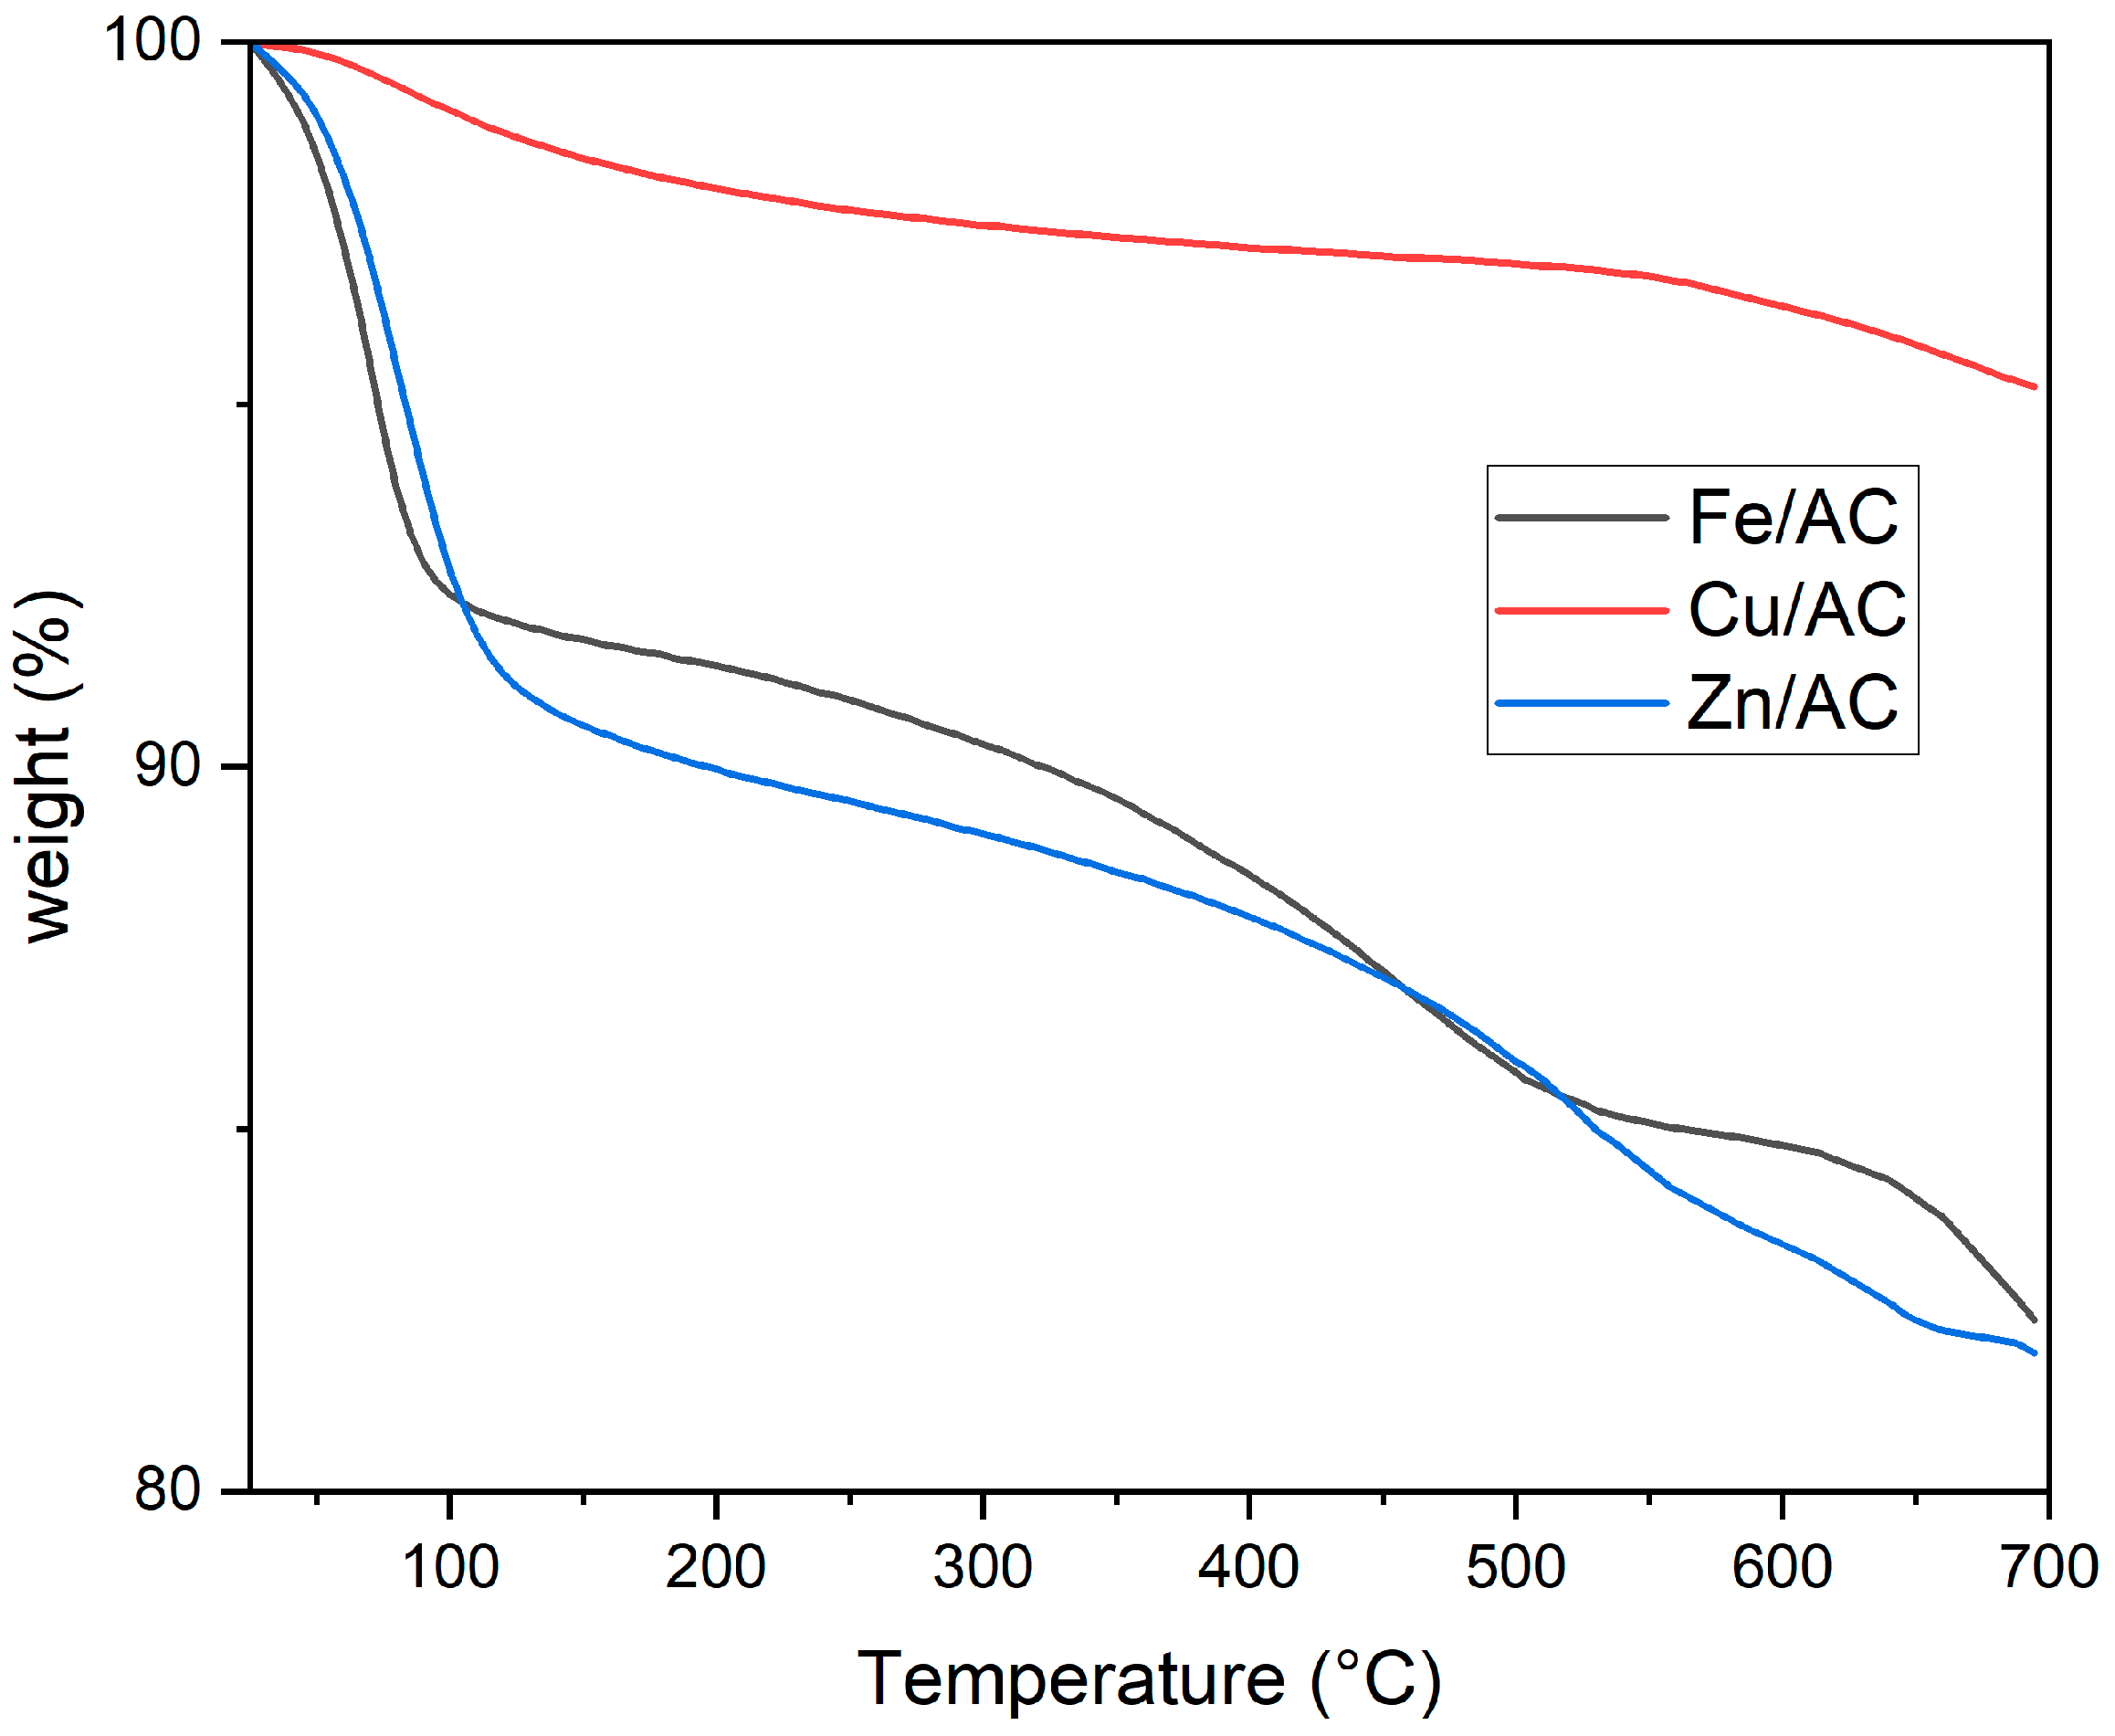
2.3. Thermogravimetric Analysis
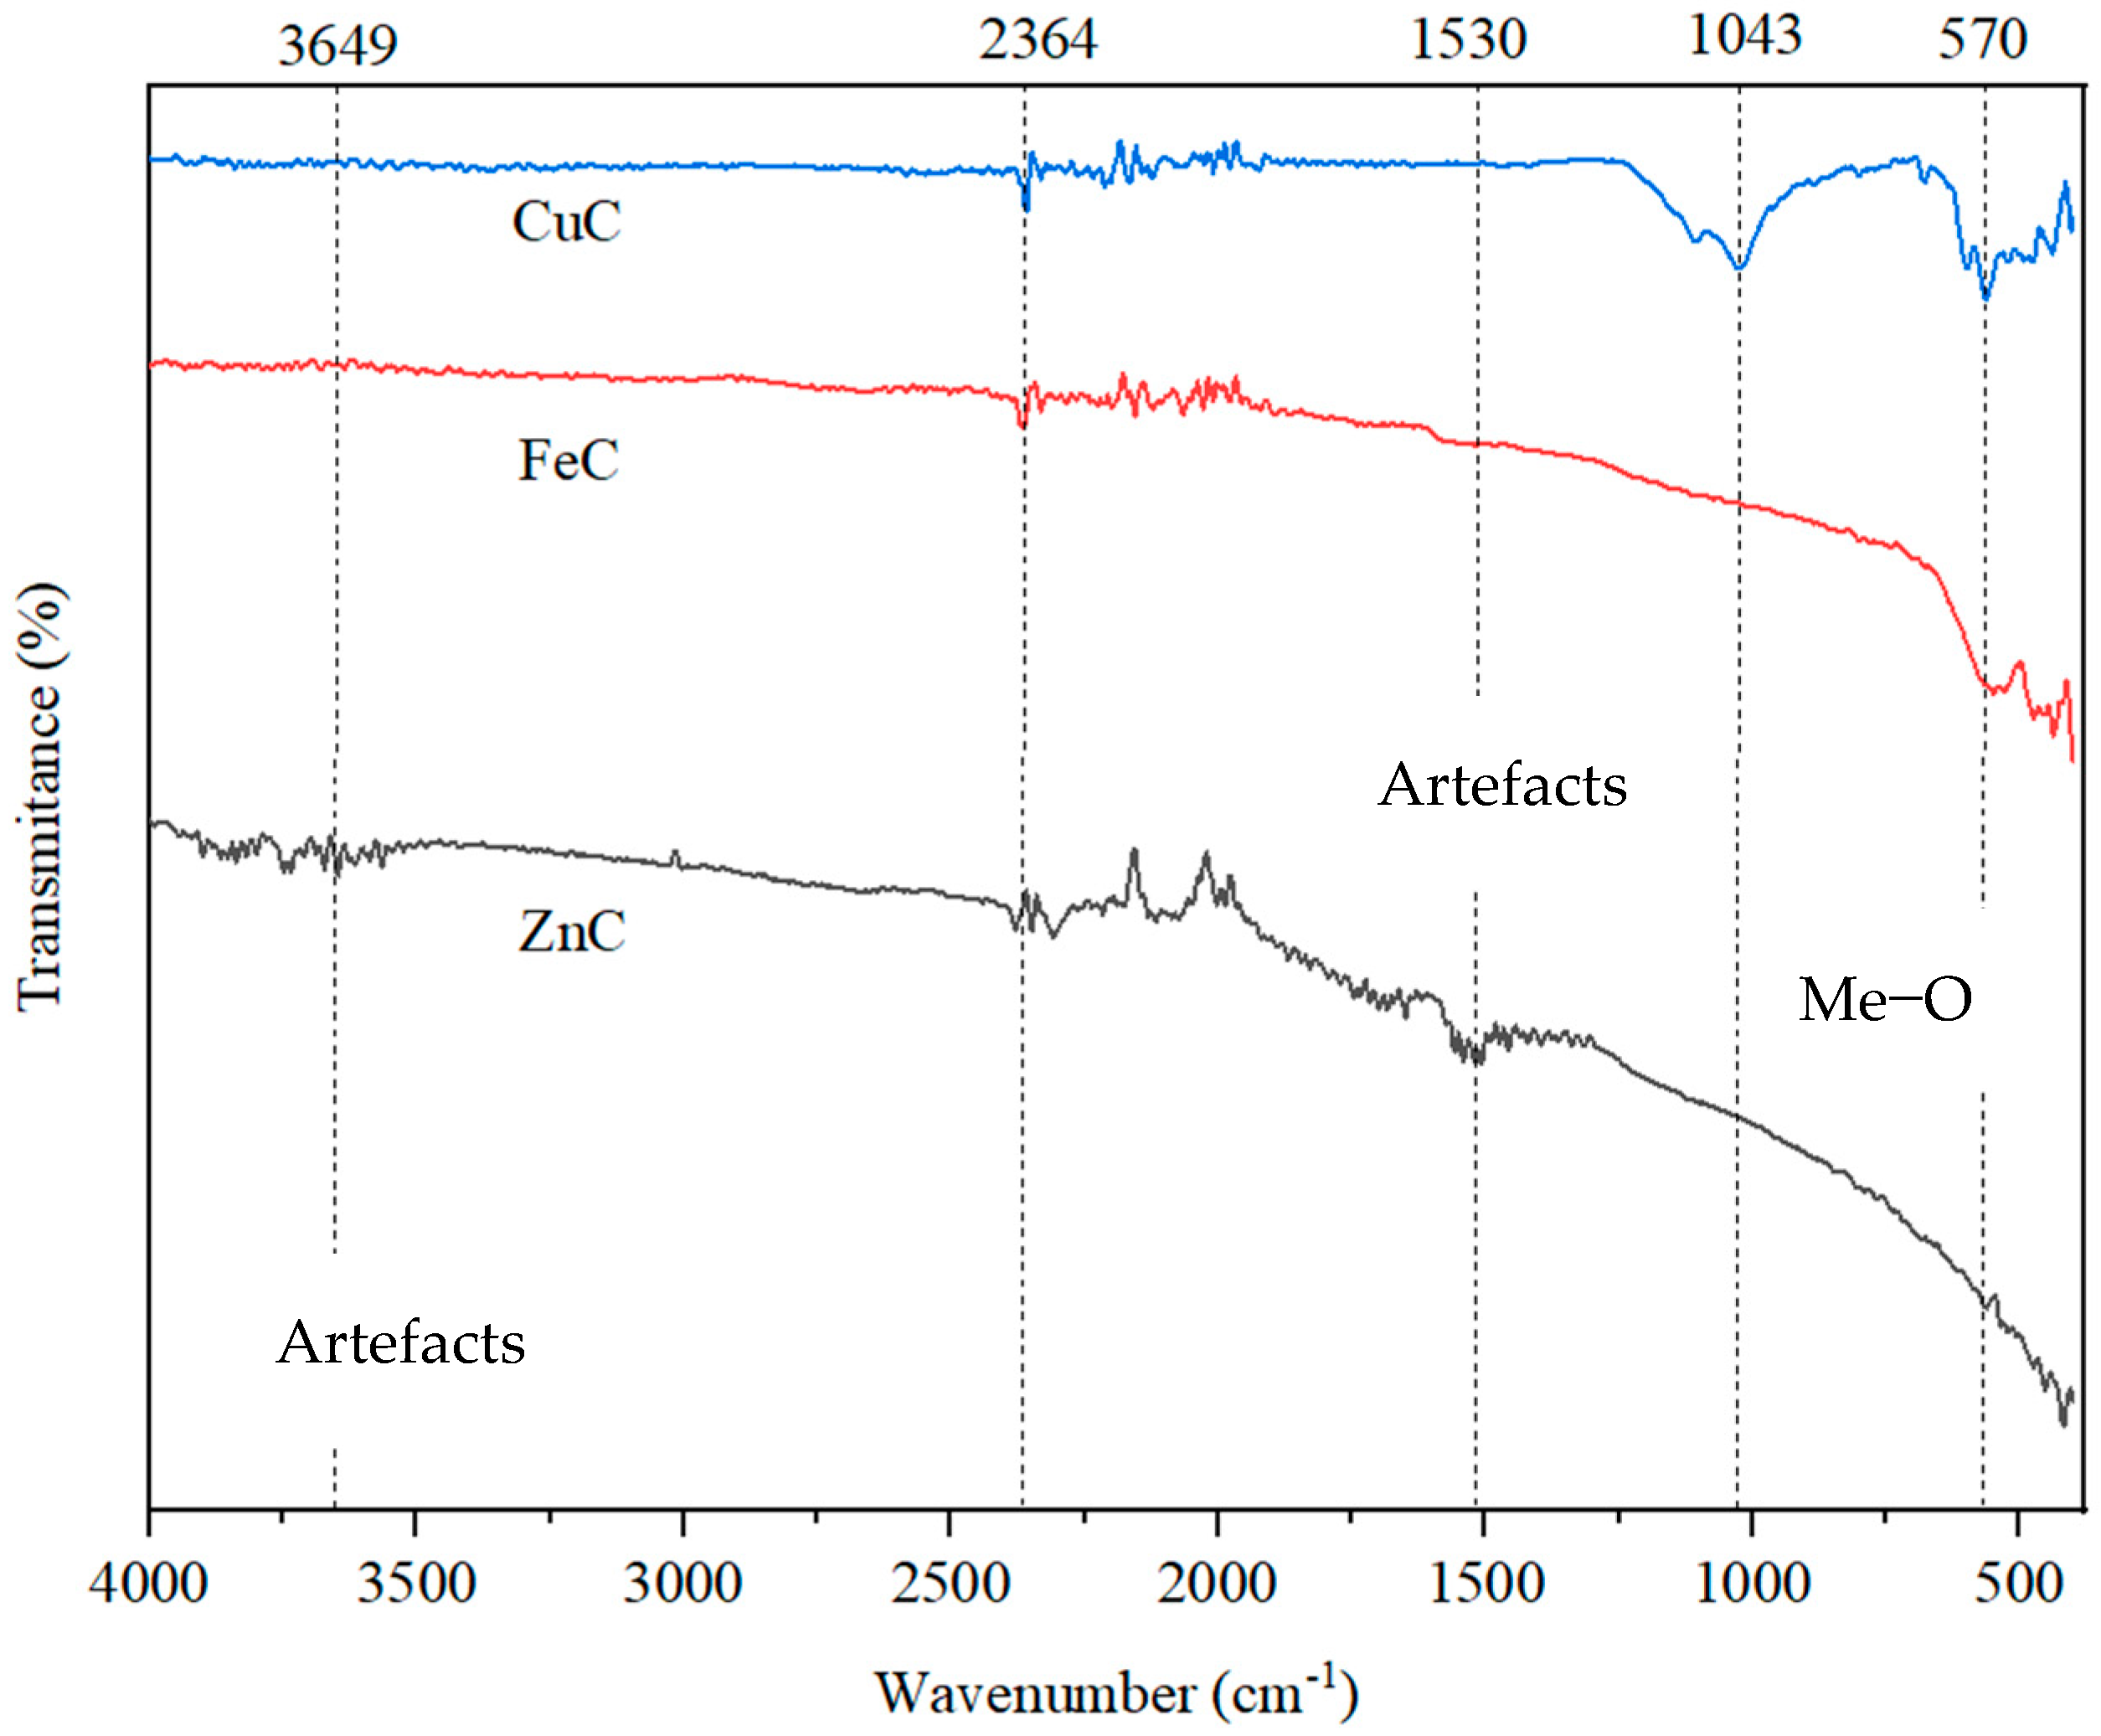
2.4. FTIR Analysis
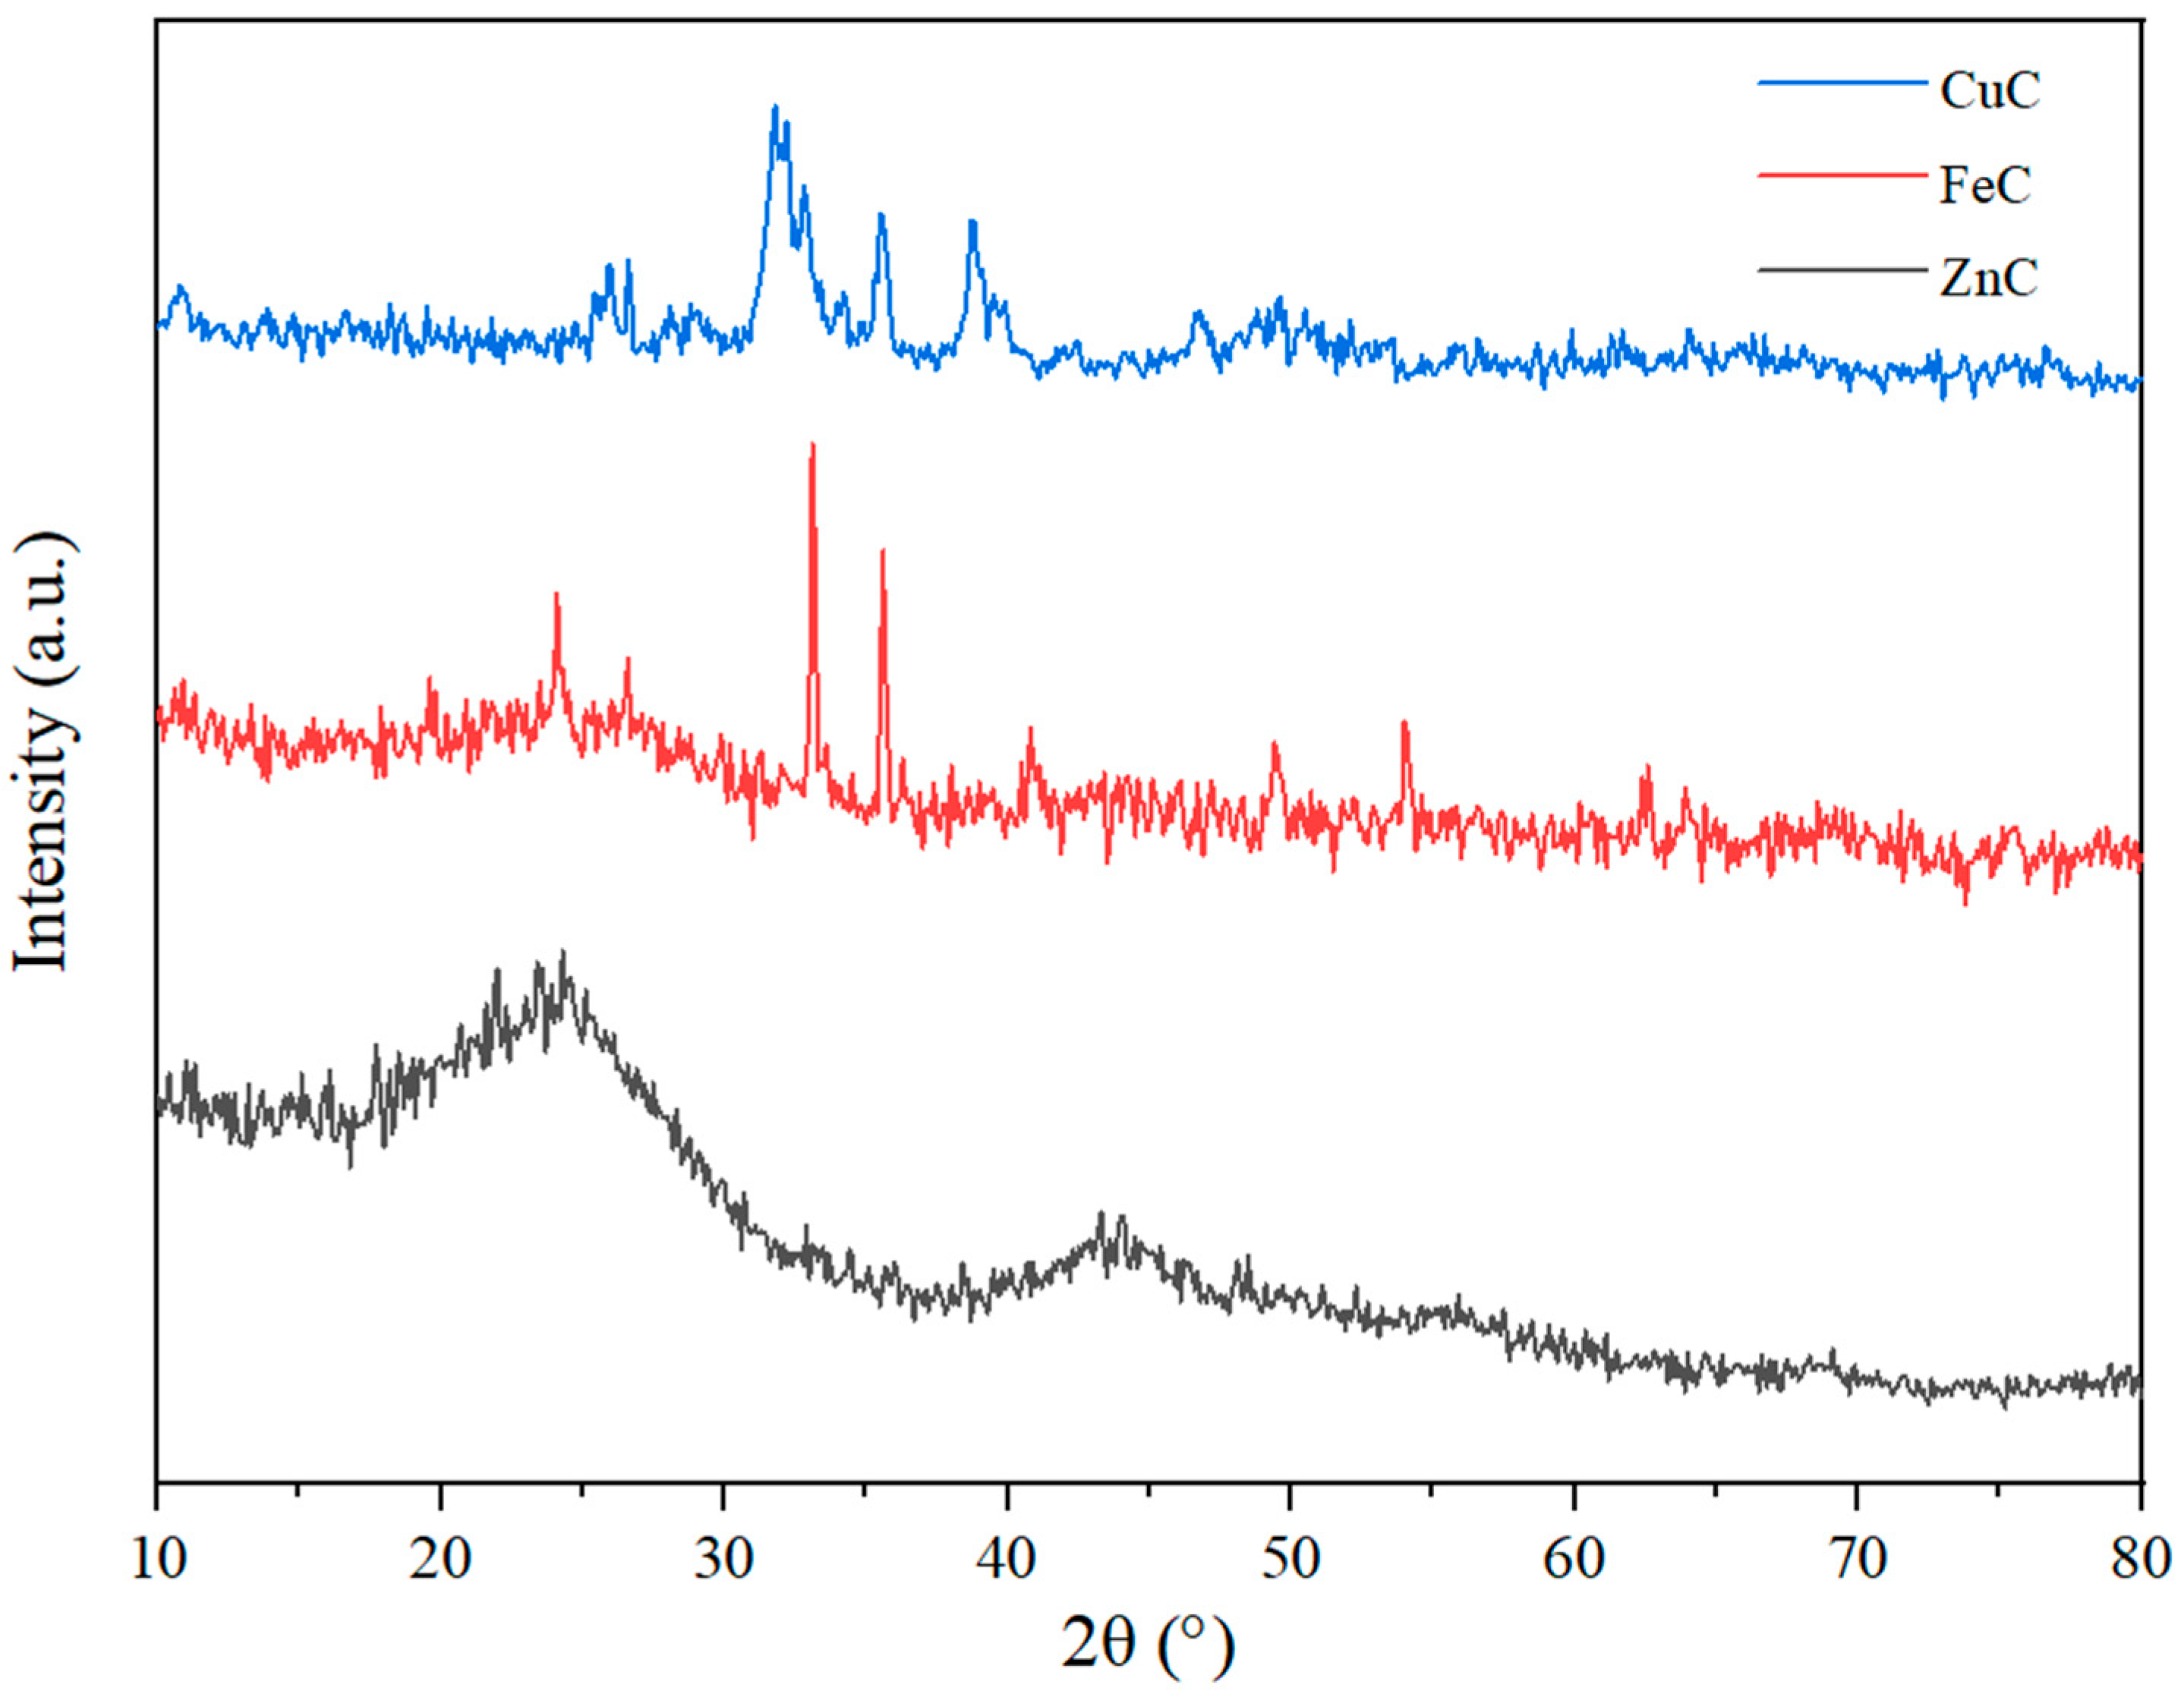
2.5. XRD Analysis
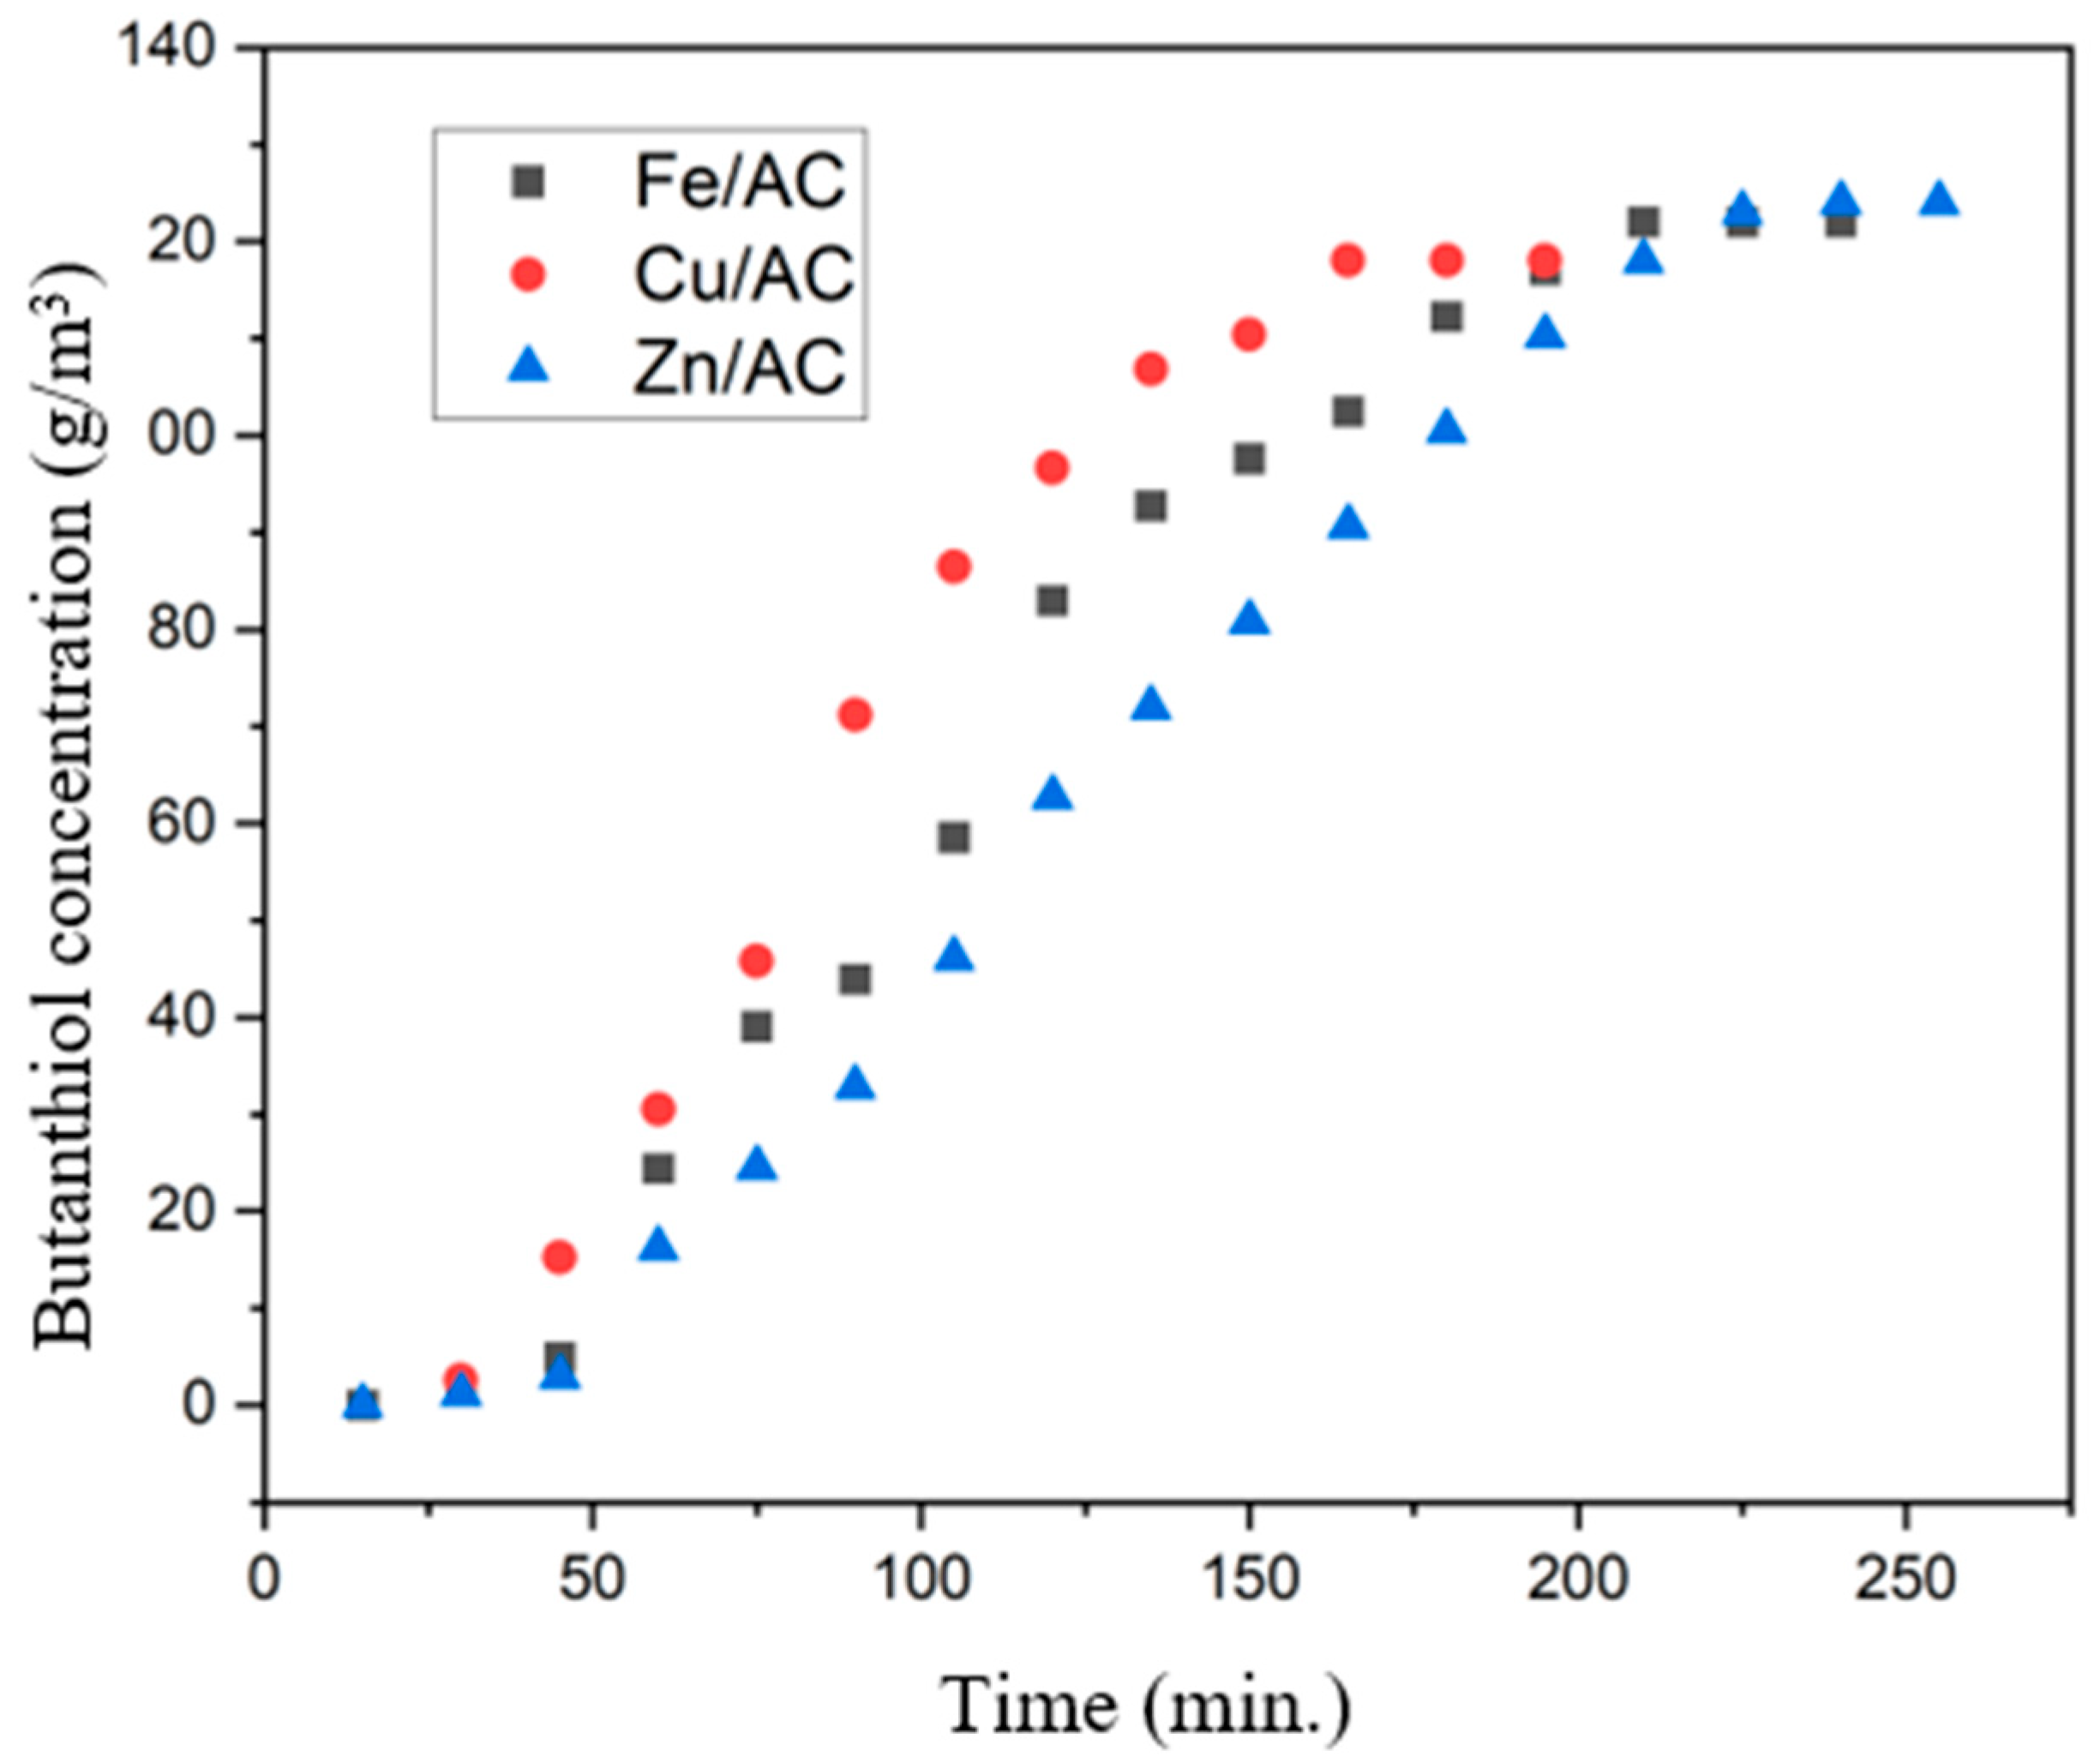
2.6. Butanethiol Adsorption Tests on Prepared Adsorbents
- (a)
- Adsorbent mass: 40 g;
- (b)
- Gas flow (nitrogen): 300 cm3/min;
- (c)
- Butanethiol concentration in the carrier gas: 121.11 g/m3;
- (d)
- Adsorber temperature: 150 °C.
3. Materials and Methods
3.1. Materials
3.2. Synthesis of Adsorbent
3.3. Characterization Methods
4. Conclusions
Author Contributions
Funding
Institutional Review Board Statement
Data Availability Statement
Acknowledgments
Conflicts of Interest
References
- Kangas, J.; Jäppinen, P.; Savolainen, H. Exposure to hydrogen sulfide, mercaptans and sulfur dioxide in pulp industry. Am. Ind. Hyg. Assoc. J. 1984, 45, 787–789. [Google Scholar] [CrossRef] [PubMed]
- Heaney, C.D.; Wing, S.; Campbell, R.L.; Caldwell, D.; Hopkins, B.; Richardson, D.; Yeatts, K. Relation between malodor, ambient hydrogen sulfide, and health in a community bordering a landfill. Environ. Res. 2011, 111, 847–852. [Google Scholar] [CrossRef]
- Rubright, S.L.M.; Pearce, L.L.; Peterson, J. Environmental toxicology of hydrogen sulfide. Nitric Oxide 2017, 71, 1–13. [Google Scholar] [CrossRef] [PubMed]
- Riveles, K.; Nagai, A. Analysis of Refinery Chemical Emissions and Health Effects; Office of Environmental Health Hazard Assessment California Environmental Protection Agency: Sacramento, CA, USA, 2019. [Google Scholar]
- Tansy, M.F.; Kendall, F.M.; Fantasia, J.; Landin, W.E.; Oberly, R.; Sherman, W. Acute and subchronic toxicity studies of rats exposed to vapors of methyl mercaptan and other reduced-sulfur compounds. J. Toxicol. Environ. Health 1981, 8, 71–88. [Google Scholar] [CrossRef]
- Fang, J.; Xu, X.; Jiang, L.; Qiao, J.; Zhou, H.; Li, K. Preliminary results of toxicity studies in rats following low-dose and short-term exposure to methyl mercaptan. Toxicol. Rep. 2019, 6, 431–438. [Google Scholar] [CrossRef]
- Bagreev, A.; Bashkova, S.; Bandosz, T.J. Dual role of water in the process of methyl mercaptan adsorption on activated carbons. Langmuir 2002, 18, 8553–8559. [Google Scholar] [CrossRef]
- Bashkova, S.; Bagreev, A.; Bandosz, T.J. Adsorption of methyl mercaptan on activated carbons. Environ. Sci. Technol. 2002, 36, 2777–2782. [Google Scholar] [CrossRef]
- Lee, S.W.; Daud, W.M.A.W.; Lee, M.G. Adsorption characteristics of methyl mercaptan, dimethyl disulfide, and trimethylamine on coconut-based activated carbons modified with acid and base. J. Ind. Eng. Chem. 2010, 16, 973–977. [Google Scholar] [CrossRef]
- Tamai, H.; Nagoya, H.; Shiono, T. Adsorption of methyl mercaptan on surface modified activated carbon. J. Colloid Interface Sci. 2006, 300, 814–817. [Google Scholar] [CrossRef]
- Guo, Z.; Huang, J.; Xue, Z.; Wang, X. Electrospun graphene oxide/carbon composite nanofibers with well-developed mesoporous structure and their adsorption performance for benzene and butanone. J. Chem. Eng. 2016, 306, 99–106. [Google Scholar] [CrossRef]
- Moghadaszadeh, Z.; Toosi, M.R.; Zardoost, M.R. Adsorption of light mercaptans over metal (Co, Cu, Fe, Ni) doped hexagonal boron nitride nanosheets: A first-principles study. J. Mol. Model. 2019, 25, 138. [Google Scholar] [CrossRef] [PubMed]
- Zhao, H.; Zhu, J.; Wang, J.; Hu, L. Highly efficient adsorption of ethyl mercaptan on hierarchical porous carbon derived from rice husk. Chem. Eng. Sci. 2025, 302, 120915. [Google Scholar] [CrossRef]
- Weber, G.; Benoit, F.; Bellat, J.P.; Paulin, C.; Mougin, P.; Thomas, M. Selective adsorption of ethyl mercaptan on NaX zeolite. Microporous Mesoporous Mater. 2008, 109, 184–192. [Google Scholar] [CrossRef]
- Yao, X.; Zhou, J.; Liu, Z. Study on adsorption of low-concentration methyl mercaptan by starch-based activated carbon. Chemosphere 2022, 302, 134901. [Google Scholar] [CrossRef] [PubMed]
- Jiang, Z.; Lei, Y.; Zhang, J.; Pinto, M.L.; Liu, Q.; Qian, G. Enhanced adsorption and regeneration performances for methyl mercaptan capture by a metal-organic framework incorporated in a mesoporous silica. Sep. Purif. Technol. 2025, 357, 130041. [Google Scholar] [CrossRef]
- Aguayo-Villarreal, I.A.; Montes-Morán, M.A.; Hernández-Montoya, V.; Bonilla-Petriciolet, A.; Concheso, A.; Rojas-Mayorga, C.K.; González, J. Importance of iron oxides on the carbons surface vs the specific surface for VOC’s adsorption. Ecol. Eng. 2017, 106, 400–408. [Google Scholar] [CrossRef]
- Peng, S.; Li, W.; Deng, Y.; Li, W.; Ma, X.; Chen, Y. Removal of low concentration CH3SH with regenerable Cu-doped mesoporous silica. J. Colloid Interface Sci. 2018, 513, 903–910. [Google Scholar] [CrossRef] [PubMed]
- Li, H.; Dong, X.; da Silva, E.B.; de Oliveira, L.M.; Chen, Y.; Ma, L.Q. Mechanisms of metal sorption by biochars: Biochar characteristics and modifications. Chemosphere 2017, 178, 466–478. [Google Scholar] [CrossRef] [PubMed]
- Jayaprakash, J.; Srinivasan, N.; Chandrasekaran, P.; Girija, E.K. Synthesis and characterization of cluster of grapes like pure and Zinc-doped CuO nanoparticles by sol-gel method. Spectrochim. Acta Mol. Biomol. Spectrosc. 2015, 136, 1803–1806. [Google Scholar] [CrossRef]
- Hadkar, V.M.; Selvaraj, C.I. Characterization and investigating the potential therapeutic effects of phyto-assisted CuO and Zn-doped CuO nanoparticles from Calophyllum apetalum (Willd.) leaf extract. J. Drug Deliv. Technol. 2025, 104, 106530. [Google Scholar] [CrossRef]
- Nzilu, D.M.; Madivoli, E.S.; Makhanu, D.S.; Wanakai, S.I.; Kiprono, G.K.; Kareru, P.G. Green synthesis of copper oxide nanoparticles and its efficiency in degradation of rifampicin antibiotic. Sci. Rep. 2023, 13, 14030. [Google Scholar] [CrossRef] [PubMed]
- Tan, X.; Liu, Y.; Zeng, G.; Wang, X.; Hu, X.; Gu, Y.; Yang, Z. Application of biochar for the removal of pollutants from aqueous solutions. Chemosphere 2015, 125, 70–85. [Google Scholar] [CrossRef]
- He, L.; Lv, L.; Pillai, S.C.; Wang, H.; Xue, J.; Ma, Y.; Liu, Y.; Chen, Y.; Wu, L.; Zhang, Z.; et al. Efficient degradation of diclofenac sodium by periodate activation using Fe/Cu bimetallic modified sewage sludge biochar/UV system. Sci. Total Environ. 2021, 783, 146974. [Google Scholar] [CrossRef]
- Nguyen-Quang, M.; Azzolina-Jury, F.; Thibault-Starzyk, F.; Travert, A.; Ziąbka, M.; Samojeden, B.; Motak, M.; Da Costa, P. Unveiling the potential of surfactant Pluronic-P123 application during the synthesis of Ni-hydrotalcitederived catalysts for low-temperature CO2 methanation: A novel approach. Appl. Mater. Today 2023, 32, 101805. [Google Scholar] [CrossRef]
- Mishra, R.K.; Lu, Q.; Mohanty, K. Thermal behaviour, kinetics and fast pyrolysis of Cynodon dactylon grass using Py-GC/MS and Py-FTIR analyser. J. Anal. Appl. Pyrolysis 2020, 150, 104887. [Google Scholar] [CrossRef]
- Chintala, V.; Kumar, S.; Pandey, J.K.; Sharma, A.K.; Kumar, S. Solar thermal pyrolysis of non-edible seeds to biofuels and their feasibility assessment. Energy Convers. Manag. 2017, 153, 482–492. [Google Scholar] [CrossRef]
- Chalmers, J.M. Mid-infrared spectroscopy: Anomalies, artifacts and common errors. Handb. Vib. Spectrosc. 2006, 3, 2326–2347. [Google Scholar]
- González-Suárez, B.W.; Pantoja-Espinoza, J.C.; Lardizábal-Gutierrez, D.; Flores, M.U.; Paraguay-Delgado, F. Effect of [Zn acetate]/[KOH] ratio on ZnO particles synthesis and photocatalytic Rhodamine B degradation. JMR&T 2024, 30, 8092–8107. [Google Scholar]
- Saussey, J.; Lavalley, J.C.; Bovet, C. Infrared study of CO2 adsorption on ZnO. Adsorption sites. J. Chem. Soc. Faraday Trans. 1 Phys. Chem. Condens. Phases 1982, 78, 1457–1463. [Google Scholar] [CrossRef]
- Ma, J.; Cui, S.; Zhang, J.; Huang, W.; Wang, Y. Efficient degradation of methyl orange with Fe/Co@PC particle electrodes in a three dimensional electrochemical reactor: Performance and mechanism. J. Water Process Eng. 2025, 69, 106765. [Google Scholar] [CrossRef]
- Wang, Y.; Muramatsu, A.; Sugimoto, T. FTIR analysis of well-defined α-Fe2O3 particles. Colloids Surf. A Physicochem. Eng. Asp. 1998, 134, 281–297. [Google Scholar] [CrossRef]
- Goudarzi, A.; Lin, L.; Ko, F.K. X-Ray Diffraction Analysis of Kraft Lignins and Lignin-Derived Carbon Nanofibers. ASME J. Nanotechnol. Eng. Med. 2014, 5, 021006. [Google Scholar] [CrossRef]
- Annamalai, S.; Kumar, A.V.N.; Shin, W.S. Revisiting the persulfate activation performance of seaweed derived biochars: The composition and origin of pollutant degradation activity. Process Saf. Environ. Prot. 2025, 193, 195–204. [Google Scholar] [CrossRef]
- Jose, L.M.; Kuriakose, S.; Thomas, S. Fabrication, Characterization and In Vitro Antifungal Property Evaluation of Biocompatible Lignin-Stabilized Zinc Oxide Nanoparticles Against Selected Pathogenic Fungal Strains. BioNanoScience 2020, 10, 583–596. [Google Scholar] [CrossRef]
- Deng, L.; Du, P.; Yu, W.; Yuan, P.; Annabi-Bergaya, F.; Liu, D.; Zhou, J. Novel hierarchically porous allophane/diatomite nanocomposite for benzene adsorption. Appl. Clay Sci. 2019, 168, 155–163. [Google Scholar] [CrossRef]


| No. | Adsorbent | Specific Surface Area (m2/g) | Total Pore Volume (cm3/g) | Average Pore Diameter (nm) |
|---|---|---|---|---|
| 1 | Cu/AC | 443.7 | 0.2797 | 2.521 |
| 2 | Fe/AC | 836.1 | 0.4717 | 2.256 |
| 3 | Zn/AC | 816.2 | 0.4627 | 2.268 |
| Sample | Compound | Crystallite Size (nm) | Crystallinity Degree, Xc % |
|---|---|---|---|
| Cu/AC | copper oxide | 124.7 | 96.37 |
| copper sulphide | 82.4 | 96.35 | |
| copper | 54.7 | 99.09 | |
| Fe/AC | iron oxide | 35.01 | 80.72 |
| iron | 85.41 | 99.21 | |
| Zn/AC | zinc | 56.6 | 90.05 |
| zinc oxide | 97.4 | 98.94 |
| No. | Adsorbent | Amount Adsorbed (g Butanethiol/m3) | Maximum Adsorption Capacity (cm3 Butanethiol/g Adsorbent) |
|---|---|---|---|
| 1 | Cu/AC | 9368.79 | 1.696 |
| 2 | Fe/AC | 12,579.42 | 1.790 |
| 3 | Zn/AC | 13,662.28 | 1.601 |
Disclaimer/Publisher’s Note: The statements, opinions and data contained in all publications are solely those of the individual author(s) and contributor(s) and not of MDPI and/or the editor(s). MDPI and/or the editor(s) disclaim responsibility for any injury to people or property resulting from any ideas, methods, instructions or products referred to in the content. |
© 2025 by the authors. Licensee MDPI, Basel, Switzerland. This article is an open access article distributed under the terms and conditions of the Creative Commons Attribution (CC BY) license (https://creativecommons.org/licenses/by/4.0/).
Share and Cite
Sanda, M.; Onuțu, I.; Dușescu-Vasile, C.M.; Vasilievici, G.; Bomboș, D.; Băjan, M.; Brănoiu, G. Removal of Butyl Mercaptan from Gas Streams by Reactive Adsorption. Molecules 2025, 30, 1962. https://doi.org/10.3390/molecules30091962
Sanda M, Onuțu I, Dușescu-Vasile CM, Vasilievici G, Bomboș D, Băjan M, Brănoiu G. Removal of Butyl Mercaptan from Gas Streams by Reactive Adsorption. Molecules. 2025; 30(9):1962. https://doi.org/10.3390/molecules30091962
Chicago/Turabian StyleSanda, Mia, Ion Onuțu, Cristina Maria Dușescu-Vasile, Gabriel Vasilievici, Dorin Bomboș, Marian Băjan, and Gheorghe Brănoiu. 2025. "Removal of Butyl Mercaptan from Gas Streams by Reactive Adsorption" Molecules 30, no. 9: 1962. https://doi.org/10.3390/molecules30091962
APA StyleSanda, M., Onuțu, I., Dușescu-Vasile, C. M., Vasilievici, G., Bomboș, D., Băjan, M., & Brănoiu, G. (2025). Removal of Butyl Mercaptan from Gas Streams by Reactive Adsorption. Molecules, 30(9), 1962. https://doi.org/10.3390/molecules30091962