2.2. Fitting the Response Surface Models
The variation in the particle size, polydispersity index and zeta potential were predicted by employing response surface methodology as the responses were the function of the emulsion composition and preparation variables of levodopa loaded nanoemulsions.
Table 1 shows the experimental data obtained for the three response variables based on central composite design (CCD) matrix. The experimental data was statistically analyzed. The statistic analysis was used to determine the best fitted model for the four independent variables. The estimated regression coefficients,
R2, adjusted
R2, regression (
p-value), lack of fit (
p-value) and probability values related to the effect of the four independent variables are shown in
Table 2. A positive value in the regression equation represents an effect that favors optimization due to a synergistic effect, while a negative value indicates an inverse relationship or antagonistic effect between the factor and the response [
11]. It should be mentioned that non-significant (
p < 0.005) linear terms were included in the final reduced model if quadratic or interaction terms containing these variables were found to be significant (
p < 0.05) [
12].
In this work, the response surface analysis demonstrated that the second-order polynomial used for particle size has a higher coefficient of determination (
R2 = 0.9757) compared to the polydispersity index (
R2 = 0.9632) and the zeta potential (
R2 = 0.9093). The obtained coefficient of determination showed that more than 90% of the response variation of the particle size, zeta potential and polydispersity index could be described by RSM models as the function of the main nanoemulsion and preparation variables. It was observed that the lack of fit had no indication of significant (
p < 0.05) for the final reduced model, therefore proving the satisfactory fitness of the response surface model to the significant (
p < 0.05) factors effect (
Table 2).
From
Table 2, it was observed that only two independent variables (C and D) exhibited a positive effect on the response of particle size (
R1). For zeta potential (
R2), three independent variables (A, B, C) presented a positive effect while for polydispersity index (
R3) all independent variables presented negative effects except for one variable (D). Coefficients with more than one factor, or higher order terms in the regression equation, represent the interaction between terms or the quadratic relationship, respectively which suggest a non-linear relationship between factors and responses [
13]. In this condition, factors can produce a different degree of response than is predicted by the regression equation if they are varied at different levels or more than one factor is changed simultaneously [
11]. All the responses
R1,
R2 and
R3 were affected by the interaction of independent variables, presenting a quadratic relationship. The interaction effects between A and B and between A and D were favorable only for response
R2. A favorable effect was also noticed for all responses,
R1,
R2 and
R3 for the interaction between B and C. The interaction between B and D was favorable only for
R1. However, it was observed that the interaction between A and C and between C and D had an inverse effect for all responses. Quadratic effects of all four independent variables were noticed for all the responses. The highest and positive quadratic effect for all variables was noticed for
R1 while the highest and negative quadratic effect was noticed for
R2.
The coefficient significance of the quadratic polynomial models was evaluated by using Analysis of Variance (ANOVA). For any of the terms in the models, a large
F-value and a small
p-value indicated a more significant effect on the respective response variables [
14].
Table 3 shows the effect of independent variables on the variation of the physicochemical properties of levodopa-loaded nanoemulsions. The independent variables that most affect the particle size of the nanoemulsion for the linear term were lecithin composition, followed by the linear term of addition rate; the other two linear terms (oil and Cremophor EL composition) did not indicate any significant effect (
p > 0.05). The quadratic term of lecithin composition also had a significant effect (
p < 0.05) on the particle size of nanoemulsions. Conversely, the effect of the other three quadratic terms was insignificant (
p > 0.05). Furthermore, the interaction between oil and lecithin composition and between oil composition and addition rate showed a significant effect (
p < 0.05) on the particle size of nanoemulsions.
The variable which exhibited the largest effect on the zeta potential of the nanoemulsion for the linear term was Cremophor EL composition. The other three variables (oil composition, lecithin composition and addition rate) showed insignificant effects. The quadratic terms of Cremophor EL composition, addition rate and oil composition exhibited significant effects on the zeta potential as well. The interaction between oil composition and addition rate showed a significant effect on the zeta potential compared to the other interactions.
For the polydispersity index, the linear and quadratic term of the addition rate had the most significant effect (p < 0.001), followed by the linear term of Cremophor EL composition and interaction between Cremophor EL composition and addition rate. Thus, it was indicated that in evaluating the response variation of the polydispersity index, it was important to consider the Cremophor EL composition and the addition rate.
2.3. Response Surface Analysis
In general, there is a high demand in the pharmaceutical industry for the production of nanoemulsions with a smaller droplet size (<1 μm). Due to the nano-sized and kinetically stable characteristics, nanoemulsions are very efficient in encapsulating and/or solubilising the drugs and can successfully deliver them to the targeted part of the body. Direct contact of the drug with the body fluids and tissues can be avoided and the drug is released slowly over a prolonged period of time, which may lead to minimization of side effects [
15–
17].
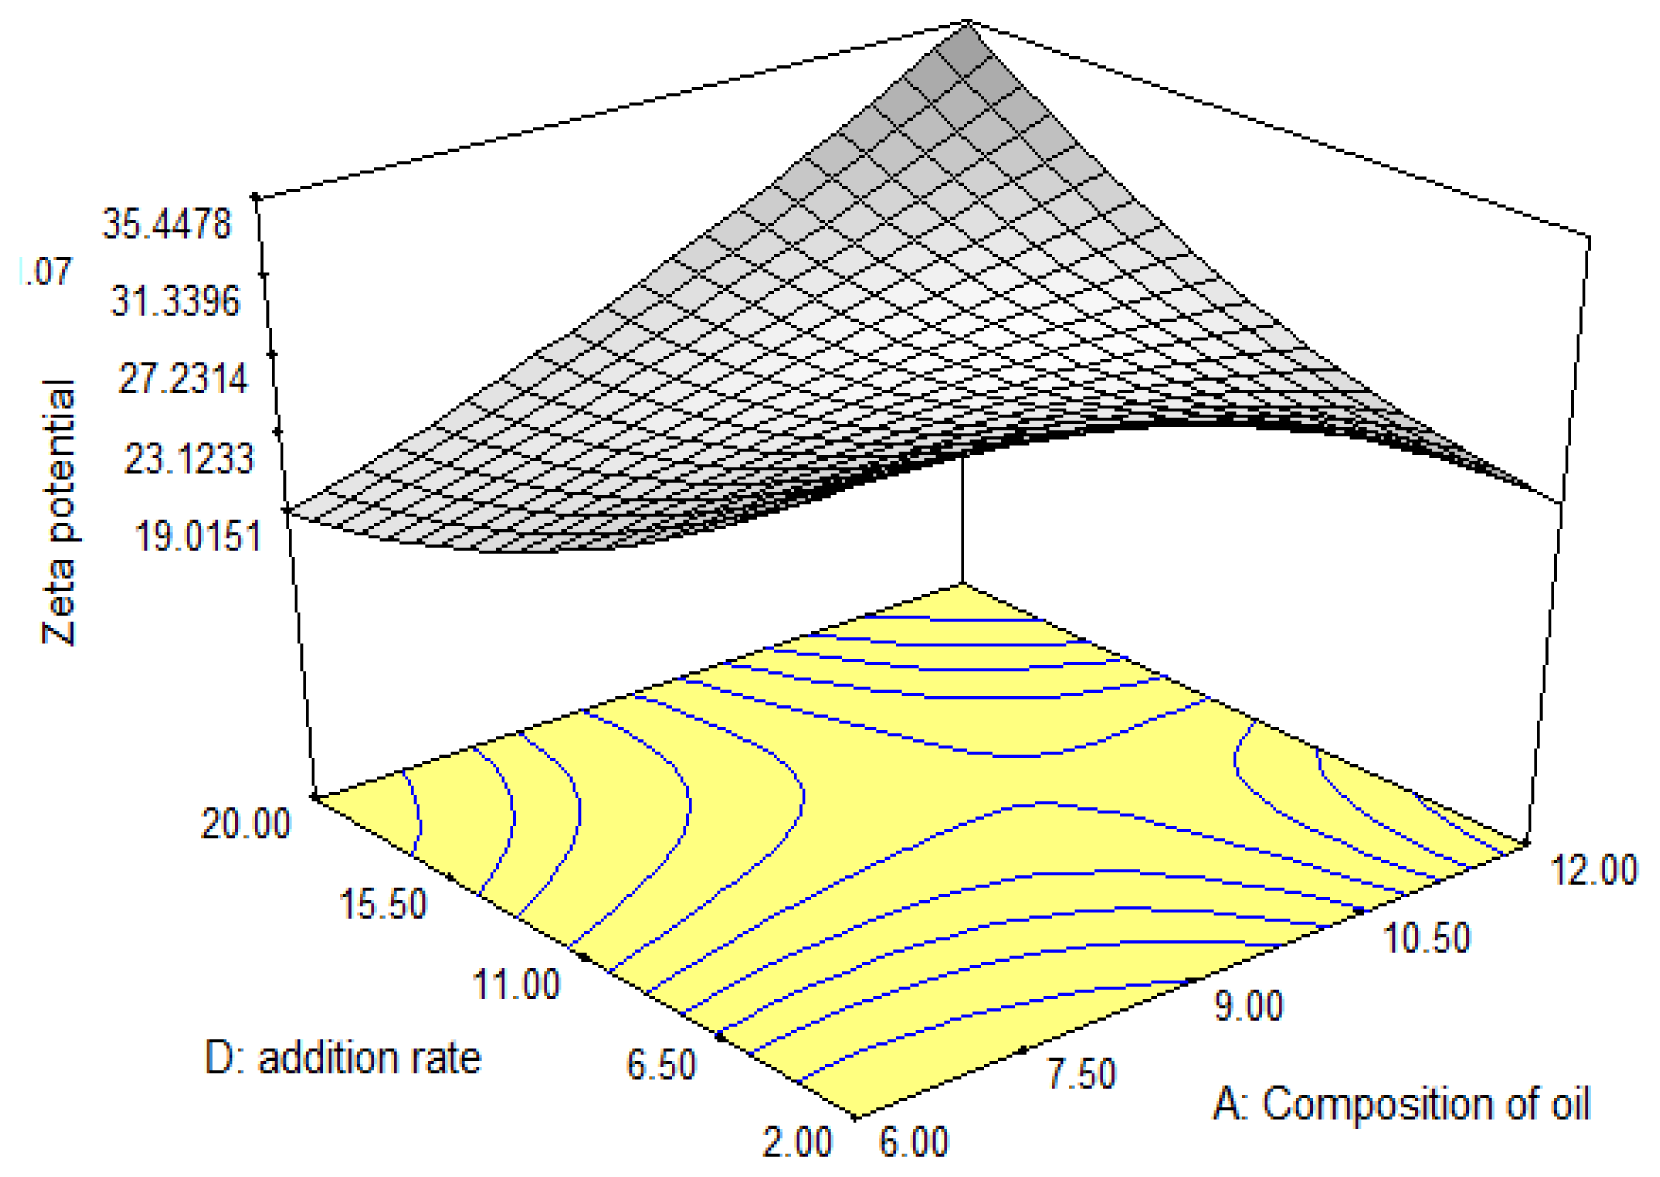
For the optimization of levodopa-loaded nanoemulsions, response surface analyses were plotted in three dimensional model graphs. The response surface plots for particle size, zeta potential and polydispersity index which are used to interpret the interaction effect of the variables are presented in
Figures 1–
3 respectively. The third and forth factors were kept at constant level.
Figure 1A,B demonstrated that the particle size increases with increasing oil composition. The oil phase composition influences the physicochemical properties and the stability of parenteral lipid emulsions [
18]. A few explanations need to be considered to describe the observed results. First, with the rise in the oil content, the droplet disruption process becomes more difficult which is due to an increase in the flow resistance and hence the droplet break-up rate becomes severely restricted [
19,
20]. Second, part of the effect can be attributed to the increased rates of collision frequency, particularly at lower concentration, between the emulsion droplets followed by an ultimate increase of coalescence frequency which subsequently lead to a higher probability of coalescence of the droplets [
21].
As shown in
Figure 1A, the increasing in lecithin content led to an increase in particle size. However, additional increase in the lecithin composition resulted in a decrease of the particle size. The increase in particle size may result from an impoverishment of the surfactant at the interface with increasing surface of the dispersed oil phase [
20]. In addition, the increase in particle size may also be due to an insufficient amount of lecithin to emulsify the oil and the aqueous phase. Decrease of particle size by further increase in lecithin is due to the fact that the emulsifier plays a vital role in the formation of emulsion as it lowers the interfacial tension, thereby the Laplace pressure,
p is reduced and the stress required for droplet deformation is reduced [
21].
Figure 1B demonstrates increasing particle size when the oil composition is increased (9%–12%
w/
w) and the addition rate is reduced. Generally, particle size was reduced when the addition rate was decreased. However, the phenomenon did not occur in this case. The possible reason for this observation might be due to the relatively higher oil content. The addition rate factor did not help significantly in the emulsification process.
The zeta potential is a stability indicative parameter in colloidal systems like submicron emulsions [
22–
24] due to electrostatic repulsion.
Figure 2 demonstrated that by decreasing the addition rate and the composition of oil, the zeta potential increased. This observation could be due to the stabilization mechanisms; electrostatic and steric mechanism. At low addition rate and composition of oil, the effect of steric stabilization is caused by the incorporation of surfactant and co-surfactant. However, by increasing the addition rate and oil composition, the surfactant and co-surfactant were unable to increase the electrostatic repulsion between emulsion droplets, as the amount was insufficient. In addition, decreasing the addition rate at high range (10.5–20 mL/min) increased the zeta potential with increasing oil composition. The reason for this behavior could be attributed to the strong repulsive Coulomb force between charged particles which counterbalances the Van der Waals attraction force and this phenomenon is not only contributed by the surfactant role but is also due to the decreasing addition rate.
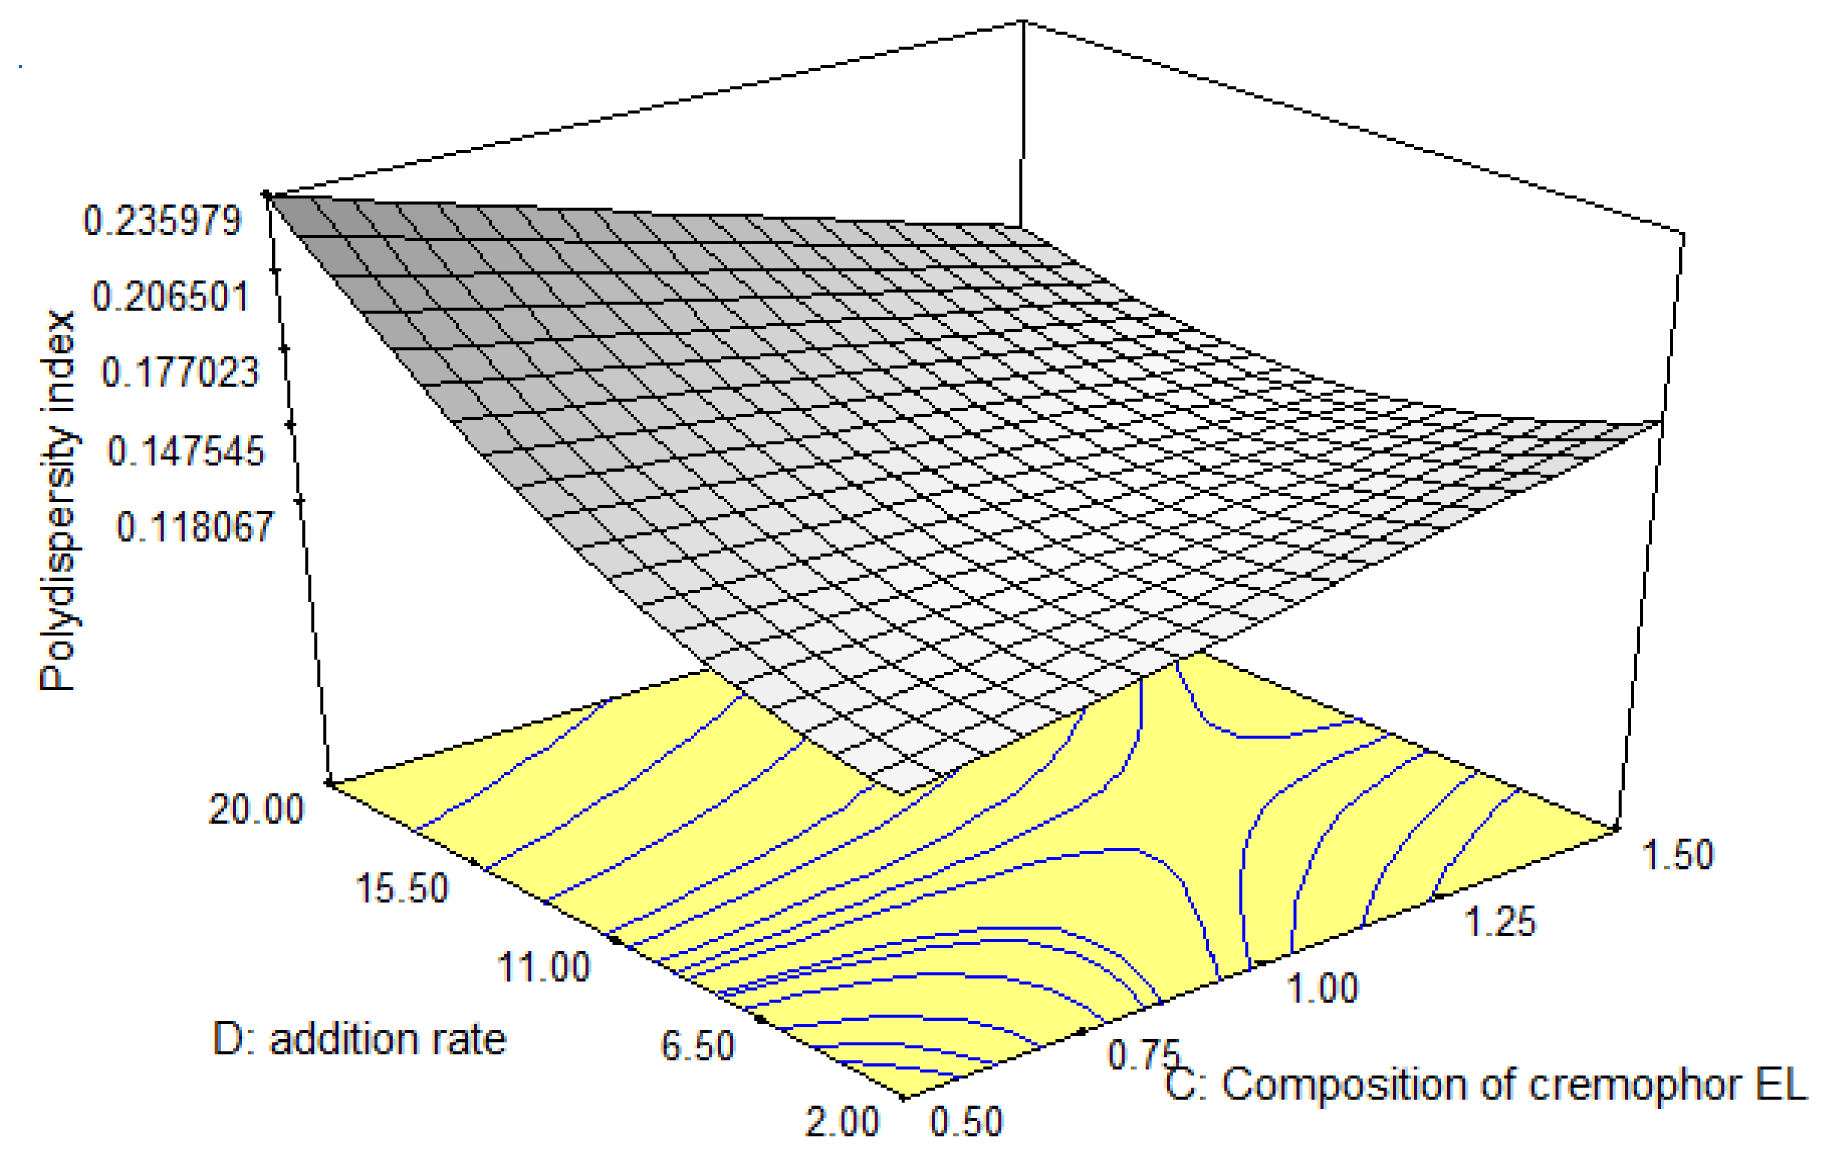
Polydispersity index (PI) characterizes the disperse systems with respect to deviation from the average size, and values up to 0.250 are acceptable for parenteral emulsions [
25]. The polydispersity index varied from 0 to 1. The composition of materials and the preparation method used play an important role in the emulsion formulation as both may affect each other and thus influence the physicochemical properties of the emulsions.
Figure 3 demonstrated that the polydispersity index increased with increasing addition rate and Cremophor EL composition at low range (0.5%–0.8%
w/
w). The increasing polydispersity index could be due to the high addition rate of the oil phase over the mixture of the aqueous phase, thus limiting the breaking down of the oil droplet during the emulsification process. This promoted the formation of a large particle size. The presence of a high concentration of emulsifier ultimately led to an increase in the flow resistance in the batch emulsification process which in turn resulted in the larger magnitude of apparent viscosity of the prepared emulsions [
19,
26]. The higher concentration of co-emulsifier produced an emulsion with high viscosity, which can considerably affect the emulsification efficiency. Consequently, this condition increased the coalescence rate resulting in a larger particle size. The large particles tend to coalesce faster than small particles. This phenomenon contributed to the high polydispersity index as the distribution of the particle size became broad. In addition, the low amount of Cremophor EL used, was insufficient to emulsify the emulsion system.
By increasing the addition rate (11–20mL/min) and composition of Cremophor EL (0.85%–1.5%
w/
w) the polydispersity index decreased. The decrease in polydispersity index could be due to the co-surfactant, Cremophor EL which possesses polyethylene glycols and ethoxylated glycerol polar covalent parts. Both structures have excellent capability to solubilize many types of essential oil. Because of these two highly hydrophilic groups in the aqueous phase, the difference in viscosity between the two immiscible phases is reduced, thereby leading to lowering of the critical Weber number followed by an increased droplet break-up efficiency [
21]. Cremophor EL, which is a non-ionic surfactant, was chosen as co-surfactant not only due to its great emulsifying properties but also due to its characteristically low toxicity.


