Article

Synergistic Reaction of SO2 with NO2 in Presence of H2O and NH3: A Potential Source of Sulfate Aerosol

1
Environment Research Institute, Shandong University, Jinan 250100, China
2
College of Biological and Environmental Engineering, Binzhou University, Binzhou 256600, China
3
Center for Optics Research and Engineering (CORE), Shandong University, Qingdao 266237, China
*
Authors to whom correspondence should be addressed.
Int. J. Mol. Sci. 2019, 20(15), 3746; https://doi.org/10.3390/ijms20153746
Submission received: 24 June 2019 / Revised: 28 July 2019 / Accepted: 29 July 2019 / Published: 31 July 2019
(This article belongs to the Section Physical Chemistry and Chemical Physics)

Abstract

:
Effect of H2O and NH3 on the synergistic oxidation reaction of SO2 and NO2 is investigated by theoretical calculation using the molecule system SO2-2NO2-nH2O (n = 0, 1, 2, 3) and SO2-2NO2-nH2O-mNH3 (n = 0, 1, 2; m = 1, 2). Calculated results show that SO2 is oxidized to SO3 by N2O4 intermediate. The additional H2O in the systems can reduce the energy barrier of oxidation step. The increasing number of H2O molecules in the systems enhances the effect and promotes the production of HONO. When the proportion of H2O to NH3 is 1:1, with NH3 included in the system, the energy barrier is lower than two pure H2O molecules in the oxidation step. The present study indicates that the H2O and NH3 have thermodynamic effects on promoting the oxidation reaction of SO2 and NO2, and NH3 has a more significant role in stabilizing product complexes. In these hydrolysis reactions, nethermost barrier energy (0.29 kcal/mol) can be found in the system SO2-2NO2-H2O. It is obvious that the production of HONO is energetically favorable. A new reaction mechanism about SO2 oxidation in the atmosphere is proposed, which can provide guidance for the further study of aerosol surface reactions.

Graphical Abstract

1. Introduction

Sulfur dioxide (SO2), a major air pollutant, is released into the atmosphere via the combustion of sulfur containing fuels and industrial production [1,2,3], volcanic eruptions, and decomposition of sulfides in nature. SO2 can be oxidized to form sulfuric acid (H2SO4) through the homogeneous or heterogeneous processes [4,5,6], which include gas-phase oxidation by hydroxyl radical (OH•) and in-cloud oxidation by dissolved ozone (O3) and hydrogen peroxide (H2O2) [7,8,9]. It has been proved that sulfuric acid is the main contributor to the new particle formation, resulting in serious environmental issues such as haze and acid rain [10,11,12]. Thus, it is significant to investigate the SO2 oxidation mechanism in the atmosphere.
In hazy weather, researchers have found that a considerable amount of PM2.5 can be formed in the atmosphere, and sulfate is the significant component of the fine particulate matter [13,14,15,16,17,18]. Previous studies have indicated that, as the haze weather gets worse, the concentration of O3 decreases, while the concentrations of NO2 and sulfate increase [19]. However, widespread formation pathways (gas-phase oxidation and in-cloud oxidation) of sulfate cannot account for the phenomena of high content of sulfate. Some researchers have investigated that the oxidation reaction of SO2 by NO2 is proposed as a missing key pathway to form sulfate in a special condition [19,20,21,22,23,24]. Wang et al. have considered that NO2 could effectively react with SO2 in the presence of H2O and NH3 during the severe haze period [25]:
SO 2 ( g ) + 2 NO 2 ( g ) + 2 H 2 O ( aq ) 2 H + ( aq ) + SO 4 2 ( aq ) + 2 HONO ( g )
2 NH 3 ( g ) + SO 2 ( g ) + 2 NO 2 ( g ) + 2 H 2 O ( aq ) 2 NH 4 + ( aq ) + SO 4 2 ( aq ) + 2 HONO ( g )
From Reaction (1) and (2), it can be seen that the final products primarily include SO42− and HONO.
In the presence of water, the process of NO2 dimerization is likely to occur in polluted atmospheric conditions [26,27]. Some studies have demonstrated that N2O4, the dimer of NO2, serves as the oxidant to oxidize SO2 on the aerosol surface [28,29,30]. For NO2 dimer, three isomers, symmetric sys-O2N-NO2, and asymmetric t-ONONO2, c-ONONO2, can be found. The sys-O2N-NO2 is very stable due to its symmetry, while asymmetric ONO-NO2 can be rapidly converted to NO+ and NO3 in the presence of water [31,32,33,34]. The ion pairs (NO+NO3) can also oxidize many organic and inorganic compounds [35]. Although these studies have shown that SO2 can react with NO2 to produce H2SO4, the reaction mechanism is not completely understood.
In this paper, we researched the gas-phase reaction of SO2 with NO2 using the density functional theory (DFT) method. The different number of water molecules is added to the reaction so as to investigate the role of water molecules in the oxidation reaction. In addition, the effect of NH3 in the oxidation reaction also is considered.

2. Results and Discussion

2.1. The Reaction of SO2-2NO2-nH2O (n = 0, 1, 2, 3)

2.1.1. The Reaction of SO2-2NO2

In the absence of H2O, the equilibrium structures and potential energy are shown in Figure 1, Table 1 and Table 2 present the corresponding energy data and the numerical value of charge distribution of NO+NO3 and NO+NO2. The relative energies, enthalpies and Gibbs free energies in all relevant species for the system SO2-2NO2 are summarized in Table S1. Two main pathways are found due to the formation of two NO2 dimers, t-ONONO2 and c-ONONO2. The pre-reactive complexes (RC1 and RC2) are produced by a collision of SO2. The IM1 (a binding of −23.27 kcal/mol) is formed via transient state (TS1) with the energy barrier and reaction energy of 45.48 kcal/mol and −11.49 kcal/mol, respectively. The IM2 is produced by TS2 with the energy barrier and reaction energy of 52.45 kcal/mol and −5.77 kcal/mol, respectively. These two processes are similar in that an O atom from NO+NO3 fragments transforms into SO2 to lead to the formation of SO3. As shown in Table S1, the reaction SO2-2NO2→IM1 is exothermic and spontaneous (ΔH of −24.50 kcal/mol and ΔG of −0.29 kcal/mol at 298.15K). Due to the absence of H2O molecule, the hydrolysis process cannot be carried out, and HONO cannot be generated, finally.

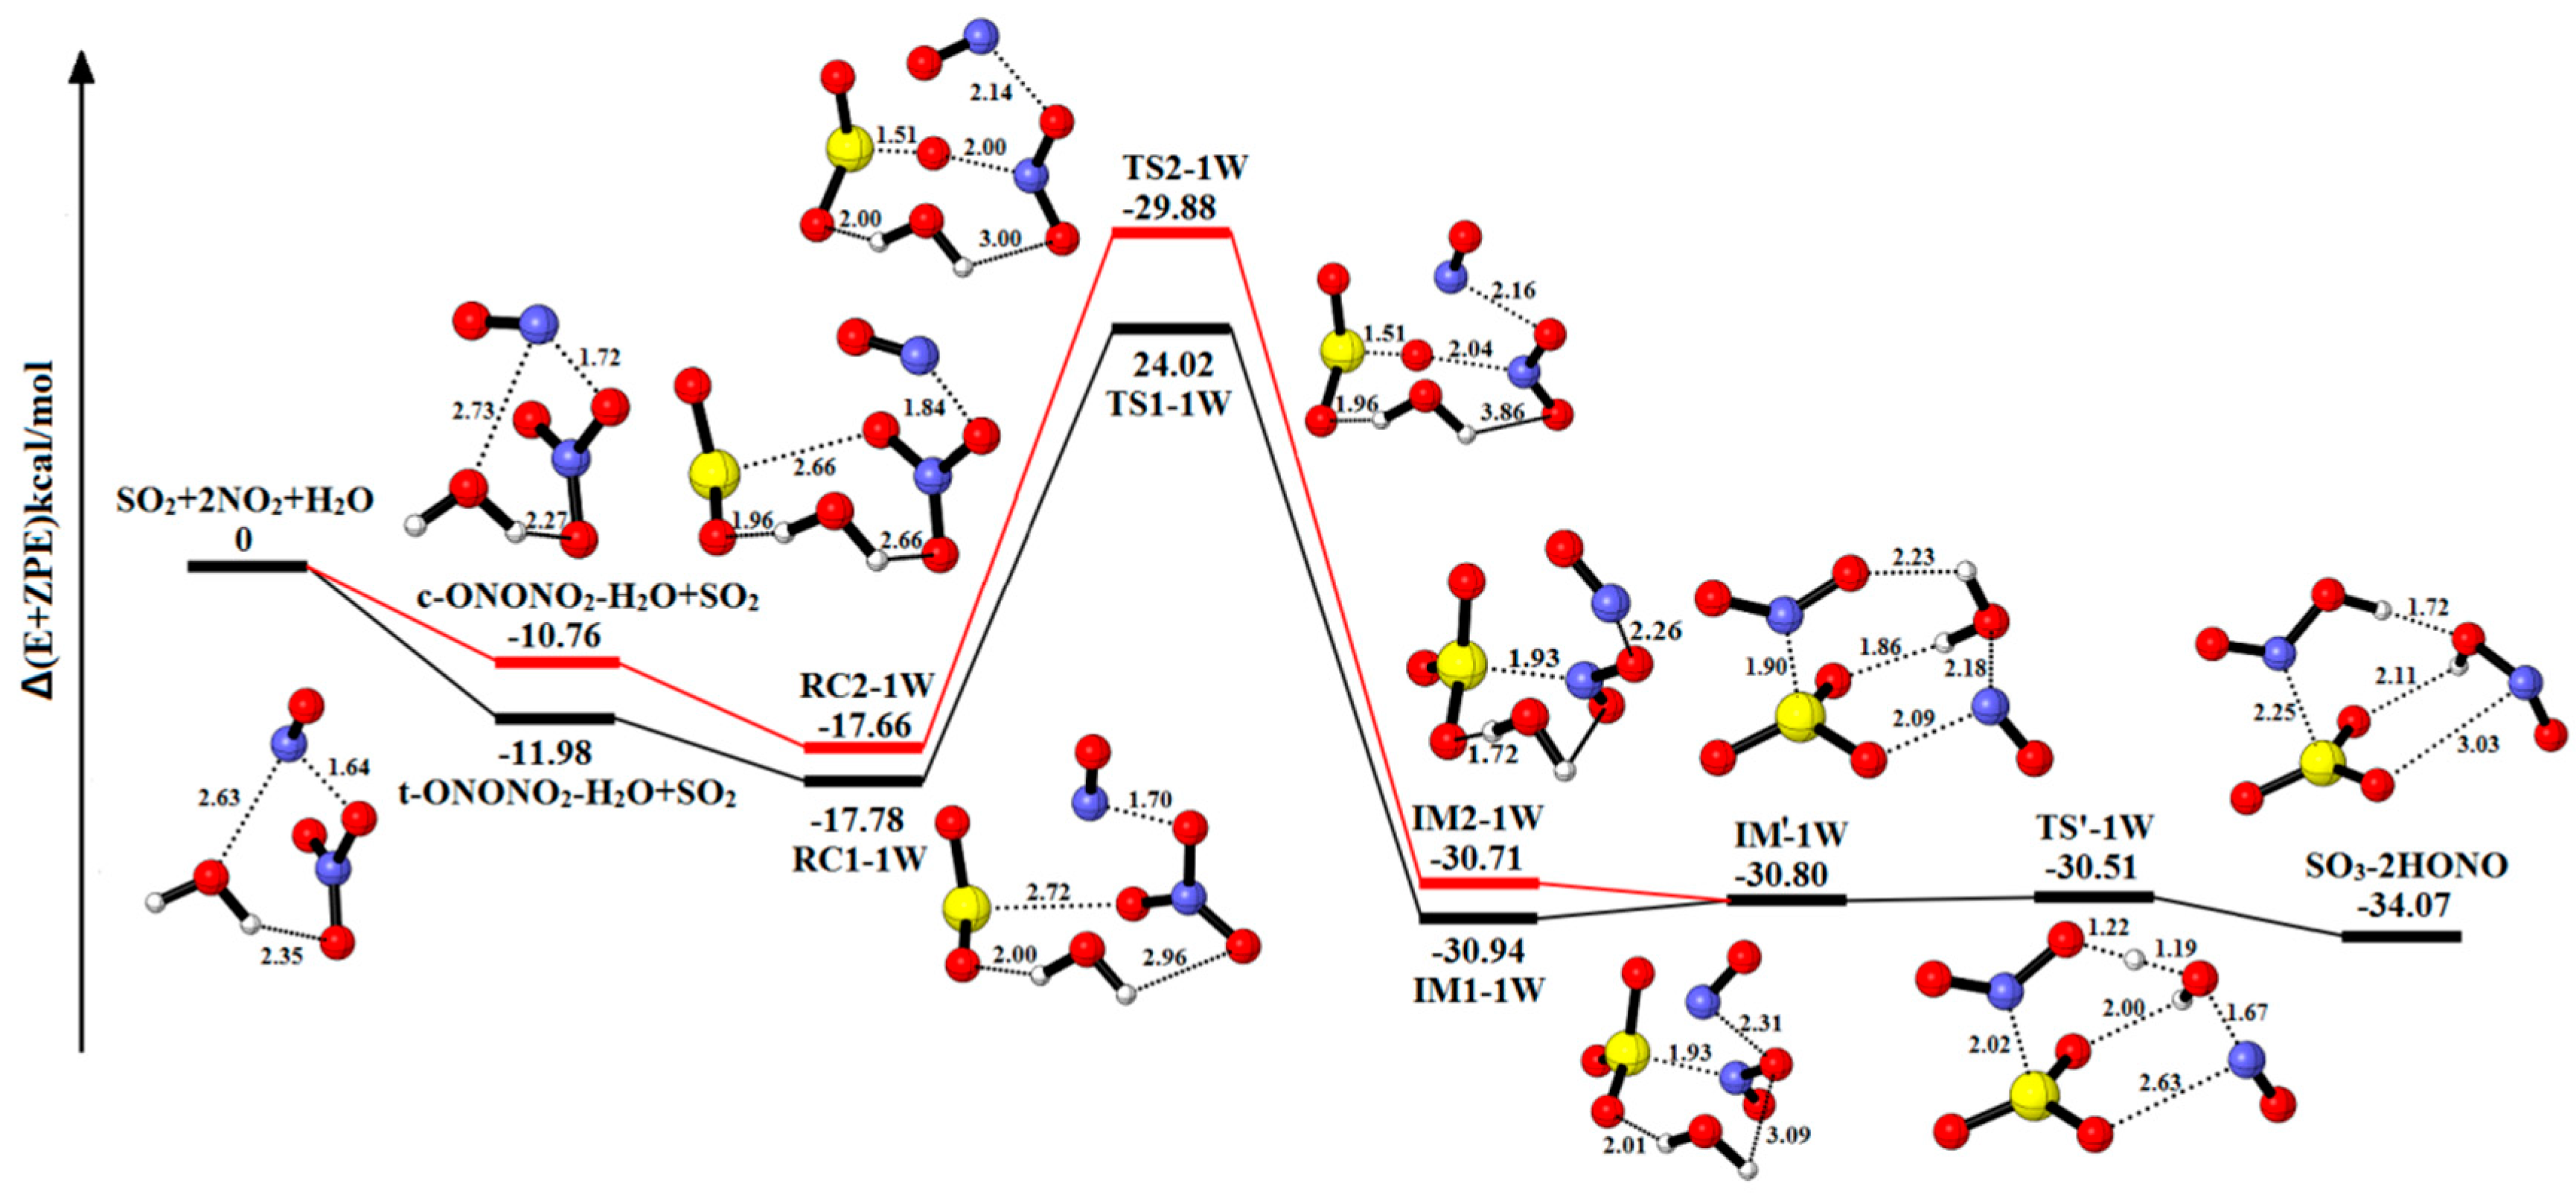
2.1.2. The Reaction of SO2-2NO2-H2O

Figure 2 explores the equilibrium structures and potential energy of SO2-2NO2-H2O. The corresponding energy data and the numerical value of charge distribution are put in Table 1 and Table 2. The relative energies, enthalpies and Gibbs free energies in all relevant species for the SO2-2NO2-H2O are listed in Table S2. In these two pathways, the complexes (t-ONONO2-H2O and c-ONONO2-H2O) are firstly produced via the interaction between an N2O4 molecule and a water molecule. Through a collision with SO2, the two complexes can transform into the pre-reactive complex (RC1-1W and RC2-1W).
Beginning with the reactant complex RC1-1W (a binding energy of 17.78 kcal/mol), the complex IM1-1W (a binding energy 30.94 kcal/mol) can be formed via the TS1-1W with the energy barrier of 41.80 kcal/mol. In this process, an oxygen atom from NO+NO3 fragment is transferred to SO2, leading to the formation of SO3. The complex IM1-1W can undergo an isomerization process to form IM′-1W with the energy absorption of 0.14 kcal/mol. Because the H2O molecule gets involved, the NO+NO2 fragments are divided into two parts, and the NO+ fragment rotates by an angle. Once the IM′-1W is produced, the final complex SO3-2HONO can be easily formed with the energy barrier of 0.29 kcal/mol and the reaction energy of −3.27 kcal/mol. From IM′-1W to SO3-2HONO, the water molecule reacts with the isolated NO+ fragment and NO2 fragment to form two HONO molecules. In the other pathway, the reaction process is similar in the above step. The IM2-1W is formed from the conversion of RC2-1W via the transition state TS2-1W with the energy barrier of 47.54 kcal/mol and the reaction energy of −13.05 kcal/mol. After that, the hydrolysis process is the same as the above reaction (IM′-1W to SO3-2HONO). The reactant (IM′-1W) is formed via IM2-1W releasing the energy of 0.09 kcal/mol. In the same way, the SO3-2HONO is formed with the energy barrier and reaction energy of 0.30 kcal/mol and −3.27 kcal/mol, respectively.
In the absence of water, the energy barrier is higher than one H2O molecule and the hydrolysis reaction cannot produce HONO. The result indicates that H2O molecule reacts as the solvent to reduce activation energy and stable structures and also is a critical reactant in the formation of HONO.

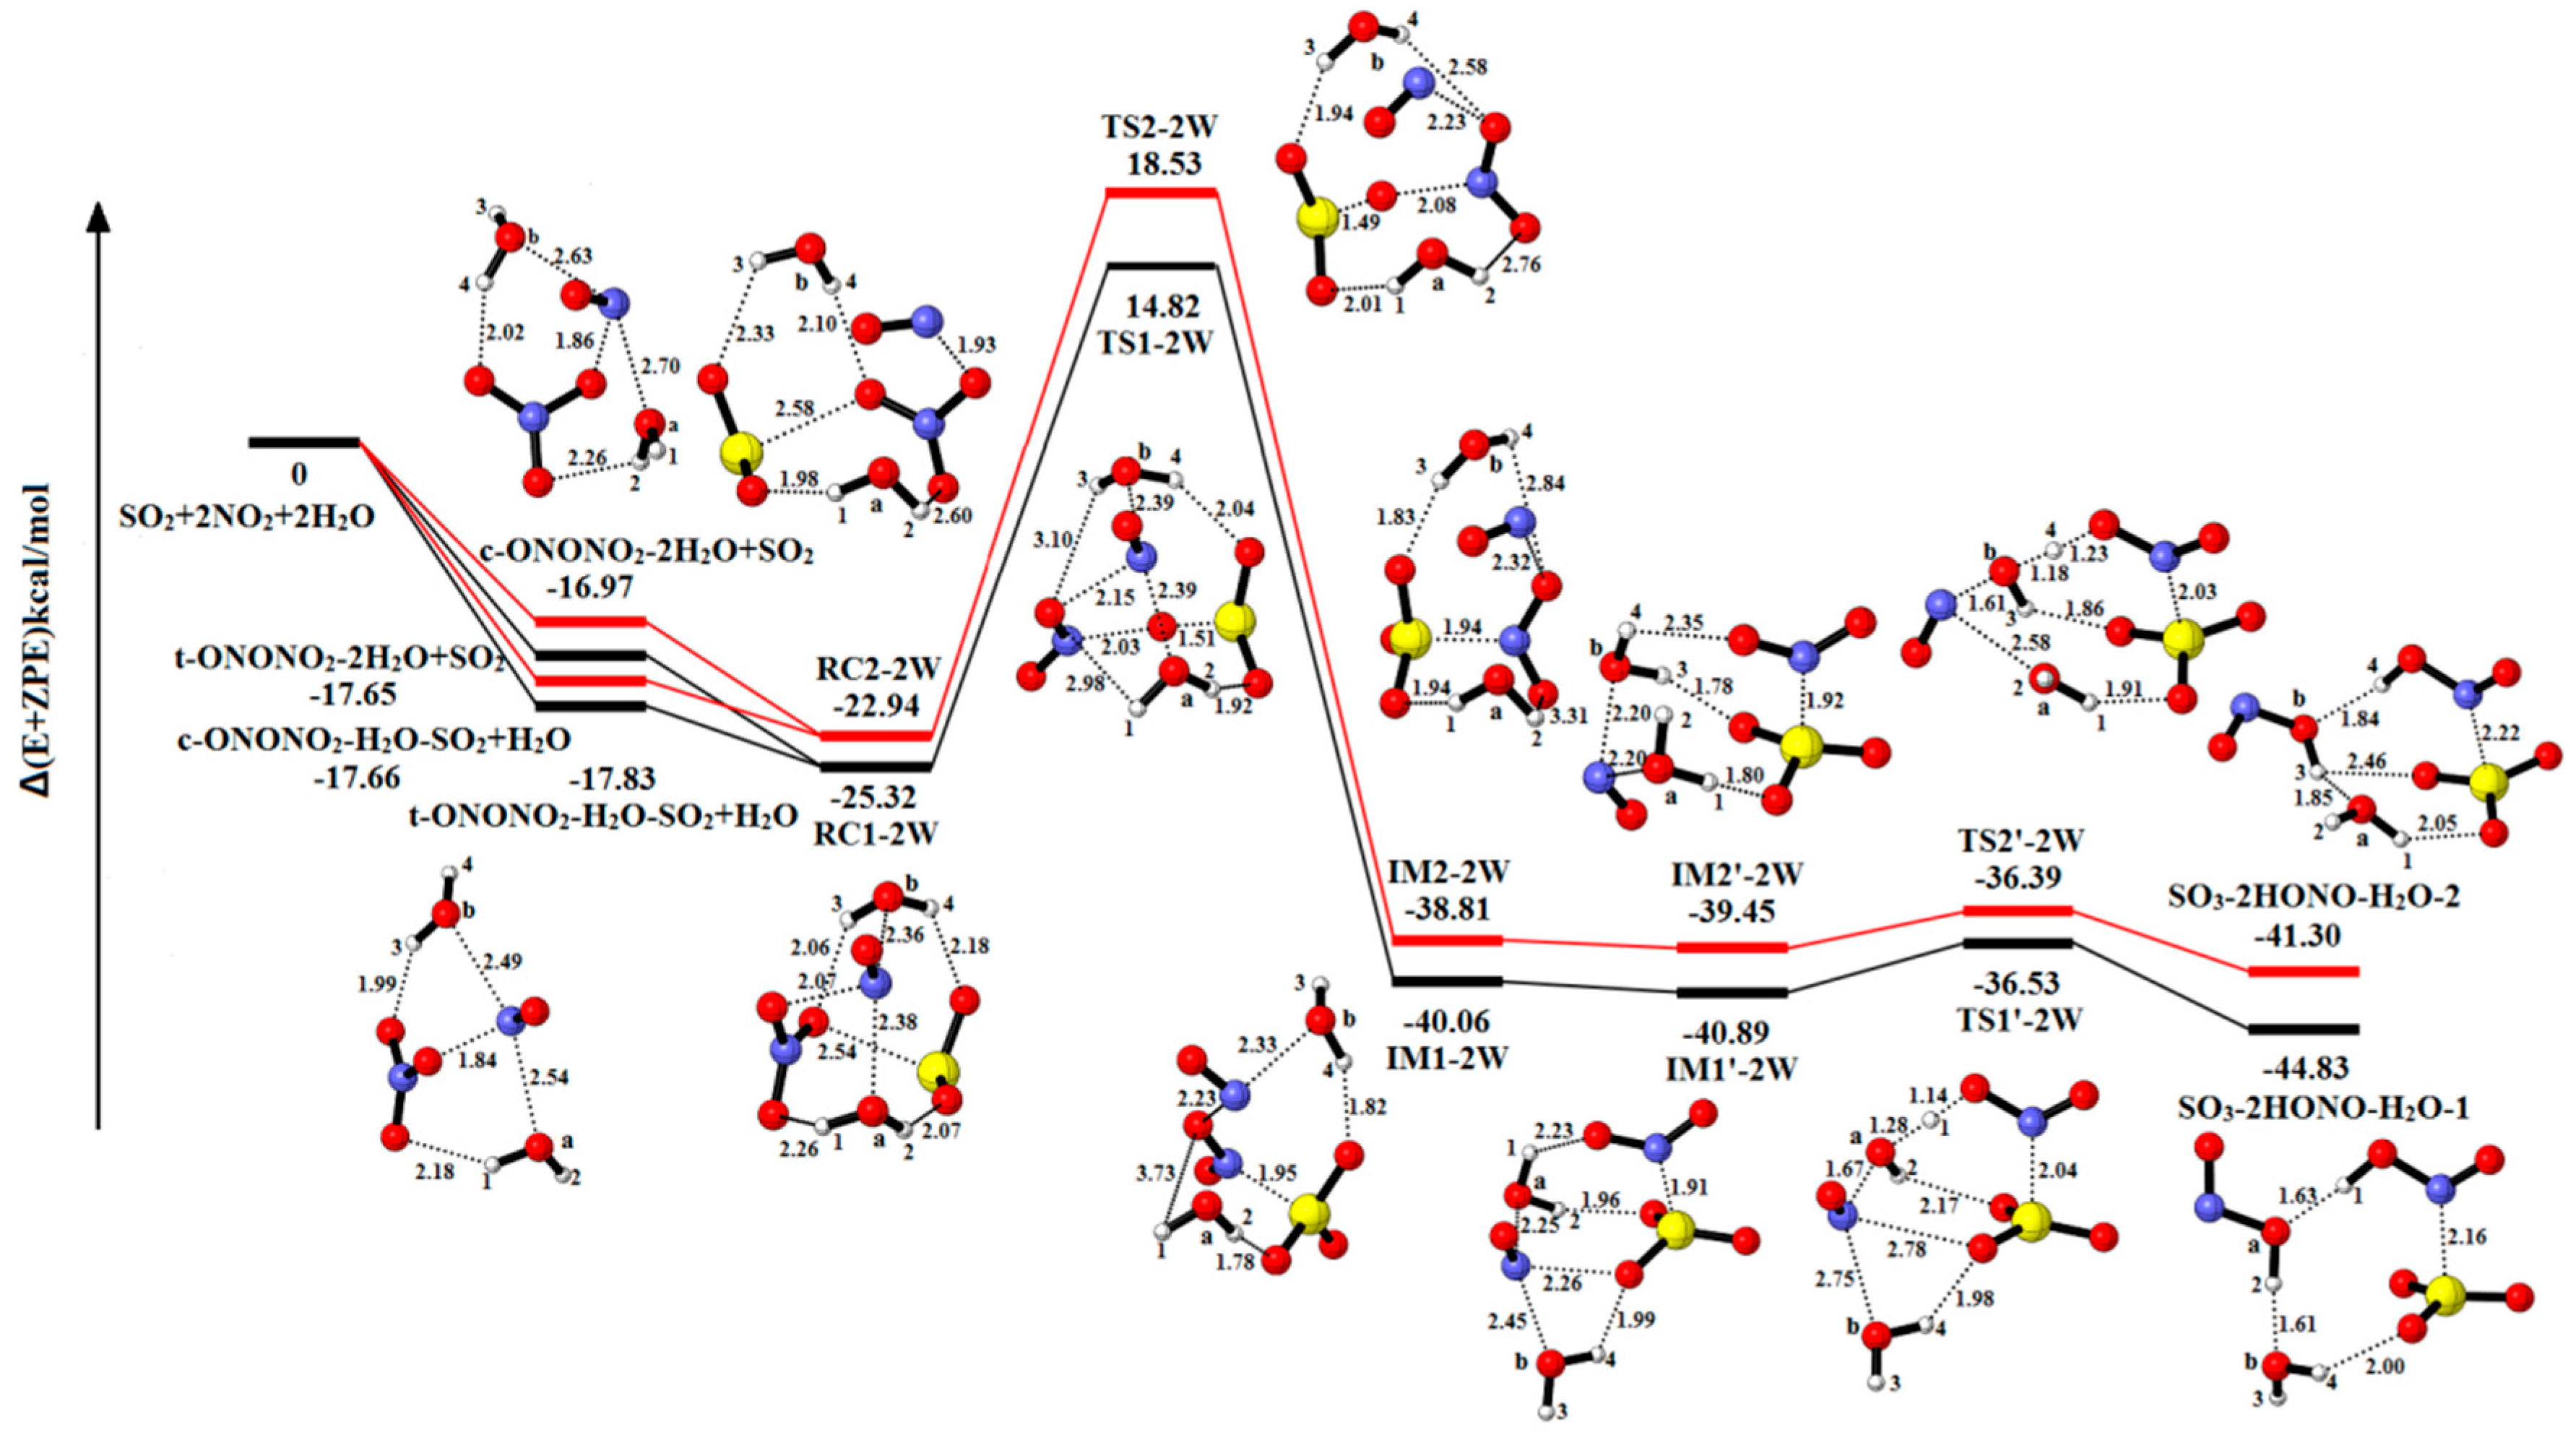
2.1.3. The Reaction of SO2-2NO2-2H2O

Figure 3 presents the optimized geometries of molecular species involved in the reaction of SO2-2NO2-2H2O to examine the role of an additional H2O molecule. Table 1 and Table 2 show the corresponding energy data and the charge distribution. Table S3 shows the relative energies, enthalpies and Gibbs free energies in all relevant species for the SO2-2NO2-2H2O. In these pathways, the pre-reactive complexes (RC1-2W and RC2-2W) are produced via the interaction between the complexes (t-ONONO2-2H2O and c-ONONO2-2H2O) and SO2, or a collision of the complexes (t-ONONO2-H2O-SO2 and c-ONONO2-H2O-SO2) with H2O.
Starting with the complex RC1-2W (−25.32 kcal/mol), the intermediate complex IM1-2W (−40.06 kcal/mol) is formed via TS1-2W with the energy barrier of 40.14 kcal/mol. The isomerized intermediate complex IM1′-2W (−40.89 kcal/mol) is formed by the H2O(a) closing to NO+NO2. The H2O(a) molecule reacts with NO+NO2 with an energy barrier and reaction energy of 4.36 kcal/mol and −3.94 kcal/mol, respectively. The other pathway is analogous with the above process, and the barrier (41.47 kcal/mol) is slightly higher than the reaction pathway involving in TS1-2W.
In the presence of two H2O molecules, the H2O(a) serves as reactant to form HONO, and the other H2O(b) acts as a solvent molecule in this reaction pathway to reduce energy barrier and stable complex structures. Compare with the one-water reaction in the first step, the energy barrier for TS1-2W is reduced by 1.66 kcal/mol. Moreover, the energy barrier of TS2-2W is decreased by 6.07 kcal/mol for TS2-1W. It shows that the second-water molecule plays a certain role in lowering the energy barrier and stabilizing the complexes structures.

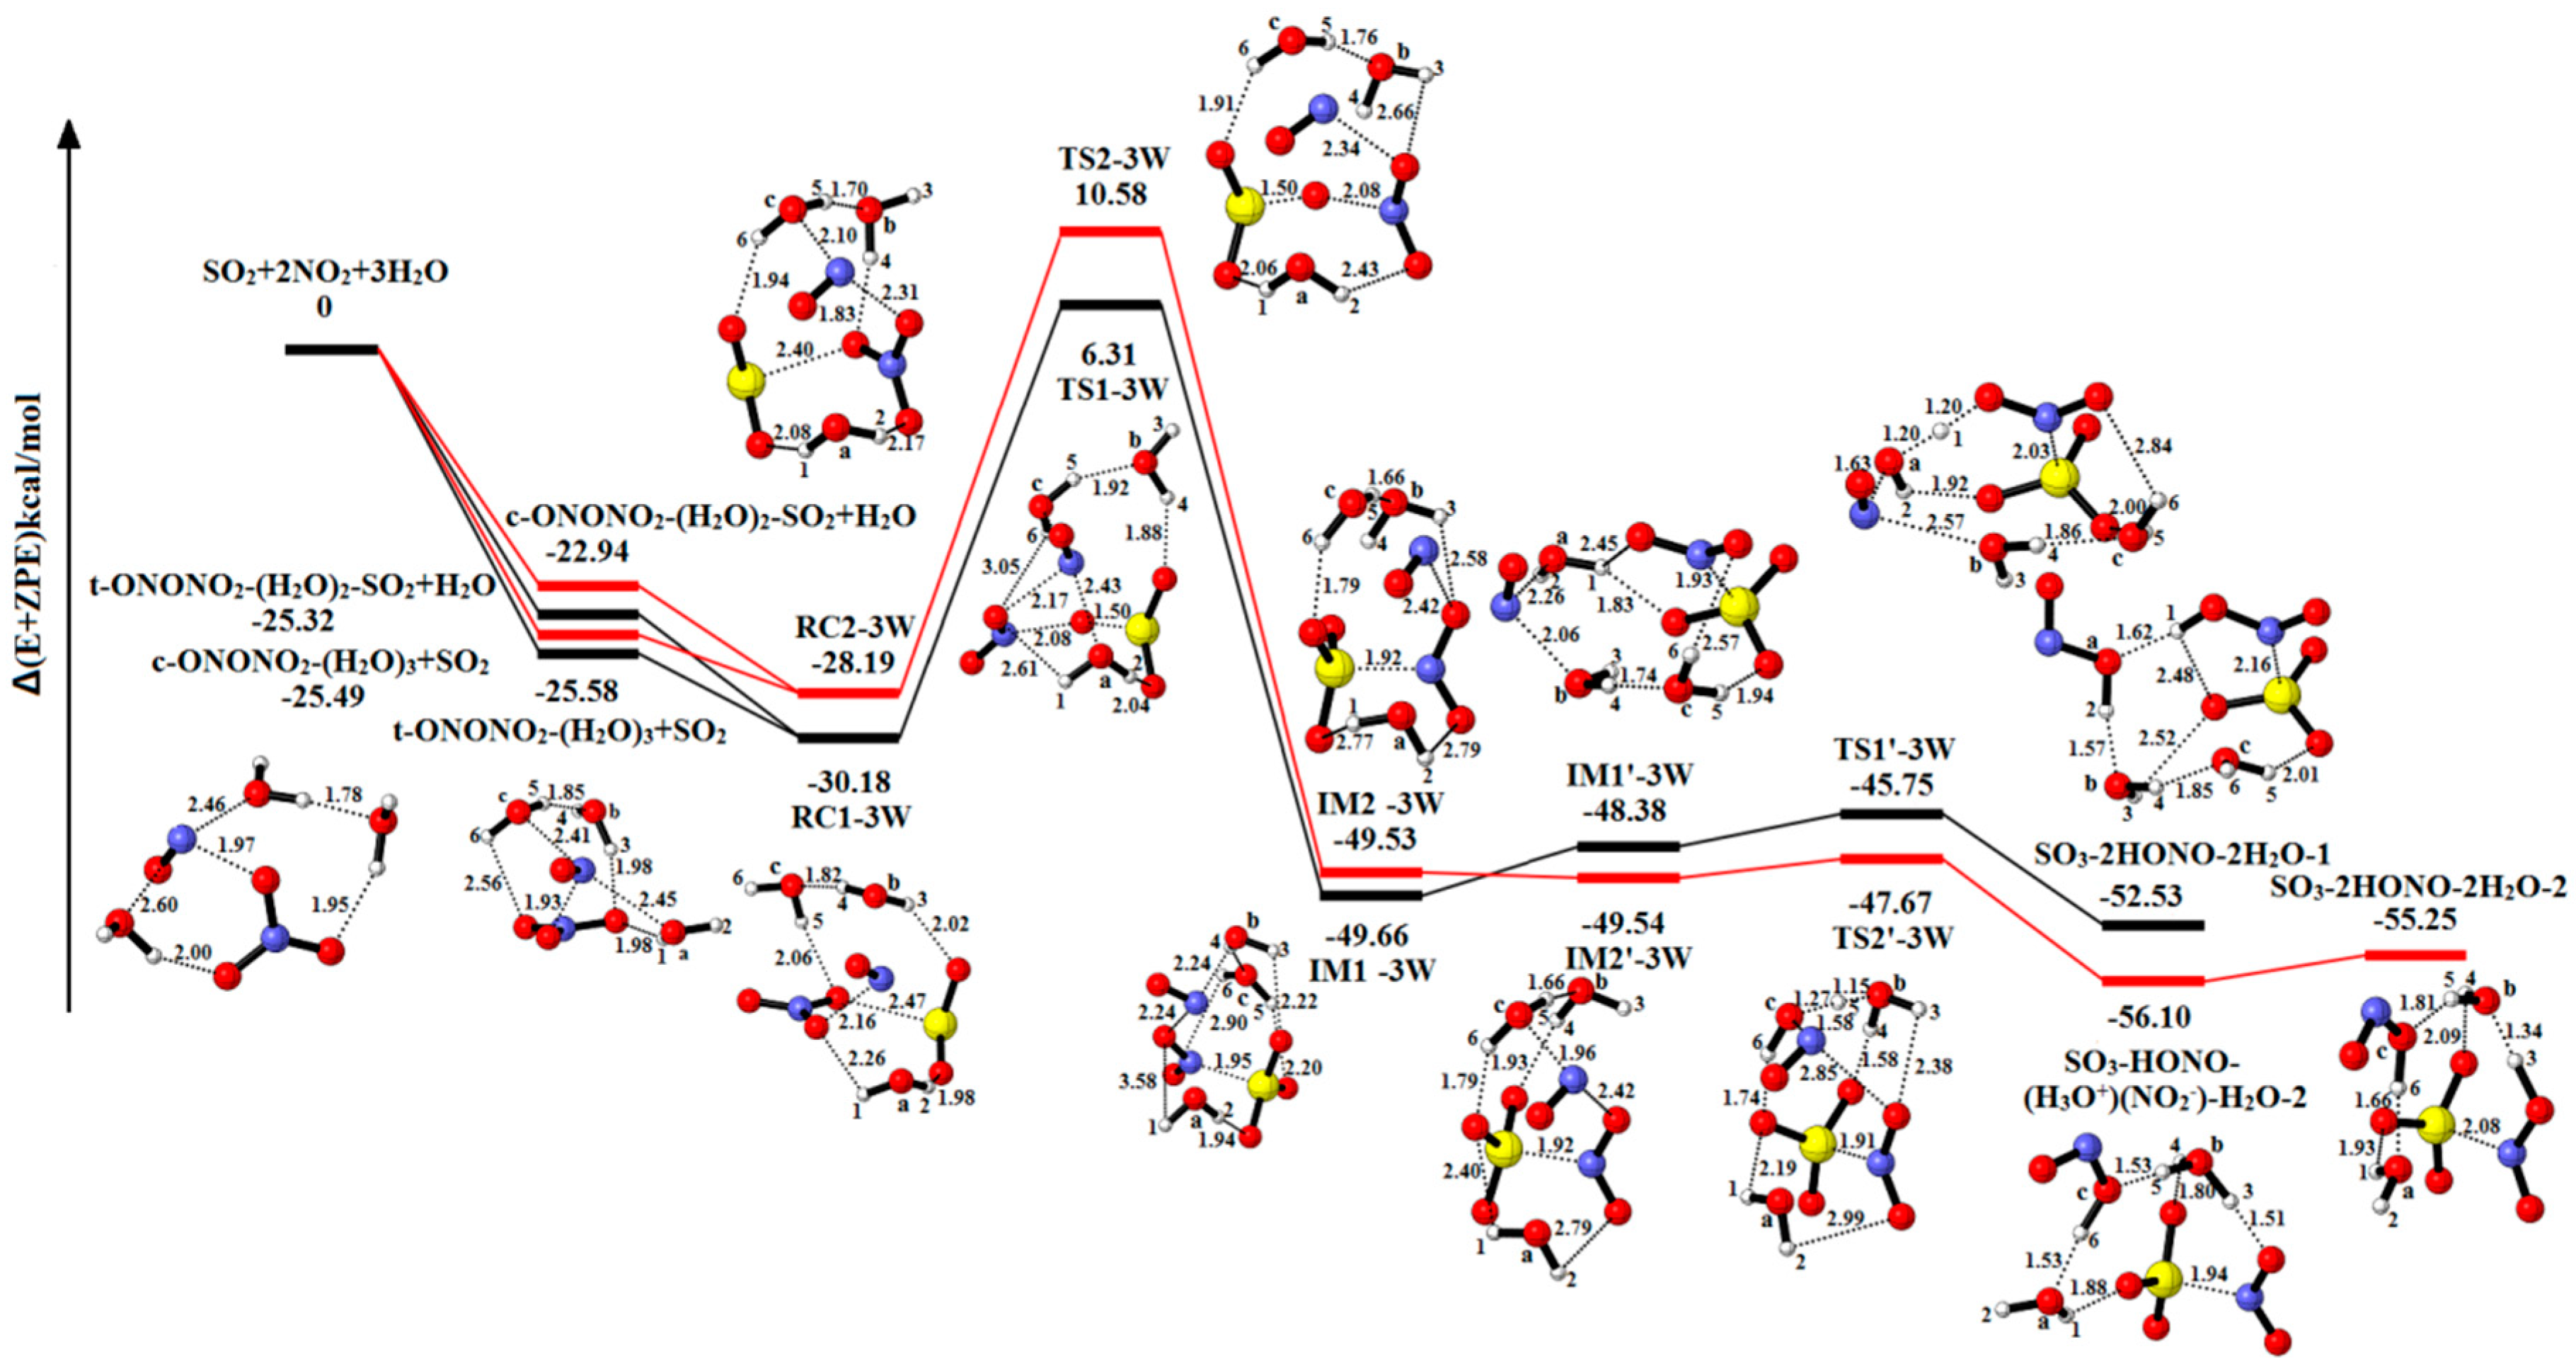
2.1.4. The Reaction of SO2-2NO2-3H2O

The consequence of three H2O molecules taking part in reaction is shown in Figure 4. The corresponding energy data and the charge distribution are put in Table 1 and Table 2. Table S4 summarizes the relative energies, enthalpies and Gibbs free energies in all relevant species for the SO2-2NO2-3H2O. The reactant complex RC1-3W (−30.18 kcal/mol) and RC2-3W (−28.19 kcal/mol) may be formed after SO2 attacks the tetramer complexes (t-ONONO2-(H2O)3 and c-ONONO2-(H2O)3), or H2O attacks t-ONONO2-(H2O)2-SO2 and t-ONONO2-(H2O)2-SO2, respectively. To form the IM1-3W from RC1-3W, there is an energy barrier of 36.49 kcal/mol at the transition state TS1-3W and reducing reaction energy of 19.48 kcal/mol. The reactant complex of hydrolysis reaction is IM1′-3W, and NO+NO2 is divided by the closing of H2O molecule. Through the TS1’-3W (−45.75 kcal/mol), a stable product complex SO3-2HONO-2H2O-1 (−52.53 kcal/mol) is produced eventually. The oxidation reaction of the other pathway is approximately similar to RC1-3W to IM1-3W. It is different from the above hydrolytic processes, and H2O(c) reacts as a transporter to transmit a proton forming H3O+ intermediate. The relevant energy barrier and reaction energy of the process are shown in Table 1. As shown in Table S4, the reaction SO2-2NO2-3H2O→SO3-2HONO-2H2O-1 is exothermic and spontaneous.
In comparison to one-water molecules in the process of SO2 oxidation, three H2O molecules have successfully reduced the energy barrier height by 5.35 kcal/mol and 8.77 kcal/mol. In these two pathways, the two additional H2O molecules act only as a solvent without entering into the reaction. It shows that the third-water molecule plays a significant role in stabilizing the complexes and lowering the energy barrier. As the number of H2O increases, the releasing energy gets more and more, and the configurations of product complexes are more and more stable. The hydrolysis reaction is still favorable thermodynamically with the number of H2O molecule increasing.

2.2. The Reaction of SO2-2NO2-nH2O-mNH3 (n = 0, 1, 2; m = 1, 2)

2.2.1. The Reaction of SO2-2NO2-NH3

Figure 5 explores the equilibrium structures and potential energy of the system 2NO2-SO2-NH3. Table S5 summarizes the relative energies, enthalpies and Gibbs free energies in all relevant species. The corresponding thermodynamic data and the charge distribution are put in Table 1 and Table 2. Reactant complexes (RC1-1A and RC2-1A) are formed through the collision between complexes (t-ONONO2-NH3 and c-ONONO2-NH3) and SO2, which is equivalent to replacing one H2O molecule from RC1-1W and RC2-1W with NH3. RC1-1A (−15.12 kcal/mol) is converted into IM1-1A (−35.22 kcal/mol) via the transformation of an O molecule with the energy barrier and reaction energy of 40.60 kcal/mol and −20.10 kcal/mol, respectively. The other pathway is similar to the above pathway with the energy barrier and reaction energy of 48.85 kcal/mol and −13.76 kcal/mol, respectively. The hydrolytic process cannot occur because of the absence of H2O molecule. As we can see in Table S5, the reaction SO2-2NO2-NH3→IM1-1A is exothermic and spontaneous (ΔH = −37.16 kcal/mol and ΔG = −3.12 kcal/mol).
Compared with the reaction pathway of SO2-2NO2 to IM1 and IM2, the result indicates that NH3 molecule can serve as catalyst and solvent to reduce the energy barrier and stable structures. The NH3 molecule cannot trigger the hydrolysis reaction to produce HONO.

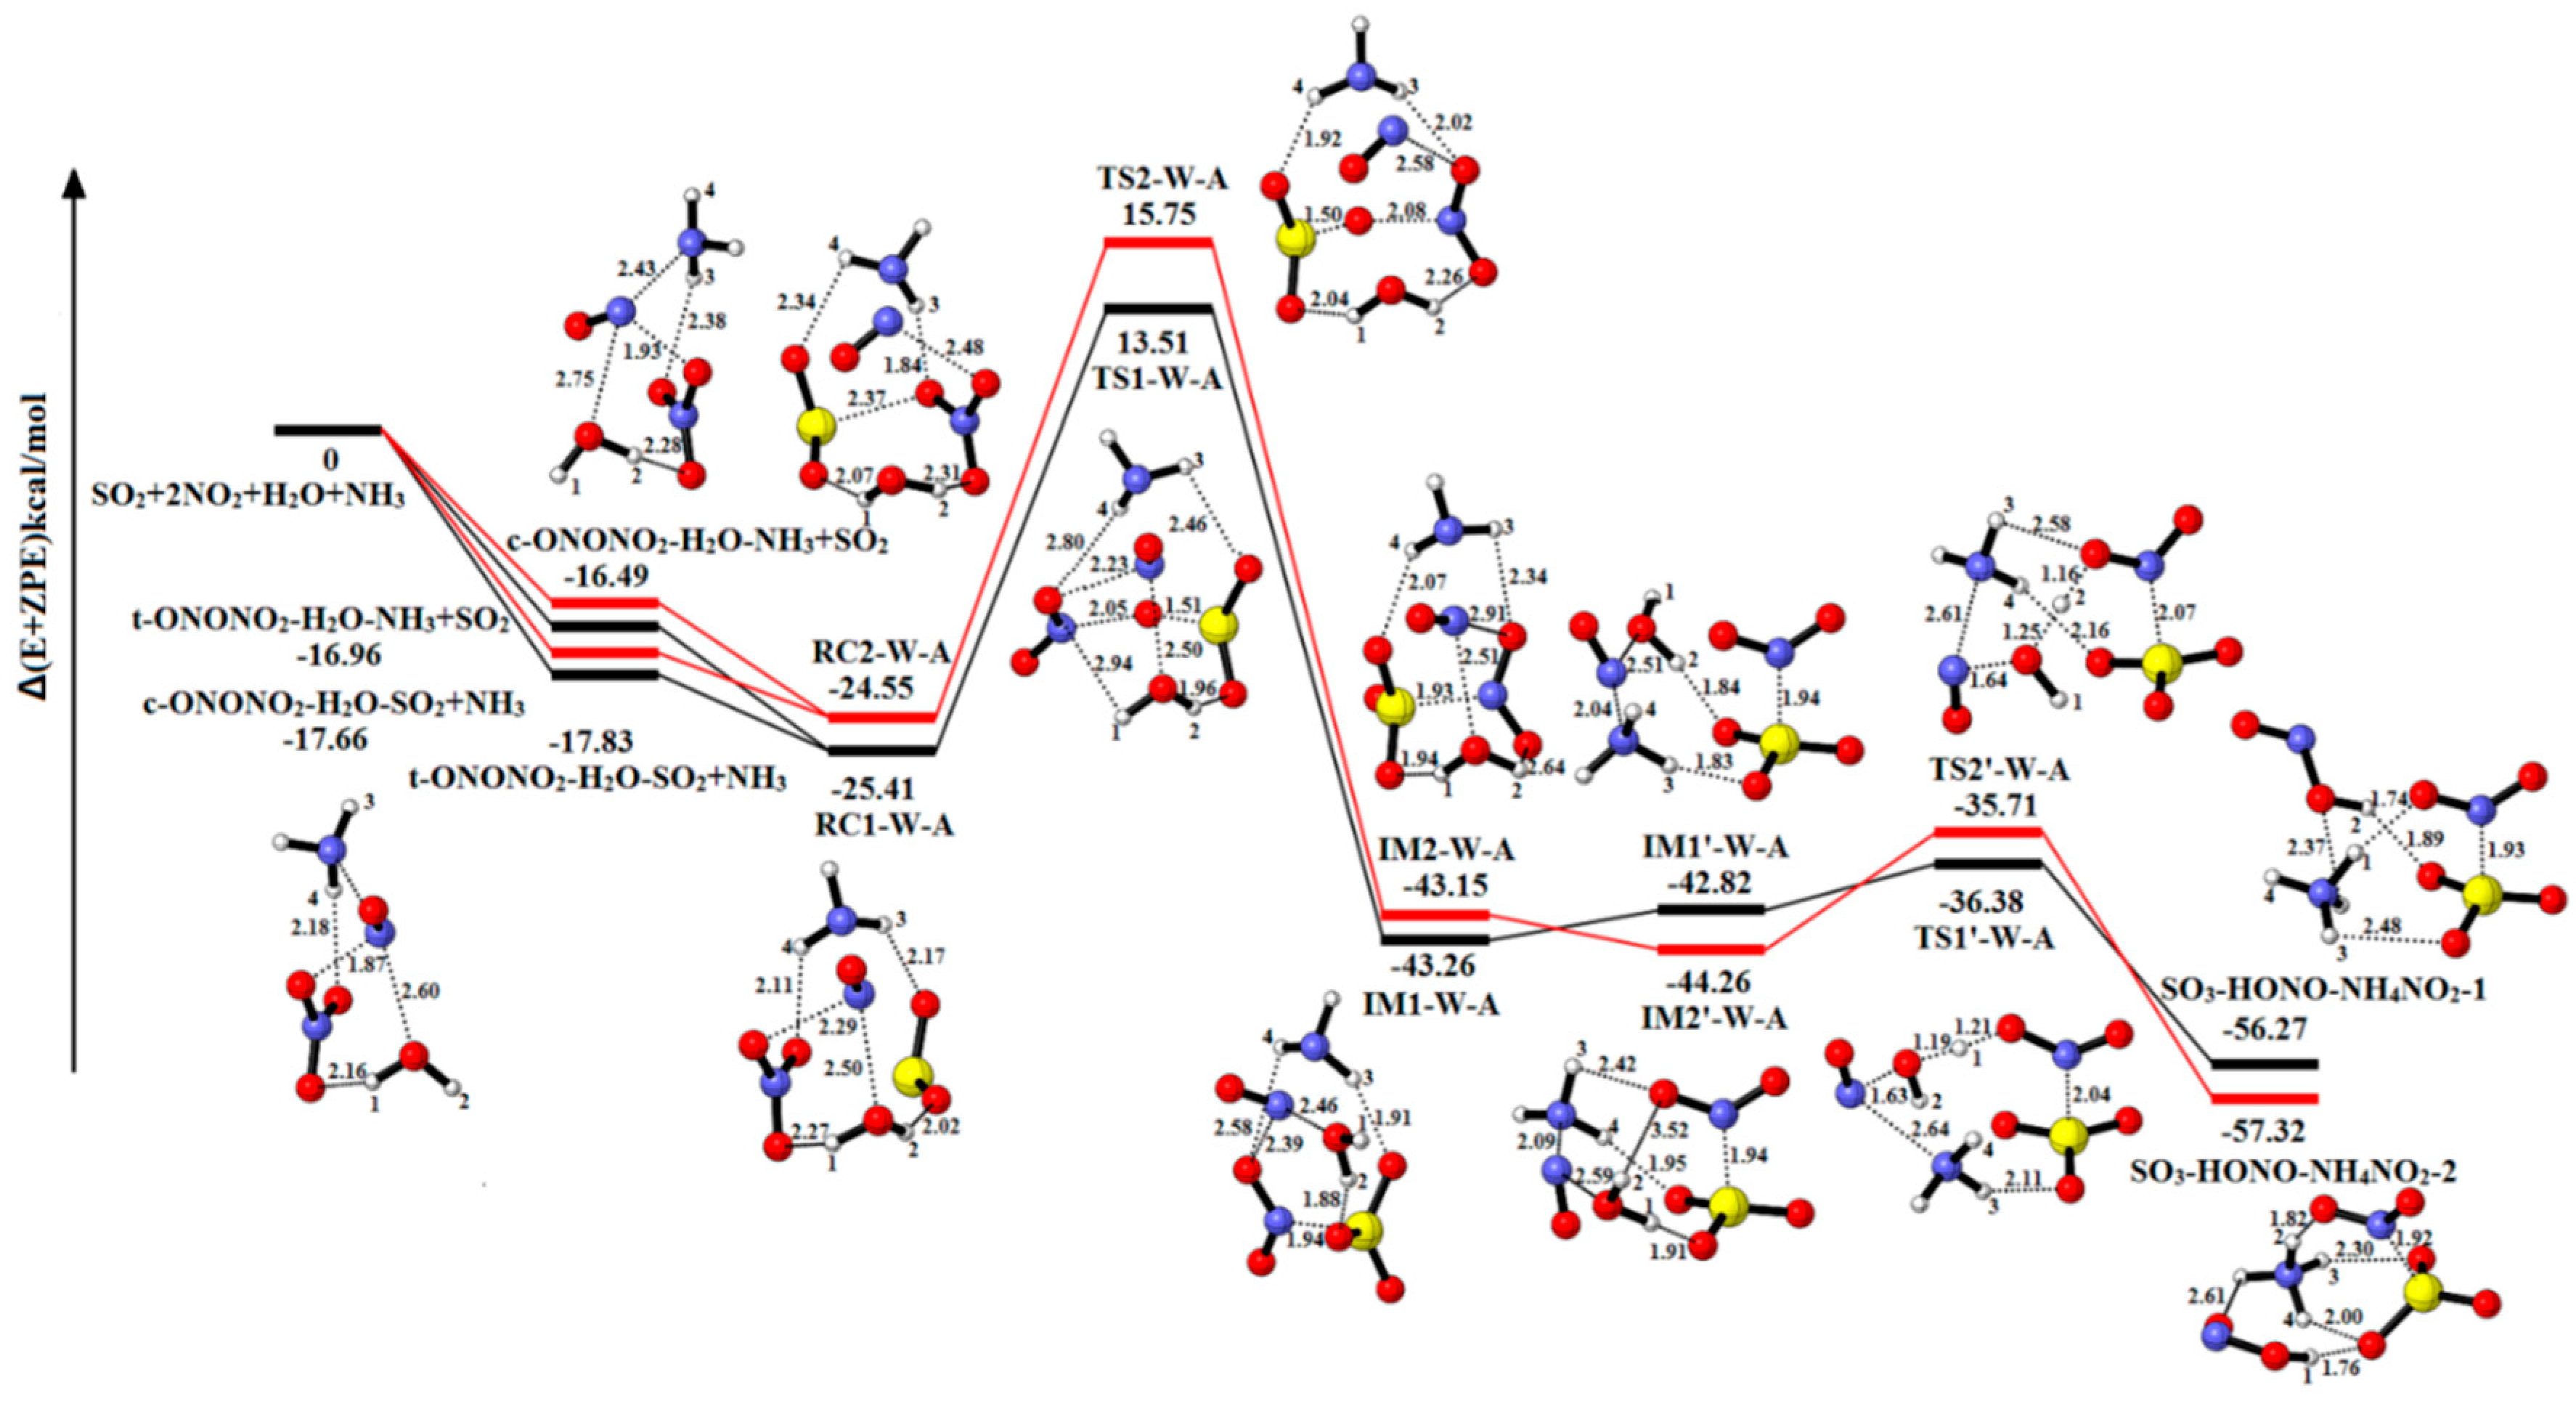
2.2.2. The Reaction of SO2-2NO2-H2O-NH3

The relative energies, enthalpies and Gibbs free energies in all relevant species for SO2-2NO2-H2O-NH3 are summarized in Table S6. As shown in Figure 6, RC1-1W-1A and RC2-1W-1A are formed after SO2 attacks the complex t/c-ONONO2-H2O-NH3 or NH3 attacks t/c-ONONO2-H2O-SO2. The product complex IM1-W-A (−43.26 kcal/mol) is formed through TS1-W-A (13.51 kcal/mol) with the energy barrier and reaction energy of 38.92 kcal/mol and −17.85 kcal/mol, respectively. When the only water molecule gets close to the NO+NO2, the reactant complex (IM1′-W-A) of hydrolysis reaction is formed through separating the two parts, NO+ and NO2. The IM1′-W-A releases the reaction energy of 13.45 kcal/mol to form the product complex SO3-HONO-NH4NO2-1 (−56.27 kcal/mol) via TS1’-W-A with the energy barrier of 6.44 kcal/mol. The NH3 molecule and the H2O molecule not only serve as catalyst and stabilizer, but also act as reactants to produce HONO and NH4NO2. It is different from the pathway of two H2O molecules, because the NH3 is more protophilia than water and the HONO is liable to provide a proton to form NH4NO2. The other pathway is analogous with RC1-W-A to SO3-HONO-NH4NO2-1. The energy barrier and energy reaction are 40.30 kcal/mol and −18.60 kcal/mol in oxidation reaction and 8.55 kcal/mol and −13.06 kcal/mol in hydrolysis reaction, respectively.
Compared with the one-water reaction, the energy barrier for the SO2-oxidation reaction is reduced by 2.92 kcal/mol and 7.24 kcal/mol, respectively. Compared with the two-water reaction, it shows that the NH3 molecule plays a more important role in stabilizing the complexes and lowering the energy barrier. When ammonia (NH3) is present in hydrolysis reaction, the product complexes form ammonium nitrite (NH4NO2). The most important reason is that the ability of NH3 to acquire the proton is stronger than water.

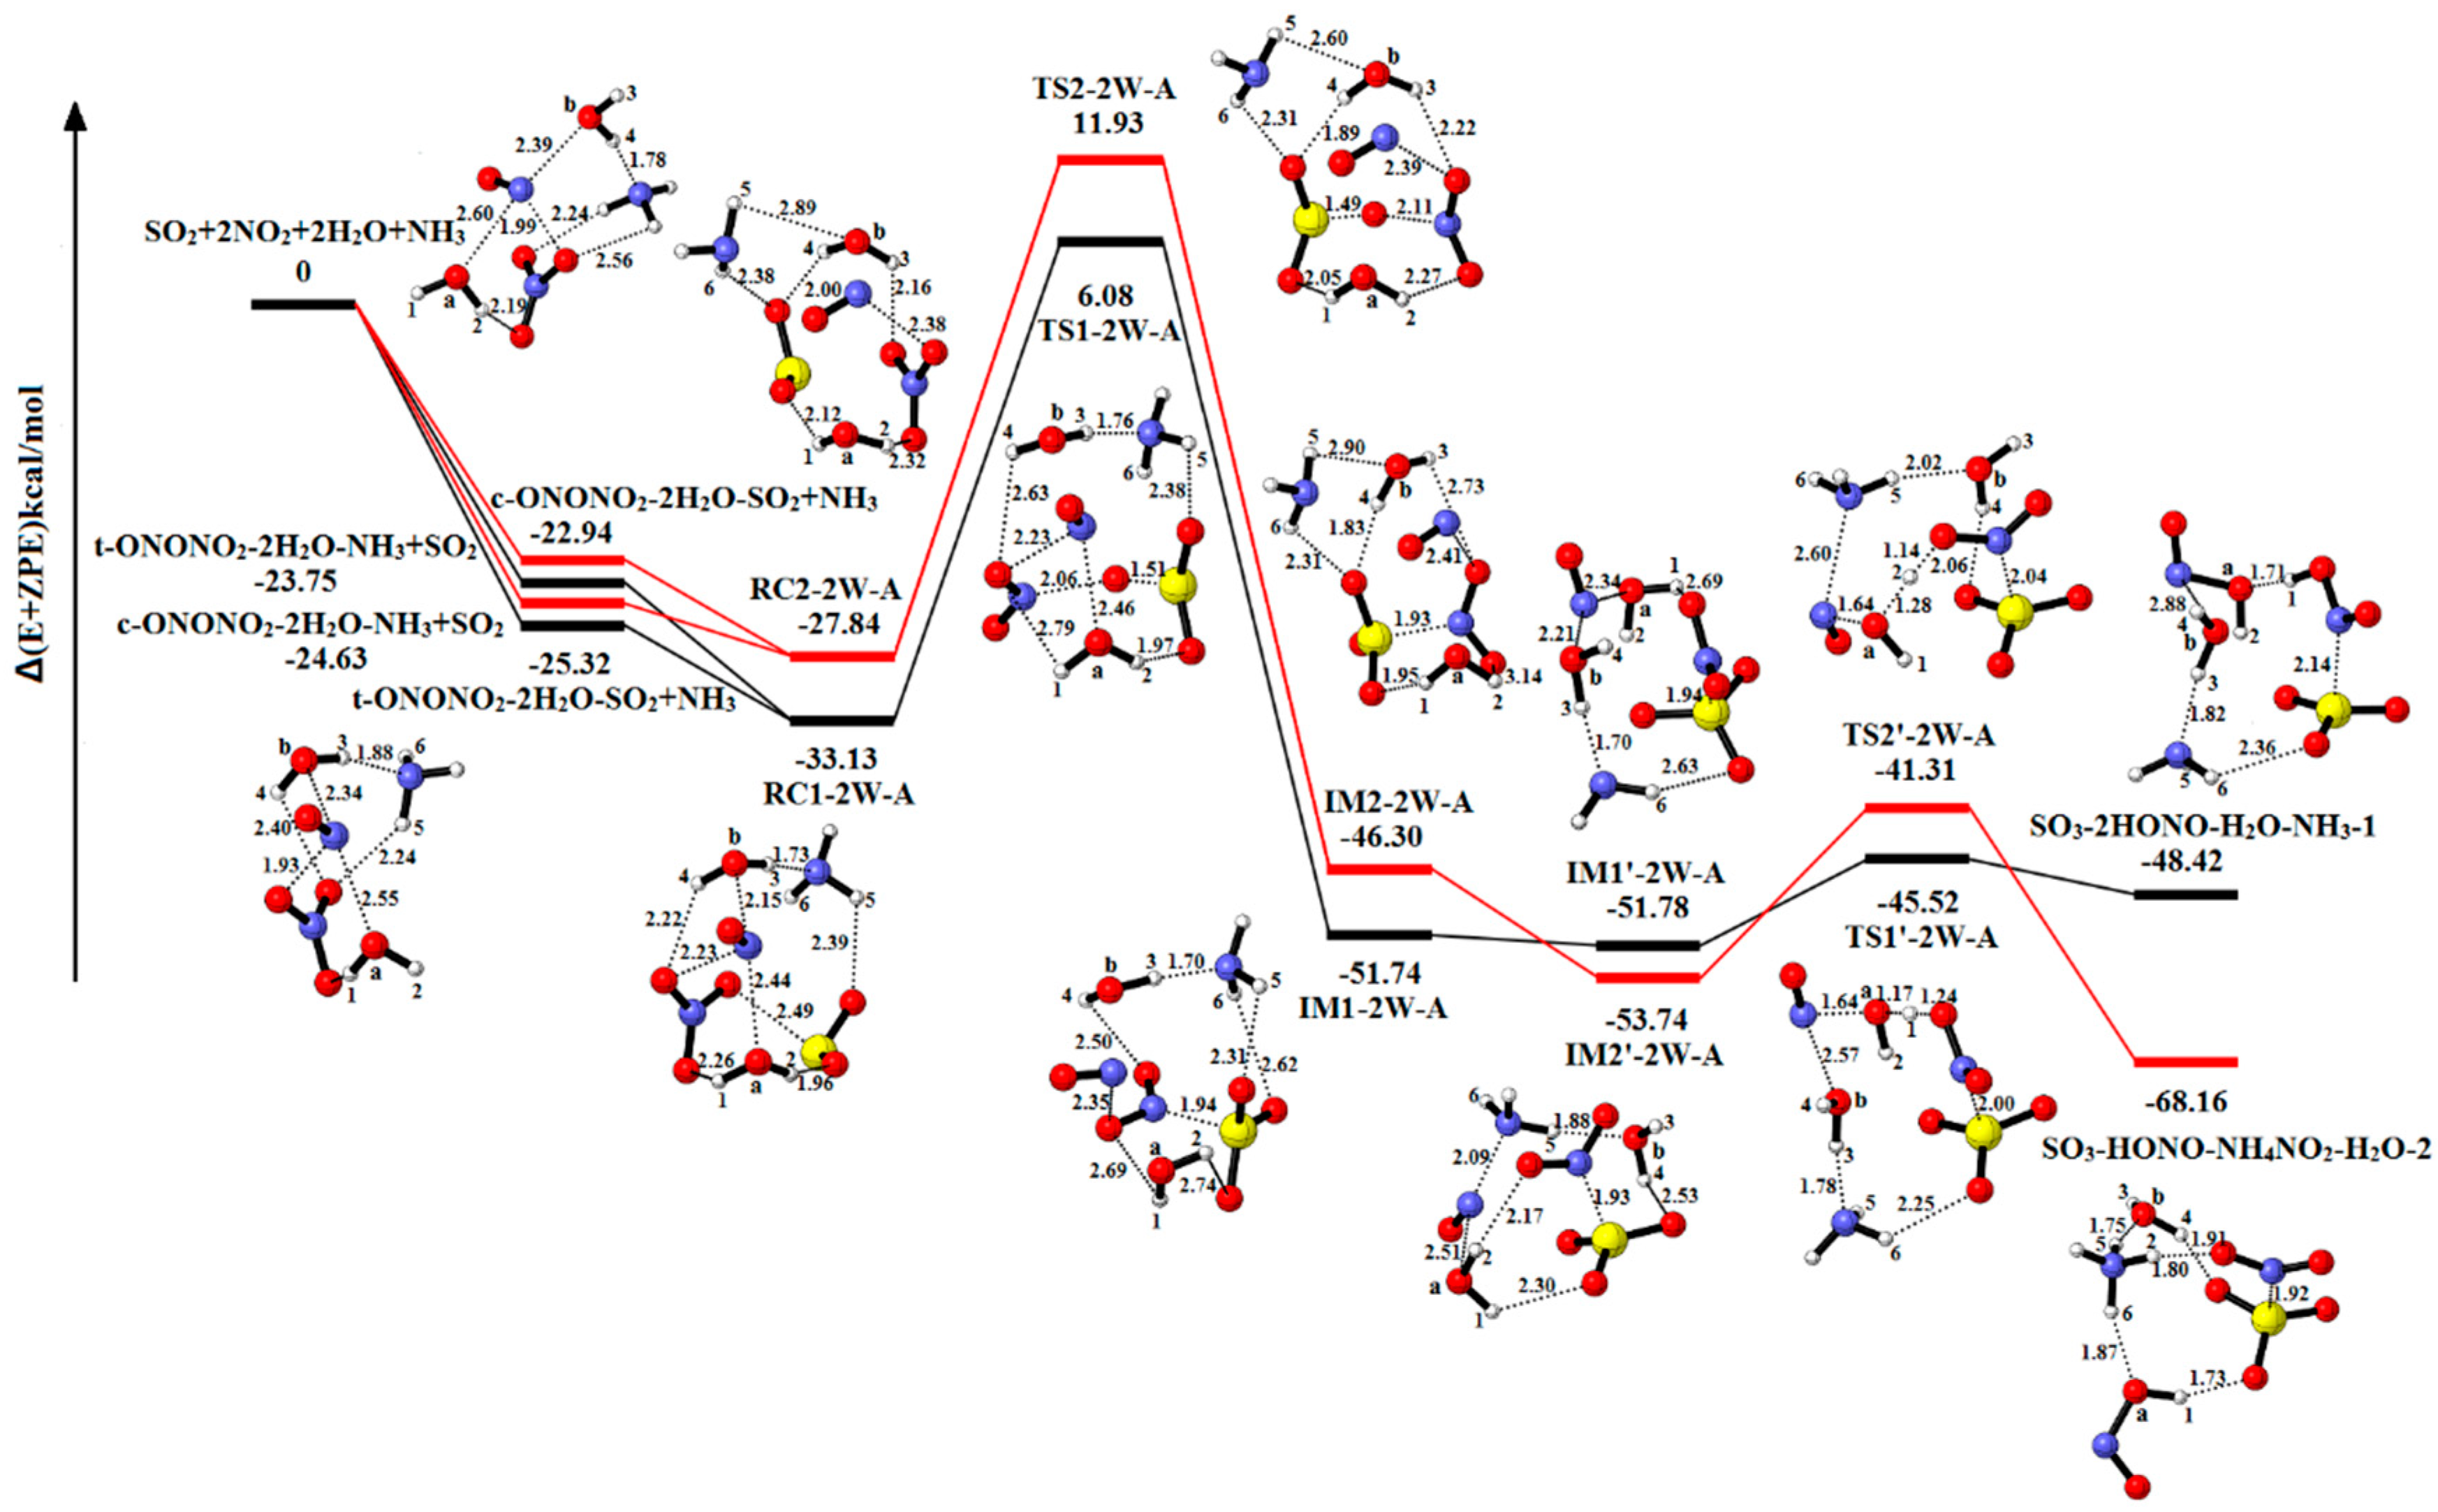
2.2.3. The Reaction of SO2-2NO2-2H2O-NH3

The structure of reactant complex RC1-2W-A and RC2-2W-A is formed by replacing one H2O molecule from RC1-3W and RC2-3W with NH3 in Figure 7. IM1-2W-A (−51.74 kcal/mol) is formed via TS1-2W-A (6.08 kcal/mol), in which the energy barrier and energy reaction are 39.21 kcal/mol and −18.61 kcal/mol, respectively. IM1′-2W-A (−51.78 kcal/mol) is formed by the migration process of H2O(a) molecule. The IM1′-2W-A is converted into the product complex SO3-2HONO-H2O-NH3-1 (−48.42 kcal/mol) via the transition state TS1’-2W-A (−45.52 kcal/mol). The corresponding reaction energy and energy barrier are 3.36 kcal/mol and 6.26 kcal/mol, respectively. On account of the similarity to the above pathway, we will not describe the details about the other pathway. The energy barrier and reaction energy are shown in the Table 1. As shown in Table S7, the reaction SO2-2NO2-2H2O-NH3→SO3-2HONO-H2O-NH3-2 is exothermic and spontaneous.
In presence of one NH3 molecule, the NH3 molecule and two H2O molecules serve as solvent to reduce energy barrier and stable structures, and the one H2O molecule and the NH3 molecule serve as reactant to produce HONO and NH4NO2.

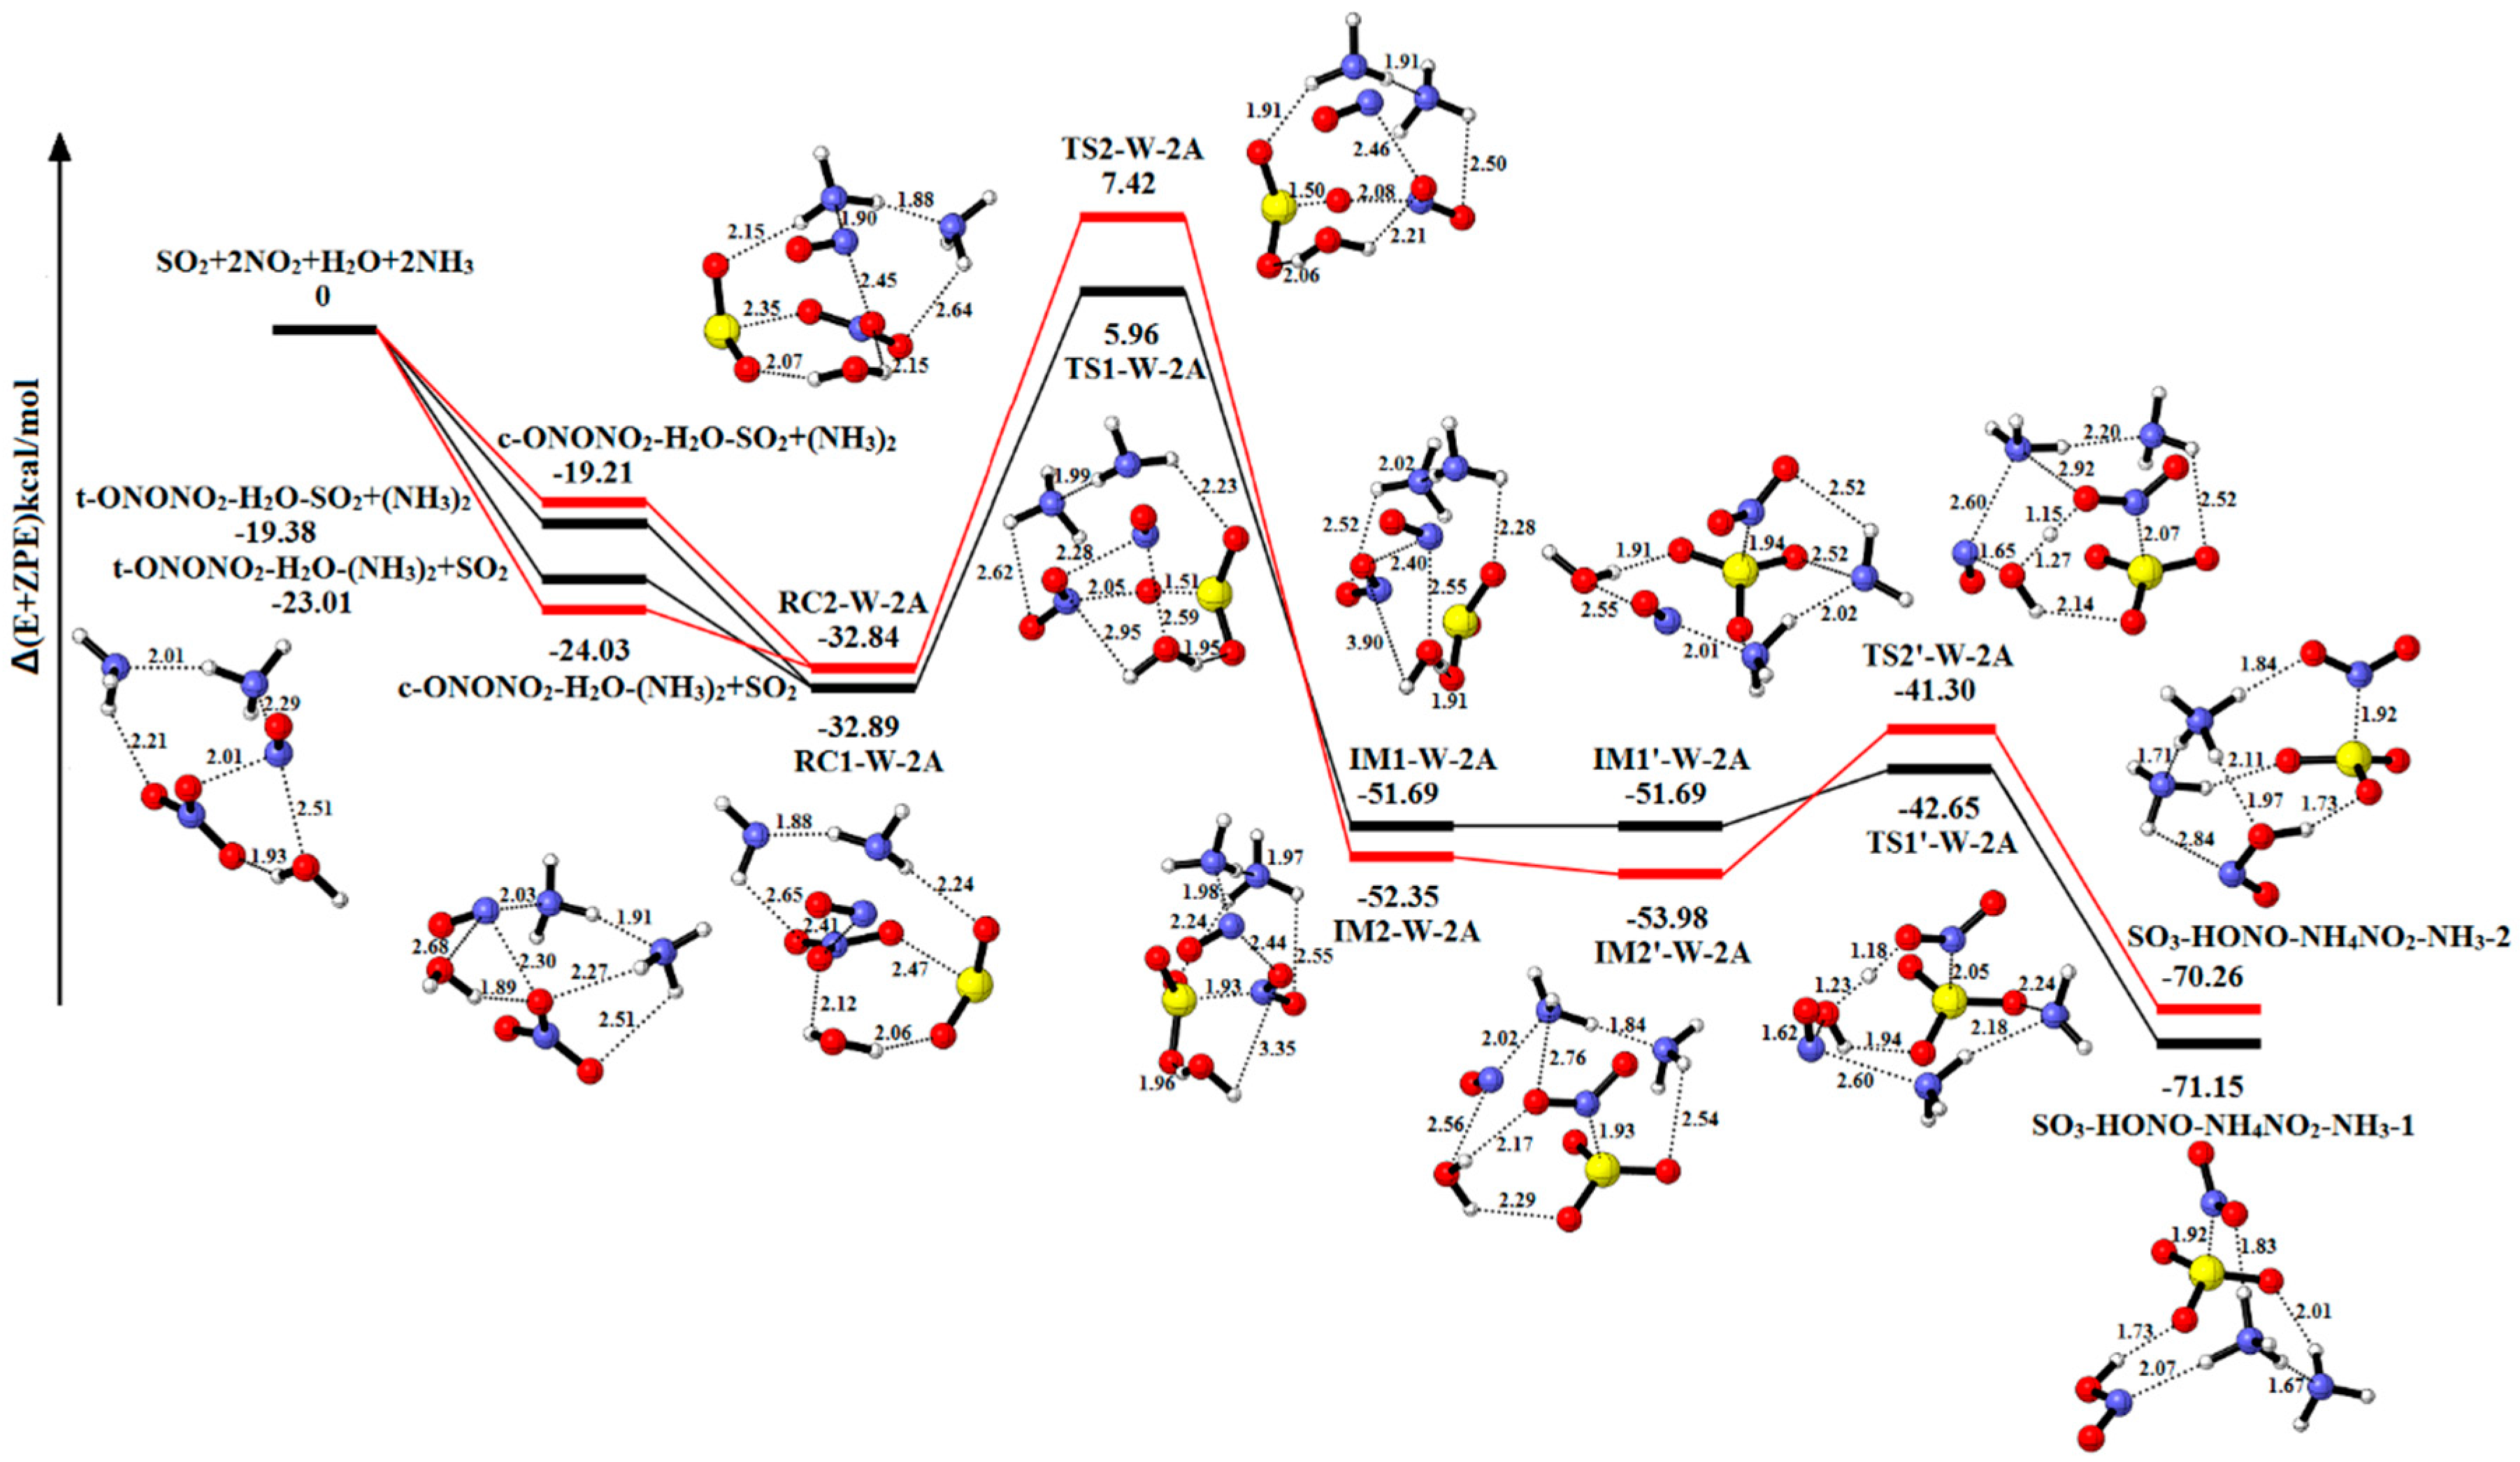
2.2.4. The Reaction of SO2-2NO2-H2O-2NH3

Figure 8 explores the equilibrium structures and potential energy of SO2-2NO2-H2O-2NH3. Table S8 summarizes the relative energies, enthalpies and Gibbs free energies in all relevant species. Similar to the previous reactions, the reactant complexes (RC1-W-2A and RC2-W-2A) are formed through combining NH3-NH3 and t/c-ONONO2-H2O-SO2 or SO2 and t/c-ONONO2-H2O-(NH3)2, which equals replacing two H2O molecules from RC1-3W or RC2-3W with two NH3 molecules. Starting with the reactant complex RC1-W-2A, the reaction occurs through the transition state TS1-W-2A forming the product complex IM1-W-2A. The process requires an energy barrier of 38.85 kcal/ and reaction energy of −18.80 kcal/mol, respectively. The IM1′-W-2A, with a binding energy of 51.69 kcal/mol, can serve as the reactant complex in the next step. The SO3-HONO-NH4NO2-NH3-1 (−71.15 kcal/mol) is resulted from IM1′-W-2A by the only H2O molecule reacting between the NO and NO2, along with energy barrier and energy reaction of 9.04 kcal/mol and −19.46 kcal/mol, respectively. As shown in Figure 8, the other pathway is similar to the reaction of RC1-W-2A to SO3-HONO-NH4NO2-NH3-1. There are energy barrier and reaction energy of 40.26 kcal/mol and −19.51 kcal/mol in oxidation reaction, respectively. In the hydrolysis process, the energy barrier and reaction energy are 12.68 kcal/mol and −16.28 kcal/mol, respectively. Table S8 indicates that both reaction pathways SO2-2NO2-H2O-2NH3→SO3-HONO-NH4NO2-1 and SO3-HONO-NH4NO2-2 are exothermic and spontaneous.
In presence of two NH3 molecules, two NH3 molecules and the only H2O molecule serve as catalyst and stabilizer, and the one NH3 molecule and H2O molecule serve as reactant to produce NH4NO2.
Compared with the three-water reaction, the proportion of H2O and NH3 molecules is 2:1 and 1:2. The result indicates that the energy barrier is slighting different from the three-water molecule in the SO2-oxidation reaction. In the hydrolytic reaction, the energy barrier is higher than the three-water molecule, and these processes release more reaction energy. Moreover, the binding energy of product complexes is lower than that of the SO3-2HONO-2H2O. This result shows that the NH3 molecule plays a significant role in stabilizing complexes.

3. Materials and Methods

All quantum chemistry calculations are performed by Gaussian 09 programs (vB.01, Gaussian, Inc, Wallingford, CT, USA) [36]. The structures of the reactant (RC), product (PC), intermediate (IM), and transition states (TS) are optimized using M06-2X density functional method with the 6-311++G (d, p) basis set [37]. This is relatively accurate and time-efficient when used to study the reaction mechanism and has been employed successfully in our previous studies [38,39]. The vibrational frequencies have been obtained to verify that the reactant complexes, intermediates, and product complexes have all positive frequencies and that the transition state (TS) geometries have only one imaginary frequency at the same level. According to the calculation of vibrational frequencies, zero-point energy (ZPE) and thermal correction are also obtained at the same level to decide their characteristics and thermodynamic properties. All the enthalpies (H) and Gibbs free energies (G) are calculated with thermal correction at 298.15 K. Moreover, the intrinsic reaction coordinate (IRC) calculation is used to verify whether each transition state is connected with the corresponding intermediates [40]. The single-point energies of all stationary points are refined using the more precise basis set for M06-2X/6-311++G (3df, 3pd) [41]. The ultrafine integration grid is applied to improving the accuracy during the whole gas-phase calculation. We also calculated electrostatic potential (ESP) to analyze charge distribution for NO+NO3 and NO+NO2 fragments of RC and IM with the same basis [42,43]. The geometries are visualized using the CYL view software package (v1.0b, Université de Sherbrooke, Montreal, QC, Canada) [44].

4. Conclusions

In this paper, the reaction mechanism of SO2 with NO2 to form SO3 in the presence of H2O and NH3 is investigated. Table S9 represents that Cartesian coordinates for all relative Optimized geometries (reactants, transient states and products) at M06-2X/6-311++G(d,p), x coordinate, y coordinate and z coordinate. The effects of different amounts of H2O and NH3 have been studied in detail. The results indicate that HONO cannot be formed in the absence of H2O molecules. In the oxidation step of the system SO2-2NO2-nH2O (n = 0, 1, 2, 3), H2O plays a catalytic role to produce SO3, which reduces the energy barrier. In the hydrolytic step, the energy barrier of two H2O molecules is larger than that of one or three H2O molecules. But it is still thermodynamically favorable. When NH3 is involved in the reaction, the energy barrier is lower than SO2-2NO2 in the oxidation step. For SO2-2NO2-2H2O, when the ratio of NH3 to H2O is 1:1, the energy barrier changes more greatly than SO2-2NO2-2H2O. For SO2-2NO2-3H2O, when the ratio of NH3 to H2O is 1:2 and 2:1, the change of the energy barrier is not obvious. Compared to pure water reactions, the role of NH3 in stabilizing product complexes and acquiring protons is more effective than H2O. This research provides a new insight into reaction pathways of sulfuric acid formation, and can also contribute to the further study of aerosol surface reactions.

Supplementary Materials

The following are available online at https://www.mdpi.com/1422-0067/20/15/3746/s1.

Author Contributions

Conceptualization, Z.W., C.Z., G.L., and X.S.; methodology, Z.W., G.L., X.S., and N.W.; writing—original draft, Z.W.; writing—review and editing, C.Z., G.L., X.S., and Z.L.

Funding

This research was funded by National Natural Science Foundation of China, grant number 21337001 and 21607011; Natural Science Foundation of Shandong Province, grant number ZR2018MB043; the Fundamental Research Fund of Shandong University, grant number 2018JC027; and Focus on research and development plan in Shandong province, grant number 2019GSF109037.

Conflicts of Interest

The authors declare no conflicts of interest.

Abbreviations

PMParticulate Matter
DFTDensity Functional Theory
RCReactant complex
IMIntermediate
PCProduct
TSTransient state
IRCIntrinsic reaction coordinate
ESPElectrostatic potential

References

  1. You, C.F.; Xu, X.C. Coal combustion and its pollution control in China. Energy 2010, 35, 4467–4472. [Google Scholar] [CrossRef]
  2. Hewitt, C.N. The atmospheric chemistry of sulphur and nitrogen in power station plumes. Atmos. Environ. 2001, 35, 1155–1170. [Google Scholar] [CrossRef]
  3. Rosas, J.M.; Ruiz-Rosas, R.; Rodríguez-Mirasol, J.; Cordero, T. Kinetic study of SO2 removal over lignin-based activated carbon. Chem. Eng. J. 2017, 307, 707–721. [Google Scholar] [CrossRef]
  4. Baltrusaitis, J.; Jayaweera, P.M.; Grassian, V.H. Sulfur Dioxide Adsorption on TiO2 Nanoparticles: Influence of Particle Size, Coadsorbates, Sample Pretreatment, and Light on Surface Speciation and Surface Coverage. J. Phys. Chem. C 2011, 115, 492–500. [Google Scholar] [CrossRef]
  5. Kroll, J.A.; Frandsen, B.N.; Kjaergaard, H.G.; Vaida, V. Atmospheric Hydroxyl Radical Source: Reaction of Triplet SO2 and Water. J. Phys. Chem. A 2018, 122, 4465–4469. [Google Scholar] [CrossRef] [PubMed]
  6. Wang, H.; You, C. Photocatalytic removal of low concentration SO2 by titanium dioxide. Chem. Eng. J. 2016, 292, 199–206. [Google Scholar] [CrossRef]
  7. Zhang, R.; Wang, G.; Guo, S.; Zamora, M.L.; Ying, Q.; Lin, Y.; Wang, W.; Hu, M.; Wang, Y. Formation of urban fine particulate matter. Chem Rev. 2015, 115, 3803–3855. [Google Scholar] [CrossRef] [PubMed]
  8. Hung, H.M.; Hoffmann, M.R. Oxidation of Gas-Phase SO2 on the Surfaces of Acidic Microdroplets: Implications for Sulfate and Sulfate Radical Anion Formation in the Atmospheric Liquid Phase. Environ. Sci. Technol. 2015, 49, 13768–13776. [Google Scholar] [CrossRef] [PubMed]
  9. Long, B.; Bao, J.L.; Truhlar, D.G. Reaction of SO2 with OH in the atmosphere. Phys. Chem. Chem. Phys. Pccp 2017, 19, 8091. [Google Scholar] [CrossRef]
  10. Sitha, S.; Jewell, L.L.; Piketh, S.J.; Fourie, G. A quantum chemical calculation of the potential energy surface in the formation of HOSO2 from OH + SO2. Atmos. Environ. 2011, 45, 745–754. [Google Scholar] [CrossRef]
  11. Zhang, R.; Khalizov, A.; Wang, L.; Hu, M.; Xu, W. Nucleation and growth of nanoparticles in the atmosphere. Chem. Rev. 2012, 112, 1957–2011. [Google Scholar] [CrossRef] [PubMed]
  12. Charlson, R.J.; Schwartz, S.E.; Hales, J.M.; Cess, R.D.; Coakley, J.A.; Hansen, J.E.; Hofmann, D.J. Climate forcing by anthropogenic aerosols. Science 1992, 255, 423–430. [Google Scholar] [CrossRef] [PubMed]
  13. Zheng, G.J.; Duan, F.K.; Su, H.; Ma, Y.L.; Cheng, Y.; Zheng, B.; Zhang, Q.; Huang, T.; Kimoto, T.; Chang, D.; et al. Exploring the severe winter haze in Beijing: The impact of synoptic weather, regional transport and heterogeneous reactions. Atmos. Chem. Phys. 2015, 15, 2969–2983. [Google Scholar] [CrossRef]
  14. Wang, Y.; Lampel, J.; Xie, P.; Beirle, S.; Li, A.; Wu, D.; Wagner, T. Ground-based MAX-DOAS observations of tropospheric aerosols, NO2, SO2 and HCHO in Wuxi, China, from 2011 to 2014. Atmos. Chem. Phys. 2017, 17, 2189–2215. [Google Scholar] [CrossRef]
  15. Quan, J.; Tie, X.; Zhang, Q.; Liu, Q.; Li, X.; Gao, Y.; Zhao, D. Characteristics of heavy aerosol pollution during the 2012–2013 winter in Beijing, China. Atmos. Environ. 2014, 88, 83–89. [Google Scholar] [CrossRef]
  16. Zhao, X.J.; Zhao, P.S.; Xu, J.; Meng, W.; Pu, W.W.; Dong, F.; He, D.; Shi, Q.F. Analysis of a winter regional haze event and its formation mechanism in the North China Plain. Atmos. Chem. Phys. 2013, 13, 5685–5696. [Google Scholar] [CrossRef] [Green Version]
  17. Xue, J.; Yuan, Z.; Yu, J.Z.; Lau, A.K.H. An Observation-Based Model for Secondary Inorganic Aerosols. Aerosol Air Qual. Res. 2014, 14, 862–878. [Google Scholar] [CrossRef] [Green Version]
  18. He, H.; Wang, Y.; Ma, Q.; Ma, J.; Chu, B.; Ji, D.; Tang, G.; Liu, C.; Zhang, H.; Hao, J. Mineral dust and NOx promote the conversion of SO2 to sulfate in heavy pollution days. Sci. Rep. 2014, 4, 4172. [Google Scholar] [CrossRef]
  19. Cheng, Y.; Zheng, G.; Wei, C.; Mu, Q.; Zheng, B.; Wang, Z.; Gao, M.; Zhang, Q.; He, K.; Carmichael, G.; et al. Reactive nitrogen chemistry in aerosol water as a source of sulfate during haze events in China. Sci. Adv. 2016, 2, e1601530. [Google Scholar] [CrossRef]
  20. Wang, Y.; Zhang, Q.; Jiang, J.; Zhou, W.; Wang, B.; He, K.; Duan, F.; Zhang, Q.; Philip, S.; Xie, Y. Enhanced sulfate formation during China’s severe winter haze episode in January 2013 missing from current models. J. Geophys. Res. Atmos. 2014, 119, 10425–10440. [Google Scholar] [CrossRef]
  21. Gao, M.; Carmichael, G.R.; Wang, Y.; Ji, D.; Liu, Z.; Wang, Z. Improving simulations of sulfate aerosols during winter haze over Northern China: The impacts of heterogeneous oxidation by NO2. Front. Environ. Sci. Eng. 2016, 10, 16. [Google Scholar] [CrossRef]
  22. Xue, J.; Yuan, Z.; Griffith, S.M.; Yu, X.; Lau, A.K.H.; Yu, J.Z. Sulfate Formation Enhanced by a Cocktail of High NOx, SO2, Particulate Matter, and Droplet pH during Haze-Fog Events in Megacities in China: An Observation-Based Modeling Investigation. Environ. Sci. Technol. 2016, 50, 7325–7334. [Google Scholar] [CrossRef] [PubMed]
  23. Ma, J.; Chu, B.; Liu, J.; Liu, Y.; Zhang, H.; He, H. NOx promotion of SO2 conversion to sulfate: An important mechanism for the occurrence of heavy haze during winter in Beijing. Environ. Pollut. 2018, 233, 662–669. [Google Scholar] [CrossRef] [PubMed]
  24. Zhang, H.; Chen, S.; Jie, Z.; Zhang, S.; Zhang, Y.; Zhang, X.; Li, Z.; Zeng, X. Formation of aqueous-phase sulfate during the haze period in China: Kinetics and atmospheric implications. Atmos. Environ. 2018, 177, 93–99. [Google Scholar] [CrossRef]
  25. Wang, G.; Zhang, R.; Gomez, M.E.; Yang, L.; Levy Zamora, M.; Hu, M.; Lin, Y.; Peng, J.; Guo, S.; Meng, J.; et al. Persistent sulfate formation from London Fog to Chinese haze. Proc. Natl. Acad. Sci. United States Am. 2016, 113, 13630–13635. [Google Scholar] [CrossRef] [Green Version]
  26. Pimentel, A.S.; Lima, F.C.A.; da Silva, A.B.F. The asymmetric dimerization of nitrogen dioxide. Chem. Phys. Lett. 2007, 436, 47–50. [Google Scholar] [CrossRef]
  27. Miller, Y.; Finlayson-Pitts, B.J.; Gerber, R.B. Ionization of N2O4 in Contact with Water: Mechanism, Time Scales and Atmospheric Implications. J. Am. Chem. Soc. 2009, 131, 12180–12185. [Google Scholar] [CrossRef]
  28. Liu, C.; Ma, Q.; Liu, Y.; Ma, J.; He, H. Synergistic reaction between SO2 and NO2 on mineral oxides: A potential formation pathway of sulfate aerosol. Phys. Chem. Chem. Phys. 2012, 14, 1668–1676. [Google Scholar] [CrossRef]
  29. Ma, Q.; Liu, Y.; He, H. Synergistic Effect between NO2 and SO2 in Their Adsorption and Reaction on γ-Alumina. J. Phys. Chem. A 2008, 112, 6630–6635. [Google Scholar] [CrossRef]
  30. Ma, Q.; Wang, T.; Liu, C.; He, H.; Wang, Z.; Wang, W.; Liang, Y. SO2 Initiates the Efficient Conversion of NO2 to HONO on MgO Surface. Environ. Sci. Technol. 2017, 51, 3767–3775. [Google Scholar] [CrossRef]
  31. Zhu, R.S.; Lai, K.Y.; Lin, M.C. Ab initio chemical kinetics for the hydrolysis of N2O4 isomers in the gas phase. J. Phys. Chem A 2012, 116, 4466–4472. [Google Scholar] [CrossRef] [PubMed]
  32. Liu, W.G.; Goddard, W.A., 3rd. First-principles study of the role of interconversion between NO2, N2O4, cis-ONO-NO2, and trans-ONO-NO2 in chemical processes. J. Am. Chem Soc. 2012, 134, 12970–12978. [Google Scholar] [CrossRef] [PubMed]
  33. Wang, X.; Bai, F.Y.; Sun, Y.Q.; Wang, R.S.; Pan, X.M.; Tao, F.M. Theoretical study of the gaseous hydrolysis of NO2 in the presence of NH3 as a source of atmospheric HONO. Environ. Chem. 2015, 13, 611–622. [Google Scholar] [CrossRef]
  34. Varner, M.E.; Finlayson-Pitts, B.J.; Benny Gerber, R. Reaction of a charge-separated ONONO2 species with water in the formation of HONO: An MP2 Molecular Dynamics study. Phys. Chem. Chem. Phys. 2014, 16, 4483–4487. [Google Scholar] [CrossRef] [PubMed]
  35. Addison, C.C. Dinitrogen tetroxide, nitric acid, and their mixtures as media for inorganic reactions. Chem. Rev. 1980, 80, 21–39. [Google Scholar] [CrossRef]
  36. Frisch, M.J.; Trucks, G.W.; Schlegel, H.B.; Scuseria, G.E.; Robb, M.A.; Cheeseman, J.R.; Scalmani, G.; Barone, V.; Mennucci, B.; Petersson, G.A.; et al. Gaussian 09, Revision B.01, Gaussian, Inc.: Wallingford, CT, USA, 2010.
  37. Zhao, Y.; Truhlar, D.G. The M06 suite of density functionals for main group thermochemistry, thermochemical kinetics, noncovalent interactions, excited states, and transition elements: Two new functionals and systematic testing of four M06-class functionals and 12 other functionals. Theor. Chem. Acc. 2008, 120, 215–241. [Google Scholar] [CrossRef]
  38. Lv, G.; Nadykto, A.B.; Sun, X.; Zhang, C.; Xu, Y. Towards understanding the role of amines in the SO2 hydration and the contribution of the hydrated product to new particle formation in the Earth’s atmosphere. Chemosphere 2018, 205, 275–285. [Google Scholar] [CrossRef]
  39. Lv, G.; Sun, X.; Zhang, C.; Li, M. Understanding the catalytic role of oxalic acid in SO3 hydration to form H2SO4 in the atmosphere. Atmos. Chem. Phys. 2019, 19, 2833–2844. [Google Scholar] [CrossRef]
  40. Fukui, K. The Path of Chemical Reactions-The IRC Approach. Acc. Chem. Res. 1981, 14, 471–476. [Google Scholar] [CrossRef]
  41. Purvis, G.D.; Bartlett, R.J. A full coupled-cluster singles and doubles model: The inclusion of disconnected triples. J. Chem. Phys. 1982, 76, 1910–1918. [Google Scholar] [CrossRef]
  42. Besler, B.H.; Merz, K.M., Jr.; Kollman, P.A. Atomic Charges Derived from Semiempirical Methods. J. Comput. Chem. 1990, 11, 431–439. [Google Scholar] [CrossRef]
  43. Singh, C.U.; Kollman, P.A. An Approach to Computing Electrostatic Charges for Molecules. J. Comput. Chem. 1984, 5, 129–145. [Google Scholar] [CrossRef]
  44. Legault, C.Y. CYLview, 1.0b; Université de Sherbrooke: Montreal, QC, Canada, 2009. Available online: http://www.cylview.org (accessed on 20 July 2018).
Figure 1. Potential energy profile for the reaction of SO2-2NO2. The yellow spheres are S atoms, the red spheres are O atom, and the blue spheres are N atom, respectively. (Unit: Energies in kcal/mol; bond lengths in angstroms). The black and red lines are the different pathways. The black line represents the reaction of t-ONONO2-SO2, and the red line is the reaction of c-ONONO2-SO2.
Ijms 20 03746 g001
Figure 2. Potential energy profile for the reaction of SO2-2NO2-H2O. The yellow spheres are S atoms, the red spheres are O atom, the blue spheres are N atom, and the white spheres represent H atom, respectively. (Unit: Energies in kcal/mol; bond lengths in angstroms). The black and red lines are the different pathways. The black line represents the reaction of t-ONONO2-H2O-SO2, and the red line is the reaction of c-ONONO2-H2O-SO2.
Ijms 20 03746 g002
Figure 3. Potential energy profile for the reaction of SO2-2NO2-2H2O. The yellow spheres are S atoms, the red spheres are O atom, the blue spheres are N atom, and the white spheres represent H atom, respectively. (Unit: Energies in kcal/mol; bond lengths in angstroms). The black and red lines are the different pathways. The black line represents the reaction of t-ONONO2-2H2O-SO2, and the red line is the reaction of c-ONONO2-2H2O-SO2.
Ijms 20 03746 g003
Figure 4. Potential energy profile for the reaction of SO2-2NO2-3H2O. The yellow spheres are S atoms, the red spheres are O atom, the blue spheres are N atom, and the white spheres represent H atom, respectively. (Unit: Energies in kcal/mol; bond lengths in angstroms). The black and red lines are the different pathways. The black line represents the reaction of t-ONONO2-3H2O-SO2, and the red line is the reaction of c-ONONO2-3H2O-SO2.
Ijms 20 03746 g004
Figure 5. Potential energy profile for the reaction of SO2-2NO2-NH3. The yellow spheres are S atoms, the red spheres are O atom, the blue spheres are N atom, and the white spheres represent H atom, respectively. (Unit: Energies in kcal/mol; bond lengths in angstroms). The black and red lines are the different pathways. The black line represents the reaction of t-ONONO2-NH3-SO2, and the red line is the reaction of c-ONONO2-NH3-SO2.
Ijms 20 03746 g005
Figure 6. Potential energy profile for the reaction of SO2-2NO2-H2O-NH3. The yellow spheres are S atoms, the red spheres are O atom, the blue spheres are N atom, and the white spheres represent H atom, respectively. (Unit: Energies in kcal/mol; bond lengths in angstroms). The black and red lines are the different pathways. The black line represents the reaction of t-ONONO2-H2O-NH3-SO2, and the red line is the reaction of c-ONONO2-H2O-NH3-SO2.
Ijms 20 03746 g006
Figure 7. Potential energy profile for the reaction of SO2-2NO2-2H2O-NH3. The yellow spheres are S atoms, the red spheres are O atom, the blue spheres are N atom, and the white spheres represent H atom, respectively. (Unit: Energies in kcal/mol; bond lengths in angstroms). The black and red lines are the different pathways. The black line represents the reaction of t-ONONO2-2H2O-NH3-SO2, and the red line is the reaction of c-ONONO2-2H2O-NH3-SO2.
Ijms 20 03746 g007
Figure 8. Potential energy profile for the reaction of SO2-2NO2-H2O-2NH3. The yellow spheres are S atoms, the red spheres are O atom, the blue spheres are N atom, and the white spheres represent H atom, respectively. (Unit: Energies in kcal/mol; bond lengths in angstroms). The black and red lines are the different pathways. The black line represents the reaction of t-ONONO2-H2O-2NH3-SO2, and the red line is the reaction of c-ONONO2-H2O-2NH3-SO2.
Ijms 20 03746 g008
Table 1. Energy barriers and reaction energies for the integrated reactions 2NO2-SO2-mH2O-nNH3 (m = 0, 1, 2, 3; n = 0, 1, 2) (unit: kcal/mol).
Oxidation ReactionHydrolysis Reaction
Reaction SystemsEnergy Barrier (kcal/mol)Reaction Energy (kcal/mol)Energy Barrier (kcal/mol)Reaction Energy (kcal/mol)
SO2-2NO245.48−11.49
52.45−5.77
SO2-2NO2-H2O41.80−13.160.29−3.27
47.54−13.050.29−3.27
SO2-2NO2-2H2O40.14−14.754.36−3.94
41.47−15.873.06−1.85
SO2-2NO2-3H2O36.49−19.482.63−4.15
38.77−21.341.87−6.56
SO2-2NO2-NH340.60−20.10
48.85−13.76
SO2-2NO2-H2O-NH338.92−17.856.44−13.45
40.30−18.608.55−13.06
SO2-2NO2-2H2O-NH339.21−18.616.263.36
39.77−18.4612.43−14.42
SO2-2NO2-H2O-2NH338.85−18.809.04−19.46
40.26−19.5112.68−16.28
Table 2. The charge distribution for the NO+NO3 and NO+NO2 in reactant complexes (RC) and intermediates (IM).
Reactant ComplexesNO+NO3IntermediateNO+NO2
SO2-2NO2RC10.330−0.328IM10.502−0.201
RC20.405−0.394IM20.501−0.217
SO2-2NO2-H2ORC1-1W0.472−0.437IM1-1W0.712−0.250
RC2-1W0.506−0.472IM2-1W0.688−0.280
SO2-2NO2-2H2ORC1-2W0.644−0.605IM1-2W0.772−0.290
RC2-2W0.592−0.532IM2-2W0.726−0.259
SO2-2NO2-3H2ORC1-3W0.730−0.695IM1-3W0.767−0.309
RC2-3W0.705−0.724IM2-3W0.621−0.282
SO2-2NO2-NH3RC1-1A0.448−0.442IM1-1A0.241−0.222
RC2-1A0.458−0.635IM2-1A0.643−0.228
SO2-2NO2-H2O-NH3RC1-1W-1A0.599−0.569IM1-1W-1A0.640−0.261
RC2-1W-1A0.508−0.672IM2-1W-1A0.596−0.279
SO2-2NO2-2H2O-NH3RC1-2W-1A0.675−0.673IM1-2W-1A0.773−0.296
RC2-2W-1A0.722−0.625IM2-2W-1A0.717−0.241
SO2-2NO2-H2O-2NH3RC1-1W-2A0.440−0.696IM1-1W-2A0.549−0.297
RC2-1W-2A0.449−0.691IM2-1W-2A0.488−0.283

