Catalytic Reaction Mechanism of NO–CO on the ZrO2 (110) and (111) Surfaces

Abstract
:
1. Introduction
2. Results and Discussion
2.1. CO and NO Adsorption on ZrO2 (110) Surface
2.2. Reaction Mechanism of NO Reduction with CO on ZrO2 (110) Surface
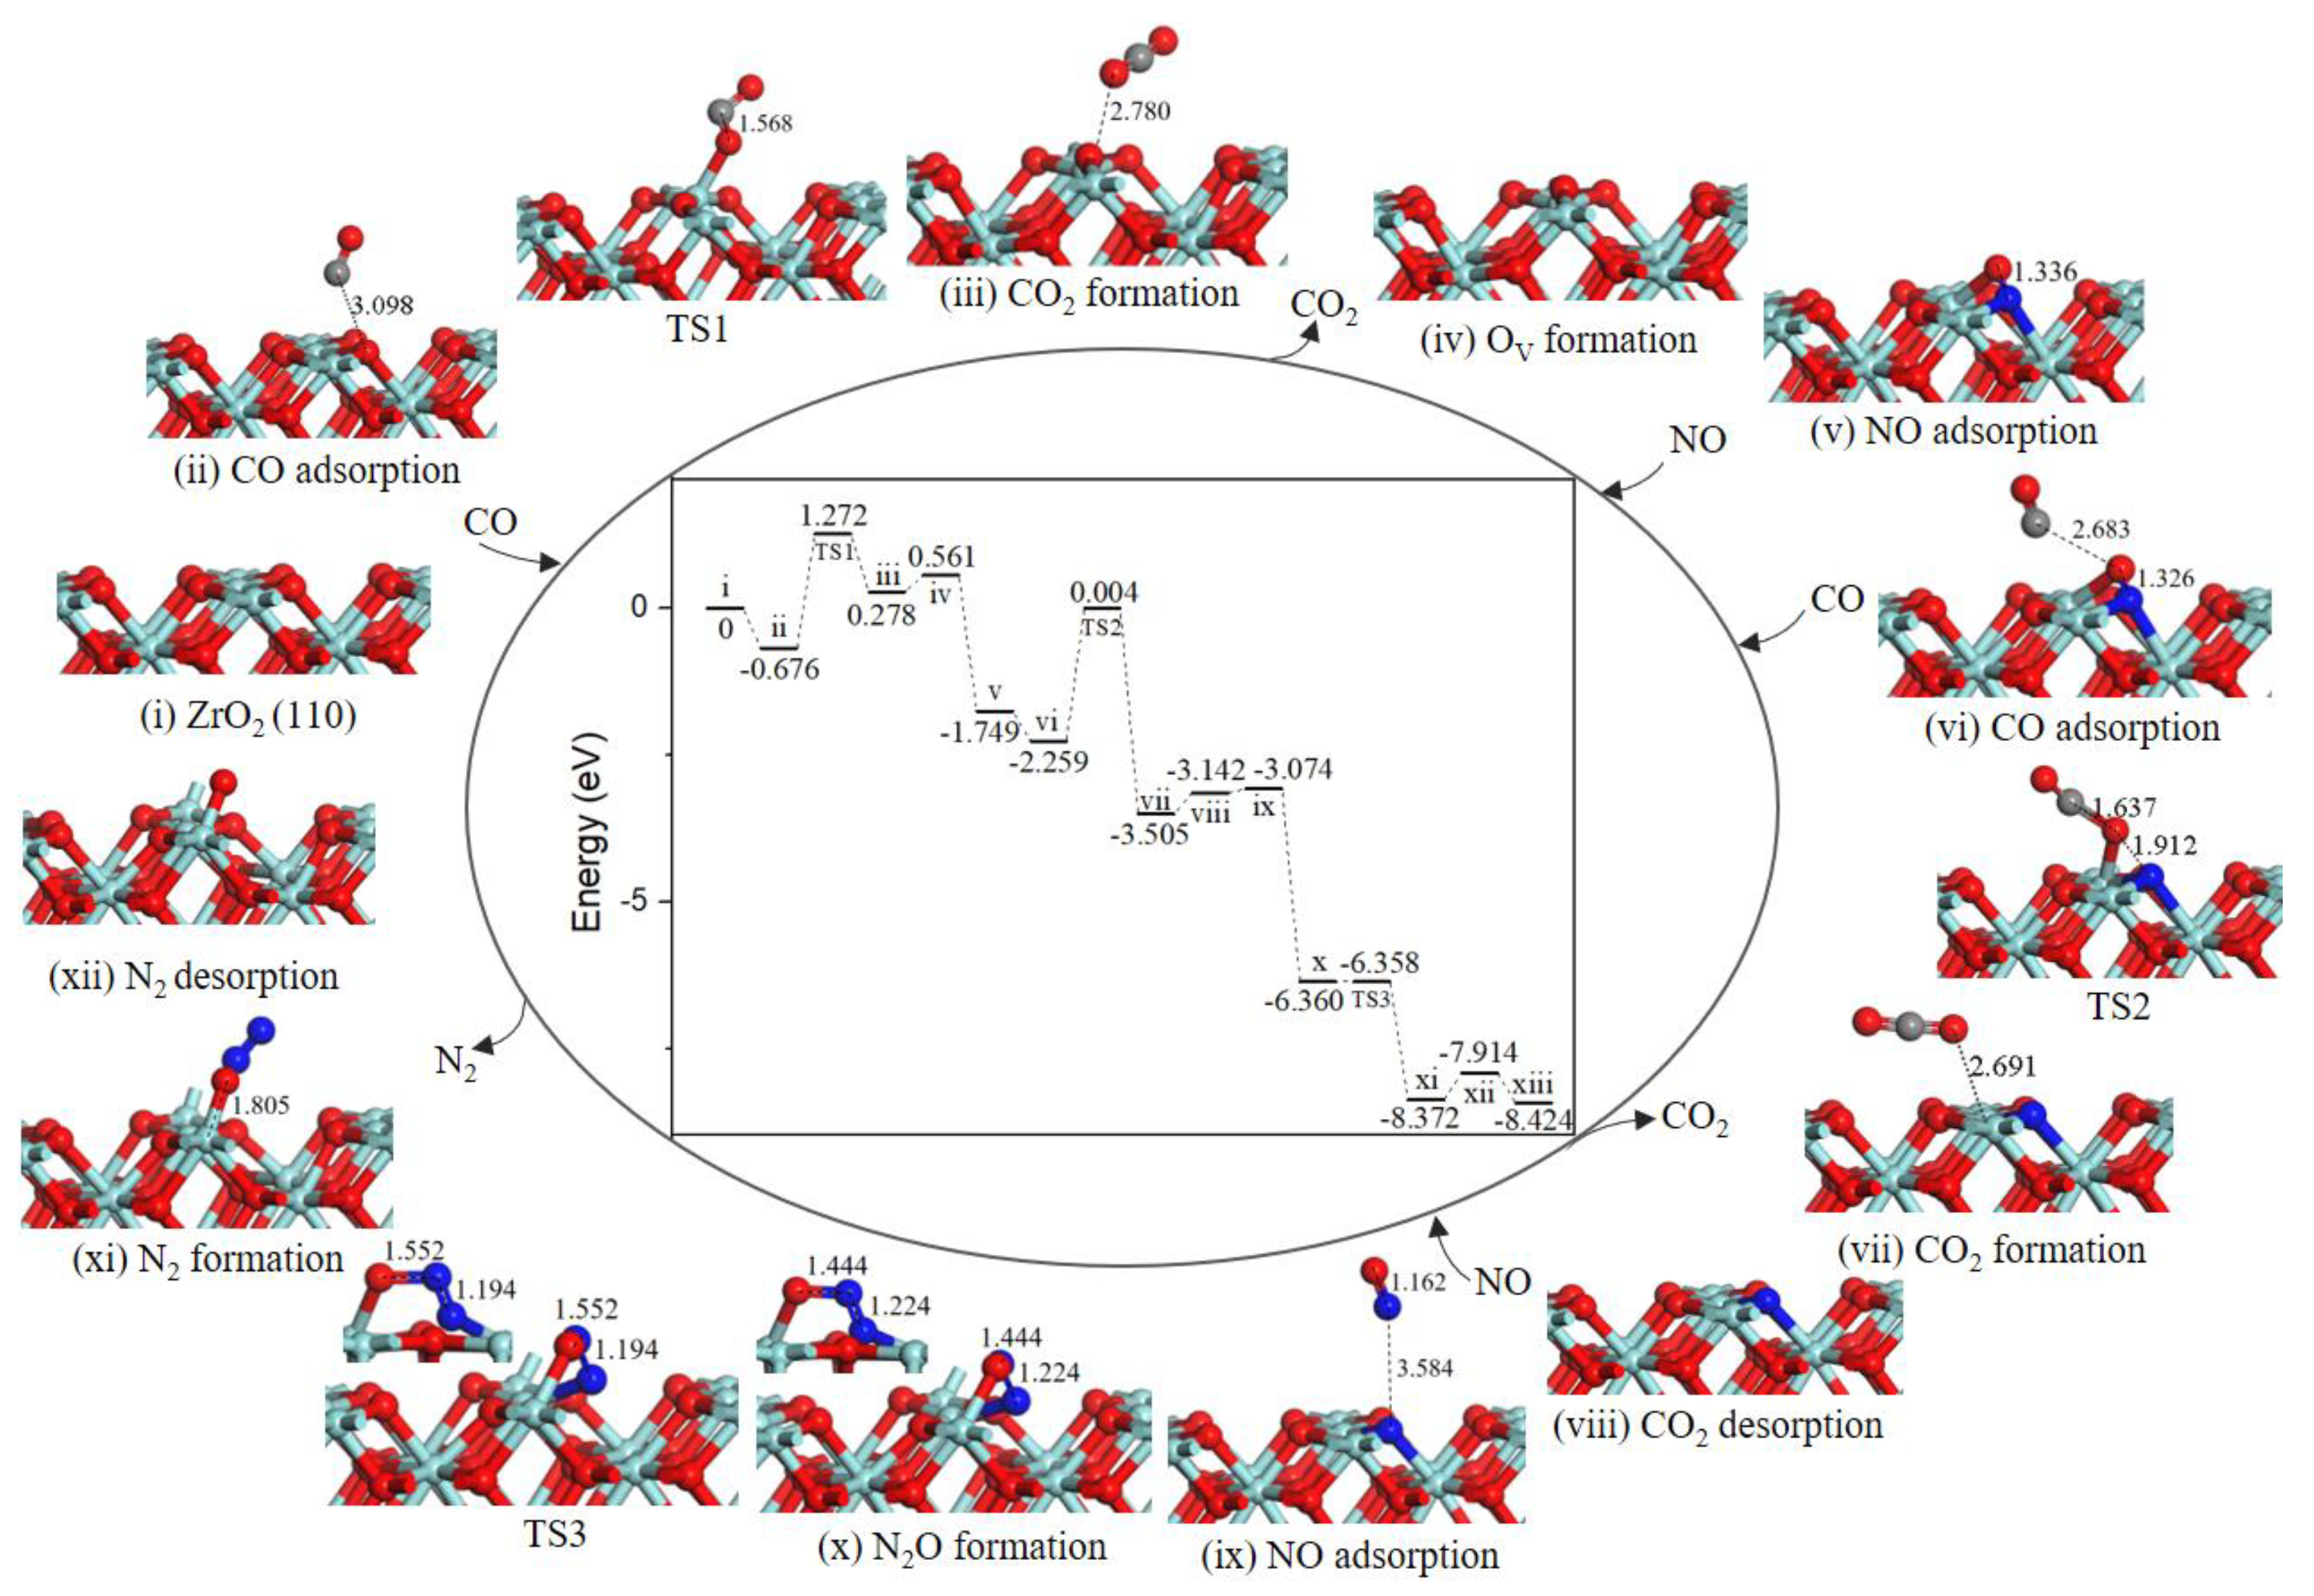
2.2.1. Path 1
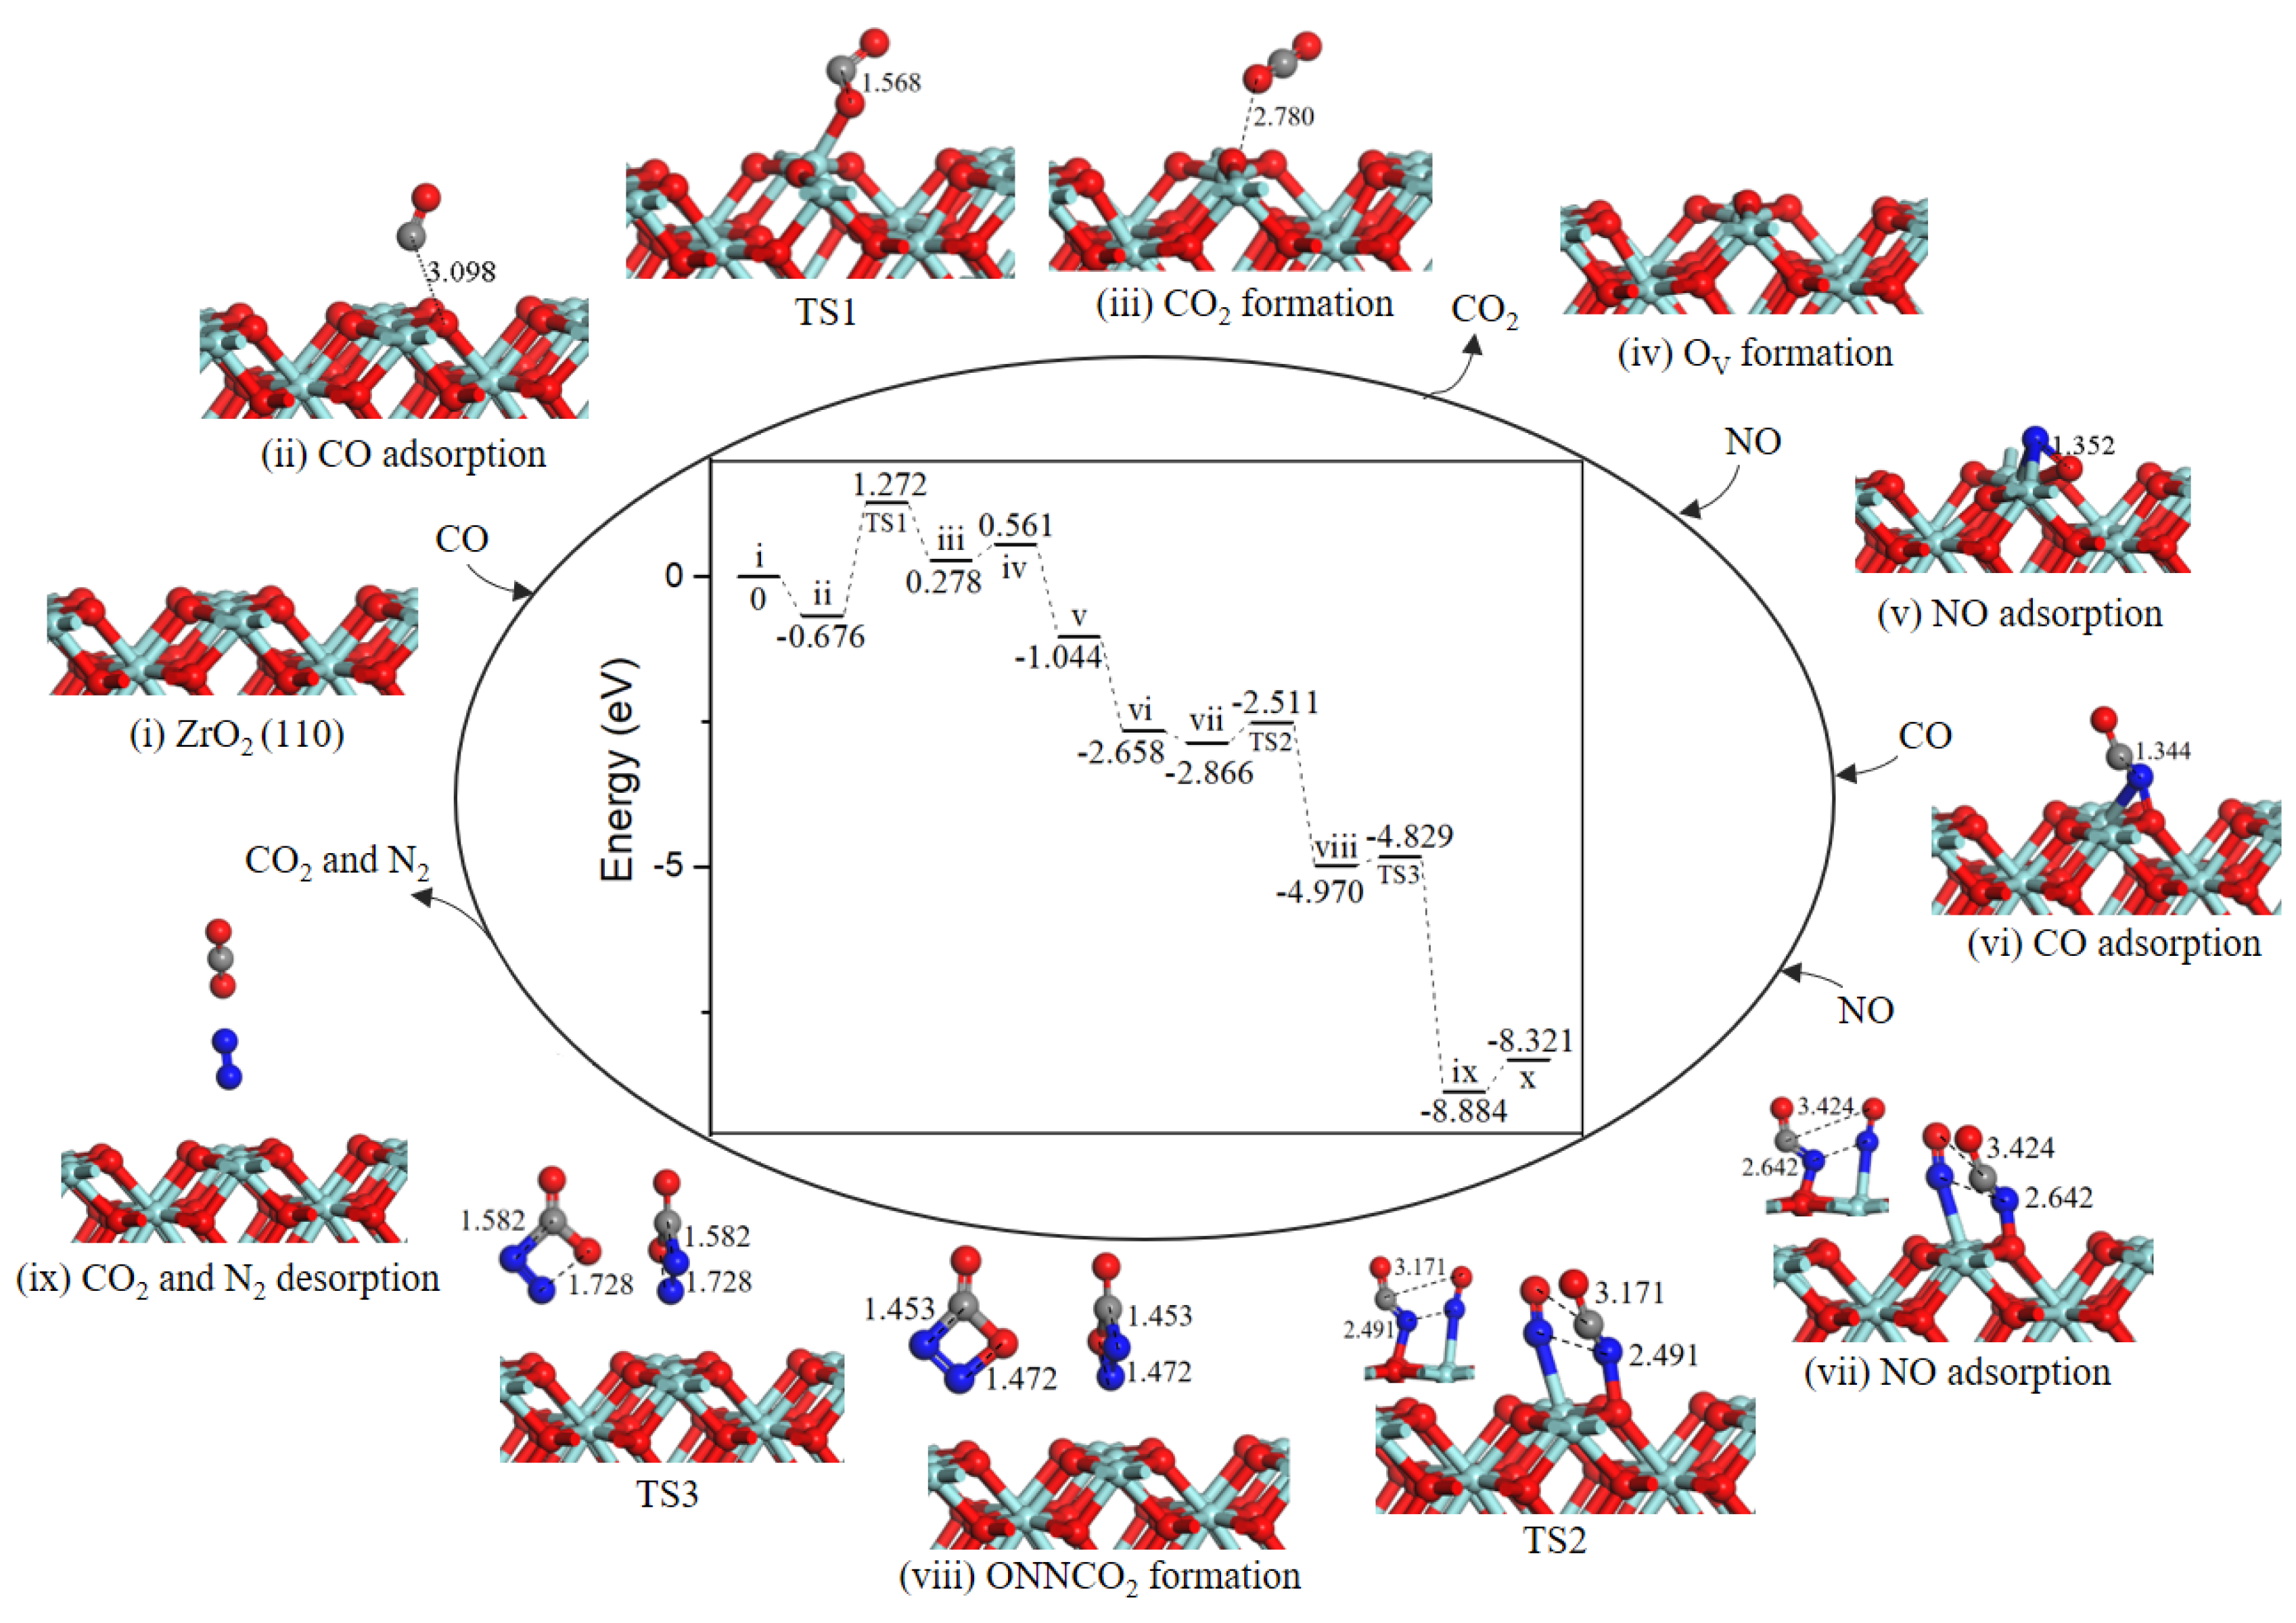
2.2.2. Path 2
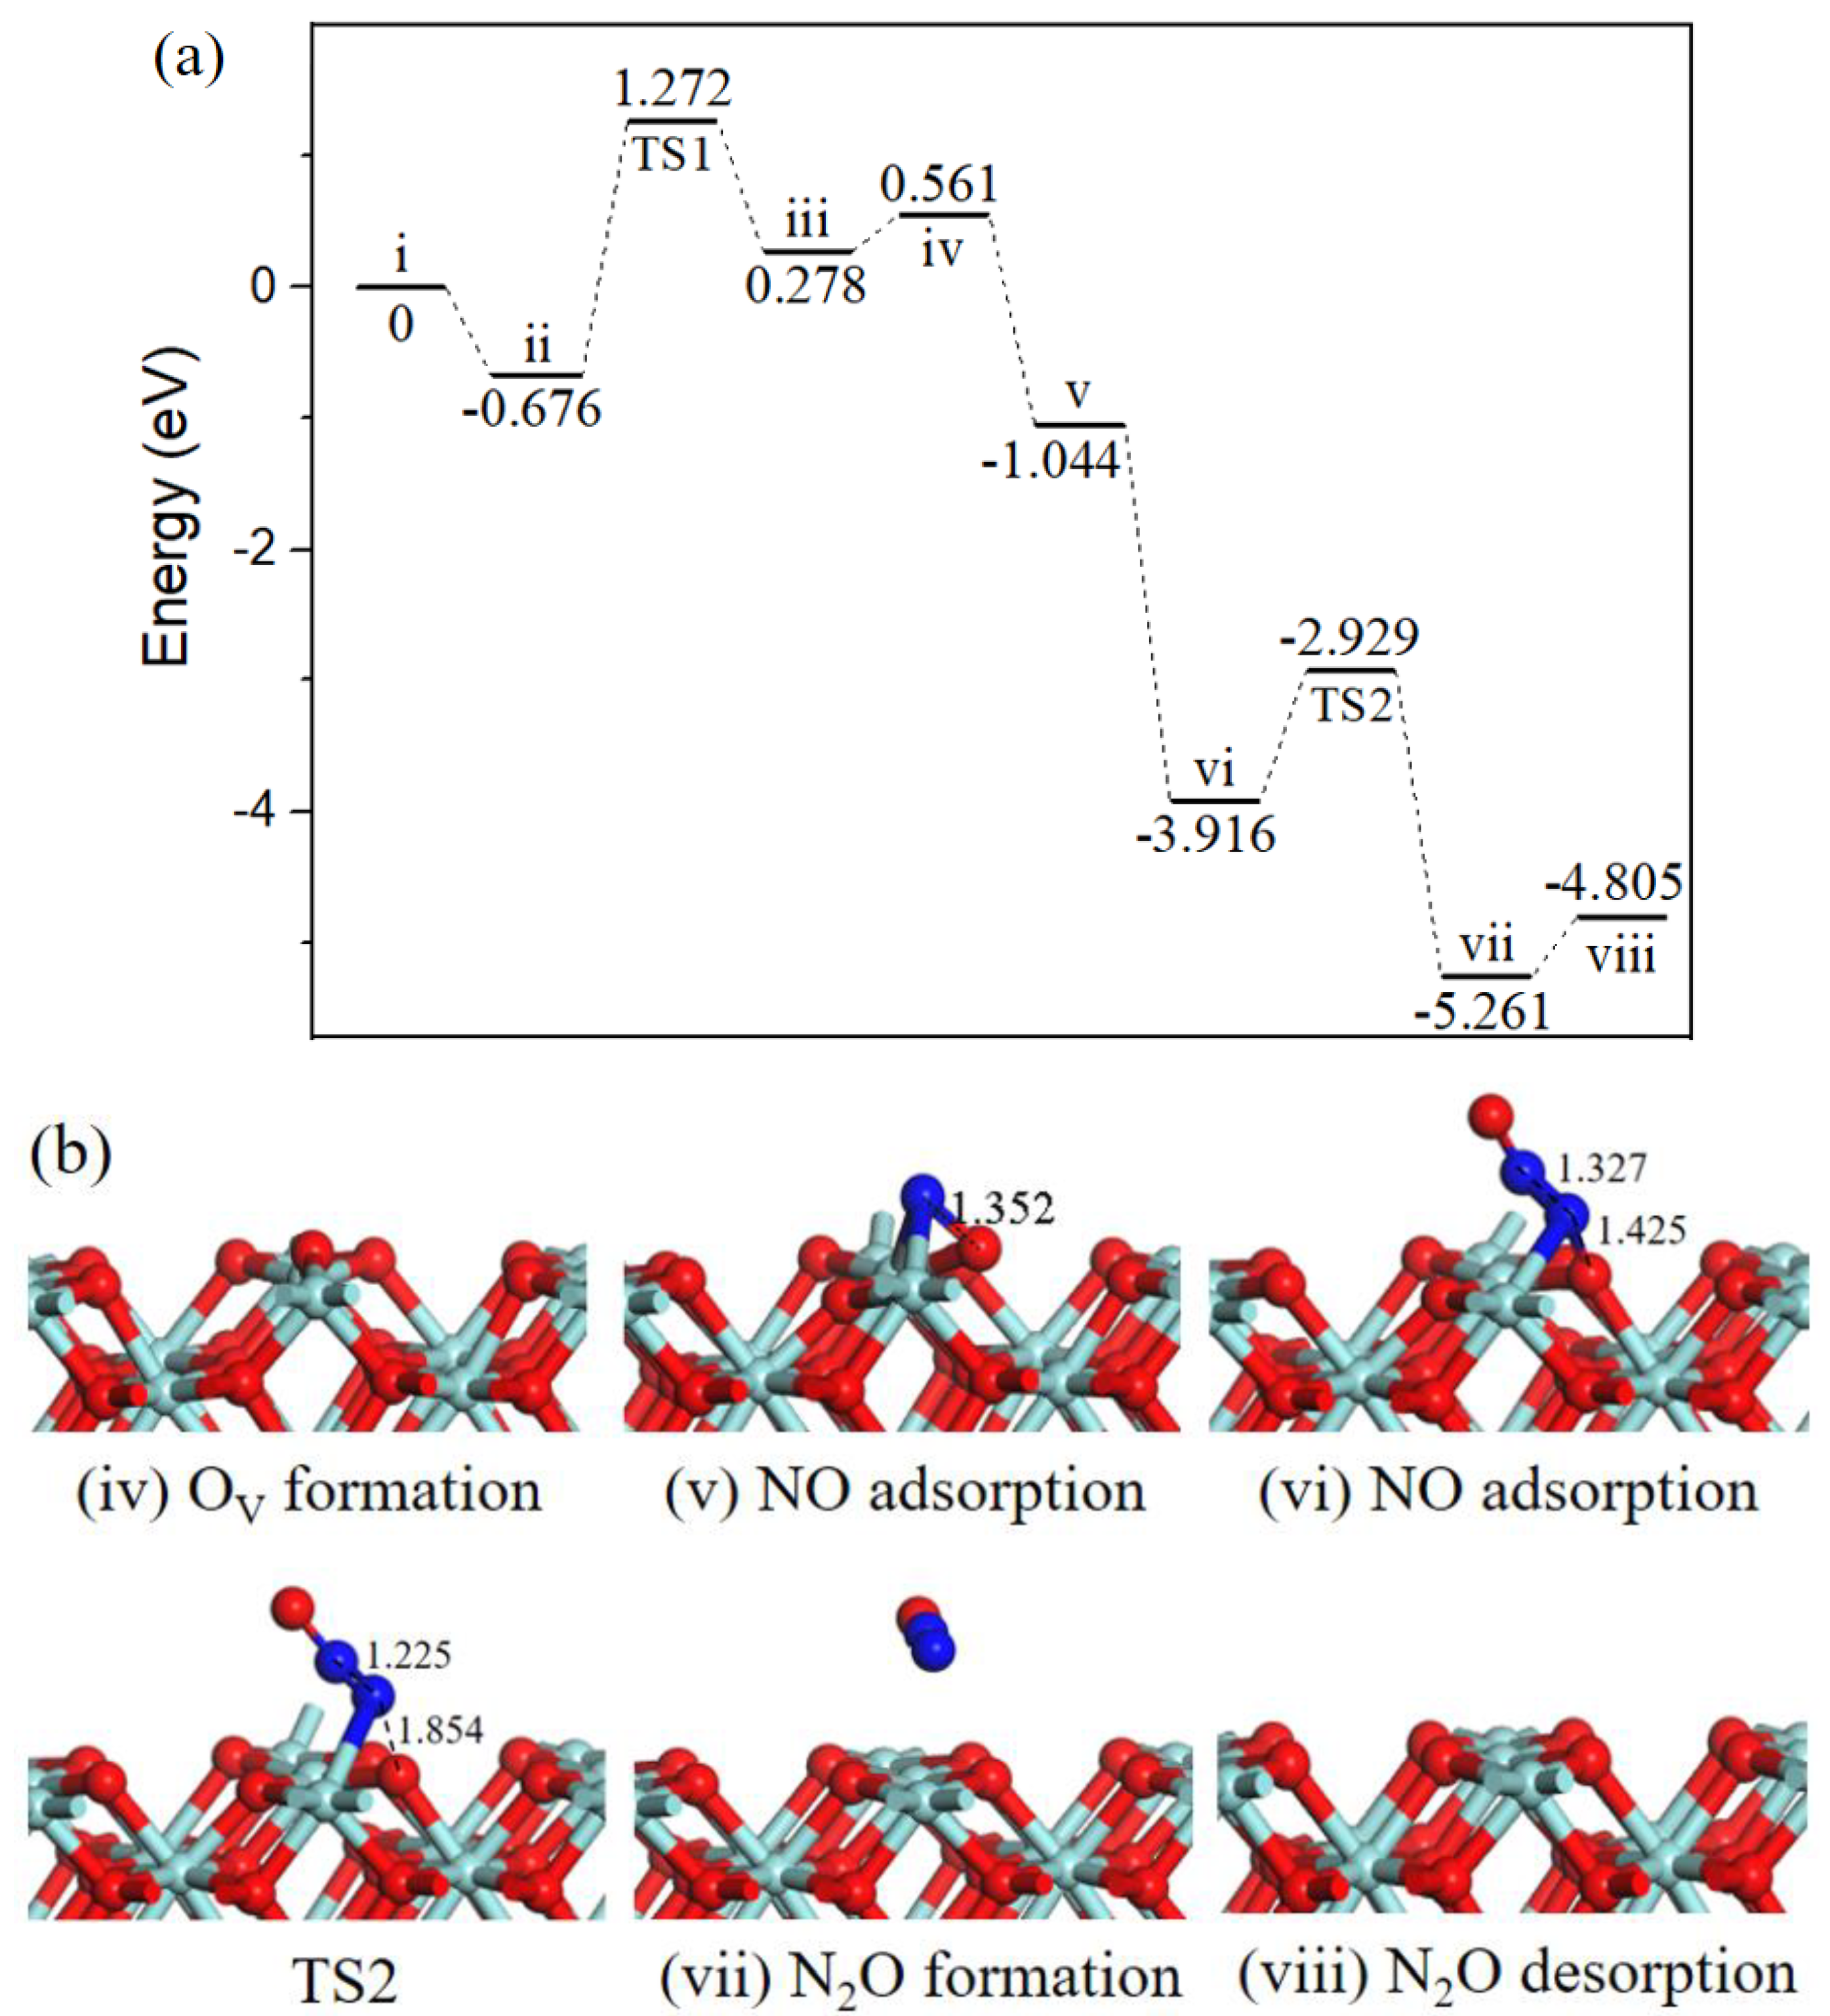
2.2.3. N2O formation.
2.3. CO and NO Adsorption on ZrO2 (111) Surface
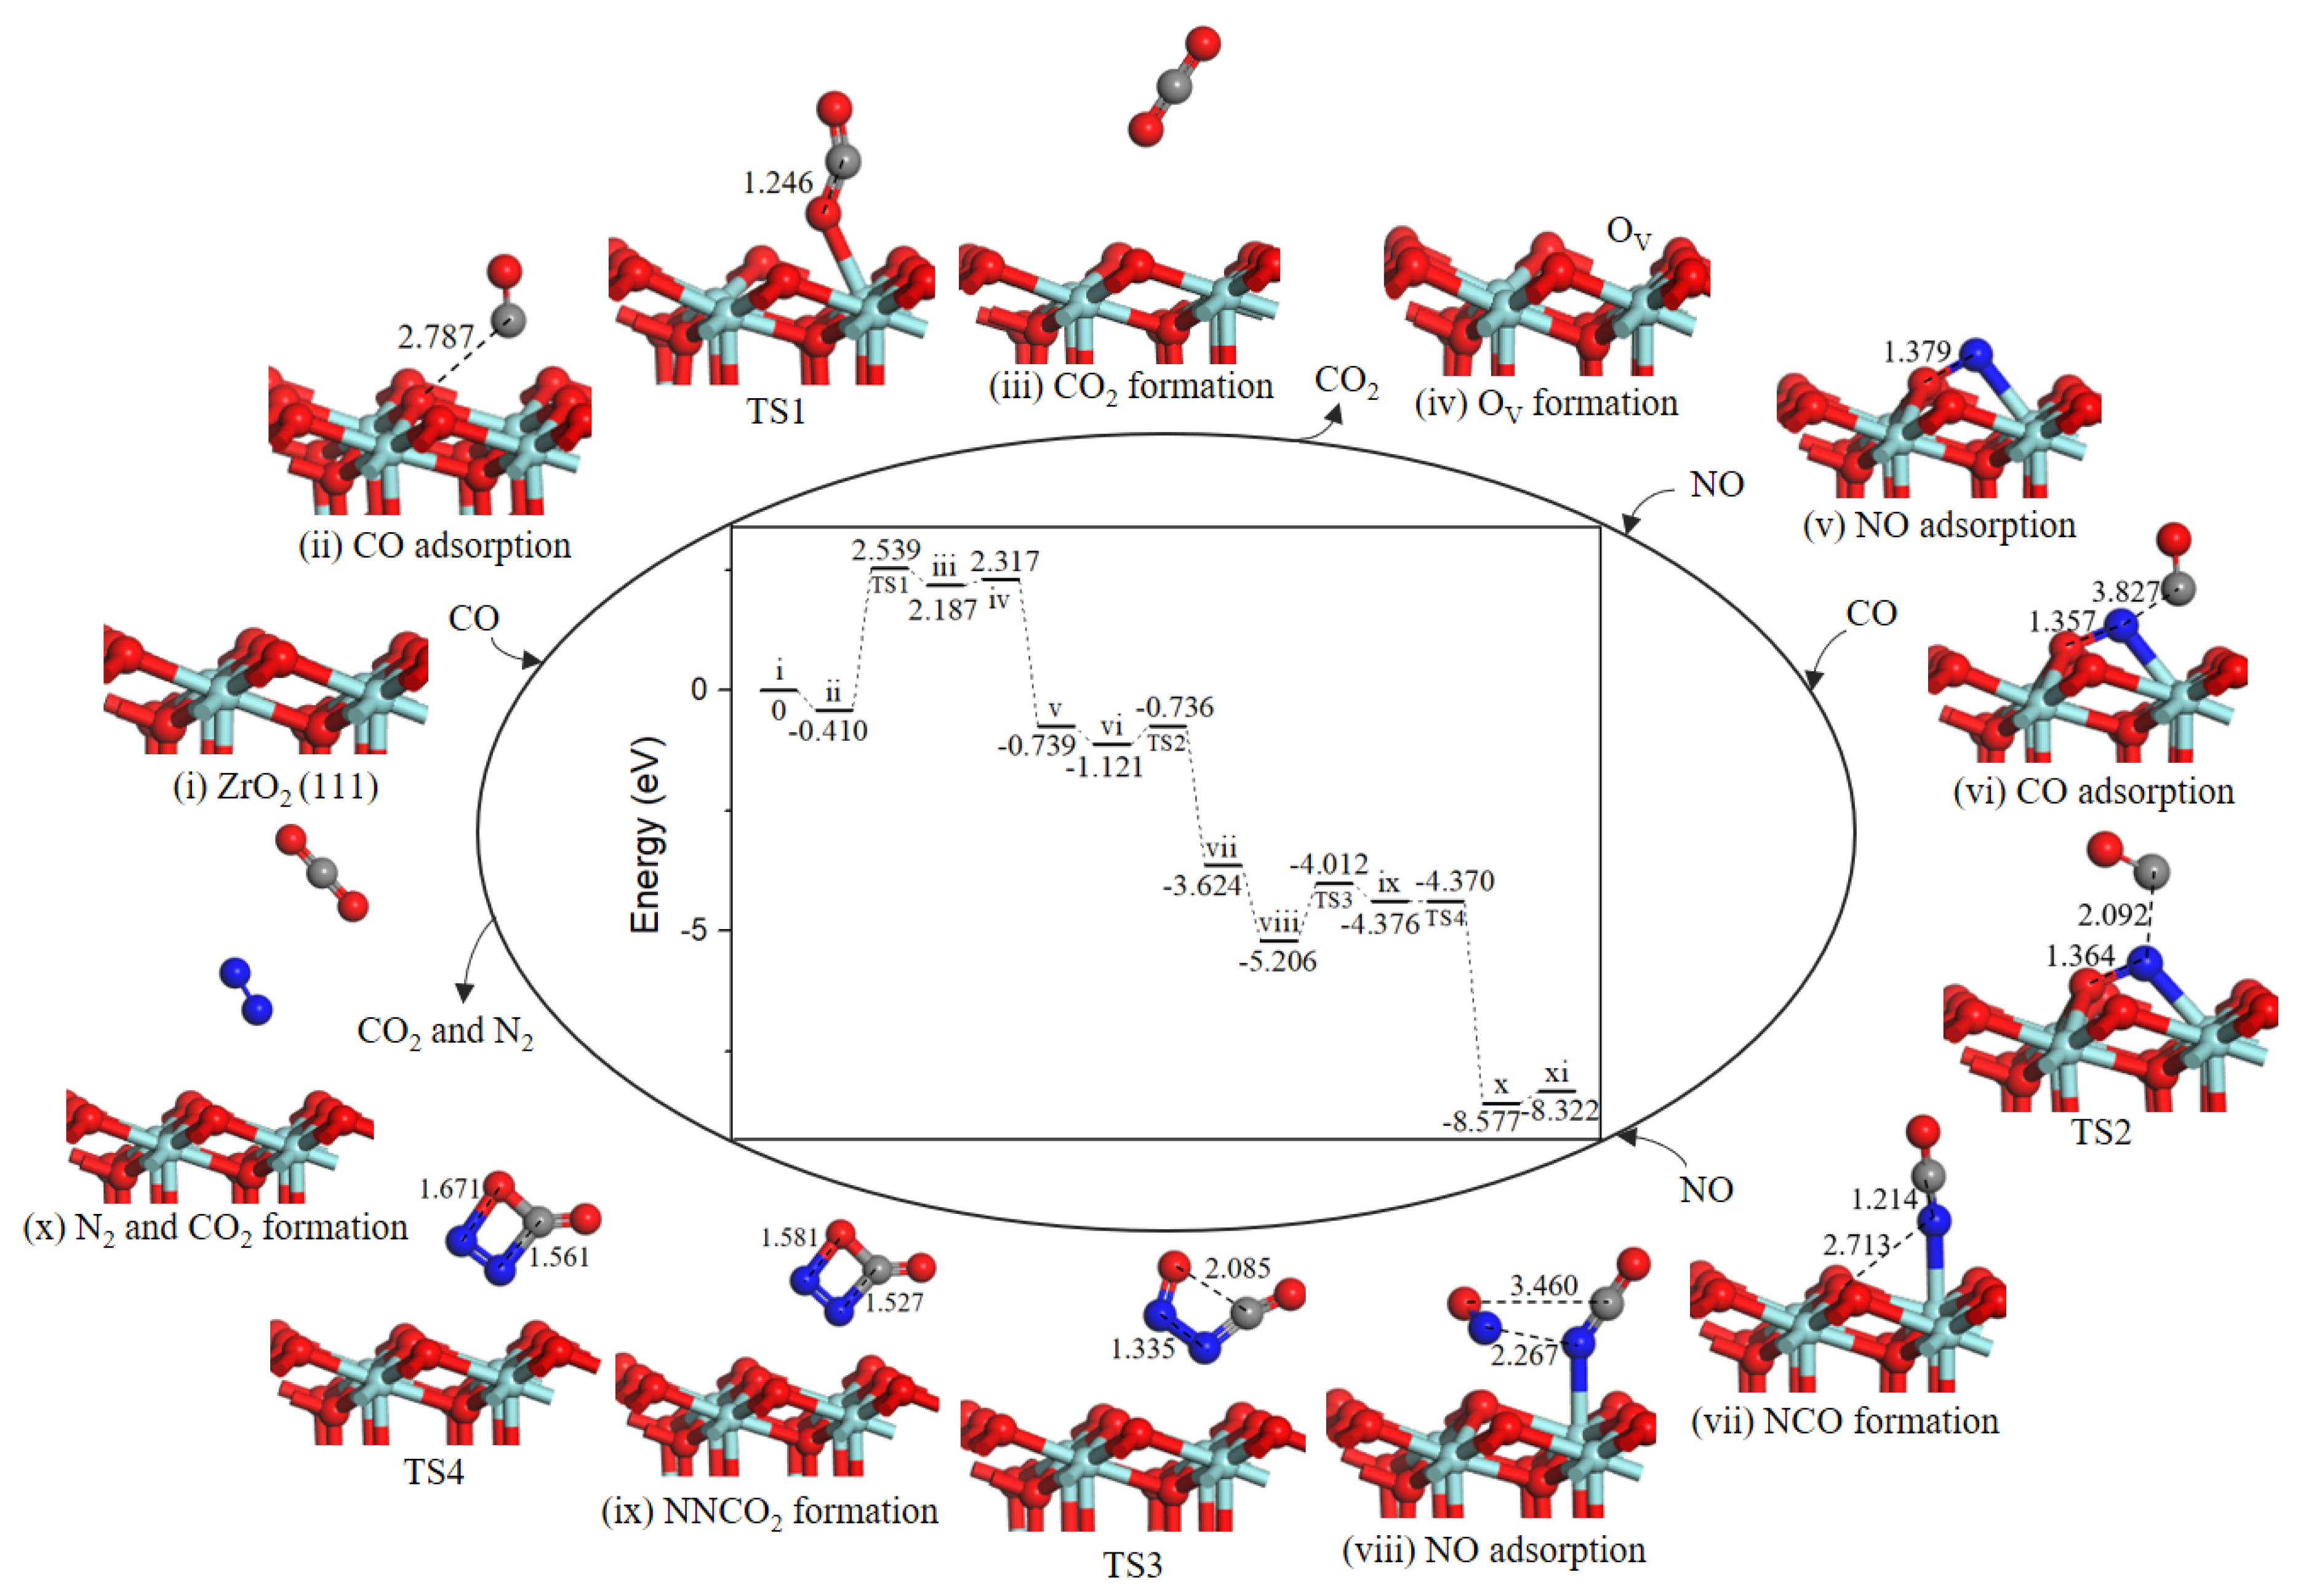
2.4. Reaction Mechanism of NO Reduction with CO on ZrO2 (111) Surface
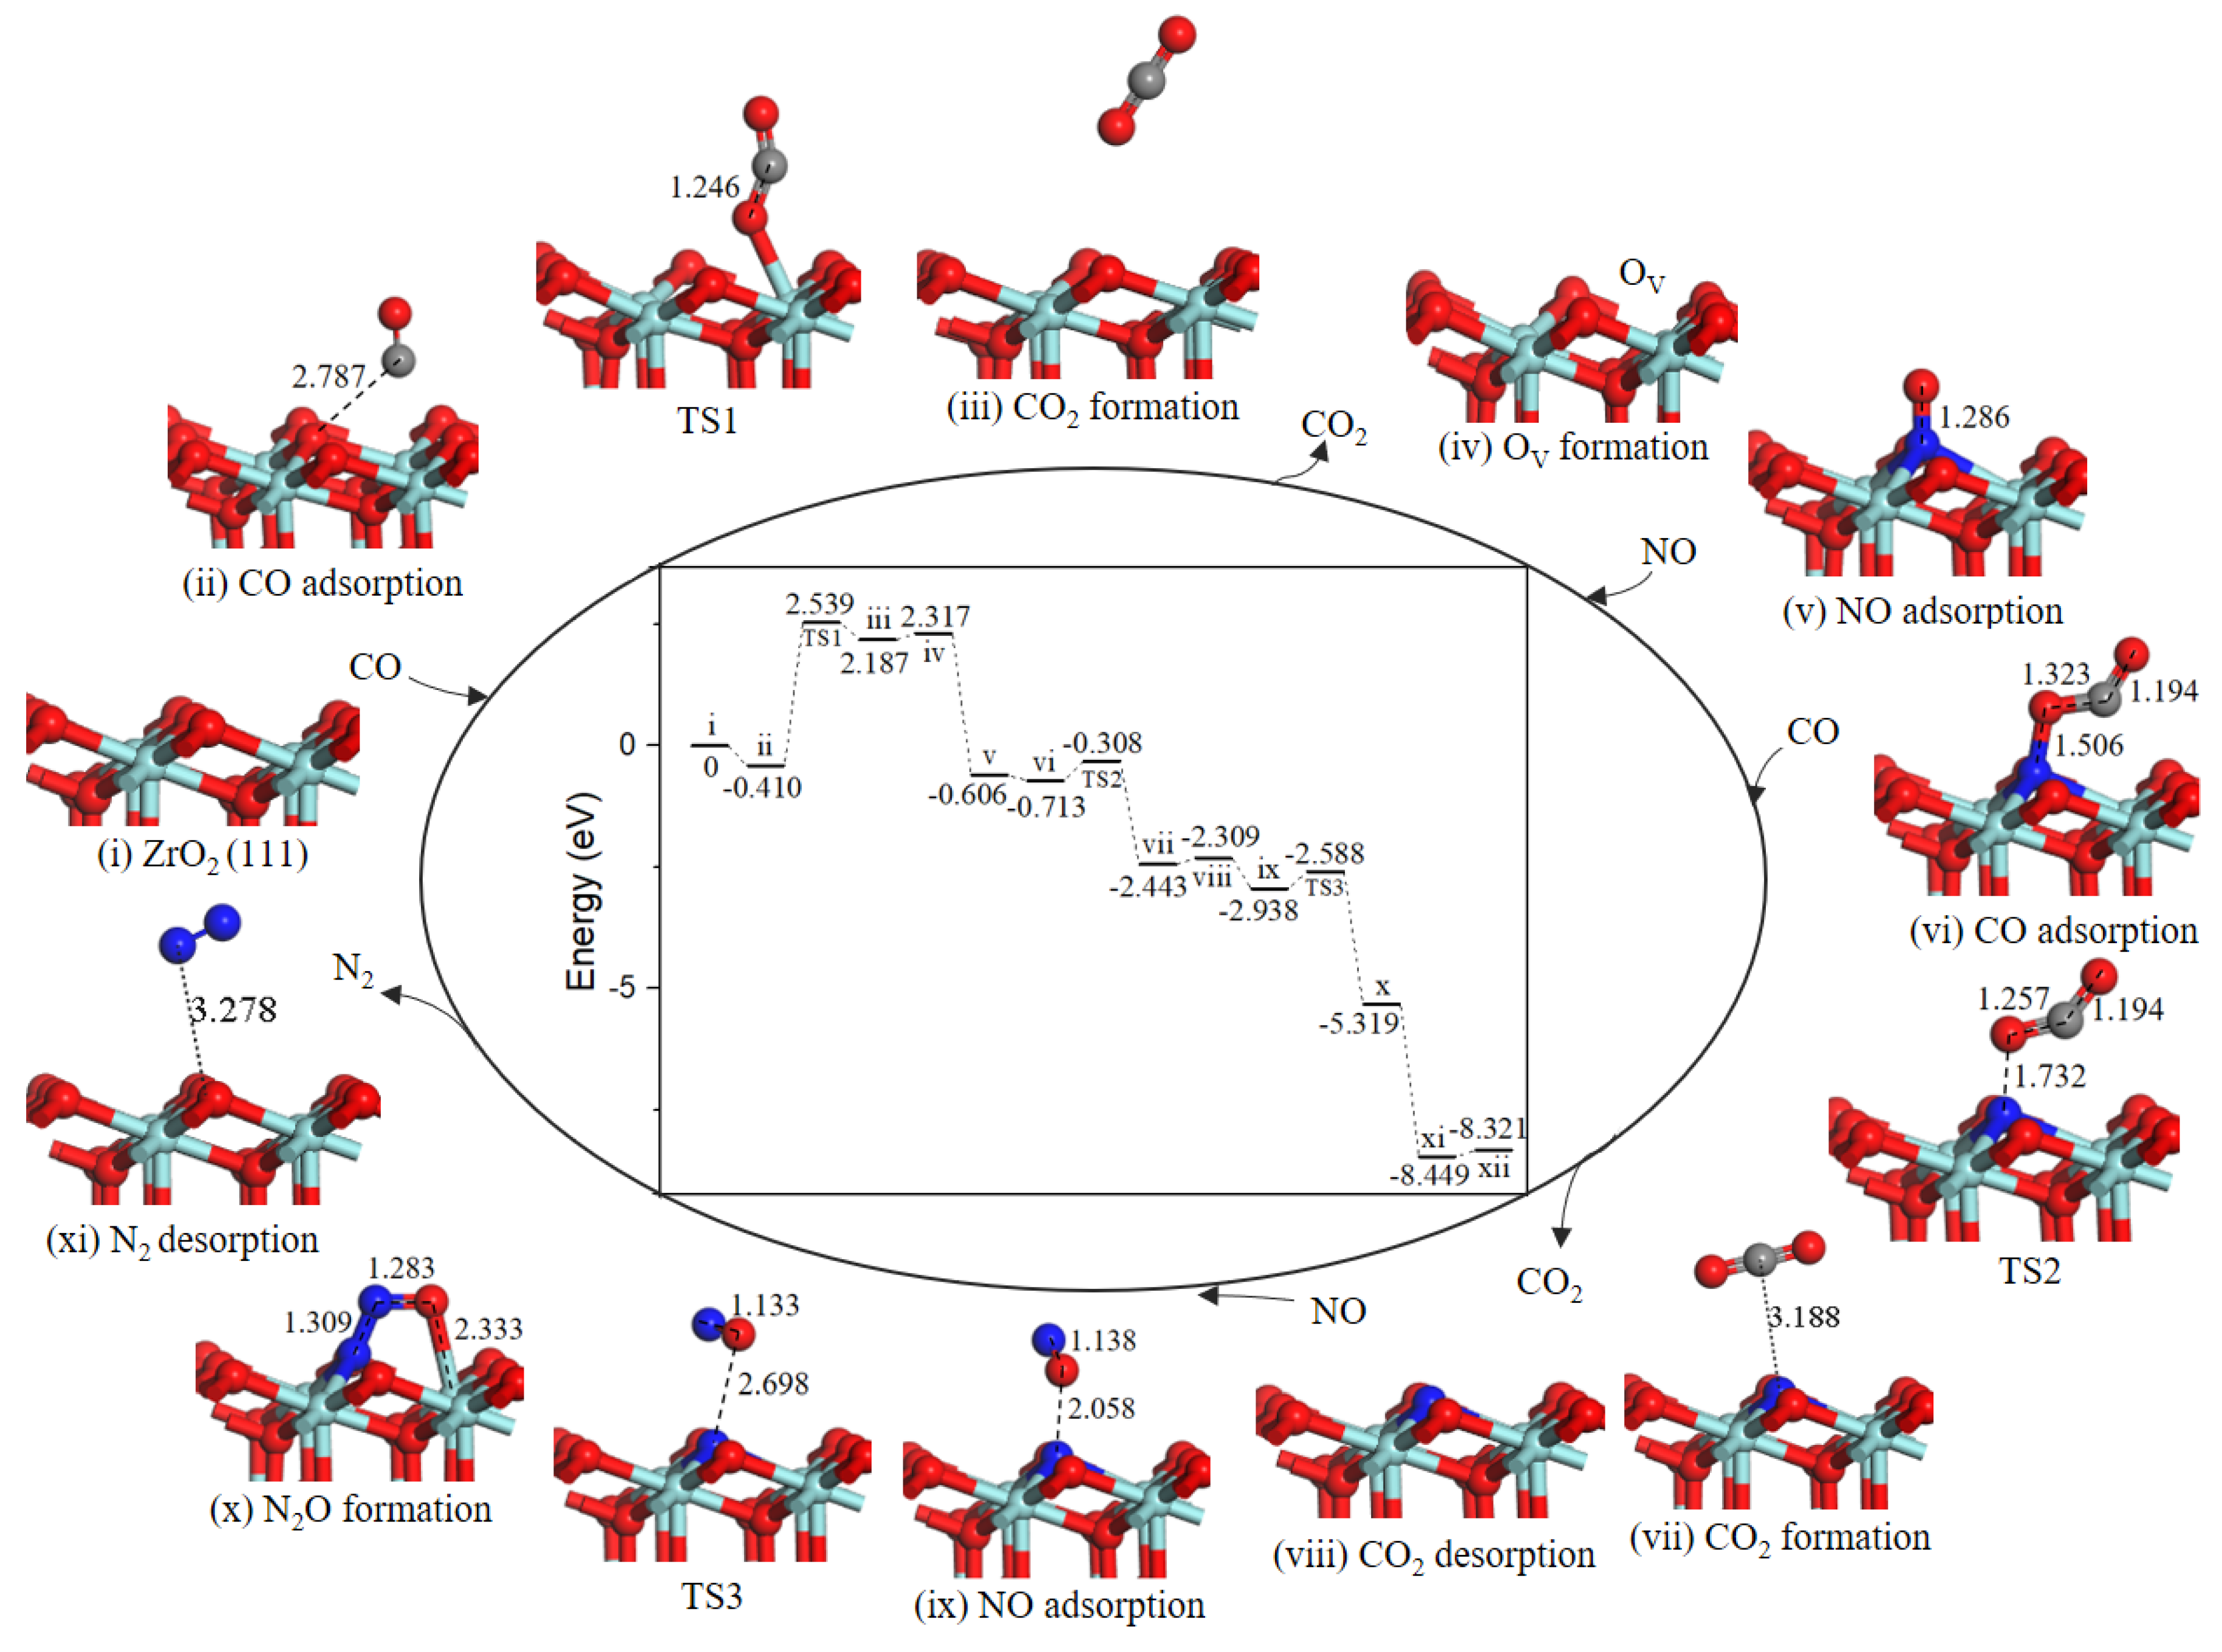
2.4.1. Path 1’
2.4.2. Path 2′
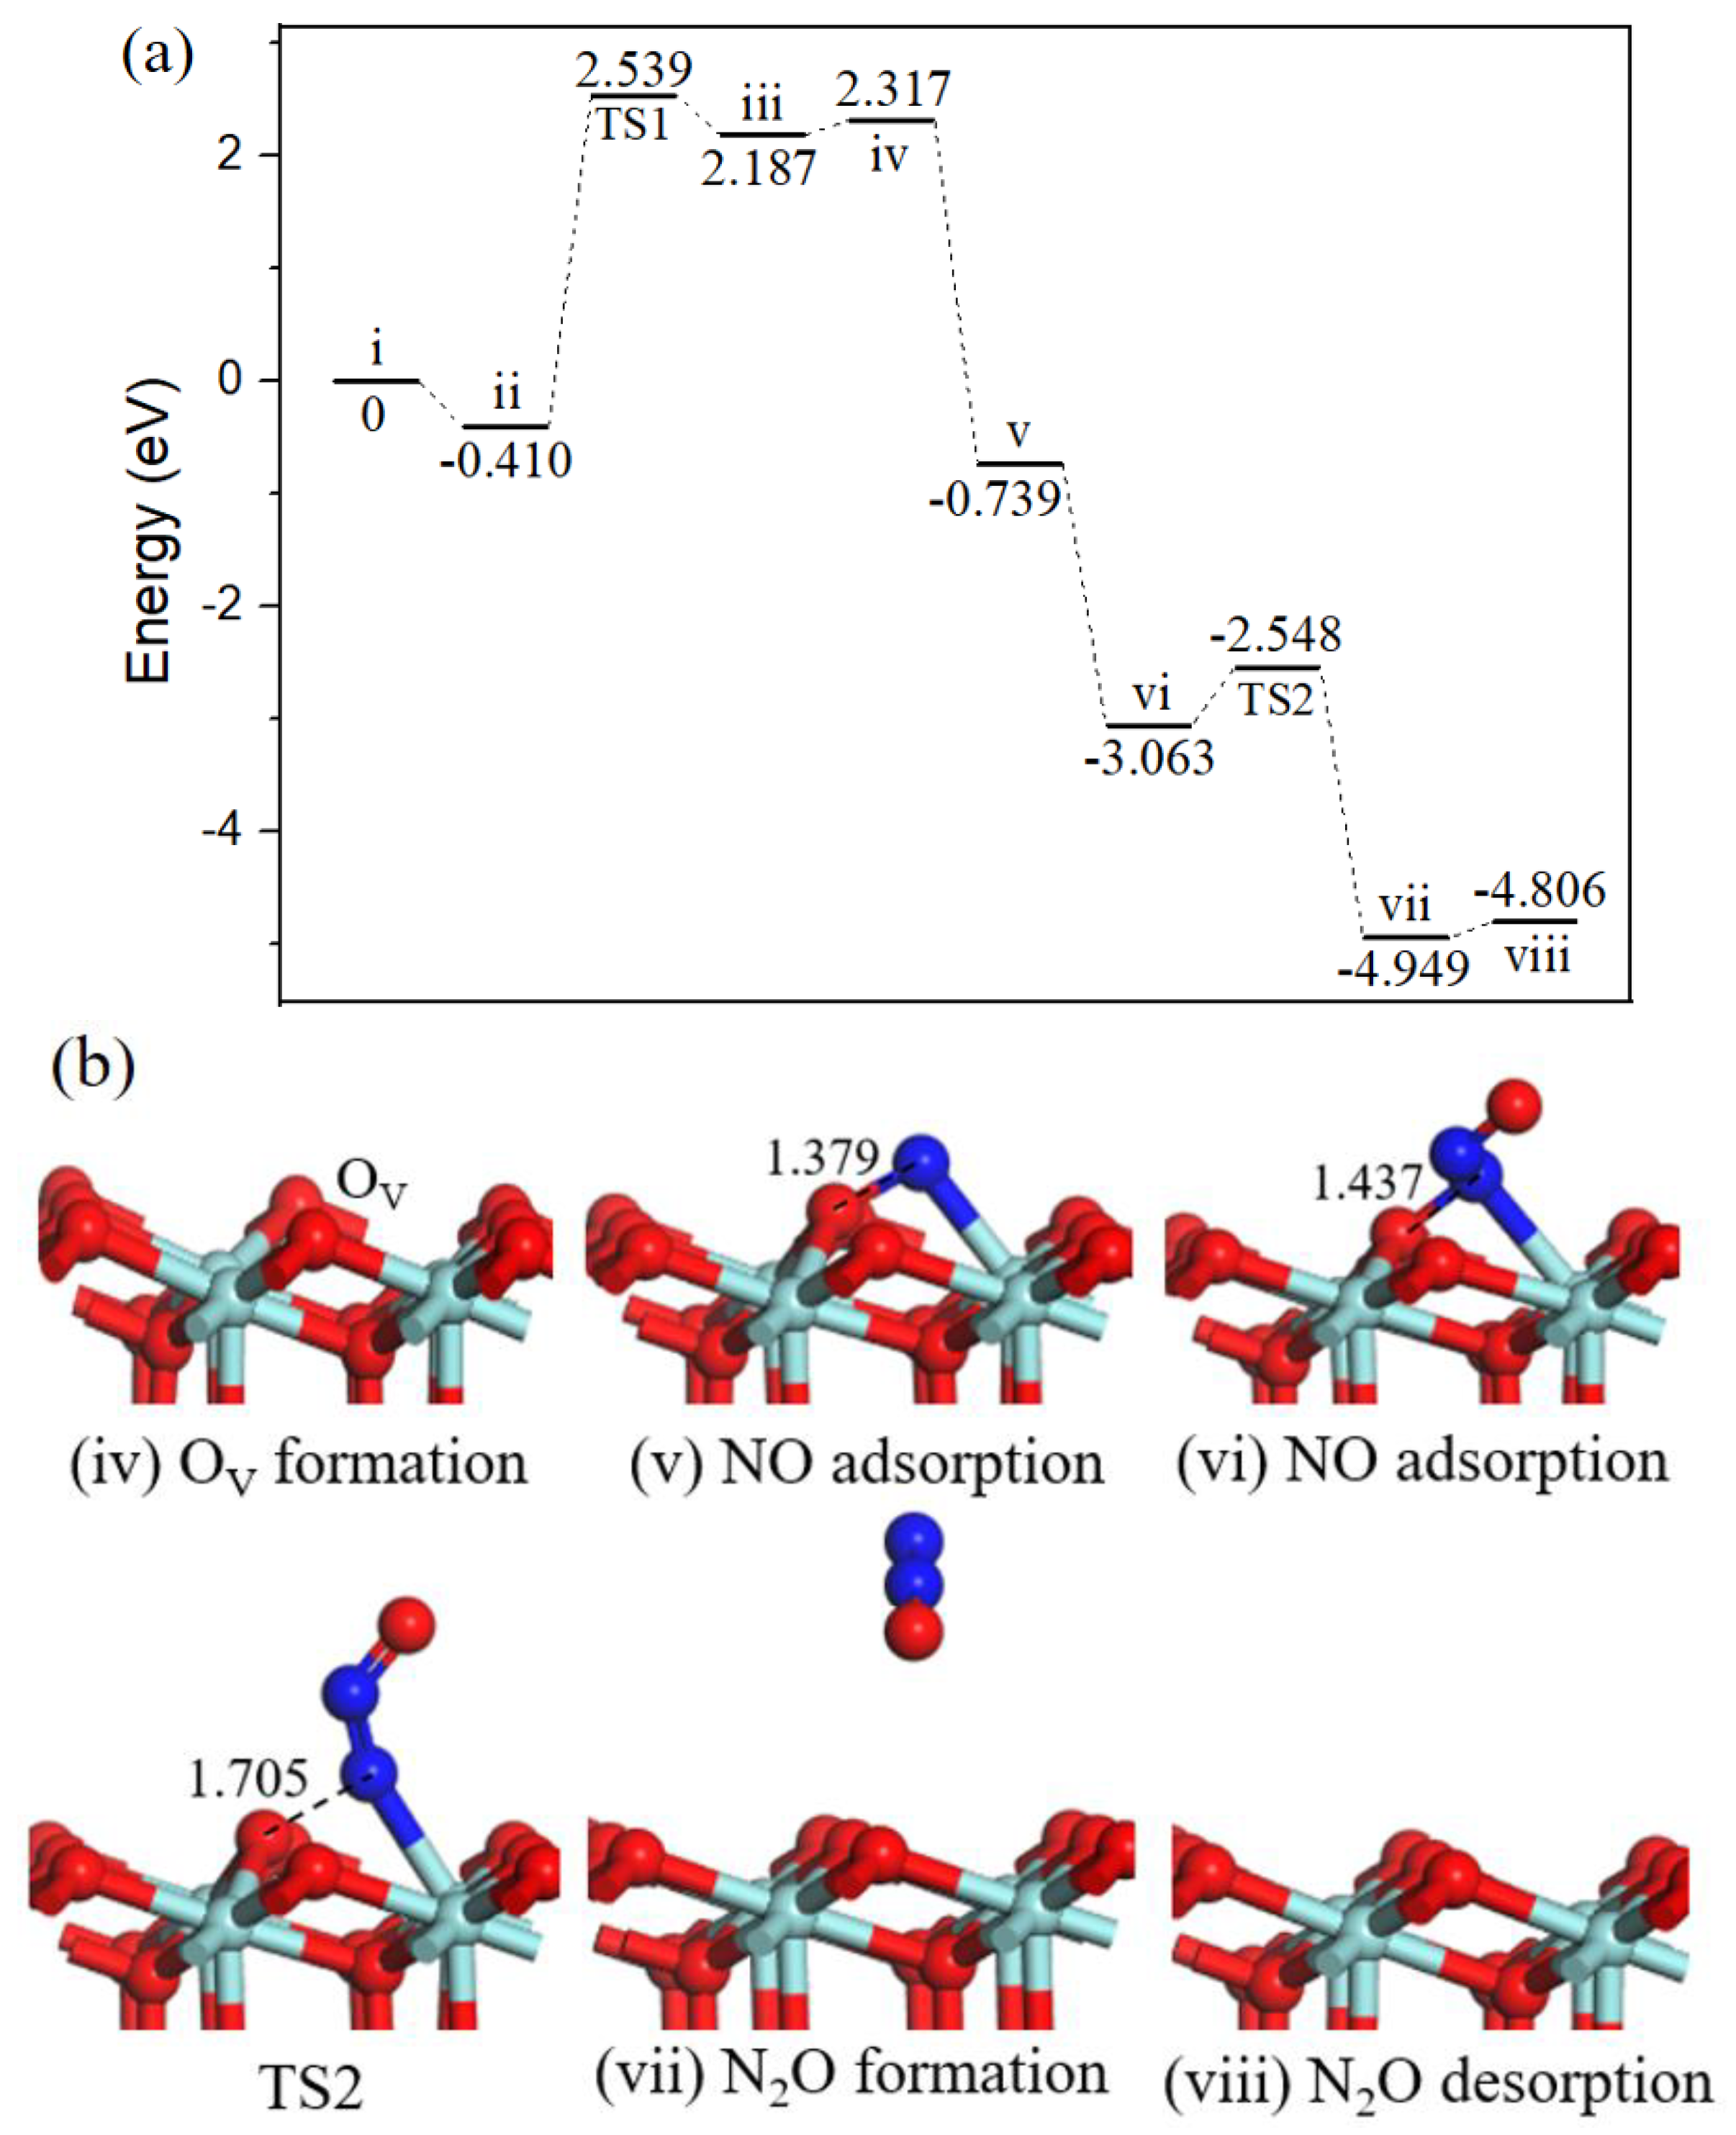
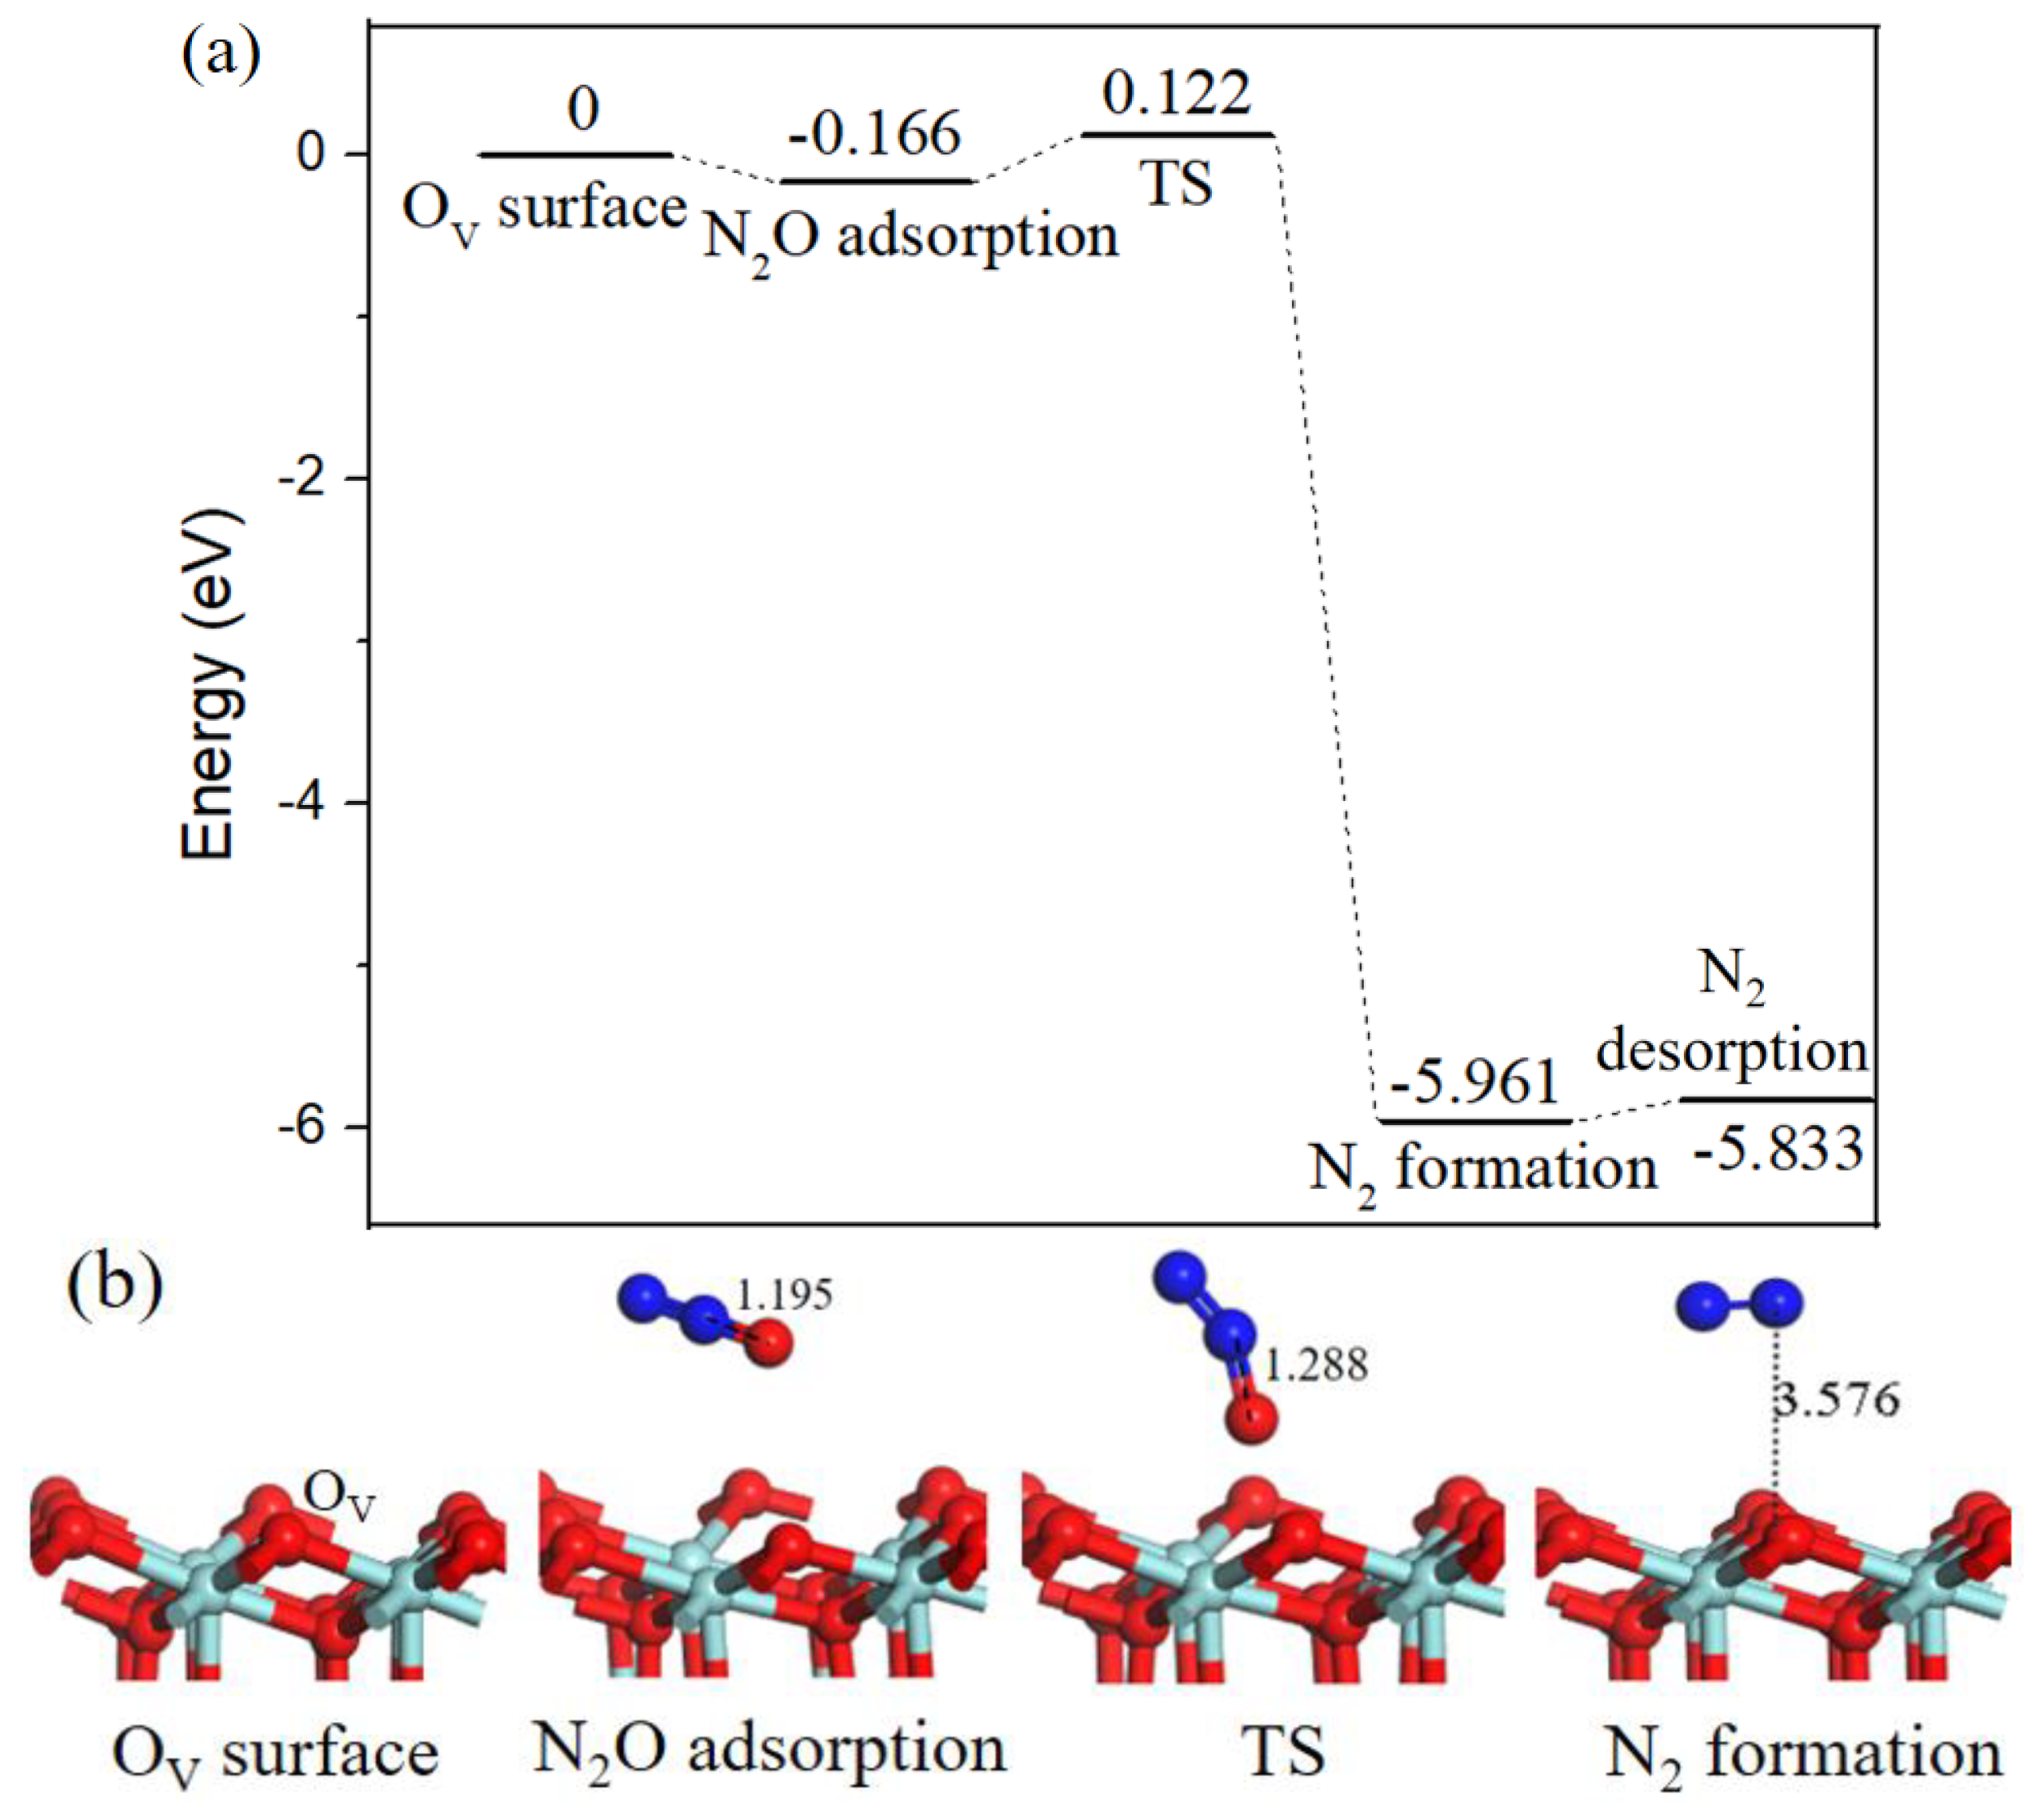
2.4.3. Mechanism involving N2O
3. Materials and Methods
4. Conclusions
Supplementary Materials
Author Contributions
Funding
Conflicts of Interest
References
- Taylor, K.C. Nitric Oxide Catalysis in Automotive Exhaust Systems. Catal. Rev. 1993, 35, 457–481. [Google Scholar] [CrossRef]
- Shelef, M.; Graham, G.W. Why Rhodium in Automotive Three-Way Catalysts? Catal. Rev. 1994, 36, 433–457. [Google Scholar] [CrossRef]
- Lin, J.; Ma, C.; Wang, Q.; Xu, Y.; Ma, G.; Wang, J.; Wang, H.; Dong, C.; Zhang, C.; Ding, M. Enhanced low-temperature performance of CO2 methanation over mesoporous Ni/Al2O3-ZrO2 catalysts. Appl. Catal. B Environ. 2019, 243, 262–272. [Google Scholar] [CrossRef]
- Romero-Sáez, M.; Dongil, A.B.; Benito, N.; Espinoza-González, R.; Escalona, N.; Gracia, F. CO2 methanation over nickel-ZrO2 catalyst supported on carbon nanotubes: A comparison between two impregnation strategies. Appl. Catal. B Environ. 2018, 237, 817–825. [Google Scholar] [CrossRef]
- Chen, C.; Ruan, C.; Zhan, Y.; Lin, X.; Zheng, Q.; Wei, K. The significant role of oxygen vacancy in Cu/ZrO2 catalyst for enhancing water-gas-shift performance. Int. J. Hydrog. Energy 2014, 39, 317–324. [Google Scholar] [CrossRef]
- Kauppinen, M.M.; Melander, M.M.; Bazhenov, A.S.; Honkala, K. Unraveling the Role of the Rh–ZrO2 Interface in the Water-Gas-Shift Reaction via a First-Principles Microkinetic Study. ACS Catal. 2018, 8, 11633–11647. [Google Scholar] [CrossRef] [Green Version]
- Yao, X.; Chen, L.; Cao, J.; Chen, Y.; Tian, M.; Yang, F.; Sun, J.; Tang, C.; Dong, L. Enhancing the deNOx performance of MnOx/CeO2-ZrO2 nanorod catalyst for low-temperature NH3-SCR by TiO2 modification. Chem. Eng. J. 2019, 369, 46–56. [Google Scholar] [CrossRef]
- Liu, S.; Wang, H.; Wei, Y.; Zhang, R.; Royer, S. Morphology-Oriented ZrO2-Supported Vanadium Oxide for the NH3-SCR Process: Importance of Structural and Textural Properties. ACS Appl. Mater. Interfaces 2019, 11, 22240–22254. [Google Scholar] [CrossRef]
- De Souza, P.M.; Rabelo-Neto, R.C.; Borges, L.E.P.; Jacobs, G.; Davis, B.H.; Graham, U.M.; Resasco, D.E.; Noronha, F.B. Effect of Zirconia Morphology on Hydrodeoxygenation of Phenol over Pd/ZrO2. ACS Catal. 2015, 5, 7385–7398. [Google Scholar] [CrossRef]
- Ohta, H.; Feng, B.; Kobayashi, H.; Hara, K.; Fukuoka, A. Selective hydrodeoxygenation of lignin-related 4-propylphenol into n-propylbenzene in water by Pt-Re/ZrO2 catalysts. Catal. Today 2014, 234, 139–144. [Google Scholar] [CrossRef] [Green Version]
- Okamoto, Y.; Gotoh, H. Copper-zirconia catalysts for NO□CO reactions. Catal. Today 1997, 36, 71–79. [Google Scholar] [CrossRef]
- Koga, H.; Hayashi, A.; Ato, Y.; Tada, K.; Hosokawa, S.; Tanaka, T.; Okumura, M. Effect of ceria and zirconia supports on NO reduction over platinum-group metal catalysts: A DFT study with comparative experiments. Catal. Today 2019, 332, 236–244. [Google Scholar] [CrossRef]
- Luo, M.F.; Zhong, Y.J.; Zhu, B.; Yuan, X.X.; Zheng, X.M. Temperature-programmed desorption study of NO and CO2 over CeO2 and ZrO2. Appl. Surf. Sci. 1997, 115, 185–189. [Google Scholar] [CrossRef]
- Sun, C.; Zhu, J.; Lv, Y.; Qi, L.; Liu, B.; Gao, F.; Sun, K.; Dong, L.; Chen, Y. Dispersion, reduction and catalytic performance of CuO supported on ZrO2-doped TiO2 for NO removal by CO. Appl. Catal. B Environ. 2011, 103, 206–220. [Google Scholar] [CrossRef]
- Zhao, B.; Ran, R.; Wu, X.; Weng, D.; Wu, X.; Huang, C. Comparative study of Mn/TiO2 and Mn/ZrO2 catalysts for NO oxidation. Catal. Commun. 2014, 56, 36–40. [Google Scholar] [CrossRef]
- Koga, H.; Tada, K.; Hayashi, A.; Ato, Y.; Okumura, M. High NOx Reduction Activity of an Ultrathin Zirconia Film Covering a Cu Surface: A DFT Study. Catal. Lett. 2017, 147, 1827–1833. [Google Scholar] [CrossRef]
- Kantcheva, M.; Samarskaya, O.; Ilieva, L.; Pantaleo, G.; Venezia, A.M.; Andreeva, D. In situ FT-IR investigation of the reduction of NO with CO over Au/CeO2-Al2O3 catalyst in the presence and absence of H2. Appl. Catal. B Environ. 2009, 88, 113–126. [Google Scholar] [CrossRef] [Green Version]
- Sica, A.M.; Gigola, C.E. Interaction of CO, NO and NO/CO over Pd/γ-Al2O3 and Pd-WOx/γ-Al2O3 catalysts. Appl. Catal. A Gen. 2003, 239, 121–139. [Google Scholar] [CrossRef]
- Jin, X.; Huai, L.-Y.; Wen, H.; Yi, W.-C.; Liu, J.-Y. Reduction of NO with CO on the Co3O4(110)-B and CoO(110) Surfaces: A First-Principles Study. J. Phys. Chem. C 2019, 123, 1770–1778. [Google Scholar] [CrossRef]
- Gao, H. Theoretical analysis of CO+NO reaction mechanism on the single Pd atom embedded in γ-Al2O3 (110) surface. Appl. Catal. A Gen. 2017, 529, 156–166. [Google Scholar] [CrossRef]
- Carlotto, S.; Natile, M.M.; Glisenti, A.; Vittadini, A. Catalytic Mechanisms of NO Reduction in a CO–NO Atmosphere at Co- and Cu-Doped SrTiO3(100) Surfaces. J. Phys. Chem. C 2018, 122, 449–454. [Google Scholar] [CrossRef]
- Mars, P.; van Krevelen, D.W. Oxidations carried out by means of vanadium oxide catalysts. Chem. Eng. Sci. 1954, 3, 41–59. [Google Scholar] [CrossRef]
- Howard, C.J.; Hill, R.J.; Reichert, B.E. Structures of ZrO2 polymorphs at room temperature by high-resolution neutron powder diffraction. Acta Crystallogr. Sect. B 1988, 44, 116–120. [Google Scholar] [CrossRef]
- Song, W.; Hensen, E.J.M. A computational DFT study of CO oxidation on a Au nanorod supported on CeO2(110): On the role of the support termination. Catal. Sci. Technol. 2013, 3, 3020–3029. [Google Scholar] [CrossRef]
- Liang, L.; Dang, S.; Gao, Y. Preparation of cubic ZrO2 ultrafine powders and characterization of their catalytic properties for CO total oxidation. J. Fudan Univ. Nat. Sci. 2003, 266–269. (In Chinese) [Google Scholar] [CrossRef]
- Liang, L.; Dang, S.; Gao, Y. Preparation of cubic ZrO2 ultrafine powders and characterization of their catalytic properties for CO complete oxidation. Acta Pet. Sin. Pet. Process. Sect. 2003, 70–75. (In Chinese) [Google Scholar]
- Carlotto, S.; Natile, M.M.; Glisenti, A.; Paul, J.-F.; Blanck, D.; Vittadini, A. Energetics of CO oxidation on lanthanide-free perovskite systems: The case of Co-doped SrTiO3. Phys. Chem. Chem. Phys. 2016, 18, 33282–33286. [Google Scholar] [CrossRef]
- Azad, S.; Szanyi, J.; Peden, C.H.F.; Wang, L.Q. Adsorption and reaction of NO on oxidized and reduced SrTiO3(100) surfaces. J. Vac. Sci. Technol. A 2003, 21, 1307–1311. [Google Scholar] [CrossRef]
- Rodriguez, J.A.; Azad, S.; Wang, L.Q.; García, J.; Etxeberria, A.; González, L. Electronic and chemical properties of mixed-metal oxides: Adsorption and reaction of NO on SrTiO3(100). J. Chem. Phys. 2003, 118, 6562–6571. [Google Scholar] [CrossRef]
- Zhu, J.; Xiao, D.; Li, J.; Yang, X.; Wu, Y. Mechanism of NO decomposition on perovskite (-like) catalysts. Chin. Sci. Bull. 2005, 50, 707–710. [Google Scholar] [CrossRef]
- Fritz, A.; Pitchon, V. The current state of research on automotive lean NOx catalysis. Appl. Catal. B Environ. 1997, 13, 1–25. [Google Scholar] [CrossRef]
- Liu, J.; Wang, L.; Song, W.; Zhao, M.; Liu, J.; Wang, H.; Zhao, Z.; Xu, C.; Duan, Z. BiMOx Semiconductors as Catalysts for Photocatalytic Decomposition of N2O: A Combination of Experimental and DFT+U Study. ACS Sustain. Chem. Eng. 2019, 7, 2811–2820. [Google Scholar] [CrossRef]
- Tan, L.; Huang, L.; Liu, Y.; Wang, Q. Detailed mechanism of the NO+CO reaction on Rh(100) and Rh(111): A first-principles study. Appl. Surf. Sci. 2018, 444, 276–286. [Google Scholar] [CrossRef]
- Zhang, J.; Gong, X.; Lu, G. DFT + U study of the CO + NOx reaction on a CeO2(110)-supported Au nanoparticle. Chin. J. Catal. 2014, 35, 1305–1317. [Google Scholar] [CrossRef]
- Delley, B. An all-electron numerical method for solving the local density functional for polyatomic molecules. J. Chem. Phys. 1990, 92, 508–517. [Google Scholar] [CrossRef]
- Delley, B. From molecules to solids with the DMol3 approach. J. Chem. Phys. 2000, 113, 7756–7764. [Google Scholar] [CrossRef]
- Perdew, J.P.; Wang, Y. Accurate and simple analytic representation of the electron-gas correlation energy. Phys. Rev. B 1992, 45, 13244–13249. [Google Scholar] [CrossRef]
- Elber, R.; Karplus, M. A method for determining reaction paths in large molecules: Application to myoglobin. Chem. Phys. Lett. 1987, 139, 375–380. [Google Scholar] [CrossRef]
- Halgren, T.A.; Lipscomb, W.N. The synchronous-transit method for determining reaction pathways and locating molecular transition states. Chem. Phys. Lett. 1977, 49, 225–232. [Google Scholar] [CrossRef]
- Monkhorst, H.J.; Pack, J.D. Special points for Brillouin-zone integrations. Phys. Rev. B 1976, 13, 5188–5192. [Google Scholar] [CrossRef]
- Irikura, K.K. Systematic Errors in ab Initio Bond Dissociation Energies. J. Phys. Chem. A 1998, 102, 9031–9039. [Google Scholar] [CrossRef]


| Gas Molecule | Adsorption Site | Eads (eV) | Figure | |
|---|---|---|---|---|
| CO | C-end | ZrT | −0.676 | 1(c) |
| OT | −0.675 | - | ||
| Ob | −0.227 | - | ||
| O-end | ZrT | −0.359 | 1(d) | |
| OT | −0.257 | - | ||
| Ob | −0.231 | - | ||
| NO | N-end | ZrT | −0.788 | 1(e) |
| OT | −0.776 | - | ||
| Ob | −0.253 | - | ||
| O-end | ZrT | −0.575 | 1(f) | |
| OT | −0.290 | - | ||
| Ob | −0.047 | - | ||
| Gas Molecule | Adsorption site | Eads (eV) | Figure | |
|---|---|---|---|---|
| CO | C-end | ZrT | −0.410 | 5(c) |
| OT | −0.129 | - | ||
| OH | −0.160 | - | ||
| O-end | ZrT | −0.162 | 5(d) | |
| OT | −0.133 | - | ||
| OH | −0.154 | - | ||
| NO | N-end | ZrT | −0.041 | 5(e) |
| OT | 0.078 | - | ||
| OH | 0.046 | - | ||
| O-end | ZrT | 0.054 | 5(f) | |
| OT | 0.076 | - | ||
| OH | 0.055 | - | ||
© 2019 by the authors. Licensee MDPI, Basel, Switzerland. This article is an open access article distributed under the terms and conditions of the Creative Commons Attribution (CC BY) license (http://creativecommons.org/licenses/by/4.0/).
Share and Cite
Cao, X.; Zhang, C.; Wang, Z.; Sun, X. Catalytic Reaction Mechanism of NO–CO on the ZrO2 (110) and (111) Surfaces. Int. J. Mol. Sci. 2019, 20, 6129. https://doi.org/10.3390/ijms20246129
Cao X, Zhang C, Wang Z, Sun X. Catalytic Reaction Mechanism of NO–CO on the ZrO2 (110) and (111) Surfaces. International Journal of Molecular Sciences. 2019; 20(24):6129. https://doi.org/10.3390/ijms20246129
Chicago/Turabian StyleCao, Xuesong, Chenxi Zhang, Zehua Wang, and Xiaomin Sun. 2019. "Catalytic Reaction Mechanism of NO–CO on the ZrO2 (110) and (111) Surfaces" International Journal of Molecular Sciences 20, no. 24: 6129. https://doi.org/10.3390/ijms20246129