Article

Molecular Mechanisms Underlying Increase in Lysine Content of Waxy Maize through the Introgression of the opaque2 Allele

1
The Key Laboratory of Plant Resources Conservation and Germplasm Innovation in Mountainous Region (Ministry of Education), Institute of Agro-Bioengineering and College of Life Sciences, Guizhou University, Guiyang 550025, China
2
The State Key Laboratory Breeding Base of Green Pesticide and Agricultural Bioengineering, Guizhou University, Guiyang 550025, China
3
Guizhou Institute of Upland Food Crops, Guizhou Academy of Agricultural Sciences, Guiyang 550006, China
*
Authors to whom correspondence should be addressed.
These authors contributed equally to this work.
Int. J. Mol. Sci. 2019, 20(3), 684; https://doi.org/10.3390/ijms20030684
Submission received: 29 December 2018 / Revised: 30 January 2019 / Accepted: 1 February 2019 / Published: 5 February 2019
(This article belongs to the Special Issue Transcriptional and Post-transcriptional Gene Regulation in Plants)

Abstract

:
The opaque2 (o2) mutation in maize is associated with high lysine content in endosperm and good nutritional value. To improve the nutritional quality of waxy maize, the o2 allele was introgressed into the wxwx line using marker-assisted backcrossing selection technology. The lysine content of o2o2wxwx lines was higher than that of the wxwx line. To reveal the mechanism of increasing lysine content through introgression of the o2 in waxy maize, the transcriptome on kernels (18th day after pollination) of the o2o2wxwx and parent lines was analyzed using RNA-sequencing (RNA-Seq). The RNA-Seq analysis revealed 49 differentially expressed genes (DEGs). Functional analysis showed that these DEGs were mostly related to the catalytic activity and metabolic processes. The O2 gene regulated multiple metabolic pathways related to biological processes (BP) and molecular function (MP) during waxy maize endosperm development. In particular, in the o2o2wxwx lines, the two genes that encode the EF-1α and LHT1 were up-regulated, but the gene that encodes sulfur-rich proteins was down-regulated, raising the grain lysine content. These findings are of great importance for understanding the molecular mechanism underlying the lysine content increase due to o2 allele introgression into waxy maize.

1. Introduction

Corn (Zea mays L.) is one of the main fodder and food crops. The quality and taste of corn can directly affect healthy development in humans, livestock, and poultry. Lysine is an essential amino acid for monogastric animals such as humans, livestock, and poultry, and the amylopectin content in starch is closely related to food quality. In corn, the waxy (wx) mutation can increase grain amylopectin content to improve the eating quality, while the opaque2 (o2) mutation can increase the lysine content to improve the nutritional quality. The lysine content in normal corn (<0.3%) is lower than the nutritional quality required for human consumption and food processing (>0.5%; the index was recommended by Food and Agriculture Organization of the United Nations (FAO), and the World Health Organization (WHO)) [1]. In 1964, Mertz et al. found that the o2 mutation could significantly increase the lysine content of corn endosperm [2]. The Opaque2 (O2) gene is located on the short arm of chromosome 7, and encodes a leucine zipper family transcription factor. This factor contains a basic domain (ACGT) that activates the expression of 22 kDa α-zein and 15 kDa β-zein genes [3]. The domain can also directly or indirectly regulate other non-zein protein genes, such as b-32 and b-70 [4]. Meanwhile, waxy corn, which possesses a good eating quality, was first found in China [5,6,7]. Collins described the characteristics of waxy corn for the first time in 1909 [8]: The grain was dark, smooth, and waxy, and the endosperm was composed of 95–100% amylopectin. The Waxy1 (Wx) gene is located on the long arm of chromosome 9, and encodes granule-bound starch synthase I (GBSS-I). Additionally, it determines the amylose synthesis in maize endosperm and pollen [9,10,11,12,13]. The mutated endosperm was caused by genetic drift and its lysine content was not high enough (0.24–0.34%) to meet the nutritional quality requirements for human consumption and food processing [14].
To improve the nutritional quality for waxy corn, Misra et al. integrated the wx and o2 genes into four inbred lines–Oh43, W64A, B37, and C103–with lysine and free amino acids being higher in the double mutants (o2wx) compared to the corresponding single mutants [15]. Zhang et al. acquired 18 high-quality maize inbred lines containing wx and o2 genes that had lysine contents ranging from 0.36–0.54%; these were 1.15–27.06% higher than the lysine contents of the original parent lines [16]. Yang et al. integrated o16 and wx genes to obtain 13 corn families; the lysine contents of these corn families were at least 16% higher than those of their original parents [17]. The literature indicates that lysine content can be increased without affecting the waxy property, through combining high-lysine genes and waxy genes [18]. The introgression of the o2 gene into normal corn with different genetic backgrounds caused different degrees of transcriptional modifications [19]. The o2 gene altered the physiological, biochemical, and proteomic properties of corn to some extent [14]; with the introgression of o2 not only reducing the accumulation of prolamin, but also altering the expression of endosperm proteins associated with amino acids, biosynthesis, starch, stress response, and signal transduction [14,20]. However, the underlying molecular mechanisms of the o2 gene that result in an increase in the lysine content of corn remain unknown.
In this study, an o2 gene was introgressed into waxy corn by backcrossing using the marker-assisted backcrossing selection (MABS) technology. After foreground and background selections, two o2o2wxwx double recessive inbred lines, QCL8004_1 and QCL8004_2, were acquired. To understand the regulatory transcriptional network of waxy corn after o2 gene introgression, kernels at 18 days after pollination (18th DAP) were used for transcriptional sequencing analysis. The transcriptional differences between the double recessive mutants (o2o2wxwx) and the waxy parent (wxwx) were compared. These results provide a foundation for studying the underlying molecular mechanisms of the o2 gene introgression-driven improvements in lysine and tryptophan content.

2. Results

2.1. The Kernel Morphological Characteristics and Lysine Content of Pyramided Progenies

In this study, the grain phenotype and endosperm cross section of o2o2wxwx mutant lines and their recurrent parent were observed under natural light. The results showed that grain seeds of the recurrent parent and o2o2wxwx mutant were smooth, opaque, and waxy (Figure 1A,B). Meanwhile, there was a slight increase in the amount of farinaceous endosperm compared to the recurrent parent QCL5013 (Figure 1C). Two markers of simple sequence repeats (SSR) markers umc1066 and phi027 were used for o2 and wx genes verifications, and were introgressed into QCL8004_1 and QCL8004_2 (Figure 1D). Under scanning electron microscopy (SEM), the starch granules of QCL8004_1 and QCL8004_2 had an irregular shape and arrangement, with a high density of matrix proteins that dispersed in the gap between starch granules, while those of QCL5013 and Tai19 were mostly elliptical and relatively smooth (Figure 1E).
Lysine contents of QCL8004_1 and QCL8004_2, detected on mature kernels from the Inspection and Testing Center for Quality of Cereals and their Products, the Ministry of Agriculture and Rural Affairs of the People’s Republic of China, were 0.37% and 0.38%, respectively (Table 1). These values were higher than those of QCL5013 by 15.63% and 18.75%, respectively; meanwhile, their amylopectin contents of mature kernels were above 98%, which was equivalent to the recurrent parent (Table 1).

2.2. The Recovery Rate of the Genetic Background of o2o2wxwx Lines

In total, 55,229 single nucleotide polymorphism (SNP) markers were incorporated into the 55K SNP chip (Table S1), and 15,514 polymorphic SNPs were found between Tai19 (o2o2) and QCL5013 (wxwx). Based on the SNP markers, the genetic background recovery rates of QCL8004_1 and QCL8004_2 were 93.16% and 93.28%, respectively, which were higher than the theoretical rate (87.50%). Moreover, the background recovery rates of QCL8004_1 chromosomes based on the SNP markers ranged from 88.68–95.83% and the average rate was 93.54%. In comparison, the recovery rates of QCL8004_2 chromosomes ranged from 83.04–95.85% and the average rate was 93.23% (Figure 2A). These data indicate that QCL8004_1 and QCL8004_2 show higher background recovery rates than the theoretical rate (87.50%).
The chromosome recombination frequencies in the o2o2wxwx double recessive mutants were calculated by Graphical GenoTypes (GGT32). The results, shown in Figures S1 and S2, demonstrated that the recombination rates of different chromosomes differed slightly, and were relatively higher in chromosomes 1 (chr1) and 7 (chr7) (Figure 2B). Meanwhile, the recombinant fragment distributions in each chromosome of QCL8004_1 and QCL8004_2 differed slightly. Those fragments were relatively concentrated in chromosomes 1 (chr1), 3 (chr3), 4 (chr4), 6 (chr6), and 7 (chr7). In chr1, fragments were mainly concentrated in AX-86241431 (SNP, physical locations, 241.59 MB) to AX-90605656 (250.24 MB), and AX-91422403 (281.79 MB) to AX-90728414 (282.73 MB). In chr3, fragments were mainly concentrated in AX-91553625 (0.20 MB) to AX-91554402 (4.36 MB), and AX-91412879 (187.01 MB) to AX-90849007 (199.93 MB). In chr4, fragments were mainly concentrated in AX-91630097 (170.66 MB) to AX-86313874 (176.16 MB). In chr6, fragments were mainly concentrated in AX-86259944 (7.75 MB) to AX-90587704 (8.77 MB), and AX-90989242 (45.05 MB) to AX-91690814 (50.15 MB). In chr7, fragments were mainly concentrated in AX-91040704 (68.48 MB) to AX-123945296 (88.11 MB), and AX-86252028 (113.54 MB) to AX-91055672 (124.07 MB). This was related to the o2 gene from the donor parent and the directional selection of high lysine.

2.3. The Quality of RNA-Seq and Biological Replicates

RNA-seq analysis showed that each sample generated an average of 22,962,789 clean reads (Table S2), the average mapping ratio to the reference gene was 81.77% (Table S3), and the average mapping ratio to the reference genome was 90.31% (Table S4). After quality control, the average Q20 (the percentage of the number of bases with a sequencing base mass value greater than 20 in the total number of bases in the original data) of all samples was 95.86% and the average Q30 (the percentage of the number of bases with a sequencing base mass value greater than 30 in the total number of bases in the original data) was 86.50% (Table S5), indicating good quality control and high utilization of sequencing data.
Quantitative expression analysis of the sequenced genes was presented as fragments per kilobase million (FPKM; Table S6). Overall, 28307, 28451, 28128, and 29061 genes were detected in QCL5013, QCL8004_1, QCL8004_2, and Tai19, respectively, accounting for 71.67%, 72.03%, 71.21%, and 73.58% of the total genes of corn (Figure 3), indicating that most genes were covered.
Correlation among the three replicates of each sample was calculated according to the FPKM quantification result. The correlation coefficients of QCL5013, QCL8004_1, QCL8004_2, and Tai19 were 0.9778, 0.9897, 0.9746, and 0.9962 (Figure S3), respectively, indicating that the transcriptional sequencing data of the three replicates for each sample could be further analyzed.

2.4. Identification of Differentially Expressed Genes

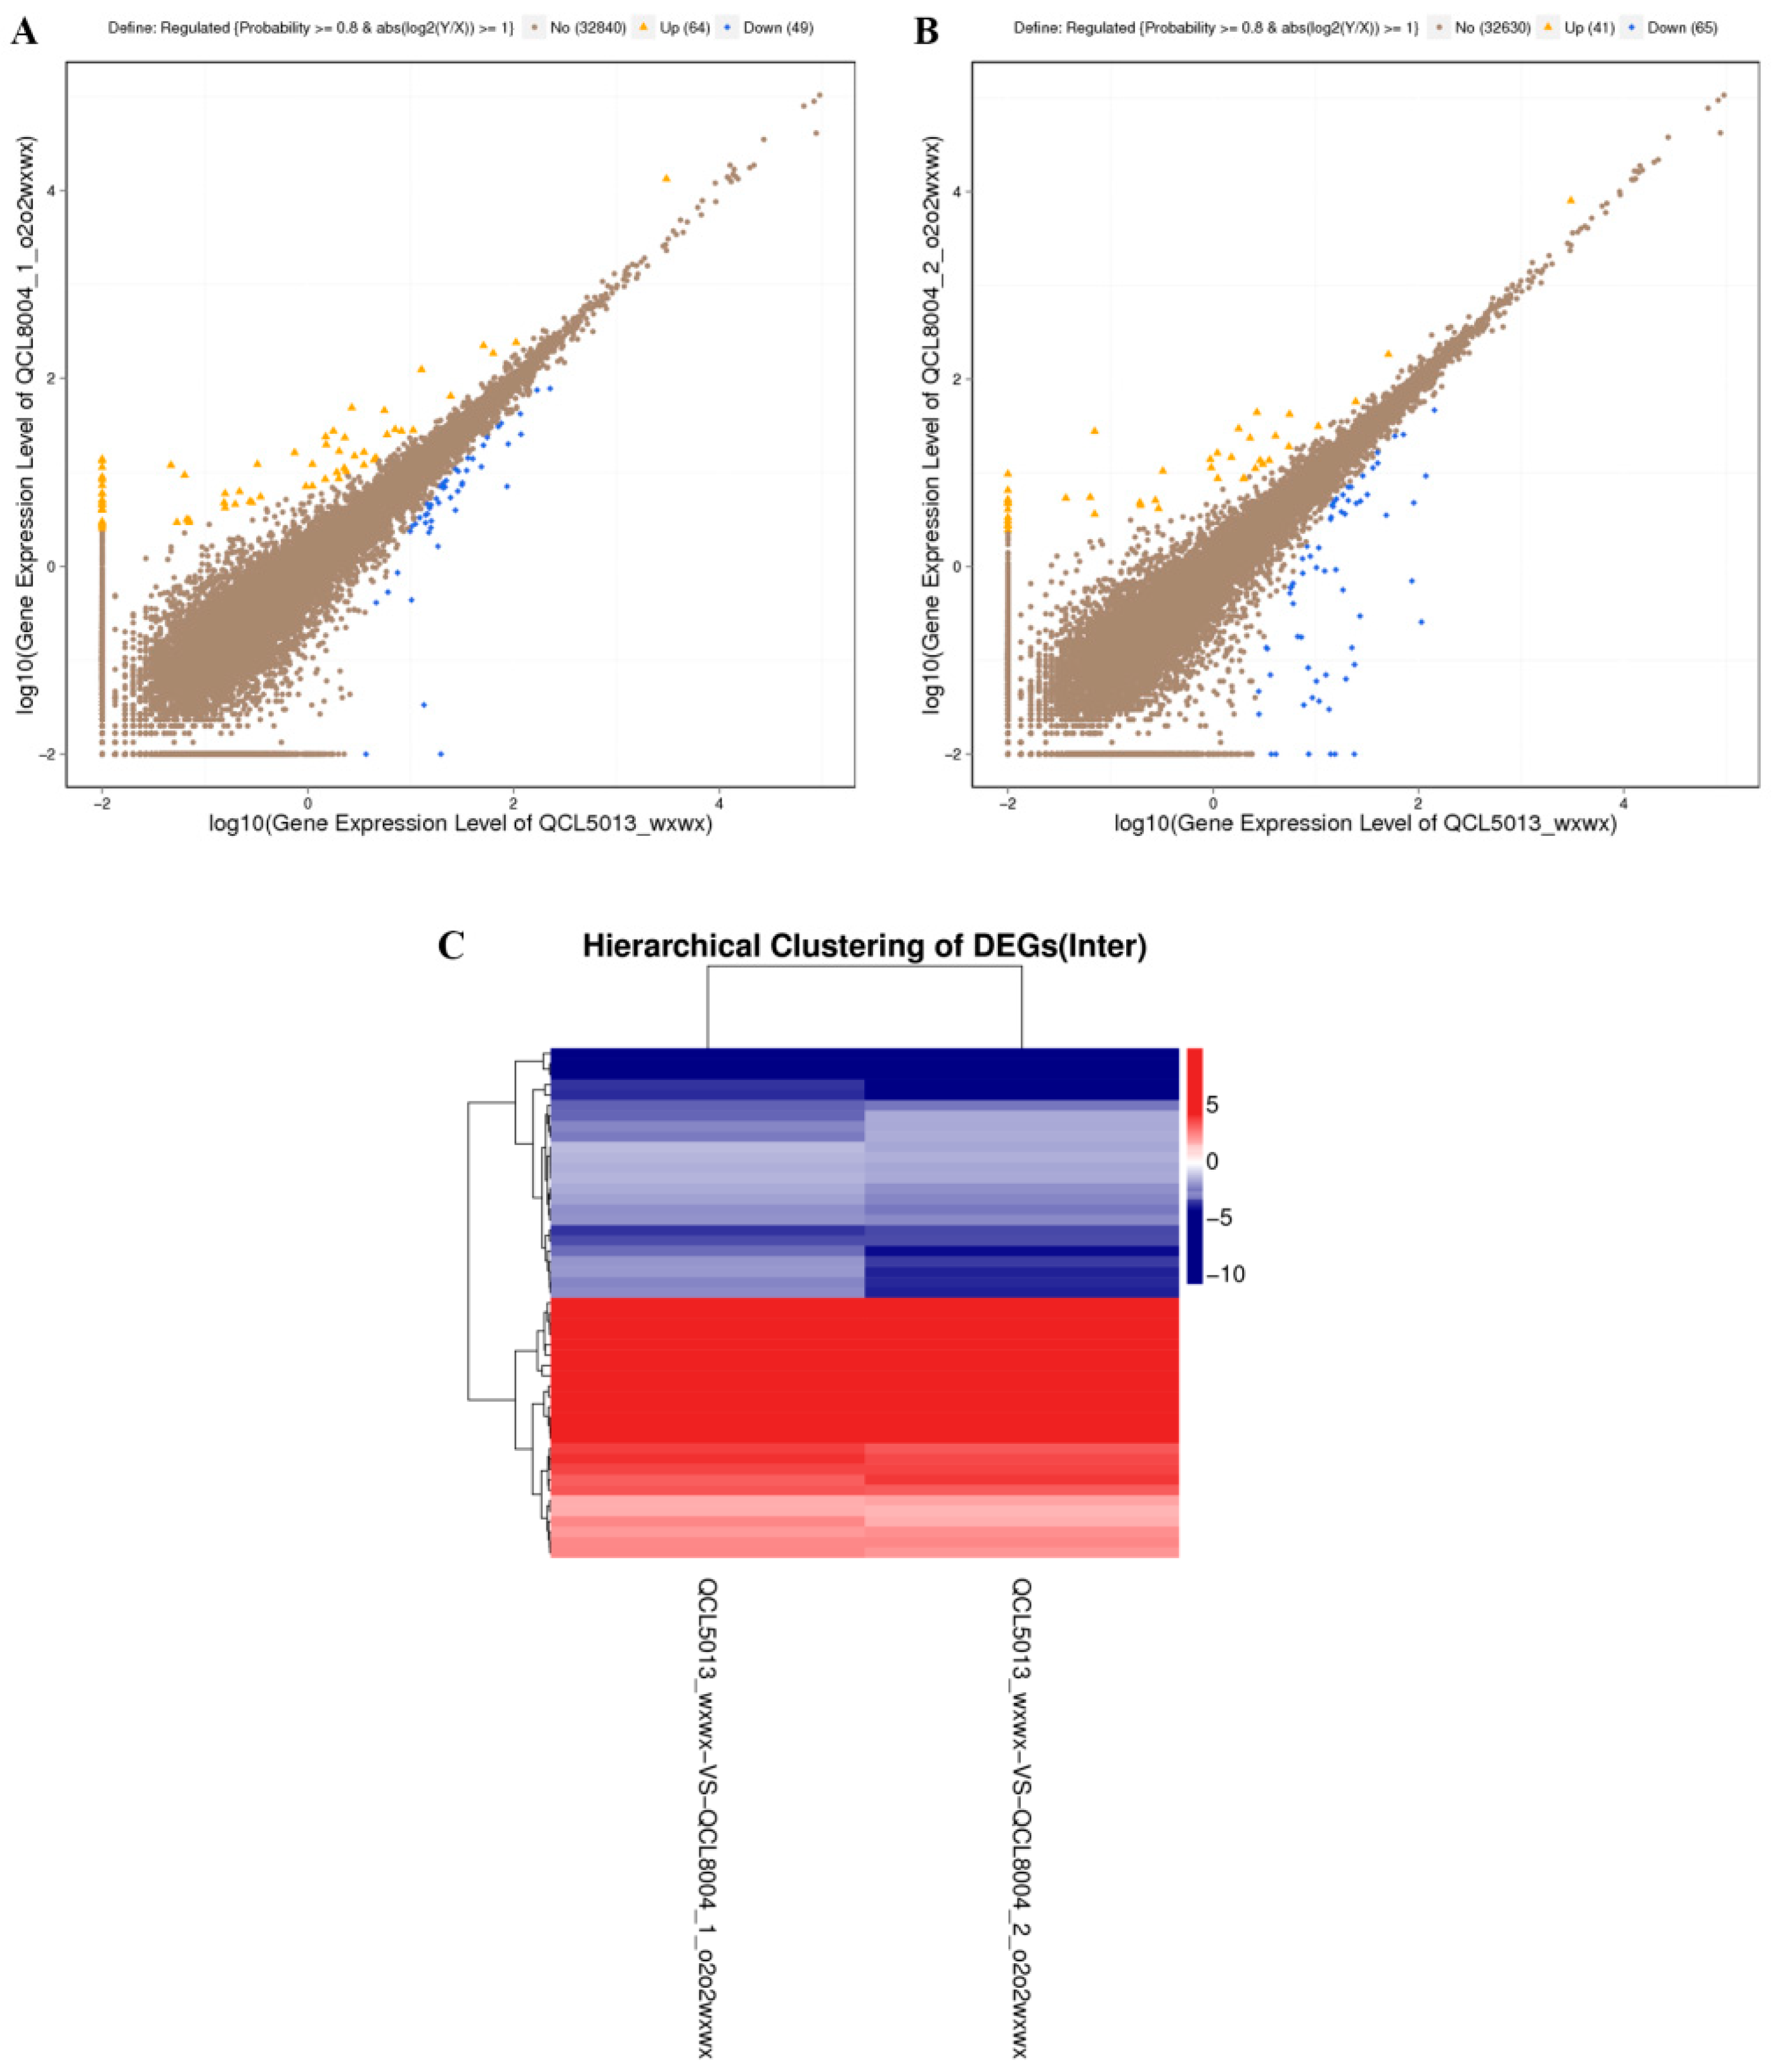
The differentially expressed genes (DEGs) between QCL8004_1, QCL8004_2, and the recurrent parent QCL5013 were analyzed using NOISeq and were hierarchically clustered using Cluster. Compared with their recurrent parent QCL5013, 113 DEGs, including 49 down-regulated and 64 up-regulated genes, were detected in QCL8004_1 (Figure 4A), while 106 DEGs, including 65 down-regulated and 41 up-regulated genes, were detected in QCL8004_2 (Figure 4B). To further reduce the differences caused by different background recovery rates and genetic recombination, the intersection of DEGs (including 25 up-regulated and 24 down-regulated genes) in QCL8004_1 and QCL8004_2 was acquired. This method filtered the most irrelevant DEGs (Figure 4C), allowing for further analysis of actual DEGs.

2.5. GO Annotation and KEGG Analysis

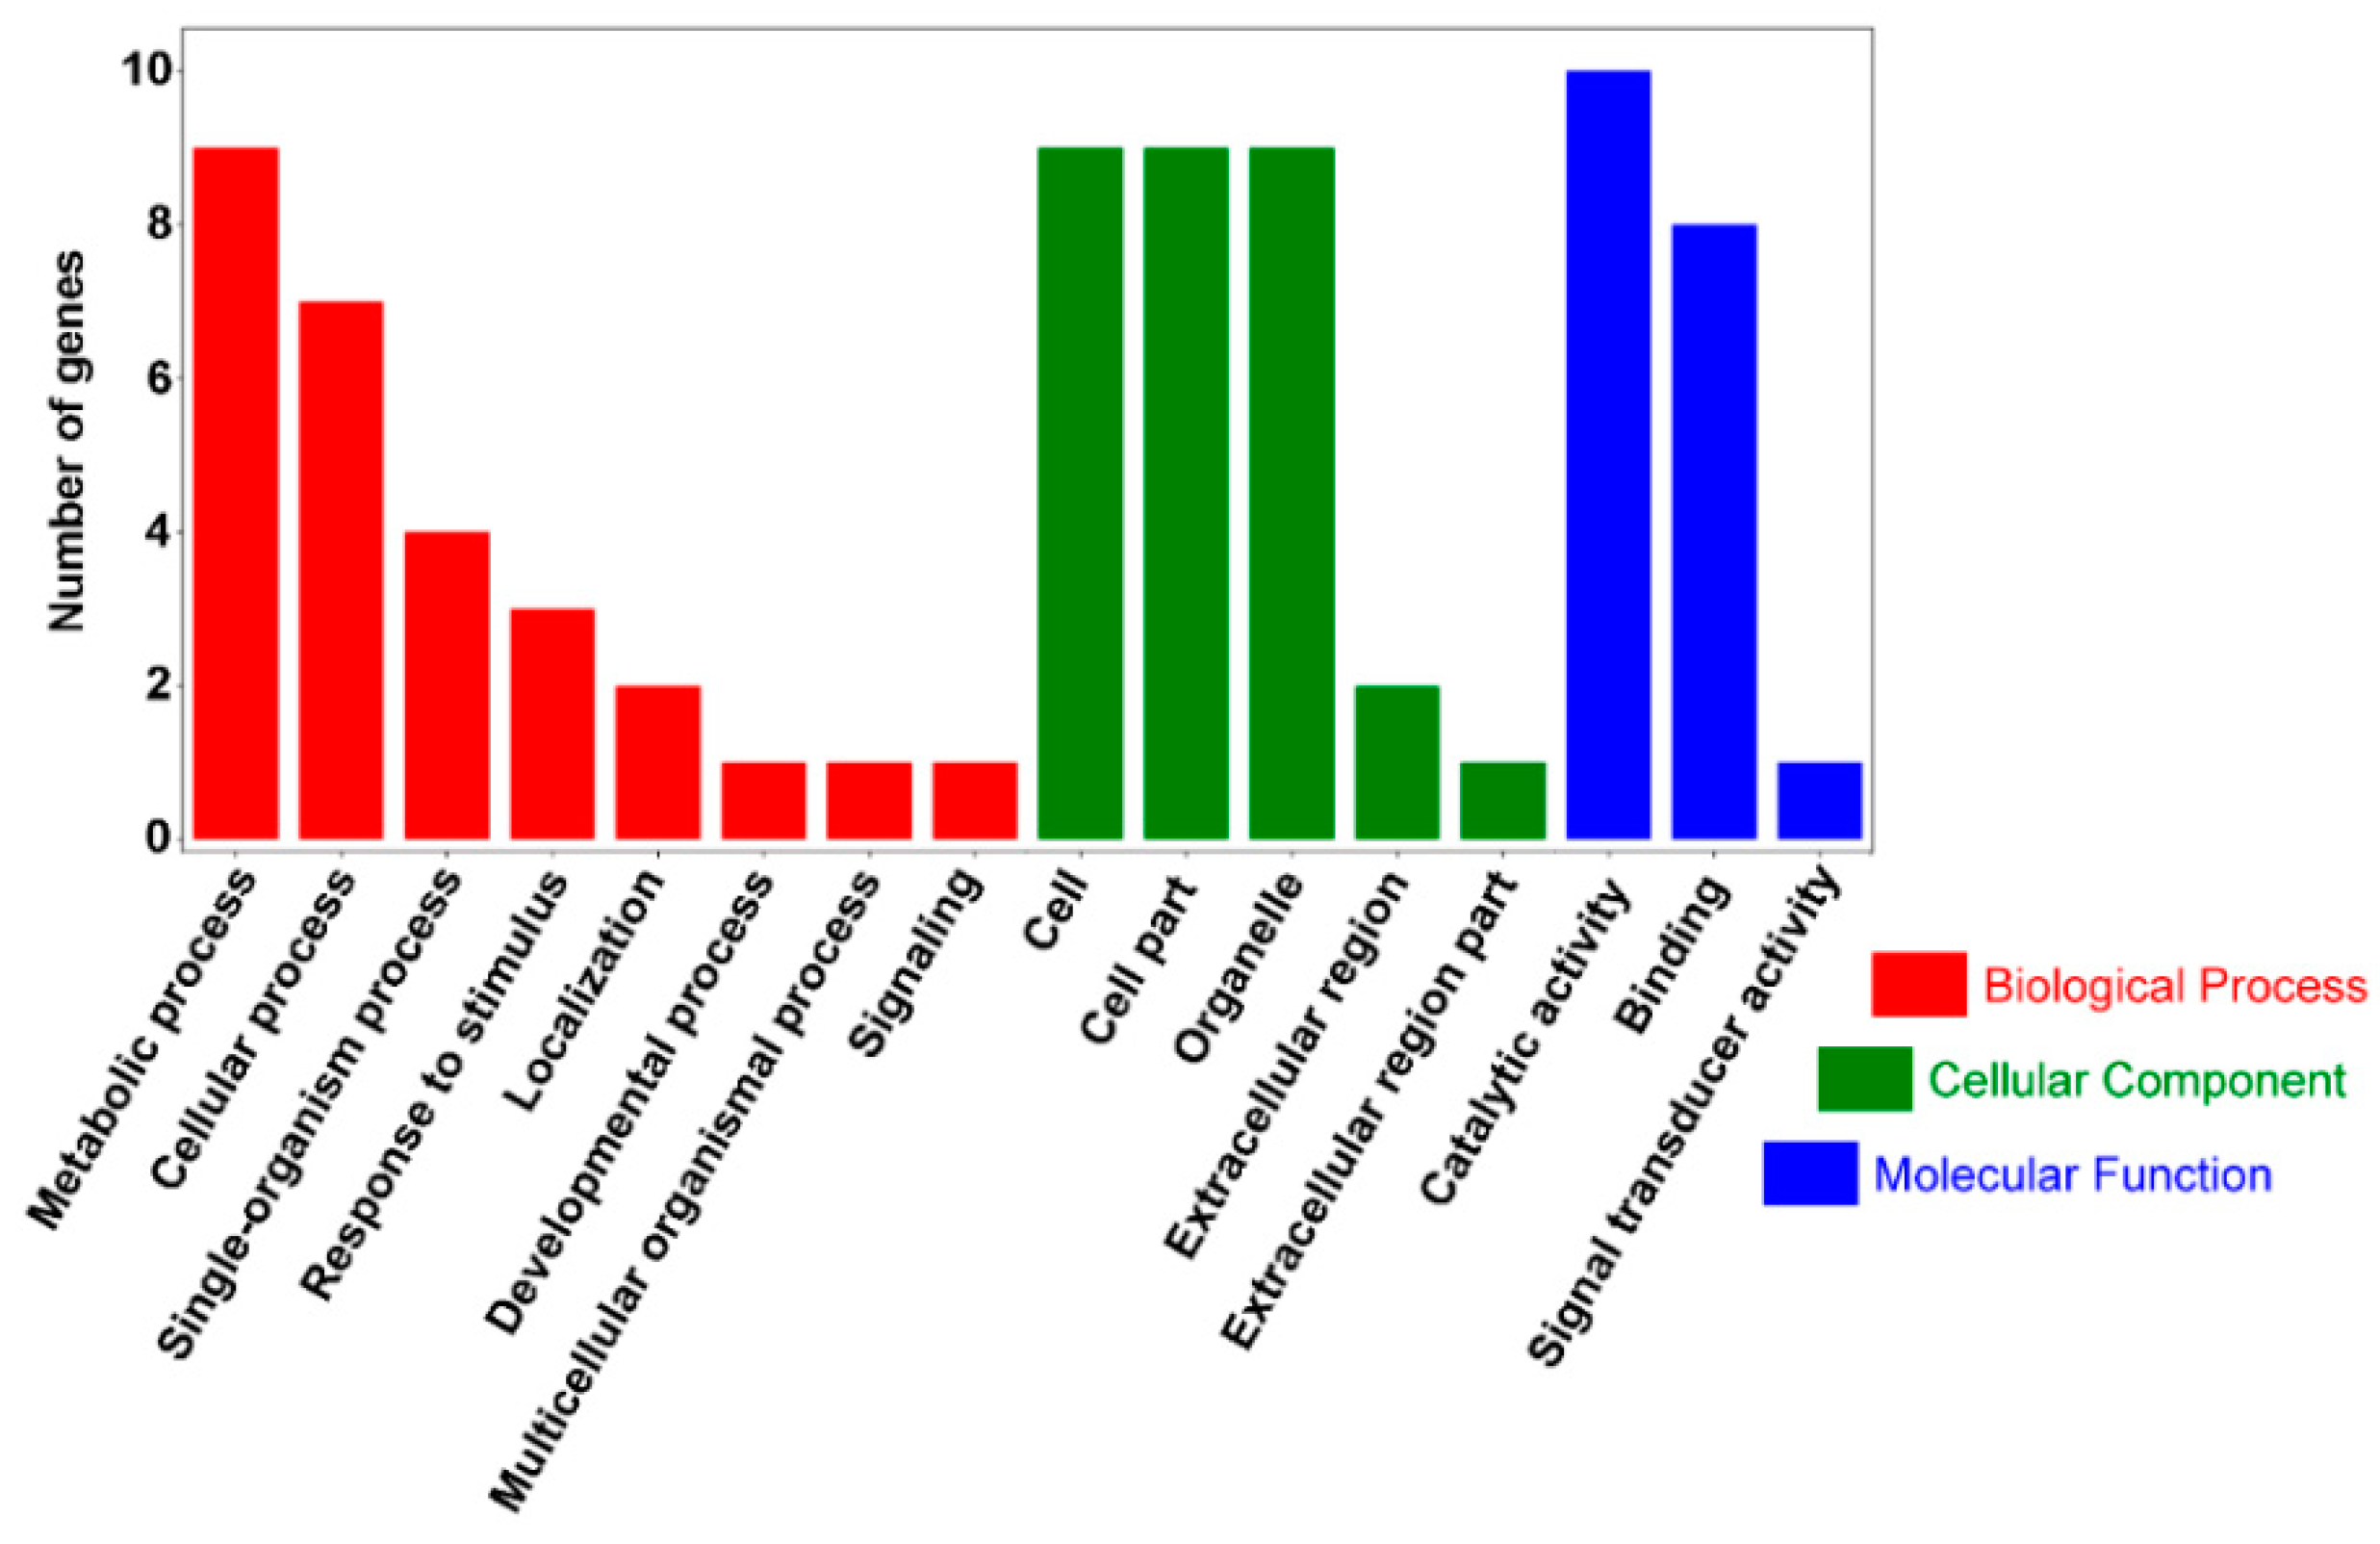
Gene ontology (GO) functional classification was performed for 49 significantly different genes; the results shown in Figure 5 and Table S7 were related to cell components (CC), molecular function (MF), and biological processes (BP). In CC, 10 genes were detected, which were involved in cells (GO: 0005623), cell parts (GO: 0044464), and organelles (GO: 0043226); in MF, 14 genes detected were involved in binding (GO: 0005488) and catalytic activity (GO: 0003824); in BP, 15 genes detected were involved in cellular processes (GO: 0009987) and metabolic processes (GO: 0008152), including nine genes involved in metabolic processes. Significantly different genes were mainly annotated into MF and BP, indicating that the o2 gene introgression into waxy corn primarily caused expression changes in genes related to catalytic activity and metabolic processes.
Pathway analysis of DEGs based on the Kyoto Encyclopedia of Genes and Genomes (KEGG) database showed that only 18 genes were annotated into 14 known KEGG pathways, while 31 DEGs were not annotated into any known KEGG pathways. As shown in Figure 6 and Table S8, six genes were annotated into metabolism, six genes into genetic information processing, three genes into environmental information processing, and three genes into cellular processes. In taurine and hypotaurine metabolism (KEGG 00430), Zm00001d033489.1, which encodes the key enzyme in the conversion of cysteine into hypotaurine (cysteine oxidase), was down-regulated in the endosperm of o2o2wxwx double mutants, thereby inhibiting hypotaurine synthesis. In starch and sucrose metabolism (K00500), Zm00001d033556.1 (K13648), which encodes the key element of pectin synthesis (galacturonosyltransferase), was up-regulated, thereby promoting pectin synthesis. In the phenylpropene (K00940) and flavonoid (K00941) metabolic pathways, Zm00001d037073.1 (hct3, hydroxycinnamoyl transferase3) and Zm00001d045145.1, which encode the down-stream enzymes of phenylalanine and tyrosine metabolism (hydroxycinnamoyl transferase and 2-oxoglutarate-dependent dioxygenase, respectively), were down-regulated, thereby inhibiting the degradation of phenylalanine and tyrosine.

2.6. qRT-PCR Validation

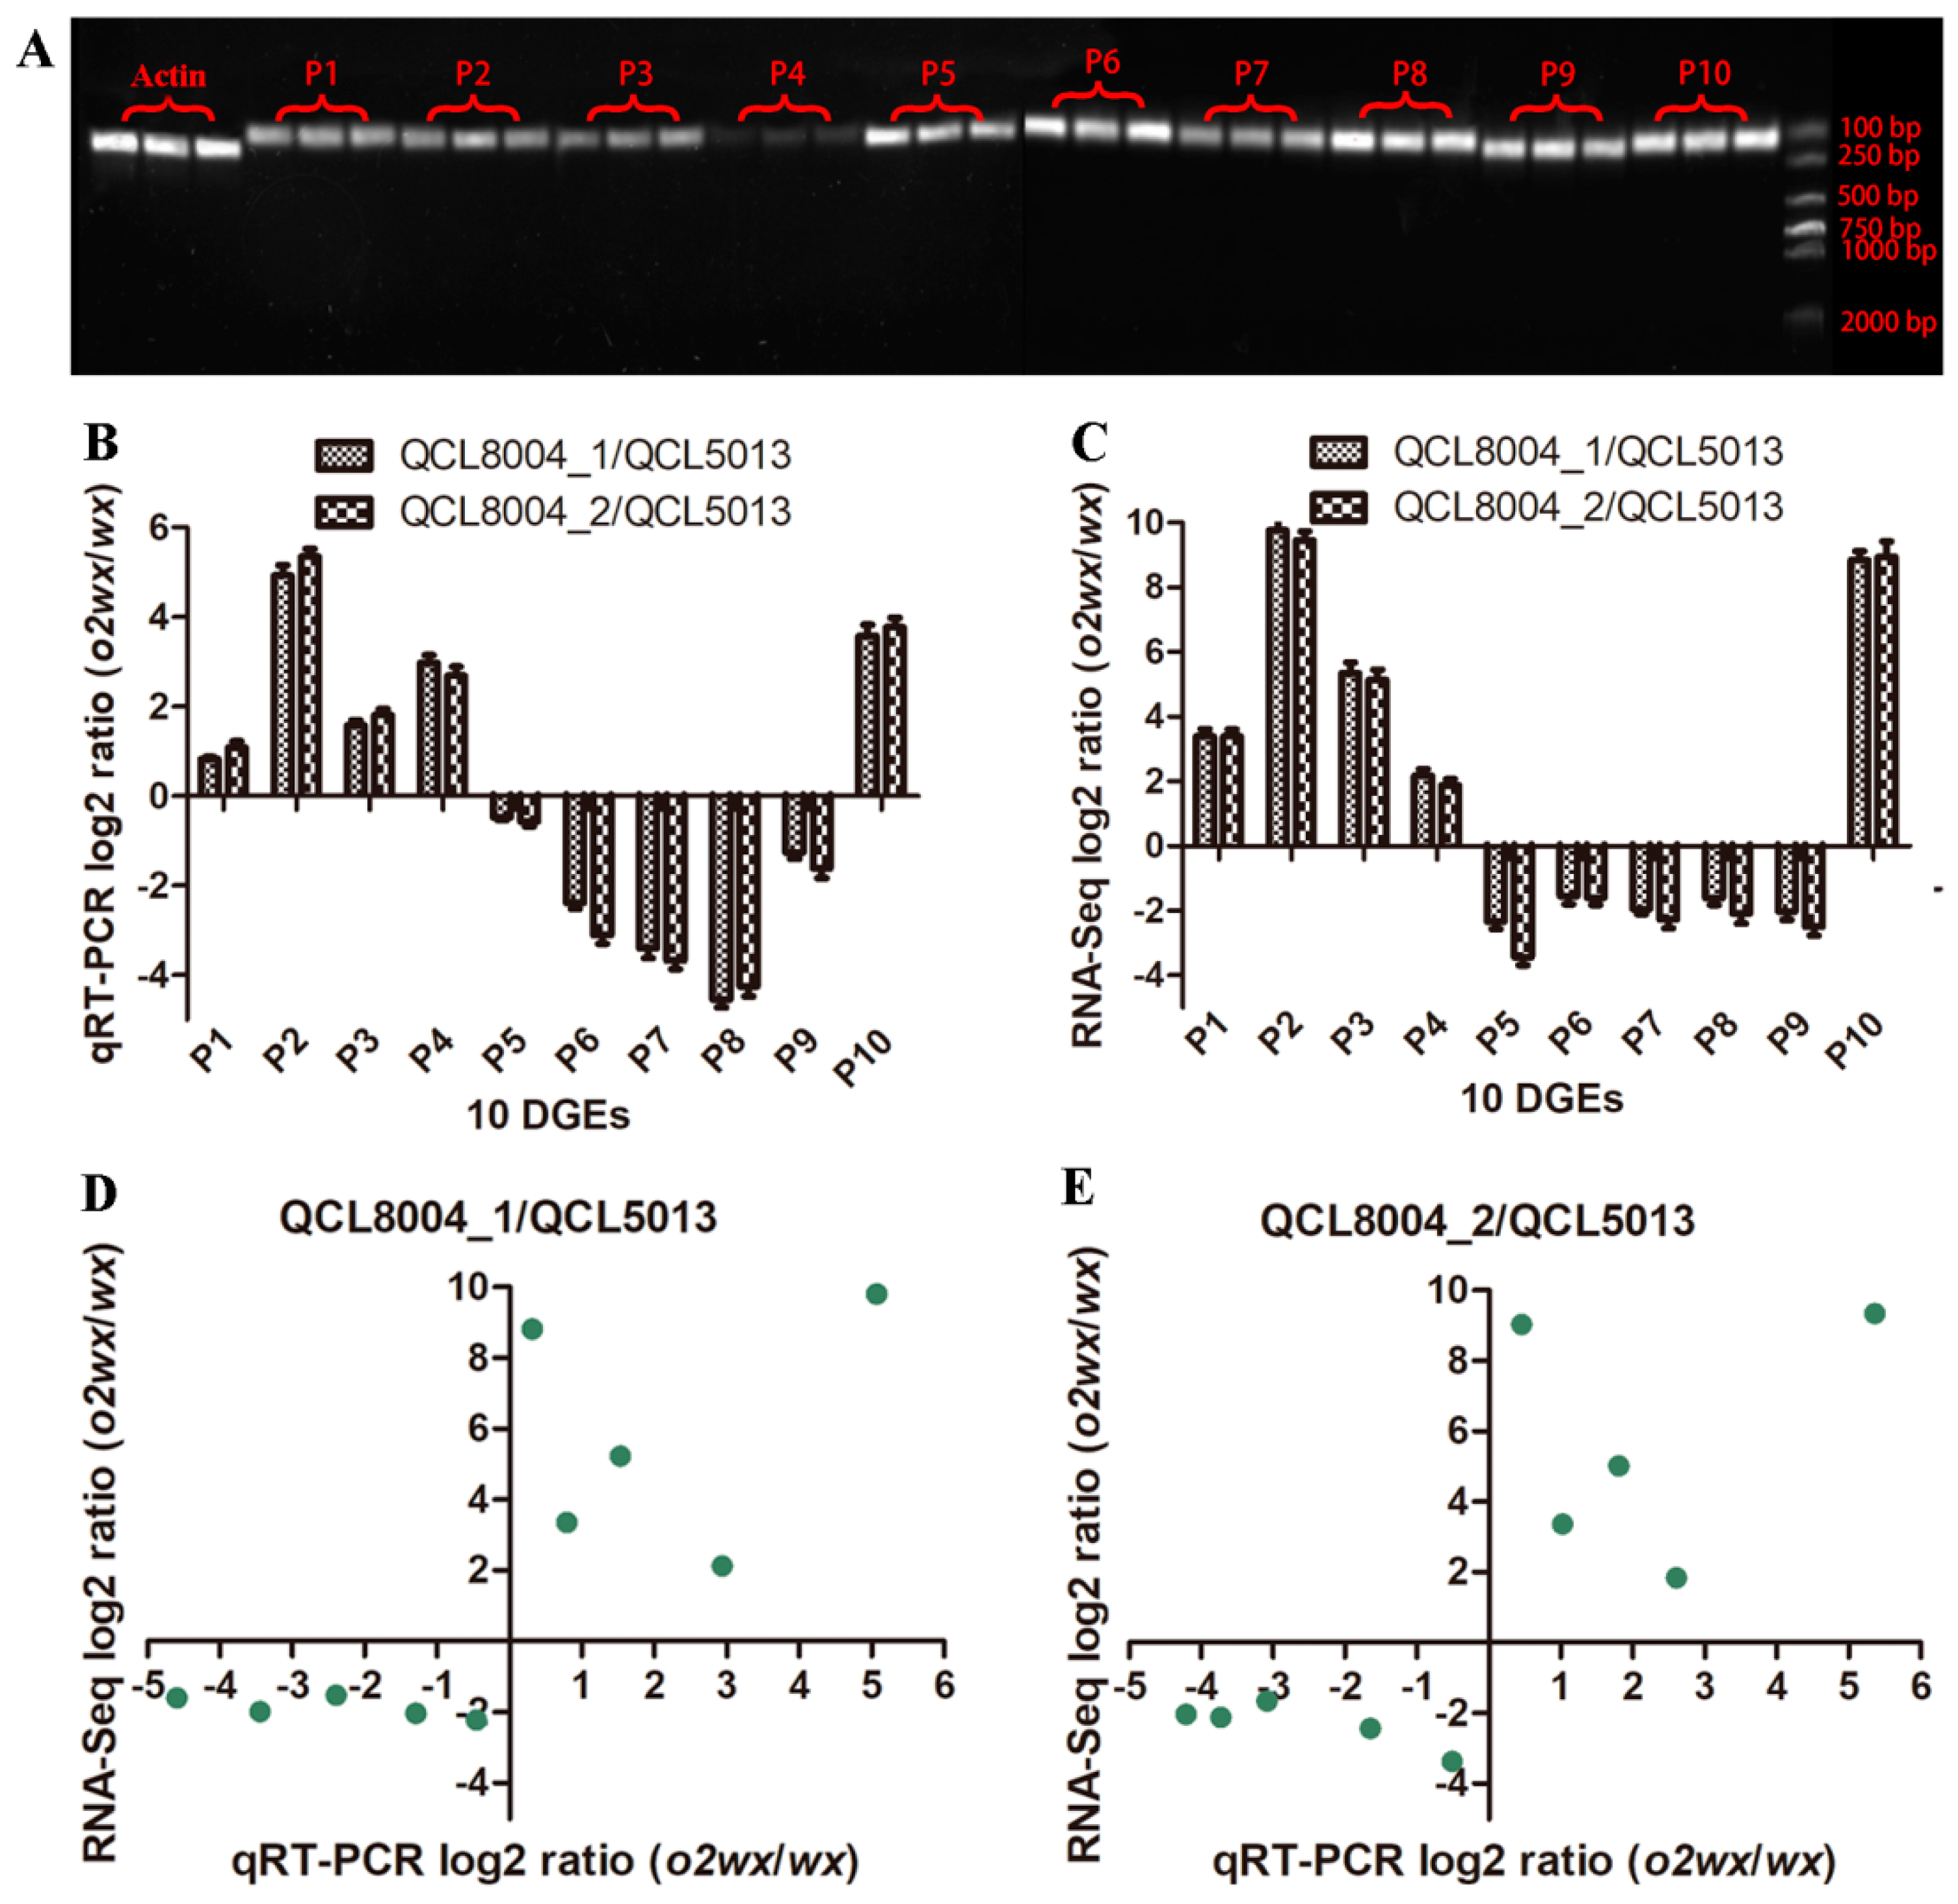
To validate the expression differences between o2wx and wx observed by RNA-Seq, we conducted quantitative real-time polymerase chain reaction (qRT-PCR) verification for 10 DGEs. Figure 7A shows that the designed primers for 10 DEGs showed better specificity. Meanwhile, the results shown in Figure 7B demonstrated that the qRT-PCR expression patterns of these 10 genes were similar to those measured by transcriptional sequencing (Figure 7C) between QCL8004_1 vs. QCL5013 and QCL8004_2 vs. QCL5013. In addition, Pearson coefficients of QCL8004_1 vs. QCL5013 and QCL8004_2 vs. QCL5013 were 0.8760 and 0.8843, respectively (Figure 7D,E). The RNA-seq results showed high relevance to the qRT-PCR results, indicating data reliability.

3. Discussion

In this study, the o2 gene was introgressed into waxy corn using the MABS technology to generate o2 and wx double recessive mutants. At the milking stage (18th DAP), the RNA-Seq analysis was conducted on kernels. In the o2o2wxwx mutants, the RNA-Seq results revealed 49 DEGs, which included the previously reported elongation factor and heat-shock protein genes [14]. New DEGs were also identified, such as the lysine/histidine specific amino acid transporter gene (Zm00001d012262.1, LHT1, lysine histidine transporter 1), a sulfur-rich protein gene (Zm00001d011063.1), and a dehydrin gene (Zm00001d033483.1, ZmDHN13, dehydrin13). This data will be helpful in revealing the transcriptional regulation mechanisms increasing lysine content after o2 gene introgression into waxy maize.
In this study, we found that lysine contents of QCL8004_1 and QCL8004_2 were higher than their recurrent parent by 15.63% and 18.75%, respectively; however, these values were lower than those of the mutants acquired by Zhou et al. (0.47%) [14]. Meanwhile, the background recovery rates of QCL8004_1 and QCL8004_2 were 93.16% and 93.28%, respectively, higher than the theoretical recovery rate (87.5%), and slightly higher than the BC6F3 mutants of Zhou et al. [14]. This was caused by background selection while screening the BC1F1, BC2F1, and BC2F2 generations using the SSR molecular marker technique [14]. In our study, 15,514 polymorphic SNPs were used for background analysis, which was significantly more than the 54 SSR markers used by Zhou et al. These methods favored the elimination of background interference and improved the accuracy of DEGs detection.
In the RNA-seq results, 28307, 28451, 28128, and 29061 genes were detected in QCL5013, QCL8004_1, QCL8004_2, and Tai19, respectively, accounting for over 70% of total corn genes, indicating good coverage of the genome. Differential analysis showed that, compared with the recurrent parent QCL5013, 113 DEGs, including 49 down-regulated and 64 up-regulated genes, were detected in QCL8004_1, while 106 DEGs, including 65 down-regulated and 41 up-regulated genes, were detected in QCL8004_2. Up-regulated and down-regulated genes in QCL8004_1 and QCL8004_2 differed significantly, potentially due to their different genetic background and recombination events. In 2013, Jia et al. [19] reported transcriptional profile differences between the o2 and wild-type lines. To minimize the influence of such differences, the intersection of DEGs in QCL8004_1 and QCL8004_2 was acquired; this contained 49 significant DEGs, including 25 up-regulated and 24 down-regulated genes. This further improved the accuracy of the DEG analysis.
Based on the GO functional classification statistics, we found that the significant DEGs were mainly involved in MF (14 genes) and BP (15 genes). In addition, pathway analysis based on the KEGG public database showed that 18 genes were annotated to 14 known KEGG pathways. Therefore, the introgression of the o2 gene into wxwx corn resulted in the altered expression of genes associated with MF and BP.
Zm00001d034771.1, which encodes elongation factor 2, and Zm00001d029385.1, which encodes elongation factor 1-alpha (EF-1α), were up-regulated in the endosperm of o2o2wxwx double mutants, agreeing with data from Carneiro et al. [21]. The literature shows that EF-1α levels in corn endosperm highly correlate with lysine content [22]. This could indicate that Zm00001d029385.1 up-regulation increased EF-1α levels and improved the lysine content. However, it remains to be determined whether the up-regulated expression of Zm00001d034771.1 was related to the lysine content.
Lactoylglutathione lyase (LGL, also known as glyoxalase I) plays an important role in cellular detoxification and tolerance to abiotic stresses [23]. Li et al. [24] found that two LGLs (GRMZM2G312877 and GRMZM2G028110) were detected as O2 target genes according to chromatin immune-precipitation followed by sequencing (ChIP-Seq), and thought that O2 could regulate genes involved in stress resistance. Meanwhile, Zhou et al. [14] studied protein changes in the endosperm of the o2o2wxwx double mutant using the two-dimensional gel electrophoresis (2DE) technique. Their results showed that the 17.5 kDa class II heat shock protein (HSP), 17.4 kDa class II heat shock protein, and 17.0 kDa class II heat shock protein were up-regulated in the o2o2wxwx endosperm. However, in our study, only Zm00001d028408.1 (heat shock protein), Zm00001d039936.1 (16.9 kDa class I heat shock protein 1), Zm00001d039935.1 (16.9 kDa class I heat shock protein 1), and Zm00001d028561.1 (class I heat shock protein 3) were detected and found to be down-regulated in the o2o2wxwx endosperm. These genes could be regulated by o2 to influence kernel development.
Literature analysis revealed that amino acids cannot automatically pass through the cell membrane, and so corresponding transport proteins are needed for their transportation [25]. Since the cDNA of the first plant amino acid transporter (NAT2/AAP1) was cloned by Frommer et al. [26] and Hsu et al. [27], several amino acid transporter genes have been identified [28,29,30,31,32]. Chen et al. [31] identified a new lysine/histidine specific amino acid transporter (LHT1) located in roots, young leaves, flowers, and fruit. In this study, Zm00001d012262.1, encoding a lysine/histidine-specific amino acid transporter, was significantly up-regulated in the o2o2wxwx endosperm, indicating that the o2 gene introgression into wxwx corn could up-regulate the expression of the LHT1 gene. This was associated with increased lysine transport to the endosperm and grain lysine content. In tryptophan metabolism, the up-regulation of Zm00001d030185.1 could enhance tryptophan synthesis and increase the grain tryptophan content. Meanwhile, Zm00001d033483.1, encoding the ZmDHN13 protein, was up-regulated in the endosperm of the o2o2wxwx double mutants. The ZmDHN13 protein contained 15% histidine, 14% glycine, 23.4% lysine, and 14% glutamic acid [31]. The introgression of the o2 gene into waxy corn promoted the synthesis of the ZmDHN13 protein and increased the lysine content. ZmDHN13 belongs to the dehydrin protein family [33], meaning that increased ZmDHN13 synthesis is also likely to improve the dehydration rate of grains and the plant’s resistance to abiotic stresses, such as low temperature, drought, and high salt. In addition, sulfur-rich proteins are mostly the plant seed prolamin, such as the 10 kDa and 15 kDa zeins of maize [34,35]. In this study, Zm00001d011063.1, encoding a sulfur-rich protein, was down-regulated in the endosperm of the o2o2wxwx double mutants, indicating that the o2 gene introgression into wxwx corn decreased sulfur-rich protein synthesis and, therefore, increased the lysine content of maize grains.
Moreover, the O2 not only directly activates genes associated with a variety of nutrient storage genes and enzymes involved in carbon and amino acid metabolism pathways, but also controls transcription factors that regulate various other aspects of plant metabolism [24]. EF-1α and LHT1 levels in corn endosperm highly correlate with lysine content, and show increased transcription [22,31], while 10 kDa zein shows decreased transcription [24]. Our results demonstrated that the O2 gene regulated multiple metabolic pathways related to BP and MP during waxy maize endosperm development. In the o2o2wxwx kernels, Zm00001d029385.1 and Zm00001d012262.1, which encode the EF-1α and LHT1, respectively, were up-regulated, while Zm00001d011063.1, which encodes sulfur-rich proteins (mostly 10 kDa zein), was down-regulated. These changes can improve the grain lysine content of waxy maize, although the functions of these genes in lysine biosynthesis or transport need to be further studied. Meanwhile, the O2 can directly or indirectly activate HSPs and EF2, and other DEGs associated with response to stimulus, the metabolic process, and other aspects of plant metabolism (Figure 8). These results are important for elucidating the underlying molecular mechanisms in the lysine content improvement of waxy corn following the o2 gene introgression. The above genes that reduce zeins and increase the lysine content may be used for gene editing or the development of new biomarkers to promote molecular quality breeding.

4. Materials and Methods

4.1. Materials

QCL5013 (wxwx) is a waxy maize inbred line generated by our research group. Tai19 (o2o2) is a high lysine maize inbred line from Shanxi Academy of Agricultural Sciences, Shanxi, China. We used QCL5013 (wxwx) as the female parent and Tai19 (o2o2) as the male parent, to generate an F1 hybrid. BC1F1 was then obtained by backcrossing the F1 hybrid to the QCL5013 (recurrent parent). From BC1F1, 29 plants with the O2o2wxwx genotype were identified after the screening of 213 plants using the wx gene marker phi027 and o2 gene marker umc1066 (Table S9); BC2F1 was then obtained by backcrossing with QCL5013. From BC2F1, 13 plants with the O2o2wxwx genotype were identified after the screening of 50 plants using the o2 gene marker umc1066; BC2F2 was then obtained by self-pollination. In total, 110 individual plants from the BC2F2 generation were planted; plants with the o2o2wxwx genotype were screened using umc1066 and BC2F3 seeds were obtained by self-pollination. These plants continued to be planted, self-pollinated, and purified. Overall, 23 BC2F3 plants were selected according to their agronomic characteristics. Meanwhile, two BC2F3 plants, F3-4 and F3-7, were selected according to the combination of genetic background analysis using 41 SSR markers and a lysine content analysis of 23 plants (Table S10). Self-pollination for additive generations was continued until these lines were genetically stable; plants from these two lines were named QCL8004_1 and QCL8004_2 (Figure S4).
The characteristics and appearance photographs of ears and kernels were taken by a Canon PC1472. Mature kernels were peeled with a razor blade. Then, a small piece of endosperm was spray-coated with the ion sputter (E-1010, Hitachi, Japan). The submicroscopic structure of the endosperm was observed by scanning electron microscopy (S-3400N, Hitachi, Japan) in the Guizhou Key Laboratory of Agricultural Biotechnology Guiyang, China.

4.2. DNA Extraction and Genetic Background Analysis

QCL8004_1, QCL8004_2, and their parents (QCL5013 and Tai19) were planted in a test field. Leaves were sampled from five plants per line and genomic DNA was extracted according to Yang’s method [36]. Genotyping these lines was conducted using a 55K SNP chip designed by Cheng et al. [37] on the Affymetrix® GenTian® platform (CapitaBio Technology Co., Ltd. Beijing, China) to measure the genetic background recovery rates of QCL8004-1 and QCL8004-2. Statistical analysis of the background recovery rate based on molecular markers was calculated by the following Formula (1):
G   ( g ) = L + X   ( g ) 2 L
where G (g) is the background recovery rate after backcrossing g generations; X (g) is the number of markers showing band forms of the recipient parent; g represents the generations of backcrossing; and L is the total number of tested markers [38,39,40].
The background recovery rate was theoretically calculated using the following Formula (2):
E   [ G   ( g ) ] = 1 ( 1 / 2 ) g + 1

4.3. RNA-Seq Library Construction and Sequencing

All maize materials were grown in the experimental station (N 26°30′14″ and E 106°39′21″) of the Guizhou Institute of Upland Food Crops, Guizhou Academy of Agricultural Science, China, during the summer of 2016. A minimum of three well-filled ears of each genotype were sampled at the 18th DAP. Total RNA was extracted with the Plant RNA Kit, according to the manufacturer’s instructions (OMEGA); three biological replicates were adopted in this study. The concentration and purity of RNA samples were examined using a NanoDrop 1000 and Agilent 2100 Bioanalyzer. Oligo (dT) magnetic beads were used to select mRNA with a polyA tail, the mRNA was hybridized with a DNA probe, and the DNA/RNA hybrid strand was digested with RNase H, followed by DNase I reaction to remove the DNA probe. The target RNA was fragmented with broken buffer and reversely transcribed to form cDNA using N6 random primers, and the second strand of the cDNA was then synthesized to generate dsDNA. The ends of the dsDNA were repaired, phosphorylated at the 5’ end, and adhered to ‘A’ at the 3’ end; then an adaptor with stretched ‘T’ at the 3’ end was ligated as the PCR substrate. Two specific primers were used to amplify the ligation product. The PCR product was thermally denatured and the single-stranded DNA was cyclized by splint oligo and DNA ligase. Transcriptional sequencing was performed on the BGISEQ-500 platform for the following data analysis.

4.4. Identification of Differentially Expressed Genes

Among the raw sequencing reads, the reads with adaptors, the reads in which unknown bases were more than 10%, and the low quality reads (the percentage of low quality bases was over 50% in a read; the low quality base was no more than 5 (Q ≤ 5)) were removed. The remaining reads were clean reads.
For mapping clean reads, Bowtie2 [41] was used to reference genes and HISAT [42] was used to reference the genomes. The FPKM method was used in calculating the expression level by RSEM [43] and Formula (3) was employed, as shown below:
FPKM ( A ) = 10 6 C N L / 10 3
where C was the number of fragments that are aligned to gene A; N was the total number of fragments that are aligned to all genes; and L was the number of bases on gene A. The NOISeq method [44] was used for screening DEGs according to the following default criteria: Fold change ≥ 2 and divergent probability ≥ 0.8.

4.5. GO and Pathway Enrichment Analysis of DEGs

All DEGs were mapped to each term of the gene ontology database (http://www.geneontology.org/) (30 November 2016), and the number of genes in each term was calculated. The hypergeometric test was used to find out which GO items were significantly enriched in the DEGs compared with the whole genome background. Referring to the software GO::TermFinder (http://www.yeastgenome.org/help/analyze/go-term-finder) (30 November 2016), the p value was calculated by using Formula (4):
P = 1 i = 0 m 1 ( M i ) ( N M n i ) ( N n )
where N was the number of all genes with GO annotation; n was the number of DEGs in N; M was the number of all genes that are annotated to a certain GO term; and m was the number of DEGs in M. After being corrected by Bonferroni correction [45], the calculated p value was defined as the GO term. The GO terms with a p value ≤ 0.05 were defined as significantly enriched GO terms in DEGs.
KEGG [46] was used to perform the pathway enrichment analysis of DEGs. The formula used to calculate KEGG was similar to that used for GO analysis; here, N was the number of all genes with KEGG annotation; n was the number of DEGs in N; M was the number of all genes annotated as specific pathways; and m was the number of DEGs in M. The pathways with a q value ≤ 0.05 were defined as significantly enriched pathways in DEGs.

4.6. qRT-PCR Validation

Ten DEGs were selected for qRT-PCR verification. The primers shown in Table 2 were designed online (http://sg.idtdna.com/primerquest/Home/Index), and the first-strand cDNAs were synthesized from 1000 ng of total RNA using a reverse transcription kit (RevertAid First Strand cDNA Synthesis Kit, K1622, Thermo Fisher Scientific Inc., Shanghai, China) in a 20 μL reaction volume. The qRT-PCR was conducted on the CFX Connect Real-Time PCR System (Bio-Rad Laboratories. Inc., Shanghai, China), according to the method used by Liu et al. [47] in a 20 μL reaction volume with the SYBR® Select Master Mix (Applied Biosystems Inc., California, USA), using 4 μL of a tenfold diluted cDNA solution, 10 μL of SYBR® Select Master Mix, and 10 μM of each primer. The thermal cycling conditions were 2 min at 50 °C and 10 min at 95 °C, followed by 40 cycles of 15 s at 95 °C and 1 min at 60 °C.
The relative expression levels for each gene were calculated using the comparative Ct method with normalization to the internal control gene. Three replicates were used for each sample and actin was used as an internal standard, and the relative expression level was calculated using the 2−ΔΔCT method [48].

4.7. Accession Numbers

The raw data of RNA-seq reads were deposited in the National Center for Biotechnology Information (NCBI) database under accession number (SRP157066). Biosample accessions were as follows: SAMN09791929, SAMN09791930, SAMN09791931, SAMN09791932, SAMN09791933, SAMN09791934, SAMN09791935, SAMN09791936, SAMN09791937, SAMN09791938, SAMN09791939, and SAMN09791940.

5. Conclusions

In this study, the opaque2 (o2) gene was introgressed into the waxy corn using the MABS technology, and two o2o2wxwx lines, QCL8004_1 and QCL8004_2, were acquired. The results showed that lysine contents of QCL8004_1 and QCL8004_2 were improved compared to that of their recurrent parent. Meanwhile, NOISeq differential expression analysis showed that 49 differentially expressed genes were mostly related to the catalytic activity and metabolic processes. Zm00001d029385.1 and Zm00001d012262.1, which encode the EF-1α and LHT1, respectively, were up-regulated, while Zm00001d011063.1, which encodes sulfur-rich proteins (mostly 10 kDa zein), was down-regulated in the o2o2wxwx lines. These changes can improve waxy maize grain lysine content. This information will help uncover the regulatory transcriptional mechanism for the increase of lysine content by o2 gene introgression into waxy maize.

Supplementary Materials

Supplementary materials can be found at https://www.mdpi.com/1422-0067/20/3/684/s1. Table S1. Genotyping results of Tai19, QCL5013, QCL8004_1, and QCL8004_2 by 55k SNP array. Table S2. Summary for RNA sequencing data of Tai19, QCL5013, QCL8004_1, and QCL8004_2. Table S3. Alignment statistic of reads aligned with reference gene. Table S4. Alignment statistic of reads aligned with reference genome. Table S5. QC20 and QC30 of RNA sequencing data for Tai19, QCL5013, QCL8004_1, and QCL8004_2. Table S6. FPKM of all genes for Tai19, QCL5013, QCL8004_1, and QCL8004_2. Table S7. GO functional classification on DEGs for QCL5013 vs. QCL8004_1 and QCL5013 vs. QCL8004_2. Table S8. KEGG functional classification on DEGs for QCL5013 vs. QCL8004_1 and QCL5013 vs. QCL8004_2. Table S9. The information of SSR primers for the o2 and wx alleles. Table S10. Background recovery rates and lysine contents of 23 BC2F3 plants. Figure S1. Graphical genotypes of QCL8004_1 and QCL8004_2 on chromosomes 1, 2, 3, 4, and 5. QCL5013, recurrent parent; Tai19, donor parent; A, B, H, and U of the SNP markers were used to establish the database. A, consistent with the recurrent parent; B, consistent with the donor parent; H, heterozygous; U, unidentified. Figure S2. Graphical genotypes of QCL8004_1 and QCL8004_2 on chromosomes 6, 7, 8, 9, and 10. QCL5013, recurrent parent; Tai19, donor parent; A, B, H, and U of the SNP markers were used to establish the database. A, consistent with the recurrent parent; B, consistent with the donor parent; H, heterozygous; U, unidentified. Figure S3. The heatmap of correlation coefficient values across samples. a, b, c represents three biological replicates. Gradient color barcode at the right top indicates the minimum value in white and the maximum in blue. If one sample is highly similar to another one, the correlation value between them is very close to 1. Figure S4. The MABS scheme adapted for the introgression of o2 gene into the waxy maize inbred QCL5013. MAS, marker-assisted selection; FS, foreground selection; BS, background selection.

Author Contributions

W.Y. and D.Z. conceived and designed the experiments; W.W., S.N., Y.D. (Yi Dai), X.Z., M.W., and Y.D. (Yanqin Ding) performed the experiments and analyzed the data; W.Y. and W.W. contributed reagents/analysis tools; W.W. and W.Y. wrote the paper.

Funding

This research was supported by grants from the National Natural Science Foundation of China (Nos. 30560079 and 31160307), the Genetically Breeding Major Project of the Ministry of Agriculture of China (2016ZX08010-003), the Guizhou Academy of Agricultural Sciences (Nos. S2014008 and IIS2014006), the Guizhou Department of Science and Technology (Nos. NY20143020, SE20144002, and MSP20184005), the Agricultural Committee of Guizhou Province (No. GZCYTX2013-0701), and the Open Project of State Key Laboratory of Crop Genetics and Germplasm Enhancement.

Conflicts of Interest

The authors declare no conflicts of interest.

Abbreviations

GBSS-IGranule-bound starch synthase I
MABSMarker-assisted backcrossing selection
DAPDay after pollination
SNPSingle nucleotide polymorphism
SSRSimple Sequence Repeats
qRT-PCRQuantitative real-time polymerase chain reaction
FPKMFragments Per Kilobase Million
GOGene Ontology
KEGGKyoto Encyclopedia of Genes and Genomes
hct3Hydroxycinnamoyl transferase 3
LHT1Lysine histidine transporter 1
DHN13Dehydrin 13
EF-1αElongation factor 1-alpha
MFMolecular function
BPBiological processes
CCCell components
ChIP-SeqChromatin immune-precipitation follow by sequencing
HSPheat shock protein
SEMScanning electron microscopy

References

  1. Tian, Q.Z.; Li, X.H.; Li, M.S.; Jiang, W.; Zhang, S.H. Molecular markers assisted selection to quality protein maize. J. Maize Sci. 2004, 12, 108–110+113. [Google Scholar] [CrossRef]
  2. Mertz, E.T.; Bates, L.S.; Nelson, O.E. Mutant gene that changes protein composition and increases lysine content of maize endosperm. Science 1964, 145, 279–280. [Google Scholar] [CrossRef] [PubMed]
  3. Gavazzi, F.; Lazzari, B.; Ciceri, P.; Gianazza, E.; Viotti, A. Wild-type Opaque2 and defective opaque2 polypeptides form complexes in maize endosperm cells and bind the opaque2-zein target site. Plant Physiol 2007, 145, 933–945. [Google Scholar] [CrossRef] [PubMed]
  4. Rossi, V.; Motto, M.; Pellegrini, L. Analysis of the methylation pattern of the maize Opaque-2 (O2) promoter and in vitro binding studies indicate that the O2 B-Zip protein and other endosperm factors can bind to methylated target sequences. J. Biol. Chem. 1997, 272, 13758–13765. [Google Scholar] [CrossRef] [PubMed]
  5. Zeng, M.Q. Blood relationship of Chinese waxy maize. China Seeds 1987, 3, 21–24. [Google Scholar] [CrossRef]
  6. Zheng, H.J.; Wang, H.; Yang, H.; Wu, J.H.; Shi, B.; Cai, R.; Xu, Y.B.; Wu, A.Z.; Luo, L.J. Genetic diversity and molecular evolution of Chinese waxy maize germplasm. PLoS ONE 2013, 8, 1–11. [Google Scholar] [CrossRef] [PubMed]
  7. Wu, X.Y.; Chen, D.; Lu, Y.Q.; Liu, W.H.; Yang, X.M.; Du, J.; Li, L.H. Molecular characteristics of two new waxy mutations in China waxy maize. Mol. Breed. 2017, 37, 27. [Google Scholar] [CrossRef]
  8. Collins, G.N. A New Type of Indian Corn from China; US Department of Agriculture, Bureau of Plant Industry: Washington, DC, USA, 1909; Volume 161, pp. 1–30.
  9. Wicker, T.; Sabot, F.; Hua-Van, A.; Bennetzen, J.; Capy, P.; Chalhoub, B.; Flavell, A.; Leroy, P.; Morgante, M.; Panaud, O.; et al. A unified classification system for eukaryotic transposable elements. Nat. Rev. Genet. 2007, 8, 973–982. [Google Scholar] [CrossRef]
  10. Fan, L.J.; Quan, L.Y.; Leng, X.D.; Guo, X.Y.; Hu, W.M.; Ruan, S.; Ma, H.; Zeng, M. Molecular evidence for post-domestication selection in the Waxy gene of Chinese waxy maize. Mol. Breed. 2008, 22, 329–338. [Google Scholar] [CrossRef]
  11. Bao, J.D.; Yao, J.Q.; Zhu, J.Q.; Hu, W.M.; Cai, D.G.; Li, Y.; Shu, Q.Y.; Fan, L.J. Identification of glutinous maize landraces and inbred lines with altered transcription of waxy gene. Mol. Breed. 2012, 30, 1707–1714. [Google Scholar] [CrossRef]
  12. Lu, D.; Lu, W.P. Effects of protein removal on the physicochemical properties of waxy maize flours. Starch-Stärke 2012, 64, 874–881. [Google Scholar] [CrossRef]
  13. Zhang, W.L.; Yang, W.P.; Wang, M.C.; Wang, W.; Zeng, G.P.; Chen, Z.W.; Cai, Y.L. Increasing lysine content of waxy maize through introgression of opaque-2 and opaque-16 genes using molecular assisted and biochemical development. PLoS ONE 2013, 8, e56227. [Google Scholar] [CrossRef] [PubMed]
  14. Zhou, Z.Q.; Song, L.Y.; Zhang, X.X.; Li, X.H.; Yan, N.; Xia, R.P.; Zhu, H.; Weng, J.F.; Hao, Z.F.; Zhang, D.G.; et al. Introgression of opaque2 into waxy maize causes extensive biochemical and proteomic changes in endosperm. PLoS ONE 2016, 11, e0158971. [Google Scholar] [CrossRef] [PubMed]
  15. Misra, P.S.; Mertz, E.T.; Glover, D.V. Studies on corn proteins. VI. Endosperm protein changes in single and double endosperm mutants of maize. Cereal Chem. 1975, 52, l–6. [Google Scholar]
  16. Zhang, S.K.; Teng, H.S.; Su, Q.; Yang, Y.J. Selection of waxy-QPM maize lines with SSR markers. Guangxi Agric. Sci. 2009, 10, 1279–1283. [Google Scholar]
  17. Yang, L.Q.; Wang, W.; Yang, W.P.; Wang, M.C. Marker-assisted selection for pyramiding the waxy and opaque-16 genes in maize using cross and backcross schemes. Mol. Breed. 2013, 31, 767–775. [Google Scholar] [CrossRef]
  18. Dang, N.C.; Munsch, M.; Aulinger, I.; Renlai, W.; Stamp, P. Inducer line generated double haploid seeds for combined waxy and opaque 2 grain quality in subtropical maize (Zea mays. L.). Euphytica 2012, 183, 153–160. [Google Scholar] [CrossRef]
  19. Jia, H.; Nettleton, D.; Peterson, J.M.; Vazquez-Carrillo, G.; Jannink, J.L.; Scott, M.P. Comparison of transcript profiles in wild-type and o2 maize endosperm in different genetic backgrounds. Crop Sci. 2007, 47, 45–49. [Google Scholar] [CrossRef]
  20. Zhang, Z.Y.; Zheng, X.X.; Yang, J.; Messing, J.; Wu, Y.R. Maize endosperm-specific transcription factors O2 and PBF network the regulation of protein and starch synthesis. Proc. Natl. Acad. Sci. USA 2016, 113, 10842–10847. [Google Scholar] [CrossRef] [Green Version]
  21. Carneiro, N.P.; Hughes, P.A.; Larkins, B.A. The eEFlA gene family is differentially expressed in maize endosperm. Plant Mol. Biol. 1999, 41, 801–814. [Google Scholar] [CrossRef]
  22. Habben, J.E.; Moro, G.L.; Hunter, B.G.; Hamaker, B.R.; Larkins, B.A. Elongation factor 1 alpha concentration is highly correlated with the lysine content of maize endosperm. Proc. Natl. Acad. Sci. USA 1995, 92, 8640–8644. [Google Scholar] [CrossRef] [PubMed]
  23. Wu, C.; Ma, C.Q.; Pan, Y.; Gong, S.L.; Zhao, C.X.; Chen, S.X.; Li, H.Y. Sugar beet M14 glyoxalase I gene can enhance plant tolerance to abiotic stresses. J. Plant Res. 2013, 126, 415–425. [Google Scholar] [CrossRef] [PubMed]
  24. Li, C.B.; Qiao, Z.Y.; Qi, W.W.; Wang, Q.; Yuan, Y.; Yang, X.; Tang, Y.P.; Mei, B.; Lu, Y.D.; Zhao, H.; et al. Genome-wide characterization of cis-acting DNA targets reveals the transcriptional regulatory framework of Opaque2 in maize. Plant Cell 2015, 114. [Google Scholar] [CrossRef]
  25. Bush, D.R. Proton-coupled sugar and amino acid transporters in plants. Annu. Rev. Plant Biol. 1993, 44, 513–542. [Google Scholar] [CrossRef]
  26. Frommer, W.B.; Hummel, S.; Riesmeier, J.W. Expression cloning in yeast of a cDNA encoding a broad specificity amino acid permease from Arabidopsis thaliana. Proc. Natl. Acad. Sci. USA 1993, 90, 5944–5948. [Google Scholar] [CrossRef] [PubMed]
  27. Hsu, L.C.; Chiou, T.J.; Chen, L.; Bush, D.R. Cloning a plant amino acid transporter by functional complementation of a yeast amino acid transport mutant. Proc. Natl. Acad. Sci. USA 1993, 90, 7441–7445. [Google Scholar] [CrossRef] [PubMed]
  28. Kwart, M.; Hirner, B.; Hummel, S.; Frommer, W.B. Differential expression of two related amino acid transporters with differing substrate specificity in Arabidopsis thaliana. Plant J. 1993, 4, 993–1002. [Google Scholar] [CrossRef] [PubMed] [Green Version]
  29. Fischer, W.N.; Kwart, M.; Hummel, S.; Frommer, W.B. Substrate specificity and expression profile of amino acid transporters (AAPs) in Arabidopsis. J. Biol. Chem. 1995, 270, 16315–16320. [Google Scholar] [CrossRef] [PubMed]
  30. Rentsch, D.; Hirner, B.; Schmelzer, E.; Frommer, W.B. Salt stress-induced proline transporters and salt stress-repressed broad specificity amino acid permeases identified by suppression of a yeast amino acid permease-targeting mutant. Plant Cell 1996, 8, 1437–1446. [Google Scholar] [CrossRef] [PubMed]
  31. Chen, L.; Bush, D.R. LHT1, a lysine-and histidine-specific amino acid transporter in Arabidopsis. Plant Physiol. 1997, 115, 1127–1134. [Google Scholar] [CrossRef] [PubMed]
  32. Svennerstam, H.; Ganeteg, U.; Bellini, C.; Näsholm, T. Comprehensive screening of Arabidopsis mutants suggests the lysine histidine transporter 1 to be involved in plant uptake of amino acids. Plant Physiol. 2007, 143, 1853–1860. [Google Scholar] [CrossRef] [PubMed]
  33. Liu, Y.; Wang, L.; Zhang, T.P.; Yang, X.H.; Li, D.Q. Functional characterization of KS-type dehydrin ZmDHN13 and its related conserved domains under oxidative stress. Sci. Rep. 2017, 7, 7361. [Google Scholar] [CrossRef] [PubMed]
  34. Kirihara, J.A.; Petri, J.B.; Messing, J. Isolation and sequence of a gene encoding a methionine-rich 10-kDa zein protein from maize. Gene 1988, 71, 359–370. [Google Scholar] [CrossRef]
  35. Pedersen, K.; Argos, P.; Naravana, S.V.; Larkins, B.A. Sequence analysis and characterization of a maize gene encoding a high-sulfur zein protein of Mr 15,000. J. Biol. Chem. 1986, 261, 6279–6284. [Google Scholar] [PubMed]
  36. Yang, W.P.; Zheng, Y.L.; Zheng, W.T.; Feng, R. Molecular genetic mapping of a high-lysine mutant gene (opaque-16) and the double recessive effect with opaque-2 in maize. Mol. Breed. 2005, 15, 257–269. [Google Scholar] [CrossRef]
  37. Xu, C.; Ren, Y.H.; Jian, Y.Q.; Guo, Z.F.; Zhang, Y.; Xie, C.X.; Fu, J.J.; Wang, H.W.; Wang, G.Y.; Xu, Y.B.; et al. Development of a maize 55 K SNP array with improved genome coverage for molecular breeding. Mol. Breed. 2017, 37, 20. [Google Scholar] [CrossRef] [PubMed]
  38. Hospital, F.; Chevalet, C.; Mulsant, P. Using markers in gene introgression breeding programs. Genetics 1992, 132, 199–210. [Google Scholar]
  39. Xia, J.H.; Zheng, Y.L. Molecular marker-assisted backcross breeding of maize Rf3 NIL and its efficient analysis. Acta Agron. Sin. 2002, 28, 339–344. [Google Scholar]
  40. Fang, M.J.; Ding, D.; Yang, W.P.; Xu, S.Z.; Zheng, Y.L. The linkage drag analysis of flanked opaque2 by SSR marker in two maize BC1F1 population. Acta Agron. Sin. 2005, 31, 1359–1364. [Google Scholar]
  41. Langmead, B.; Trapnell, C.; Pop, M.; Salzberg, S.L. Ultrafast and memory-efficient alignment of short DNA sequences to the human genome. Genome Biol. 2009, 10, R25. [Google Scholar] [CrossRef]
  42. Kim, D.; Langmead, B.; Salzberg, S.L. HISAT: A fast spliced aligner with low memory requirements. Nat. Methods 2015, 12, 357. [Google Scholar] [CrossRef] [PubMed]
  43. Li, B.; Dewey, C.N. RSEM: Accurate transcript quantification from RNA-Seq data with or without a reference genome. BMC Bioinform. 2011, 12, 323. [Google Scholar] [CrossRef] [PubMed]
  44. Tarazona, S.; Furio-Tari, P.; Turra, D.; Pietro, A.D.; Nueda, M.J.; Ferrer, A.; Conesa, A. Data quality aware analysis of differential expression in RNA-seq with NOISeq R/Bioc package. Nucleic Acids Res. 2015, 43, e140. [Google Scholar] [CrossRef] [PubMed]
  45. Abdi, H. Bonferroni and Šidák Corrections for Multiple Comparisons. In Encyclopedia of Measurement and Statistics; Salkind, M.J., Ed.; Sage: Thousand Oaks, CA, USA, 2007. [Google Scholar]
  46. Kanehisa, M.; Araki, M.; Goto, S.; Hattori, M.; Hirakawa, M.; Itoh, M.; Katayama, T.; Kawashima, S.; Okuda, S.; Tokimatsu, T.; et al. KEGG for linking genomes to life and the environment. Nucleic Acids Res. 2008, 36, 480–484. [Google Scholar] [CrossRef] [PubMed]
  47. Liu, Y.B.; Qin, L.J.; Han, L.Z.; Xiang, Y.; Zhao, D.G. Overexpression of maize SDD1 (ZmSDD1) improves drought resistance in Zea mays L. by reducing stomatal density. Plant Cell 2015, 122, 147–159. [Google Scholar] [CrossRef]
  48. Stephen, A.B.; Vladimir, B.; Jeremy, A.G.; Jan, H.; Jim, H.; Mikael, K.; Reinhold, M.; Tania, N.; Michael, W.P.; Gregory, L.S.; et al. The MIQE guidelines: Minimum information for publication of quantitative real-time PCR experiments. Clin. Chem. 2009, 55, 611–622. [Google Scholar] [CrossRef]
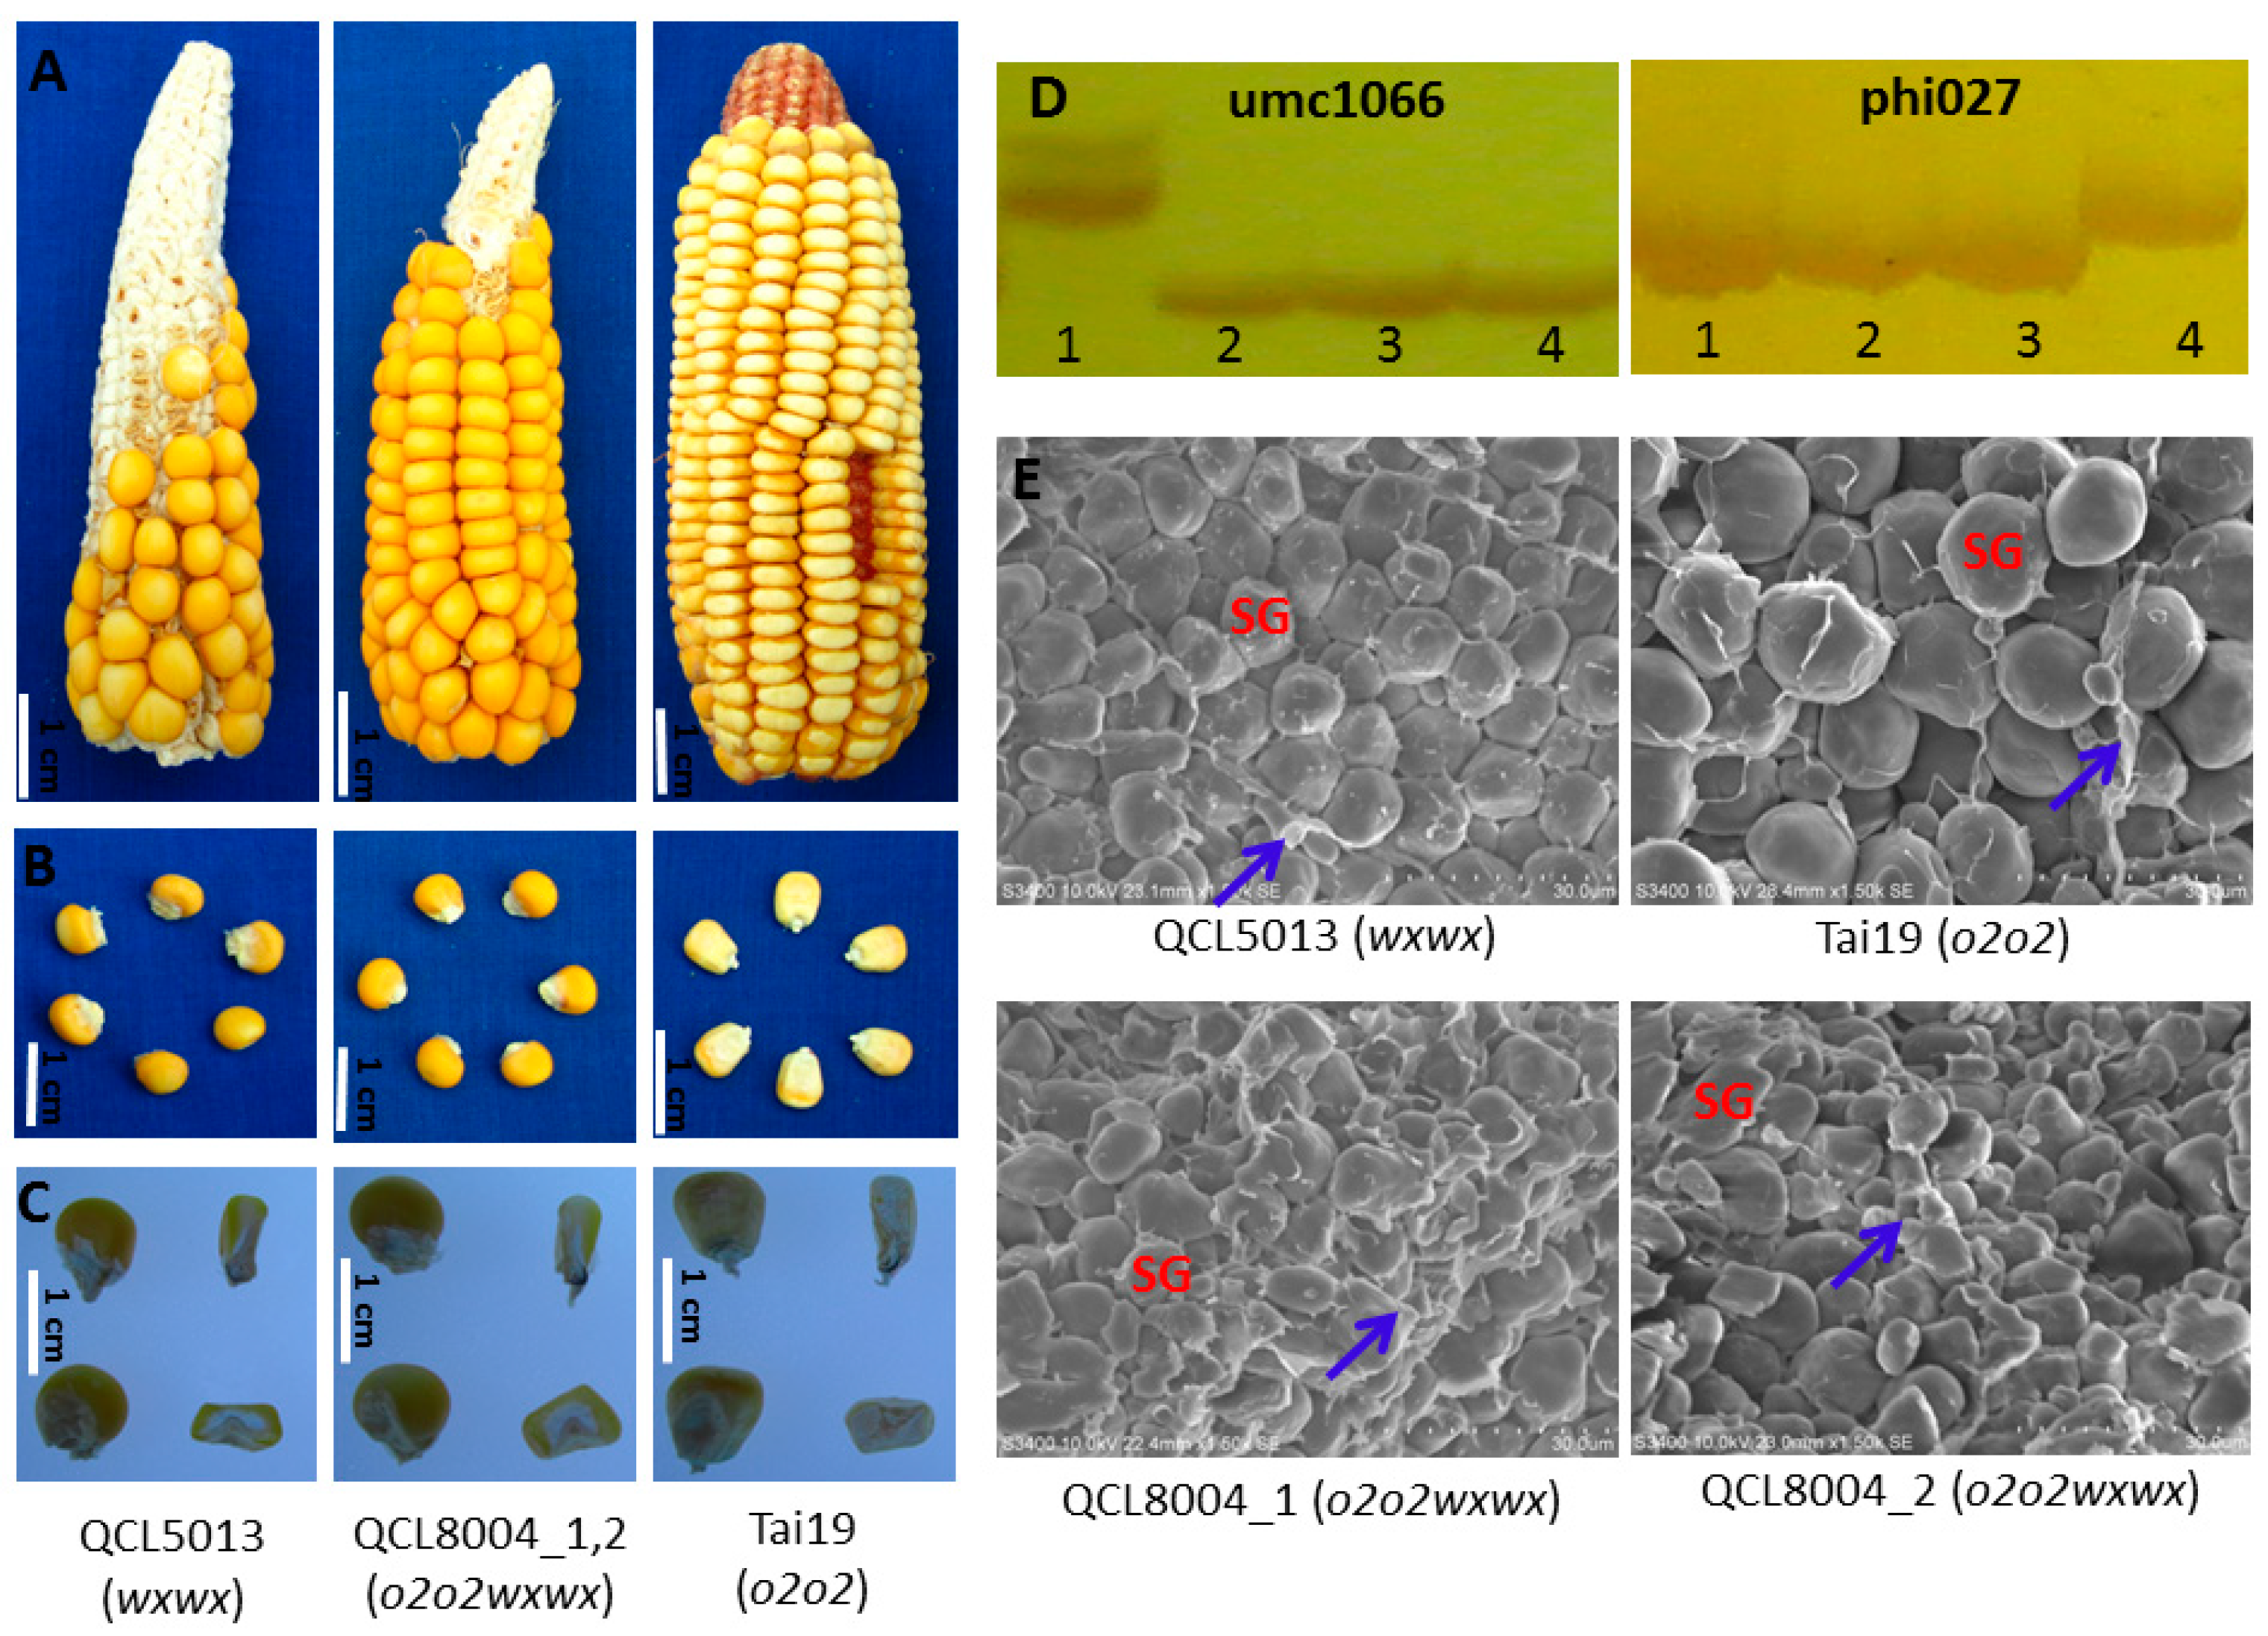
Figure 1. Phenotypic features of o2o2wxwx and recurrent parent. (A) Photographs of intact ears taken under normal light. (B) Photographs of mature kernels taken under normal light. (C) Light transmission of mature kernels on a light box, Bars = 1 cm. (D) Electrophoresis pattern of SSR marker for target gene o2 and wx. Lane 1, QCL5013; Lane 2, QCL8004_1; Lane 3, QCL8004_2; Lane 4, Tai19. (E) Scanning electron micrograph for endosperms of QCL8004_1, QCL8004_2, QCL5013, and Tai19 at 1500× magnification, respectively, Bars = 30 µm. SG, starch granules; Blue arrows, matrix protein.
Ijms 20 00684 g001
Figure 2. The background recovery rate (A) and recombination rate (B) of QCL8004_1 and QCL8004_2 in ten chromosomes.
Ijms 20 00684 g002
Figure 3. The number and percentage of identified genes in each sample.
Ijms 20 00684 g003
Figure 4. (A) Scatter plots of all expressed genes in each pairwise (QCL5013 vs. QCL8004_1). (B) Scatter plots of all expressed genes in each pairwise (QCL5013 vs. QCL8004_2). (C) Intersection heatmap of DEGs for each cluster plan.
Ijms 20 00684 g004
Figure 5. GO functional classification on DEGs for QCL5013 vs. QCL8004_1 and QCL5013 vs. QCL8004_2. Y axis means number of DEGs (the number is presented by its square root value). X axis represents GO terms. All GO terms are grouped into three ontologies: orange is for biological process, brown is for cellular component, and blue is for molecular function.
Ijms 20 00684 g005
Figure 6. KEGG functional classification of DEGs for QCL5013 vs. QCL8004_1 and QCL5013 vs. QCL8004_2. X axis means number of DEGs. Y axis represents second KEGG pathway terms. All second pathway terms are grouped in top pathway terms indicated in different colors.
Ijms 20 00684 g006
Figure 7. (A) The electrophoresis pattern of 10 DGEs by qRT-PCR. (B) The qRT-PCR log2 ratio (o2wx/wx). (C) The RNA-Seq log2 ratio (o2wx/wx) of 10 DGEs. (D) The qRT-PCR validation of 10 DGEs identified by RNA-seq, Pearson’s r = 0.8760. (E) The qRT-PCR validation of 10 DGEs identified by RNA-seq. Pearson’s r = 0.8843. P1, Zm00001d034771.1; P2, Zm00001d029385.1; P3, Zm00001d012262.1; P4, Zm00001d033483.1; P5, Zm00001d011063.1; P6, Zm00001d028561.1; P7, Zm00001d039935.1; P8, Zm00001d039936.1; P9, Zm00001d028408.1; P10, Zm00001d030185.1.
Ijms 20 00684 g007
Figure 8. A proposed model of the transcriptional regulatory framework for the O2 gene in waxy maize. Solid arrows, directly effected; dotted arrows, indirectly effected; full lines, directed related; dotted lines, indirectly related.
Ijms 20 00684 g008
Table 1. The contents of lysine and amylopectin of QCL8004_1, QCL8004_2, Tai 19, and QCL5013.
No.NameGenotypeLysine (%)±% to QCL5013Amylopectin (%)±% to QCL5013
1Tai19o2o20.43///
2QCL5013wxwx0.32/100/
3QCL8004_1o2o2wxwx0.3715.6398.95−1.05
4QCL8004_2o2o2wxwx0.3818.7598.64−1.36
Table 2. The qPCR primers of ten DEGs.
NO.Gene IDPrimer Sequences (5′-3′)Location of PrimerAmplicon Length (bp)
P1Zm00001d034771.1F: TGGTGGTGGTTGACTGTATTGExon 295
R: CACGGTAAGAACTGGCCTAATC
P2Zm00001d029385.1F: CCGATGCATCAAACAGAGAGAExon 4120
R: TCAGGTCGCTTCCTGAATAAC
P3Zm00001d012262.1F: AGTAAAGCAGCTCGTGTTCTAAExon 2103
R: CAATGTGGTAGTGTCGCAAATC
P4Zm00001d033483.1F: GGCATCGTGGAGAAGATCAAExon 1101
R: TCGCCGTGCTTCTTCTTT
P5Zm00001d011063.1F: CAACTATGTAGCGGCGTCTAAExon 2138
R: ACAGACACAGGCGGTAATG
P6Zm00001d028561.1F: AGGAGCACGAGGAGAAGAAExon 1108
R: CCTTGATCTGGTCTGCCTTG
P7Zm00001d039935.1F: TCTGGTTGAGCATCCAATCCExon 1102
R: TCGTAGAAGACACAGGAAACATC
P8Zm00001d039936.1F: GAGAACACCAAGGTGGATCAGExon 1 and 2113
R: CCAGAGATCTCAATAGCCTTCAC
P9Zm00001d028408.1F: CAGGAGAACAGGGACAACAGExon 2149
R: GGCGACATCGGATCAACTAA
P10Zm00001d030185.1F: GAGGCTAAAGAGAAGTGCAAGAExon 1117
R: CTCCTCTCCAACCCTAGATACA