Genome-Wide Detection of Major and Epistatic Effect QTLs for Seed Protein and Oil Content in Soybean Under Multiple Environments Using High-Density Bin Map

 ,
, 


Abstract
:
1. Introduction
2. Results
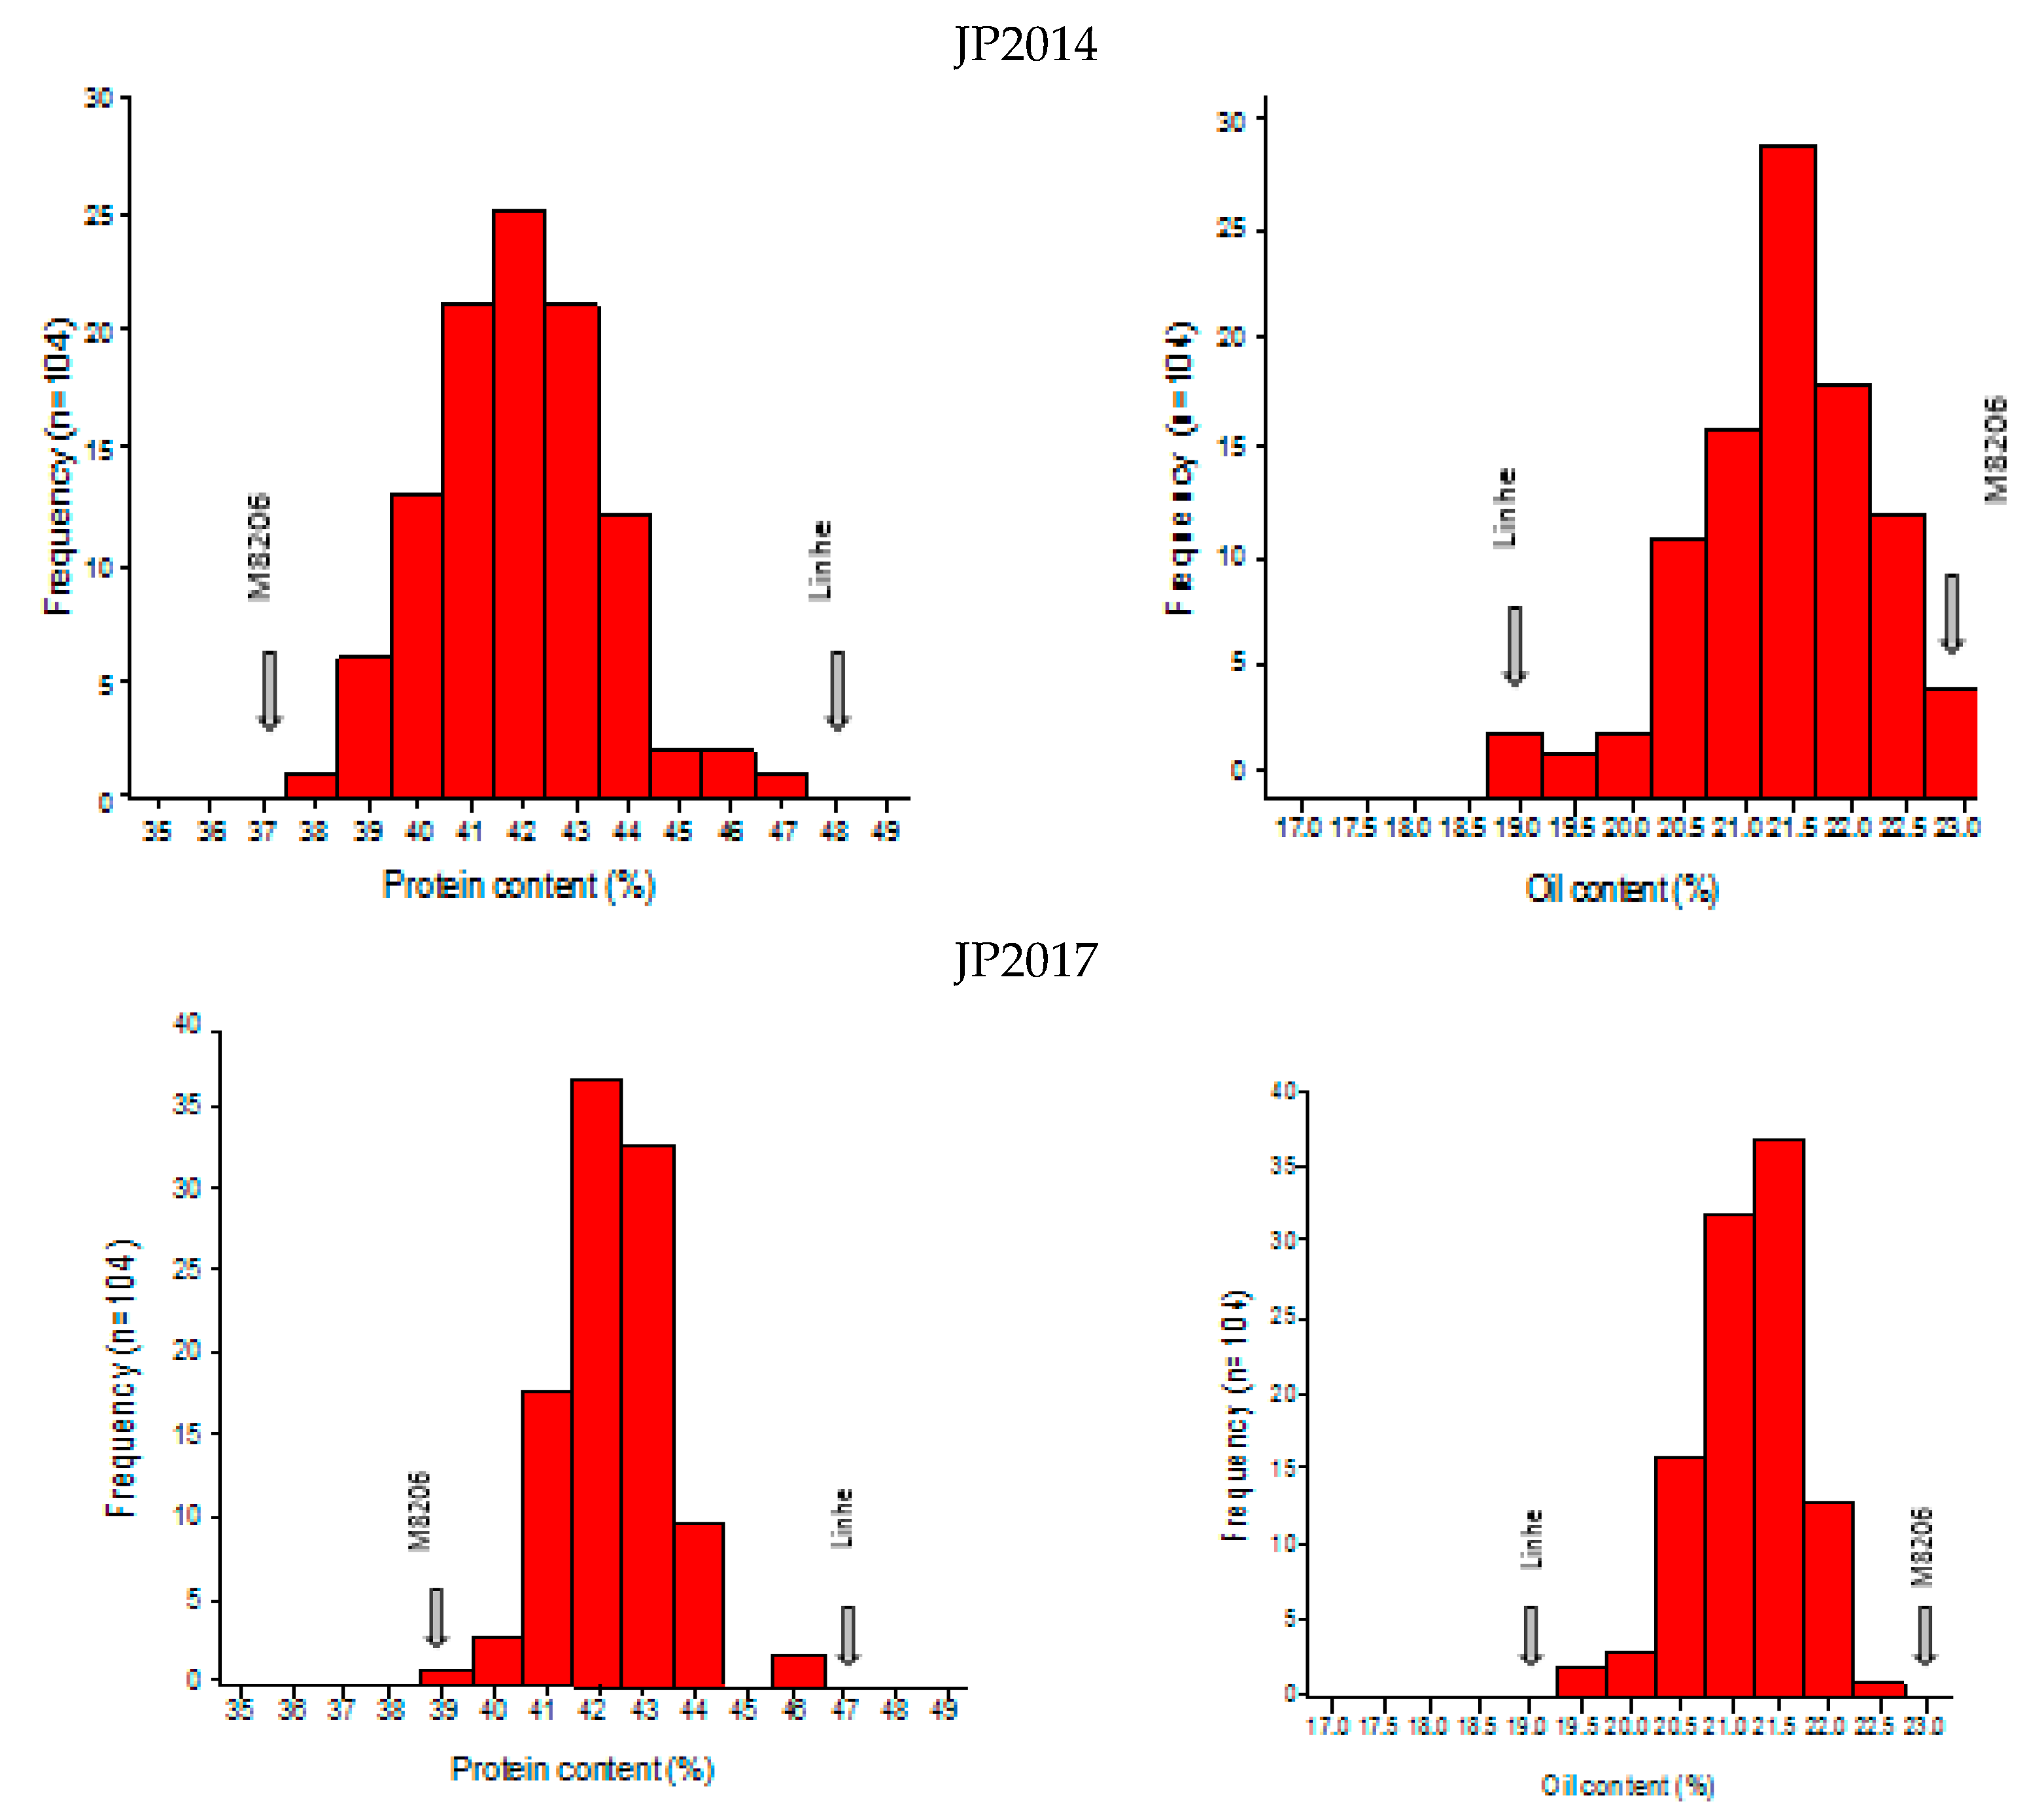
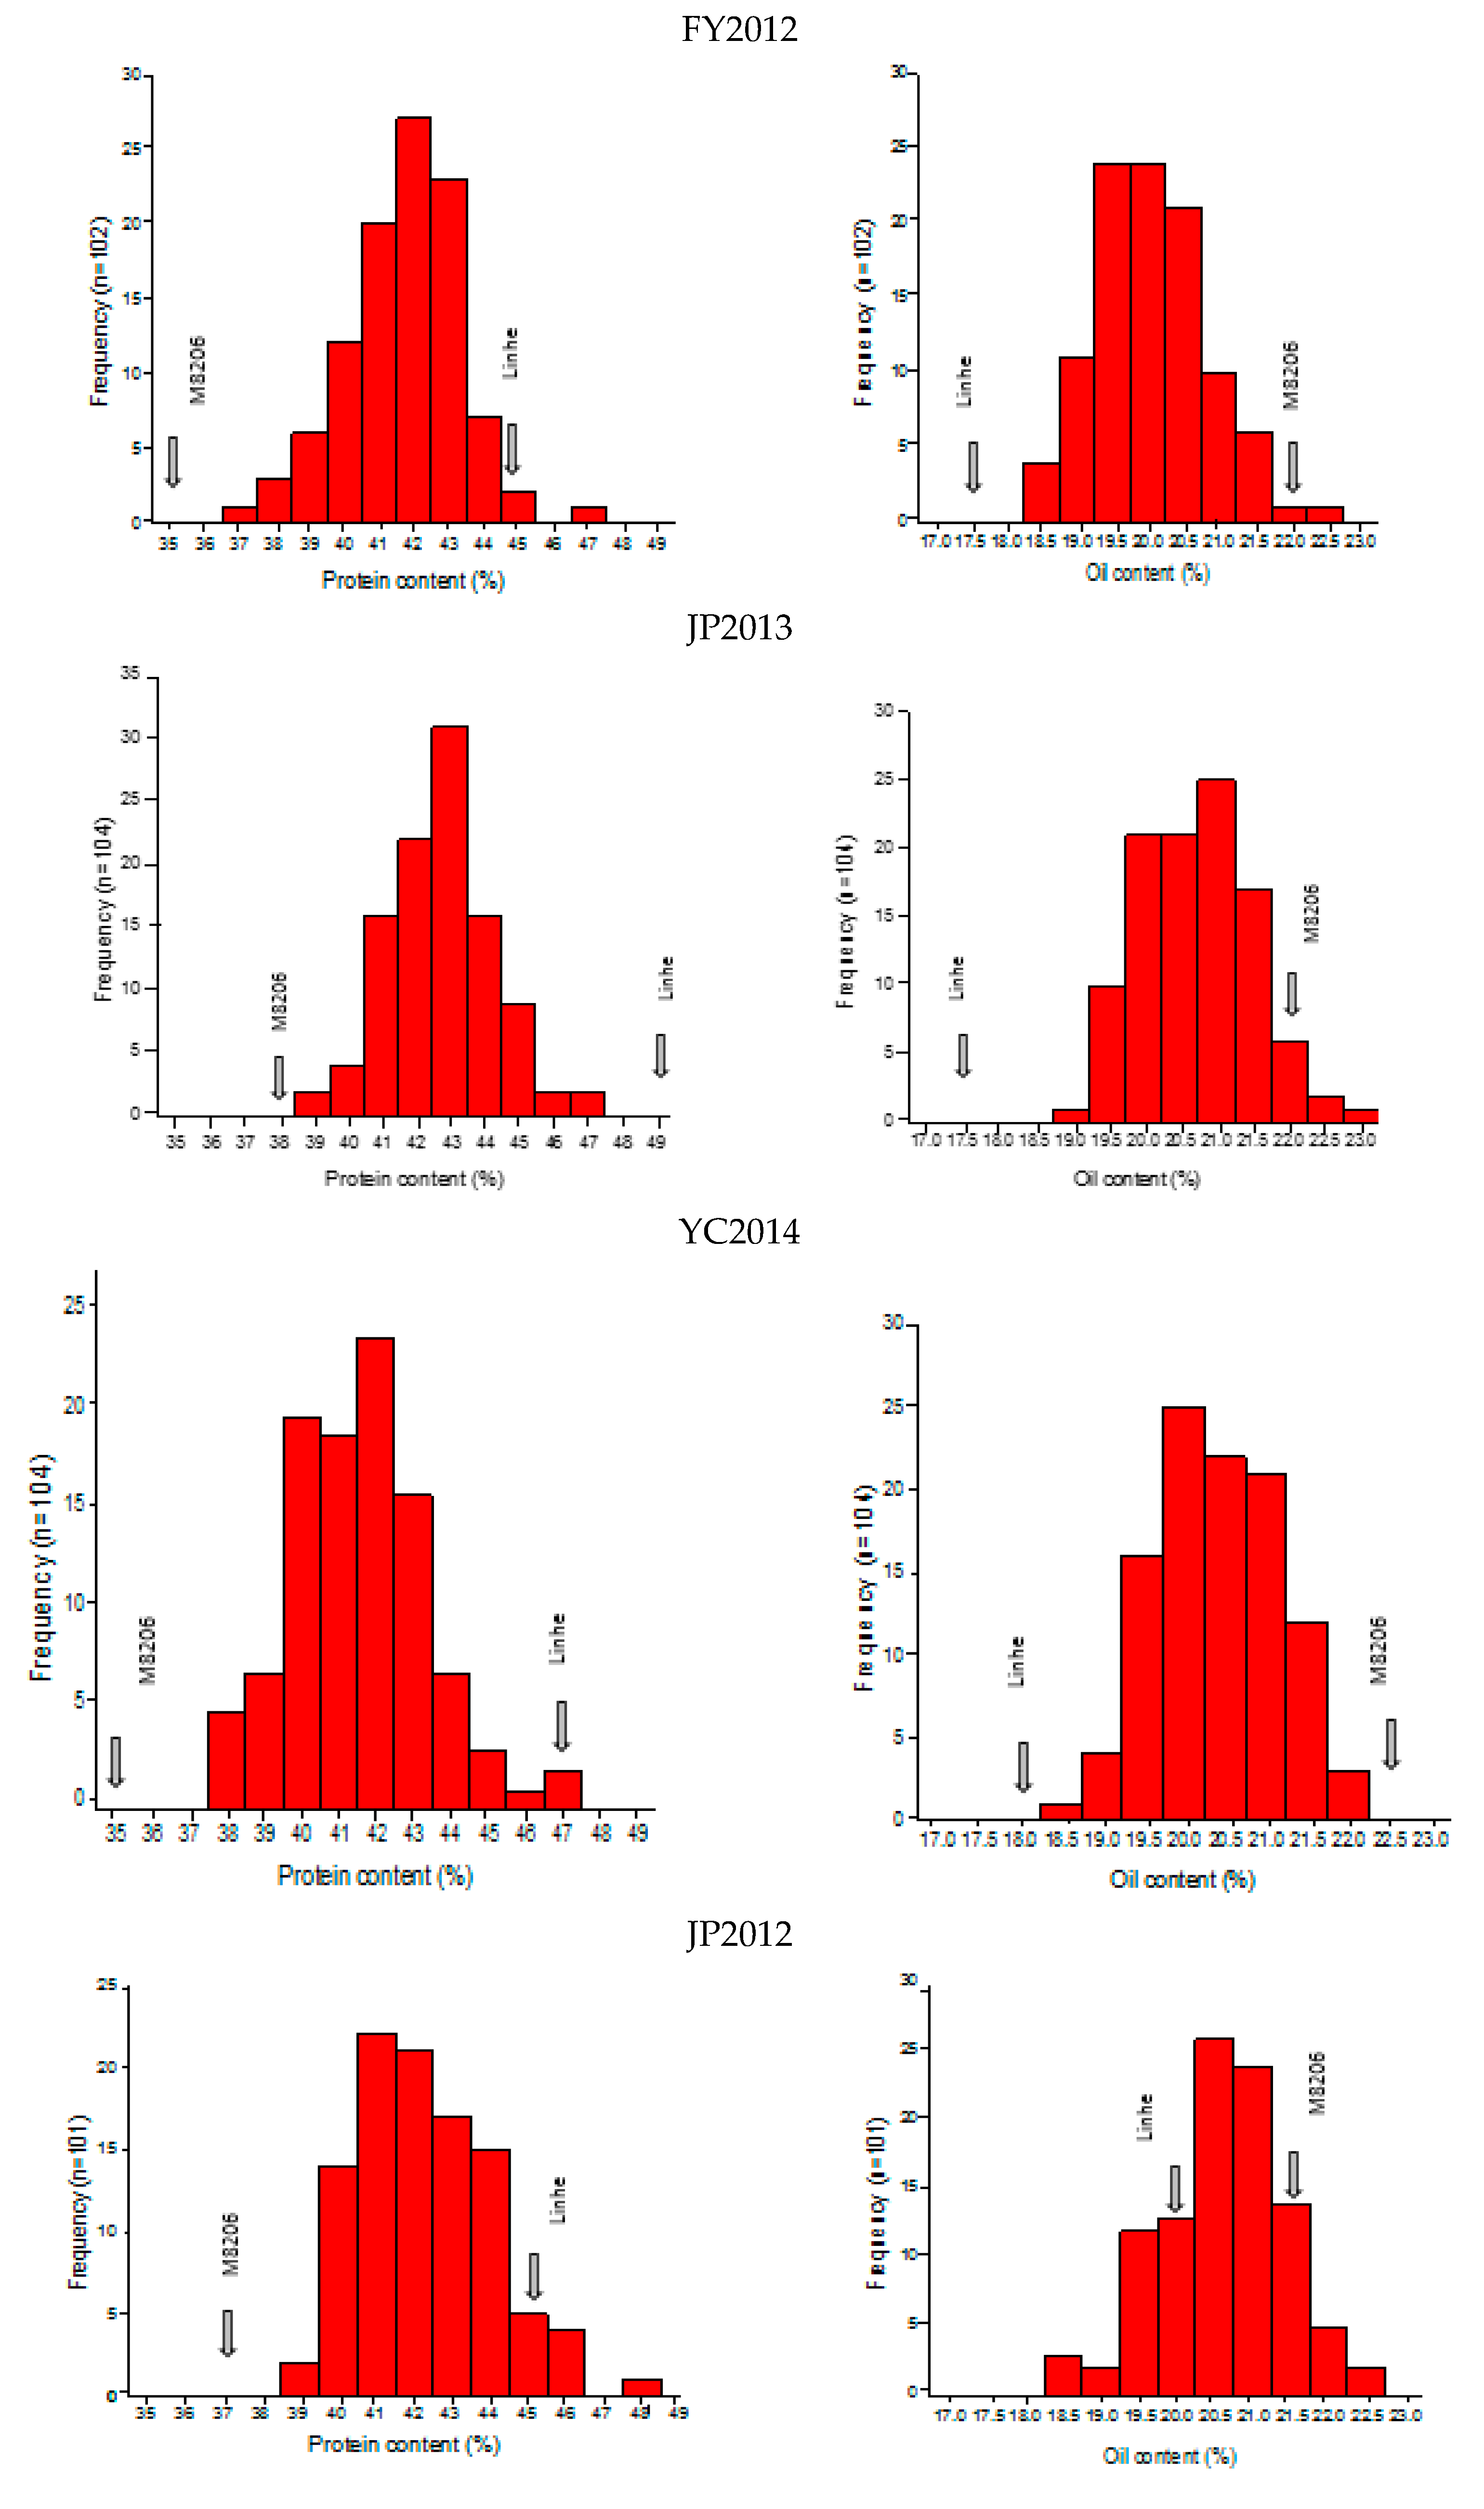
2.1. Phenotypic Analysis of Seed Protein and Oil Content
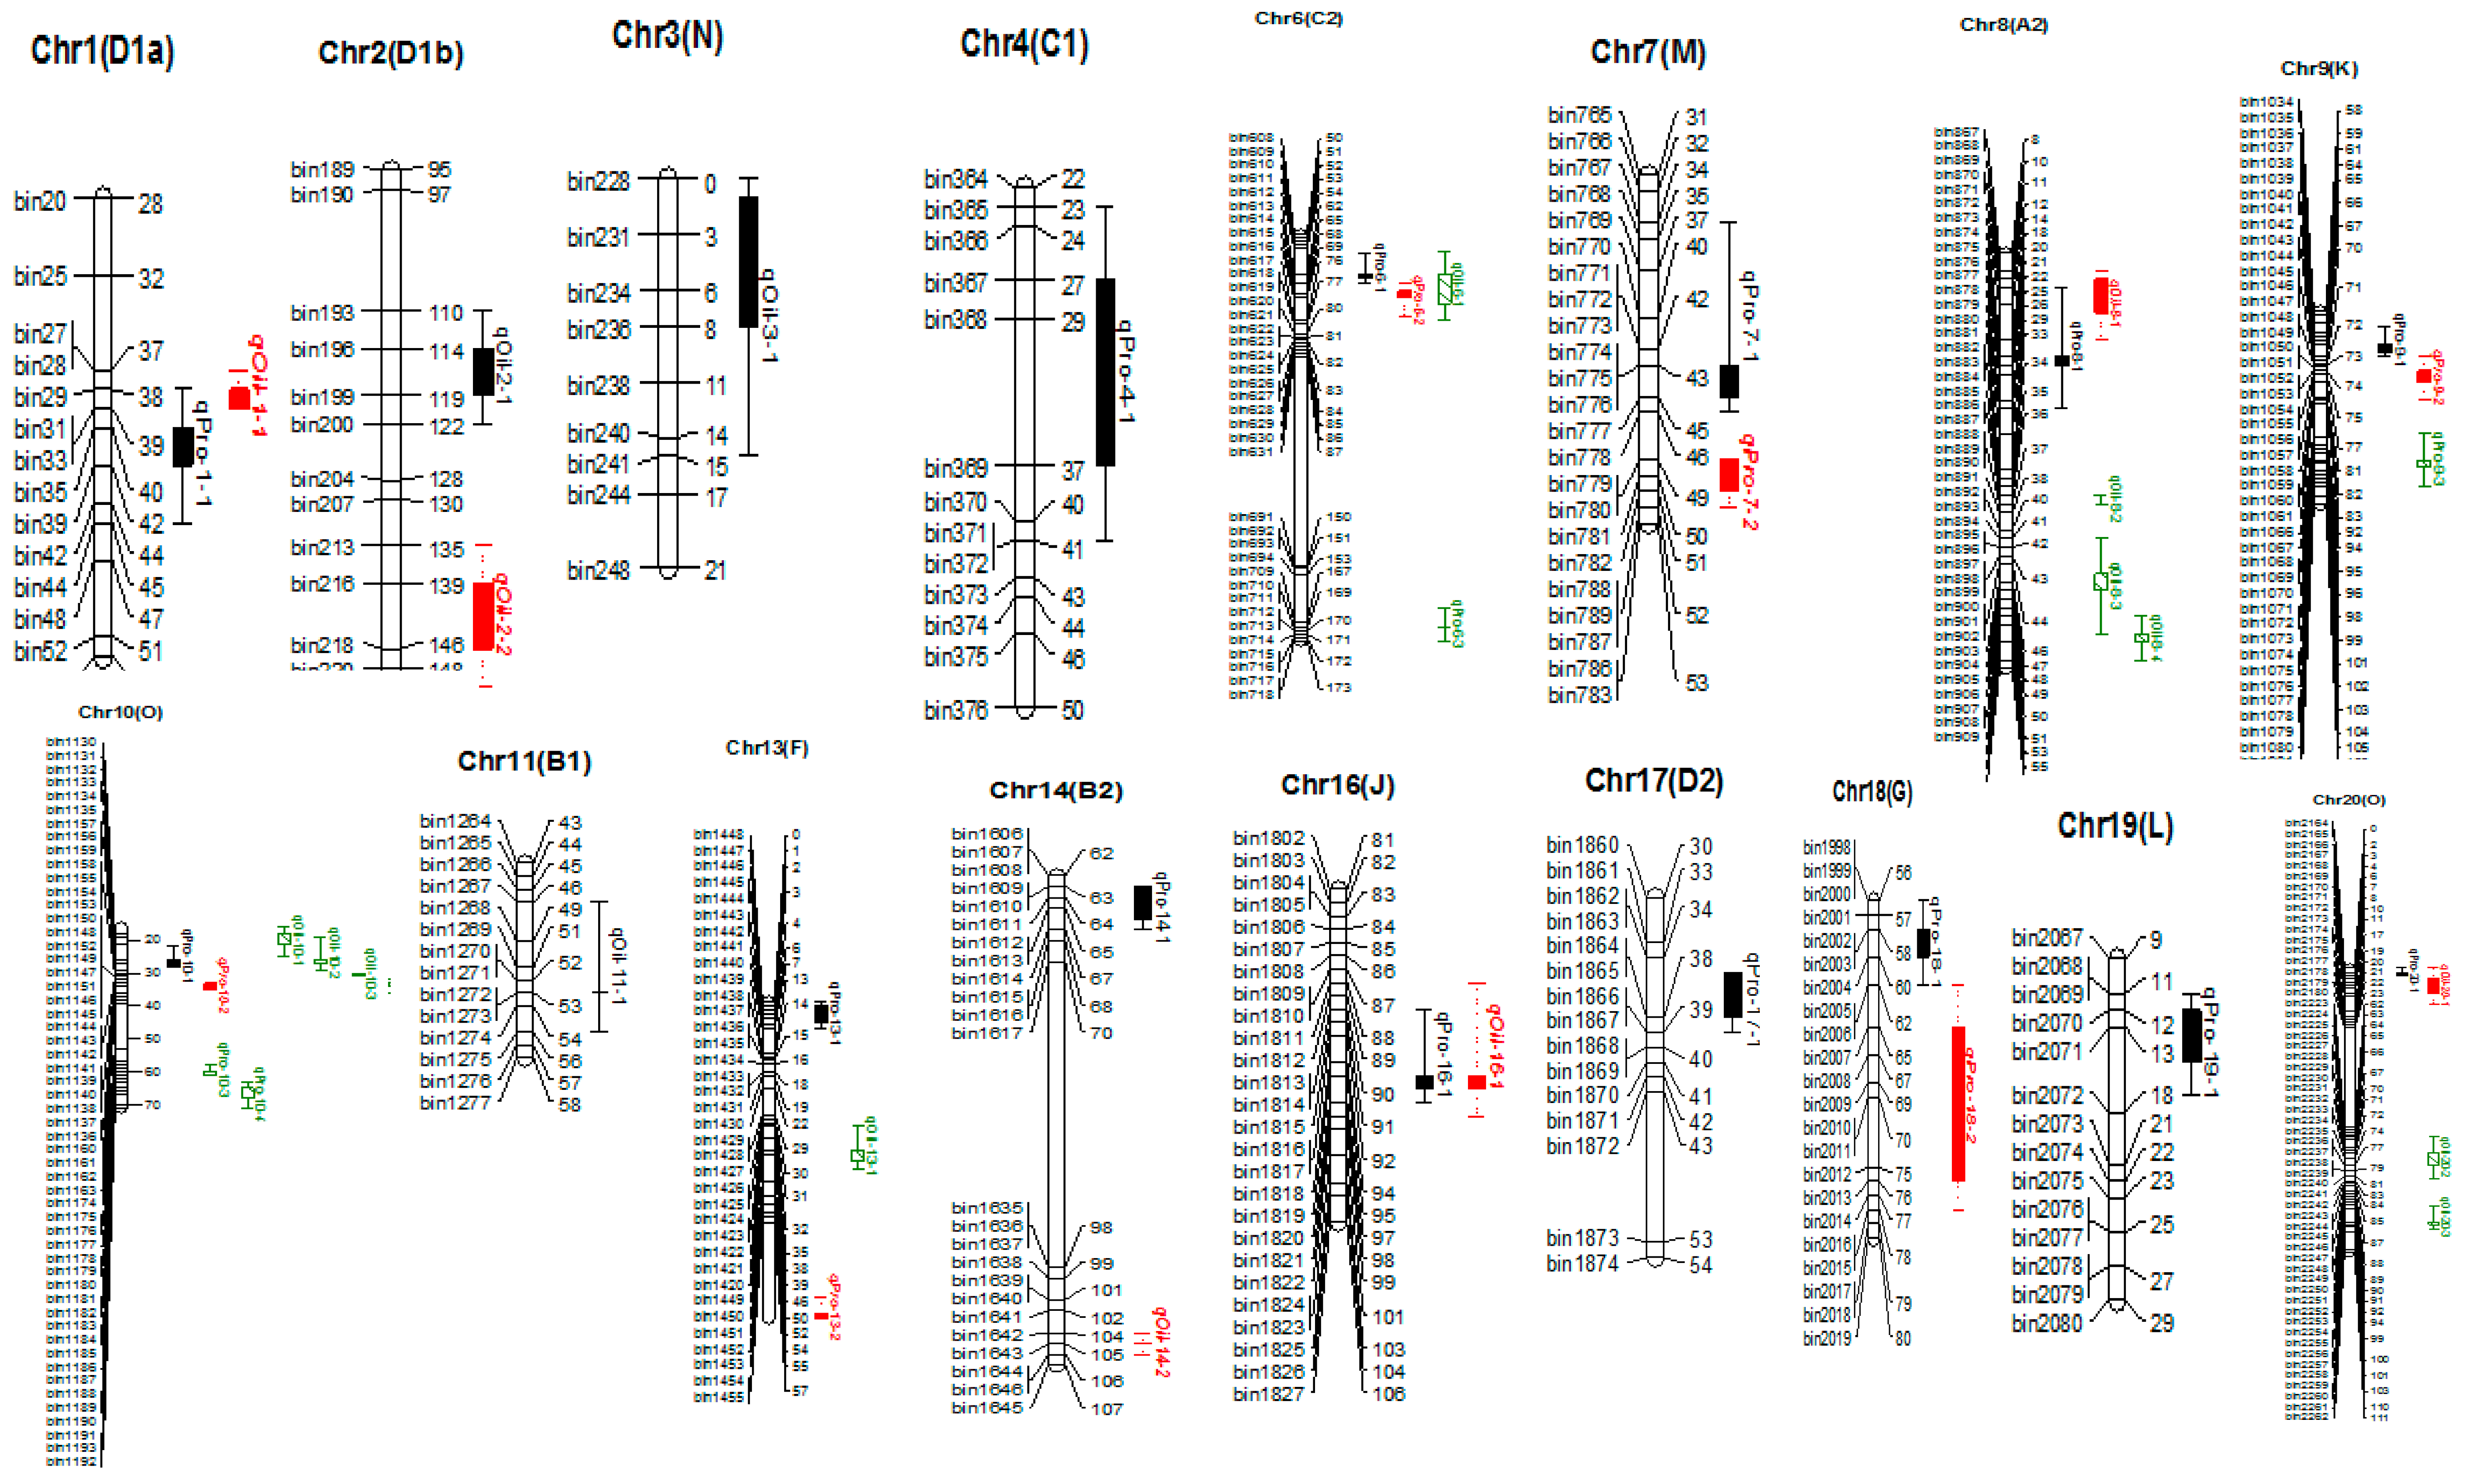
2.2. QTL Analysis for Seed Protein and Oil Content
2.3. QTL × Environment Interaction Analysis
2.4. Epistatic-Effect QTLs and Epistatic QTL Interactions with the Environment
2.5. Candidate Gene Prediction of the Major Stable QTLs
3. Discussion
4. Materials and Methods
4.1. Plant Material and Experimental Conditions
4.2. Measurement and Analysis of Seed Protein and Oil Contents
4.3. Bin Map Construction
4.4. Mapping of Main- and Epistatic-Effect QTLs
4.5. Identification of Candidate Genes
5. Conclusions
Supplementary Materials
Author Contributions
Acknowledgments
Conflicts of Interest
Abbreviations
| RAD-seq | Restriction site associated DNA sequencing |
| QTL | Quantitative trait loci |
| RIL | Recombinant inbred line |
| R2 | Phenotypic variation explained |
| GO | Gene ontology |
| RNA-seq | Ribonucleic acid sequencing |
| MAS | Marker-assisted selection |
| Q × E | QTL and environment interaction |
| RCBD | Randomized complete block design |
| ANOVA | Analysis of variance |
| MSG | Multiplexed shotgun genotyping |
| SNP | Single nucleotide polymorphism |
| CIM | Composite interval mapping |
| MCMC | Markov chain monte carlo |
References
- Wang, J.; Chen, P.; Wang, D.; Shannon, G.; Zeng, A.; Orazaly, M.; Wu, C. Identification and mapping of stable QTL for protein content in soybean seeds. Mol. Breed. 2015, 35, 92. [Google Scholar] [CrossRef]
- Han, Y.; Zhao, X.; Liu, D.; Li, Y.; Lightfoot, D.A.; Yang, Z.; Zhao, L.; Zhou, G.; Wang, Z.; Huang, L. Domestication footprints anchor genomic regions of agronomic importance in soybeans. New Phytol. 2016, 209, 871–884. [Google Scholar] [CrossRef] [PubMed]
- Yesudas, C.; Bashir, R.; Geisler, M.B.; Lightfoot, D. Identification of germplasm with stacked QTL underlying seed traits in an inbred soybean population from cultivars Essex and Forrest. Mol. Breed. 2013, 31, 693–703. [Google Scholar] [CrossRef]
- Messina, M. Soy and health update: Evaluation of the clinical and epidemiologic literature. Nutrients 2016, 8, 754. [Google Scholar] [CrossRef] [PubMed]
- Wilcox, J.R. World Distribution and Trade of Soybean. In Soybeans: Improvement, Production, and Uses, 3rd ed.; American Society of Agronomy: Madison, WI, USA, 2004; pp. 621–669. [Google Scholar]
- Li, D.; Zhao, X.; Han, Y.; Li, W.; Xie, F. Genome-wide association mapping for seed protein and oil contents using a large panel of soybean accessions. Genomics 2018, 111, 90–95. [Google Scholar] [CrossRef] [PubMed]
- Hyten, D.L.; Pantalone, V.R.; Sams, C.E.; Saxton, A.M.; Landau-Ellis, D.; Stefaniak, T.R.; Schmidt, M.E. Seed quality QTL in a prominent soybean population. Theor. Appl. Genet. 2004, 109, 552–561. [Google Scholar] [CrossRef] [PubMed] [Green Version]
- Patil, G.; Vuong, T.D.; Kale, S.; Valliyodan, B.; Deshmukh, R.; Zhu, C.; Wu, X.; Bai, Y.; Yungbluth, D.; Lu, F. Dissecting genomic hotspots underlying seed protein, oil, and sucrose content in an interspecific mapping population of soybean using high-density linkage mapping. Plant Biotechnol. J. 2018. [Google Scholar] [CrossRef] [PubMed]
- Burton, J.W.; Brim, C.A. Recurrent selection in soybeans. III. Selection for increased percent oil in seeds. Crop Sci. 1981, 21, 31–34. [Google Scholar] [CrossRef]
- Burton, J.W. Quantitative genetics: Results relevant to soybean breeding. In Soybeans: Improvement, Production, and Uses, 2nd ed.; American Society of Agronomy: Madison, WI, USA, 1987; pp. 211–241. [Google Scholar]
- Wilcox, J.R. Increasing seed protein in soybean with eight cycles of recurrent selection. Crop Sci. 1998, 38, 1536–1540. [Google Scholar] [CrossRef]
- Csanádi, G.; Vollmann, J.; Stift, G.; Lelley, T. Seed quality QTLs identified in a molecular map of early maturing soybean. Theor. Appl. Genet. 2001, 103, 912–919. [Google Scholar] [CrossRef]
- Jiang, Z.; Han, Y.; Teng, W.; Zhang, Z.; Sun, D.; Li, Y.; Li, W. Identification of QTL underlying the filling rate of protein at different developmental stages of soybean seed. Euphytica 2010, 175, 227–236. [Google Scholar] [CrossRef]
- Mao, T.; Jiang, Z.; Han, Y.; Teng, W.; Zhao, X.; Li, W. Identification of quantitative trait loci underlying seed protein and oil contents of soybean across multi-genetic backgrounds and environments. Plant Breed. 2013, 132, 630–641. [Google Scholar] [CrossRef]
- Qi, Z.; Pan, J.; Han, X.; Qi, H.; Xin, D.; Li, W.; Mao, X.; Wang, Z.; Jiang, H.; Liu, C. Identification of major QTLs and epistatic interactions for seed protein concentration in soybean under multiple environments based on a high-density map. Mol. Breed. 2015, 36, 55. [Google Scholar] [CrossRef]
- Zhang, Y.; Li, W.; Lin, Y.; Zhang, L.; Wang, C.; Xu, R. Construction of a high-density genetic map and mapping of QTLs for soybean (Glycine max) agronomic and seed quality traits by specific length amplified fragment sequencing. BMC Genom. 2018, 19, 641. [Google Scholar] [CrossRef] [PubMed]
- Diers, B.W.; Keim, P.; Fehr, W.R.; Shoemaker, R.C. RFLP analysis of soybean seed protein and oil content. Theor. Appl. Genet. 1992, 83, 608–612. [Google Scholar] [CrossRef] [PubMed]
- Brummer, E.C.; Graef, G.L.; Orf, J.; Wilcox, J.R.; Shoemaker, R.C. Mapping QTL for seed protein and oil content in eight soybean populations. Crop Sci. 1997, 37, 370–378. [Google Scholar] [CrossRef]
- Kabelka, E.A.; Diers, B.W.; Fehr, W.R.; Leroy, A.R.; Baianu, I.C.; You, T.; Neece, D.J.; Nelson, R.L. Putative alleles for increased yield from soybean plant introductions. Crop Sci. 2004, 44, 784–791. [Google Scholar] [CrossRef]
- Eskandari, M. Identification and Localization of Quantitative Trait Loci (QTL) and Genes Associated with Oil Concentration in Soybean [Glycine max (L.) Merrill] Seed. Ph.D. Thesis, University of Guelph, Guelph, ON, Canada, 2012. [Google Scholar]
- Wang, X.; Jiang, G.L.; Green, M.; Scott, R.A.; Song, Q.; Hyten, D.L.; Cregan, P.B. Identification and validation of quantitative trait loci for seed yield, oil and protein contents in two recombinant inbred line populations of soybean. Mol. Genet. Genom. 2014, 289, 935–949. [Google Scholar] [CrossRef] [PubMed] [Green Version]
- Teng, W.; Li, W.; Zhang, Q.I.; Wu, D.; Zhao, X.; Li, H.; Han, Y.; Li, W. Identification of quantitative trait loci underlying seed protein content of soybean including main, epistatic and QTL × Environment effects in different regions of northeast china. Genome 2017, 60, 649–655. [Google Scholar] [CrossRef] [PubMed]
- Li, W.H.; Liu, W.; Liu, L.; You, M.S.; Liu, G.T.; Li, B.Y. QTL Mapping for wheat flour color with additive, epistatic, and QTL×Environmental interaction effects. Agric. Sci. China 2011, 10, 651–660. [Google Scholar] [CrossRef]
- Wang, D.; El-Basyoni, I.S.; Baenziger, P.S.; Crossa, J.; Eskridge, K.; Dweikat, I. Prediction of genetic values of quantitative traits with epistatic effects in plant breeding populations. Heredity 2012, 109, 313. [Google Scholar] [CrossRef] [PubMed]
- Bernardo, R. Molecular markers and selection for complex traits in plants: Learning from the last 20 years. Crop Sci. 2008, 48, 1649–1664. [Google Scholar] [CrossRef]
- Sun, F.D.; Zhang, J.H.; Wang, S.F.; Gong, W.K.; Shi, Y.Z.; Liu, A.Y.; Li, J.W.; Gong, J.W.; Shang, H.H.; Yuan, Y.L. QTL mapping for fiber quality traits across multiple generations and environments in upland cotton. Mol. Breed. 2012, 30, 569–582. [Google Scholar] [CrossRef]
- Korir, P.C.; Qi, B.; Wang, Y.; Zhao, T.; Yu, D.; Chen, S.; Gai, J. A study on relative importance of additive, epistasis and unmapped QTL for Aluminium tolerance at seedling stage in soybean. Plant Breed. 2011, 130, 551–562. [Google Scholar] [CrossRef]
- Zhang, Y.H.; Liu, M.F.; He, J.B.; Wang, Y.F.; Xing, G.N.; Li, Y.; Yang, S.P.; Zhao, T.J.; Gai, J.Y. Marker-assisted breeding for transgressive seed protein content in soybean [Glycine max (L.) Merr.]. Theor. Appl. Genet. 2015, 128, 1061–1072. [Google Scholar] [CrossRef] [PubMed]
- Qi, Z.M.; Zhang, X.Y.; Qi, H.D.; Xin, D.W.; Han, X.; Jiang, H.W.; Yin, Z.H.; Zhang, Z.G.; Zhang, J.Z.; Zhu, R.S. Identification and validation of major QTLs and epistatic interactions for seed oil content in soybeans under multiple environments based on a high-density map. Euphytica 2017, 213, 162. [Google Scholar]
- Holland, J.B. Genetic architecture of complex traits in plants. Curr. Opin. Plant Biol. 2007, 10, 156–161. [Google Scholar] [CrossRef] [PubMed]
- Jannink, J.L.; Moreau, L.; Charmet, G.; Charcosset, A. Overview of QTL detection in plants and tests for synergistic epistatic interactions. Genetica 2009, 136, 225–236. [Google Scholar] [CrossRef] [PubMed]
- Jannink, J.L.; Wu, X.L. Estimating allelic number and identity in state of QTLs in interconnected families. Genet. Res. 2003, 81, 133–144. [Google Scholar] [CrossRef] [PubMed]
- Han, Y.; Teng, W.; Yu, K.; Poysa, V.; Anderson, T.; Qiu, L.; Lightfoot, D.A.; Li, W. Mapping QTL tolerance to Phytophthora root rot in soybean using microsatellite and RAPD/SCAR derived markers. Euphytica 2008, 162, 231–239. [Google Scholar] [CrossRef]
- Schmutz, J.; Cannon, S.; Schlueter, J.; Ma, J.; Mitros, T.; Nelson, W.; Hyten, D.L.; Song, Q.; Thelen, J.J.; Cheng, J. Genome sequence of the palaeopolyploid soybean. Nature 2010, 463, 178–183. [Google Scholar] [CrossRef] [PubMed]
- Xing, G.; Zhou, B.; Wang, Y.; Zhao, T.; Yu, D.; Chen, S.; Gai, J. Genetic components and major QTL confer resistance to bean pyralid (Lamprosema indicata Fabricius) under multiple environments in four RIL populations of soybean. Theor. Appl. Genet. 2012, 125, 859–875. [Google Scholar] [CrossRef] [PubMed]
- Jun, T.H.; Van, K.; Kim, M.Y.; Lee, S.H.; Walker, D.R. Association analysis using SSR markers to find QTL for seed protein content in soybean. Euphytica 2008, 162, 179–191. [Google Scholar] [CrossRef]
- Li, D.; Sun, M.; Han, Y.; Teng, W.; Li, W. Identification of QTL underlying soluble pigment content in soybean stems related to resistance to soybean white mold (Sclerotinia sclerotiorum). Euphytica 2010, 172, 49–57. [Google Scholar] [CrossRef]
- Reinprecht, Y.; Poysa, V.W.; Yu, K.; Rajcan, I.; Ablett, G.R.; Pauls, K.P. Seed and agronomic QTL in low linolenic acid, lipoxygenase-free soybean (Glycine max (L.) Merrill) germplasm. Genome 2006, 49, 1510–1527. [Google Scholar] [CrossRef] [PubMed]
- Eskandari, M.; Cober, E.R.; Rajcan, I. Genetic control of soybean seed oil: II. QTL and genes that increase oil concentration without decreasing protein or with increased seed yield. Theor. Appl. Genet. 2013, 126, 1677–1687. [Google Scholar] [CrossRef] [PubMed]
- Lu, W.; Wen, Z.; Li, H.; Yuan, D.; Li, J.; Zhang, H.; Huang, Z.; Cui, S.; Du, W. Identification of the quantitative trait loci (QTL) underlying water soluble protein content in soybean. Theor. Appl. Genet. 2013, 126, 425–433. [Google Scholar] [CrossRef] [PubMed]
- Leamy, L.J.; Zhang, H.; Li, C.; Chen, C.Y.; Song, B.H. A genome-wide association study of seed composition traits in wild soybean (Glycine soja ). BMC Genom. 2017, 18, 18. [Google Scholar] [CrossRef] [PubMed]
- Qiu, B.; Arelli, P.; Sleper, D. RFLP markers associated with soybean cyst nematode resistance and seed composition in a ‘Peking’×’Essex’population. Theor. Appl. Genet. 1999, 98, 356–364. [Google Scholar] [CrossRef]
- Qi, Z.M.; Sun, Y.N.; Wu, Q.; Liu, C.Y.; Hu, G.H.; Chen, Q.S. A meta-analysis of seed protein concentration QTL in soybean. Can. J. Plant Sci. 2011, 91, 221–230. [Google Scholar]
- Liang, H.Z.; Yu, Y.L.; Wang, S.F.; Yun, L.; Wang, T.F.; Wei, Y.L.; Gong, P.T.; Liu, X.Y.; Fang, X.J.; Zhang, M.C. QTL mapping of isoflavone, oil and protein contents in soybean (Glycine max L. Merr.). Agric. Sci. China 2010, 9, 1108–1116. [Google Scholar] [CrossRef]
- Tajuddin, T.; Watanabe, S.; Yamanaka, N.; Harada, K. Analysis of quantitative trait loci for protein and lipid contents in soybean seeds using recombinant inbred lines. Breed. Sci. 2003, 53, 133–140. [Google Scholar] [CrossRef]
- Wang, X.; Jiang, G.L.; Green, M.; Scott, R.A.; Hyten, D.L.; Cregan, P.B. Quantitative trait locus analysis of unsaturated fatty acids in a recombinant inbred population of soybean. Mol. Breed. 2014, 33, 281–296. [Google Scholar] [CrossRef]
- Cao, Y.; Li, S.; Wang, Z.; Chang, F.; Kong, J.; Gai, J.; Zhao, T. Identification of major quantitative trait loci for seed oil content in soybeans by combining linkage and genome-wide association mapping. Front. Plant Sci. 2017, 8, 1222. [Google Scholar] [CrossRef] [PubMed]
- Chung, J.; Babka, H.L.; Graef, G.L.; Staswick, P.E.; Lee, D.J.; Cregan, P.B.; Shoemaker, R.C.; Specht, J.E. The seed protein oil and yield QTL on soybean linkage group I. Crop Sci. Crop Sci. 2003, 43, 1053–1067. [Google Scholar] [CrossRef]
- Severin, A.J.; Woody, J.L.; Bolon, Y.T.; Joseph, B.; Diers, B.W.; Farmer, A.D.; Muehlbauer, G.J.; Nelson, R.T.; Grant, D.; Specht, J.E. RNA-Seq Atlas of Glycine max: A guide to the soybean transcriptome. BMC Plant Biol. 2010, 10, 160. [Google Scholar] [CrossRef] [PubMed]
- Sale, P.W.G.; Campbell, L.C. Changes in physical characteristics and composition of soybean seed during crop development. Field Crops Res. 1980, 3, 147–155. [Google Scholar] [CrossRef]
- Tamagno, S.; Adee, E.; Ciampitti, I. Effects of nitrogen in soybean seed quality definition during seed-filling period. Kans. Agric. Exp. Station Res. Rep. 2018, 4, 8. [Google Scholar] [CrossRef]
- Akond, M.; Liu, S.; Boney, M.; Kantartzi, S.K.; Meksem, K.; Bellaloui, N.; Lightfoot, D.A.; Kassem, M.A. Identification of quantitative trait loci (QTL) underlying protein, oil, and five major fatty acids’ contents in soybean. Am. J. Plant Sci. 2014, 5, 158. [Google Scholar] [CrossRef]
- Hwang, E.Y.; Song, Q.; Jia, G.; Specht, J.E.; Hyten, D.L.; Costa, J.; Cregan, P.B. A genome-wide association study of seed protein and oil content in soybean. BMC Genom. 2014, 15, 1. [Google Scholar] [CrossRef] [PubMed]
- Panthee, D.; Pantalone, V.; West, D.; Saxton, A.; Sams, C. Quantitative trait loci for seed protein and oil concentration, and seed size in soybean. Crop Sci. 2005, 45, 2015–2022. [Google Scholar] [CrossRef]
- Zou, G.; Zhai, G.; Feng, Q.; Yan, S.; Wang, A.; Zhao, Q.; Shao, J.; Zhang, Z.; Zou, J.; Han, B. Identification of QTLs for eight agronomically important traits using an ultra-high-density map based on SNPs generated from high-throughput sequencing in sorghum under contrasting photoperiods. J. Exp. Bot. 2012, 63, 5451. [Google Scholar] [CrossRef] [PubMed]
- Gutierrez-Gonzalez, J.J.; Vuong, T.D.; Zhong, R.; Yu, O.; Lee, J.-D.; Shannon, G.; Ellersieck, M.; Nguyen, H.T.; Sleper, D.A. Major locus and other novel additive and epistatic loci involved in modulation of isoflavone concentration in soybean seeds. Theor. Appl. Genet. 2011, 123, 1375–1385. [Google Scholar] [CrossRef] [PubMed]
- Xie, W.; Feng, Q.; Yu, H.; Huang, X.; Zhao, Q.; Xing, Y.; Yu, S.; Han, B.; Zhang, Q. Parent-independent genotyping for constructing an ultrahigh-density linkage map based on population sequencing. Proc. Natl. Acad. Sci. USA 2010, 107, 10578–10583. [Google Scholar] [CrossRef] [PubMed] [Green Version]
- Song, Q.J.; Jia, G.F.; Zhu, Y.L.; Grant, D.; Nelson, R.T.; Hwang, E.Y.; Hyten, D.L.; Cregan, P.B. Abundance of SSR motifs and development of candidate polymorphic SSR markers (BARCSOYSSR_1.0) in soybean. Crop Sci. 2010, 50, 1950–1960. [Google Scholar] [CrossRef]
- Hyten, D.L.; Choi, I.-Y.; Song, Q.; Specht, J.E.; Carter, T.E.; Shoemaker, R.C.; Hwang, E.-Y.; Matukumalli, L.K.; Cregan, P.B. A high density integrated genetic linkage map of soybean and the development of a 1536 universal soy linkage panel for quantitative trait locus mapping. Crop Sci. 2010, 50, 960–968. [Google Scholar] [CrossRef]
- Lee, S.; Freewalt, K.R.; McHale, L.K.; Song, Q.; Jun, T.-H.; Michel, A.P.; Dorrance, A.E.; Mian, M.R. A high-resolution genetic linkage map of soybean based on 357 recombinant inbred lines genotyped with BARCSoySNP6K. Mol. Breed. 2015, 35, 58. [Google Scholar] [CrossRef]
- Jansen, R.C.; Van Ooijen, J.W.; Stam, P.; Lister, C.; Dean, C. Genotype-by-environment interaction in genetic mapping of multiple quantitative trait loci. Theor. Appl. Genet. 1995, 91, 33–37. [Google Scholar] [CrossRef] [PubMed] [Green Version]
- Wang, F.; Guan, C.Y. Molecular mapping and identification of quantitative trait loci for yield components in rapeseed (Brasscia napus L.). Yi Chuan = Hereditas 2010, 32, 271–277. [Google Scholar] [CrossRef] [PubMed]
- Miao, H.; Xing-Fang, G.U.; Zhang, S.P.; Zhang, Z.H.; Huang, S.W.; Wang, Y.; Cheng, Z.C.; Zhang, R.W.; Sheng-Qi, M.U.; Man, L.I. Mapping QTLs for fruit-associated traits in Cucumis sativus L. Sci. Agric. Sin. 2011, 44, 5031–5040. [Google Scholar] [CrossRef]
- Miao, H.; Gu, X.F.; Zhang, S.P.; Zhang, Z.H.; Huang, S.W.; Wang, Y.; Fang, Z.Y. Mapping QTLs for seedling-associated traits in cucumber. Acta Hortic. Sin. 2012, 39, 879–887. [Google Scholar]
- Zhang, D.; Lü, H.; Chu, S.; Zhang, H.; Zhang, H.; Yang, Y.; Li, H.; Yu, D. The genetic architecture of water-soluble protein content and its genetic relationship to total protein content in soybean. Sci. Rep. 2017, 7, 5053. [Google Scholar] [CrossRef] [PubMed]
- Liu, X.; Jin, J.; Wang, G.; Herbert, S. Soybean yield physiology and development of high-yielding practices in Northeast China. Field Crops Res. 2008, 105, 157–171. [Google Scholar] [CrossRef]
- Allard, R. Genetic basis of the evolution of adaptedness in plants. In Adaptation in Plant Breeding; Springer: Berlin/Heidelberg, Germany, 1997; pp. 1–11. [Google Scholar]
- Li, W.; Sun, D.; Du, Y.; Chen, Q.; Zhang, Z.; Qiu, L.; Sun, G. Quantitative trait loci underlying the development of seed composition in soybean (Glycine max L. Merr.). Genome 2007, 50, 1067–1077. [Google Scholar] [CrossRef] [PubMed]
- Carlborg, O.; Haley, C.S. Epistasis: Too often neglected in complex trait studies? Nat. Rev. Genet. 2004, 5, 618–625. [Google Scholar] [CrossRef] [PubMed]
- Hill, J.E.; Breidebbach, R.W. Proteins of soybean seeds: II. Accumulation of the major protein components during seed development and maturation. Plant Physiol. 1974, 53, 747–751. [Google Scholar] [CrossRef] [PubMed]
- Matheny, T.; Hunt, P. Effects of irrigation on accumulation of soil and symbiotically fixed n by soybean grown on a norfolk loamy sand. Agron. J. 1983, 75, 719–722. [Google Scholar] [CrossRef]
- Vollmann, J.; Fritz, C.N.; Wagentristl, H.; Ruckenbauer, P. Environmental and genetic variation of soybean seed protein content under Central European growing conditions. J. Sci. Food Agric. 2000, 80, 1300–1306. [Google Scholar] [CrossRef]
- Lihua, C.Y.D. The Principle of high-yielding soybean and its culture technique. Acta Agron. Sin. 1982, 1, 006. [Google Scholar]
- Palanga, K.K.; Jamshed, M.; Rashid, M.; Gong, J.; Li, J.; Iqbal, M.S.; Liu, A.; Shang, H.; Shi, Y.; Chen, T. Quantitative trait locus mapping for verticillium wilt resistance in an Upland Cotton recombinant inbred line using SNP-based high density genetic map. Front. Plant Sci. 2017, 8, 382. [Google Scholar] [CrossRef] [PubMed]
- Zhang, W.K.; Wang, Y.J.; Luo, G.Z.; Zhang, J.S.; He, C.Y.; Wu, X.L.; Gai, J.Y.; Chen, S.Y. QTL mapping of ten agronomic traits on the soybean (Glycine max L. Merr.) genetic map and their association with EST markers. Theor. Appl. Genet. 2004, 108, 1131–1139. [Google Scholar] [CrossRef] [PubMed]
- Baird, N.A.; Etter, P.D.; Atwood, T.S.; Currey, M.C.; Shiver, A.L.; Lewis, Z.A.; Selker, E.U.; Cresko, W.A.; Johnson, E.A. Rapid SNP discovery and genetic mapping using sequenced RAD markers. PLoS ONE 2008, 3, e3376. [Google Scholar] [CrossRef] [PubMed]
- Andolfatto, P.; Davison, D.; Erezyilmaz, D.; Hu, T.T.; Mast, J.; Sunayama-Morita, T.; Stern, D.L. Multiplexed shotgun genotyping for rapid and efficient genetic mapping. Genome Res. 2011, 21, 610–617. [Google Scholar] [CrossRef] [PubMed] [Green Version]
- Li, R.; Yu, C.; Li, Y.; Lam, T.W.; Yiu, S.M.; Kristiansen, K.; Wang, J. SOAP2: An improved ultrafast tool for short read alignment. Bioinformatics 2009, 25, 1966–1967. [Google Scholar] [CrossRef] [PubMed]
- Li, R.; Li, Y.; Fang, X.; Yang, H.; Wang, J.; Kristiansen, K.; Wang, J. SNP detection for massively parallel whole-genome resequencing. Genome Res. 2009, 19, 1124–1132. [Google Scholar] [CrossRef] [PubMed] [Green Version]
- Manjarrez-Sandoval, P.; Carter, T.E.; Webb, D.; Burton, J. Heterosis in soybean and its prediction by genetic similarity measures. Crop Sci. 1997, 37, 1443–1452. [Google Scholar] [CrossRef]
- Peng, Y.; Hu, Y.; Mao, B.; Xiang, H.; Ye, S.; Pan, Y.; Sheng, X.; Li, Y.; Ni, X.; Xia, Y. Genetic analysis for rice grain quality traits in the YVB stable variant line using RAD-seq. Mol. Genet. Genom. 2015, 291, 1–11. [Google Scholar] [CrossRef] [PubMed]
- Van Ooijen, J.W.; Voorrips, R. JoinMap® 3.0, Software for the Calculation of Genetic Linkage Maps; Plant Research International: Wageningen, The Netherlands, 2001; pp. 1–51. [Google Scholar]
- Wang, S.; Basten, C.; Zeng, Z. Windows QTL Cartographer 2.5; Department of Statistics, North Carolina State University: Raleigh, NC, USA, 2007. [Google Scholar]
- Palomeque, L.; Li-Jun, L.; Li, W.; Hedges, B.; Cober, E.R.; Rajcan, I. QTL in mega-environments: II. Agronomic trait QTL co-localized with seed yield QTL detected in a population derived from a cross of high-yielding adapted x high-yielding exotic soybean lines. Theor. Appl. Genet. 2009, 119, 429–436. [Google Scholar] [CrossRef] [PubMed]
- Palomeque, L.; Liu, L.J.; Li, W.; Hedges, B.R.; Cober, E.R.; Smid, M.P.; Lukens, L.; Rajcan, I. Validation of mega-environment universal and specific QTL associated with seed yield and agronomic traits in soybeans. Theor. Appl. Genet. 2010, 120, 997–1003. [Google Scholar] [CrossRef] [PubMed]
- Voorrips, R.E. MapChart: Software for the graphical presentation of linkage maps and QTLs. J. Hered. 2002, 93, 77–78. [Google Scholar] [CrossRef] [PubMed]
- Wang, D.L.; Zhu, J.; Li, Z.K.L.; Paterson, A.H. Mapping QTLs with epistatic effects and QTL×environment interactions by mixed linear model approaches. Theor. Appl. Genet. 1999, 99, 1255–1264. [Google Scholar] [CrossRef]
- Yang, J.; Hu, C.; Hu, H.; Yu, R.; Xia, Z.; Ye, X.; Zhu, J. QTLNetwork: Mapping and visualizing genetic architecture of complex traits in experimental populations. Bioinformatics 2008, 24, 721–723. [Google Scholar] [CrossRef] [PubMed]
- Wang, C.S.; Rutledge, J.J.; Gianola, D. Bayesian analysis of mixed linear models via Gibbs sampling with an application to litter size in Iberian pigs. Genet. Select. Evol. 1994, 26, 91–115. [Google Scholar] [CrossRef]
- Yang, J.; Williams, Z.R.W. Mapping the genetic architecture of complex traits in experimental populations. Bioinformatics 2007, 23, 1527–1536. [Google Scholar] [CrossRef] [PubMed] [Green Version]


| QTLs Names a | Chr b | Pos (cM) c | LOD d | R2 (%) e | A f | Confidence Interval (cM) g | Env. h | Ref. i |
|---|---|---|---|---|---|---|---|---|
| qPro-1-I | 1 | 39.51 | 2.74 | 6.32 | 0.32 | 37.9–44.4 | CE | [18] |
| qPro-4-1 | 4 | 37.51 | 2.55 | 5.80 | −0.45 | 27.1–41.4 | YC2014 | New |
| qPro-6-1 | 6 | 62.11 | 6.17 | 15.09 | 0.74 | 56.1–65.4 | YC2014 | New |
| qPro-6-2 | 6 | 67.41 | 5.08 | 13.23 | 0.69 | 65.4–74.8 | YC2014 | New |
| qPro-6-3 | 6 | 168.61 | 3.47 | 11.16 | −2.58 | 163.5–172.7 | JP2012 | New |
| qPro-7-1 | 7 | 41.71 | 5.62 | 13.59 | 0.69 | 34.2–44.7 | YC2014 | New |
| 42.01 | 10.28 | 26.22 | 0.81 | 40.9–42.6 | JP2014 | |||
| 42.01 | 8.46 | 22.21 | 0.58 | 38.8–43.4 | CE | |||
| 44.91 | 4.34 | 14.04 | 2.85 | 42.9–46.1 | JP2012 | |||
| qPro-7-2 | 7 | 49.21 | 5.30 | 15.01 | 0.64 | 48.8–51.9 | JP2014 | [7] |
| 49.21 | 4.59 | 13.07 | 0.45 | 48.8–52.0 | CE | |||
| qPro-8-1 | 8 | 19.91 | 2.60 | 8.21 | 2.15 | 12.4–25.9 | JP2012 | New |
| qPro-9-1 | 9 | 67.41 | 3.51 | 7.70 | 0.46 | 61.6–69.5 | YC2014 | [14] |
| qPro-9-2 | 9 | 74.31 | 3.54 | 11.94 | 0.39 | 70.3–81.8 | JP2017 | [14] |
| qPro-9-3 | 9 | 97.71 | 2.78 | 6.40 | 0.33 | 91.3–105.4 | CE | [14] |
| qPro-10-1 | 10 | 26.11 | 8.93 | 21.52 | 0.76 | 22.3–27.5 | YC2014 | [36] |
| 26.11 | 6.26 | 15.35 | 0.49 | 23.1–28.4 | CE | |||
| qPro-10-2 | 10 | 33.31 | 5.46 | 13.62 | 0.48 | 32.9–33.9 | CE | New |
| 34.01 | 6.18 | 15.84 | 0.66 | 33.1–35.3 | YC2014 | |||
| qPro-10-3 | 10 | 59.51 | 3.66 | 8.10 | 0.46 | 58.0–61.3 | JP2014 | [37] |
| qPro-10-4 | 10 | 64.71 | 3.53 | 7.84 | 0.45 | 62.7–70.8 | JP2014 | [37] |
| qPro-13-1 | 13 | 0.91 | 3.24 | 10.27 | −2.11 | 0.0–06.6 | JP2013 | [38] |
| qPro-13-2 | 13 | 79.91 | 3.05 | 10.78 | −2.50 | 75.6–81.1 | JP2013 | [39] |
| qPro-14-1 | 14 | 63.41 | 2.70 | 8.46 | 0.32 | 62.9–67.0 | JP2017 | [40,41] |
| qPro-14-2 | 14 | 104.51 | 2.66 | 5.74 | 0.38 | 104.4–105.5 | JP2014 | [42] |
| qPro-16-1 | 16 | 94.71 | 3.20 | 6.96 | 0.42 | 89.2–97.2 | JP2014 | New |
| qPro-17-1 | 17 | 38.21 | 3.99 | 9.32 | 0.57 | 34.7–39.3 | YC2014 | New |
| qPro-18-1 | 18 | 57.51 | 4.52 | 10.09 | 0.50 | 56.4–61.6 | JP2014 | [40] |
| qPro-18-2 | 18 | 64.91 | 3.11 | 7.15 | 0.42 | 62.2–69.2 | JP2014 | [14] |
| 73.51 | 3.57 | 8.33 | 0.47 | 67.5–77.9 | YC2014 | |||
| qPro-19-1 | 19 | 11.91 | 3.52 | 8.05 | −0.55 | 10.7–17.2 | YC2014 | [39] |
| qPro-20-1 | 20 | 2.01 | 3.34 | 10.71 | 2.49 | 0.0–2.9 | JP2012 | New |
| QTLs Names a | Chr b | Pos (cM) c | LOD d | R2 (%) e | A f | Confidence Interval (cM) g | Env. h | Ref. i |
|---|---|---|---|---|---|---|---|---|
| qOil-1-1 | 1 | 39.31 | 4.88 | 10.58 | −0.29 | 37.4–39.5 | JP2014 | [33] |
| 40.01 | 4.13 | 10.14 | −0.24 | 37.9–43.3 | YC2014 | |||
| qOil-2-1 | 2 | 139.21 | 4.08 | 13.31 | 1.38 | 138.0–149.4 | JP2012 | [43] |
| qOil-2-2 | 2 | 114.01 | 3.10 | 7.73 | 0.23 | 110.8–121.9 | JP2013 | [14] |
| 97.61 | 2.55 | 4.92 | 0.13 | 94.7–110.9 | CE | |||
| qOil-3-1 | 3 | 6.11 | 2.83 | 8.96 | 1.09 | 0.9–15.4 | JP2012 | [14] |
| qOil-6-1 | 6 | 62.11 | 2.74 | 5.44 | −0.71 | 55.0–75.6 | FY2012 | New |
| qOil-8-1 | 8 | 11.41 | 2.77 | 6.03 | 0.14 | 09.7–17.6 | CE | [43] |
| qOil-8-2 | 8 | 36.71 | 2.93 | 7.98 | −0.16 | 36.3–37.0 | CE | New |
| qOil-8-3 | 8 | 42.81 | 4.08 | 10.49 | −0.24 | 40.7–43.8 | YC2014 | New |
| 45.51 | 2.88 | 6.19 | −0.21 | 43.8–51.7 | JP2014 | |||
| 46.91 | 7.91 | 19.37 | −0.25 | 44.2–49.4 | CE | |||
| qOil-8-4 | 8 | 51.81 | 4.70 | 12.69 | −0.27 | 50.1–55.2 | YC2014 | [44] |
| qOil-10-1 | 10 | 17.61 | 3.54 | 9.64 | −0.23 | 16.1–19.3 | YC2014 | [14] |
| 19.31 | 2.57 | 7.48 | −0.15 | 17.3–24.8 | JP2017 | |||
| qOil-10-2 | 10 | 23.01 | 3.70 | 10.94 | −0.27 | 19.0–26.1 | JP2013 | New |
| 26.11 | 12.11 | 30.57 | −0.48 | 25.4–27.9 | JP2014 | |||
| 26.11 | 6.62 | 16.91 | −0.30 | 20.6–28.6 | YC2014 | |||
| 26.11 | 8.41 | 21.00 | −0.26 | 22.9–28.6 | CE | |||
| qOil-10-3 | 10 | 30.41 | 3.70 | 9.90 | −0.29 | 30.4–30.8 | JP2013 | [14,45] |
| qOil-10-4 | 10 | 32.91 | 5.66 | 14.50 | −0.32 | 32.2–33.6 | JP2013 | [14] |
| 33.31 | 6.06 | 15.65 | −0.29 | 32.9–35.3 | YC2014 | |||
| 33.31 | 7.66 | 19.42 | −0.25 | 32.9–35.6 | CE | |||
| 33.91 | 10.53 | 27.49 | −0.45 | 33.2–34.7 | JP2014 | |||
| qOil-11-1 | 11 | 52.91 | 4.85 | 12.61 | −0.31 | 46.0–55.5 | JP2013 | [43] |
| qOil-13-1 | 13 | 38.31 | 3.35 | 10.01 | 0.19 | 32.3–43.1 | JP2017 | [46] |
| qOil-16-1 | 16 | 94.71 | 3.92 | 8.69 | −0.17 | 87.7–97.8 | CE | New |
| qOil-20-1 | 20 | 4.41 | 3.09 | 9.86 | 1.20 | 0.0–13.8 | JP2012 | [47] |
| qOil-20-2 | 20 | 72.41 | 3.15 | 9.27 | 0.17 | 66.3–81.8 | JP2017 | [14] |
| qOil-20-3 | 20 | 99.21 | 3.92 | 8.28 | −0.25 | 92.7–102.2 | JP2014 | [14] |
| QTL | Chr | Position (cM) | Marker Range | Additive Effect | Additive x Environment Effect | |||||||
|---|---|---|---|---|---|---|---|---|---|---|---|---|
| A | H2 (%) | AE1 | AE2 | AE3 | AE4 | AE5 | AE6 | H2 (%) | ||||
| qOil-8-4 | 8 | 50.23 | bin908-bin909 | −0.21 ** | 7.38 | NS | NS | NS | NS | 0.29 ** | NS | 4.11 |
| qOil-10-2 | 10 | 26.12 | bin1134-bin1135 | −0.22 ** | 8.36 | NS | NS | NS | −0.12 * | 0.22 ** | NS | 2.40 |
| qOil-11-1 | 11 | 54.01 | bin1274-bin1275 | −0.16 ** | 4.64 | NS | NS | −0.10 * | NS | NS | NS | 2.18 |
| qOil-16-1 | 16 | 96.87 | bin1819-bin1820 | −0.14 ** | 3.52 | NS | NS | NS | NS | NS | 0.11 * | 0.47 |
| qPro-6-1 | 6 | 57.91 | bin612-bin613 | 0.38 ** | 5.55 | NS | NS | NS | NS | 0.25 * | −0.43 ** | 2.13 |
| qPro-7-1 | 7 | 41.68 | bin771-bin772 | 0.59 ** | 13.47 | NS | −0.17 ** | NS | −0.12 * | 0.55 ** | NS | 3.17 |
| qPro-10-1 | 10 | 26.12 | bin1134-bin1135 | 0.34 ** | 4.62 | NS | NS | −0.10 * | NS | 0.36 ** | NS | 1.62 |
| Trait | QTL | Chr_i | Pos_i | Marker Interval_i | QTL | Chr_j | Pos_j | Marker Interval_j | Epistatic (AA) Effect | Epistatic (AA) x Environment Effect | |||||||
|---|---|---|---|---|---|---|---|---|---|---|---|---|---|---|---|---|---|
| AA | H2 (%) | AAE1 | AAE2 | AAE3 | AAE4 | AAE5 | AAE6 | H2 (%) | |||||||||
| Oil | qOil-2-3 | 2 | 36.37 | bin132-bin133 | qOil-13-2 | 13 | 28.91 | bin1429-bin1430 | −0.14 ** | 3.81 | NS | −0.20 ** | NS | NS | NS | 0.12 * | 0.75 |
| Protein | qPro-2-1 | 2 | 150.55 | bin223-bin224 | qPro-13-3 | 13 | 57.27 | bin1455-bin1456 | 1.65 ** | 1.06 | NS | NS | NS | NS | 2.33 ** | −2.07 ** | 0.85 |
| Protein | qPro-17-2 | 17 | 78.16 | bin1892-bin1893 | qPro-17-3 | 17 | 94.43 | bin1911-bin1912 | 0.37 ** | 0.05 | 0.32 ** | NS | NS | NS | NS | −0.38 ** | 0.03 |
© 2019 by the authors. Licensee MDPI, Basel, Switzerland. This article is an open access article distributed under the terms and conditions of the Creative Commons Attribution (CC BY) license (http://creativecommons.org/licenses/by/4.0/).
Share and Cite
Karikari, B.; Li, S.; Bhat, J.A.; Cao, Y.; Kong, J.; Yang, J.; Gai, J.; Zhao, T. Genome-Wide Detection of Major and Epistatic Effect QTLs for Seed Protein and Oil Content in Soybean Under Multiple Environments Using High-Density Bin Map. Int. J. Mol. Sci. 2019, 20, 979. https://doi.org/10.3390/ijms20040979
Karikari B, Li S, Bhat JA, Cao Y, Kong J, Yang J, Gai J, Zhao T. Genome-Wide Detection of Major and Epistatic Effect QTLs for Seed Protein and Oil Content in Soybean Under Multiple Environments Using High-Density Bin Map. International Journal of Molecular Sciences. 2019; 20(4):979. https://doi.org/10.3390/ijms20040979
Chicago/Turabian StyleKarikari, Benjamin, Shuguang Li, Javaid Akhter Bhat, Yongce Cao, Jiejie Kong, Jiayin Yang, Junyi Gai, and Tuanjie Zhao. 2019. "Genome-Wide Detection of Major and Epistatic Effect QTLs for Seed Protein and Oil Content in Soybean Under Multiple Environments Using High-Density Bin Map" International Journal of Molecular Sciences 20, no. 4: 979. https://doi.org/10.3390/ijms20040979