Modeling of Protein–Protein Interactions in Cytokinin Signal Transduction

 and
and
Abstract
:
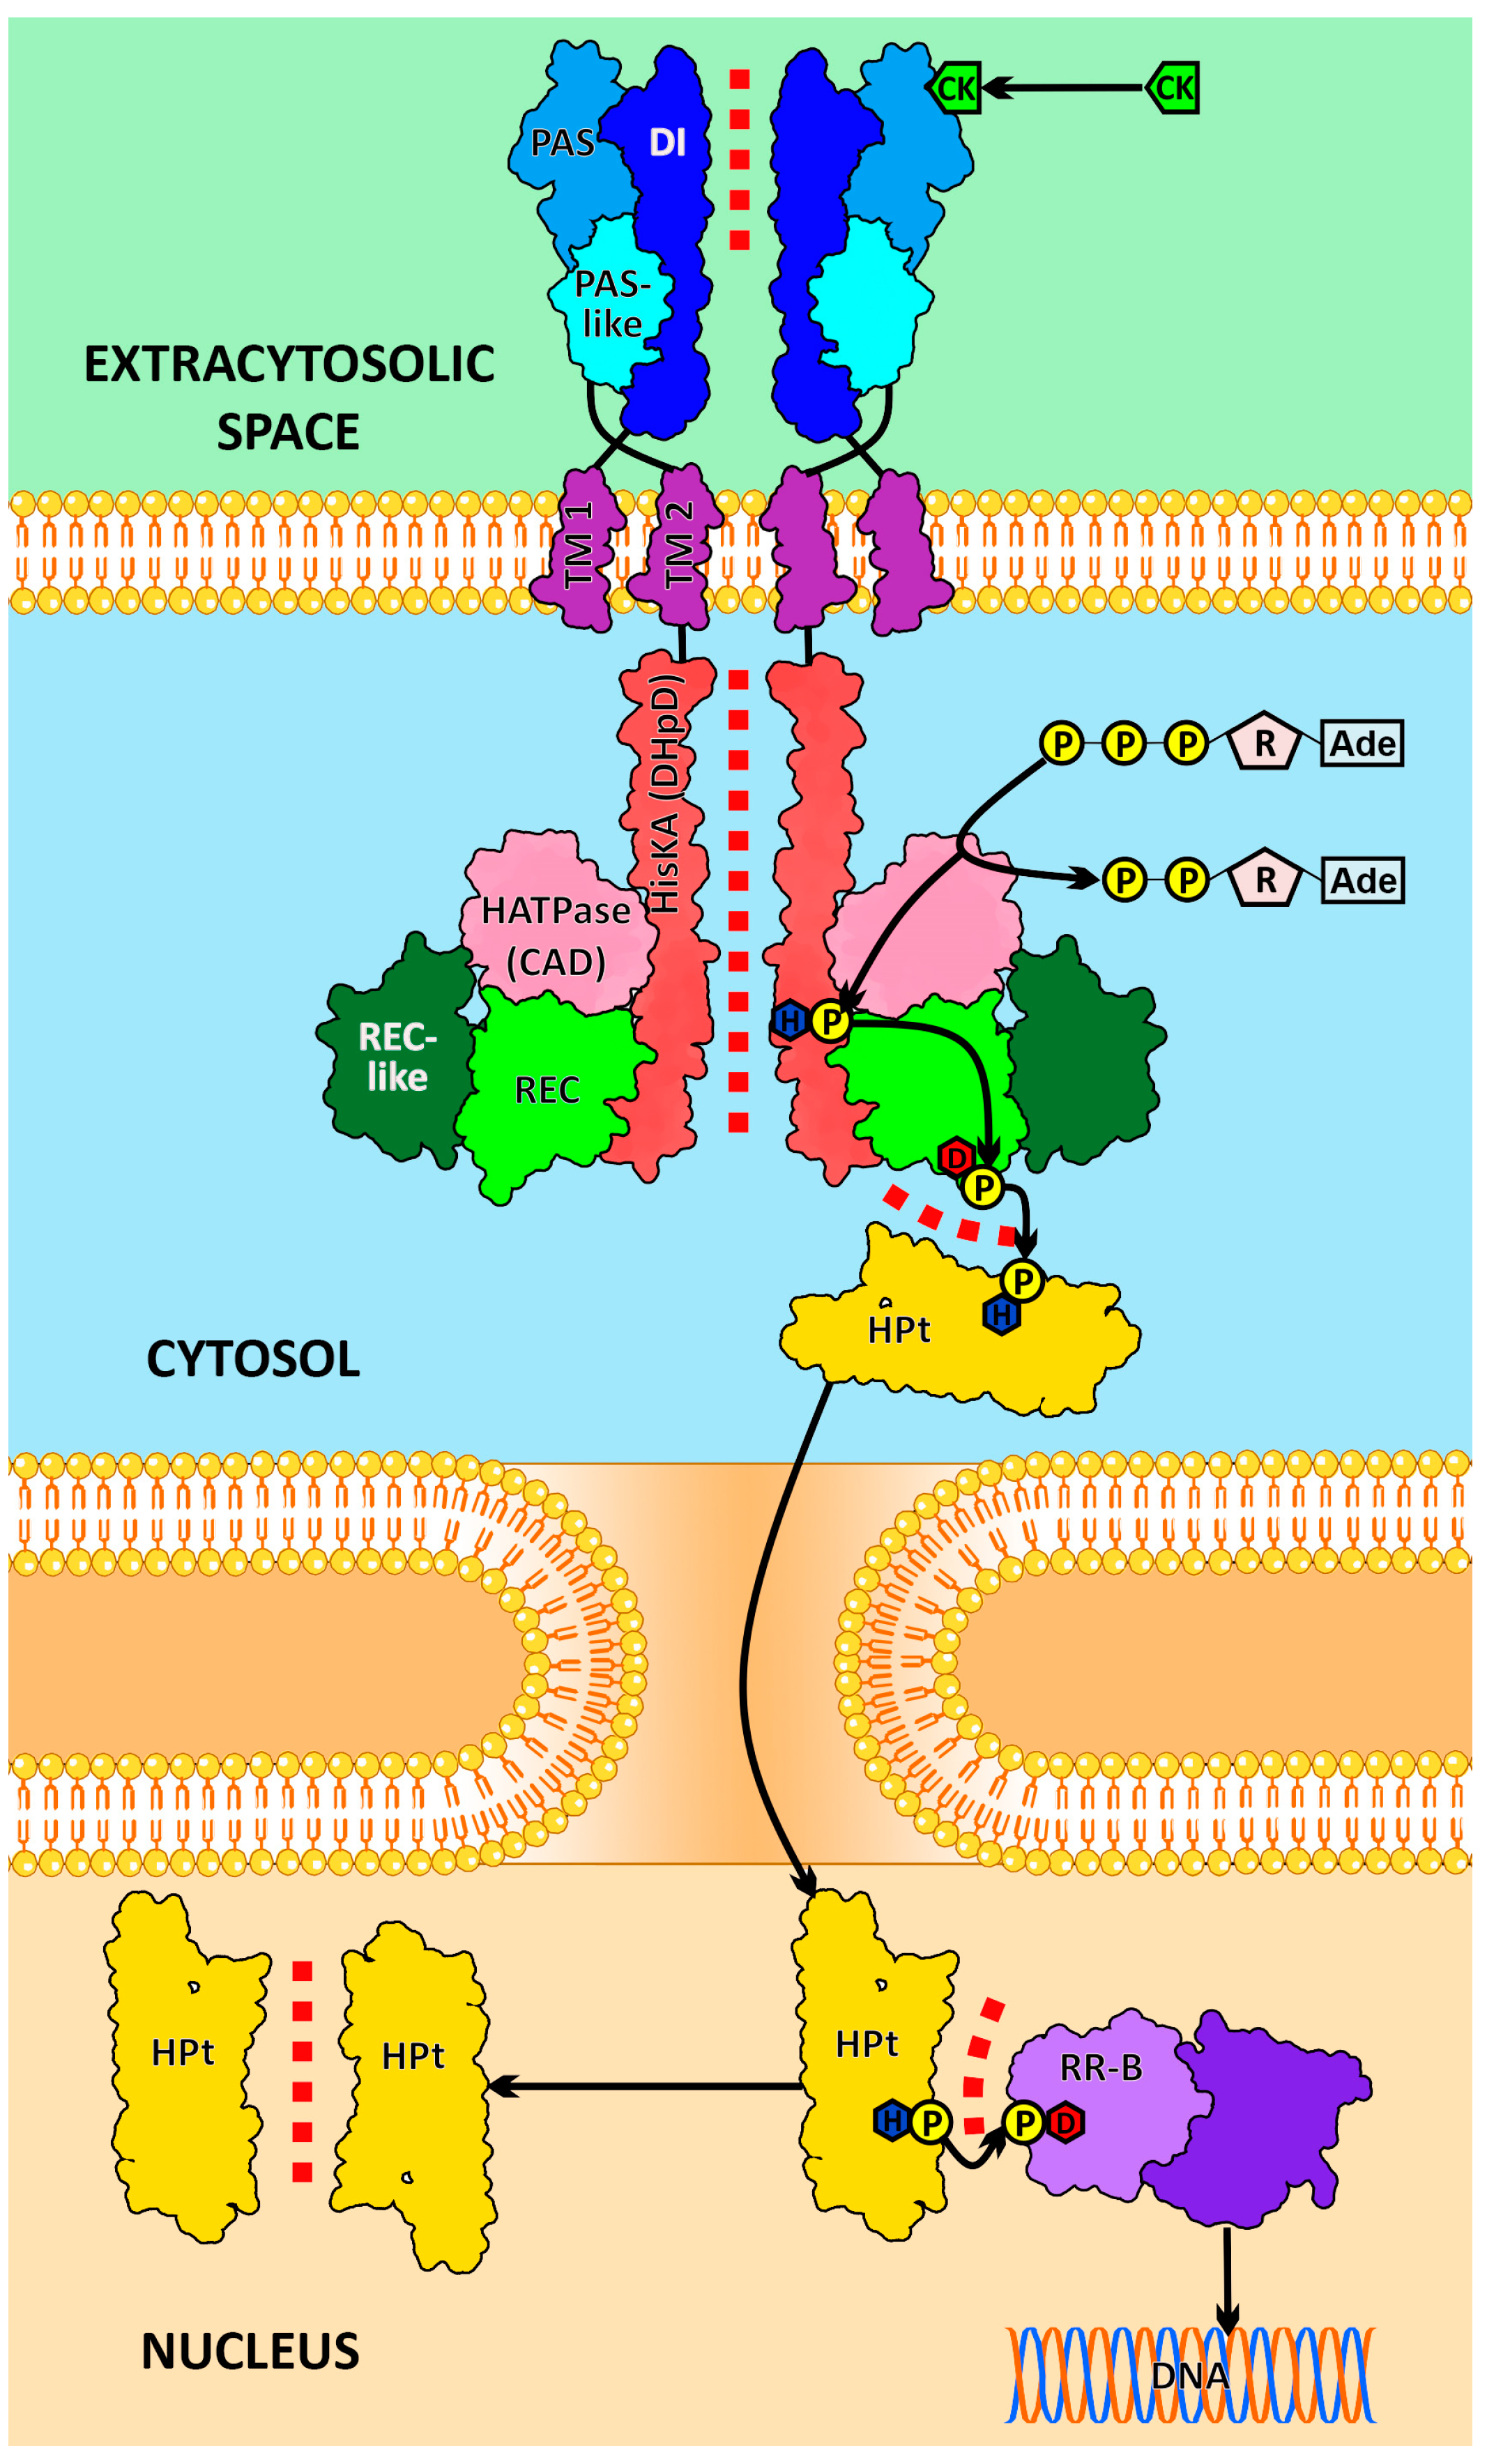
1. Introduction
2. Results and Discussion
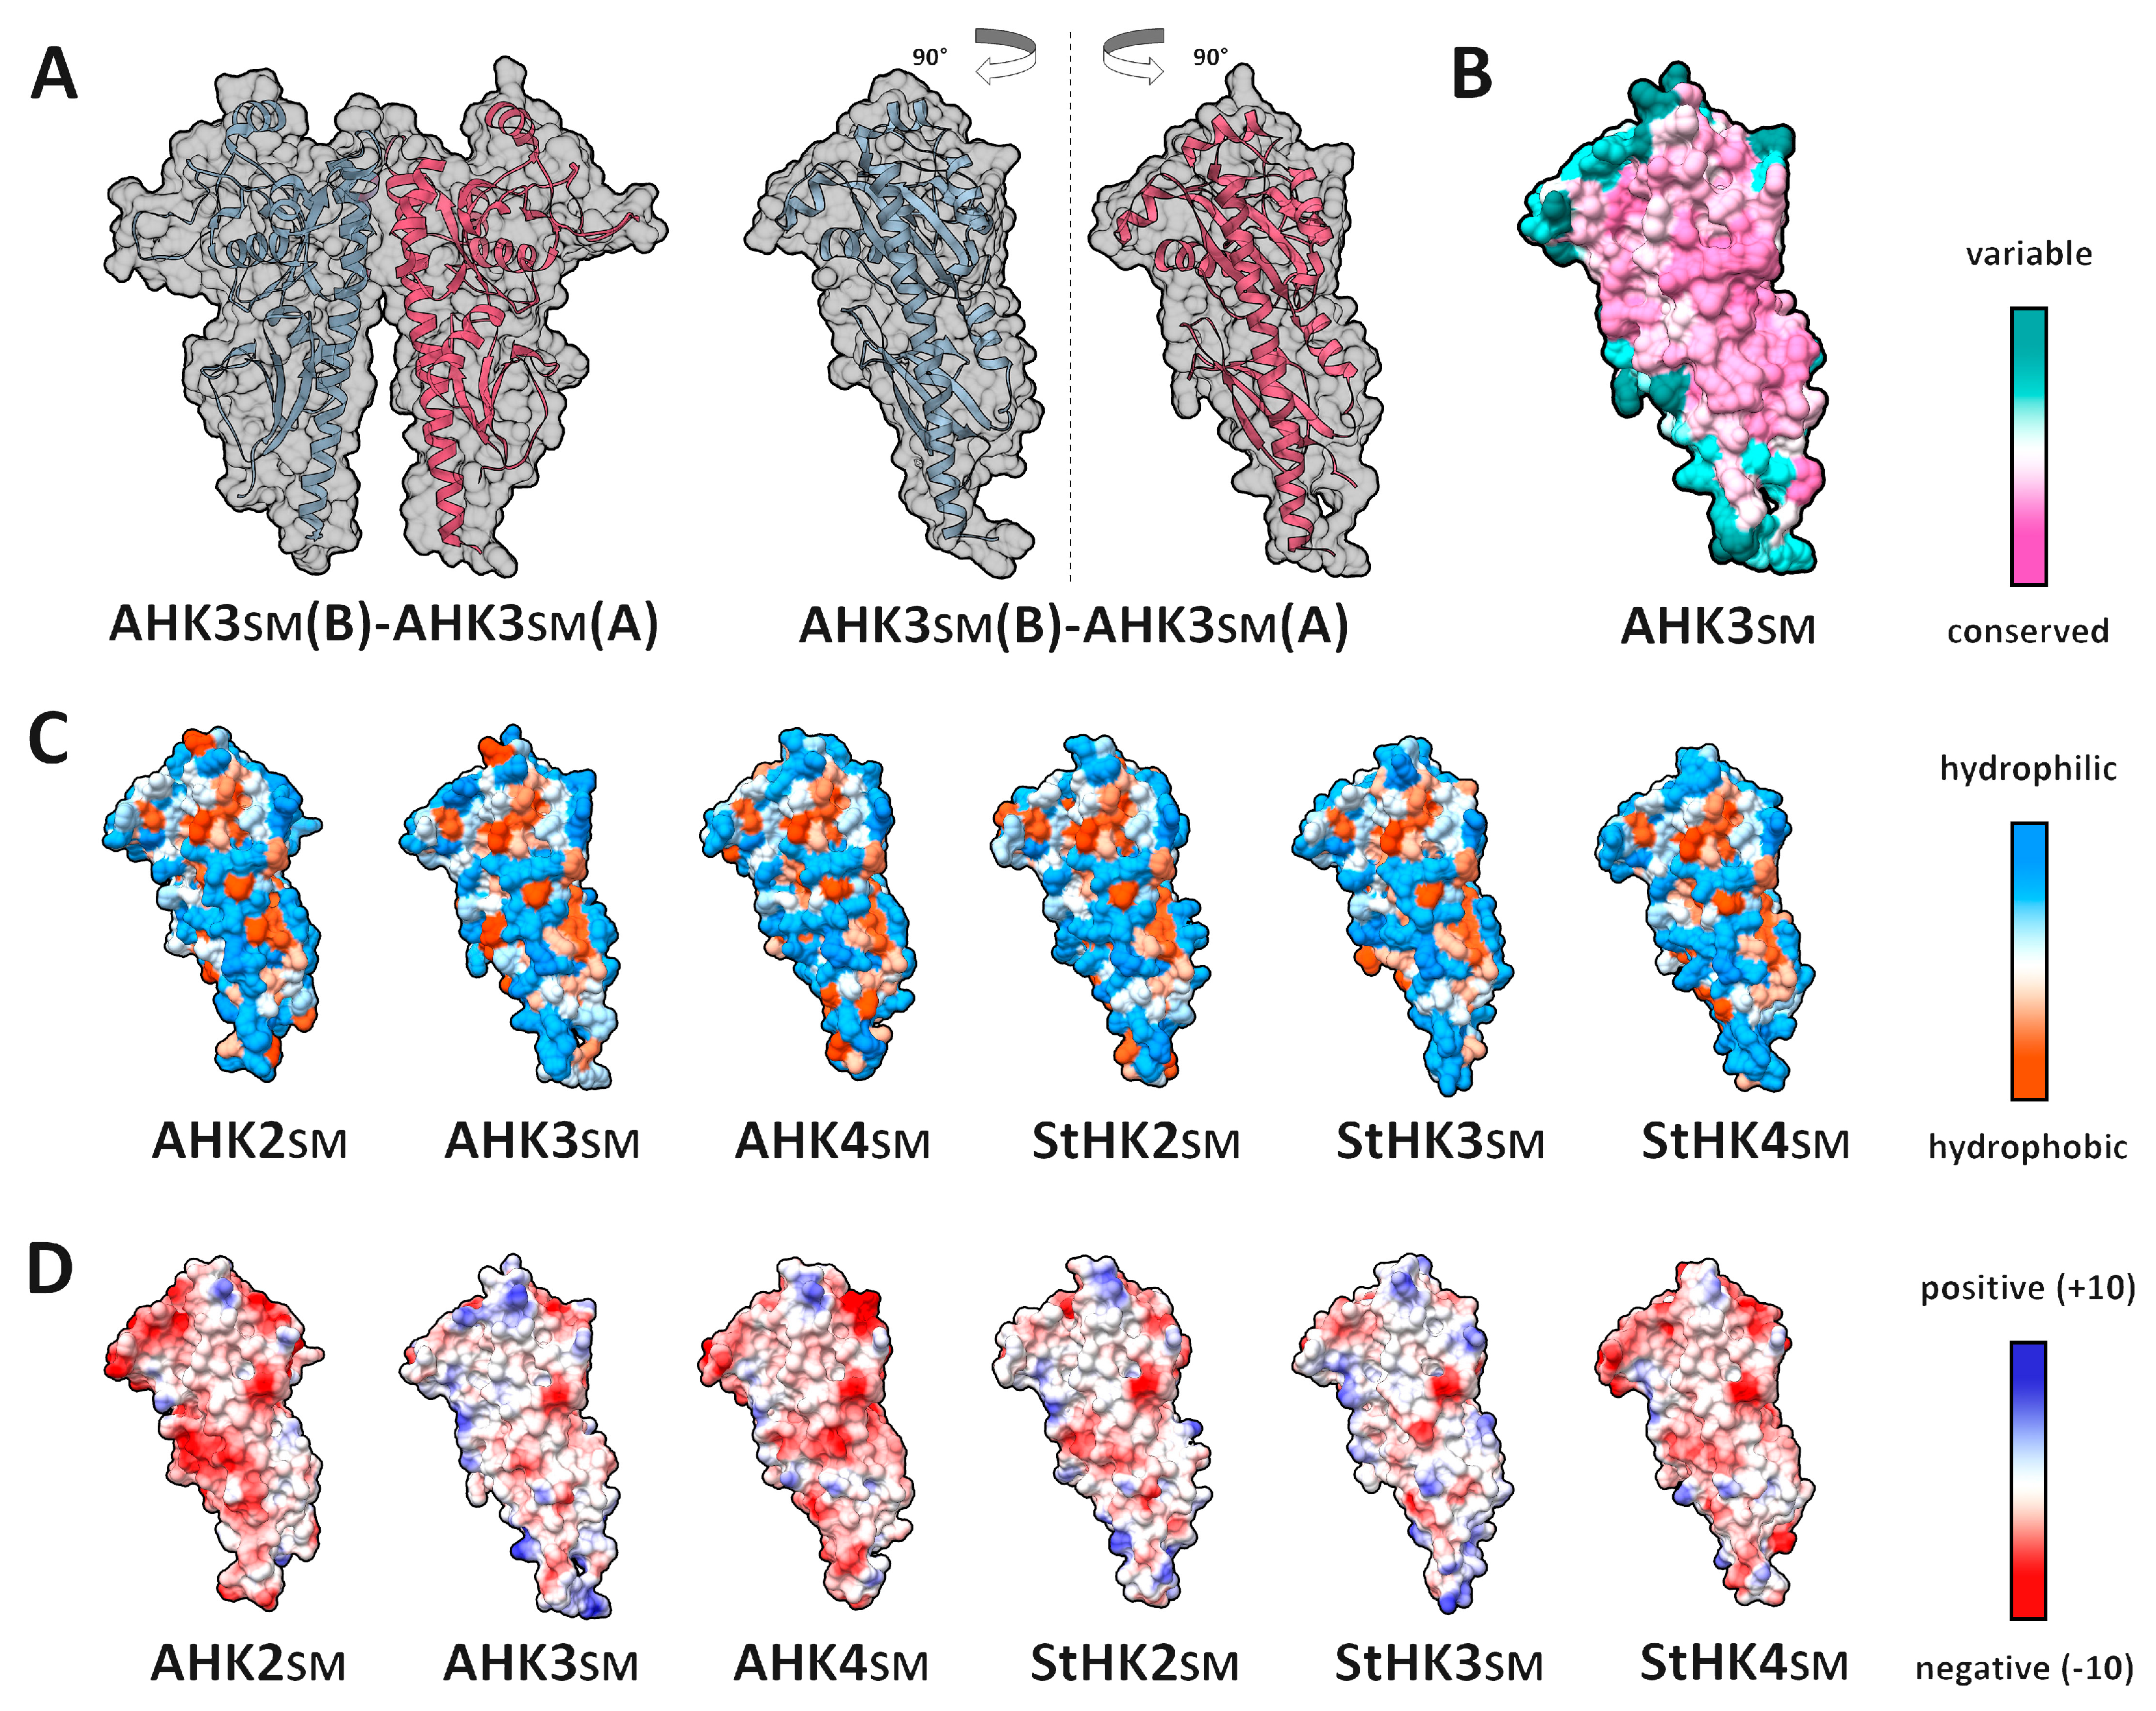
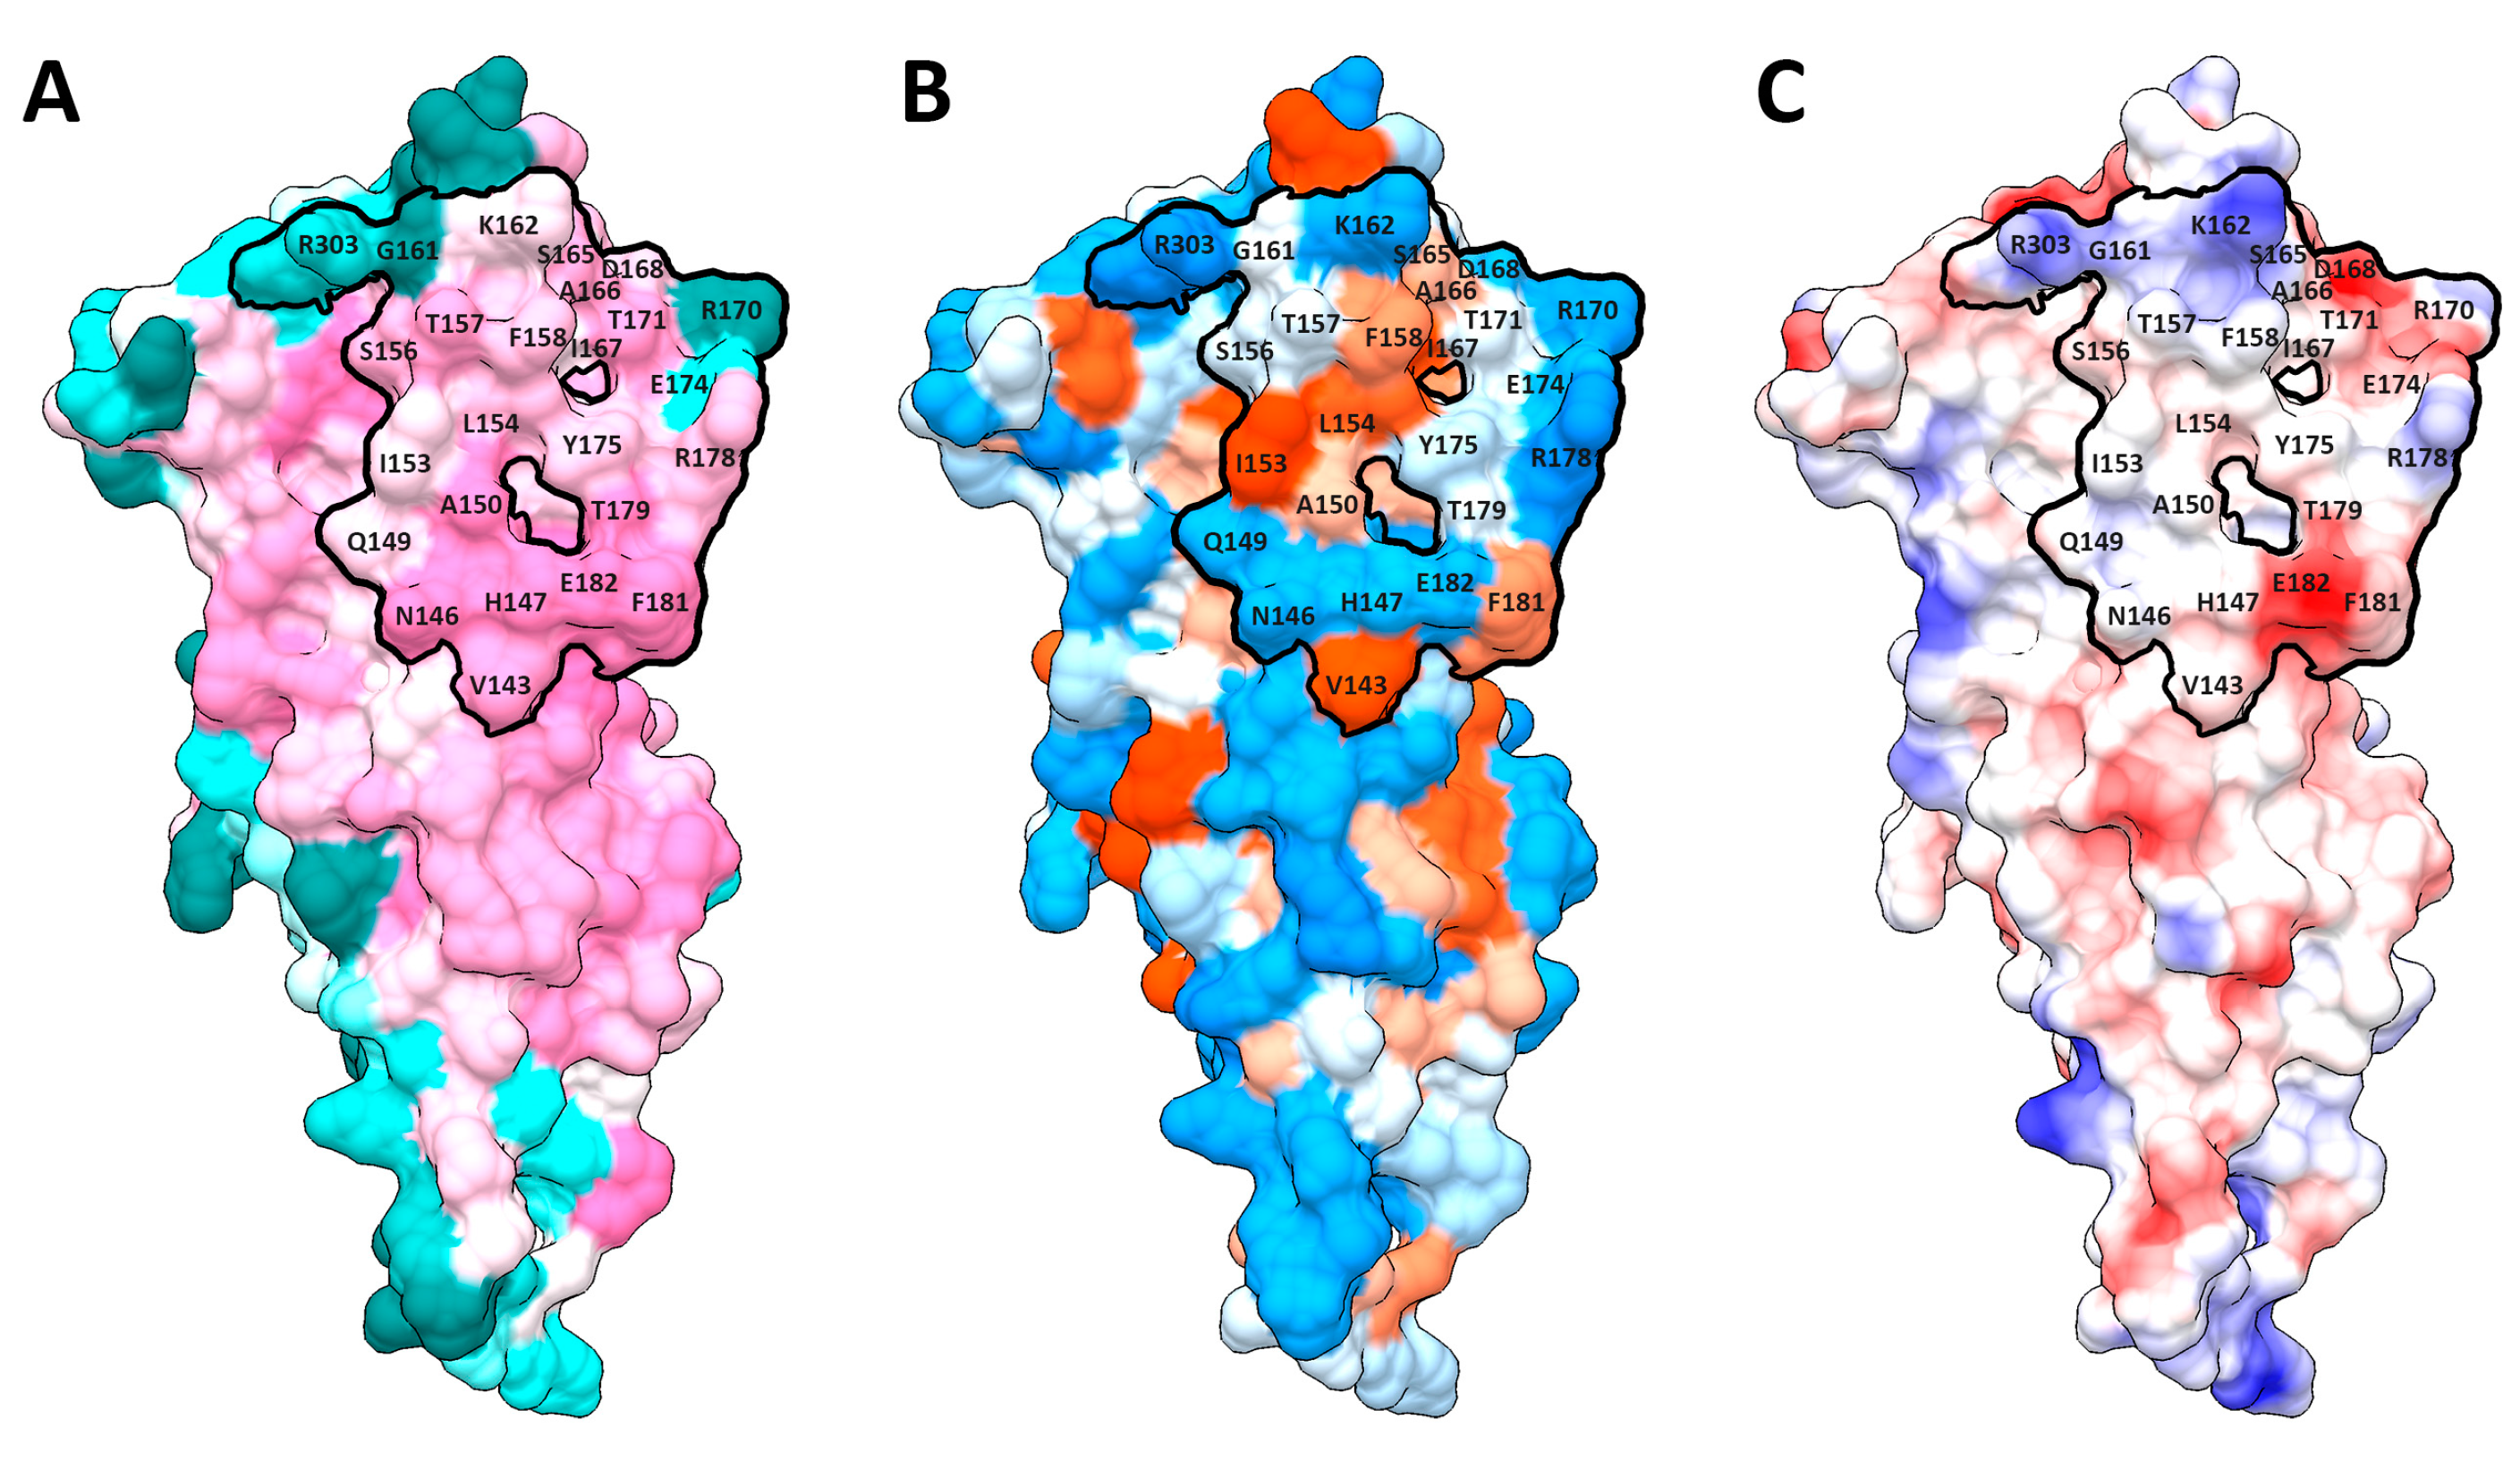
2.1. Dimerization Interfaces of the Sensor Module
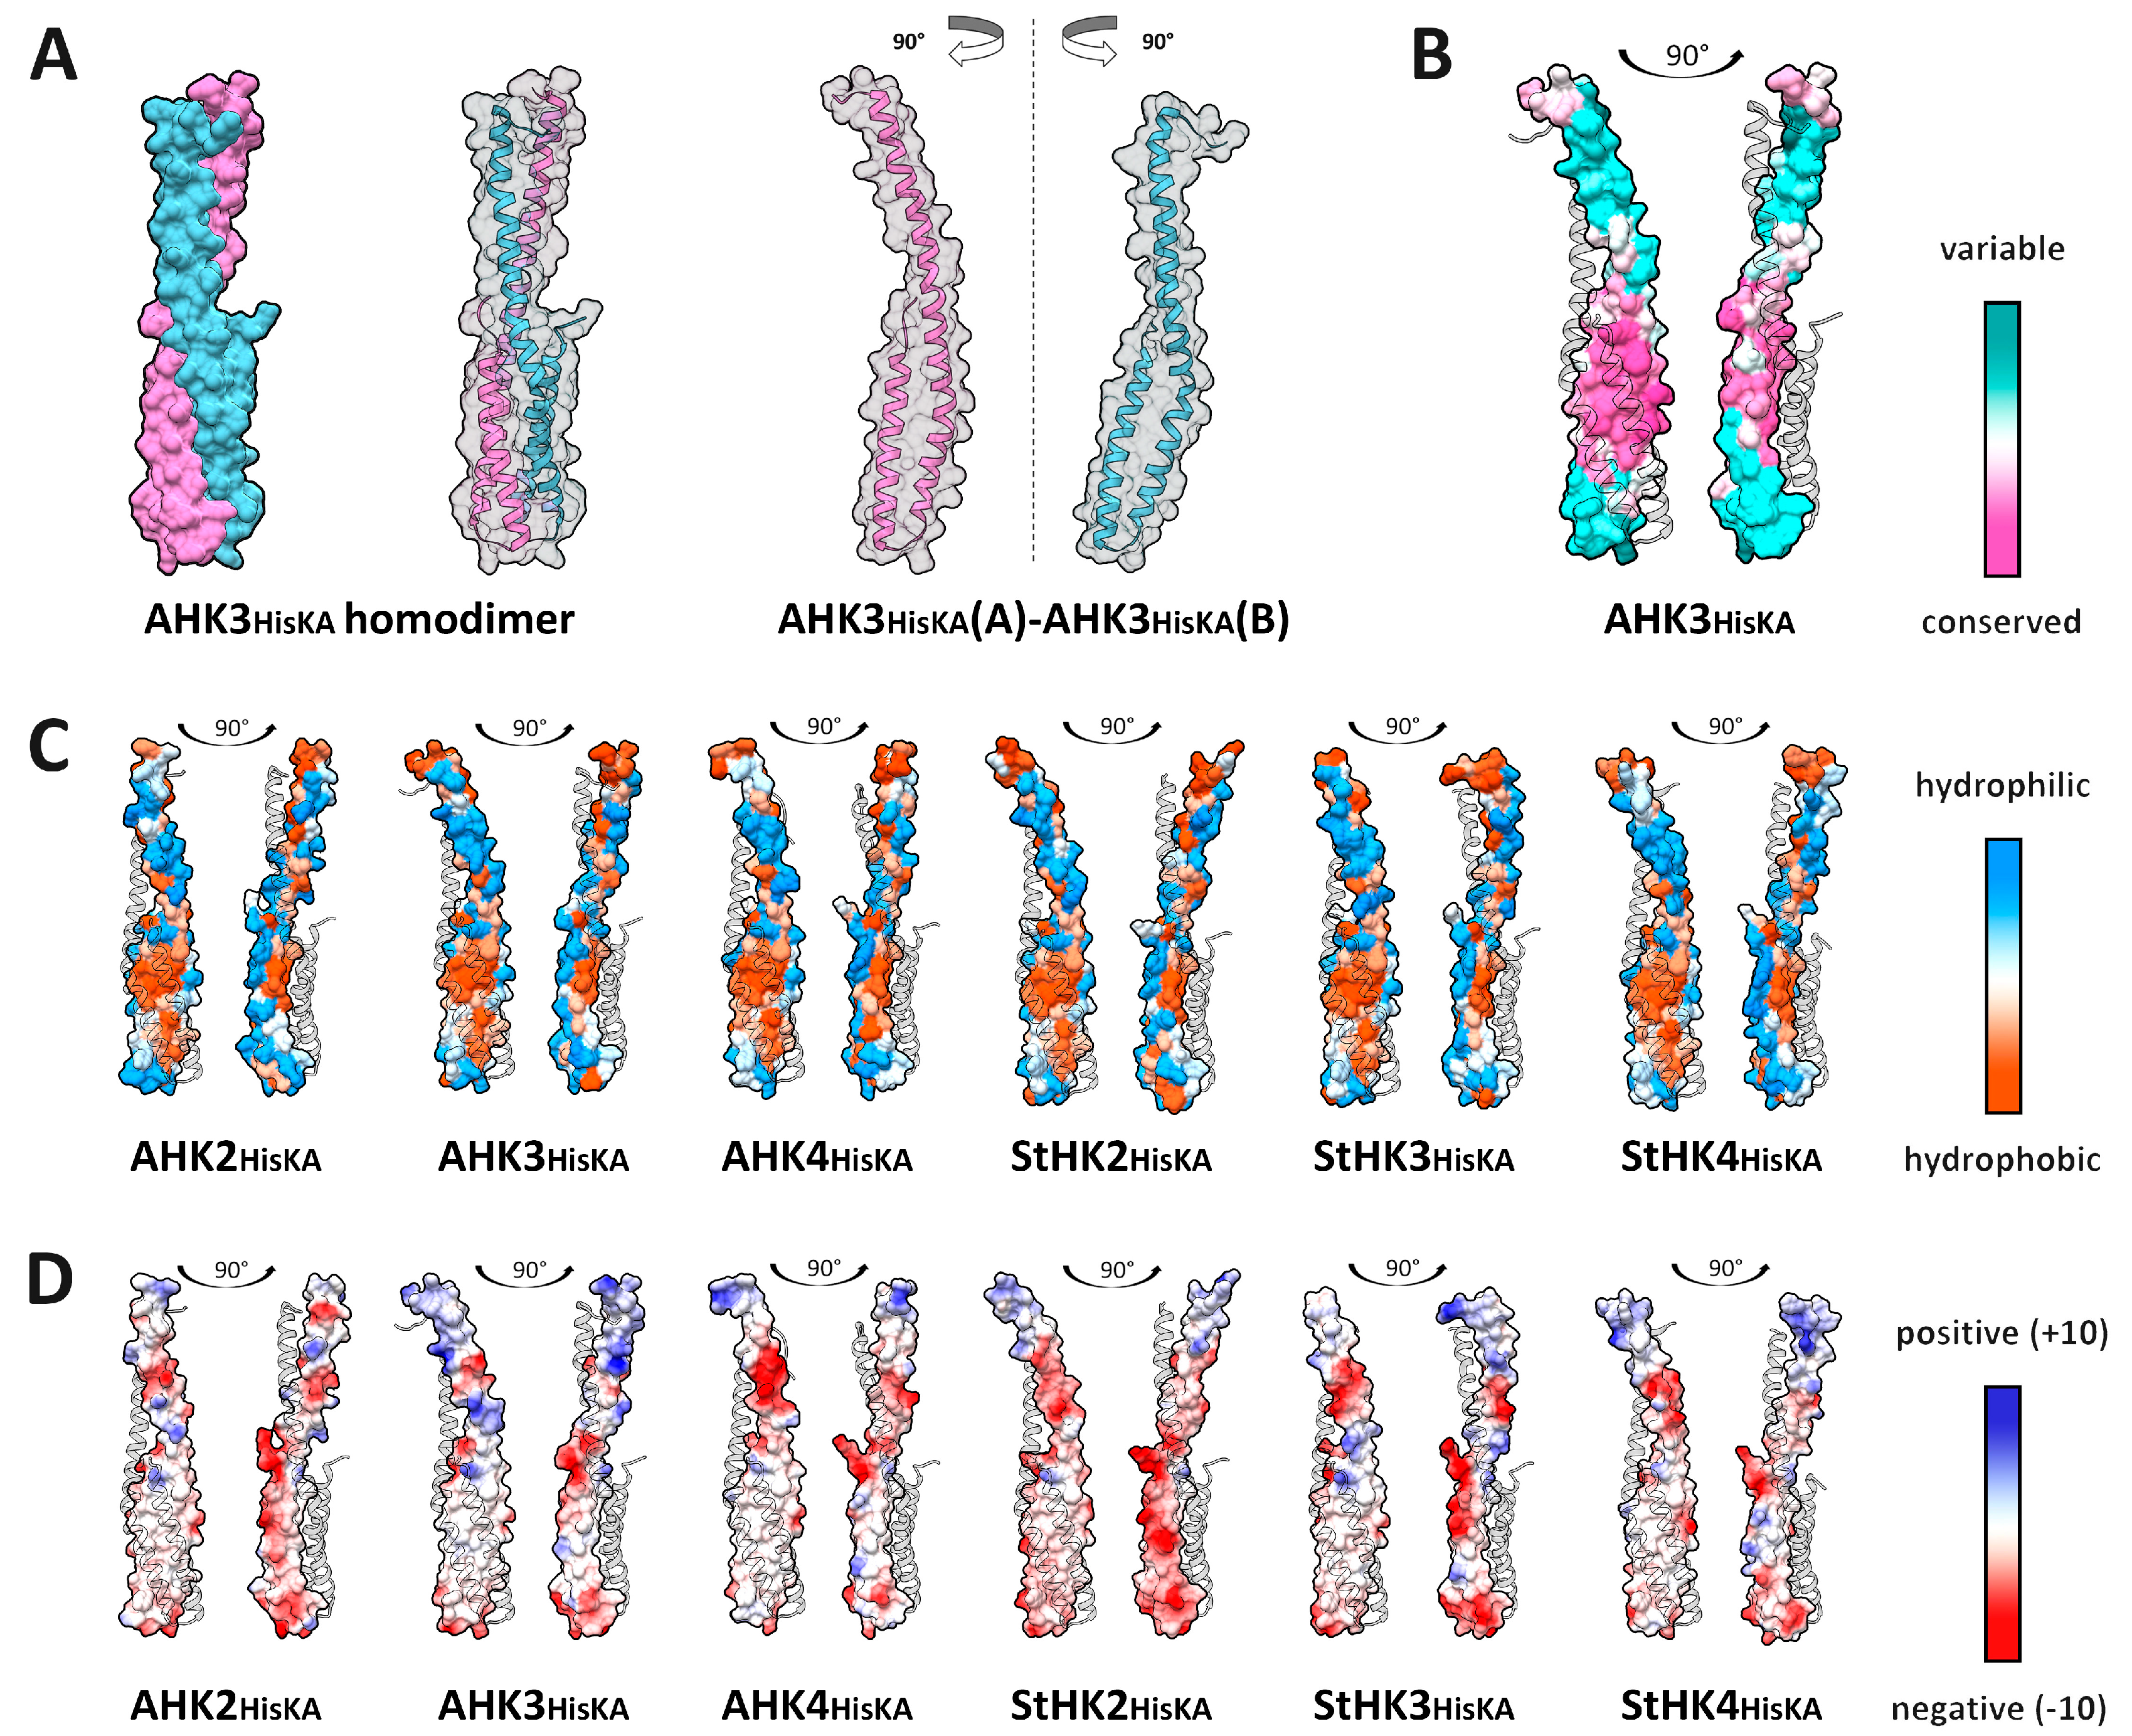
2.2. HisKA (DHpD) Domain Dimerization Interfaces
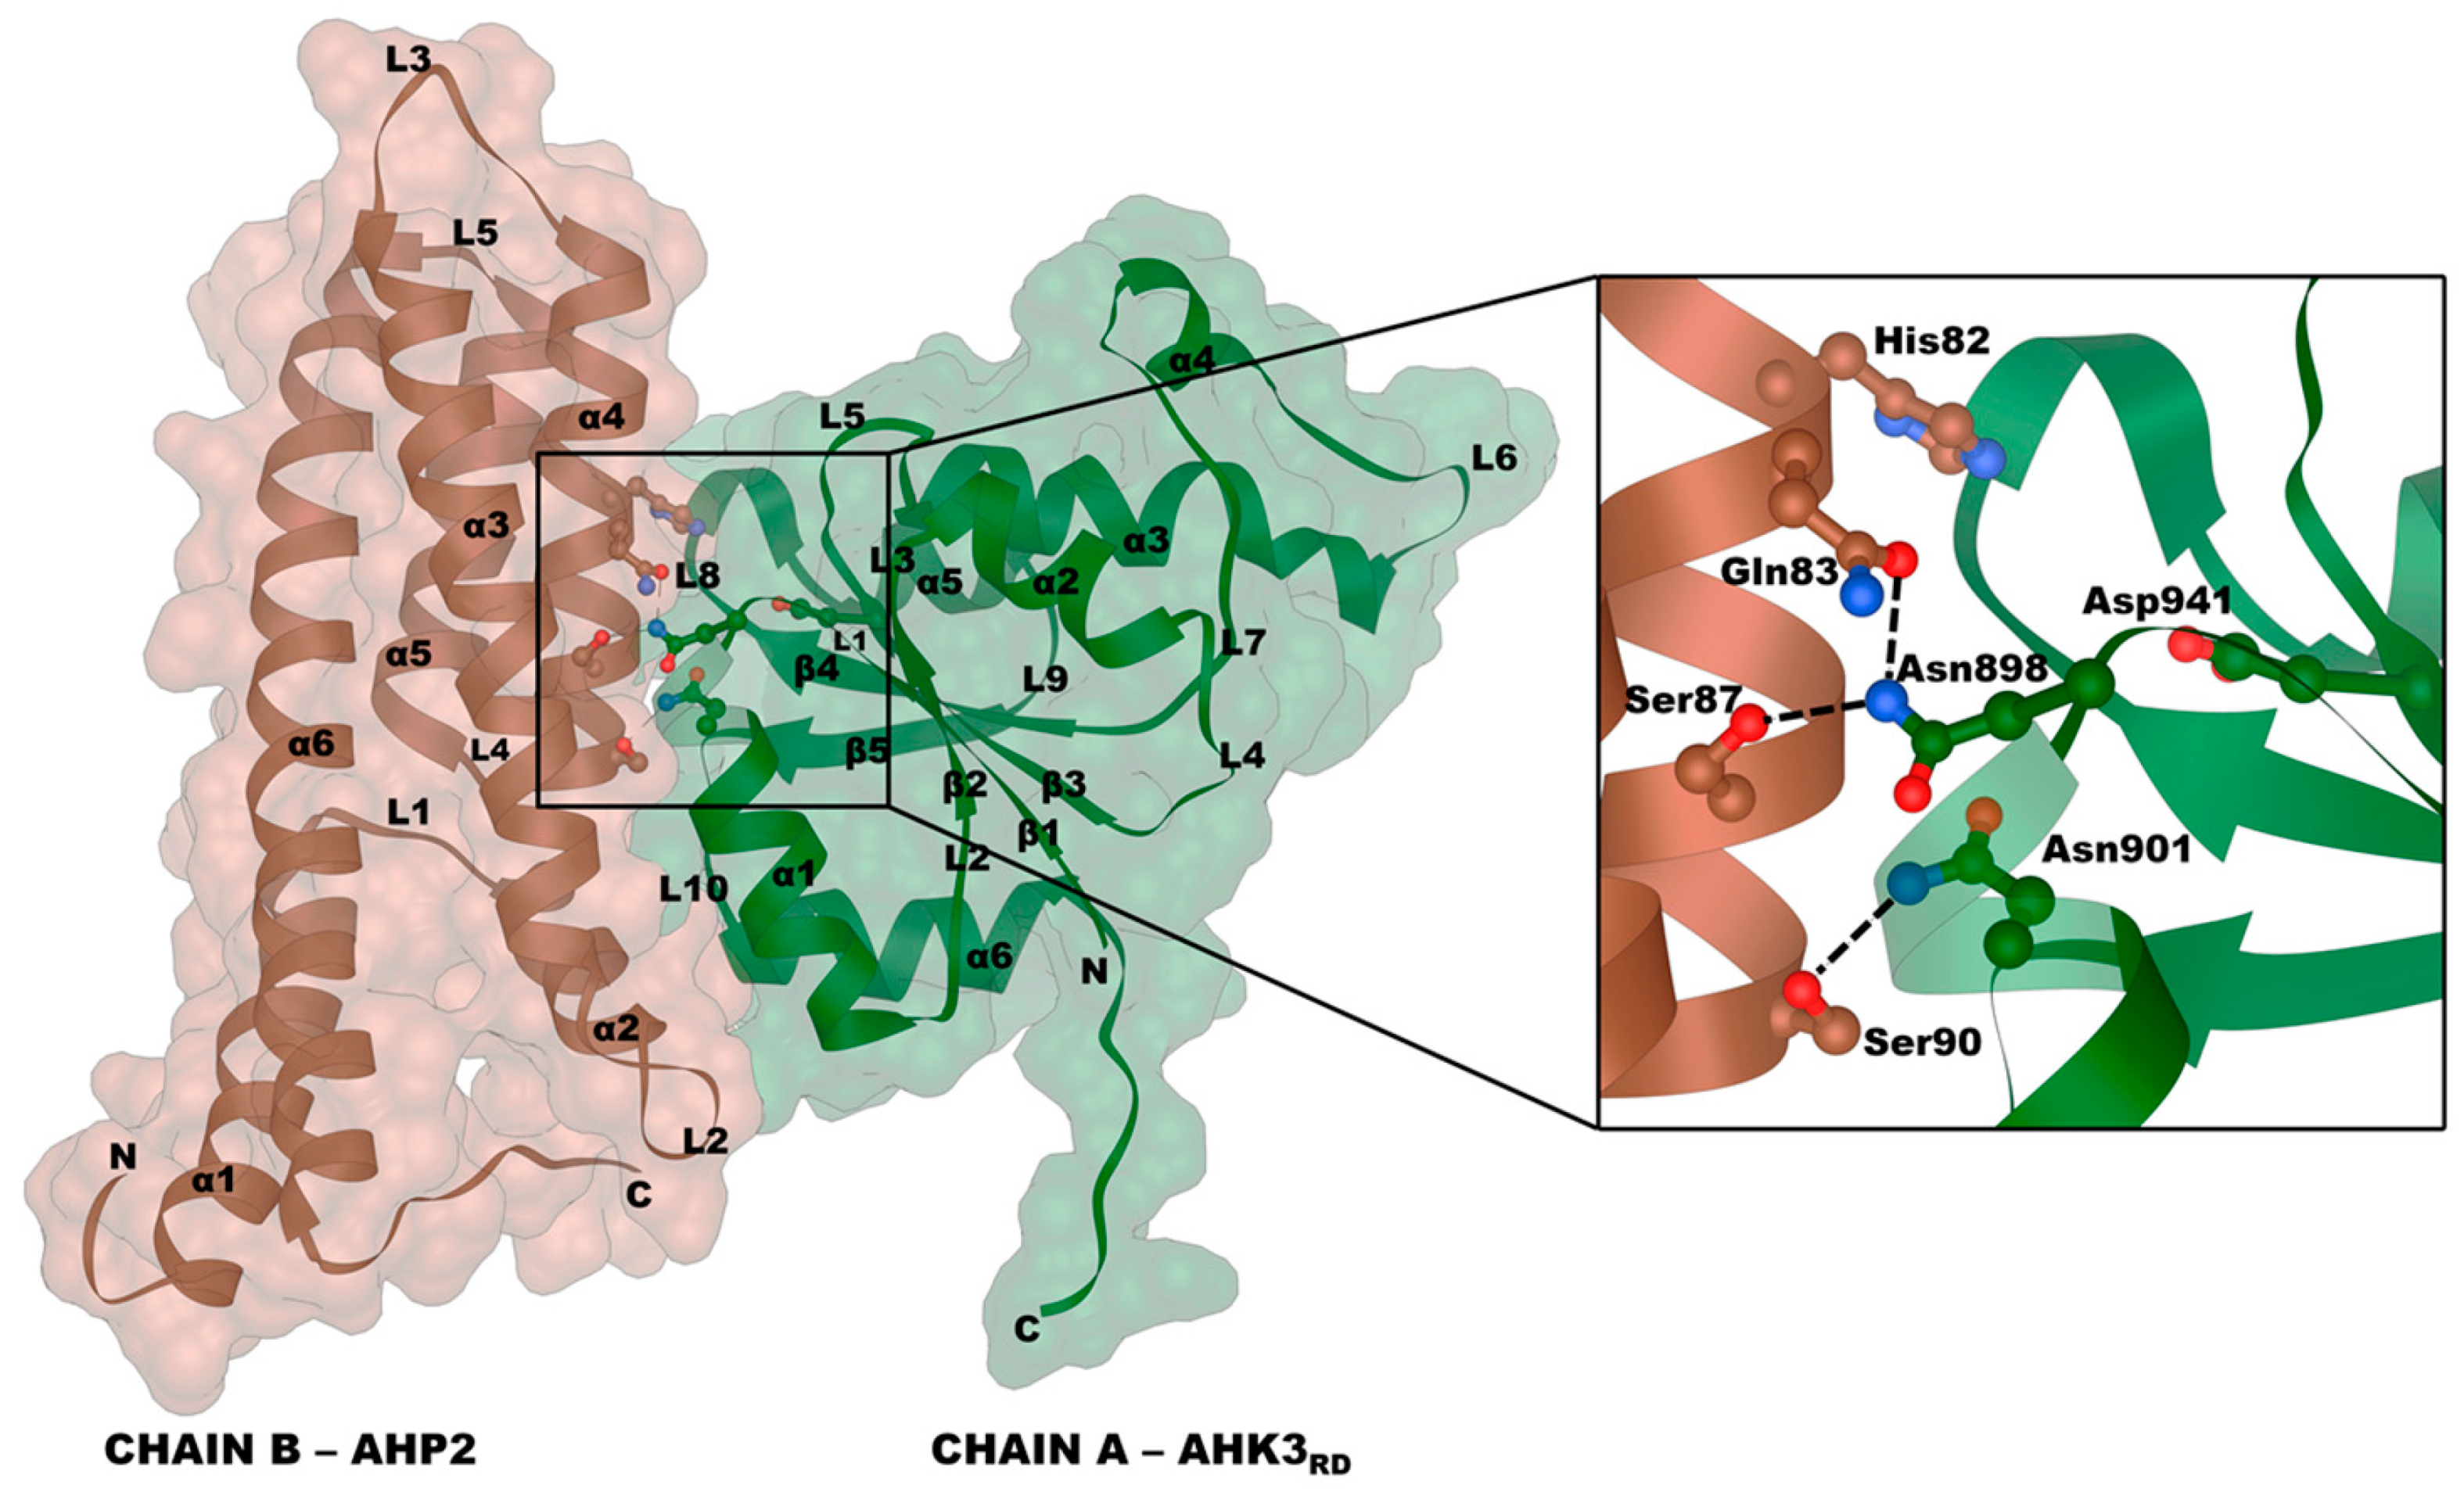
2.3. Receptor–Phosphotransmitter Interactions
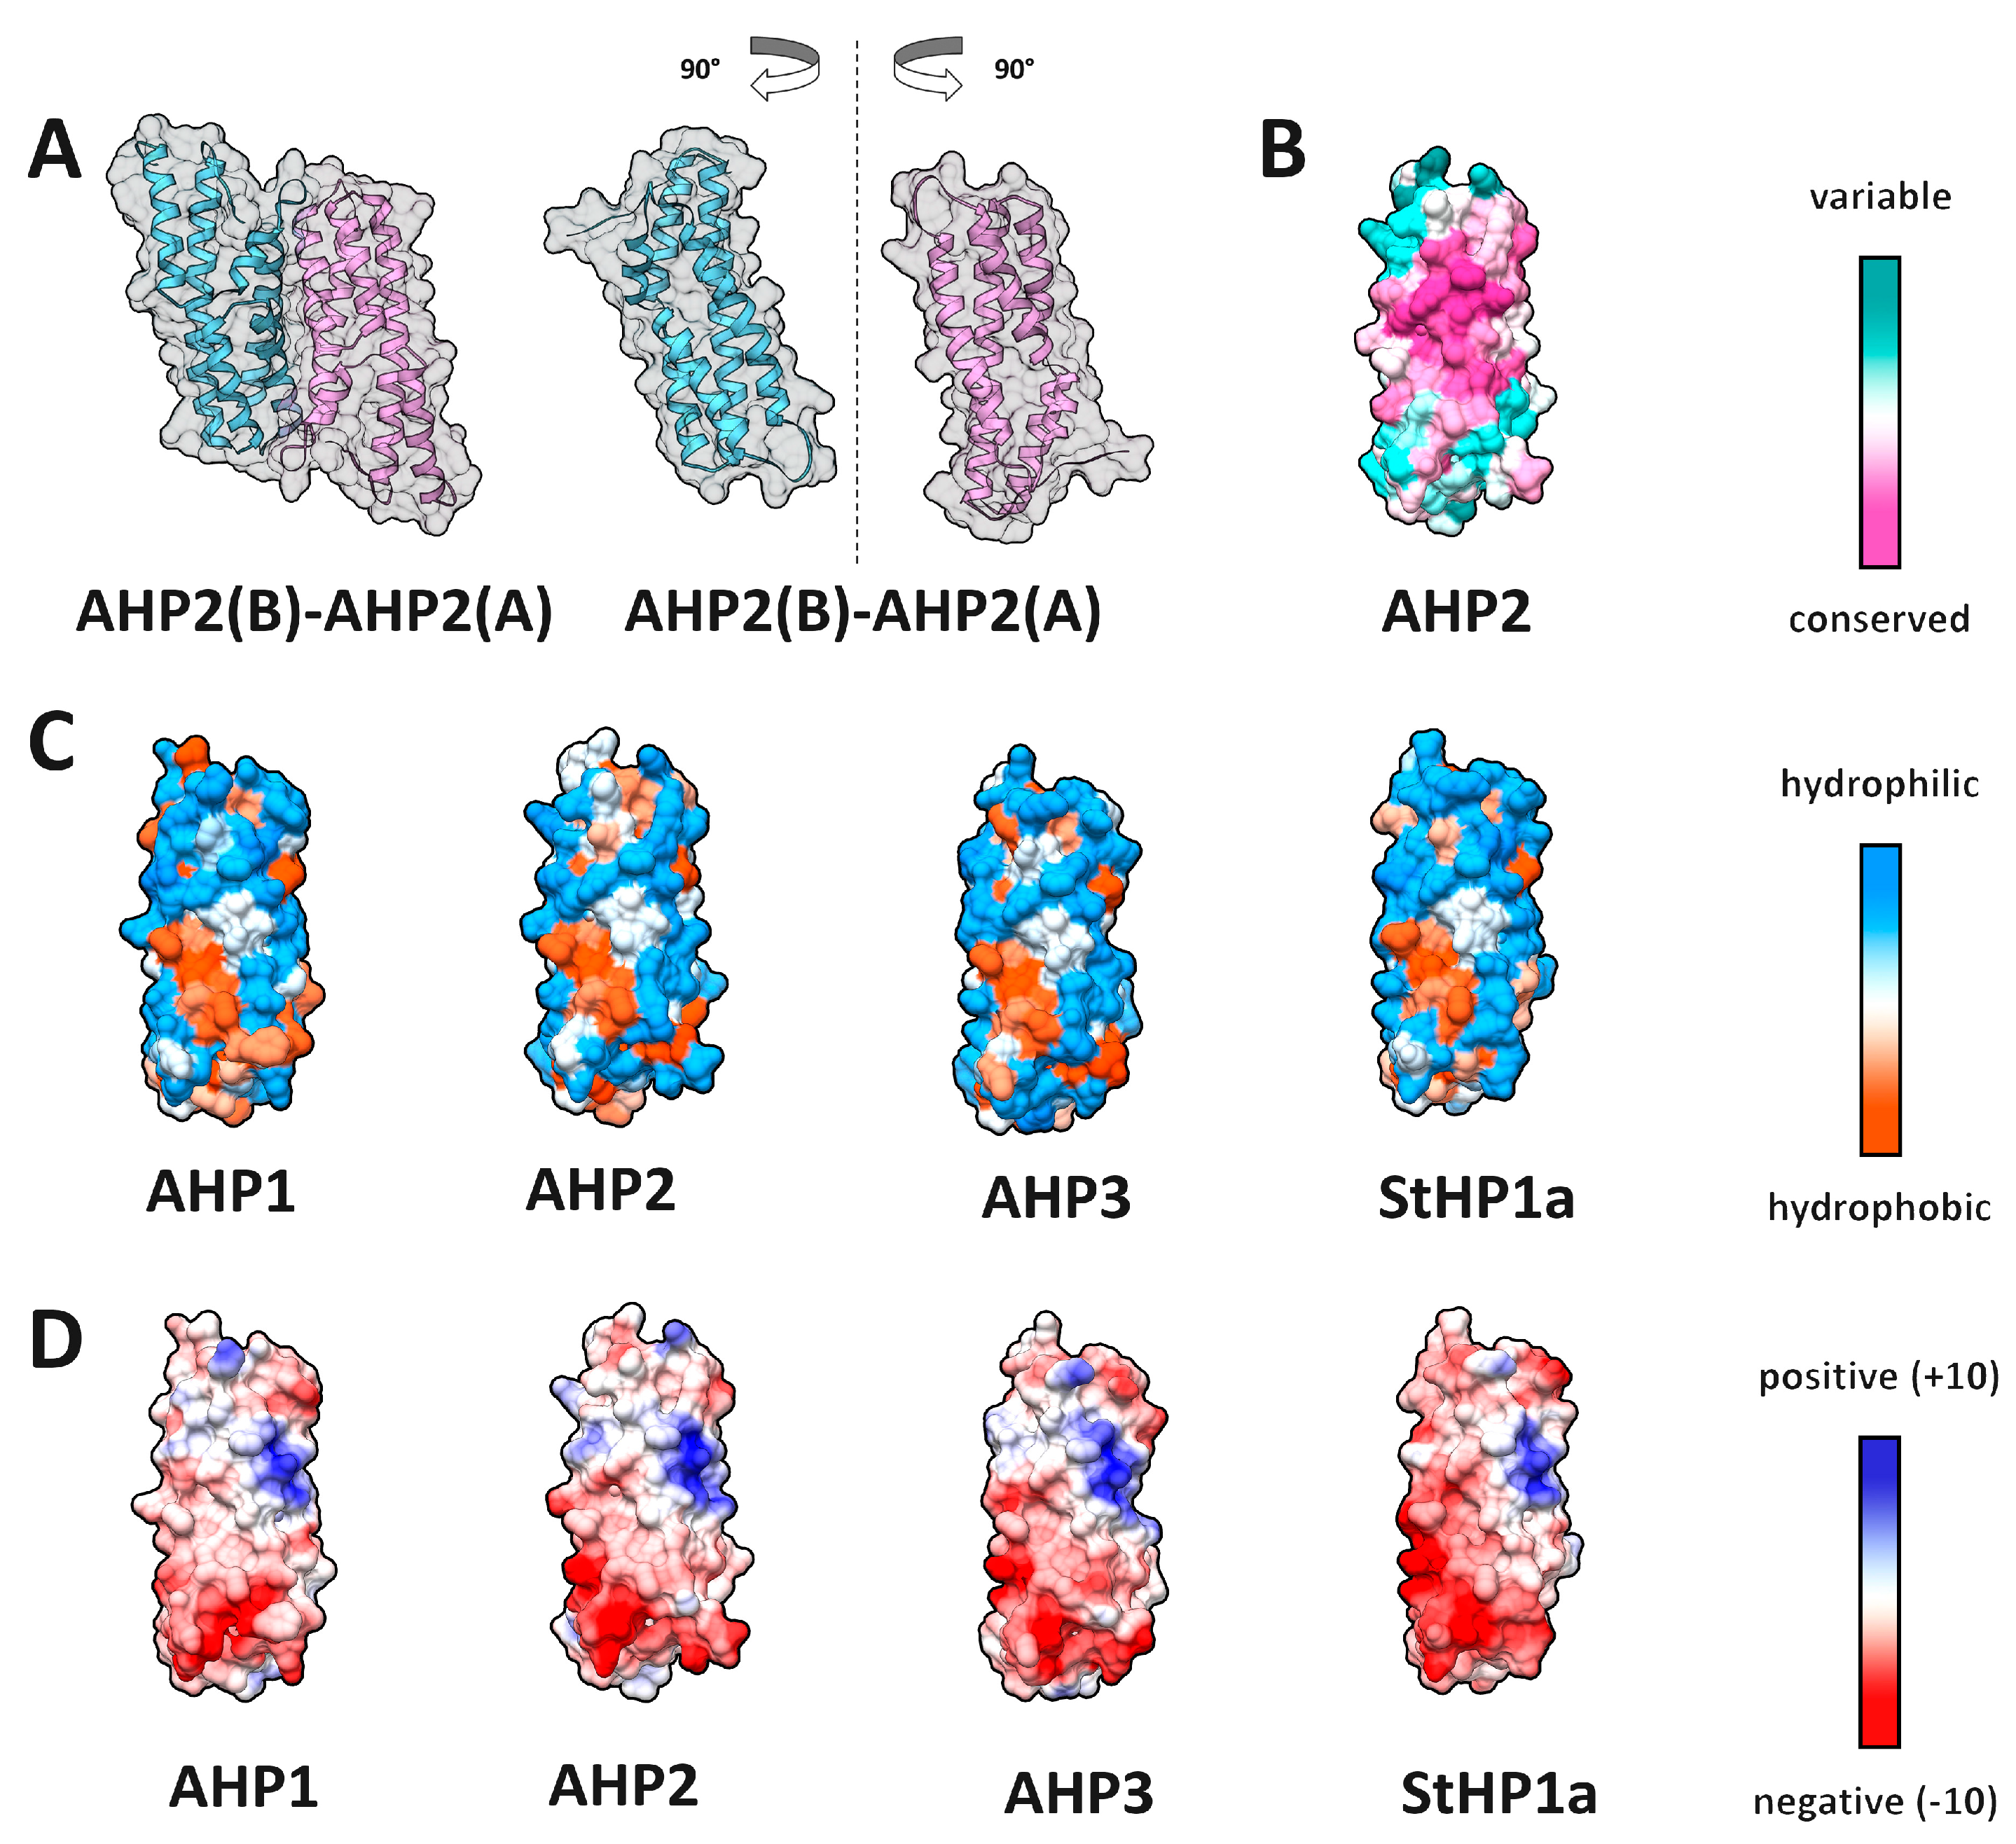
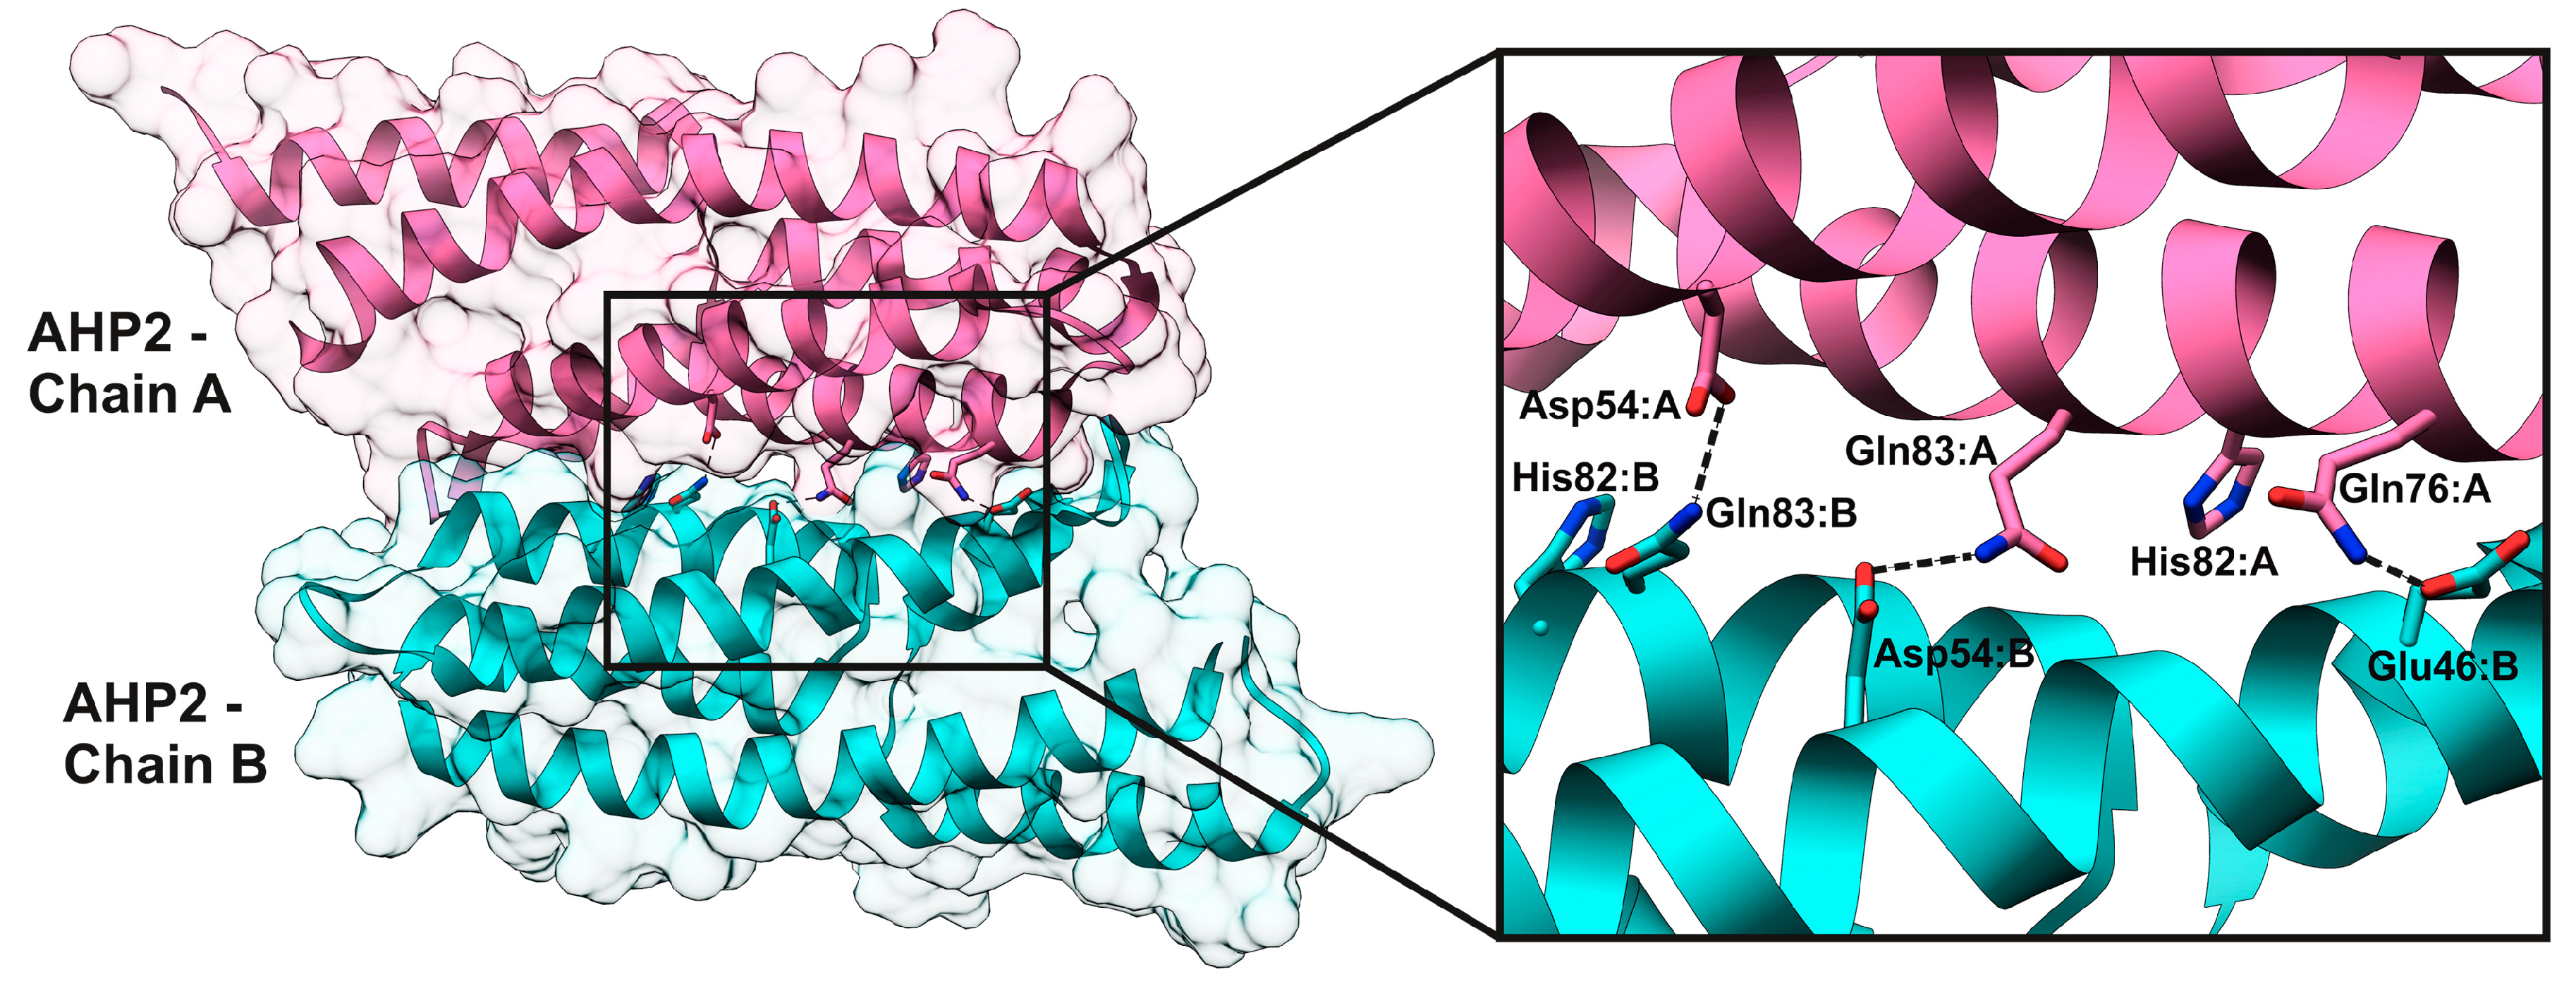
2.4. HPt–HPt Interface and Its Comparison to the HPt–HKrd Interface
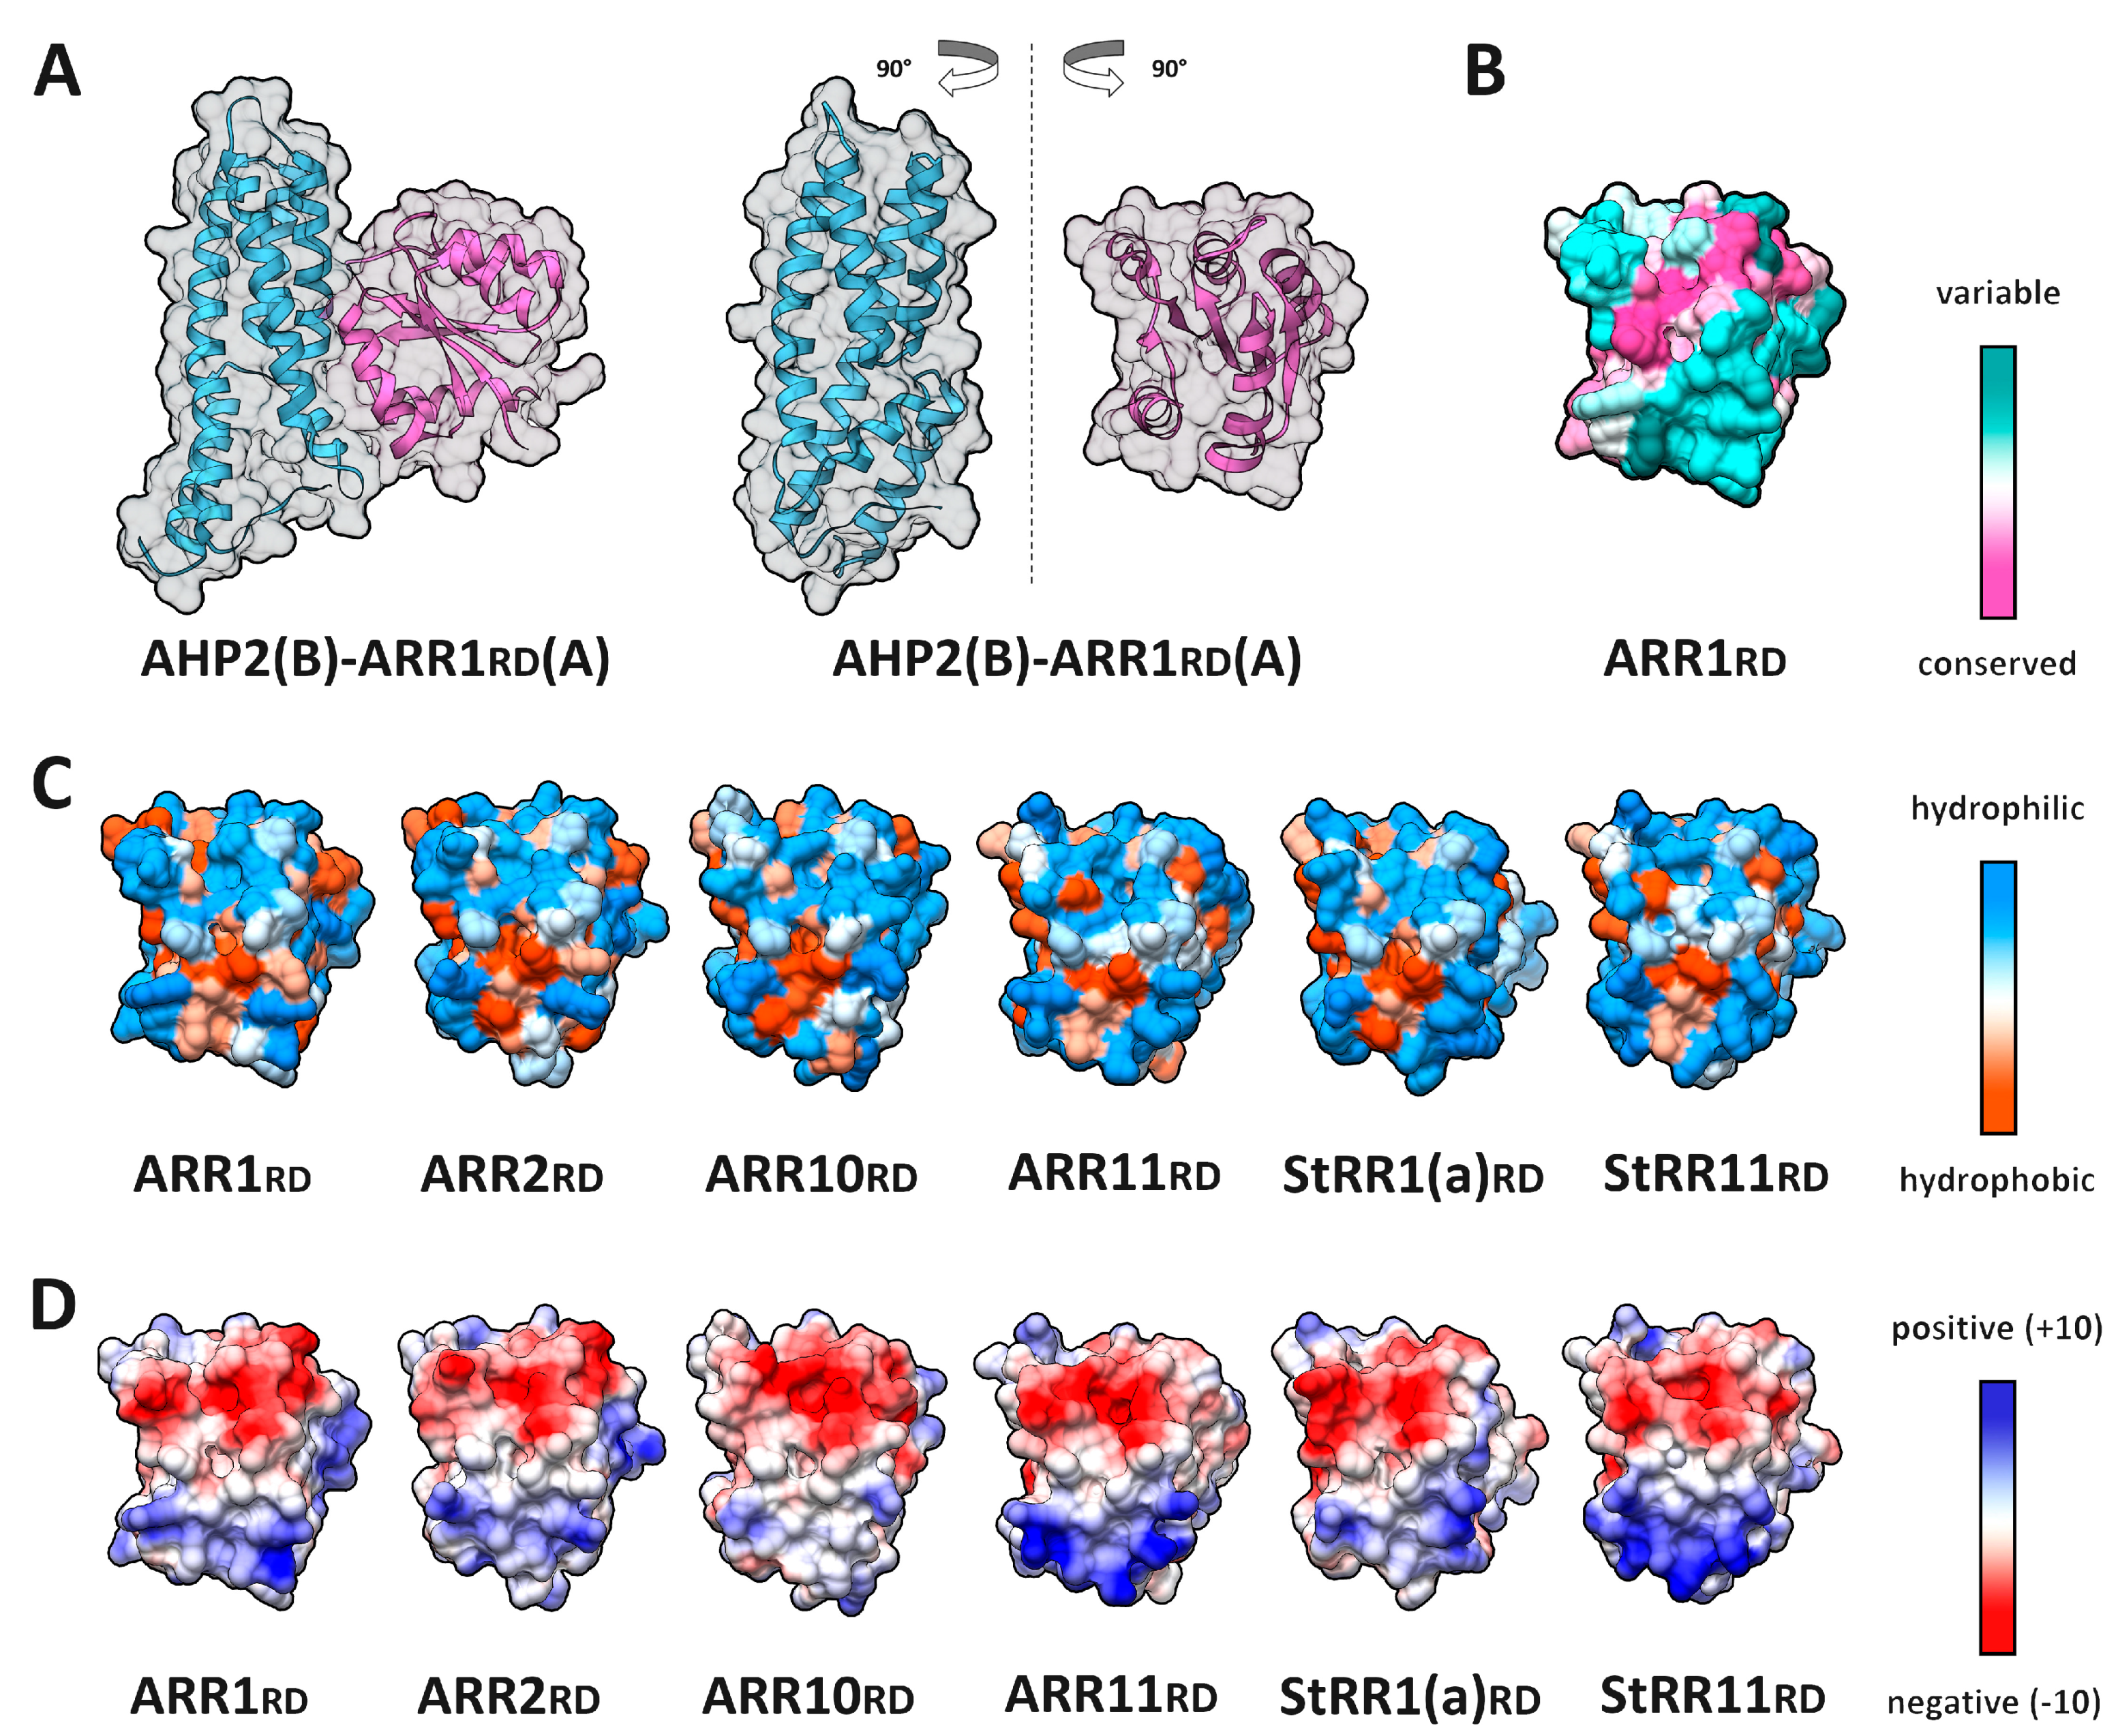
2.5. RRrd–HPt Interface and Its Comparison to AHP–AHKrd Interface
2.6. Effect of Phosphorylation on the HKrd–HPt Interactions
3. Materials and Methods
3.1. Homology Modeling
3.2. Structure Optimization, Validation, and Modification
3.3. Interface Properties Investigation
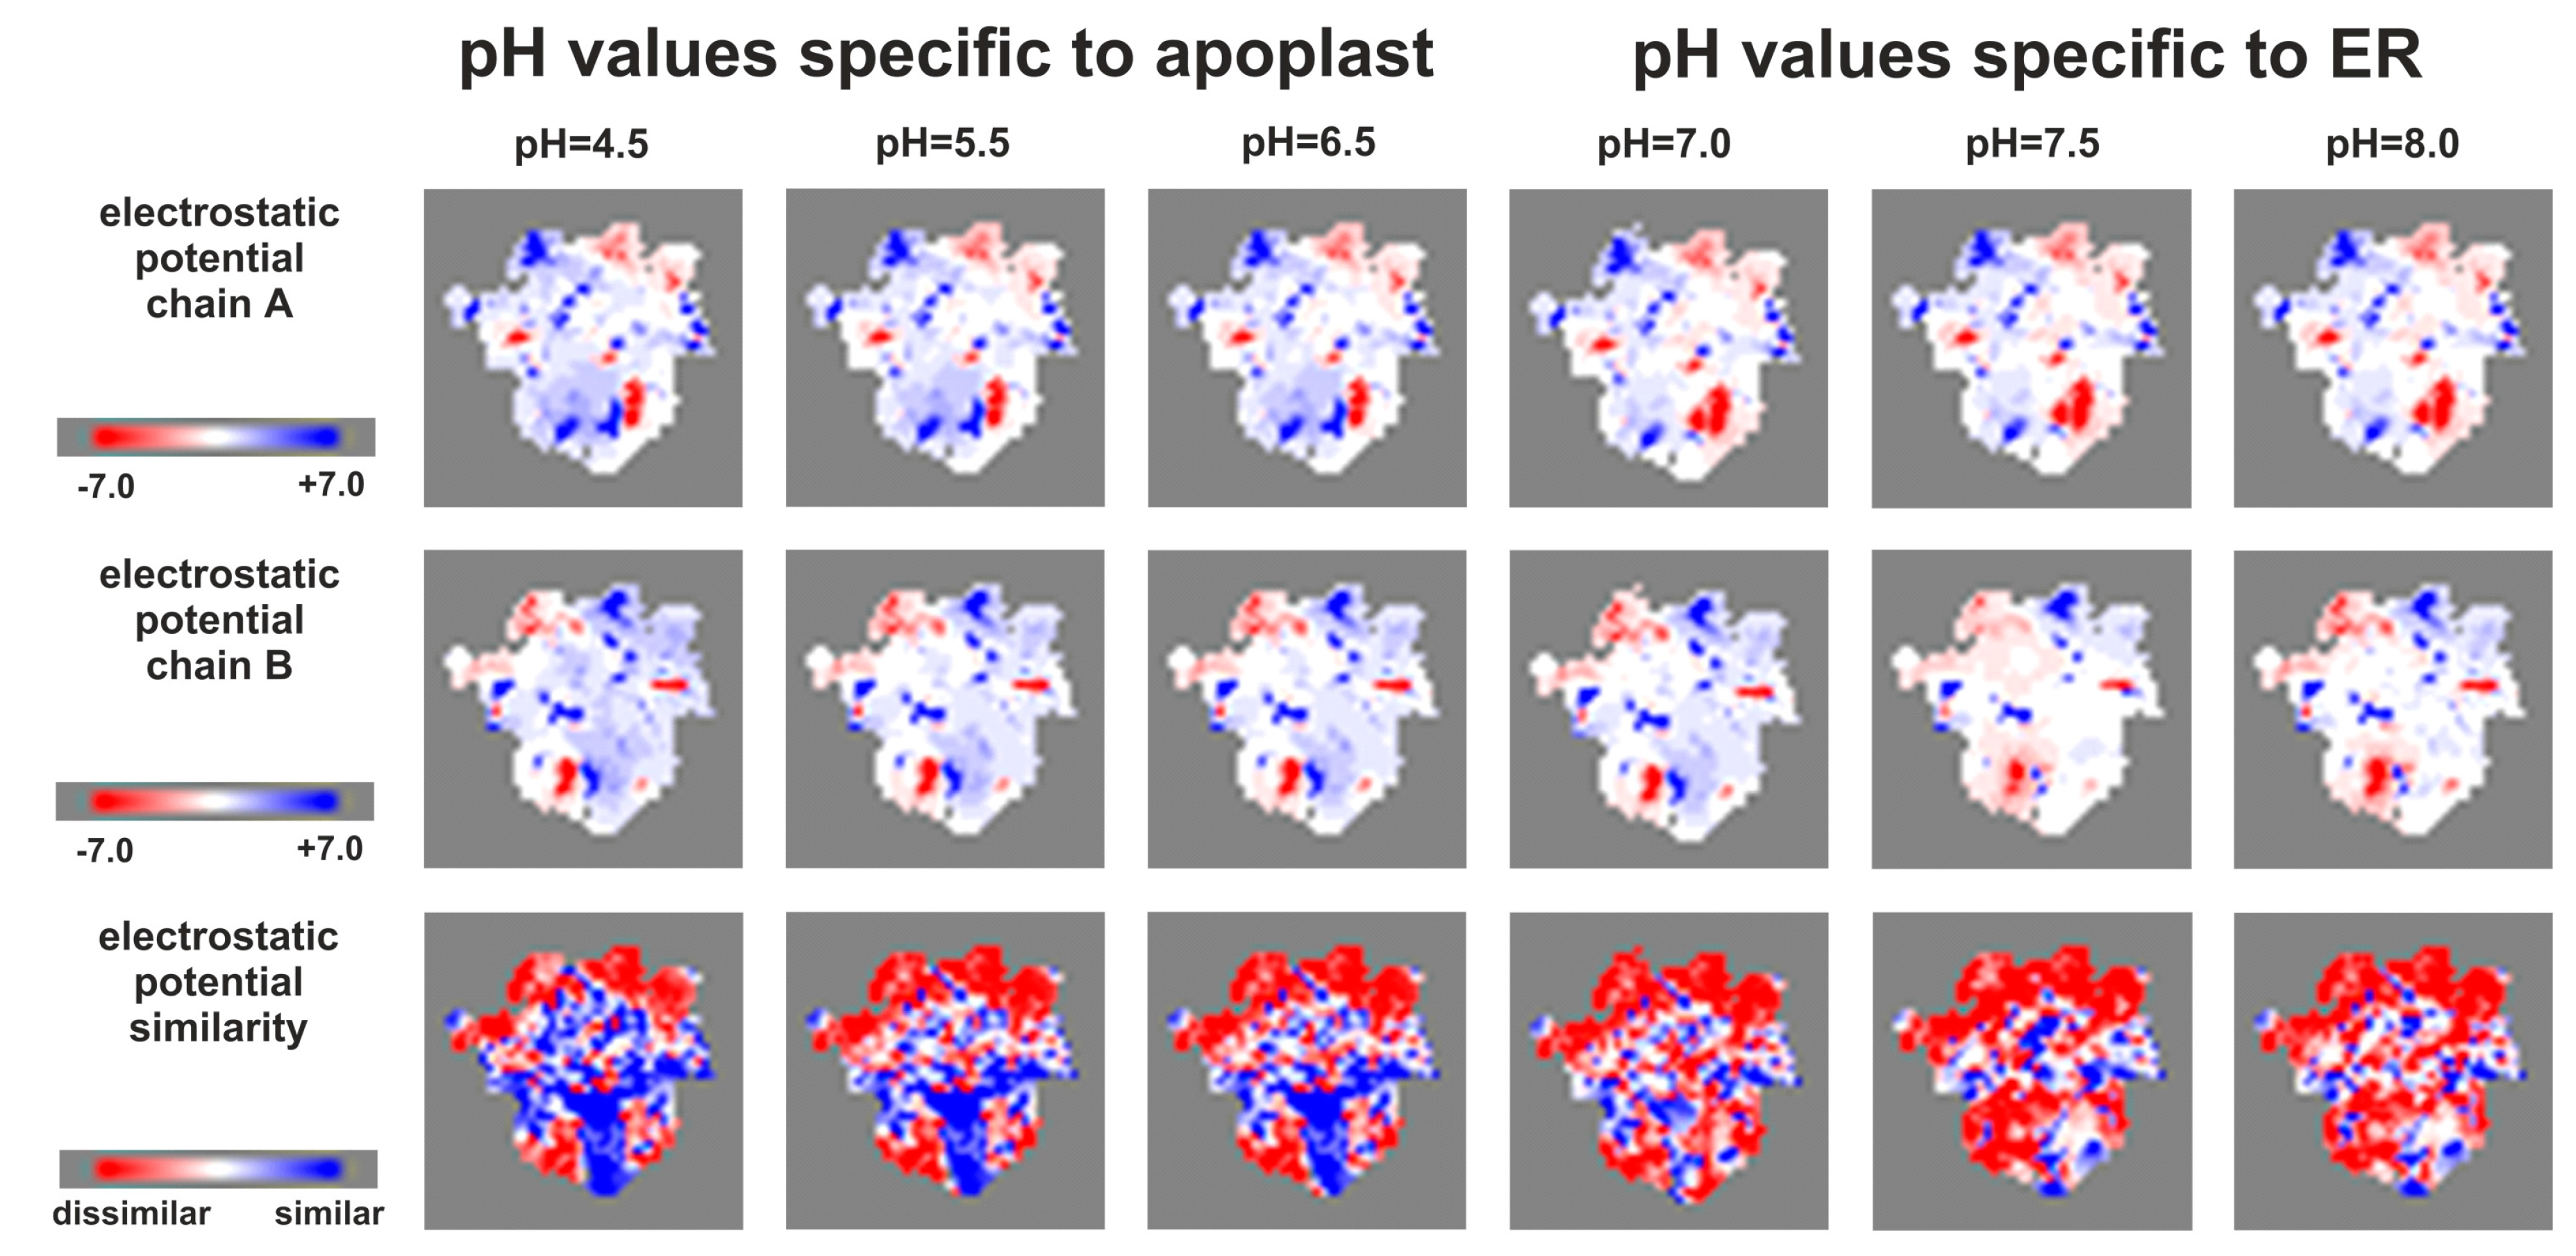
3.4. Surface Coloring
3.5. Protein–Protein Docking
4. Conclusions
Supplementary Materials
Author Contributions
Funding
Conflicts of Interest
Abbreviations
| CK | Cytokinin |
| MSP | Multistep phosphorelay system |
| HK | Histidine kinase |
| HPt | Histidine containing phosphotransfer protein (phosphotransmitter) |
| RR | Response regulator |
| TCS | Two component system |
| SM | Sensor module |
| TM | Transmembrane region |
| HisKA | HK-dimerization domain |
| RD | Receiver domain |
| PPI | Protein–protein interaction |
| ASA | Accessible surface area |
| BSA | Buried surface area |
| PQR | PQR file is a PDB file with the temperature and occupancy columns replaced by columns containing the per-atom charge (Q) and radius (R) |
| aa | Amino acid |
| RMSD | Root-mean-square deviation of atomic positions |
| BiFC | Bimolecular fluorescence complementation |
References
- Kieber, J.J.; Schaller, G.E. Cytokinins. In The Arabidopsis Book; American Society of Plant Biologists: Rockville, MD, USA, 2014; Volume 12, p. e0168. [Google Scholar]
- Wybouw, B.; De Rybel, B. Cytokinin – a developing story. Trends Plant Sci. 2019, 24, 177–185. [Google Scholar] [CrossRef] [PubMed]
- Romanov, G.A.; Lomin, S.N.; Schmülling, T. Cytokinin signaling: From the ER or from the PM? That is the question! New Phytol. 2018, 218, 41–53. [Google Scholar]
- Hothorn, M.; Dabi, T.; Chory, J. Structural basis for cytokinin recognition by Arabidopsis thaliana histidine kinase 4. Nat. Chem. Biol. 2011, 7, 766–768. [Google Scholar] [CrossRef] [PubMed]
- Steklov, M.Y.; Lomin, S.N.; Osolodkin, D.I.; Romanov, G.A. Structural basis for cytokinin receptor signaling: An evolutionary approach. Plant Cell Rep. 2013, 32, 781–793. [Google Scholar] [CrossRef]
- Mayerhofer, H.; Panneerselvam, S.; Kaljunen, H.; Tuukkanen, A.; Mertens, H.D.; Mueller-Dieckmann, J. Structural model of the cytosolic domain of the plant Ethylene Receptor 1 (ETR1). J. Biol. Chem. 2015, 290, 2644–2658. [Google Scholar] [CrossRef] [PubMed]
- Pekárová, B.; Szmitkowska, A.; Dopitová, R.; Degtjarik, O.; Žídek, L.; Hejátko, J. Structural aspects of multistep phosphorelay-mediated signaling in plants. Mol. Plant 2016, 9, 71–85. [Google Scholar] [CrossRef] [PubMed]
- Lomin, S.N.; Myakushina, Y.A.; Kolachevskaya, O.O.; Getman, I.A.; Arkhipov, D.V.; Savelieva, E.M.; Osolodkin, D.I.; Romanov, G.A. Cytokinin perception in potato: New features of canonical players. J. Exp. Bot. 2018, 69, 3839–3853. [Google Scholar] [CrossRef]
- Pekálrová, B.; Szmitkowska, A.; Houser, J.; Wimmerova, M.; Hejátko, J. Cytokinin and ethylene signaling (Chpt. 10). In Plant Structural Biology: Hormonal Regulations; Hejátko, J., Hakoshima, T., Eds.; Springer International Publishing AG, part of Springer Nature: Basel, Switzerland, 2018; pp. 165–200. [Google Scholar]
- Heyl, A.; Schmülling, T. Cytokinin signal perception and transduction. Curr. Opin. Plant Biol. 2003, 6, 480–486. [Google Scholar] [CrossRef]
- Romanov, G.A. How do cytokinins affect the cell? Russ. J. Plant Physiol. 2009, 56, 268–290. [Google Scholar] [CrossRef]
- Keshishian, E.A.; Rashotte, A.M. Plant cytokinin signalling. Essays Biochem. 2015, 58, 13–27. [Google Scholar] [CrossRef]
- Zschiedrich, C.P.; Keidel, V.; Szurmant, H. Molecular mechanisms of two-component signal transduction. J. Mol. Biol. 2016, 428, 3752–3775. [Google Scholar] [CrossRef]
- Nongpiur, R.; Soni, P.; Karan, R.; Singla-Pareek, S.L.; Pareek, A. Histidine kinases in plants: Cross talk between hormone and stress responses. Plant Signal. Behav. 2012, 7, 1230–1237. [Google Scholar] [CrossRef]
- wwPDB consortium. Protein Data Bank: The single global archive for 3D macromolecular structure data. Nucleic Acids Res. 2018, 47, D520–D528. [Google Scholar]
- Müller-Dieckmann, H.J.; Grantz, A.A.; Kim, S.H. The structure of the signal receiver domain of the Arabidopsis thaliana ethylene receptor ETR1. Structure 1999, 7, 1547–1556. [Google Scholar] [CrossRef]
- Pekárová, B.; Klumpler, T.; Triskova, O.; Horak, J.; Jansen, S.; Dopitova, R.; Borkovcova, P.; Papouskova, V.; Nejedla, E.; Sklenar, V.; et al. Structure and binding specificity of the receiver domain of sensor histidine kinase CKI1 from Arabidopsis thaliana. Plant J. 2011, 67, 827–839. [Google Scholar] [CrossRef]
- Otrusinová, O.; Demo, G.; Padrta, P.; Jaseňáková, Z.; Pekárová, B.; Gelová, Z.; Szmitkowska, A.; Kadeřávek, P.; Jansen, S.; Zachrdla, M.; et al. Conformational dynamics are a key factor in signaling mediated by the receiver domain of a sensor histidine kinase from Arabidopsis thaliana. J. Biol. Chem. 2017, 292, 17525–17540. [Google Scholar] [CrossRef]
- Bauer, J.; Reiss, K.; Veerabagu, M.; Heunemann, M.; Harter, K.; Stehle, T. Structure-Function Analysis of Arabidopsis thaliana Histidine Kinase AHK5 Bound to Its Cognate Phosphotransfer Protein AHP1. Mol. Plant 2013, 6, 959–970. [Google Scholar] [CrossRef] [PubMed]
- Degtjarik, O.; Dopitova, R.; Puehringer, S.; Nejedla, E.; Kuty, M.; Weiss, M.S.; Hejatko, J.; Janda, L.; Kuta Smatanova, I. Cloning, expression, purification, crystallization and preliminary X-ray diffraction analysis of AHP2, a signal transmitter protein from Arabidopsis thaliana. Acta Crystallogr. Sect. F Struct. Biol. Cryst. Commun. 2013, 69, 158–161. [Google Scholar] [CrossRef] [PubMed]
- Ruszkowski, M.; Brzezinski, K.; Jedrzejczak, R.; Dauter, M.; Dauter, Z.; Sikorski, M.; Jaskolski, M. Medicago truncatula histidine-containing phosphotransfer protein: Structural and biochemical insights into the cytokinin transduction pathway in plants. Febs. J. 2013, 280, 3709–3720. [Google Scholar] [CrossRef] [PubMed]
- Sugawara, H.; Kawano, Y.; Hatakeyama, T.; Yamaya, T.; Kamiya, N.; Sakakibara, H. Crystal structure of the histidine-containing phosphotransfer protein ZmHP2 from maize. Protein Sci. 2005, 14, 202–208. [Google Scholar] [CrossRef]
- Bae, E.; Bitto, E.; Bingman, C.A.; Allard, S.T.; Wesenberg, G.E.; Wrobel, R.L.; Fox, B.G.; Phillips, G.N. Crystal structure of a putative histidine-containing phosphotransfer protein from Oryza sativa. J. Korean Soc. Appl. Biol. Chem. 2010, 53, 852–856. [Google Scholar] [CrossRef]
- Levin, E.J.; Kondrashov, D.A.; Wesenberg, G.E.; Phillips, G.N. Ensemble refinement of protein crystal structures: Validation and application. Structure 2007, 15, 1040–1052. [Google Scholar] [CrossRef] [PubMed]
- Xu, Q.; Porter, S.W.; West, A.H. The yeast YPD1/SLN1 complex: Insights into molecular recognition in two-component signaling systems. Structure 2003, 11, 1569–1581. [Google Scholar] [CrossRef]
- Zhao, X.; Copeland, D.M.; Soares, A.S.; West, A.H. Crystal structure of a complex between the phosphorelay protein YPD1 and the response regulator domain of SLN1 bound to a phosphoryl analog. J. Mol. Biol. 2008, 375, 1141–1151. [Google Scholar] [CrossRef]
- Song, H.K.; Lee, J.Y.; Lee, M.G.; Moon, J.; Min, K.; Yang, J.K.; Suh, S.W. Insights into eukaryotic multistep phosphorelay signal transduction revealed by the crystal structure of Ypd1p from Saccharomyces cereviciae. J. Mol. Biol. 1999, 293, 753–761. [Google Scholar] [CrossRef] [PubMed]
- Kennedy, E.N.; Hebdon, S.D.; Menon, S.K.; Foster, C.A.; Copeland, D.M.; Xu, Q.; Janiak-Spens, F.; West, A.H. Role of the highly conserved G68 residue in the yeast phosphorelay protein Ypd1: Implications for interactions between histidine phosphotransfer (HPt) and response regulator proteins. BMC Biochem. 2019, 20, 1. [Google Scholar] [CrossRef] [PubMed]
- Bhate, M.P.; Molnar, K.S.; Goulian, M.; DeGrado, W.F. Signal transduction in histidine kinases: Insights from new structures. Structure 2015, 23, 981–994. [Google Scholar] [CrossRef] [PubMed]
- Lomin, S.N.; Myakushina, Y.A.; Arkhipov, D.V.; Leonova, O.G.; Popenko, V.I.; Schmülling, T.; Romanov, G.A. Studies of cytokinin receptor–phosphotransmitter interaction provide evidences for the initiation of cytokinin signalling in the endoplasmic reticulum. Funct. Plant Biol. 2018, 45, 192–202. [Google Scholar] [CrossRef]
- Laddach, A.; Chung, S.S.; Fraternali, F. Prediction of protein–protein interactions: Looking through the kaleidoscope. In Encyclopedia of Bioinformatics and Computational Biology, 1st ed.; Ranganathan, S., Gribskov, M., Nakai, K., Schönbach, C., Eds.; Elsevier: Amsterdam, Netherlands, 2019; Volume 2, pp. 834–848. [Google Scholar]
- Krissinel, E. Crystal contacts as nature’s docking solutions. J. Comput. Chem. 2010, 31, 133–143. [Google Scholar] [CrossRef]
- Dortay, H.; Mehnert, N.; Bürkle, L.; Schmülling, T.; Heyl, A. Analysis of protein interactions within the cytokinin-signaling pathway of Arabidopsis thaliana. Febs. J. 2006, 273, 4631–4644. [Google Scholar] [CrossRef]
- Verma, V.; Sivaraman, J.; Srivastava, A.K.; Sadanandom, A.; Kumar, P.P. Destabilization of interaction between cytokinin signaling intermediates AHP1 and ARR4 modulates Arabidopsis development. New Phytol. 2015, 206, 726–737. [Google Scholar] [CrossRef] [PubMed] [Green Version]
- Scharein, B.; Groth, G. Phosphorylation alters the interaction of the Arabidopsis phosphotransfer protein AHP1 with its sensor kinase ETR1. PLoS ONE 2011, 6, e24173. [Google Scholar] [CrossRef] [PubMed]
- Biasini, M.; Bienert, S.; Waterhouse, A.; Arnold, K.; Studer, G.; Schmidt, T.; Kiefer, F.; Cassarino, T.G.; Bertoni, M.; Bordoli, L.; et al. SWISS-MODEL: Modelling protein tertiary and quaternary structure using evolutionary information. Nucleic Acids Res. 2014, 42, W252–W258. [Google Scholar] [CrossRef]
- Altschul, S.F.; Gish, W.; Miller, W.; Myers, E.W.; Lipman, D.J. Basic local alignment search tool. J. Mol. Biol. 1990, 215, 403–410. [Google Scholar] [CrossRef]
- Larkin, M.A.; Blackshields, G.; Brown, N.P.; Chenna, R.; McGettigan, P.A.; McWilliam, H.; Valentin, F.; Wallace, I.M.; Wilm, A.; Lopez, R.; et al. Clustal W and Clustal X version 2.0. Bioinformatics 2007, 23, 2947–2948. [Google Scholar] [CrossRef] [PubMed] [Green Version]
- Bellsolell, L.; Prieto, J.; Serrano, L.; Coll, M. Magnesium binding to the bacterial chemotaxis protein CheY results in large conformational changes involving its functional surface. J. Mol. Biol. 1994, 238, 489–495. [Google Scholar] [CrossRef] [PubMed]
- Sali, A.; Blundell, T.L. Comparative protein modelling by satisfaction of spatial restraints. J. Mol. Biol. 1993, 234, 779–815. [Google Scholar] [CrossRef]
- Shen, M.-Y.; Sali, A. Statistical potential for assessment and prediction of protein structures. Protein Sci. 2006, 15, 2507–2524. [Google Scholar] [CrossRef] [PubMed] [Green Version]
- Margreitter, C.; Petrov, D.; Zagrovic, B. Vienna-PTM webserver: A toolkit for MD simulations of protein post-translational modifications. Nucleic Acids Res. 2013, 41, W422–426. [Google Scholar] [CrossRef] [PubMed]
- Pettersen, E.F.; Goddard, T.D.; Huang, C.C.; Couch, G.S.; Greenblatt, D.M.; Meng, E.C.; Ferrin, T.E. UCSF Chimera—A visualization system for exploratory research and analysis. J. Comput. Chem. 2004, 25, 1605–1612. [Google Scholar] [CrossRef]
- Maier, J.A.; Martinez, C.; Kasavajhala, K.; Wickstrom, L.; Hauser, K.E.; Simmerling, C. ff14SB: Improving the Accuracy of Protein Side Chain and Backbone Parameters from ff99SB. J. Chem. Comput. 2015, 11, 3696–3713. [Google Scholar] [CrossRef]
- Laskowski, R.A.; MacArthur, M.W.; Moss, D.S.; Thornton, J.M. PROCHECK – a program to check the stereochemical quality of protein structures. J. App. Cryst. 1993, 26, 283–291. [Google Scholar] [CrossRef]
- Laskowski, R.A.; Jabłońska, J.; Pravda, L.; Vařeková, R.S.; Thornton, J.M. PDBsum: Structural summaries of PDB entries. Protein Sci. 2018, 27, 129–134. [Google Scholar] [CrossRef]
- Wiederstein, M.; Sippl, M.J. ProSA-web: Interactive web service for the recognition of errors in three-dimensional structures of proteins. Nucleic Acids Res. 2007, 35 (suppl_2), W407–W410. [Google Scholar] [CrossRef] [PubMed]
- Benkert, P.; Kunzli, M.; Schwede, T. QMEAN server for protein model quality estimation. Nucleic Acids Res. 2009, 37, W510–W514. [Google Scholar] [CrossRef] [Green Version]
- Dunbrack, R.L., Jr. Rotamer libraries in the 21st century. Curr. Opin. Struct. Biol. 2002, 12, 431–440. [Google Scholar] [CrossRef]
- Kortemme, T.; Kim, D.E.; Baker, D. Computational alanine scanning of protein–protein interfaces. Sci. Stke 2004, 219, pl2. [Google Scholar] [CrossRef] [PubMed]
- Darnell, S.J.; Page, D.; Mitchell, J.C. Automated decision-tree approach to predicting protein–protein interaction hot spots. Proteins 2007, 68, 813–823. [Google Scholar] [CrossRef]
- Sukhwal, A.; Sowdhamini, R. Oligomerisation status and evolutionary conservation of interfaces of protein structural domain superfamilies. Mol. Biosyst. 2013, 9, 1652–1661. [Google Scholar] [CrossRef] [PubMed]
- Krissinel, E.; Henrick, K. Inference of macromolecular assemblies from crystalline state. J. Mol. Biol. 2007, 372, 774–797. [Google Scholar] [CrossRef] [PubMed]
- Xue, L.; Rodrigues, J.; Kastritis, P.; Bonvin, A.M.J.J.; Vangone, A. PRODIGY: A web-server for predicting the binding affinity in protein–protein complexes. Bioinformatics 2016, 32, 3676–3678. [Google Scholar] [CrossRef]
- Gabdoulline, R.R.; Wade, R.C.; Walther, D. MolSurfer: A macromolecular interface navigator. Nucleic Acids Res. 2003, 31, 3349–3351. [Google Scholar] [CrossRef]
- Dolinsky, T.J.; Nielsen, J.E.; McCammon, J.A.; Baker, N.A. PDB2PQR: An automated pipeline for the setup, execution, and analysis of Poisson-Boltzmann electrostatics calculations. Nucleic Acids Res. 2004, 32, W665–W667. [Google Scholar] [CrossRef]
- Glaser, F.; Pupko, T.; Paz, I.; Bell, R.E.; Bechor, D.; Martz, E.; Ben-Tal, N. ConSurf: Identification of functional regions in proteins by surface-mapping of phylogenetic information. Bioinformatics 2003, 19, 163–164. [Google Scholar] [CrossRef]
- Ashkenazy, H.; Abadi, S.; Martz, E.; Chay, O.; Mayrose, I.; Pupko, T.; Ben-Tal, N. ConSurf 2016: An improved methodology to estimate and visualize evolutionary conservation in macromolecules. Nucl. Acids Res. 2016, 44, 344–350. [Google Scholar] [CrossRef]
- Kyte, J.; Doolittle, R.F. A simple method for displaying the hydropathic character of a protein. J. Mol. Biol. 1982, 157, 105–132. [Google Scholar] [CrossRef] [Green Version]
- Kozakov, D.; Hall, D.R.; Xia, B.; Porter, K.A.; Padhorny, D.; Yueh, C.; Beglov, D.; Vajda, S. The ClusPro web server for protein–protein docking. Nat. Protoc. 2017, 12, 255–278. [Google Scholar] [CrossRef] [PubMed] [Green Version]
- Schneidman-Duhovny, D.; Inbar, Y.; Nussinov, R.; Wolfson, H.J. PatchDock and SymmDock: Servers for rigid and symmetric docking. Nucleic Acids Res. 2005, 33, W363–W367. [Google Scholar] [CrossRef] [PubMed]
- Pi, J.; Sael, L. Mass spectrometry coupled experiments and protein structure modeling methods. Int. J. Mol. Sci. 2013, 14, 20635–20657. [Google Scholar] [CrossRef] [PubMed]
- Kolachevskaya, O.O.; Lomin, S.N.; Arkhipov, D.V.; Romanov, G.A. Auxins in potato: Molecular aspects and emerging roles in tuber formation and stress resistance. Plant Cell Rep. 2019. [Google Scholar] [CrossRef]


| Protein–Protein Complex | ΔG (kcal/mol) | ΔG (kJ/mol) | Kd (μM) at 25 °C |
|---|---|---|---|
| AHK3rd–AHP2_Apo | −8 | −33.47 | 1.3 |
| AHK3rd–AHP2_Mg2+ | −8.5 | −35.56 | 0.6 |
| AHK3rd(P) –AHP2_Mg2+ | −8.8 | −36.82 | 0.35 |
| AHK3rd–AHP2(P)_Mg2+ | −7.9 | −33.05 | 1.5 |
| AHK3rd(P)–AHP2(P)_Mg2+ | −8.1 | −33.89 | 1.1 |
| AHK3rd(D941E)–AHP2_Mg2+ | −8.5 | −35.56 | 0.54 |
| AHK3rd–AHP2(H82E)_Mg2+ | −8.4 | −35.15 | 0.72 |
| Modeled Structure | Template Structure | |||
|---|---|---|---|---|
| Complex | Chain/Counterpart | PDB ID/chain ID | Protein Name | Reference |
| Sensory module dimers | chains AB | 3T4L/AB | AHK4 | [4] |
| HisKA domain dimers | chains AB | 4MT8/AB | ERS1 | [6] |
| HKrd–HPt complexes | HKrd (chainA) | 3MMN/A | CKI1 | [17] |
| 4EUK/A | CKI2(AHK5) | [19] | ||
| HPt (chain B) | 4EUK/B | AHP1 | [19] | |
| HPt–HPt dimers | chains AB | 1YVI/AB | OsHP1 | [23,24] |
| RRrd–HPt complexes | RRrd (chain A) | 1CHN/A | CheY | [38] |
| 4EUK A | CKI2(AHK5) | [19] | ||
| HPt (chain B) | 4EUK B | AHP1 | [19] | |
© 2019 by the authors. Licensee MDPI, Basel, Switzerland. This article is an open access article distributed under the terms and conditions of the Creative Commons Attribution (CC BY) license (http://creativecommons.org/licenses/by/4.0/).
Share and Cite
Arkhipov, D.V.; Lomin, S.N.; Myakushina, Y.A.; Savelieva, E.M.; Osolodkin, D.I.; Romanov, G.A. Modeling of Protein–Protein Interactions in Cytokinin Signal Transduction. Int. J. Mol. Sci. 2019, 20, 2096. https://doi.org/10.3390/ijms20092096
Arkhipov DV, Lomin SN, Myakushina YA, Savelieva EM, Osolodkin DI, Romanov GA. Modeling of Protein–Protein Interactions in Cytokinin Signal Transduction. International Journal of Molecular Sciences. 2019; 20(9):2096. https://doi.org/10.3390/ijms20092096
Chicago/Turabian StyleArkhipov, Dmitry V., Sergey N. Lomin, Yulia A. Myakushina, Ekaterina M. Savelieva, Dmitry I. Osolodkin, and Georgy A. Romanov. 2019. "Modeling of Protein–Protein Interactions in Cytokinin Signal Transduction" International Journal of Molecular Sciences 20, no. 9: 2096. https://doi.org/10.3390/ijms20092096