Article

Combined Transcriptome and Proteome Analysis of Masson Pine (Pinus massoniana Lamb.) Seedling Root in Response to Nitrate and Ammonium Supplementations

1
Institute for Forest Resources and Environment Research Center of Guizhou Province, Plateau Mountain Forest Cultivation Key Laboratory of Guizhou Province,College of Forestry, Guizhou University, Guiyang 550025, China
2
Guizhou Botanical Garden, Guiyang 550004, China
*
Author to whom correspondence should be addressed.
Int. J. Mol. Sci. 2020, 21(20), 7548; https://doi.org/10.3390/ijms21207548
Submission received: 9 September 2020 / Revised: 5 October 2020 / Accepted: 8 October 2020 / Published: 13 October 2020
(This article belongs to the Section Molecular Plant Sciences)

Abstract

:
Nitrogen (N) is an essential nutrient for plant growth and development. Plant species respond to N fluctuations and N sources, i.e., ammonium or nitrate, differently. Masson pine (Pinus massoniana Lamb.) is one of the pioneer plants in the southern forests of China. It shows better growth when grown in medium containing ammonium as compared to nitrate. In this study, we had grown masson pine seedlings in medium containing ammonium, nitrate, and a mixture of both, and performed comparative transcriptome and proteome analyses to observe the differential signatures. Our transcriptome and proteome resulted in the identification of 1593 and 71 differentially expressed genes and proteins, respectively. Overall, the masson pine roots had better performance when fed with a mixture of ammonium and nitrate. The transcriptomic and proteomics results combined with the root morphological responses suggest that when ammonium is supplied as a sole N-source to masson pine seedlings, the expression of ammonium transporters and other non-specific NH4+-channels increased, resulting in higher NH4+ concentrations. This stimulates lateral roots branching as evidenced from increased number of root tips. We discussed the root performance in association with ethylene responsive transcription factors, WRKYs, and MADS-box transcription factors. The differential analysis data suggest that the adaptability of roots to ammonium is possibly through the promotion of TCA cycle, owing to the higher expression of malate synthase and malate dehydrogenase. Masson pine seedlings managed the increased NH4+ influx by rerouting N resources to asparagine production. Additionally, flavonoid biosynthesis and flavone and flavonol biosynthesis pathways were differentially regulated in response to increased ammonium influx. Finally, changes in the glutathione s-transferase genes suggested the role of glutathione cycle in scavenging the possible stress induced by excess NH4+. These results demonstrate that masson pine shows increased growth when grown under ammonium by increased N assimilation. Furthermore, it can tolerate high NH4+ content by involving asparagine biosynthesis and glutathione cycle.

1. Introduction

Nitrogen (N) is the building block of fundamental biological molecules and a key nutrient for plant growth and development. Because it is a major limiting nutrient in growth and development of plants, substantial amount of N is used to achieve high growth and productivity. N is taken up by plant roots directly both in organic (amino acids, peptides, and proteins) and inorganic (such as nitrate (NO3), ammonium (NH4+), and urea) forms [1]. The two major inorganic N sources for plants, i.e., nitrate and ammonium differ in their chemical property as well as their availability in soils [2]. When present in water, both N-sources have similar diffusion coefficients but in soil, they behave differently due to negative ion charge and viscosity of the soil and other complex soil properties. Therefore, plants adapt their root morphology in response to N-source to optimize N absorption. It has been seen in earlier reports that lateral root branching is stimulated by ammonium, whereas nitrate stimulates lateral root elongation. Both N sources affect the plant differently; however, the N utilization efficiency also varies in different plant species. For example, it is known that many forest tree species utilize ammonium-N [3]. The higher diffusion constant of nitrate (10–100 times higher than ammonium) allows it to be rapidly transported towards roots [4]. On the other hand, the energy expenditure to acquire ammonium-N is far less than nitrate-N [2]. But at the same time, it has been established that ammonium accumulation in roots can cause toxicity [5,6]. Nevertheless, different plant species have demonstrated preference to ammonium, e.g., Picea glauca and Pinus radiate [6,7]. These reports suggested that relatively slower growth in nitrate rich environments was possibly due to highly atrophied transport systems for the ion. On the other hand, the rich ammonium content in the forest soils due to low nitrification potential could be a driving factor for the preference [8].
Nitrate transport, with a net negative charge, is accompanied with two protons through specific transporter, i.e., nitrate transporters (NRTs) [9,10]. Two nitrate transport systems, i.e., low-affinity transport system (LATS) and the high-affinity transport system (HATS), act coordinately to take up nitrate from soil through plant roots. Both transport systems involve NRT1 and NRT2 families, respectively [9]. Additionally, chloride channels (CLC) have also been implicated in NO3/H+ accumulation in vacuoles [11]. Once, N (as nitrate) arrives in root, it is reduced to nitrite catalyzed by nitrate reductase (NR) and then further reduced to NH4+ and the reaction is catalyzed by nitrite reductase (NiR). In contrast, ammonium, with a net positive charge, is eletrogenically transported by ammonium transporters (AMTs) [12,13]. Regarding ammonium transport, physiological and ammonium influx studies have shown AMTs with high affinities are located in lateral root (like AMT1.1, AMT1.3, and AMT1.5) [14,15]. Other channels such as aquaporins (AQPs), potassium channels, and non-selective channels have also been associated with NH4+ transport [16]. Ammonium that is transported to the roots or formed by reduction of nitrite is assimilated in plastid by GS/GOGAT cycle [16]. Glutamine synthase (GS) catalyzes the formation of glutamine by fixing NH4+ on a glutamate and the glutamine reacts with 2-oxoglutarate (2OG) to produce two molecules of glutamate. Additionally, cytosolic NH4+ assimilation is carried out by asparagine synthetase (AS), where amino group of glutamine is transferred to a molecule of aspartate in a ATP-dependent manner to generate glutamate and asparagine [17,18]. Recent studies using proteomics approach in Arabidopsis have shown that (carbon) C/N metabolism is modulated when plants are fed with ammonium, and the authors suggested that this modulation is probably driven by alternative C provision routes to tricarboxylic cycle (TCA) while contributing H+ balance [19].
Categorizing plants for their N-source preference is an open subject, and literature is continuously being added to this regard. Earlier, Falkengren-Grerup [20] described the interspecific differences in the preference of ammonium and nitrate in 23 vascular plants. Britto and Kronzucker [21] described that N-source preference is much more complex, and sophisticated models need to be developed for its understanding. This is mainly due to interaction between both N-sources, environmental variables, i.e., temperature, soil type, soil pH, and nutrient influx and efflux in the root zone. Recent developments in genomics technologies are facilitating detailed understanding of previously unknown pathways. For example, a study on early N-deprivation in Arabidopsis root revealed that plasma membrane pH and elevated regulation of osmotic homeostasis under ammonium deprivation lead to adjustments in post-translation modifications as compared to nitrate [22]. Another study identified sets of nitrate and ammonium-specific genes. It was reported that ammonium can play a significant role as a signal too, where NH4+ assimilation related metabolites (glutamate or glutamine) can actually trigger changes in gene expression. Furthermore, it was revealed that ammonium-specific response is primarily linked with biotic stress and plant defense [23]. Nevertheless, the functionalities of ammonium in plants are not restricted since high NH4+ contents protects plants from pathogen attack, improves the cross-tolerance to other abiotic stresses, and improves the quality of crops [24].
Masson pine (Pinus massoniana Lamb.) is one of the important plant species in the southern forests of China [25]. It has gained the status of main pioneer species for forest/vegetation restoration in China. However, this species may not grow well in sites with N gradients because of their preference of ammonium and/or relatively higher soil nitrate availability, where the latter is more prevalent in such sites [26]. In a pilot study, we observed that masson pine seedlings grow better in ammonium as compared to nitrate in small sand culture conditions. Preference of an N source can be an important determinant and predictor of masson pine distribution and interactions with other species. In order to understand the genetic basis underlying this preference and to delineate the transcriptomic and proteomic signatures governing this preference, we have performed a combined proteomic and transcriptomic study in the roots of masson pine under three non-toxic N-conditions, i.e., pure ammonium, pure nitrate and a mixture of both. Here, we discuss the differential signatures, which help masson pine grow better in ammonium.

2. Results

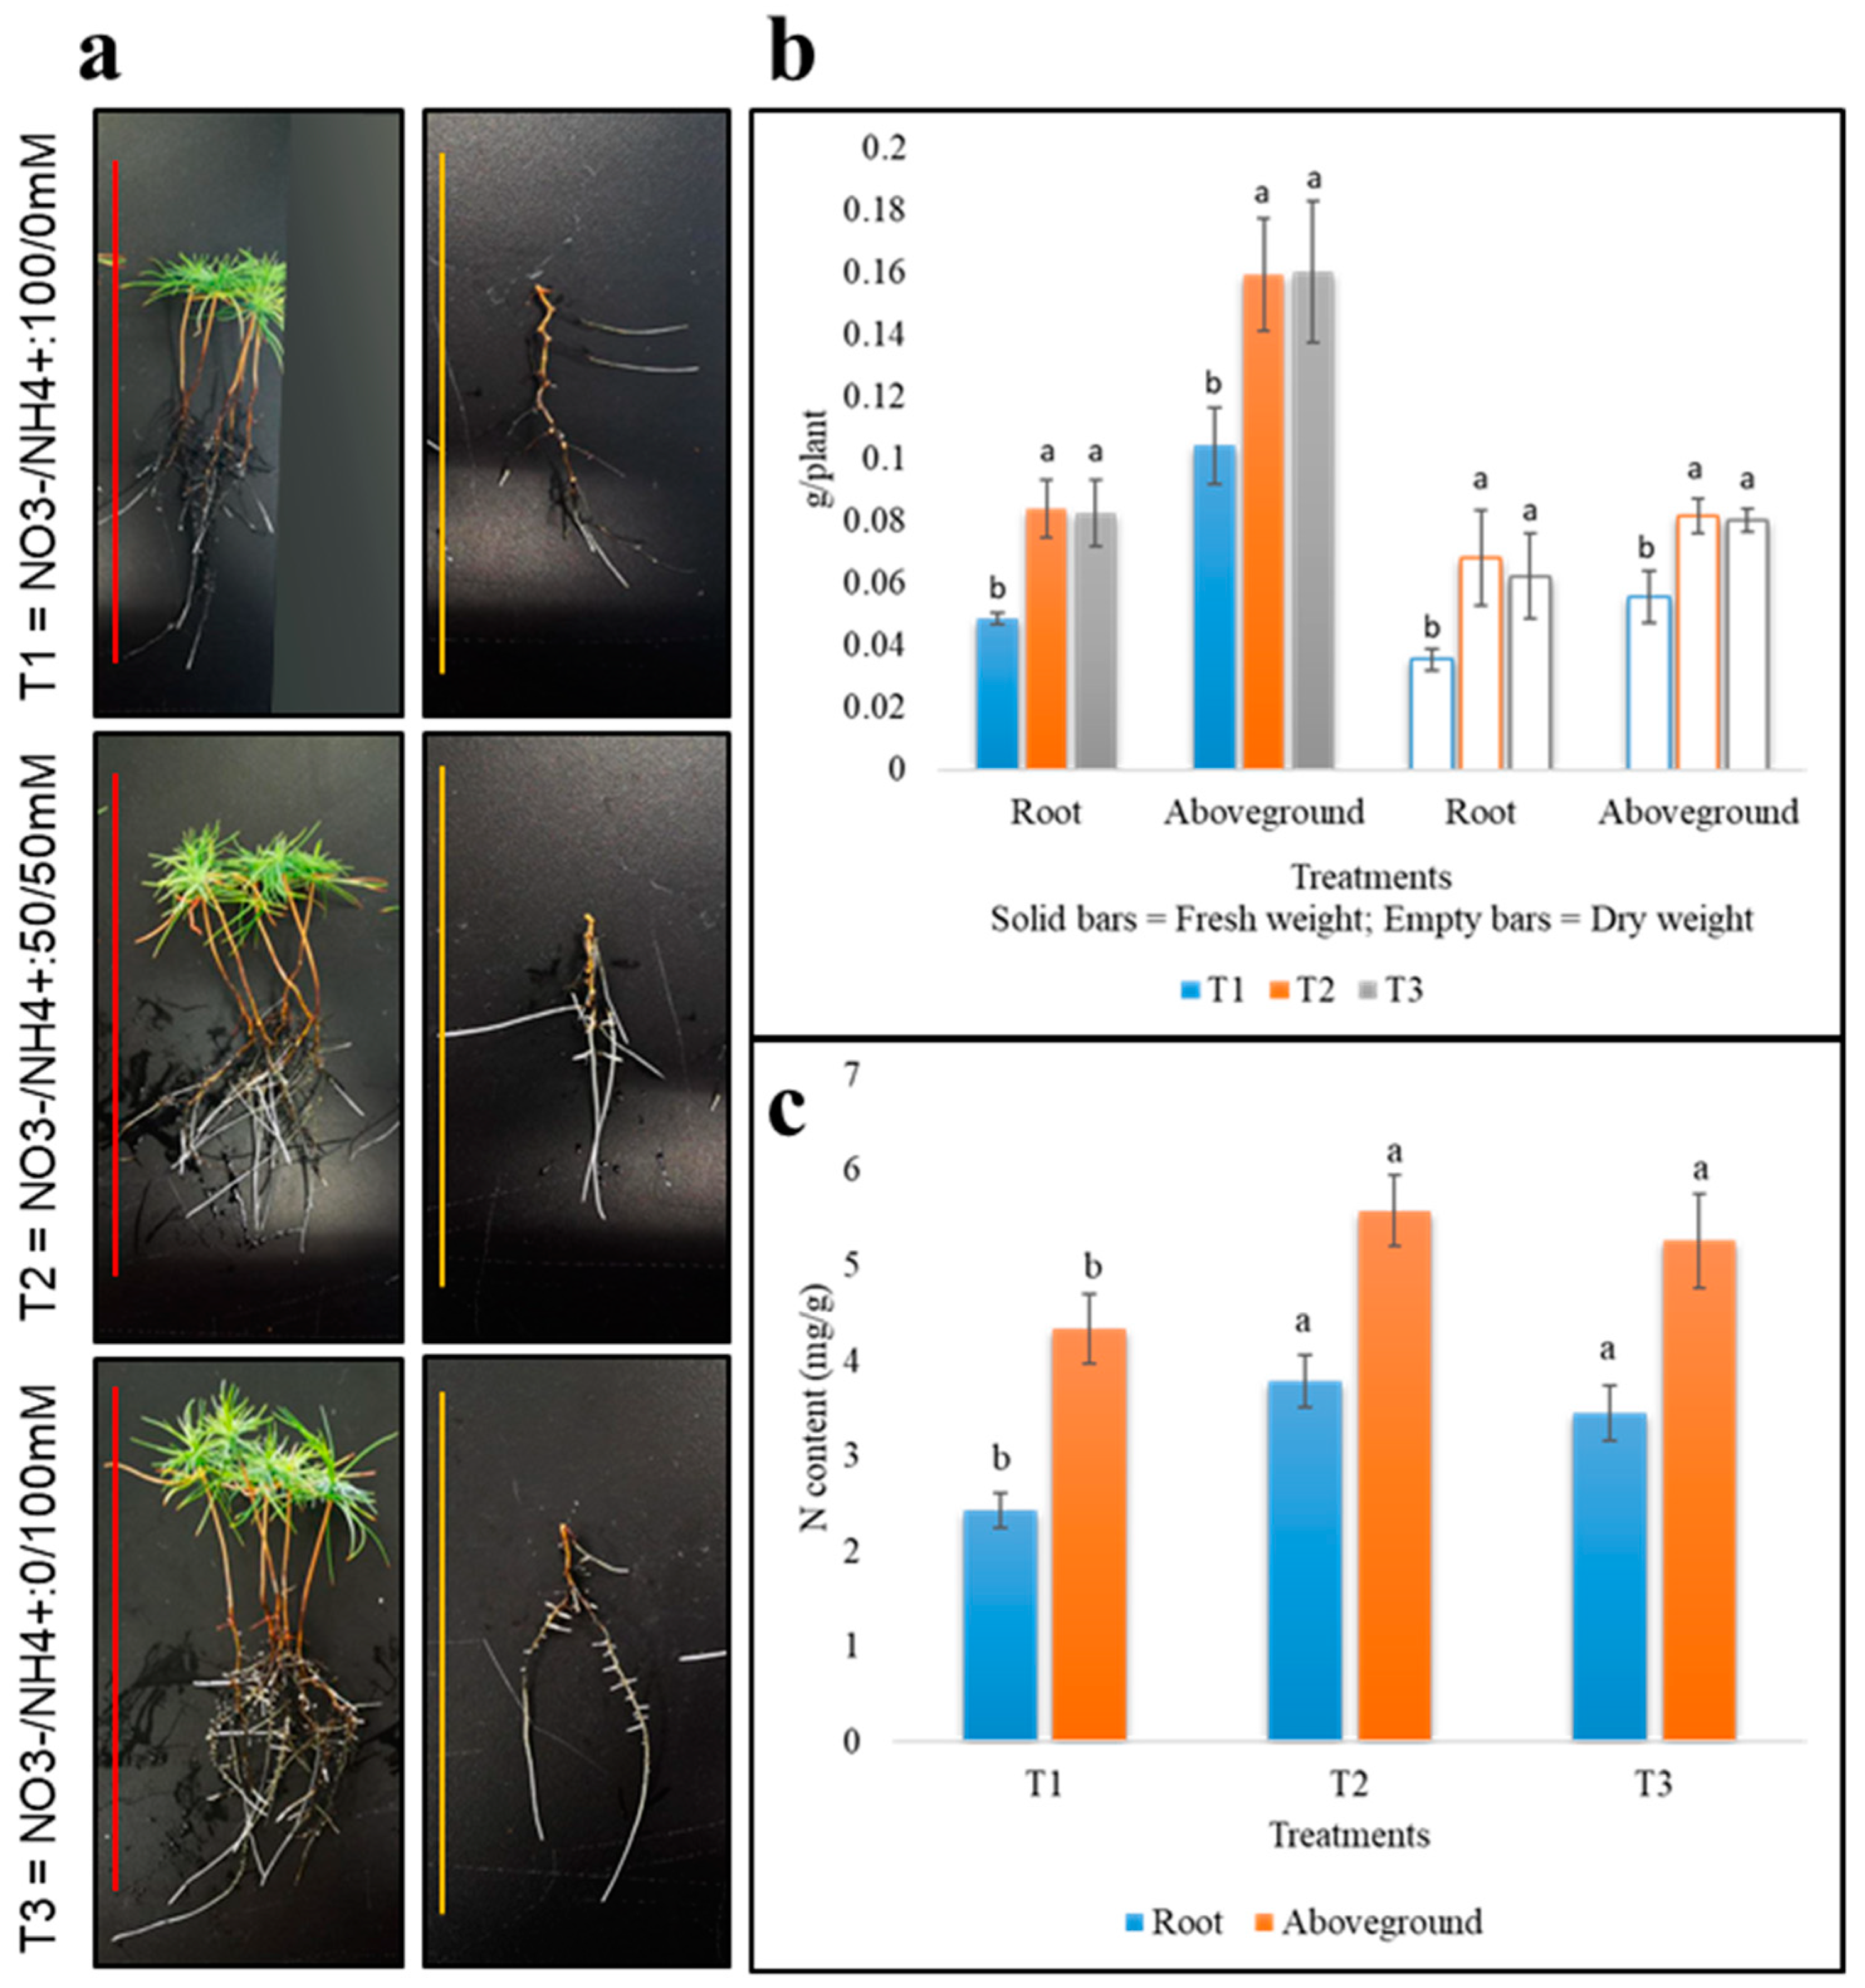
2.1. Morphological Response of Pine Roots under Different N-Nutrition

The data on the growing masson pine seedlings in different N sources, i.e., T1: NO3/NH4+: 100/0 mM, T2: NO3/NH4+: 50/50 mM, and T3: NO3/NH4+: 0/100 mM, for 30 days showed that T3 had the highest no. of root tips and longest roots. T1 had significantly lower root length, and average no. of root tips as compared to T3 (Table 1; Figure 1a). There was no significant difference for root surface area data between T2 and T3, but T1 was significantly lower than T2 and T3 for this trait. Average root volume differed significantly between T1 and T3 (Table 1; Figure 1a). Fresh and dry weights had similar pattern in aboveground part and in the roots, i.e., the weights were significantly lower in T1 as compared to T2 and T3, while weight data did not differ significantly between T2 and T3 (Figure 1b). The N content of roots and aboveground parts followed the same pattern (Figure 1c). Together, these observations suggest that when masson pine seedlings are supplied with NH4+ alone or in combination with NO3, an improvement in the studied traits was observed.

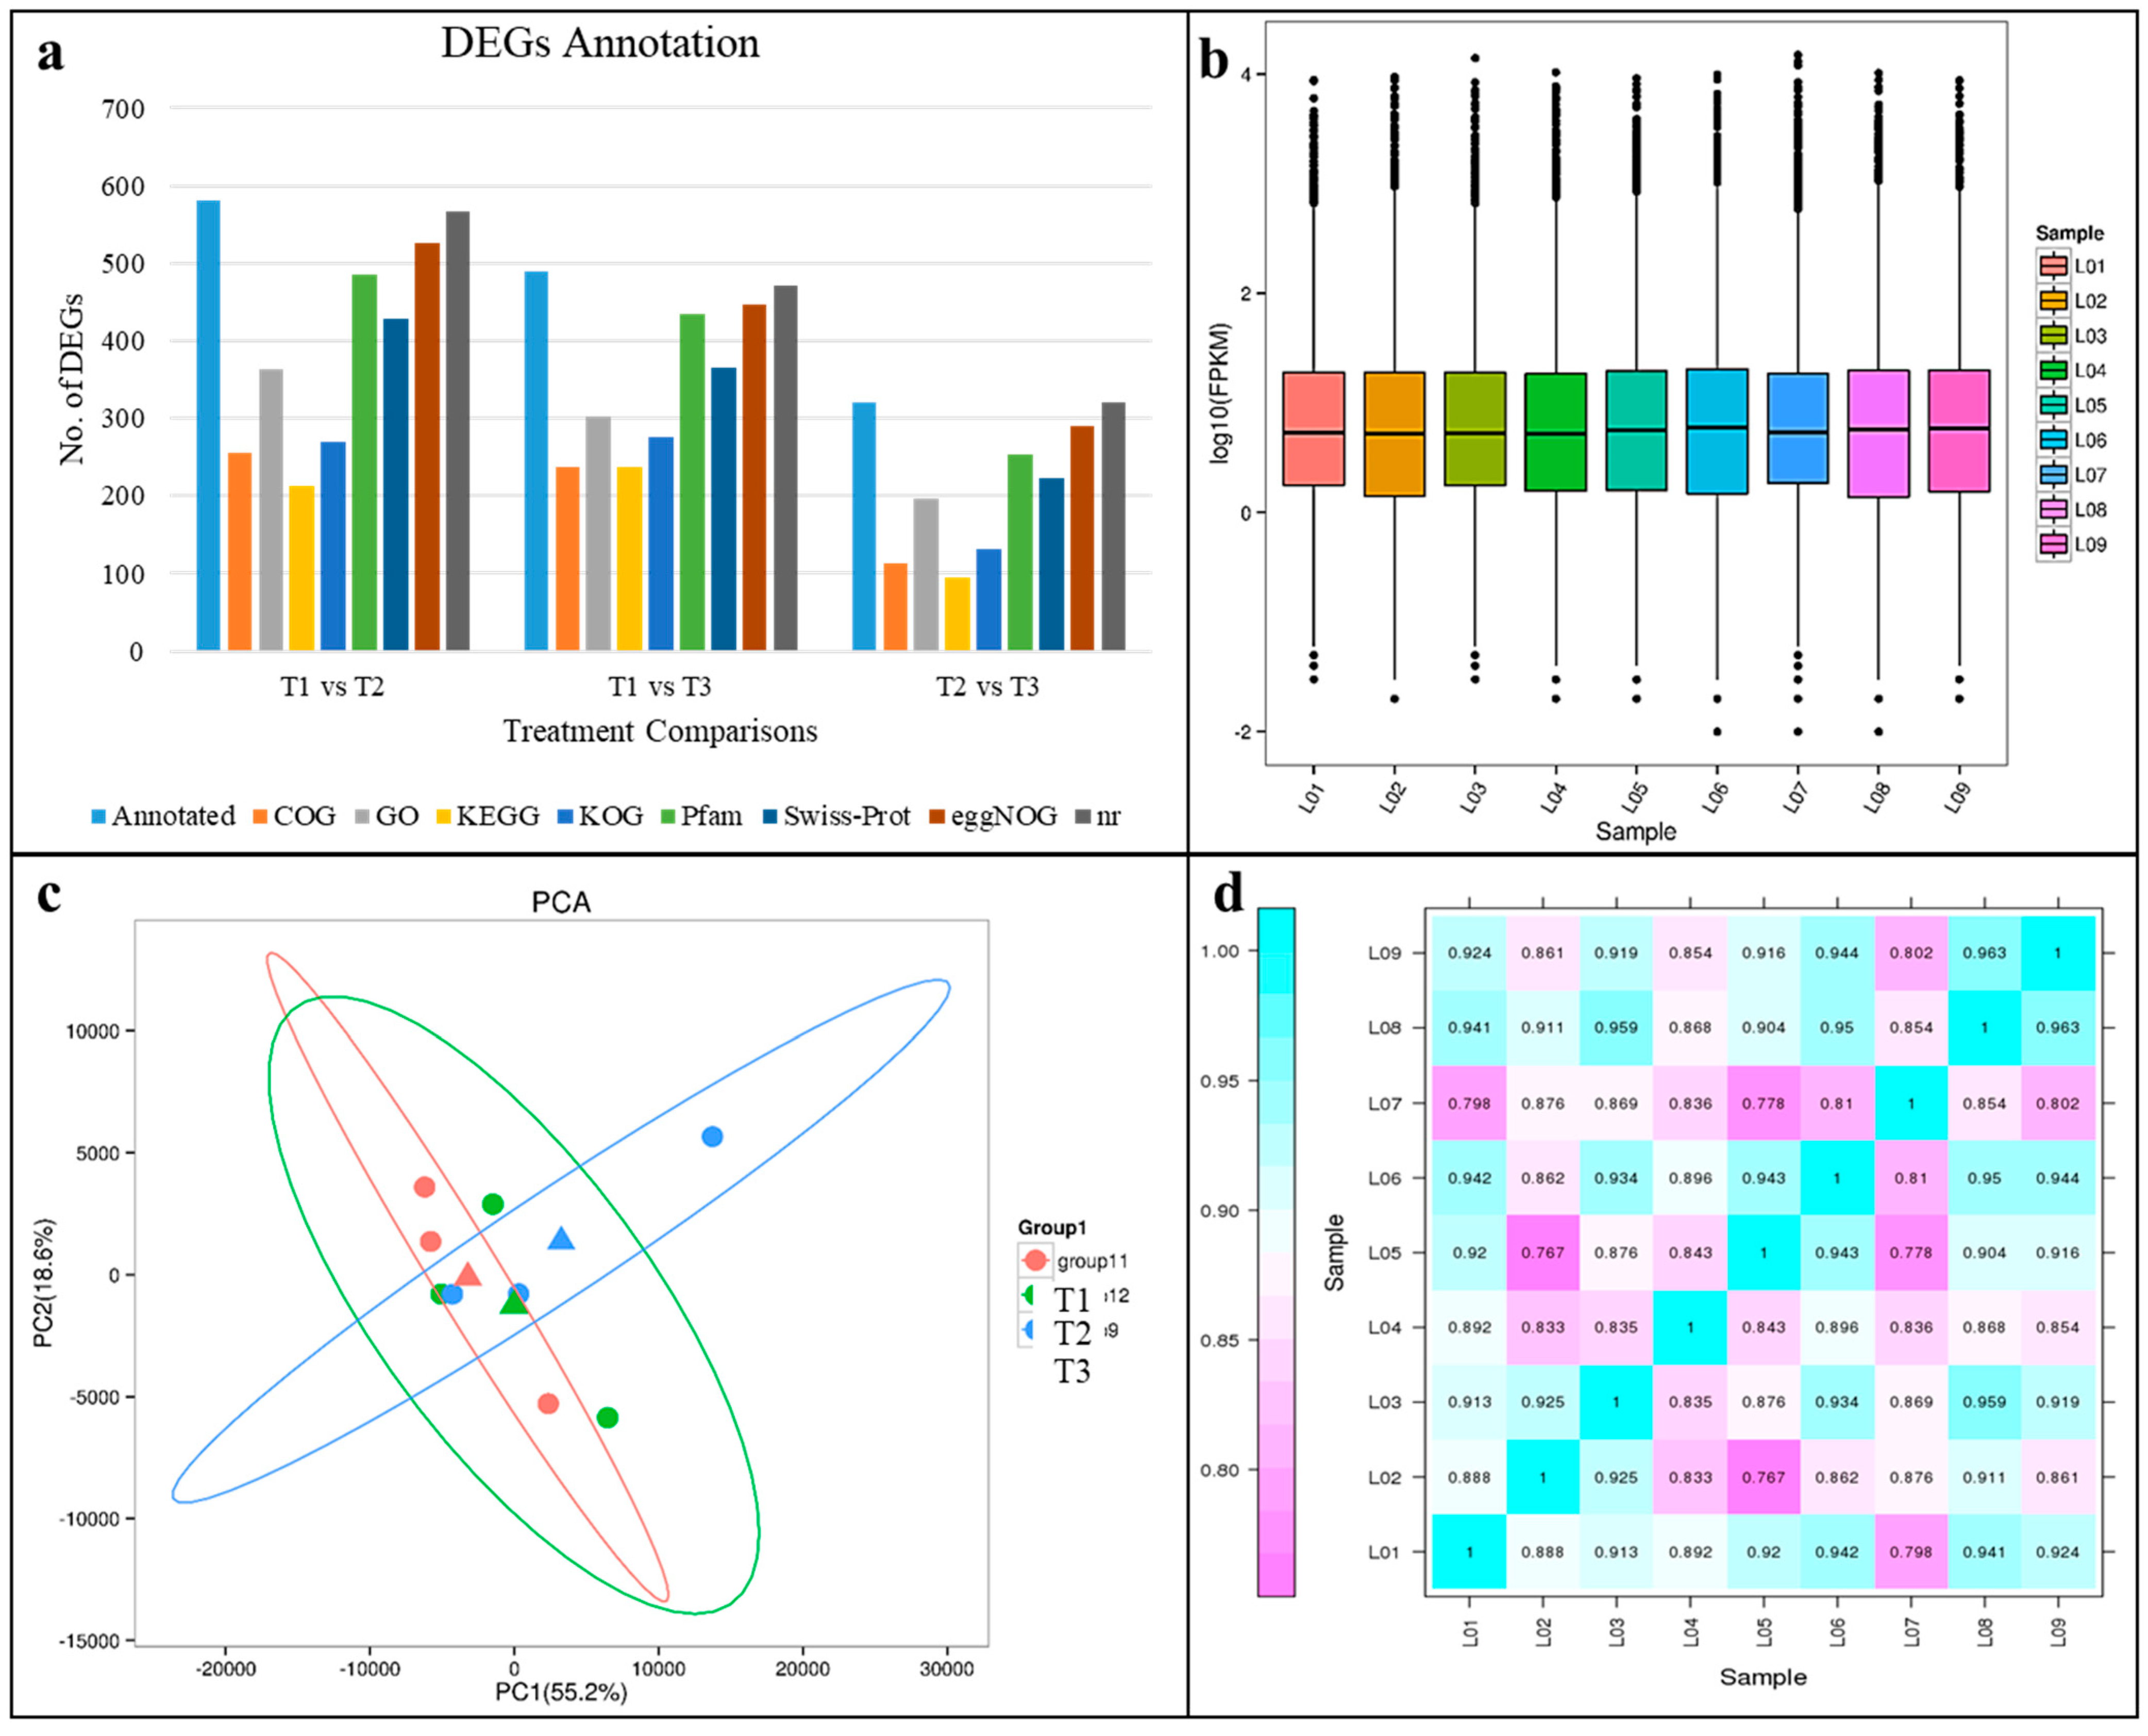
2.2. RNA Sequencing and Transcript Annotation

The transcriptome of the P. massoniana roots sequenced using Illumina Hiseq high-throughput sequencing platform showed that the reads ranging from 20.4 to 23.78 million/sample (on average 21.79 million reads) were obtained. After filtering low quality reads and adapter sequences, a total of 58.52 Gb clean data (~6.11 Gb/repeat) were obtained with Q30 based percentage ~93.13%. The clean data resulted in 34,617 unigenes, comprising 47.013 million bps with a mean length of 1358.11 bp and N50 of 2068 bp. Functional annotation of all the unigenes was conducted, a total of 6873, 10,251, 6591, 9282, 12,326, 11,304, 14,897, and 15,547 unigenes were annotated to COG, Gene ontology (GO), the Kyoto encyclopedia of genes and genomes (KEGG), eukaryotic Ortholog Groups (KOG), Pfam, Swiss-Prot, eggNOG, and non-redundant (NR), respectively. The functional DEGs annotation summary in different databases is given in Figure 2a.
The overall distribution of the gene expression based on the Fragments Per Kilobase of Transcript per Million Fragments Mapped (FPKM) method is shown in Figure 2b. The replicates of each treatment tended to group together in Principal Component Analysis (PCA) plot. The PC1 explained 55.2% variation while PC2 explained 18.6% variation (Figure 2c). Pearson correlation between replicates of all the treatments ranged from 0.767 to 0.963 (Figure 2d).

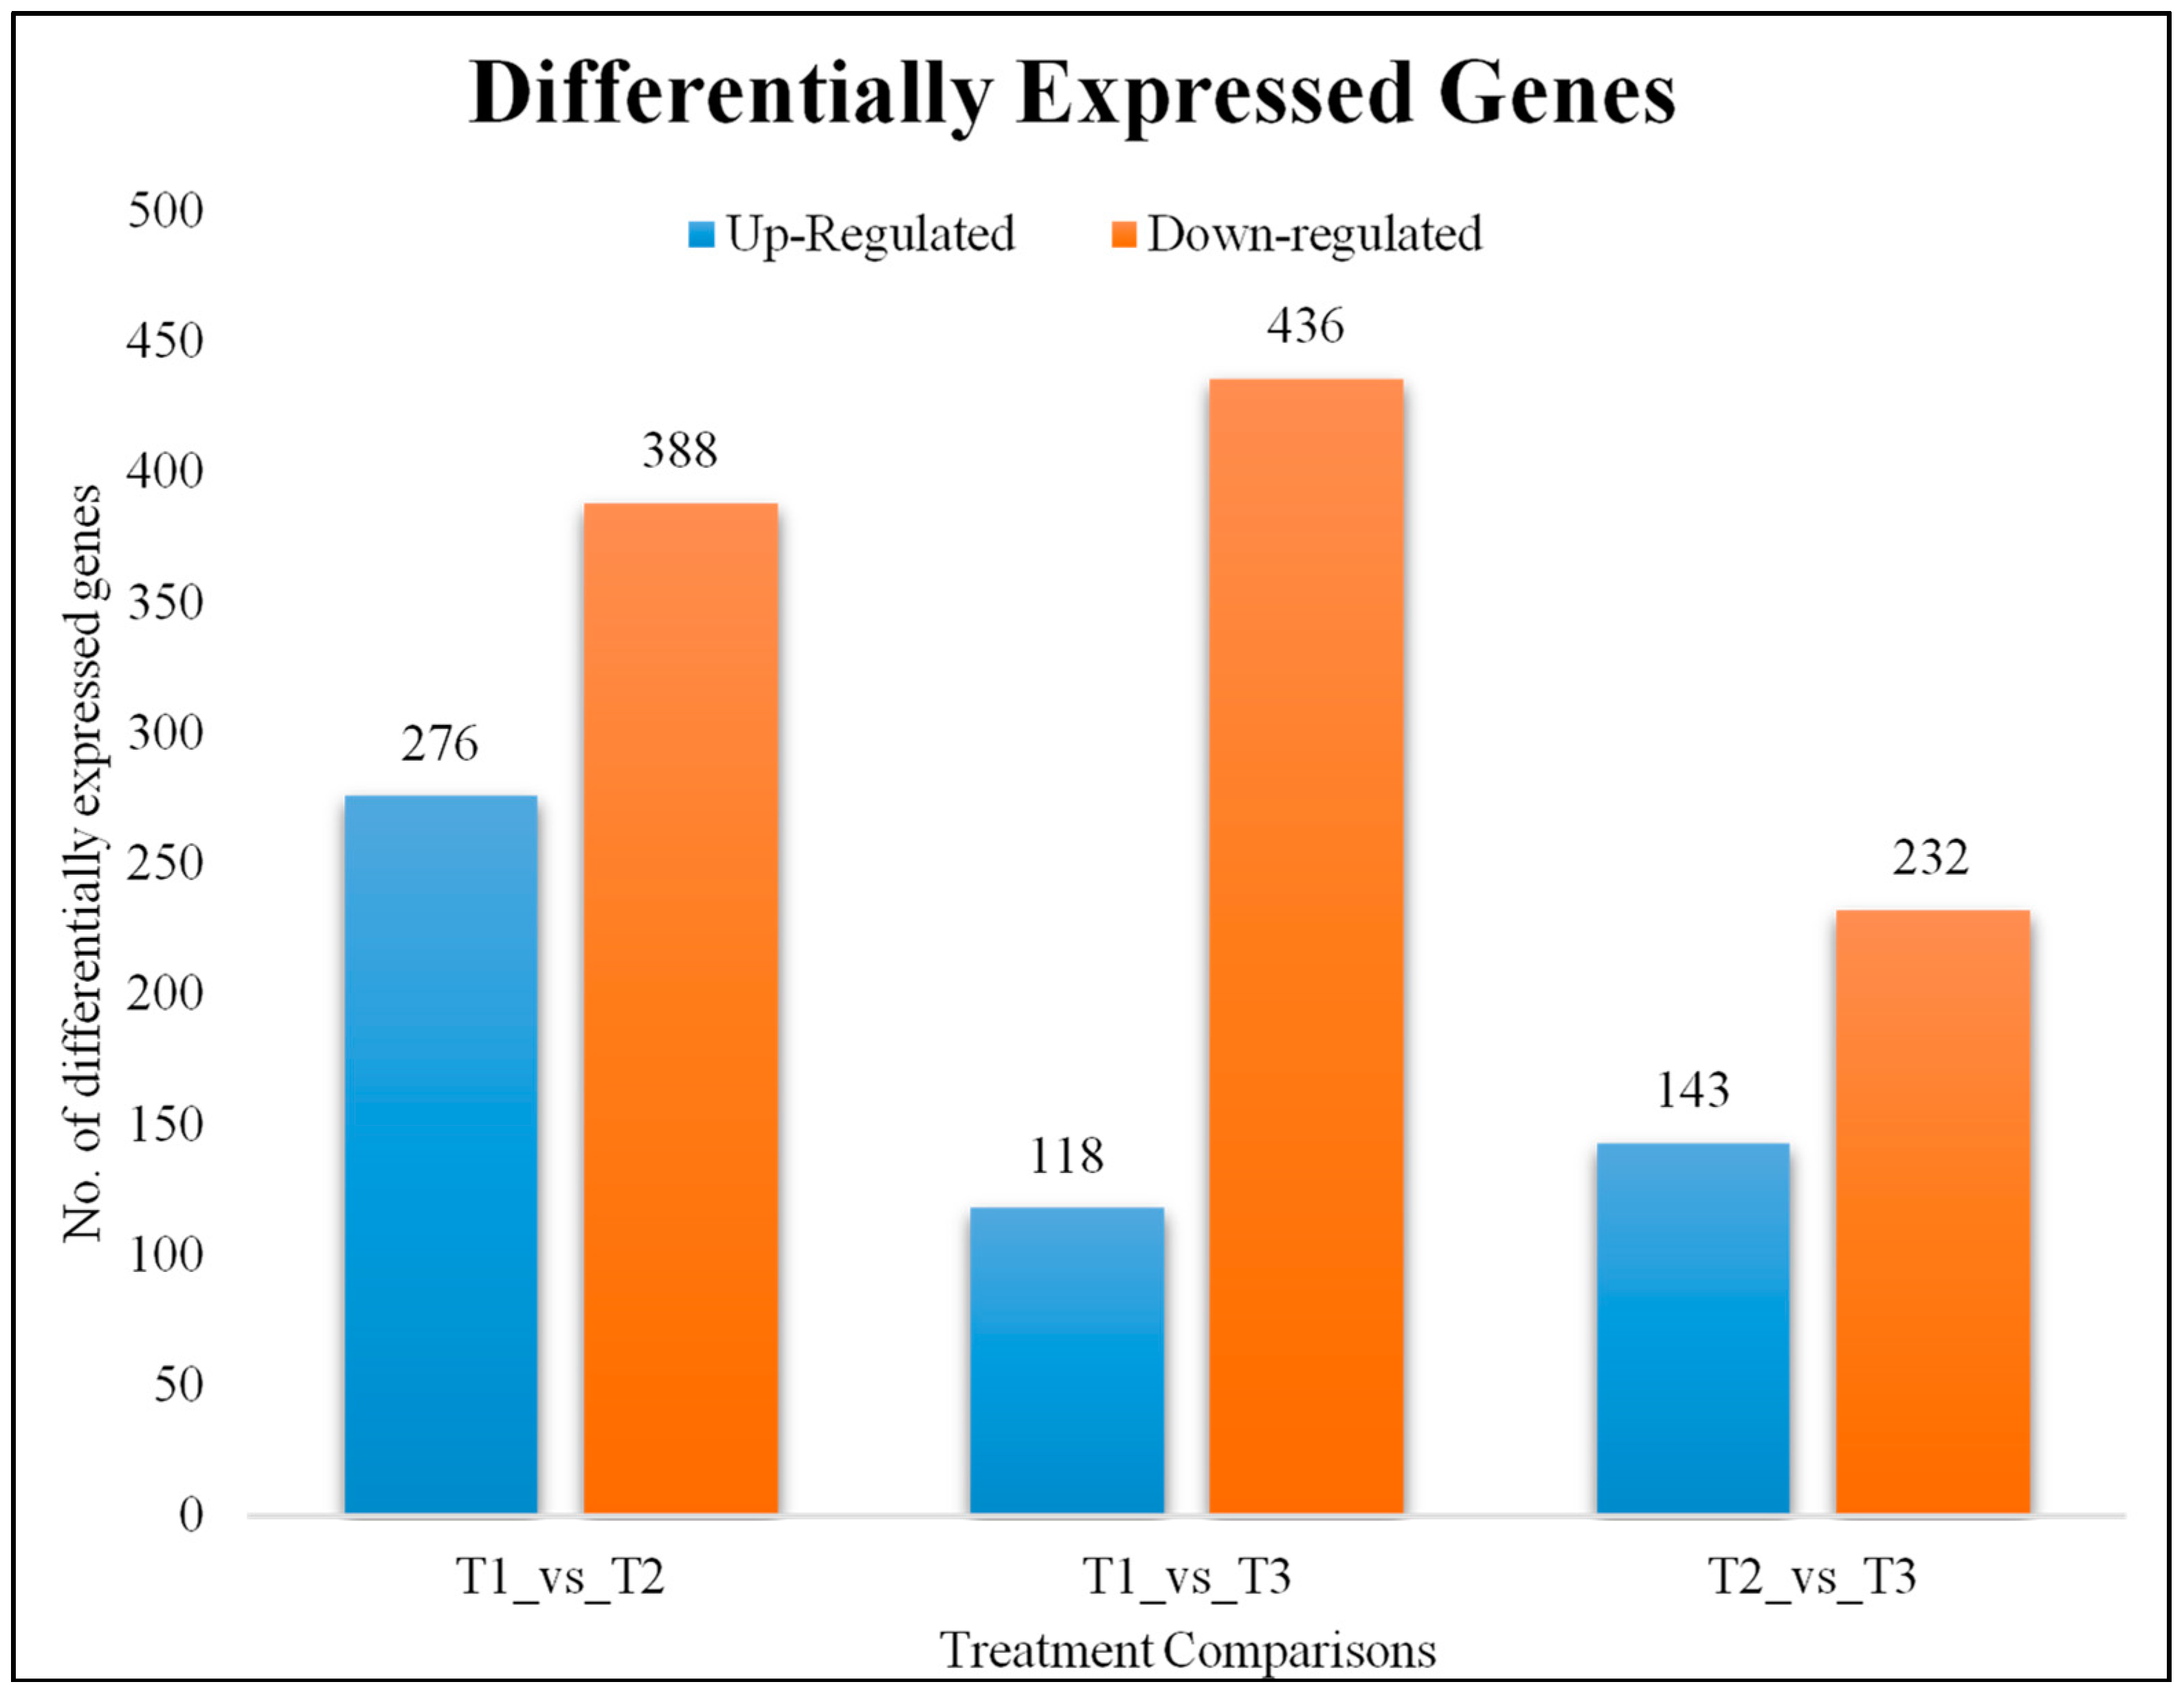
2.3. Differential Gene Expression Analysis

The screening conditions for the differentially expressed genes (DEGs) were log2 fold change ≥1 and false discovery rate (FDR) < 0.01. A total of 664, 554, and 375 DEGs were identified between T1 and T2, T1 and T3, and T2 and T3, respectively (Figure 3). We performed KEGG pathway enrichment analysis to look at the key biological pathways involved in response to different N source supplementations. The top significantly enriched pathways in T1 vs. T2 were plant hormone signal transduction, pentose and glucoronate interconversions, phenylpropanoid biosynthesis, and 62 other important pathways. In T1 vs. T3 comparison, the significantly enriched pathways were ribosome, pentose and glucoronate interconversions, carotenoid biosynthesis, and 66 other pathways. The comparison between T2 and T3 revealed the significant enrichment of phenylpropanoid biosynthesis, photosynthesis, plant-pathogen interaction, and 37 other pathways (Supplementary Figure S1).

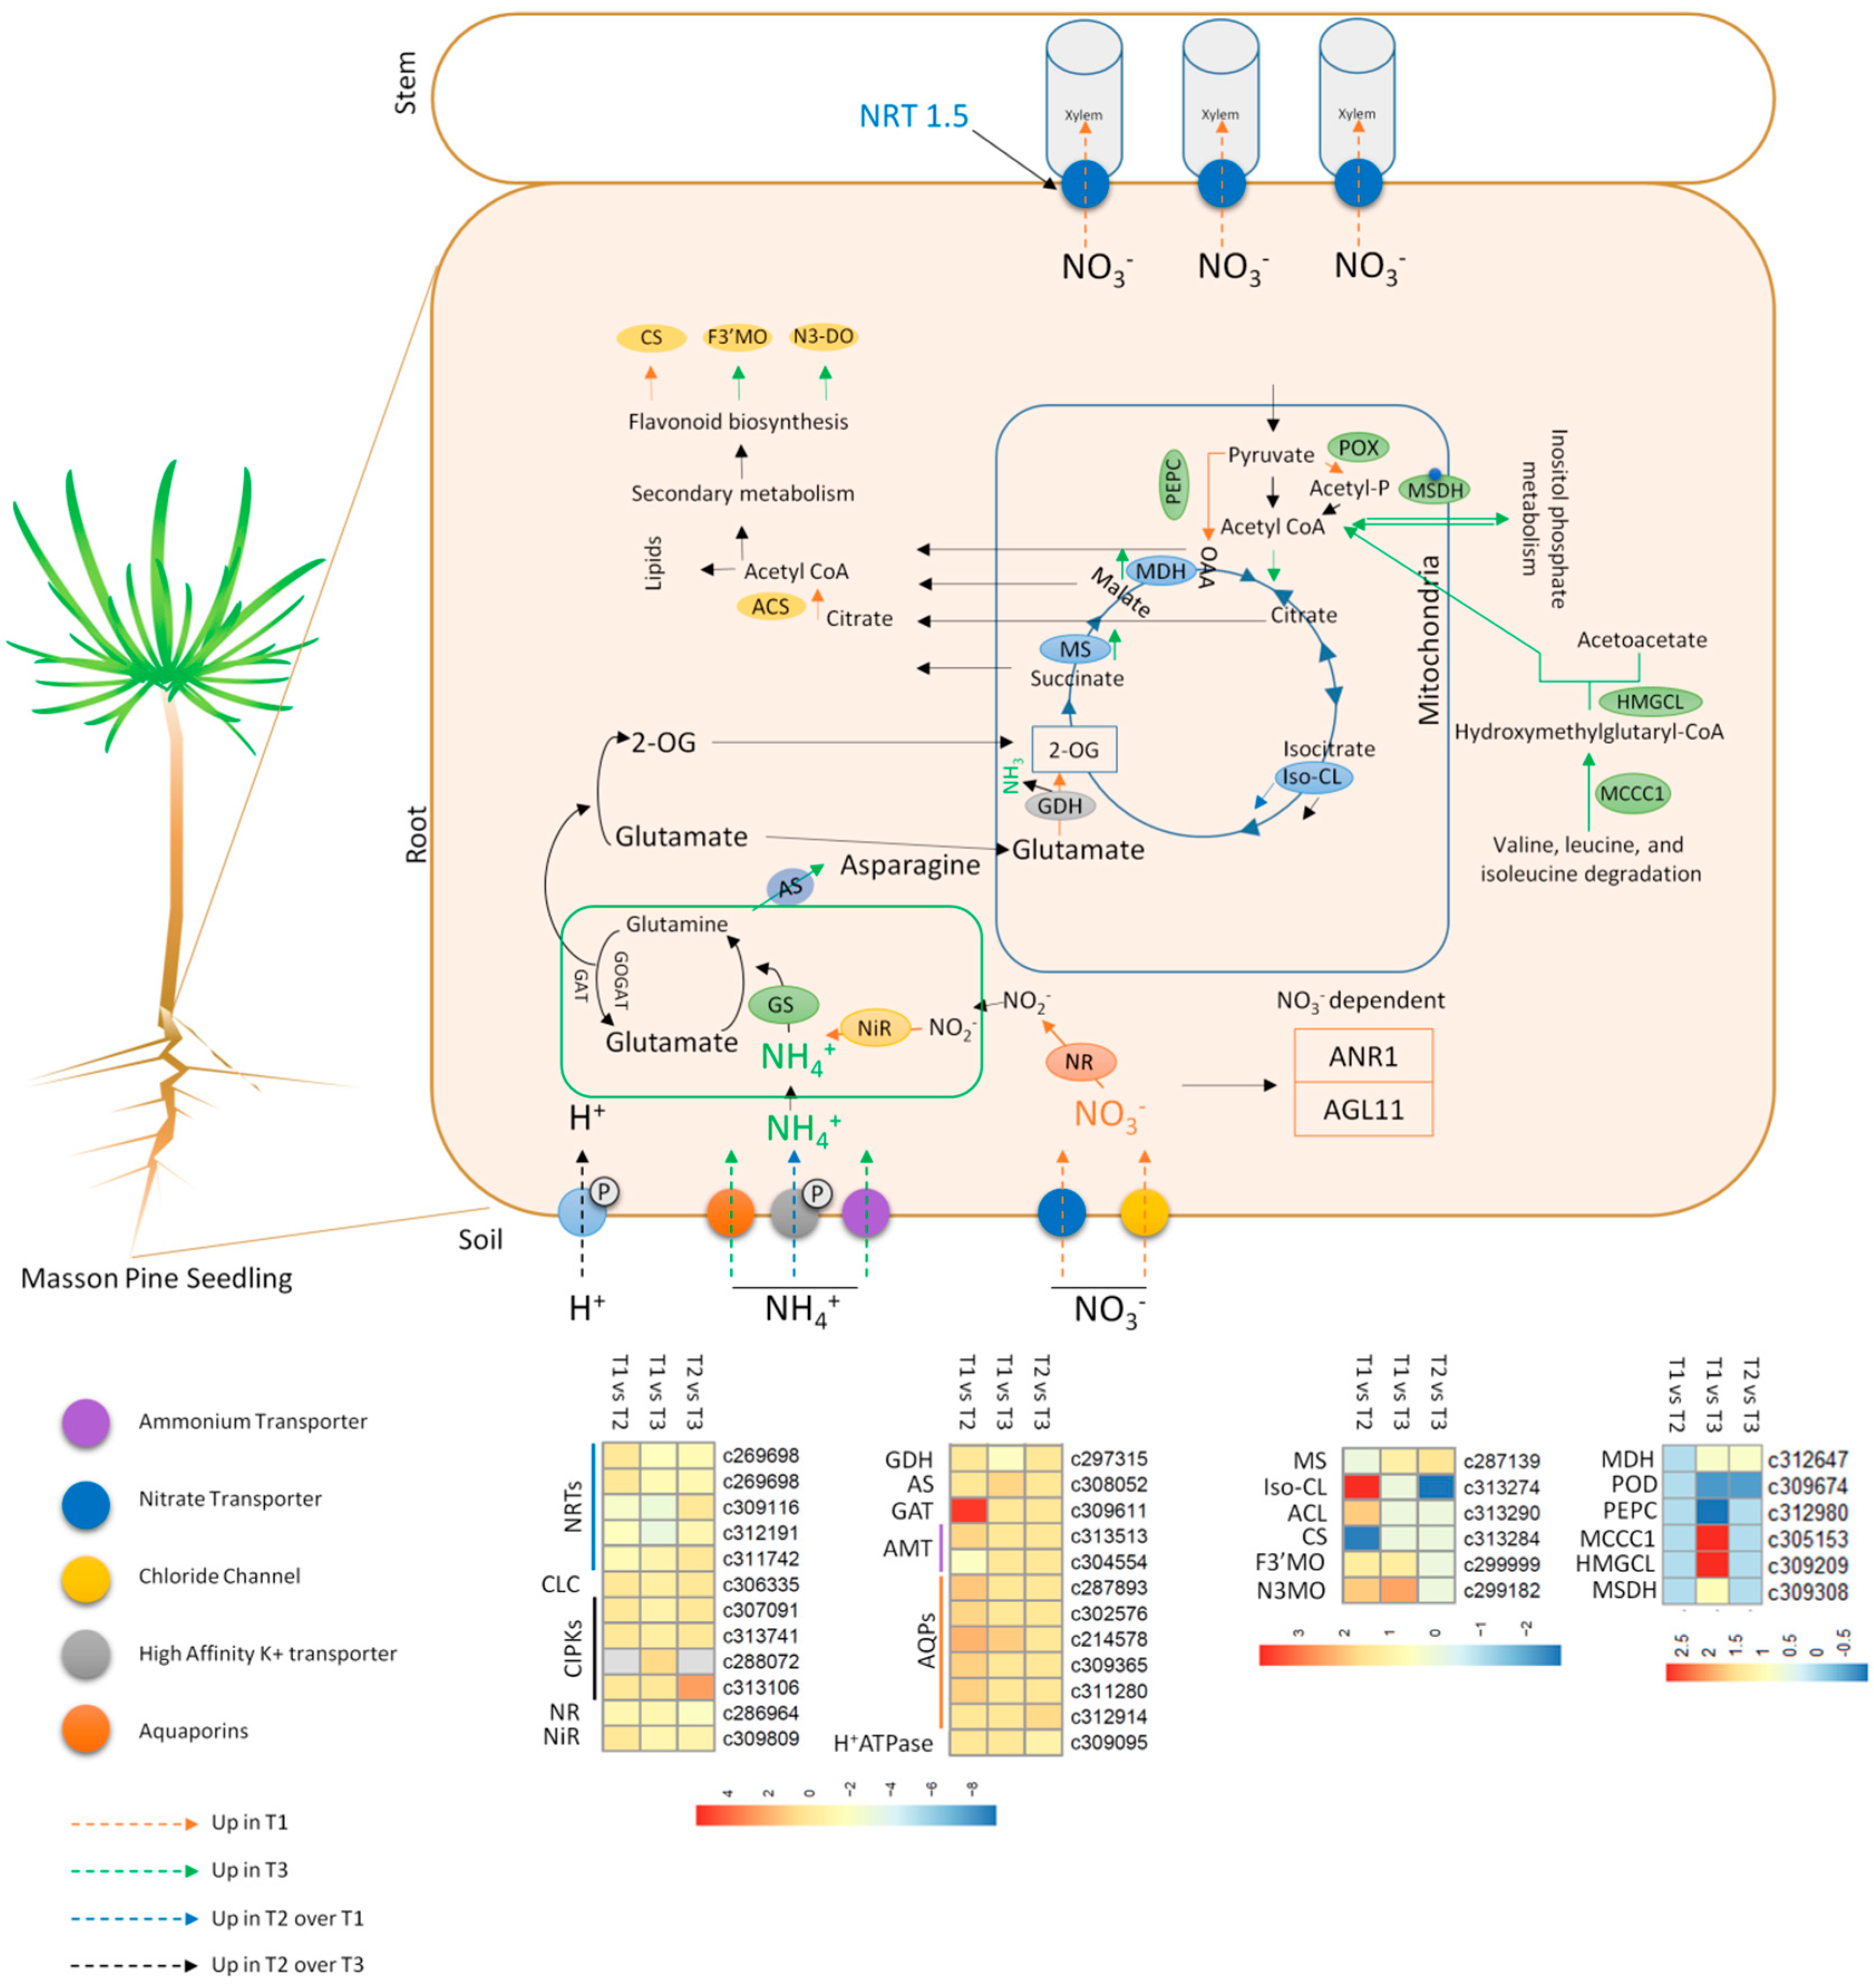
2.4. DEGs Related to N Uptake and Transport

In order to understand the transcriptional responses of masson pine seedlings to the different N treatments, we searched for DEGs related to N uptake and transport in T1 vs. T2, T1 vs. T3, T2 vs. T3. Our transcriptome data showed the differential regulation of five NRTs, i.e., two (high-affinity nitrate transporters) HA-NRT 3.1s, a HA-NRT 3.2, a high affinity NRT 2.4-Like, and one NTR 1.5. The HA-NRT 3.1s were downregulated in T3 as compared to T1. Similarly, both genes were downregulated in T3 as compared to T2, which is in line with the previously established role NO3 uptake in both conditions, i.e., when NO3 is present alone or in presence of NH4+ [27]. The HA-NRT 2.4-like gene (c309116) had significantly higher expression in T1, while decreasing NO3 resulted in decreased expression. This gene was not differentially regulated between both ammonium levels. A similar expression pattern was noticed in the case of HA-NRT 3.2. The NRT 1.5 gene (c311742) showed decreased expression in T2 and T3 as compared to T1. We also noticed that a CLC 1 (c306335) gene was expressed in both T1 and T3 where its expression reduced in T3 (log2 FC = −0.604); however, it was not differentially regulated between T1 vs. T2 and T2 vs. T3. We found that when the masson pine seedlings were supplemented with NH4+ in combination with NO3, the expression of AMT1 (c313513) was increased as compared to T1 seedlings (log2FC = 0.9621). However, another transcript annotated as Rh-like/ammonium transporter (c304554) was downregulated in T2 as compared to T1 (log2 FC = −2.0776). Our transcriptome data showed differential regulation of five aquaporins between T1 and T2 where their expression increased in T2. One of these five aquaporins, i.e., a PIP (c214578) showed an interesting profile where its expression increased in T2 and T3 as compared to T1. Additionally, a sixth aquaporin (PIP2-2) was expressed in T2 and T3 and not in T1, suggesting that its expression is NH4+ specific. The expression of c297040 (potassium channel subunit beta) doubled in T2 as compared to T1 while it did not differentially express in T3. Importantly, the expression of HAK5 (c310320) increased in both T2 and T3 as compared to T1, log2 FC = 1.35 and 0.98, respectively. Additionally, we found reduced expressions of CIPK2 and CIPK5 in T3 as compared to T1, increased expression of a CIPK9 in T3 over T1 and one CIPK 14-like in T3 over T2. A H+-transporting ATPase was differentially regulated between T2 and T3 where its expression decreased in T3 (log 2FC = −0.82) (Supplementary Tables S1–S3).

2.5. DEGs Related to Nitrate Reduction

As the nitrate reduction is an important step for the seedlings that were fed with nitrate, therefore, the enzymes NR, NiR, and glutamate dehydrogenases (GDH)’ expression was higher in T1 seedlings. Most importantly, the AS gene (c308052) was upregulated in T1 as compared to T3, while it was not differentially regulated between other two treatment comparisons, i.e., T1 vs. T2 and T2 vs. T3. Another gene (c301526), which was not annotated in many databases, but its molecular function (as per GO annotation) showed AS activity was also regulated in a similar manner as of the AS gene (c308052). These transcriptional changes suggest that nitrate is reduced to nitrite and then to ammonium in treatments fed with NO3. Next in the mitochondria, GDH alternatively incorporates ammonium into glutamate. T1 seedlings showed increased expression of GDH (c297315) as compared to T3 (Supplementary Tables S1–S3).

2.6. DEGs Related to Carbon/Nitrogen Metabolism and Secondary Metabolism

The transcriptome comparison showed several genes related to tricarboxylic acid cycle (TCA) and secondary metabolism in seedlings treated with different N sources. We found that malate synthase (MS) was upregulated in T3 as compared to T1 and T2. Iso-citrate synthetase was upregulated in T2 as compared to T1 while downregulated in T3 as compared to T2. The acetyl-CoA synthetase was differentially regulated between T1 and T2 only; upregulated in T2 (log 2FC = 1.8878). The KEGG pathway enrichment showed that secondary metabolite (flavonoid biosynthesis) pathway is regulated. We found two dihydroflavonol 4-reductases (c311910 and c312351) with contrasting expression pattern i.e., the first was upregulated in T2 as compared to T1, while the second was downregulated in T2 as compared to T1. A chalcone synthase was down regulated in T2 as compared to T1. A flavonoid 3’-monooxygenase (c299999) and a naringenin 3-dioxygenase were upregulated in T2 and T3 as compared to T1 (Supplementary Tables S1–S3).

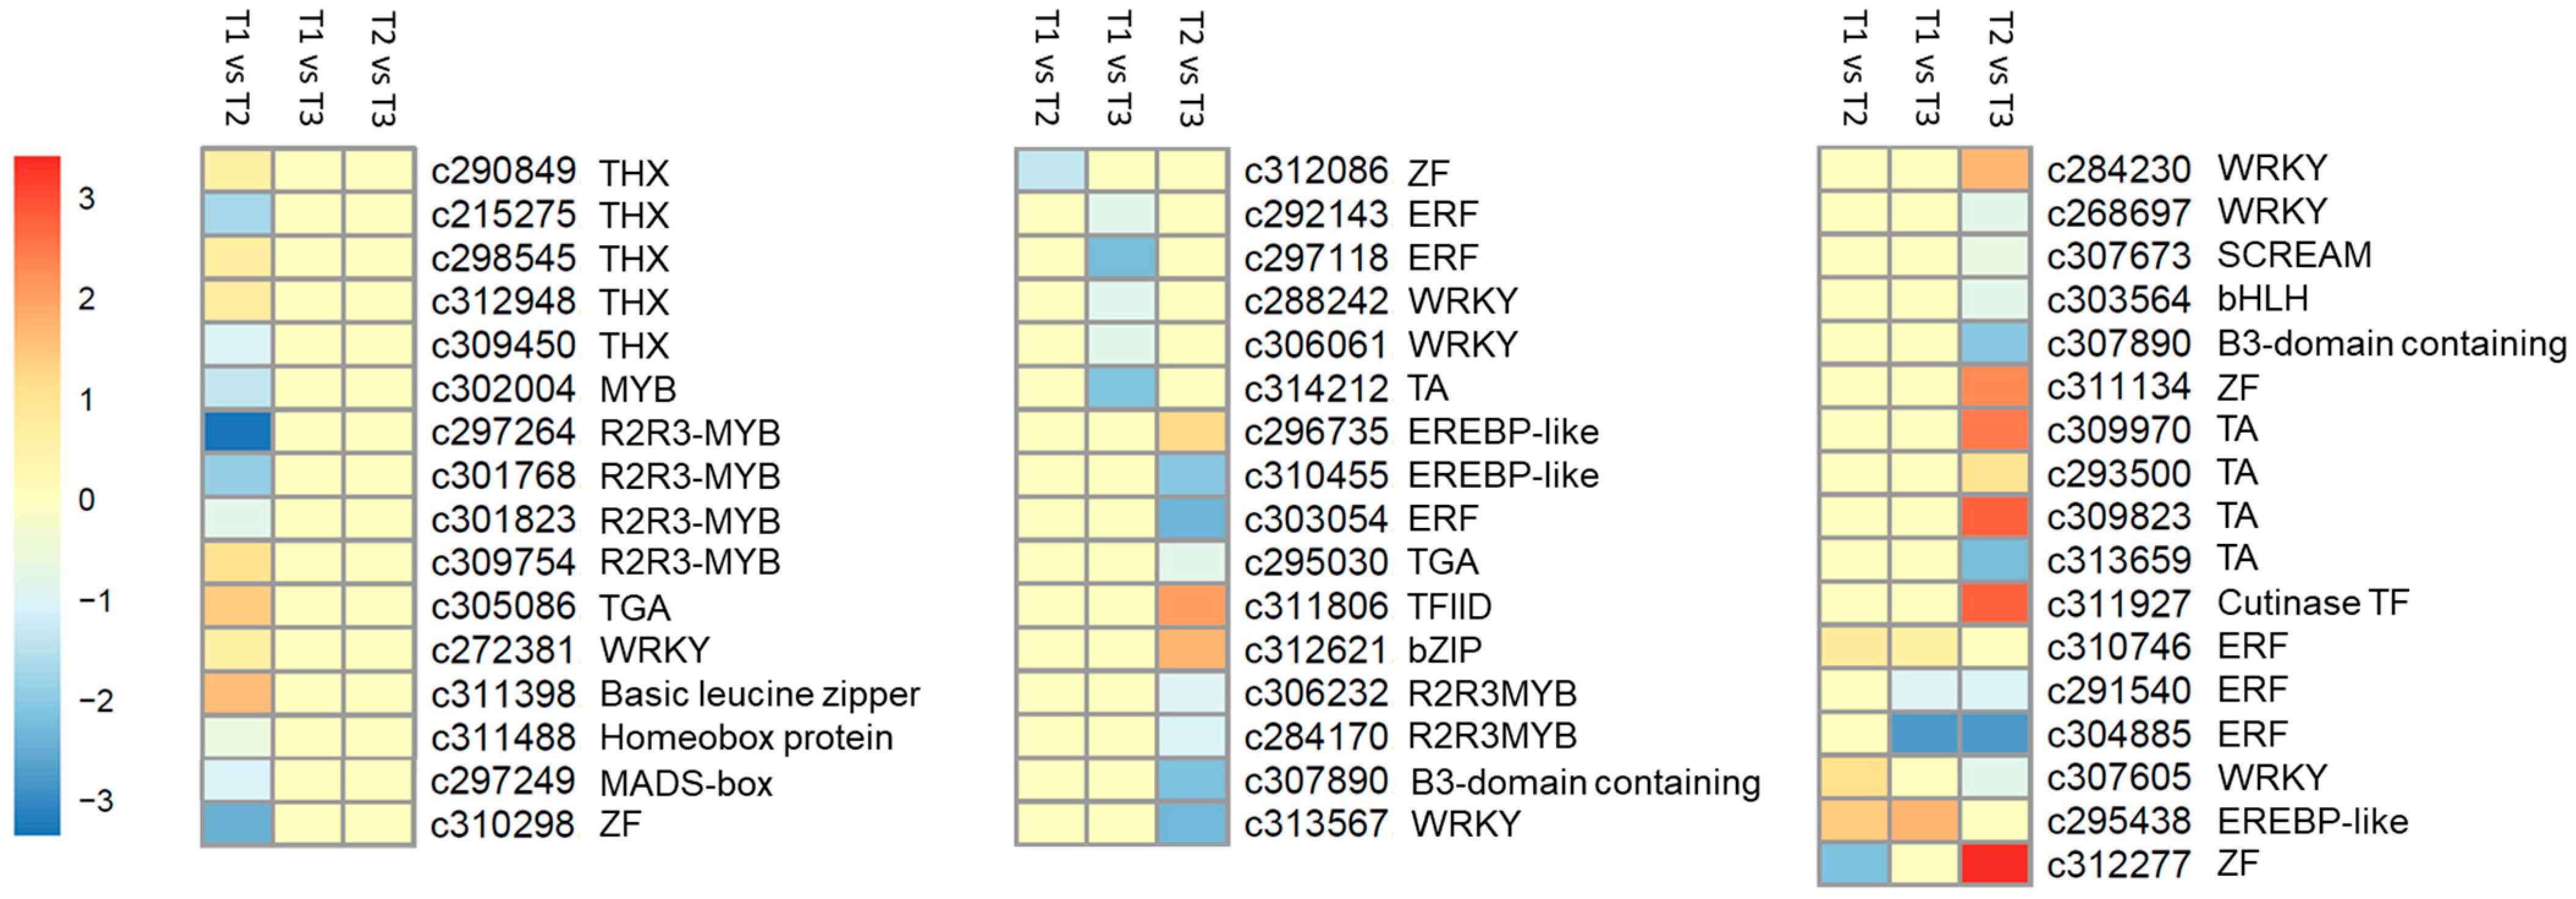
2.7. Differentially Expressed TFs

The differential analyses between the three treatments showed 52 TFs belonging to 19 families. Of these, 19 were differentially regulated between T1 and T2; 10 were downregulated in T2. The downregulated TFs belonged to THX (Trihelix TF), MYB (MYB-domain containing TF), HB (Homeo-box domain TF), and MADS-box TFs. Between T1 and T3, two ERFs (ethylene responsive factors), two WRKYs, and one basic TF (BTF) were regulated. All of these TFs were actually downregulated in T3 as compared to T1. The TFs that did not differentially express between T2 and T3 could be specific to NO3 regulation. Twenty-one TFs were differentially regulated between T2 and T3; nine of these were downregulated in T3, while the rest were upregulated. These TFs could be specific to NH4+ treatment. Apart from these, we also looked for TFs that were regulated in more than one treatment comparison. Interestingly, two TFs, i.e., ERF (c310746) and EREBP TF (c295438) were upregulated in both T2 and T3 as compared to T1. These TFs could be candidates for their roles in better performance of seedlings in T2 and T3. Two ERFs (c291540 and c304885) were down regulated in T3 over T1 and T2. One WRKY (c307605) was upregulated in T2 over T1, while it was downregulated in T3 over T2. Contrary to this, one ZnF showed downregulation in T2 as compared to T1, while upregulation in T3 as compared to T2. One bHLH (c311080) was downregulated both in T2 and T3 (Figure 4; Supplementary Tables S1–S4).

2.8. DEGs Related to Phytohormone Regulation

Fourteen DEGs were significantly enriched in plant hormone signal transduction pathway between different treatments. Of these, three were differentially expressed between T2 and T3 and their expression decreased in T3. Two genes were jasmonate ZIM domain-containing protein (c305774 and c313439) and one was a TGA (TGACG-binding) TF (c295030). A pathogenesis related protein 6-like gene (c309091) was highly expressed in T1, where its expression decreased in T2 and T3. Another SAUR family protein (c309011) was downregulated in T3 as compared to T1. All other DEGs were only regulated between T1 and T2; six were upregulated, and three were downregulated in T2 (Table 2).

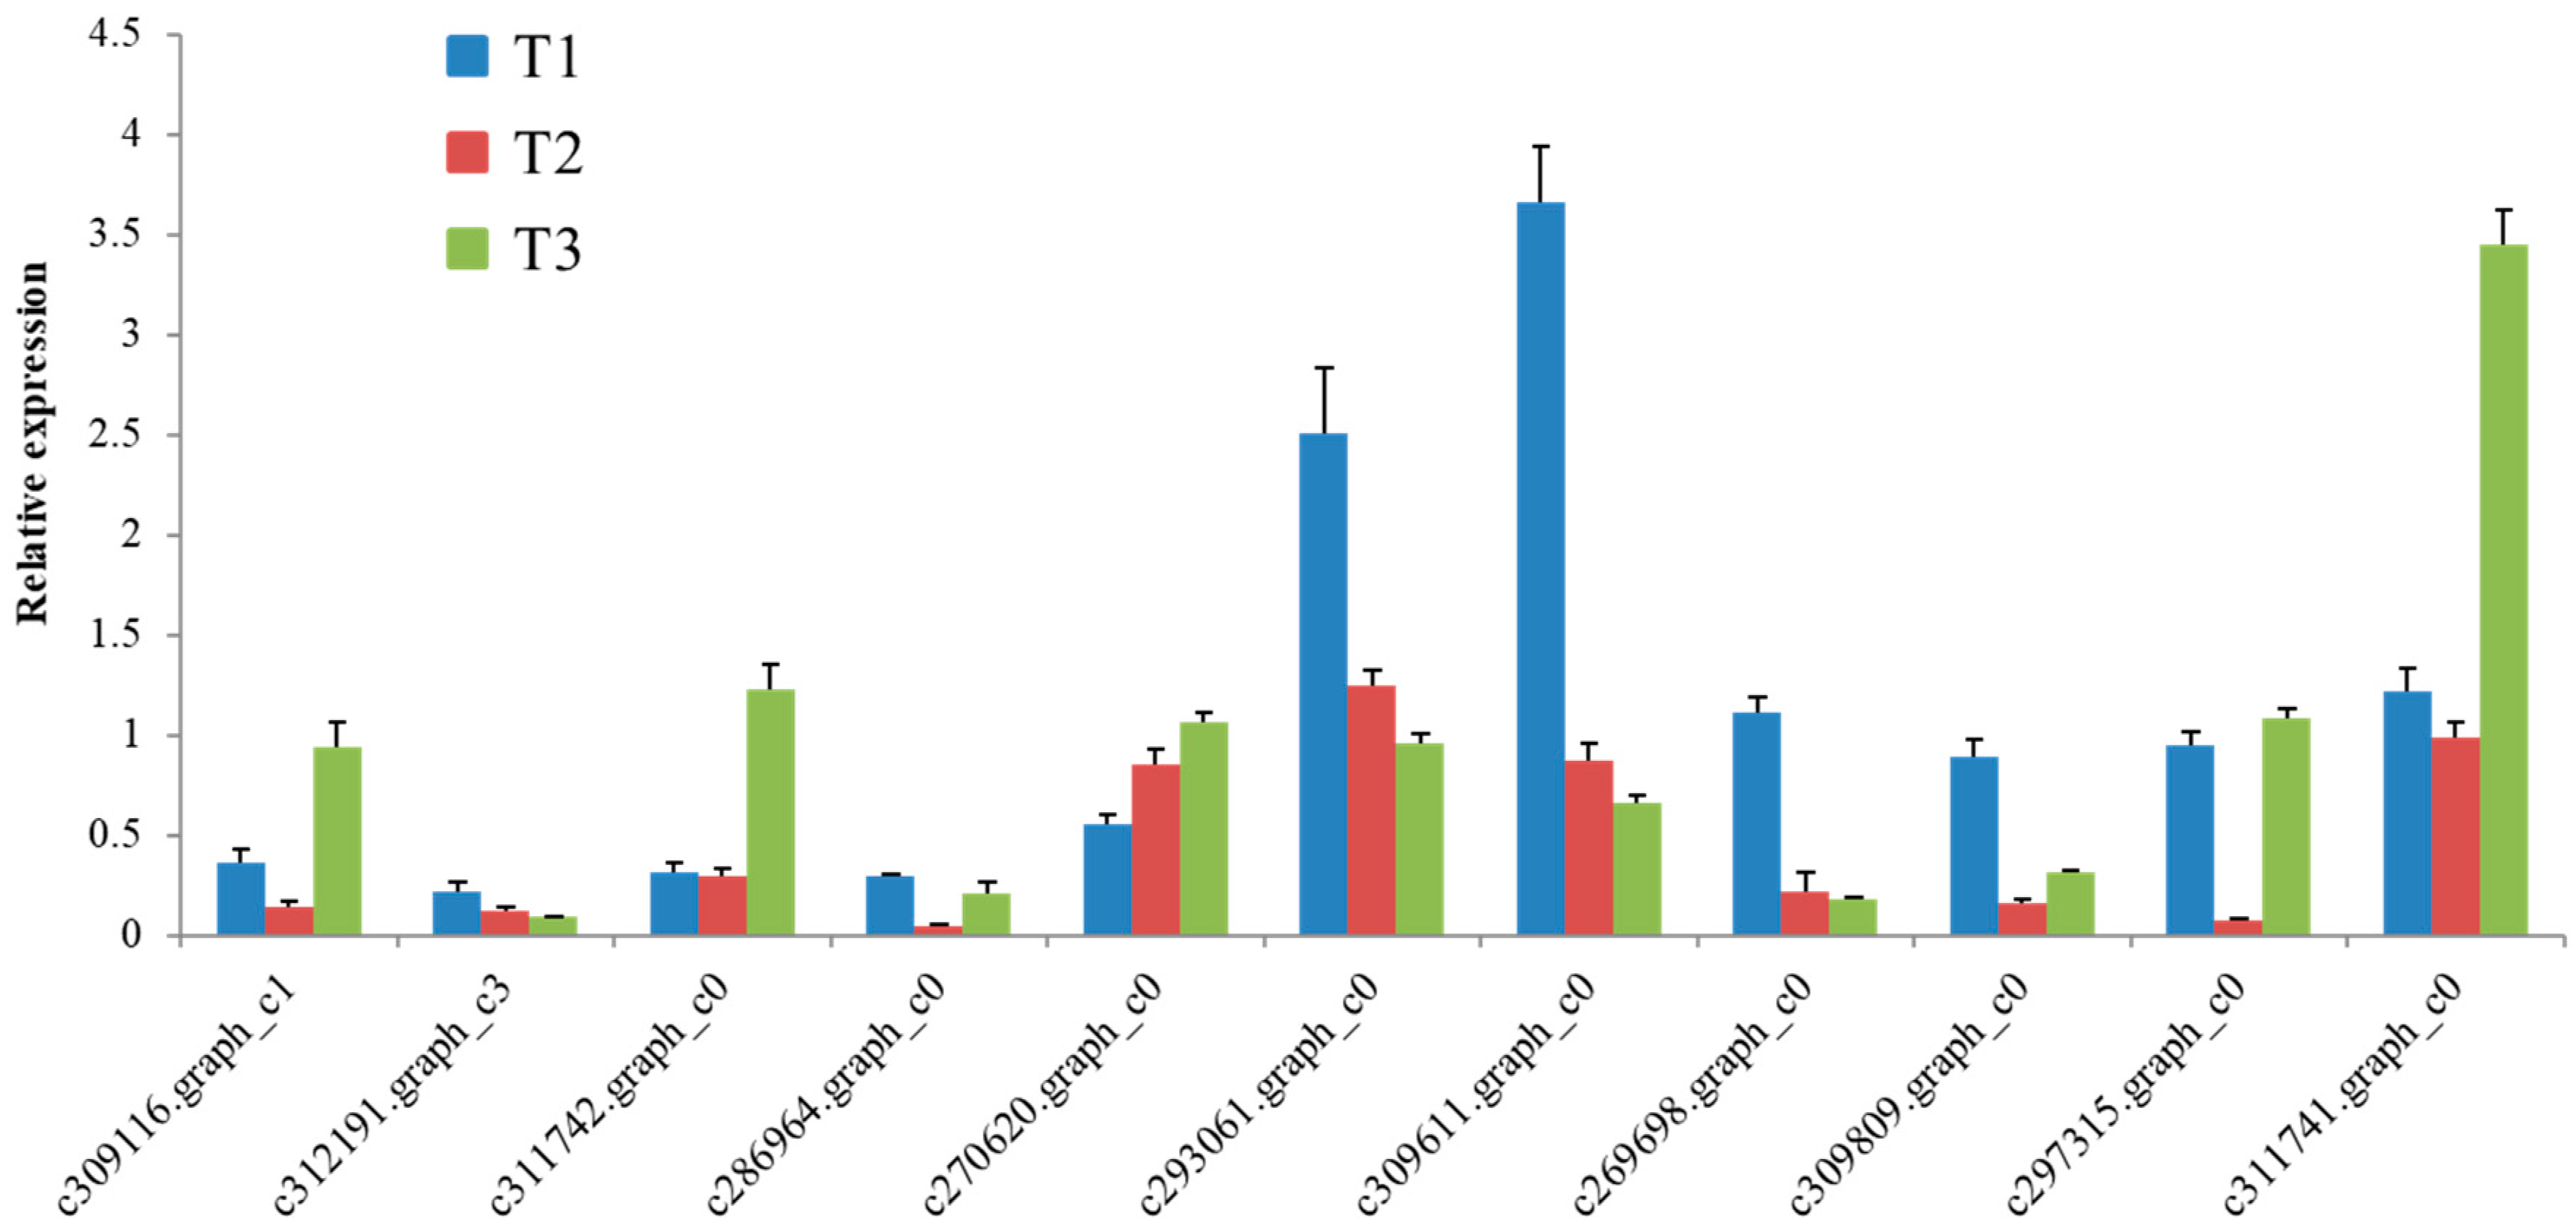
2.9. qRT-PCR Analyses of Selected Genes

We validated the expression of eleven masson pine genes of particular interest based on their important roles in the studied pathways (Figure 5). The tublin (β-TUB) gene was used as an internal control to standardize the data, and the amount of eleven genes’ transcripts was normalized by comparing with the constitutive abundance of β-TUB. All the tested genes were characterized by similar expression in the RNA-seq data.

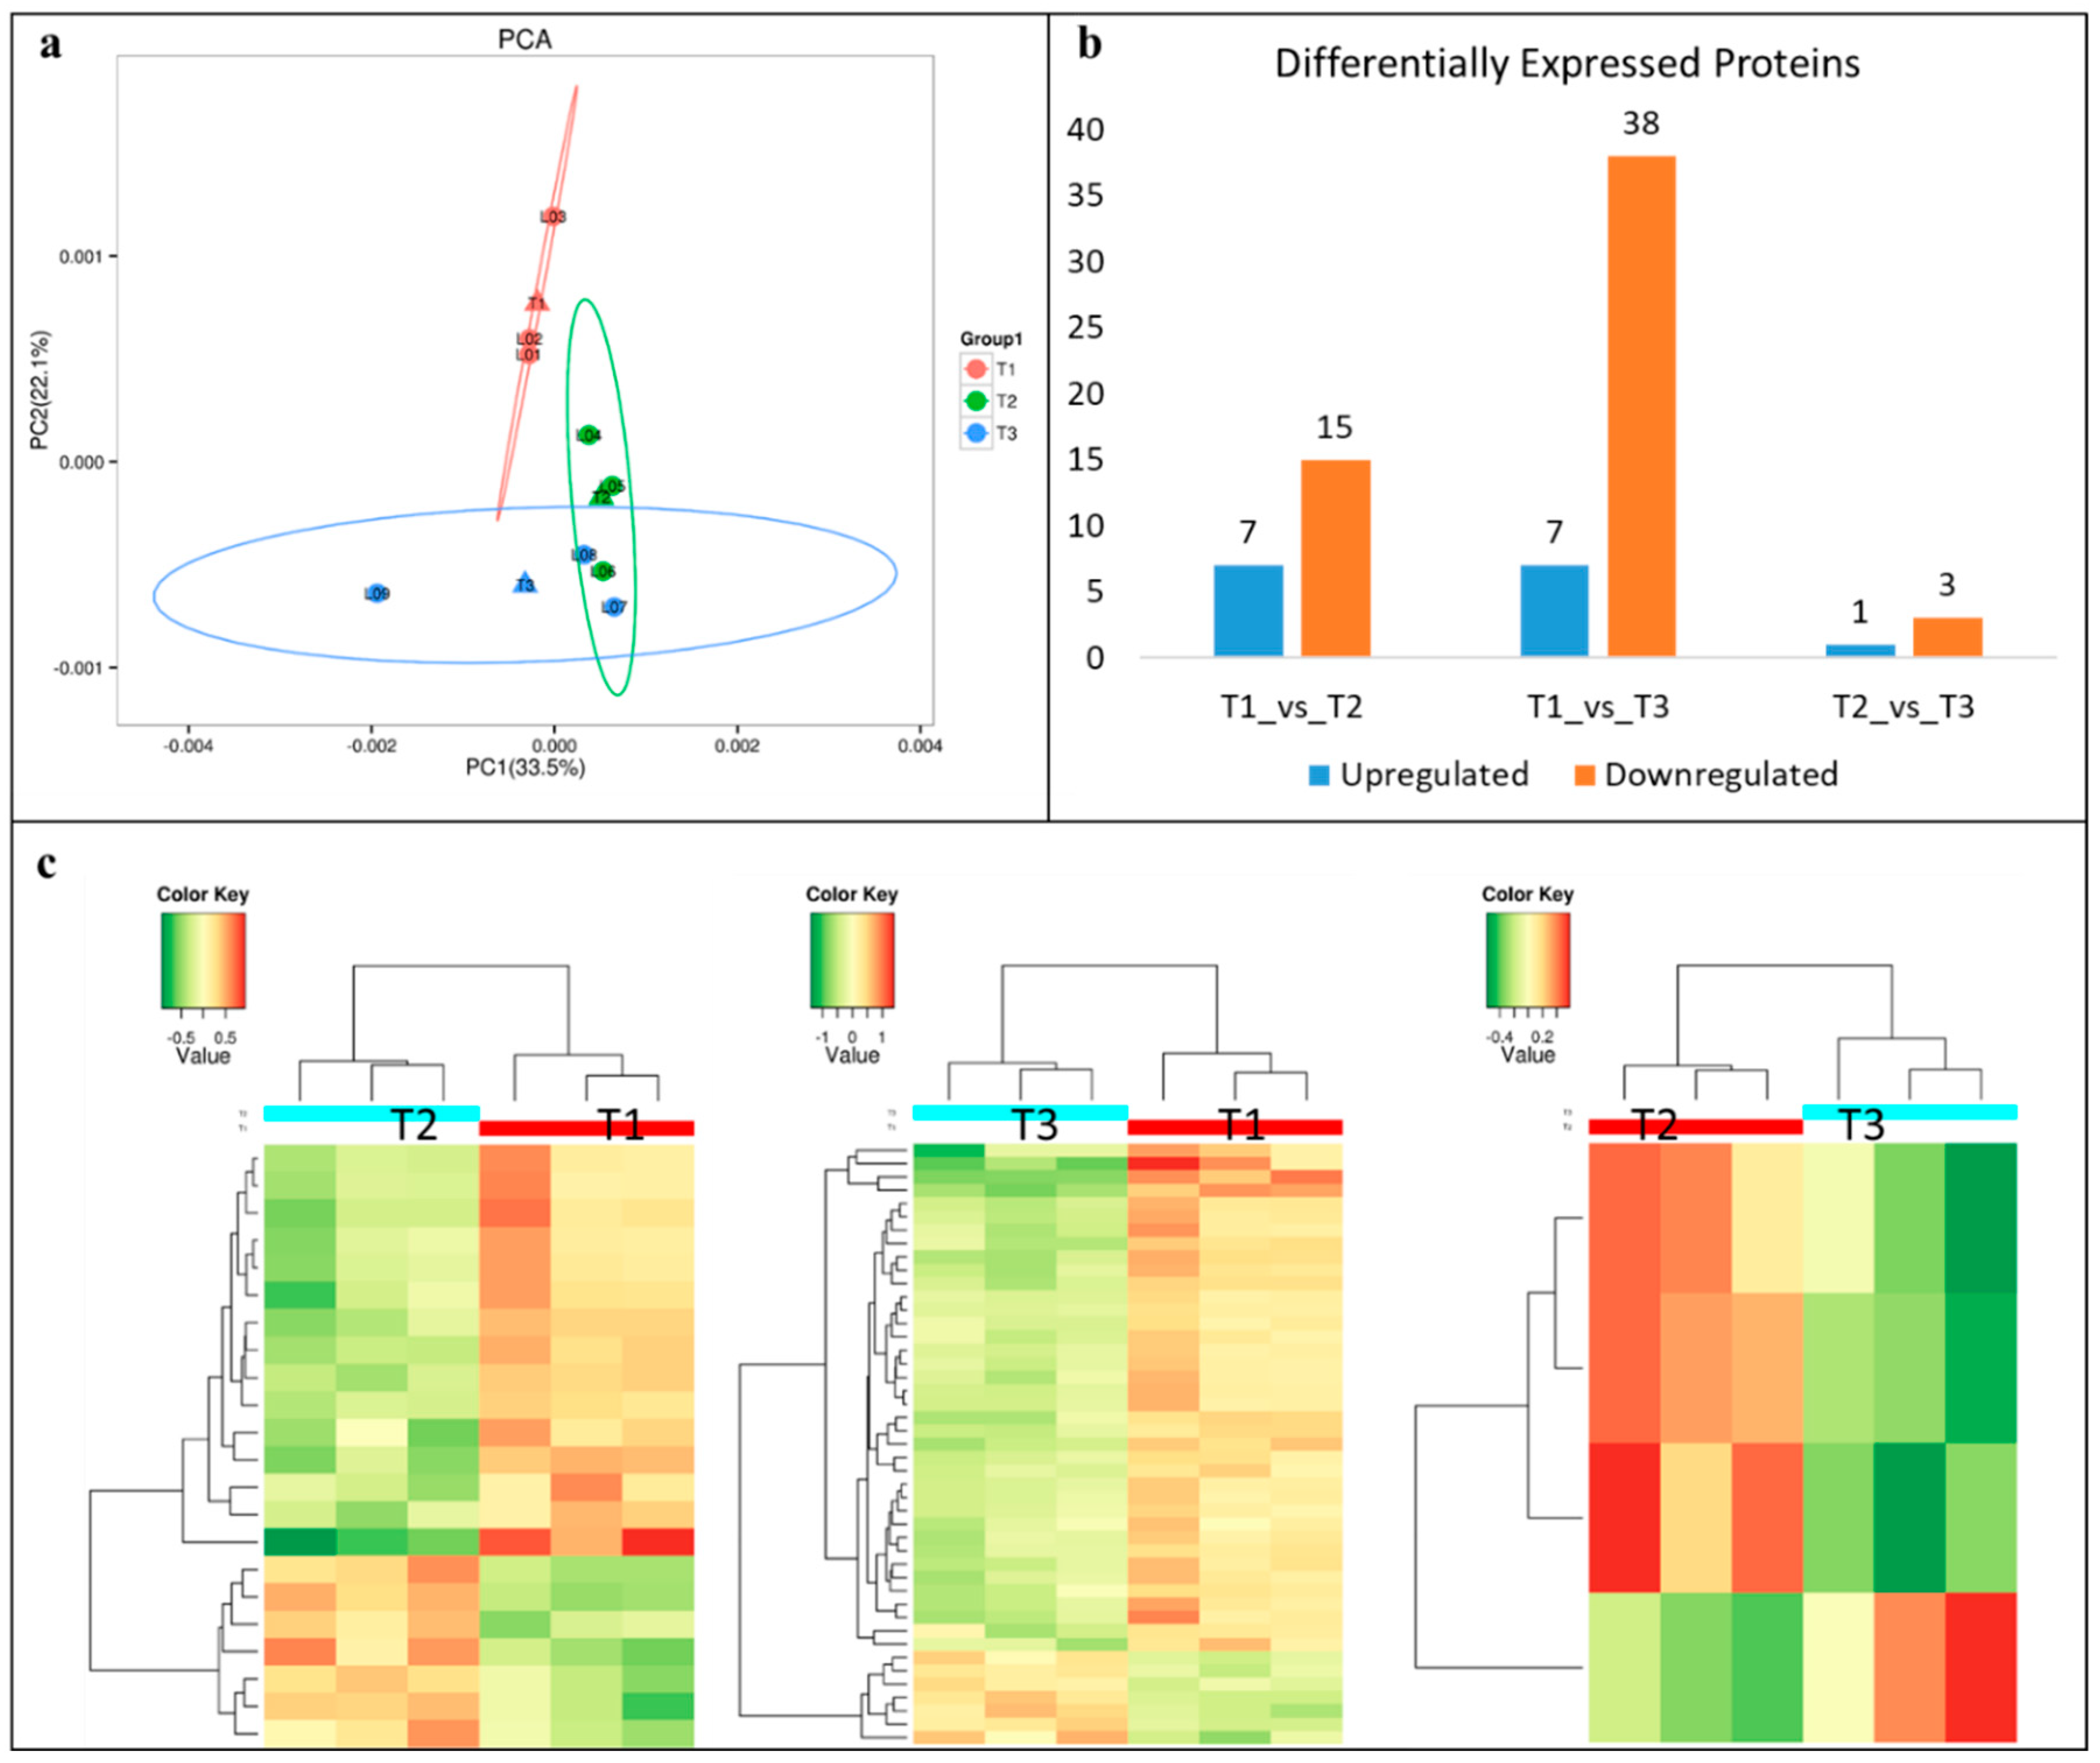
2.10. Proteome Analysis and Identification of DEPs

The proteome quantification of the three samples, i.e., T1, T2, and T3, resulted in the identification of 6227 proteins. Principal component analysis showed a clear separation between the treatments (Figure 6a). A total of 5284 proteins were annotated, i.e., 4845, 2127, and 3195 proteins were annotated in GO, KEGG, and COG databases, respectively. We used t test to analyze the differences in protein expression between the two groups of samples and screened the proteins that differed significantly (p < 0.01) with a fold change (FC) > 1.50. In total, 71 differentially expressed proteins (DEP) between the treatments (Figure 6b,c). A relatively higher number of DEPs were found between T1 and T3 (45) as compared to other treatment comparisons, i.e., T1 vs. T2 = 22, and T2 vs. T3 = 4 (Figure 6b,c). KEGG pathway enrichment analysis showed that inositol phosphate metabolism, glycerophospholipid metabolism, ribosome, phosphatidylinositol signaling system, and RNA degradation were significantly enriched between T1 and T2. Seventeen pathways were significantly enriched between T1 and T3. Most importantly, we found citrate cycle (TCA cycle), nitrogen metabolism, carbon metabolism, purine as well as pyrimidine metabolisms, and biosynthesis of amino acids. Nitrogen metabolism and ribosomes were the two pathways that were enriched between T2 and T3 (Supplementary Figure S2).
A protein (c309809; E.C.1.7.7.1) NiR was downregulated in T3 as compared to T1 and T2. A protein c250631 (E.C. 2.7.8.11) enriched in inositol phosphate metabolism was upregulated in T2 as compared to T1. It directly converts myo-inositol to phosphatidyl-1D-myo-inositol. The same protein was enriched in phosphatidylinositol signaling system and glycerophospholipid metabolism. The important observation was the upregulation of a protein in T3 as compared to T1 (c305505; E.C.2.3.3.1), which interconverts Acetyl-CoA to citrate and vice versa. Another protein (c309308; E.C.1.2.1.18) was also upregulated in T3 as compared to T1, which controls the interconversion of maonate semialdehyde and acetyl-CoA. Furthermore, in propanate metabolism, another protein on the downstream of E.C.1.2.1.18, i.e., c309308 (E.C.1.2.1.27) was upregulated in T3 as compared to T1. This protein is involved in conversion of (S)-Methyl-malonate semialdehyde to propanoyl-CoA, which is then converted into Acetyl-CoA through several intermediate steps (Supplementary Table S4). These observations are in accordance with the transcriptome changes.

3. Discussion

3.1. N Uptake and Root Responses to Ammonium

Our results suggest that relatively smaller number of genes, proteins, and TFs are specifically responsive to ammonium provision to masson pine roots in the experimental conditions (Figure 3). The root responses are triggered by either of the N-sources by activating different mechanisms, which are probably dependent of key molecular events. Our proteome and transcriptome approach have deepened the understanding of transcriptomic and proteomic signatures of masson pine roots supplied with either nitrate or ammonium. Higher root length and increased number of root tips under the influence of NH4+ could be because of the increased supply of ammonium due to the upregulation of the AMT1 in NH4+ fed roots (T3), since AMTs are known transporters of NH4+ [28]. However, in addition to AMTs, the increased expression of PIP (c214578), PIP2-2 (c312914), K+ channel subunit beta (c297040), and HAK5 (c310320) in T3 roots also played role in NH4+ influx. We state this because, previous studies have explained that NH4+ can also move across the plasma membrane through non-specific transport system involving potassium channels, aquaporins, and other non-selective cation channels [18,29]. We observed higher lateral root formation in NH4+ treated roots. Previous studies have elaborated the fact that ammonium stimulates lateral root branching, as obvious from our observations, and nitrate stimulates lateral root elongation, and together, both exert a local complementary effect on roots by increasing the lateral root branching and length [30]. On the other hand, we observed that the main roots in T3 are relatively shorter than T1 and T2. This is probably because of the downregulation of AGL11 in T3 as compared to T2. These observations are consistent with the previous reports that a MADS-box TF triggers larger primary roots and lateral root length as well as increases the expression of NRTs [31]. The root performance can also be due to the downregulation of the TGA TF (c295030) in T3 as its expression corresponds to the reduced lateral root elongation in T3 [32]. The better root morphological features in T3 as compared to T1 could also be possibly explained by the upregulation of two TFs, i.e., ERF (c310746) and EREBP TF (c295438) in both T2 and T3 as compared to T1. c310746 is a AP2/ERF (ERF039) and c295438 is ERF RAP2-3, as both have been implicated in ethylene responses in different abiotic stresses [33,34], but their roles in nitrogen assimilation need further exploration. Additionally, the TFs that were regulated between T2 and T3 are important candidates for further exploration. The ERF-LEP (c296735) that was upregulated in T3 has been reported to be involved in leaf petiole development [35], vascular cell number [36], and gibberellin-induced germination [37]. WRKY12’s (c284230) exclusive regulation between ammonium fed masson pine roots is in accordance with a recent report in maize where authors reported similar exclusive expression of WRKY TFs [38]. Some studies have reported the expression of WRKYs, MADS, and EREBPs in response to N deficiency [39], but the ammonium regulated functional characterization has not been reported yet.

3.2. Nitrogen Assimilation—The GS/GOGAT Cycle

Upon direct absorption in the roots (or by conversion of NO2 by the action of NiR), the NH4+ takes part in the glutamate to glutamine inter-conversion reaction by the GS/GOGAT enzyme system [40]. Our transcriptome and proteome data did not show differential expression of the GOGAT or GS enzyme. This suggests that the nitrogen assimilation process at this stage worked similarly regardless of the N-source (Supplementary Tables S1–S4). Since in T1, the masson pine roots had to convert the incoming NO3 into NH4+, the NR genes (which converts NO3 to NO2) was upregulated in T1 as compared to T3. For the next step, i.e., NO2 to NH4+, the required enzyme NiR was upregulated in T1 as compared to T3, which is evident from transcriptome and proteome data (Figure 7; Supplementary Table S4) [2]. These observations are quite similar to the recent work on the adaption of Arabidopsis roots to ammonium [19]. These observations, as supported by previous study, suggest that masson pine seedling roots exhibit no differential regulation of GS/COGAT when fed with either of the N-sources. The only enzyme GDH (probable NADP-dependent GDH) was upregulated in T1 as compared to T3 (Supplementary Table S2). This is different from the study on Arabidopsis, where the authors did not find its differential regulation at proteome scale [19]. Similarly, we also did not find GDH differential expression in our proteome data. It is also known that the expression of GDH is affected by a number of different factors such as C shortage, dark-adaptation, sucrose starvation, and biotic and abiotic stresses [41,42]. Based on the GDH expression observed in T1, we deduced that when fed with nitrate, masson pine seedlings might employ GDH to sustain growth under low C/N ratios. Contrarily, the ammonium fed masson pine seedlings could have adopted the asparagine synthesis [43], which is discussed in next section.

3.3. Carbon/Nitrogen Metabolism Modulation in Response to NH4+ and the Role of TCA Cycle

Plants’ ability to grow better and produce higher biomass is largely dependent on N supplementation and its balance with carbon. The C/N balance in plants is regulated by the availability of C skeletons, energy sources, and important biomolecules for N assimilation related pathways [44]. With the increased uptake (supply) of NH4+, plants will need to induce pathways to assimilate the received/produced NH4+, which in turn requires increased energy and C [19]. We found that DEGs and DEPs related to TCA cycle, i.e., MS and MD, were abundant in T3 as well as T2, clearly indicating that under ammonium nutrition, masson pine root adapts by the promotion of TCA flux mode to sustain C skeleton availability (Figure 7). This in turn leads to effective NH4+ optimal storage in asparagine since we also found the upregulation of gene related to L-asparagine metabolism, i.e., AS (c308052) (Supplementary Tables S2 and S3). A similar mechanism was revealed in wheat, where isotopic labelling showed the efficient adaptation of wheat root TCA cycle flux modes in order to match the carbon demand under ammonium nutrition [45]. This is further supported by the upregulation of the DEP c309308 (malonate-semialdehyde dehydrogenase). This enzyme converts malonic semialdehyde to acetyl-CoA (in inositol phosphate metabolism), thus increasing acetyl-CoA reserves to be further converted to citrate by c305505 (upregulated in T3). Thus, our results suggest that masson pine roots adapt to ammonium nutrition by increased N assimilation through the promotion of TCA flux modes.

3.4. Managing Increased NH4+ Accumulation in Masson Pine Roots

Increased ammonium influx has been largely considered as a universal stressful condition for plant [24]. The plant genotypes or species that withstand increased NH4+ accumulation show tolerance in different ways. Since, in soils, presence of NH4+ as a sole N source does not exist; however, certain natural ecosystem factors and the use of nitrification inhibitors lead towards increased stable and higher NH4+ content [24]. To avoid, NH4+ stress, plants adapt various strategies to protect their cells from NH4+ induced stress such as higher level of free asparagine due to its important role in protecting the cell [46]. Our observations that T3 plants had increased expression of ASs indicate that masson pine roots sense higher NH4+ levels (Figure 7; Supplementary Table S3). Since, there is a consensus that AS expression is induced by a reduction in soluble carbohydrate supply or dark [47]. We found that in T3, as compared to T1, a beta-glucosidase 12-like gene (glycosyl hydrolase family 1 member; c291550) was downregulated (Supplementary Table S3). This proposition is also based on the fact that in T1 vs. T3, 14 other genes related to carbohydrate transport and metabolism were downregulated in T3 (see DEGs in Supplementary Table S2 that are highlighted in yellow background). Most importantly, the downregulated DEGs were, i.e., pectate lyases (c312286, c293839, c309368, and c312142), pyruvate decarboxylase 4 (c285412), polygalacturonase (c307368), chitinase like protein 1 (c295894), endoglucanase (c306748), linamarin synthase (c307027), 6-phosphogluconate dehydrogenase (c283906), and galactinol-sucrose galactosyltransferase (c310284). Since, these genes are important part of carbohydrate transport and metabolism and affect (directly or indirectly) the carbohydrate supply [48,49,50,51,52,53,54]; therefore, the reduced expression lead the reduced carbohydrate supply and may have induced the AS expression. Another inducer of AS’s expression is the increased supply of reduced nitrogen, i.e., NH4+ itself [55,56]. Hence, it could be stated that masson pine seedlings, when grown solely in NH4+, had the ability to tolerate increased NH4+ supplies by increasing the expression of AS. Furthermore, it is known that N can be redirected from glutamine to asparagine when excess NH4+ is available [38].
The regulation of flavonoid biosynthesis and flavone and flavonol biosynthesis pathways between T1 and T3 clearly indicated that these pathways respond to sole NH4+ supplies (Supplementary Figure S2). However, limited information is available about role of secondary metabolites in NH4+ stress, and all the reports suggested their involvement in defense against pathogens and nutrition improvement [see review by [24]]. Whether the upregulation of flavonoid 3’-monooxygenase and naringenin 3-dioxygenase is just a consequence of ammonium assimilation increase or if they have a dedicated role in ammonium stress is a question for further elucidation.
Another common NH4+ response in plants is the glutathione metabolism, which induces antioxidant machinery and provides resistance to different abiotic stress, e.g., salt stress [57]. The upregulation of glutathione s-transferases in T2 (c291486, c307711, c292057) and in T3 (c298941) as compared to T1 indicates that ammonium provision solely or in combination with nitrate triggered glutathione s-transferase activity (Supplementary Tables S1 and S2). Studies have reported that internal ammonium excess induces reactive oxygen species (ROS) bursts [58]. Because it is known that glutathione s-transferases catalyze the transfer of superoxide free radicals to reductive glutathione, which results in the detoxification of the oxidants [59]. Therefore, changes in expression levels of glutathione s-transferases indicate that glutathione cycle has strong role in scavenging the NH4+ excess induced ROS as observed in rice [58].
Finally, we noticed the limited changes in the signaling of phytohormones in response to ammonium as compared to nitrate; however, a relatively larger number of DEGs were regulated between T1 and T2 (Table 2). The downregulation of a SAUR protein in NH4+ fed plants is consistent with the previously observations in nitrogen-deprived Arabidopsis roots [22]. The relationship of its expression with ammonium is yet to be explored; however, it is well established that auxin signaling, transport, and transduction are significantly altered by nitrate [60]. Therefore, it could be stated that the expression of c309011 (SAUR family protein) in T1 could be driven by nitrate. We state this because we also found the upregulation of other SAUR family members in T1 (Table 2). A dedicated study on the role of either of the N-sources on phytohormone biosynthesis and signaling in relation to the changes in root system architecture would increase the understanding the signaling pathways related to N-source based hormonal changes.

4. Material and Methods

4.1. Plant Material and Treatments

Masson pine seeds (P. massoniana Lamb) were collected from the excellent half-sib family individual plants of the Pinus national seed base in Ma’anshan, Duyun City, Guizhou Province, in January 2020. The seeds were sterilized with 0.5% potassium permanganate solution for 1 h, rinsed with sterile water 3~5 times, and immersed in sterile water with an initial temperature of 4 °C for 24 h. Seeds were germinated, in a germination box containing vermiculite and perlite, in an artificial climate box (day/night = 14 h/10 h and temperature 24/22 °C). Sixty days old seedlings were pre-cultured in a 1:1 solution of NH4+: NO3 for 3 days, and then, the seedlings were placed in N-free water to adapt for 1 week prior to experimental treatments, i.e., T1: NO3/NH4+: 100/0 mM, T2: NO3/NH4+: 50/50 mM, and T3: NO3/NH4+: 0/100 mM, for 30 days. Nutrient solution was changed every three days and the pH (5.5–5.6) was adjusted twice a day (9 am and 5 pm). The concentration of total N (1 mm/L) and the ion balance in the three treatments were maintained as given in the Table 3. We added nitrification inhibitor 7 µmol/L dicyandiamide in the medium to prevent the conversion of NH4+ to NO3. The experiment was conducted in a triplicate completely randomized design. Samples, three biological replicates, were taken from the roots and stored at −80 °C for RNA extraction or used for determination of growth index.

4.2. Morphological Evaluation and N-Content Measurements

The seedlings were rinsed with excess amount of tap water followed by deionized water (thrice) before the measurement of root characteristics. Root lengths were measured with a ruler. Fresh weight was determined by removing excess water on an absorbent paper and then weighing on an electronic balance (PCE-ABT 220, ±0.5 mg accuracy). Roots were oven dried at 105 °C for 30 min and then at a constant temperature, i.e., 70 °C for 48 h before dry weight was measured. Roots were scanned and analyzed with Epson digital scanner and Win RHIZO software, and the root volume and root surface area were measured. Root N content was measured by following single sulphuric acid—hydrogen peroxide digest method by Lowther [61].

4.3. Library Preparation for Transcriptome Sequencing

A total amount of 1 μg RNA per sample was used as input material for the RNA sample preparations. Sequencing libraries were generated using NEBNext®Ultra™ RNA Library Prep Kit for Illumina® (NEB, Ipswich, MA, USA) following manufacturer’s recommendations, and index codes were added to attribute sequences to each sample. Briefly, mRNA was purified from total RNA using poly-T oligo-attached magnetic beads. Fragmentation was carried out using divalent cations under elevated temperature in NEBNext First Strand Synthesis Reaction Buffer (5X). First strand cDNA was synthesized using random hexamer primer and M-MuLV Reverse Transcriptase. Second strand cDNA synthesis was subsequently performed using DNA Polymerase I and RNase H. Remaining overhangs were converted into blunt ends via exonuclease/polymerase activities. After adenylation of 3’ ends of DNA fragments, NEBNext Adaptor with hairpin loop structure was ligated to prepare for hybridization. In order to select cDNA fragments of preferentially 240 bp in length, the library fragments were purified with AMPure XP system (Beckman Coulter, Beverly, CA, USA). Then, 3 μL USER Enzyme (NEB, Ipswich, MA, USA) was used with size-selected, adaptor-ligated cDNA at 37 °C for 15 min followed by 5 min at 95 °C before PCR. Then PCR was performed with Phusion High-Fidelity DNA polymerase, Universal PCR primers, and Index (X) Primer. Finally, PCR products were purified (AMPure XP system), and library quality was assessed on the Agilent Bioanalyzer 2100 system (Beverly, CA, USA).

4.4. Clustering and Sequencing

The clustering of the index-coded samples was performed on a cBot Cluster Generation System using TruSeq PE Cluster Kit v3-cBot-HS (Illumina, San Diego, CA, USA) according to the manufacturer’s instructions. After cluster generation, the library preparations were sequenced on an Illumina Hiseq 2000 platform and paired-end reads were generated.

4.5. Data Analysis

Raw data (raw reads) of Fastq format were firstly processed through in-house perl scripts. In this step, clean data (clean reads) were obtained by removing reads containing adapter, reads containing ploy-N, and low-quality reads from raw data. At the same time, Q20, Q30, GC-content, and sequence duplication level of the clean data were calculated. All the downstream analyses were based on clean data with high quality.

4.6. Transcriptome Assembly

The read1 files from all libraries/samples were pooled into one big left.fq file, and read2 files into one big file. Transcriptome assembly was accomplished based on the read 1 and read 2 files using Trinity [62] with min_kmer_cov set to 2 by default and all other parameters were set to default settings.

4.7. Gene Functional Annotation and Differential Expression Analysis

Gene function was annotated based on the following databases: NR (NCBI non-redundant protein sequences); Pfam (Protein family); KOG/COG/eggNOG (Clusters of Orthologous Groups of proteins); Swiss-Prot; KEGG (Kyoto Encyclopedia of Genes and Genomes); GO (Gene Ontology) [63,64,65,66,67].
Gene expression levels were estimated by RSEM [68] for each sample. Clean data were mapped back onto the assembled transcriptome and the read count for each gene was obtained from the mapping results. Differential expression analysis between treatments was performed using the DESeq R package (1.10.1). The resulting P-values were adjusted using the Benjamini and Hochberg’s approach for controlling the false discovery rate [69]. Genes with an adjusted p-value < 0.05 found by DESeq were assigned as differentially expressed. For KEGG enrichment analyses we used KOBAS [70] software to test the statistical enrichment of differential expression genes in KEGG pathways.

4.8. Proteome Sequencing

4.8.1. Sample Preparation, Protein Quantification, and SDS Page

Root samples stored at −80 °C were ground with liquid nitrogen and 100 mg of freeze-dried powder was taken. Added 800 μL SDT protein lysate (4% SDS, 100 mM Tris-HCl, 100 mM DTT, pH 7.6) into the 1.5 mL centrifuge tube. The mixture was put in 100 °C boiling water bath for 5 min, then in ice bath ultrasound for 10 min (100 W for 5 s with an interval of 10 s). The mixture was again put in 100 °C boiling water bath for 5 min followed by centrifugation at 14,000× g for 30 min. Supernatant was taken and filtered with a 0.22 μm ultrafiltration tube. We took 1 μL of each sample for BCA (bicinchoninic acid) quantification and based on the quantitative results, a 20 μg protein sample was taken for SDS-PAGE electrophoresis. The remaining samples were divided into 300 μg portions and stored in the refrigerator at −80 °C.

4.8.2. Enzymatic Hydrolysis

We took 300 μg of each sample for FASP enzymatic hydrolysis and mixed the same amount of protein from each sample into an internal standard IS for enzymatic hydrolysis. Then added 200 μL UA to the sample and mixed well with buffer (8M Urea, 150 mM Tris-HCl pH 8.5), centrifuged at 14,000× g for 30 min at room temperature, discarded the filtrate, and repeated thrice. Then, we added 100 μL IAA (50 mM IAA in UA), shacked at 600 rpm and mixed for 1 min followed by an incubation at 300 rpm for 30 min at room temperature in dark. We then added 100 μL UA buffer, centrifuged at 14,000× g for 30 min at room temperature, and repeated the steps thrice. After that, we added 100 μL 25 mM/L DS buffer followed by centrifugation at 14,000× g for 30 min at room temperature, and this was repeated 3 times. Finally, we discarded the filtrate and added 40 μL Trypsin buffer (6 μg Trypsin in 40 μL DS buffer), placed it on a thermo-mixer (300 rpm, 18 h, 37 °C) followed by centrifugation at 14,000× g for 30 min at room temperature to collect the filtrate in a new collection tube. Then, 40 μL DS was added followed by centrifugation at 14,000× g for 30 min at room temperature; we took the filtrate and measured the optical density at 280 nm.

4.8.3. Classification of Peptide Markers and LC-MS/MS Analysis

Of each group of samples, 100 μg were taken and processed according to instruction manual of TMT6plex™ Isobaric Label Reagent Set (Thermo Scientific, Waltham, MA, USA). All the labelled peptides were mixed separately for HpH pre-fractionation; Column: Gemini-NX 4.6 × 150 mm column (3 µm, 110 Å) (Phenomenex, 00F-4453-E0, Torrance, CA, USA), Buffer: Buffer A was 10 mM Ammonium acetate pH 10.0; Buffer B was 10 mM Ammonium acetate, 90% ACN, pH 10.0 on 1100 Series HPLC Value System (Agilent, Santa Clara, CA, USA). After HpH classification, each set of markers collects 40 fractions of flow-through and elution, according to The HpH chromatograms were combined into 15 aliquots and stored at −80 °C after lyophilization.
Digested peptide samples were analyzed by LC-MS/MS on a nanoflow Easy-nLC1000 HPLC system (Thermo Scientific) connected to a quadrupole Orbitrap hybrid mass spectrometer (Q Exactive Plus, Thermo Scientific). Peptides were sprayed directly into the mass spectrometer after elution from a 75 μm × 50 cm C18 analytical column (PepMan, Thermo Scientific) on a linear gradient from 4 to 64% acetonitrile over 90 min. Proteins were identified by MS/MS using information-dependent acquisition of fragmentation spectra of multiple charged peptides. Up to 20 data-dependent fragment spectra were acquired in the linear ion trap for each full-scan spectrum at a scanning range of precursor ion of 350–2000 m/z, resolution of 60,000 at 2 m/z. The normalized collision energy was set to 35 eV. Protein identification was conducted in the built-in software SEQUEST Proteome Discoverer 2.1 (Thermo Scientific). Proteome Discoverer 2.1 performs FDR based on peptide identification results ≤ 0.01 (High Confident) for screening and quantitative analysis based on the peptide peak intensity value. The original quantitative result of protein is identification. The median of peptide quantification results was corrected based on the sum of the reported ion peak intensity values of all channels. The final quantitative results were then the ratio of the mean value of all channel intensity values, and the median of the ratio are normalized.
Functional classification of the differentially abundant proteins was carried out according to MapMan software (http://mapman.gabipd.org/es/mapman, version 3.6.0) [33]. Gene ontology (GO) enrichment analysis and visualization for cellular component and biological process were performed with BioMaps tool of VirtualPlant 1.3.

4.9. Gene Expression Data Validation by qRT-PCR

The primers used for qRT-PCR validation are listed in Table 4. qRT-PCR was performed using the ABI7500 Real Time System (Applied Biosystems, Foster City, CA, USA). Gene expression was analyzed quantitatively using the SYBR Green detection system with melting curve. Amplification conditions were 95 °C for 3 min, followed by 40 cycles of: denaturation, 95 °C for 15 s; annealing (55–60 °C) for 20 s; extension at 72 °C for 34 s. Samples for qRT-PCR were run in three biological replicates and two technical replicates. The results were normalized using the Pfaffl method to report relative expression [71]. For normalization of gene expression, tubulin (β-TUB) was used as internal standard.

5. Conclusions

Masson pine seedling roots grown in different N sources shown that ammonium-N increases overall performance of roots. The transcriptome and proteome sequencing results suggested that the expression of AMTs is increased while NRTs’ expression decreased in NH4+ grown seedlings. The increased NH4+ influx was due to regulation of many specific and non-specific NH4+ channels. We concluded that masson pine seedling possibly manages the increased NH4+ influx by promoting TCA cycle to sustain C skeleton availability and optimal NH4+ storage. Further experimentation on gene specific roles of the DEGs highlighted in our report will enable complete role of the TCA cycle in NH4+ management. Additionally, the increased NH4+ concentrations in the roots by increasing the expression of AS and by redirecting N from glutamine to asparagine. Finally, our data show that glutathione S- transferase activity is triggered under NH4+ higher supplies. This increased expression of glutathione S- transferase was probably to scavenge the NH4+ excess induced ROS.

Supplementary Materials

The following are available online at https://www.mdpi.com/1422-0067/21/20/7548/s1. Table S1: Differentially expressed genes between T1 and T2. Table S2: Differentially expressed genes between T1 and T3. Table S3: Differentially Expressed genes between T2 and T3. Table S4: Differentially expressed proteins in masson pine roots treated with different nitrogen sources. Figure S1: KEGG pathway enrichment based on differentially expressed genes between treatments. Figure S2: KEGG pathway enrichment based on differentially expressed proteins between treatments.

Author Contributions

Q.R. and Y.Z. conceived and designed the study; Q.R. and X.Z. conducted the experiment, collected data, and performed data analysis; Q.R. performed data validation and wrote the first draft; Y.Z. provided funding, supervised the study, and revised the first draft. All authors have read and agreed to the published version of the manuscript.

Funding

This work was funded by Guizhou Provincial Talent Team Project (QKHPTRC[2018]5261;QKHPTRC20195614), National Key R&D Program Project (2017YFD0600302; 2017YFD0600304), Guizhou Provincial First-class Discipline Building Project (GNYL[2017]007), Guizhou Provincial Hundred-level Cultivation Program Project (QKHRC-2015-4022), Guizhou Provincial Technology Program Project (QKHZC [2018]2305) and Guizhou Provincial Science and Technology Foundation (QKHJC[2020]1Y066).

Conflicts of Interest

The authors declare no conflict of interest.

References

  1. Torres-Olivar, V.; Villegas-Torres, O.G.; Domínguez-Patiño, M.L.; Sotelo-Nava, H.; Rodríguez-Martínez, A.; Melgoza-Alemán, R.M.; Valdez-Aguilar, L.A.; Alia-Tejacal, I. Role of nitrogen and nutrients in crop nutrition. J. Agric. Sci. Technol. B 2014, 4, 29. [Google Scholar]
  2. Nacry, P.; Bouguyon, E.; Gojon, A. Nitrogen acquisition by roots: Physiological and developmental mechanisms ensuring plant adaptation to a fluctuating resource. Plant Soil 2013, 370, 1–29. [Google Scholar] [CrossRef] [Green Version]
  3. Yao, X.; Rehbein, P.J.; Lee, C.J.; Evans, G.J.; Corbin, J.; Jeong, C.-H. A study on the extent of neutralization of sulphate aerosol through laboratory and field experiments using an ATOFMS and a GPIC. Atmos. Environ. 2011, 45, 6251–6256. [Google Scholar] [CrossRef]
  4. Xu, G.; Fan, X.; Miller, A.J. Plant nitrogen assimilation and use efficiency. Annu. Rev. Plant Biol. 2012, 63, 153–182. [Google Scholar] [CrossRef] [Green Version]
  5. Britto, D.T.; Kronzucker, H.J. NH4+ toxicity in higher plants: A critical review. J. Plant Physiol. 2002, 159, 567–584. [Google Scholar] [CrossRef] [Green Version]
  6. Lewis, M.A. The effects of mixtures and other environmental modifying factors on the toxicities of surfactants to freshwater and marine life. Water Res. 1992, 26, 1013–1023. [Google Scholar] [CrossRef]
  7. Thomas, R.C.; Mead, D.J. Uptake of nitrogen by Pinus radiata and retention within the soil after applying 15N-labelled urea at different frequencies. 2. Seasonal trends and processes. For. Ecol. Manag. 1992, 53, 153–174. [Google Scholar] [CrossRef]
  8. Kronzucker, H.J.; Siddiqi, M.Y.; Glass, A.D. Conifer root discrimination against soil nitrate and the ecology of forest succession. Nature 1997, 385, 59–61. [Google Scholar] [CrossRef]
  9. Dechorgnat, J.; Nguyen, C.T.; Armengaud, P.; Jossier, M.; Diatloff, E.; Filleur, S.; Daniel-Vedele, F. From the soil to the seeds: The long journey of nitrate in plants. J. Exp. Bot. 2011, 62, 1349–1359. [Google Scholar] [CrossRef] [Green Version]
  10. Nour-Eldin, H.H.; Andersen, T.G.; Burow, M.; Madsen, S.R.; Jørgensen, M.E.; Olsen, C.E.; Dreyer, I.; Hedrich, R.; Geiger, D.; Halkier, B.A. NRT/PTR transporters are essential for translocation of glucosinolate defence compounds to seeds. Nature 2012, 488, 531–534. [Google Scholar] [CrossRef]
  11. De Angeli, A.; Monachello, D.; Ephritikhine, G.; Frachisse, J.; Thomine, S.; Gambale, F.; Barbier-Brygoo, H. The nitrate/proton antiporter AtCLCa mediates nitrate accumulation in plant vacuoles. Nature 2006, 442, 939–942. [Google Scholar] [CrossRef] [PubMed]
  12. Howitt, S.M.; Udvardi, M.K. Structure, function and regulation of ammonium transporters in plants. Biochim. Biophys. Acta Biomembr. 2000, 1465, 152–170. [Google Scholar] [CrossRef] [Green Version]
  13. Ortiz-Ramirez, C.; Mora, S.I.; Trejo, J.; Pantoja, O. PvAMT1; 1, a highly selective ammonium transporter that functions as H+/NH4+ symporter. J. Biol. Chem. 2011, 286, 31113–31122. [Google Scholar] [CrossRef] [PubMed] [Green Version]
  14. D’Apuzzo, E.; Rogato, A.; Simon-Rosin, U.; El Alaoui, H.; Barbulova, A.; Betti, M.; Dimou, M.; Katinakis, P.; Marquez, A.; Marini, A.-M. Characterization of three functional high-affinity ammonium transporters in Lotus japonicus with differential transcriptional regulation and spatial expression. Plant Physiol. 2004, 134, 1763–1774. [Google Scholar] [CrossRef] [PubMed] [Green Version]
  15. Duan, F.; Giehl, R.F.; Geldner, N.; Salt, D.E.; von Wirén, N. Root zone–specific localization of AMTs determines ammonium transport pathways and nitrogen allocation to shoots. PLoS Biol. 2018, 16, e2006024. [Google Scholar] [CrossRef]
  16. Hoopen, F.t.; Cuin, T.A.; Pedas, P.; Hegelund, J.N.; Shabala, S.; Schjoerring, J.K.; Jahn, T.P. Competition between uptake of ammonium and potassium in barley and Arabidopsis roots: Molecular mechanisms and physiological consequences. J. Exp. Bot. 2010, 61, 2303–2315. [Google Scholar] [CrossRef] [PubMed] [Green Version]
  17. Glass, A.D.; Britto, D.T.; Kaiser, B.N.; Kinghorn, J.R.; Kronzucker, H.J.; Kumar, A.; Okamoto, M.; Rawat, S.; Siddiqi, M.; Unkles, S.E. The regulation of nitrate and ammonium transport systems in plants. J. Exp. Bot. 2002, 53, 855–864. [Google Scholar] [CrossRef] [Green Version]
  18. Hachiya, T.; Sakakibara, H. Interactions between nitrate and ammonium in their uptake, allocation, assimilation, and signaling in plants. J. Exp. Bot. 2017, 68, 2501–2512. [Google Scholar] [CrossRef]
  19. Coleto, I.; Vega-Mas, I.; Glauser, G.; González-Moro, M.B.; Marino, D.; Ariz, I. New insights on Arabidopsis thaliana root adaption to ammonium nutrition by the use of a quantitative proteomic approach. Int. J. Mol. Sci. 2019, 20, 814. [Google Scholar] [CrossRef] [Green Version]
  20. Falkengren-Grerup, U. Interspecies differences in the preference of ammonium and nitrate in vascular plants. Oecologia 1995, 102, 305–311. [Google Scholar] [CrossRef]
  21. Britto, D.T.; Kronzucker, H.J. Ecological significance and complexity of N-source preference in plants. Ann. Bot. 2013, 112, 957–963. [Google Scholar] [CrossRef] [PubMed] [Green Version]
  22. Menz, J.; Li, Z.; Schulze, W.X.; Ludewig, U. Early nitrogen-deprivation responses in Arabidopsis roots reveal distinct differences on transcriptome and (phospho-) proteome levels between nitrate and ammonium nutrition. Plant J. 2016, 88, 717–734. [Google Scholar] [CrossRef] [PubMed]
  23. Patterson, K.; Cakmak, T.; Cooper, A.; Lager, I.; Rasmusson, A.G.; Escobar, M.A. Distinct signalling pathways and transcriptome response signatures differentiate ammonium-and nitrate-supplied plants. Plantcell Environ. 2010, 33, 1486–1501. [Google Scholar] [CrossRef] [PubMed] [Green Version]
  24. Marino, D.; Moran, J.F. Can ammonium stress be positive for plant performance? Front. Plant Sci. 2019, 10, 1103. [Google Scholar] [CrossRef] [Green Version]
  25. Zeng, W.; Tang, S. Modeling compatible single-tree aboveground biomass equations for masson pine (Pinus massoniana) in southern China. J. For. Res. 2012, 23, 593–598. [Google Scholar] [CrossRef]
  26. Zhu, F.; Dai, L.; Hobbie, E.A.; Koba, K.; Liu, X.; Gurmesa, G.A.; Huang, S.; Li, S.; Li, Y.; Fang, Y. Uptake patterns of glycine, ammonium, and nitrate differ among four common tree species of northeast China. Front. Plant Sci. 2019, 10, 799. [Google Scholar] [CrossRef]
  27. Masclaux-Daubresse, C.; Daniel-Vedele, F.; Dechorgnat, J.; Chardon, F.; Gaufichon, L.; Suzuki, A. Nitrogen uptake, assimilation and remobilization in plants: Challenges for sustainable and productive agriculture. Ann. Bot. 2010, 105, 1141–1157. [Google Scholar] [CrossRef] [Green Version]
  28. Kiba, T.; Krapp, A. Plant nitrogen acquisition under low availability: Regulation of uptake and root architecture. Plant Cell Physiol. 2016, 57, 707–714. [Google Scholar] [CrossRef] [Green Version]
  29. Coskun, D.; Britto, D.T.; Li, M.; Becker, A.; Kronzucker, H.J. Rapid ammonia gas transport accounts for futile transmembrane cycling under NH3/NH4+ toxicity in plant roots. Plant Physiol. 2013, 163, 1859–1867. [Google Scholar] [CrossRef] [Green Version]
  30. Bisseling, T.; Scheres, B. Nutrient computation for root architecture. Science 2014, 346, 300–301. [Google Scholar] [CrossRef]
  31. Yu, C.; Liu, Y.; Zhang, A.; Su, S.; Yan, A.; Huang, L.; Ali, I.; Liu, Y.; Forde, B.G.; Gan, Y. MADS-box transcription factor OsMADS25 regulates root development through affection of nitrate accumulation in rice. PLoS ONE 2015, 10, e0135196. [Google Scholar] [CrossRef] [PubMed]
  32. Canales, J.; Contreras-López, O.; Álvarez, J.M.; Gutiérrez, R.A. Nitrate induction of root hair density is mediated by TGA 1/TGA 4 and CPC transcription factors in Arabidopsis thaliana. Plant J. 2017, 92, 305–316. [Google Scholar] [CrossRef] [PubMed] [Green Version]
  33. Kim, N.Y.; Jang, Y.J.; Park, O.K. AP2/ERF family transcription factors ORA59 and RAP2. 3 interact in the nucleus and function together in ethylene responses. Front. Plant Sci. 2018, 9, 1675. [Google Scholar] [CrossRef] [PubMed] [Green Version]
  34. Najafi, S.; Sorkheh, K.; Nasernakhaei, F. Characterization of the APETALA2/Ethylene-responsive factor (AP2/ERF) transcription factor family in sunflower. Sci. Rep. 2018, 8, 1–16. [Google Scholar] [CrossRef] [Green Version]
  35. van der Graaff, E.; Dulk-Ras, A.; Hooykaas, P.; Keller, B. Activation tagging of the LEAFY PETIOLE gene affects leaf petiole development in Arabidopsis thaliana. Development 2000, 127, 4971–4980. [Google Scholar]
  36. Van Der Graaff, E.; Hooykaas, P.J.; Keller, B. Activation tagging of the two closely linked genes LEP and VAS independently affects vascular cell number. Plant J. 2002, 32, 819–830. [Google Scholar] [CrossRef]
  37. Ward, J.M.; Smith, A.M.; Shah, P.K.; Galanti, S.E.; Yi, H.; Demianski, A.J.; van der Graaff, E.; Keller, B.; Neff, M.M. A new role for the Arabidopsis AP2 transcription factor, LEAFY PETIOLE, in gibberellin-induced germination is revealed by the misexpression of a homologous gene, SOB2/DRN-LIKE. Plant Cell 2006, 18, 29–39. [Google Scholar] [CrossRef] [Green Version]
  38. Ravazzolo, L.; Trevisan, S.; Forestan, C.; Varotto, S.; Sut, S.; Dall’Acqua, S.; Malagoli, M.; Quaggiotti, S. Nitrate and Ammonium Affect the Overall Maize Response to Nitrogen Availability by Triggering Specific and Common Transcriptional Signatures in Roots. Int. J. Mol. Sci. 2020, 21, 686. [Google Scholar] [CrossRef] [Green Version]
  39. Yang, W.; Yoon, J.; Choi, H.; Fan, Y.; Chen, R.; An, G. Transcriptome analysis of nitrogen-starvation-responsive genes in rice. BMC Plant Biol. 2015, 15, 31. [Google Scholar] [CrossRef] [Green Version]
  40. Lu, J.; Zhang, L.; Lewis, R.S.; Bovet, L.; Goepfert, S.; Jack, A.M.; Crutchfield, J.D.; Ji, H.; Dewey, R.E. Expression of a constitutively active nitrate reductase variant in tobacco reduces tobacco-specific nitrosamine accumulation in cured leaves and cigarette smoke. Plant Biotechnol. J. 2016, 14, 1500–1510. [Google Scholar] [CrossRef] [Green Version]
  41. Miflin, B.J.; Habash, D.Z. The role of glutamine synthetase and glutamate dehydrogenase in nitrogen assimilation and possibilities for improvement in the nitrogen utilization of crops. J. Exp. Bot. 2002, 53, 979–987. [Google Scholar] [CrossRef] [PubMed] [Green Version]
  42. Xiaochuang, C.; Meiyan, W.; Chunquan, Z.; Chu, Z.; Junhua, Z.; Lianfeng, Z.; Lianghuan, W.; Qianyu, J. Glutamate dehydrogenase mediated amino acid metabolism after ammonium uptake enhances rice growth under aeration condition. Plant Cell Rep. 2020, 39, 363–379. [Google Scholar] [CrossRef] [PubMed]
  43. Causin, H.; Barneix, A. Regulation of NH4+ uptake in wheat plants: Effect of root ammonium concentration and amino acids. Plant Soil 1993, 151, 211–218. [Google Scholar] [CrossRef]
  44. Nunes-Nesi, A.; Fernie, A.R.; Stitt, M. Metabolic and signaling aspects underpinning the regulation of plant carbon nitrogen interactions. Mol. Plant 2010, 3, 973–996. [Google Scholar] [CrossRef]
  45. Vega-Mas, I.; Cukier, C.; Coleto, I.; González-Murua, C.; Limami, A.M.; González-Moro, M.B.; Marino, D. Isotopic labelling reveals the efficient adaptation of wheat root TCA cycle flux modes to match carbon demand under ammonium nutrition. Sci. Rep. 2019, 9, 1–14. [Google Scholar] [CrossRef] [Green Version]
  46. Prinsi, B.; Espen, L. Mineral nitrogen sources differently affect root glutamine synthetase isoforms and amino acid balance among organs in maize. BMC Plant Biol. 2015, 15, 1–13. [Google Scholar] [CrossRef] [Green Version]
  47. Lea, P.J.; Sodek, L.; Parry, M.A.; Shewry, P.R.; Halford, N.G. Asparagine in plants. Ann. Appl. Biol. 2007, 150, 1–26. [Google Scholar] [CrossRef]
  48. Sarkissian, G.; Fowler, M. Interrelationship between nitrate assimilation and carbohydrate metabolism in plant roots. Planta 1974, 119, 335–349. [Google Scholar] [CrossRef]
  49. Schomburg, D.; Stephan, D. Galactinol-sucrose galactosyltransferase. In Enzyme Handbook 12; Springer: Berlin, Germany, 1996; pp. 431–433. [Google Scholar]
  50. Prabha, T.; Bhagyalakshmi, N. Carbohydrate metabolism in ripening banana fruit. Phytochemistry 1998, 48, 915–919. [Google Scholar] [CrossRef]
  51. Tadege, M.; Bucher, M.; Stähli, W.; Suter, M.; Dupuis, I.; Kuhlemeier, C. Activation of plant defense responses and sugar efflux by expression of pyruvate decarboxylase in potato leaves. Plant J. 1998, 16, 661–671. [Google Scholar] [CrossRef] [Green Version]
  52. Soriano, M.; Diaz, P.; Pastor, F.I.J. Pectate lyase C from Bacillus subtilis: A novel endo-cleaving enzyme with activity on highly methylated pectin. Microbiology 2006, 152, 617–625. [Google Scholar] [CrossRef] [PubMed] [Green Version]
  53. Oraby, H.; Venkatesh, B.; Dale, B.; Ahmad, R.; Ransom, C.; Oehmke, J.; Sticklen, M. Enhanced conversion of plant biomass into glucose using transgenic rice-produced endoglucanase for cellulosic ethanol. Transgenic Res. 2007, 16, 739–749. [Google Scholar] [CrossRef] [PubMed]
  54. Wu, B.; Zhang, B.; Dai, Y.; Zhang, L.; Shang-Guan, K.; Peng, Y.; Zhou, Y.; Zhu, Z. Brittle culm15 encodes a membrane-associated chitinase-like protein required for cellulose biosynthesis in rice. Plant Physiol. 2012, 159, 1440–1452. [Google Scholar] [CrossRef] [PubMed] [Green Version]
  55. Igarashi, D.; Ishizaki, T.; Totsuka, K.; Ohsumi, C. ASN2 is a key enzyme in asparagine biosynthesis under ammonium sufficient conditions. Plant Biotechnol. 2009, 26, 153–159. [Google Scholar] [CrossRef]
  56. Wong, H.-K.; Chan, H.-K.; Coruzzi, G.M.; Lam, H.-M. Correlation of ASN2 gene expression with ammonium metabolism in Arabidopsis. Plant Physiol. 2004, 134, 332–338. [Google Scholar] [CrossRef] [Green Version]
  57. Fernández-Crespo, E.; Gómez-Pastor, R.; Scalschi, L.; Llorens, E.; Camanes, G.; García-Agustín, P. NH4+ induces antioxidant cellular machinery and provides resistance to salt stress in citrus plants. Trees 2014, 28, 1693–1704. [Google Scholar] [CrossRef]
  58. Yang, S.; Hao, D.; Jin, M.; Li, Y.; Liu, Z.; Huang, Y.; Chen, T.; Su, Y. Internal ammonium excess induces ROS-mediated reactions and causes carbon scarcity in rice. BMC Plant Biol. 2020, 20, 143. [Google Scholar] [CrossRef]
  59. Kumar, S.; Trivedi, P.K. Glutathione S-transferases: Role in combating abiotic stresses including arsenic detoxification in plants. Front. Plant Sci. 2018, 9, 751. [Google Scholar] [CrossRef] [Green Version]
  60. Asim, M.; Ullah, Z.; Oluwaseun, A.; Wang, Q.; Liu, H. Signalling Overlaps between Nitrate and Auxin in Regulation of The Root System Architecture: Insights from the Arabidopsis thaliana. Int. J. Mol. Sci. 2020, 21, 2880. [Google Scholar] [CrossRef] [Green Version]
  61. Lowther, J. Use of a single sulphuric acid-hydrogen peroxide digest for the analysis of Pinus radiata needles. Commun. Soil Sci. Plant Anal. 1980, 11, 175–188. [Google Scholar] [CrossRef]
  62. Grabherr, M.G.; Haas, B.J.; Yassour, M.; Levin, J.Z.; Thompson, D.A.; Amit, I.; Adiconis, X.; Fan, L.; Raychowdhury, R.; Zeng, Q. Trinity: Reconstructing a full-length transcriptome without a genome from RNA-Seq data. Nat. Biotechnol. 2011, 29, 644. [Google Scholar] [CrossRef] [PubMed] [Green Version]
  63. Apweiler, R. Functional information in SWISS-PROT: The basis for large-scale characterisation of protein sequences. Brief. Bioinf. 2001, 2, 9–18. [Google Scholar] [CrossRef] [PubMed]
  64. Bateman, A.; Birney, E.; Cerruti, L.; Durbin, R.; Etwiller, L.; Eddy, S.R.; Griffiths-Jones, S.; Howe, K.L.; Marshall, M.; Sonnhammer, E.L. The Pfam protein families database. Nucleic Acids Res. 2002, 30, 276–280. [Google Scholar] [CrossRef] [PubMed] [Green Version]
  65. Kanehisa, M.; Goto, S. KEGG: Kyoto encyclopedia of genes and genomes. Nucleic Acids Res. 2000, 28, 27–30. [Google Scholar] [CrossRef]
  66. Tatusov, R.L.; Galperin, M.Y.; Natale, D.A.; Koonin, E.V. The COG database: A tool for genome-scale analysis of protein functions and evolution. Nucleic Acids Res. 2000, 28, 33–36. [Google Scholar] [CrossRef] [Green Version]
  67. Wilke, A.; Harrison, T.; Wilkening, J.; Field, D.; Glass, E.M.; Kyrpides, N.; Mavrommatis, K.; Meyer, F. The M5nr: A novel non-redundant database containing protein sequences and annotations from multiple sources and associated tools. BMC Bioinf. 2012, 13, 141. [Google Scholar] [CrossRef] [Green Version]
  68. Li, B.; Dewey, C.N. RSEM: Accurate transcript quantification from RNA-Seq data with or without a reference genome. BMC Bioinf. 2011, 12, 323. [Google Scholar] [CrossRef] [Green Version]
  69. Benjamini, Y.; Hochberg, Y. Controlling the false discovery rate: A practical and powerful approach to multiple testing. J. R. Stat. Soc. 1995, 57, 289–300. [Google Scholar] [CrossRef]
  70. Xie, C.; Mao, X.; Huang, J.; Ding, Y.; Wu, J.; Dong, S.; Kong, L.; Gao, G.; Li, C.-Y.; Wei, L. KOBAS 2.0: A web server for annotation and identification of enriched pathways and diseases. Nucleic Acids Res. 2011, 39, W316–W322. [Google Scholar] [CrossRef] [Green Version]
  71. Pfaffl, M.W. A new mathematical model for relative quantification in real-time RT–PCR. Nucleic Acids Res. 2001, 29, e45. [Google Scholar] [CrossRef]
Figure 1. (a) Seedlings of Pinus massoniana treated with different N forms for 30 days. The red line = 20 cm, and the orange line = 15 cm. (b) Fresh and dry weight of roots and aboveground parts of seedlings. (c) Nitrogen content of roots and aboveground parts of the seedlings. Bars on the graphs show standard deviation. Different letters show that the values differ significantly between treatments.
Ijms 21 07548 g001
Figure 2. (a) No. of differentially expressed genes annotated in different databases, (b) overall distribution of sample gene expression, (c) principal component analysis, and (d) Pearson correlations between nine replicates belonging to three treatments, where T1 = L1–3, T2 = L4–5, and T3 = L7–9.
Ijms 21 07548 g002
Figure 3. No. of differentially expressed genes (DEGs) between the tested treatment comparisons.
Ijms 21 07548 g003
Figure 4. Heatmap representing log2 FC of differentially expressed transcription factors in masson pine roots treated with different N-sources. Transcript IDs are followed by the transcription factor class. TA = the transcripts that showed transcription activity but were not annotated in any database.
Ijms 21 07548 g004
Figure 5. qRT-PCR validation of the selected differentially expressed genes in masson pine seedling roots grown in different nitrogen sources. The bars represent relative expression of the genes; the means were taken from three independent replications, and the error bars represent the standard deviation.
Ijms 21 07548 g005
Figure 6. (a) Principal component analysis, (b) summary of differentially expressed proteins, and (c) heatmaps of the expression of the differentially expressed proteins between different treatments.
Ijms 21 07548 g006
Figure 7. Schematic representation of key transcriptional changes in masson pine seedlings grown in nitrate (T1), mix of nitrate and ammonium (T2), and ammonium (T3). Green and blue boxes represent chloroplast and mitochondria, respectively. The colors of arrows represent their respective regulation by either of the treatment. NRTs (nitrate transporters), AMTs (ammonium transporters), CLC (chloride channel), CIPK (CBL-interacting protein kinase), NR (nitrate reductase), NiR (nitrite reductase), GS (glutamine synthetase), GOGAT (glutamate synthase), AS (asparagine synthetase), GDH (glutamate dehydrogenase), 2-OG (2-oxoglutarate), MS (malate synthase), MDH (malate dehydrogenase) OAA (oxaloacetate), Iso-CL (isocitrate lyase), AQP (aquaporins), ACL (ATP citrate lyase), CS (citrate synthase), F3’MO (flavonoid 3’-monooxygenase), N3DO (naringenin 3-dioxygenase), PEPC (phosphoenolpyruvate carboxylase), POX (pyruvate oxidase), MSDH (malonate-semialdehyde dehydrogenase), HMGL (methylmalonate-semialdehyde dehydrogenase), MCCC1 (3-methylcrotonyl-CoA carboxylase alpha subunit). The heatmaps show the log2 foldchange values (in three treatment comparisons) of differentially expressed genes in P. massoniana roots.
Ijms 21 07548 g007
Table 1. Root morphological characteristics of masson pine seedlings treated with different N-sources, i.e., T1, T2, and T3.
Average No. of Root TipsPrimary Root Length (cm)Total Root Length (cm)Root Surface Area (cm2)Root Volume (cm3)
T19.2 ± 2.1 c9.06 ± 1.71 b33.12 ± 2.15 b4.42 ± 0.49 b0.065 ± 0.013 b
T212.5 ± 1.8 b10.6 ± 1.39 ab38.1 ± 1.99 a5.44 ± 0.54 a0.097 ± 0.013 ab
T318 ± 3.0 a12.4 ± 1.62 a39.67 ± 1.95 a5.3 ± 0.98 a0.077 ± 0.02 a
Values are the means followed by standard deviation. Different letters show that the values differ significantly between treatments.
Table 2. Differentially regulated genes/transcription factors related to phytohormone regulation.
Gene IDlog2FCKEGG_Annotation
T1 vs. T2T1 vs. T3T2 vs. T3
c2694320.731------abscisic acid receptor PYR/PYL family
c309091−1.261−1.104---pathogenesis-related protein 1
c3045201.059------abscisic acid receptor PYR/PYL family
c3124131.222------auxin-responsive protein SAUR32-like
c3055191.301------bZIP; transcription factor TGA2
c2992061.431------F-box protein GID2
c3067241.574------SAUR family protein
c301864−0.768------protein phosphatase 2C
c272209−2.702------jasmonate ZIM domain-containing protein (TIFY 9)
c2948282.119------SAUR-like auxin-responsive family protein
c309011---−1.981---SAUR family protein
c305774------−1.163jasmonate ZIM domain-containing protein (TIFY 10B-like)
c295030------−0.831transcription factor HBP-1b (c38)-like
c313439------−2.311jasmonate ZIM domain-containing protein
--- means corresponding gene was not differentially expressed.
Table 3. Composition of the nutrient solution in the three treatments.
T1T2T3
NO3/NH4+:100/0 mMNO3/NH4+:50/50 mMNO3/NH4+:0/100 mM
KNO30.60.10
Ca(NO3)2·H2O0.20.20
CaCl20.4250.4250.625
(NH4)2SO400.250.5
KH2PO40.1250.1250.125
MgSO4·7H2O0.250.250.25
KCl0.150.650.75
K2SO4000
DCD0.007 µM/L
Table 4. Primers used for qRT-PCR analysis of selected genes.
Gene IDGene DescriptionForward Primer SequenceReverse Primer Sequence
c309116high affinity nitrate transporter 2.4-like (HA-NRT2.4-Like)GCGTTGCCTATGTCCTTAACTGATTTCGGCTTTG
c312191High-affinity nitrate transporter 3.2 (HA-NRT3.2)CCATTGTATGCCTCTTGCCTTGCTCTGATTTA
c311742Nitrate transporter 1.5 (NRT1.5)GATCGCTTCTACTTGTTATTTGAGCCAGTTCTTCGT
c286964nitrate reductase (NADH] (NR)GACTTGATCGTCTTTCGCAACACCGTGCCTACT
c270620vacuolar amino acid transporter 1 (AVT1C)TGGGACTAAGGGTCGATAAATCTTTCAGGCATACAG
c293061Protein GLUTAMINE DUMPER 2 (GDU2)ACAACCCTATGTCTCGCAGCCATTTATCACTAT
c309611Putative glutamine amidotransferase (GAT1_2.1)CATGCGTTCAGGGTGGCTATCATCATCAGGGCGTAA
c269698High-affinity nitrate transporter 3.1 (HA-NRT3.1)TAGCCACAGAATCCTATCAAGGGCAGAGCACCAACA
c309809ferredoxin-nitrite reductase (NiR)GCAAGAGCCCTGAAAAACCGAAGGCAGTAGCA
c297315glutamate dehydrogenase (NAD(P)+) (GDH)AAACAGATGCGGGATAAAGGTCGGATACAACG
c311741peptide-N4-(N-acetyl-beta-glucosaminyl) asparagine amidase (PNGase A)AGACCTCGCAGGCAGTGATTCATCCGCAAACAC
tuublin β-TUBInternal standardGTCGTGAATCATGGCATGGCGCCTCACTATCGGTTTCCCA

