1. Introduction
Cytotoxic T lymphocytes (CTLs) are part of the adaptive immune system and function to kill infected and tumorigenic cells. Similar to helper T cells, they first need to be activated via the T cell receptor which forms a complex with antigenic major histocompatibility complexes (MHC) on the target cells. This triggers a signaling cascade inside the T cell leading to the formation of an immune synapse (IS) [
1]. Proximal TCR signaling is mainly led by two kinases Lck and Fyn. The downstream cascade of Lck activation encompassing the proximal TCR signaling includes ZAP70, LAT, SLP76, phospholipase C (PLCγ1). ZAP70 phosphorylates LAT which recruits SLP76 which in turn is phosphorylated by ZAP70 to result in the LAT-SLP76 signalosome. One of the most important signaling effectors of the LAT-SLP 76 signalosome is phospholipase C (PLC) which transduces the TCR signal by hydrolyzing phosphatidyl (4,5) bisphosphate into IP3 and DAG. The local DAG gradient promotes recruitment of PKC isoforms which mediate signaling inducing MTOC polarization and synapse polarity [
2]. IP3 binding to IP3 receptors on the membrane of the endoplasmic reticulum initiates Ca
2+ depletion from the ER lumen which triggers Ca
2+ influx from the extracellular space. This store operated calcium entry (SOCE) is essential for CTL effector function [
3].
IS formation results in visible morphological modifications occurring due to changes in the composition and density of molecules such as central actin depletion, recycling TCR polarization, cytotoxic granule (CG) polarization [
4]. Initial triggering of the TCR leads to formation of numerous TCR micro-clusters whose structure resembles a miniature synapse in that every TCR micro-cluster is surrounded by a micro-ring containing adhesion molecules. These micro-adhesion ring TCR clusters are important sites for early TCR signaling and coalesce to form larger clusters that ultimately form the central SMAC (cSMAC) [
5]. The spatially distinct area surrounding the cSMAC is the peripheral SMAC (pSMAC) comprising adhesion proteins that are trans-activated by the TCR signaling and play a major role in maintaining the stability of the IS. The pSMAC also establishes an intimate contact between the two cells, increasing the relative concentrations of secreted molecules in the cleft facilitating the exchange of signals between them. Integrin, the major adhesion protein that segregates to the pSMAC, normally rests in an inactive state and upon activation by chemokines, TCR or selectin changes its conformation to an open active configuration via an inside out signaling mechanism. Active integrin further modulates the TCR via outside in signaling mechanisms [
6]. Integrin interacts with ICAM on the target cell to form close adhesions.
Depletion of the actin network occurs at the IS following TCR activation within 2 min of cell–cell adhesion and is indispensable for CG fusion because in cells that do not clear actin at the IS there is no exocytosis [
7]. PIP3 was shown to dictate actin polymerization at the immune synapse. PIP3 generated from PIP2 by PI3K recruits Dock2 which in turn activates Rac. The effector protein of active GTP bound Rac is WAVE that plays a role in actin polymerization. Dock2 deficient CTLs display small sized synapses in which the segregation of fluorescently tagged Lifeact into an actin ring is clearly visible [
8]. Finally, cortical actin recovery terminates CG fusion [
9]. While actin is cleared from the center to form an outermost ring in the distal SMAC (dSMAC), signaling proteins accumulate in a central area called the central SMAC (cSMAC).
Exocytosis of perforin and granzyme B (GzmB) containing cytotoxic granules occur within the secretory domain of the cSMAC that is adjacent to the signaling domain. Exocytosis of CGs is one of the best studied aspects of CTL biology.
The accumulation of TCRs at the IS is important to sustain signaling at the IS [
10]. It has been suggested in T helper and naïve T cells that differing TCR strengths induce different modes of immune synapses and that stronger TCR stimuli induce longer lasting or more sustained synapses [
11]. CTLs form short term synapses because they can rapidly induce granule induced killing of target cells [
12,
13,
14]. Therefore, we studied how different TCR stimuli influences different parameters of IS formation within this timeframe. For that purpose, we used supported lipid bilayers [
15,
16,
17] with differing anti-CD3 concentrations to induce IS formation and investigated the behavior of molecular markers of the different IS zones under these varying stimuli by total internal reflection fluorescence microscopy (TIRFM). We find that the stimulus strength influences specific stages of the multi-step IS formation differently. Under our experimental conditions where we stimulated CTLs with 5, 10, or 20 µg/mL anti-CD3, we observed an increase in the number and size of TCR-CD3 clusters or size and dwell time of the actin ring with increasing stimuli. However, an optimum concentration of 10 µg/mL anti-CD3 induces the fastest adhesion time to the stimulatory bilayers, maximumTCR-CD3 dwell time, and CG fusion. Our findings show that rather than the amount of signaling molecules it is their dwell time at the immune synapse that ensures maximum effector function in CTLs.
3. Discussion
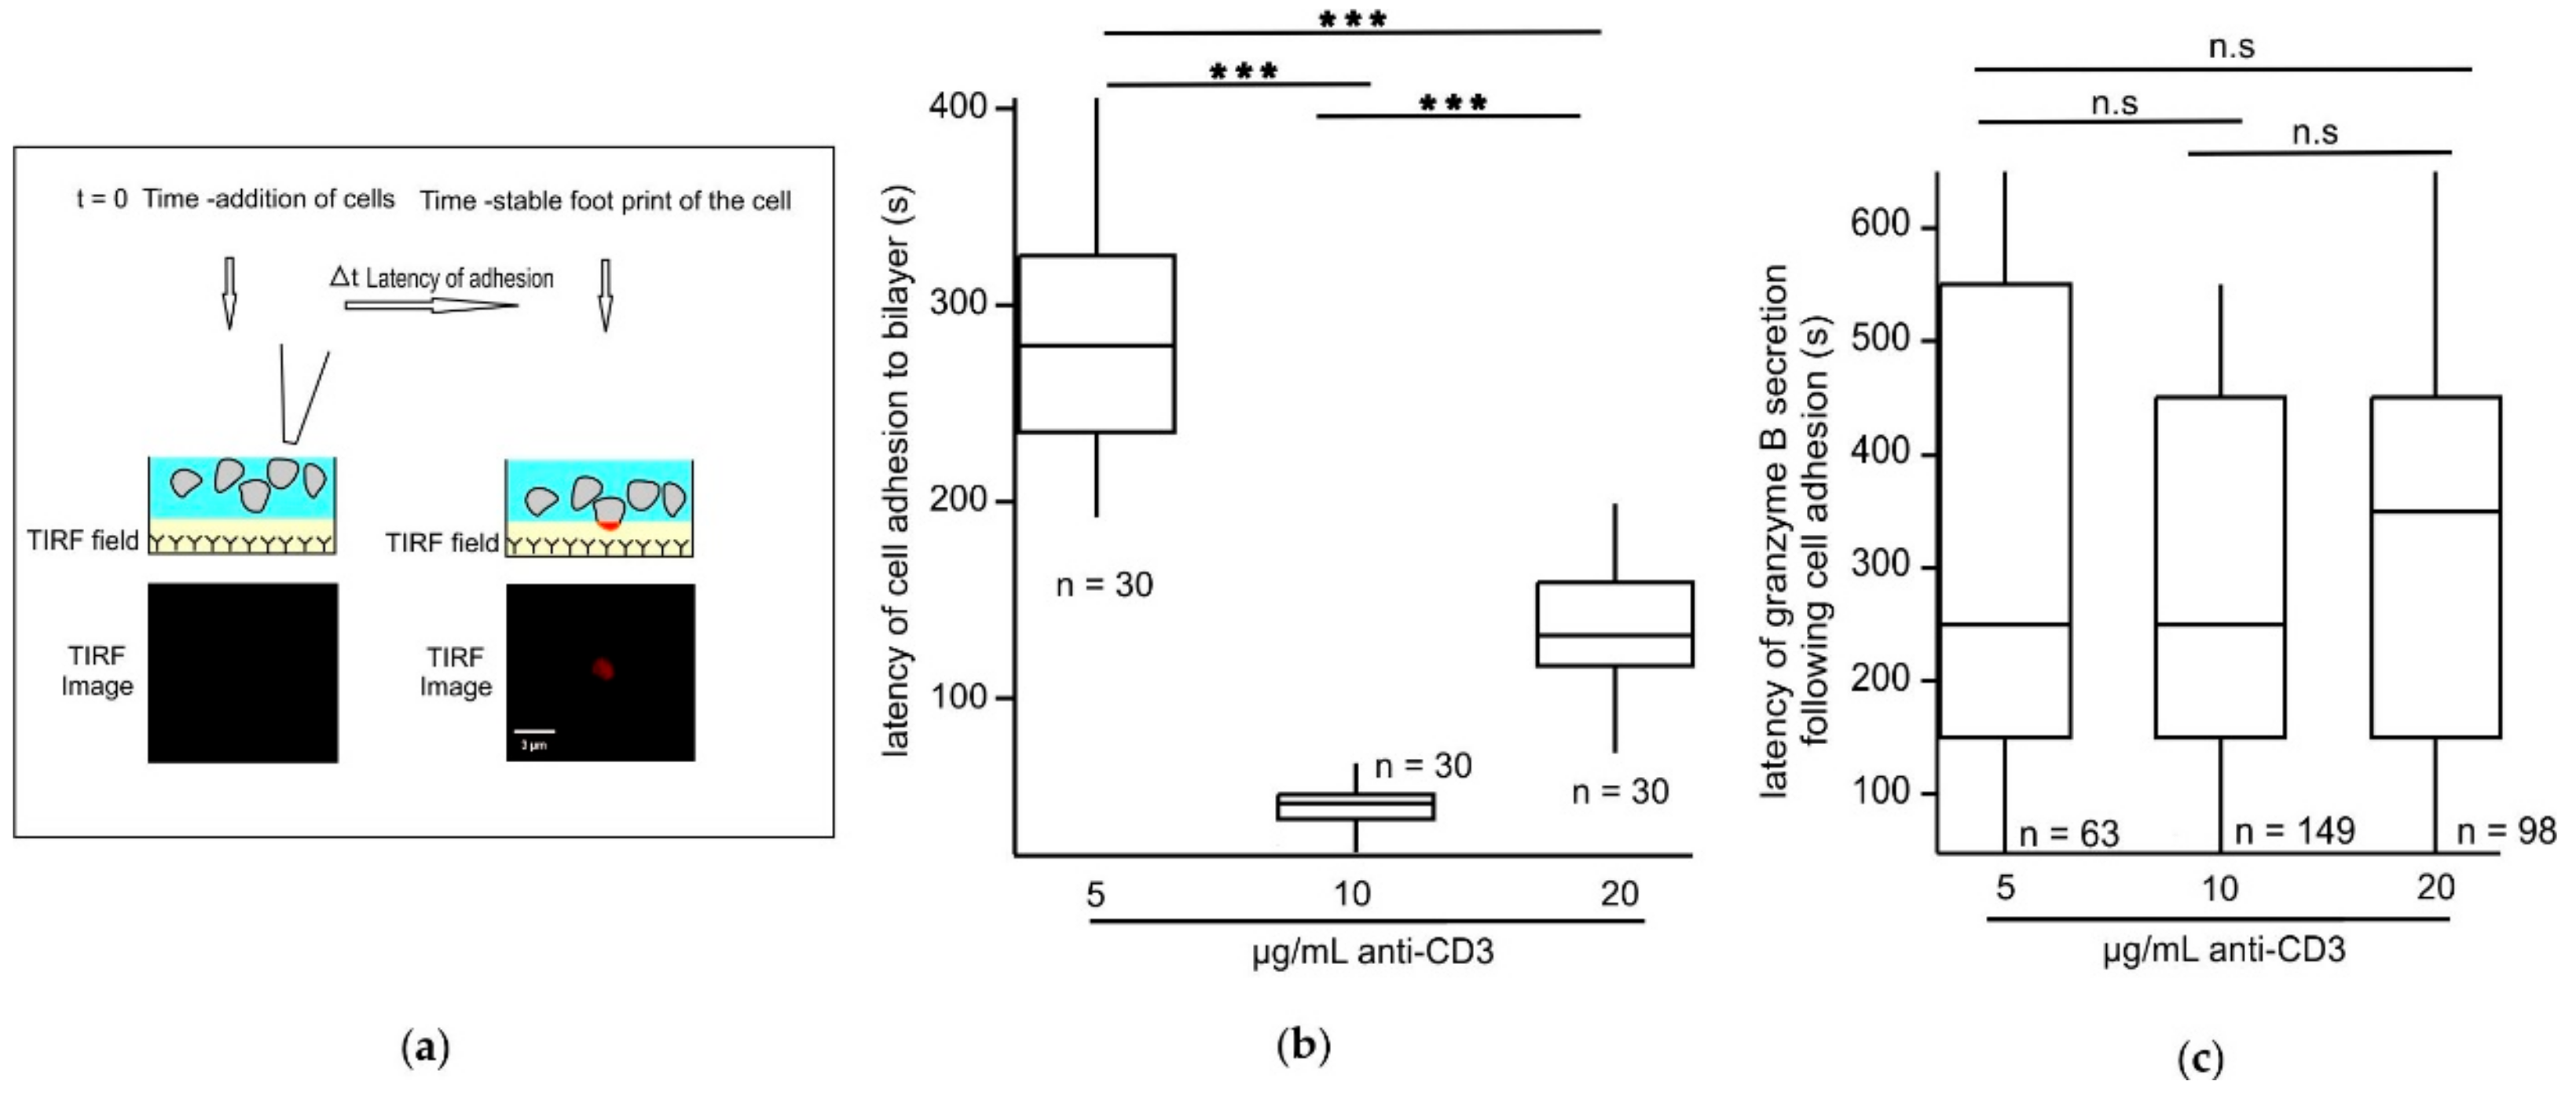
We show here that the different steps of IS formation are differently dependent on the strength of the stimulus. We generated effector CTLs by stimulating them with anti-CD3/anti-CD28 coated beads and IL-2 to study the consequences of varying strengths of TCR stimuli of cytotoxic synapses on IS formation and effector function. We used supported planar bilayers with varying concentration of biotinylated anti-CD3 but constant ICAM concentrations as surrogate targets to trigger granule release in CTLs. Immune synapses formed between CTLs and the stimulatory bilayers were imaged at a high temporal and axial resolution by TIRFM. We found that increasing the strength of the TCR trigger does not automatically result in a linear increase in downstream stages of IS formation and that certain stages of IS formation are more sensitive to the initial TCR trigger than others. Under our experimental conditions we found that with an optimum TCR trigger consisting of 10 µg/mL anti-CD3 in the stimulatory bilayers, CTLs exhibit the shortest latency time for adhesion to stimulatory bilayers, the longest dwell time of CD3-TFP clusters and maximal CG fusion.
We used anti-CD3 as a stimulus in our study which is not as physiological as a cognate peptide-MHC complex stimulation. Biotinylated anti-CD3 on supported planar bilayers have been used to reliably report downstream signaling events in T cells with clear segregation of the IS into SMACs comparable to that observed with a peptide MHC stimulation [
19]. We also have evidence that CTLs stimulated with anti-CD3 vs. cognate peptide-MHC complexes behave similarly in our functional readouts (see materials and methods in [
13]. Physical parameters such as mechanical forces, however, do influence agonist TCR-pMHC interactions occurring during T cell priming processes [
25]. While this is something we cannot address in our study, it would provide more information about the function of the cytolytic IS.
Our study describes the influence of the initial TCR trigger on the formation and efficiency of a cytotoxic IS. We cannot exclude that under physiological conditions in vivo varying stiffness of target cell membranes could also serve as a variable that affects IS dynamics. Basu et al. cultured B16 melanoma cells on stiff and soft hydrogels to induce a higher and lower membrane tension and could demonstrate a clear increase in sensitivity to perforin mediated lysis on the target cell membranes with higher tension [
26]. CD4
+ T cells also exhibit increased sensitivity to varying stiffness of activation substrates. Upon activation for 24 h with biotinylated anti-CD3, anti-CD28, and ICAM coated poly-acrylamide (PA) gels with increasing stiffness values of 0.5, 6.4, and 100 kPa, maximum activation induced surface marker expression and cytokine production was seen in CD4
+ T cells that were stimulated with the stiffest activation substrates [
27].
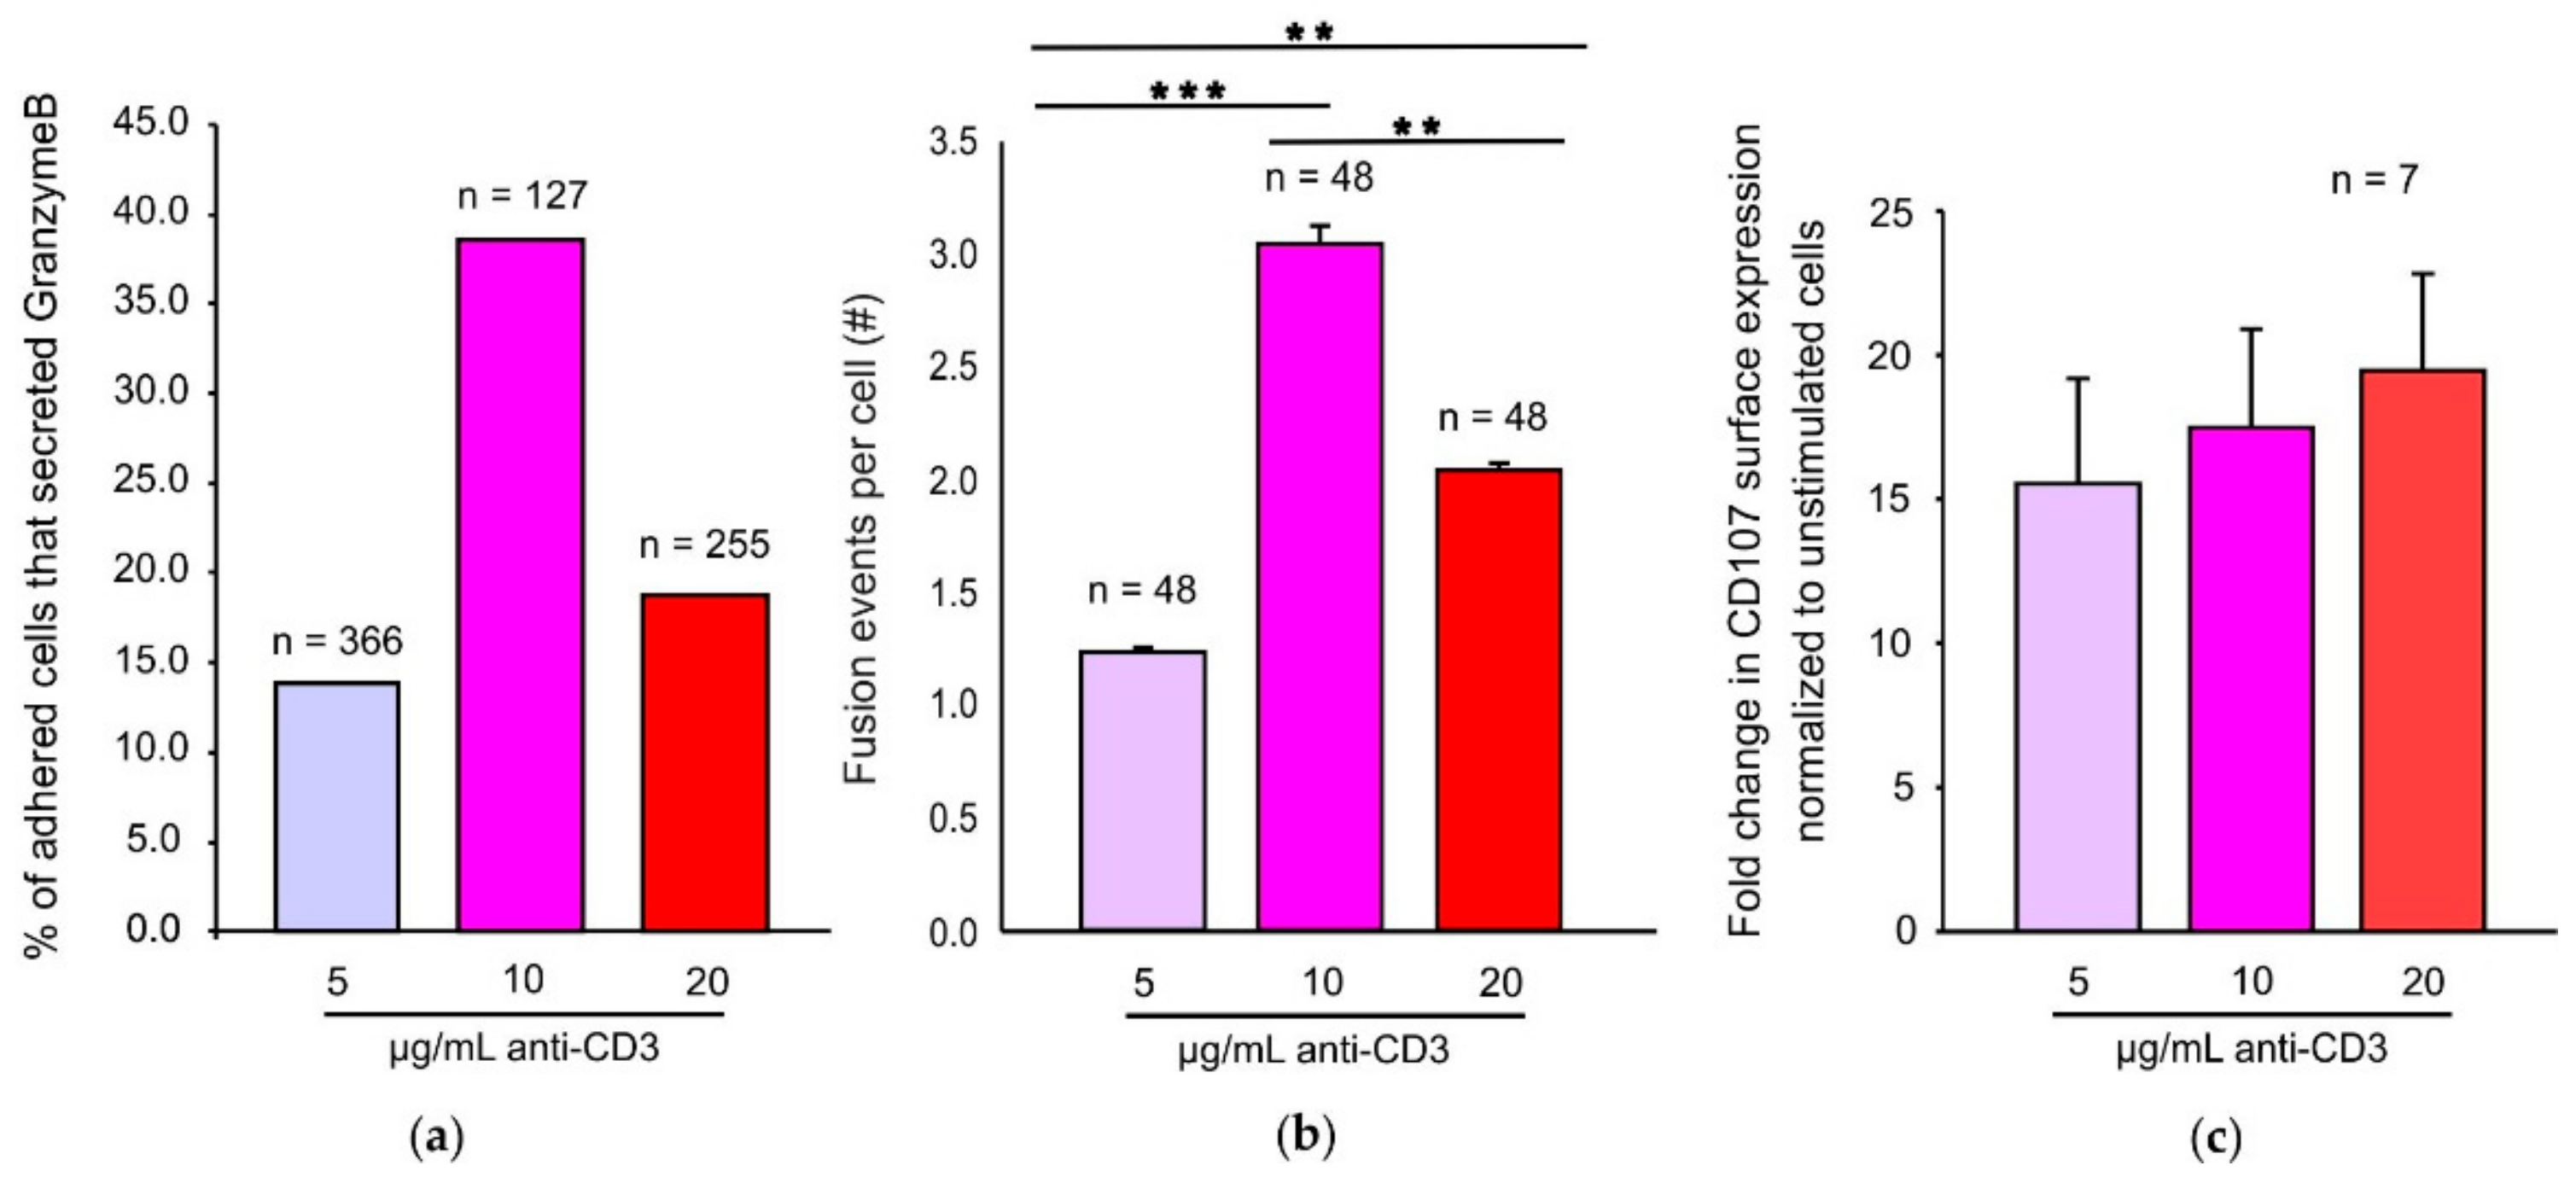
Many reports have demonstrated that increasing concentrations of cognate antigen increase CTL mediated cytotoxicity and cytokine release [
18]. Our TIRFM data demonstrate that under an optimum TCR stimulus, CTLs exhibit maximal cytotoxic granule fusion. Increased CTL mediated lysis upon increasing antigen strength may also be a consequence of alternate pathways being induced such as FAS mediated killing pathways. Interestingly, an optimum stimulus does not seem to be required for lysosomal degranulation even though surface LAMP1 detection has been widely used as a readout for CG exocytosis [
28]. One reason for this observation may be that LAMP1 degranulation assays are also detecting lysosomal degranulation occurring over the entire cell surface and not only at the IS. Another reason may be that in a LAMP1 degranulation assay the cells are stimulated for more than 2 h at 37 °C thereby giving CTLs enough time to adhere to the coated anti-CD3 surface and exhibit CG exocytosis. Xhao et al. showed that CTLs exhibit a bell-shaped calcium dependency for perforin mediated killing [
29]. According to them an intracellular Ca
2+ concentration or [Ca
2+]
i between 122 and 334 nM and an extracellular Ca
2+ concentration or [Ca
2+]
o between 23 and 625 µM is ideal for CTL and NK killing related effector functions. Although intracellular calcium levels under our varied TCR stimuli have not been tested an increase in calcium influx upon higher antigen stimulation has been demonstrated [
30]. Since our results demonstrate that there is a significant decrease in CG fusion beyond an optimum anti-CD3 concentration (in our case 10 to 20 µg/mL) our observations may be explained by the bell-shaped Ca
2+ dependence.
Different granule fusion modes essentially control the kinetics and amount of the cargo released [
31]. Various modes of lytic granule fusion have been observed in NK cells and CTLs differing in the amount of cargo release or diffusion of membrane bound LAMP1 [
32,
33]. Our results with CG membrane bound Synaptobrevin2-pHuji and CG cargo Granzyme B-mTFP demonstrate 1000-fold differences in the decay times of Synaptobrevin2-pHuji fluorescence at the site where granzyme B is released entirely. The different decay times may be due to different rates of retrieval of Synaptobrevin2 into acidic compartments. Unexpectedly, we did not observe any dependency of these decay times on the various concentrations of stimulatory anti-CD3 in our experiments. We might be able to gain more insight into the various fusion modes and their relevance by investigating CTLs generated from differing strengths or exposure time of stimuli on naïve CD8
+ T cells in the future.
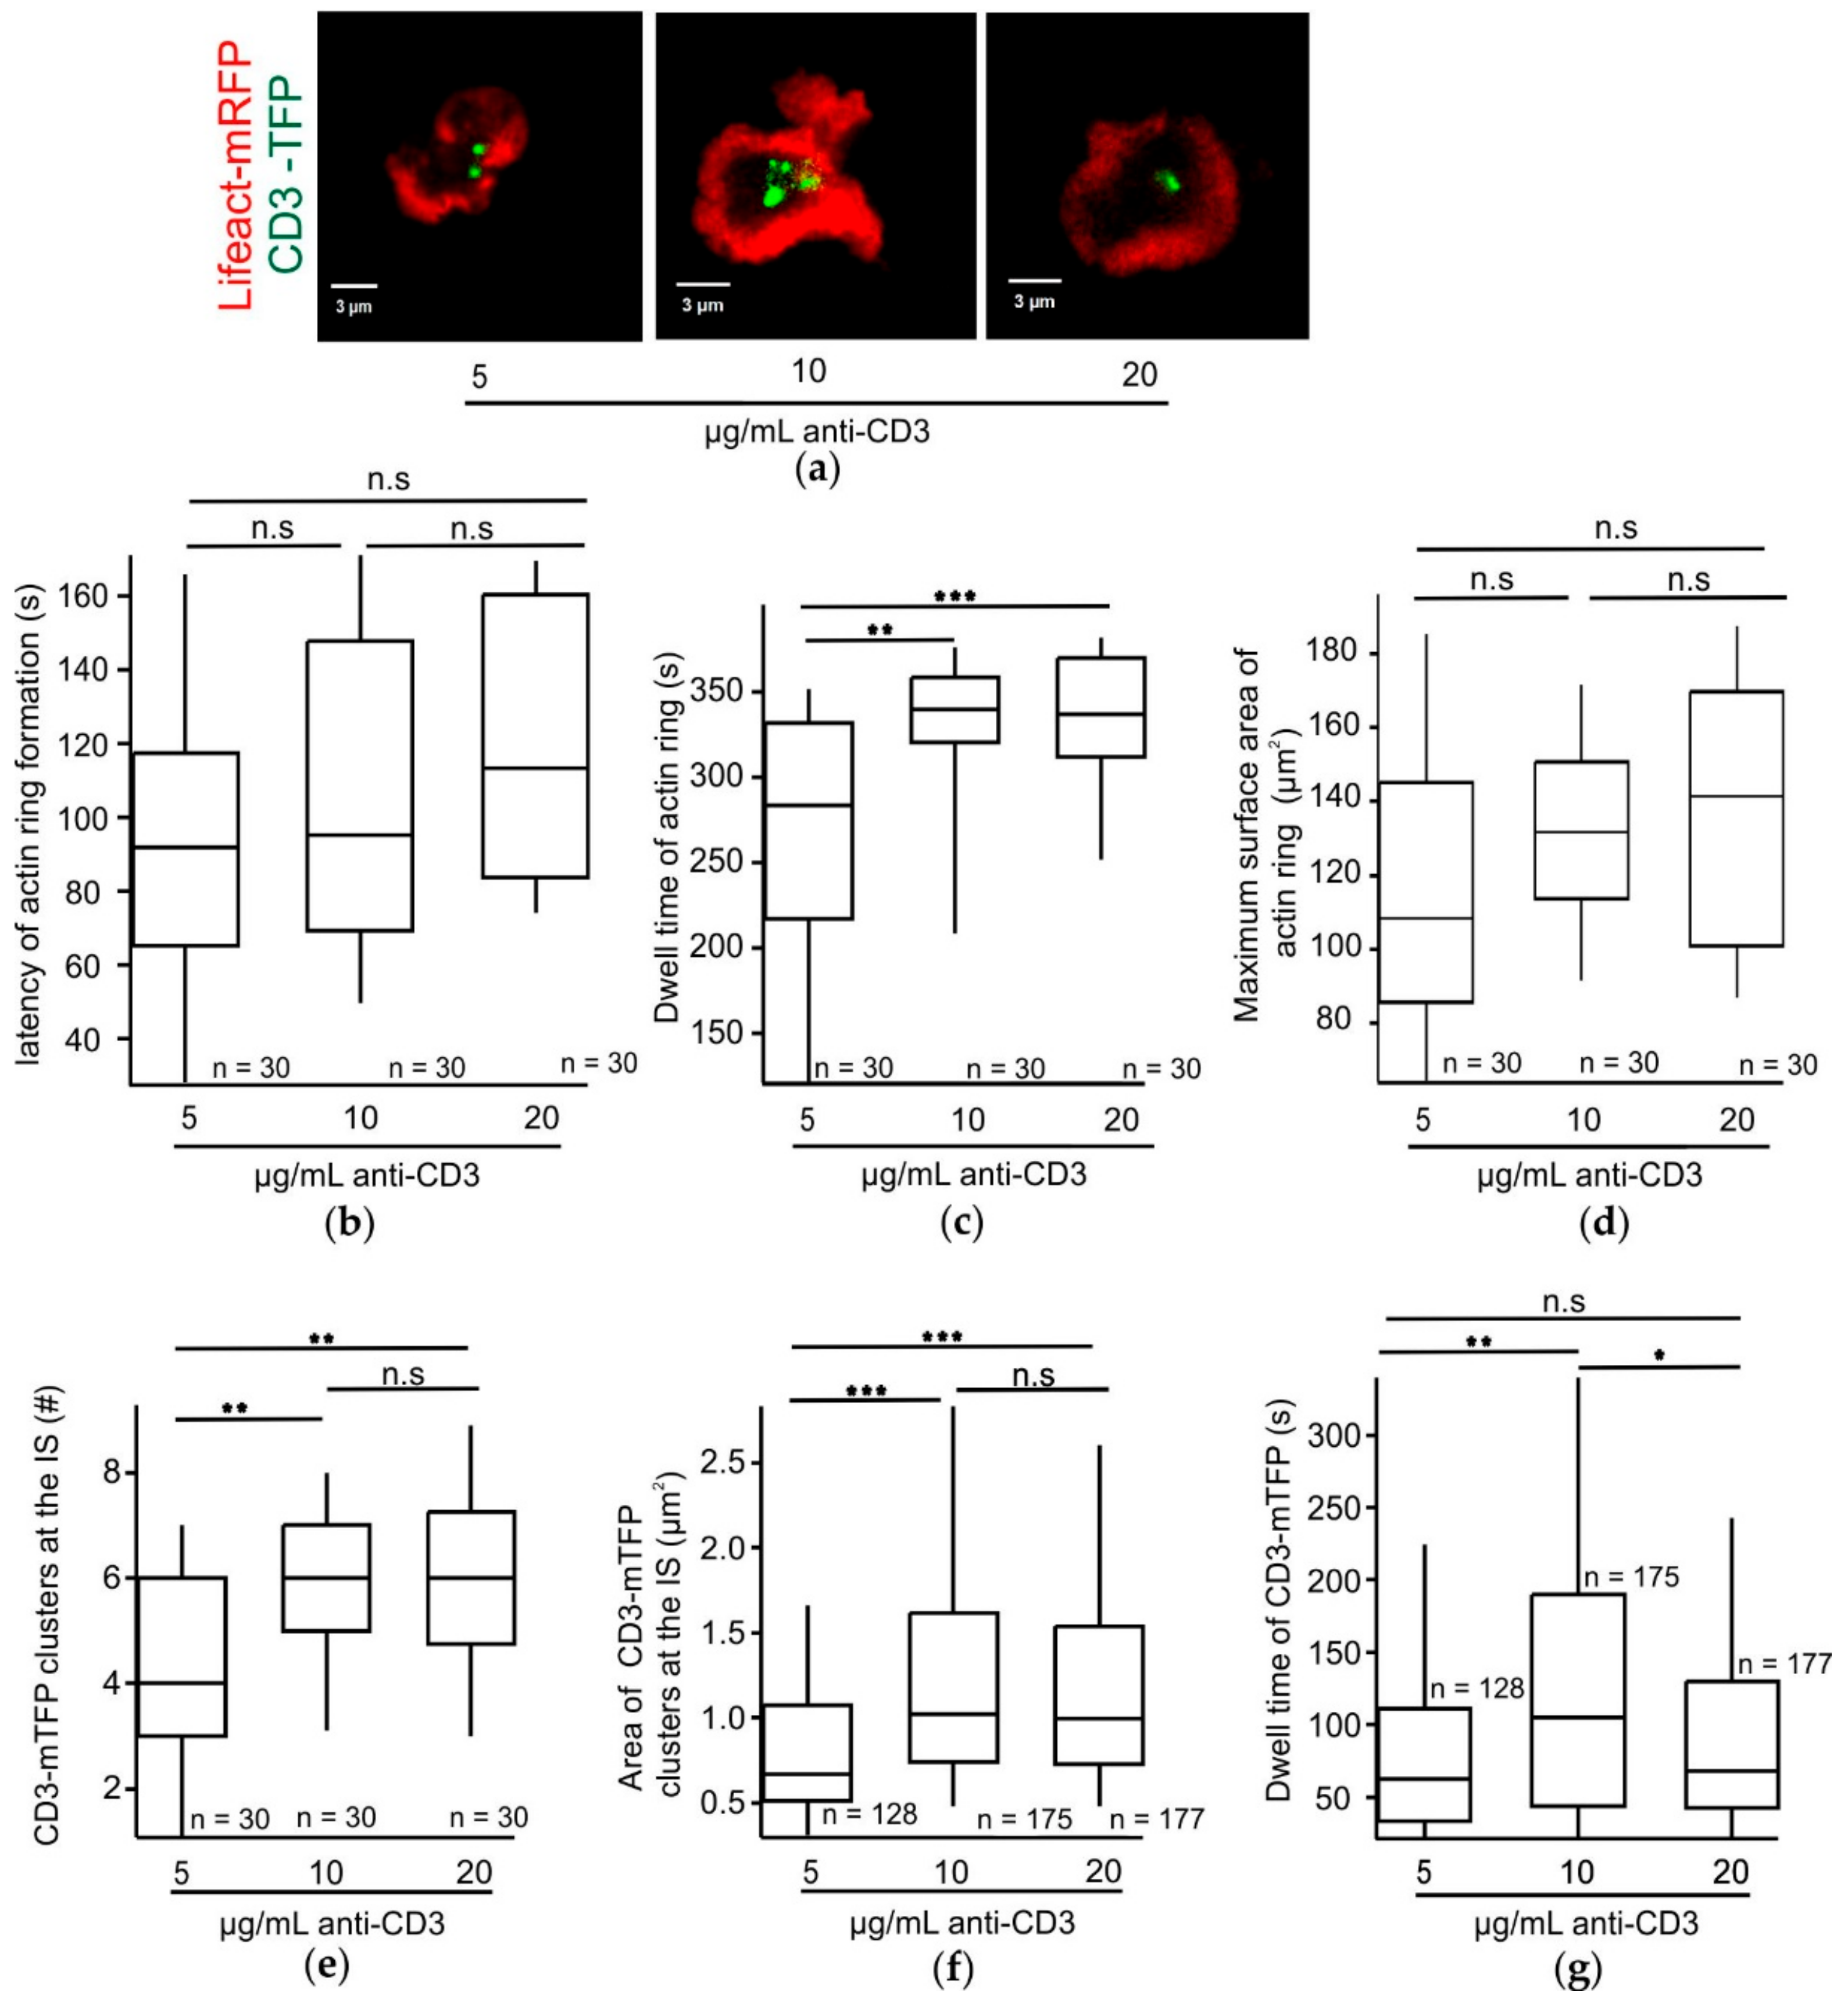
Increasing TCR strength has a positive effect on the size of CD3 clusters accumulating at the IS. Upon a TCR trigger, TCR clusters initially form at the pSMAC and move towards the cSMAC. These clusters then coalesce to form bigger clusters [
19]. Our results demonstrate that with an increasing stimulus there is an increase in the size and number of average CD3 clusters. However, there is an optimal concentration of anti-CD3 that elicits a significantly longer dwell time of the CD3-mTFP at the IS. Therefore, the size and dwell time of CD3 clusters are differently dependent on the strength of the TCR stimulus. It is well known that sustained TCR signaling is required for synapse maintenance and full effector function of naïve helper T cells [
34]. Our observation of a significant increase in the dwell time of CD3-mTFP at the IS in CTLs stimulated with an optimum 10 µg/mL anti-CD3 may explain the maximum fusion efficiency exhibited by these CTLs.
The varied stimulatory anti-CD3 concentrations in the bilayers do not influence the latency of actin ring formation in CTLs following adhesion. Since central clearance of actin plays a key role in controlling the timing of CG release at the synapse [
7], this could explain our results in which we do not find a significant difference in the latency of GzmB secretion following adhesion of the CTL to the bilayers with varied anti-CD3 concentrations. Le Floc’h et al. reported that Dock2-deficient CTLs display miniaturized synapses [
8]. Since our results show that the overall surface area of the actin ring formed is not altered upon changing TCR trigger strengths we conclude that PIP3 recruited, Dock2-dependent actin polymerization was not affected. This explains why we also do not find a significant difference in the latency of actin ring formation following adhesion upon changing anti-CD3 concentrations. However, the dwell time of the actin ring is increasing upon increasing TCR strength implying that increasing the TCR trigger is inducing more stable actin rings and in turn more stable synapses. It has been demonstrated that LAT is not required for kinetics of IS formation but for maintaining stable synapses in CTLs [
35]. Since our results demonstrate that the dwell time of the actin ring and CD3-mTFP show different dependencies on the stimulatory anti-CD3 concentrations this may be due to LAT-induced downstream effects.
T cells adhering to stimulatory bilayers indeed tended to display more movement with lower anti-CD3 concentrations. Since increasing mobility reduces formation of a stable adhesion it may explain why cells stimulated with 5 µg/mL anti-CD3 have lower fusion efficiency and fusion events per cell. However, the cells stimulated with 20 µg/mL anti-CD3, although showing less movement, also demonstrate reduced fusion efficiency. Thus, the formation of a stable adhesion with reduced movement is not a cause but rather a consequence of high antigen trigger that may lead to inefficient T cell effector function probably due to exhaustion. CTL exhaustion has been described and occurs in cases of prolonged antigen exposure such as in chronic infections and cancers during T cell activation [
36]. Under our experimental settings we are imaging CTL synapses induced by different anti-CD3 concentrations for 10 min. It would be rather surprising if we are inducing CTL exhaustion just upon higher antigenicity and it might provide new mechanistic insights into the exhaustion process itself. Since T cell exhaustion occurs prominently in cancers, understanding the mechanism of exhaustion may help us understand how to reverse it which will open new doors to cancer immunotherapy [
37].
4. Materials and Methods
4.1. Mice
Granzyme B-mTFP knock-in mice were generated with the CRISPR CAS9-D10A_mRNA (Nickase) system in cooperation with the Max-Planck-Institute for experimental Medicine in Göttingen. As a guide RNA the GzmB-protospacer-sgRNA2 sequence 5′ GTC CAG GAT TGC TCT AGG AC 3′ was used and a Homology-Directed-Repair fragment of GzmB-mTFP was inserted. Afterwards the genome of the mouse was fully sequenced to exclude side effects. All wild type mice (obtained from Charles River Laboratories, Sulzfeld, Germany) used for experiments were between 8 and 12 weeks old and belonged to the C57Bl/6N (Black 6) strain. All animal experiments were approved by the state of Saarland (Landesamt für Gesundheit und Verbraucherschutz; animal license number 41-2016; approval date: 8 November 2016) and were in accordance with German law and European animal healthcare guidelines (FELASA).
4.2. Cells
Naïve CD8
+ T cells were isolated from splenocytes using a FlowComp Dynabeads Mouse CD8
+ positive isolation kit (ThermoFisher Scientific, Karlsruhe, Germany) as described previously [
13]. The cells were cultured at a concentration of 1 × 10
6 cells per mL in AIMV Medium (ThermoFisher Scientific) supplemented with 10% FCS, 0.5% Pen/Strep and 40 µM BME (Carl Roth, Karlsruhe, Germany). Then, 2 × 10
6 cells were seeded per well of a 24-well plate and the cells were activated with anti-CD3/anti-CD28 mouse activator beads at a ratio of 1:0.8. Cells were incubated at 37 °C with 5% CO
2 for 7 or 8 days to generate effector CD8
+ T cells or CTLs. Cells were counted every day after day 2 of activation and split to 1 million/mL as the cells doubled or tripled. Furthermore, 10 U/mL of recombinant mouse IL2 (BD Biosciences, San Jose, CA, USA) was added as supplement to each well during the splitting. Cells activated for 7 or 8 days as described above were used for all experiments.
4.3. Electroporation of CTLs
Electroporation was performed using the Nucleofection kit (LONZA, Cologne, Germany) according to the manufacturers protocol. Briefly, for one electroporation 5 × 10⁶ CTLs from WT or granzyme B-mTFP knock-in mice were centrifuged at 180× g for 7 min, resuspended in 4 mL of isolation buffer and spun again at 180× g for 7 min. The cell pellet was finally resuspended in 100 µL nucleofection solution and 1.5 µg of each corresponding plasmid DNA was added before subjecting the cells to electroporation using program X-001. Following electroporation, the cells were kept in medium provided by LONZA overnight at 32 °C with 5% CO2 in one well of a 12-well plate. After 12 h of incubation the cells were spun again for 7 min at 180× g and then resuspended in 3 mL of AIM V medium with 10 U/mL recombinant mouse IL2 and again placed in the incubator at 32 °C with 5% CO2 until the end of imaging.
4.4. Plasmids
The Lifeact-mRFP construct was kindly provided by Roland Wedlich-Söldner (Universität Münster, Münster, Germany). CD3-mTFP was described previously [
38]. pHuji was amplified from a previously described VAMP7 pHuji construct [
39] using the forward primer 5′ ATG TAT ACC CAA GCT TAT GGT GAG CAA GGG CGA G 3′ to add HindIII site and the reverse primer 3′ ATG TAT ACG CGG ATC CTT ACT TGT ACA GCT CGT C 5′ to add the BamHI site. The PCR product was digested and ligated into an optimized pMax-vector containing Synaptobrevin2 as previously described [
40].
4.5. Lipid Bilayer Preparation
Preparation of proteins: first, 0.05 μg/mL biotin (EZ-link sulfo-NHS-LC-LC-Biotin (ThermoFisher Scientific)) was added to an anti-CD3 antibody solution (clone 145-2C11 diluted to 1 mg/mL) and incubated for 30 min at room temperature. Overnight dialysis at 4 °C in PBS using a dialysis cassette (Slide-A-Lyzer® Dialysis Cassettes, ThermoFisher Scientific) was performed for purification. Mouse ICAM-1 was generated from a drosophila S2 cell line expressing ICAM-1 (kindly provided by Michael Dustin, University of Oxford, UK). The protein was purified after S2 induction. Preparation of lipids: first, 100% DOPC (#850375C Sigma Aldrich/Avanti (Taufkirchen, Germany), 25% NTA (#790404C Sigma Aldrich/Avanti) and 2% capbio (#870273C Sigma Aldrich/Avanti) were prepared in a lipid buffer containing Tris (25 mM, pH 8) and NaCl (150 mM) bubbled with N2 as the working stock solution. All lipids were dissolved in DMSO (Avanti). The lipids were then dried in a lyophilizer for 2 h at −40 °C and finally resuspended in the lipid buffer to yield a liposome suspension with inhomogeneous sizes of vesicles. The suspension was extruded in avestin extruder (Lipofast®) to obtain homogenously sized SUVs (single unilamellar vesicles). The lipids were diluted to a concentration of 0.4 mM each with DOPC. The glass slides were pre-cleaned with piranha solution (50 mL of concentrated sulfuric acid + 25 mL of hydrogen peroxide), plasma cleaned to remove organic contaminations, and placed onto reaction chambers (Ibidi stickyslide® VI microscopy chamber). Coating of lipids and proteins on glass slides: the liposome solution was applied to the reaction chamber. Then, 100 μM NiSO4 in 5% casein was applied followed by ICAM His-tag (0.275 μg/mL). In the final step the biotinylated anti-CD3 antibody was applied depending on the concentration needed (5, 10, or 20 μg/mL) for the experiment. The concentration of capbio lipids was also varied according to the concentration of the anti-CD3 antibody used. Washing of wells after each step was done with HBS/HSA buffer.
4.6. Total Internal Reflection Fluorescence Microscopy
The TIRFM setup used was described previously [
39] with the following changes: a 445 nm laser (100 mW) along with a 561 nm solid state laser (100 mW) were used for excitation along with a filter cube consisting of an emission filter ZET 442/514/568 and a dichroic beamsplitter ZT405/440/514/561 (Chroma Technology Corp, Olching, Germany). The pixel size of the camera was 160 nm. The acquisition frequency for all experiments was 5 Hz and the acquisition time was 15 min. In TIRF mode the penetration depth of the evanescent light for the 561 nm and the 445 nm laser was set at 150 nm through the iLAS2 illumination control system (Roper Scientific SAS, Evry, France) for all experiments. Lipid bilayers were always freshly prepared on the day of the imaging experiments. Before the addition of cells and imaging, the HBS/HSA buffer was removed from the well of the prepared reaction chamber and 200,000 CTLs initially suspended in a low calcium imaging buffer (155 mM NaCl, 4.5 mM KCl, 5 mM HEPES, 3 mM MgCl2 × 6 H
2O, and 10 mM glucose) were added to the bilayers and imaged for 5 min. Cells were then perfused with a high calcium imaging buffer (140 mM NaCl, 4.5 mM KCl, 5 mM HEPES, 2 mM MgCl2 × 6 H
2O, 10 mM CaCl
2, and 10 mM glucose) to induce exocytosis and then imaged again for 10 min.
4.7. Imaging Analysis
All image analysis was done using ImageJ 1.52n or IGOR PRO (WaveMetrics, Portland, OR, USA). For analysis of the latency of accumulation a stable adhesion was defined as the fluorescent signal having an area of ≈3 µm2. The analysis of latency time of the first formed actin ring, its dwell time, and maximum area were analyzed manually after setting thresholds to images to distinguish fluorescence from noise and sometimes verified by the line plot function. The area of the actin ring was determined for all time frames and the maximum among all time frames was calculated for each concentration to analyze the area of cell spread at the IS. The CD3-mTFP cluster size and number and dwell time of vesicles was also analyzed automatically using the analyze set measurement parameters. Dwell time is defined as the time during which the fluorescent CD3-mTFP vesicle or the actin ring remains in the TIRF field. To determine the mobility of the IS, i.e. the center of mass of the cell footprint, the IS was determined every 200 ms for the entire recording. The change in the x and y coordinates could be reshaped into lines that form the two sides of a right triangle. The hypotenuse could be calculated using the Pythagoras theorem to generate the mobility of the IS every 200 ms and subsequently every second. All the analysis concerning the kinetics of the short and long fusion events were done using IGOR PRO. The decay time of Synaptobrevin2-pHuji fluorescence was quantified by fitting the curve with a single exponential and then calculating the time taken for 67% of decrease in fluorescence to obtain the tau (τ). All results were split into two groups based on the tau values. All fusion events with a tau value of less than a second (τ < 1 s) were categorized as short fusion events and all fusion events with a tau value of more than a second (τ > 1 s) were categorized as long fusion events. The complete fusion event time for both short and long fusion events was quantified by calculating the time elapsed between the beginning and the end of the entire fusion event. The fusion pore opening time for all fusion event types was quantified by fitting with a line the sharp increase phase of Synaptobrevin2-pHuji fluorescence and the 10% to 90% rise time was calculated.
4.8. Degranulation Assay
Degranulation assay was basically as described previously [
40] with the following changes. Briefly, day 7 or 8 activated CTLs were rested for 2 h without any stimulus in fresh culture medium. Afterwards, 0.5 million cells were resuspended in 100 μL culture medium with 1 µg/mL anti-CD107 PE (clone 1D4B, Biolegend, San Diego, CA, USA) per well of a 96-well plate. The cells were plated onto wells pre-coated with either 5, 10, or 20 μg/mL anti-CD3
ε (clone 145-2C11, BD Biosciences) or not (constitutive controls) and incubated for 2 h at 37 °C with 5% CO
2. Unstained controls were performed for every concentration of anti-CD3 used as stimulus to ensure no major change in the auto-fluorescence of the cells upon stimulation with varying anti-CD3 concentrations. Cells were then washed twice with ice cold PBS and analyzed by BD FACSAria
TM III. Data were analyzed by using FlowJo software (Celeza, Switzerland). Median fluorescent intensity (MFI) of CD107-PE was calculated for the constitutive and stimulated conditions and degranulation was analyzed as the fold change in MFI of CD107.PE upon stimulation normalized to constitutive levels.
4.9. Statistics
One-way ANOVA test was used to test significance for data that was normally distributed and ANOVA on Ranks with the post hoc Dunn’s method for data that was not normally distributed. All statistical tests were done using SigmaPlot version 13.0 (Systat Software, Erkrath, Germany).

 ,
, 


