Redox Homeostasis and Metabolism in Cancer: A Complex Mechanism and Potential Targeted Therapeutics

 ,
, 
Abstract
:1. Reactive Oxygen Species
2. Sources of ROS
3. Physiological Roles of ROS
4. Oxidative Stress
5. Oxidative Stress and Cancer
6. Metabolic Pathways and Redox Homeostasis
6.1. Glycolysis
6.2. Fatty Acid Oxidation
6.3. Pentose Phosphate Pathway
6.4. Glutamine Metabolism
6.5. The Serine–Glycine One-Carbon Metabolism (SGOC)
6.6. Oxidative Phosphorylation
7. Effects of Tumor Microenvironment (TME) Metabolism on Immune Cells and Immunotherapy
8. Transcription Factors and Redox Homeostasis
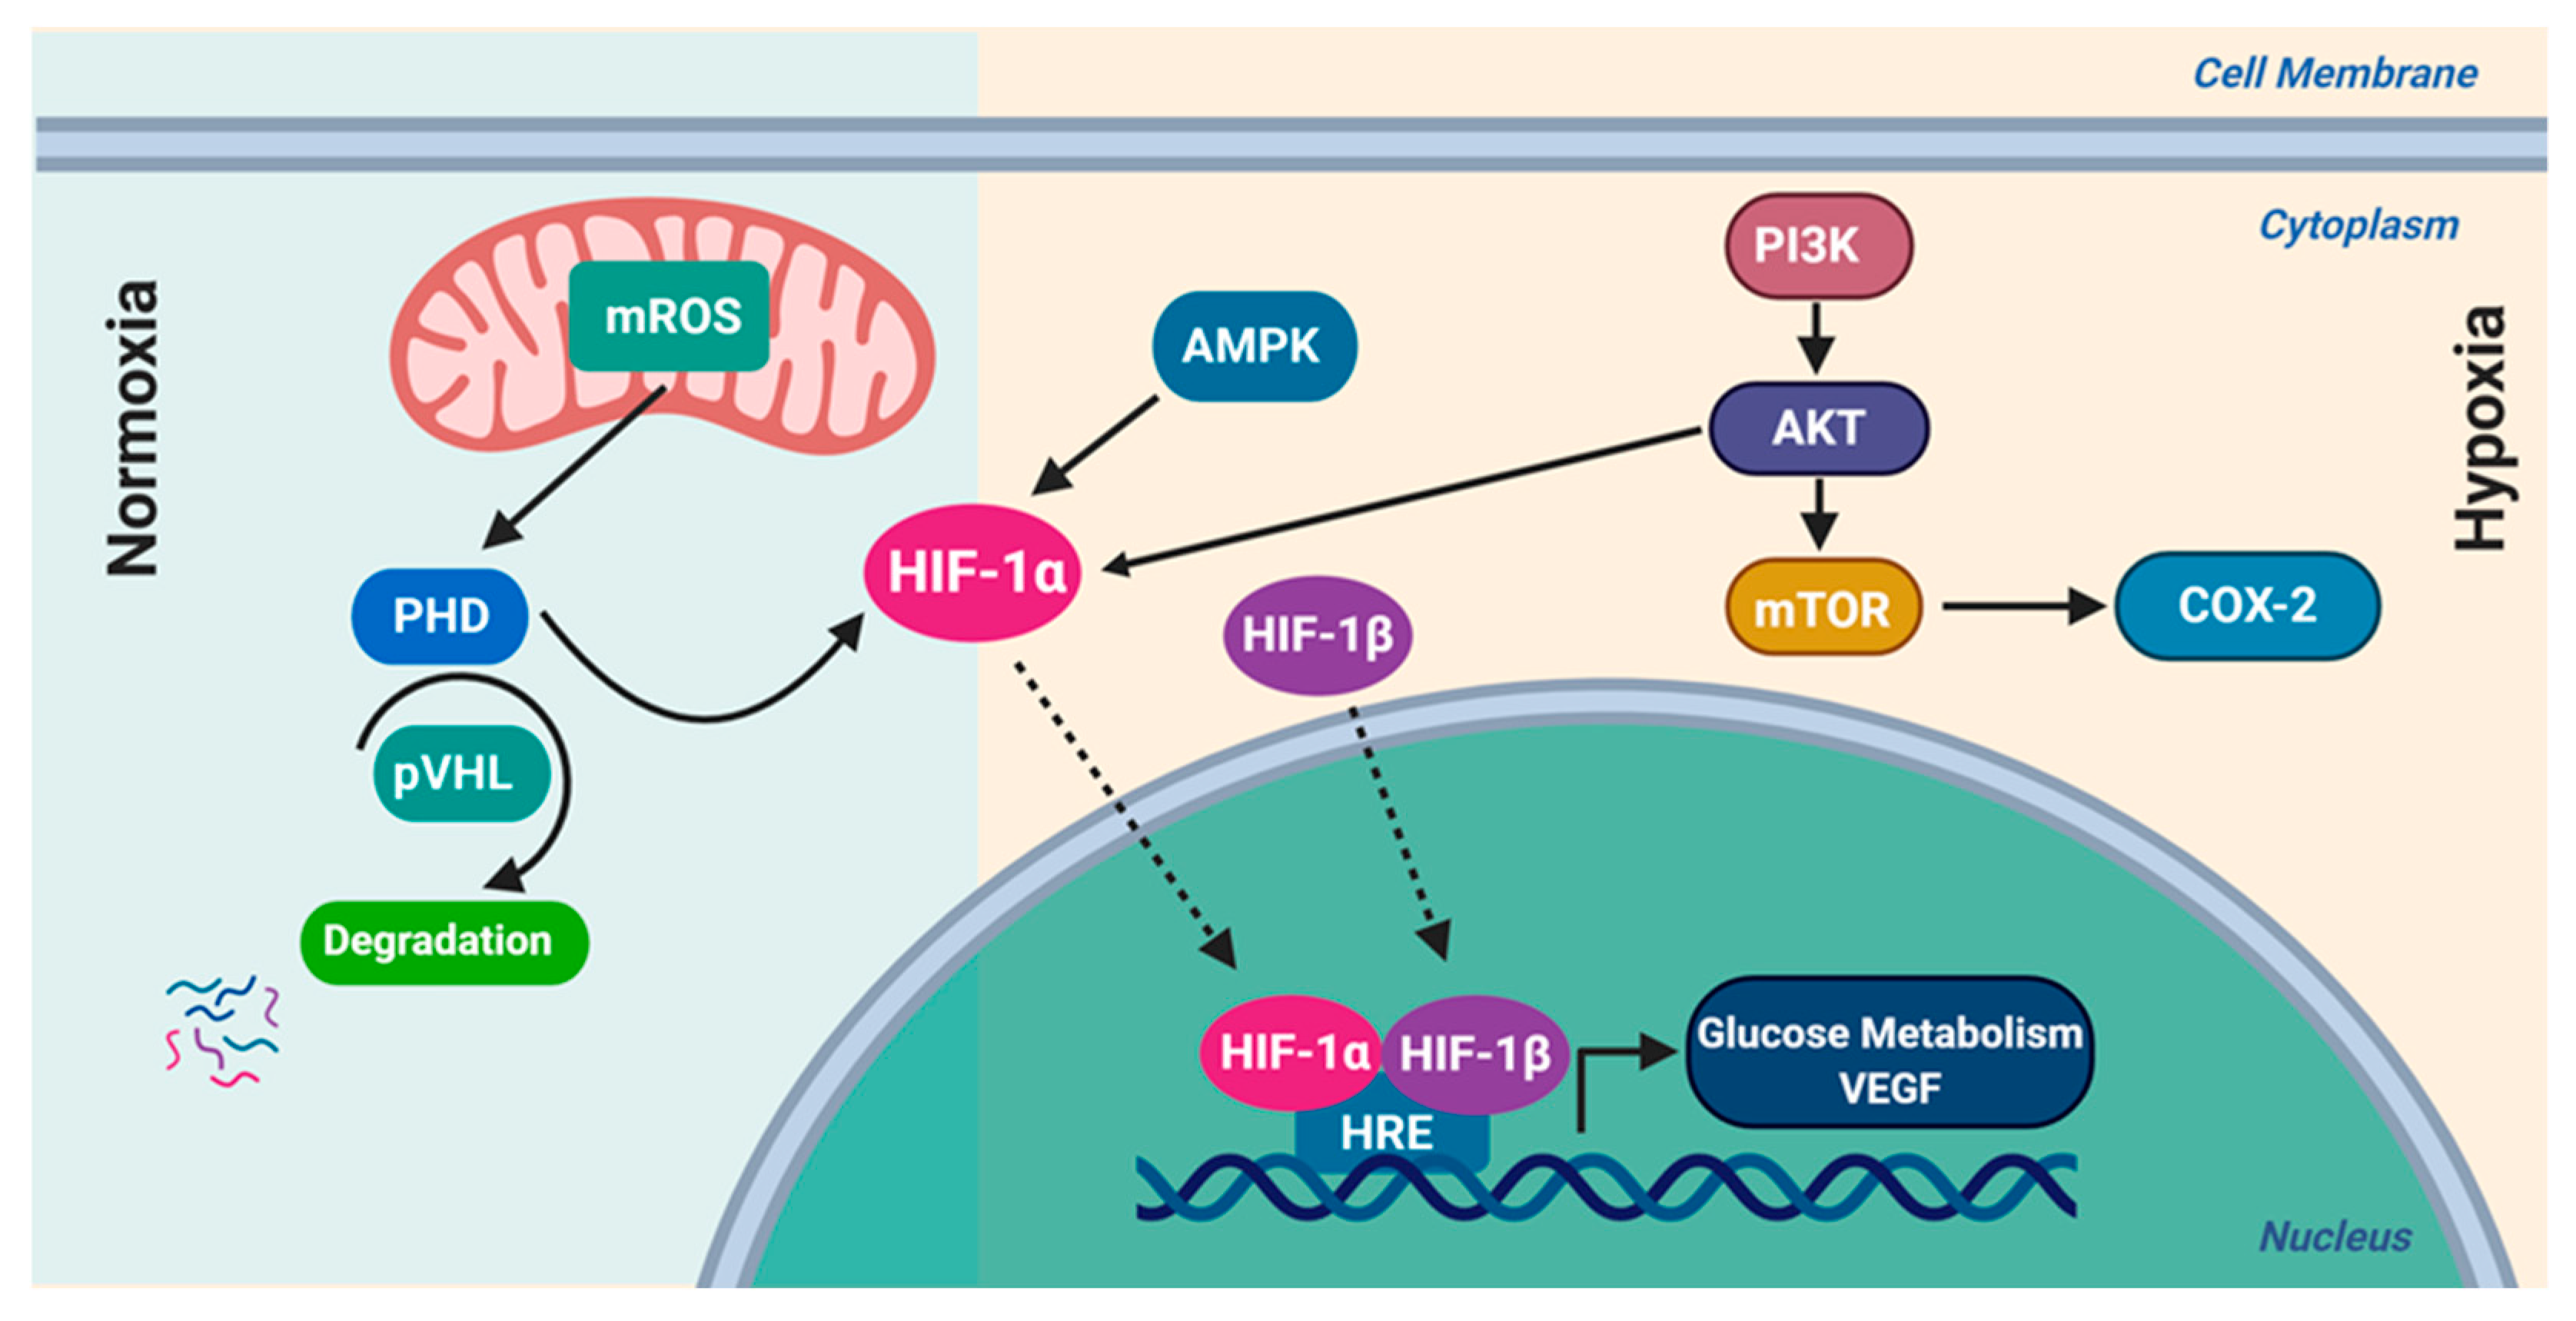
8.1. Hypoxia-Inducible Factor-1 (HIF-1)
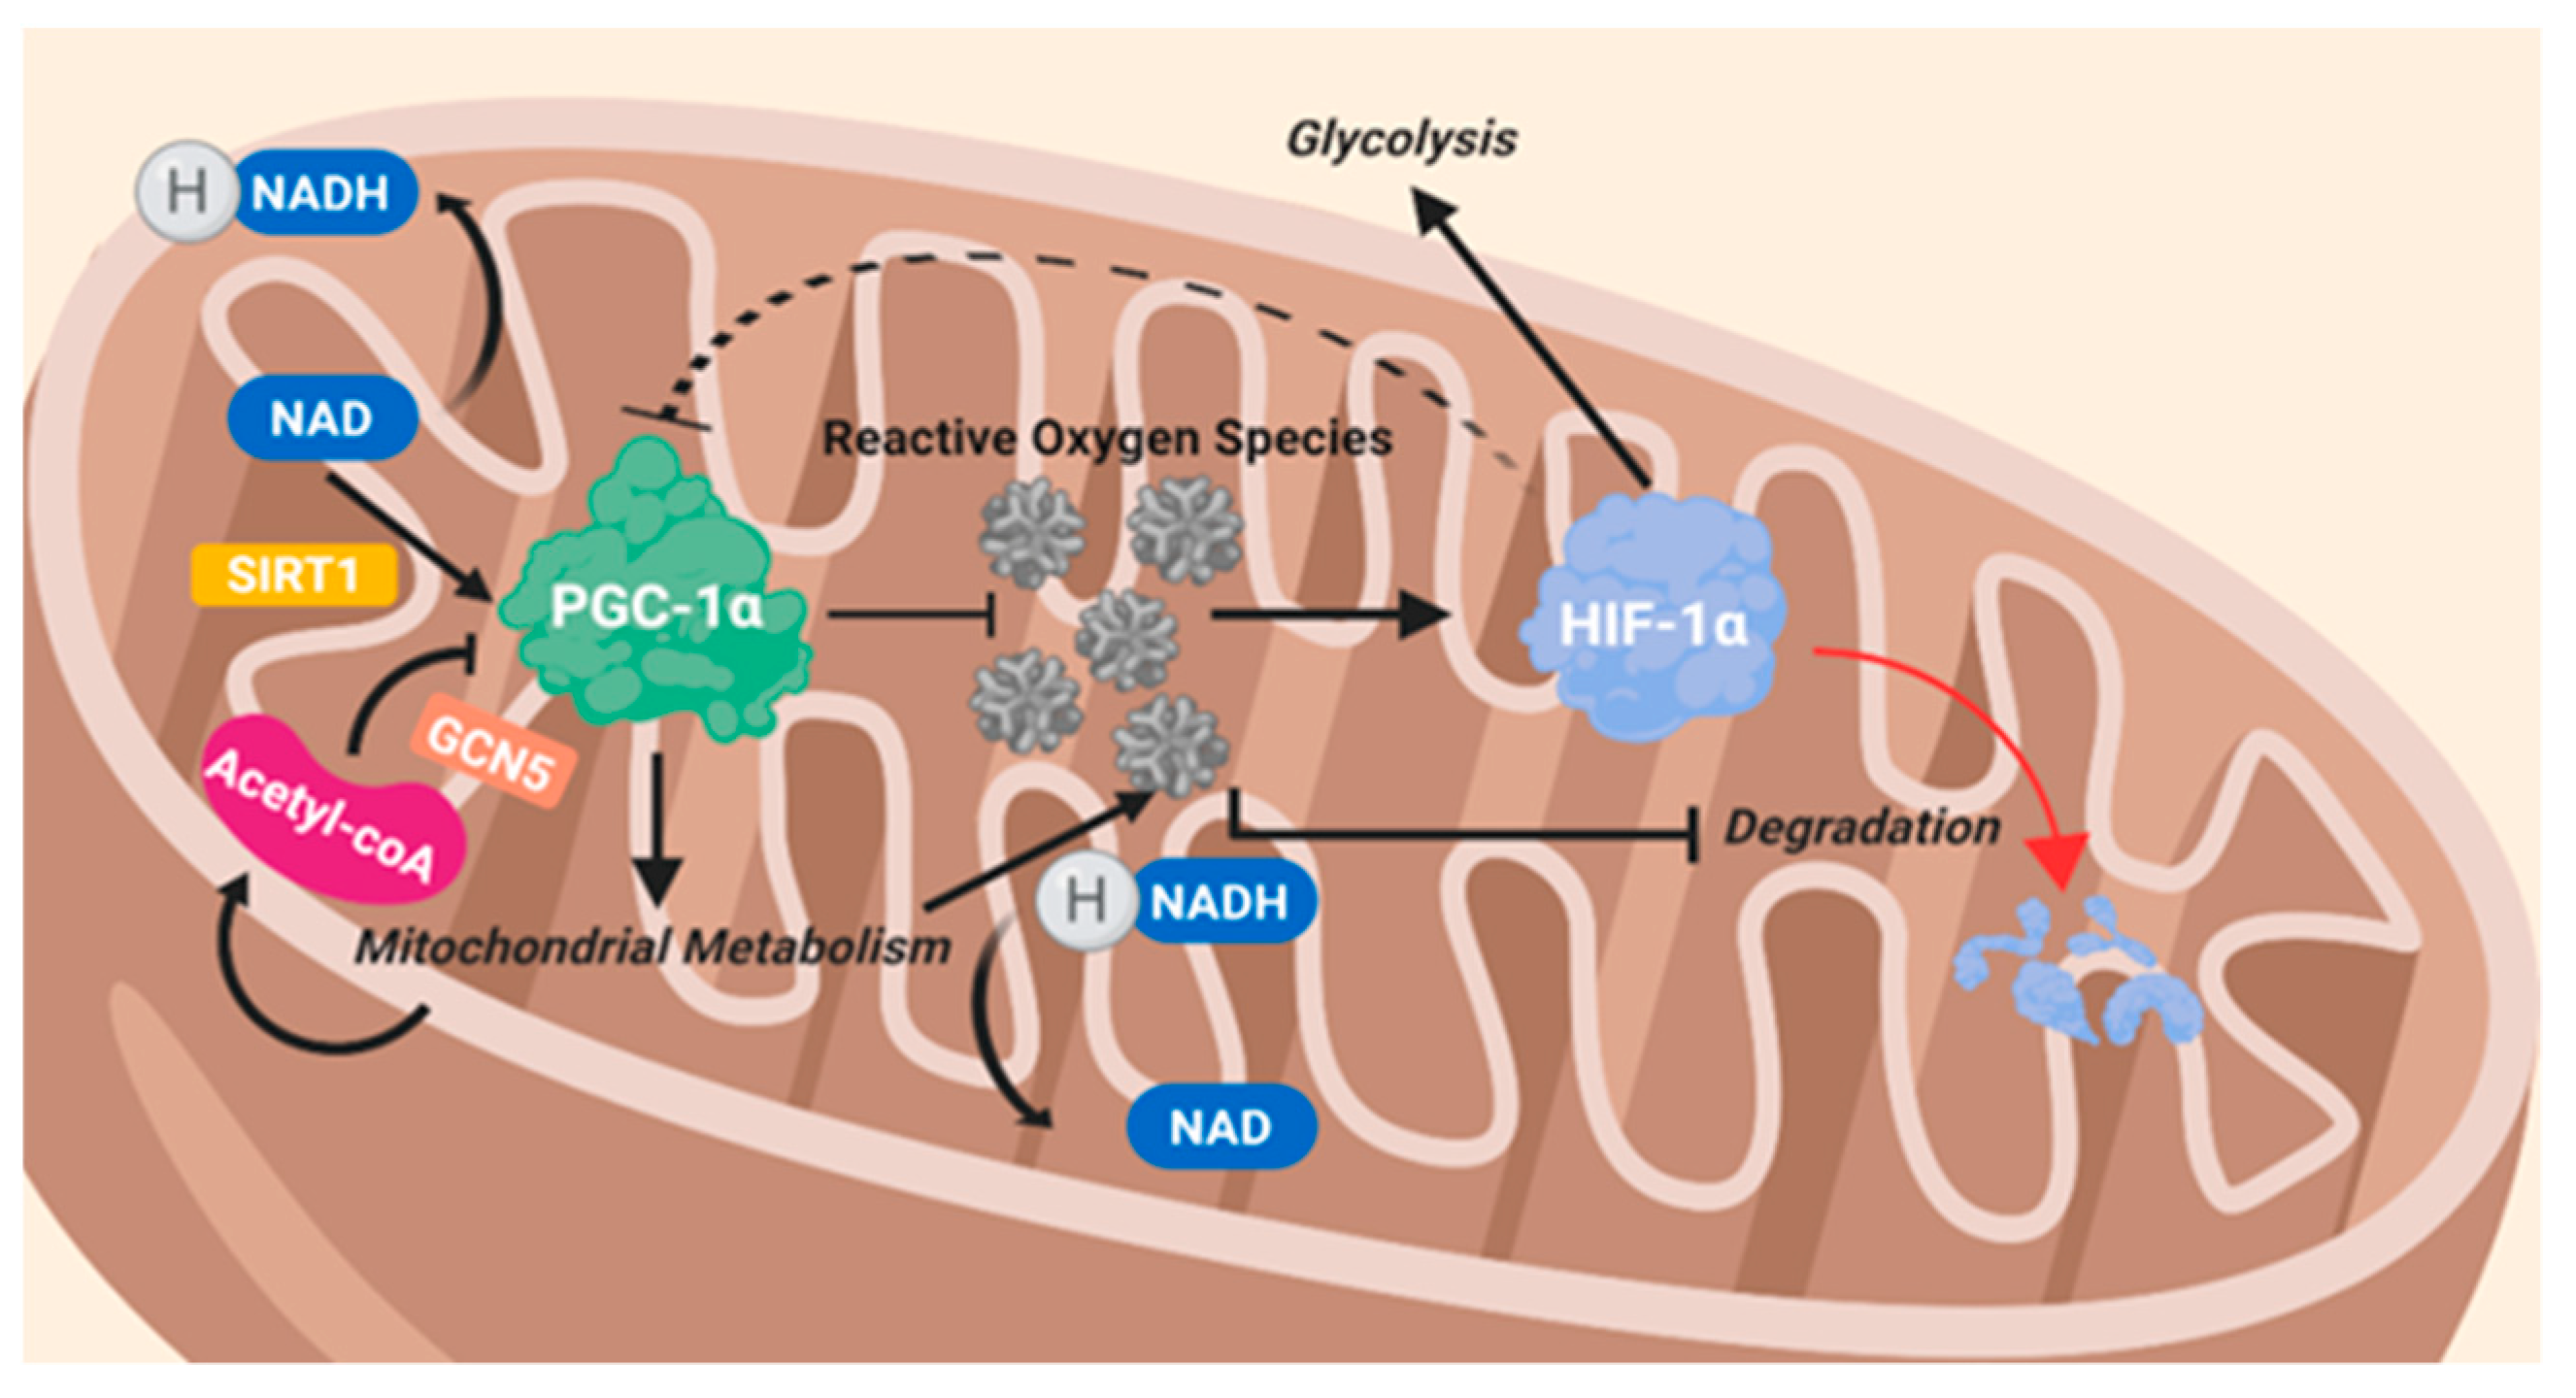
8.2. Peroxisome Proliferator-Activated Receptor Gamma Coactivator 1 Alpha (PGC-1α)
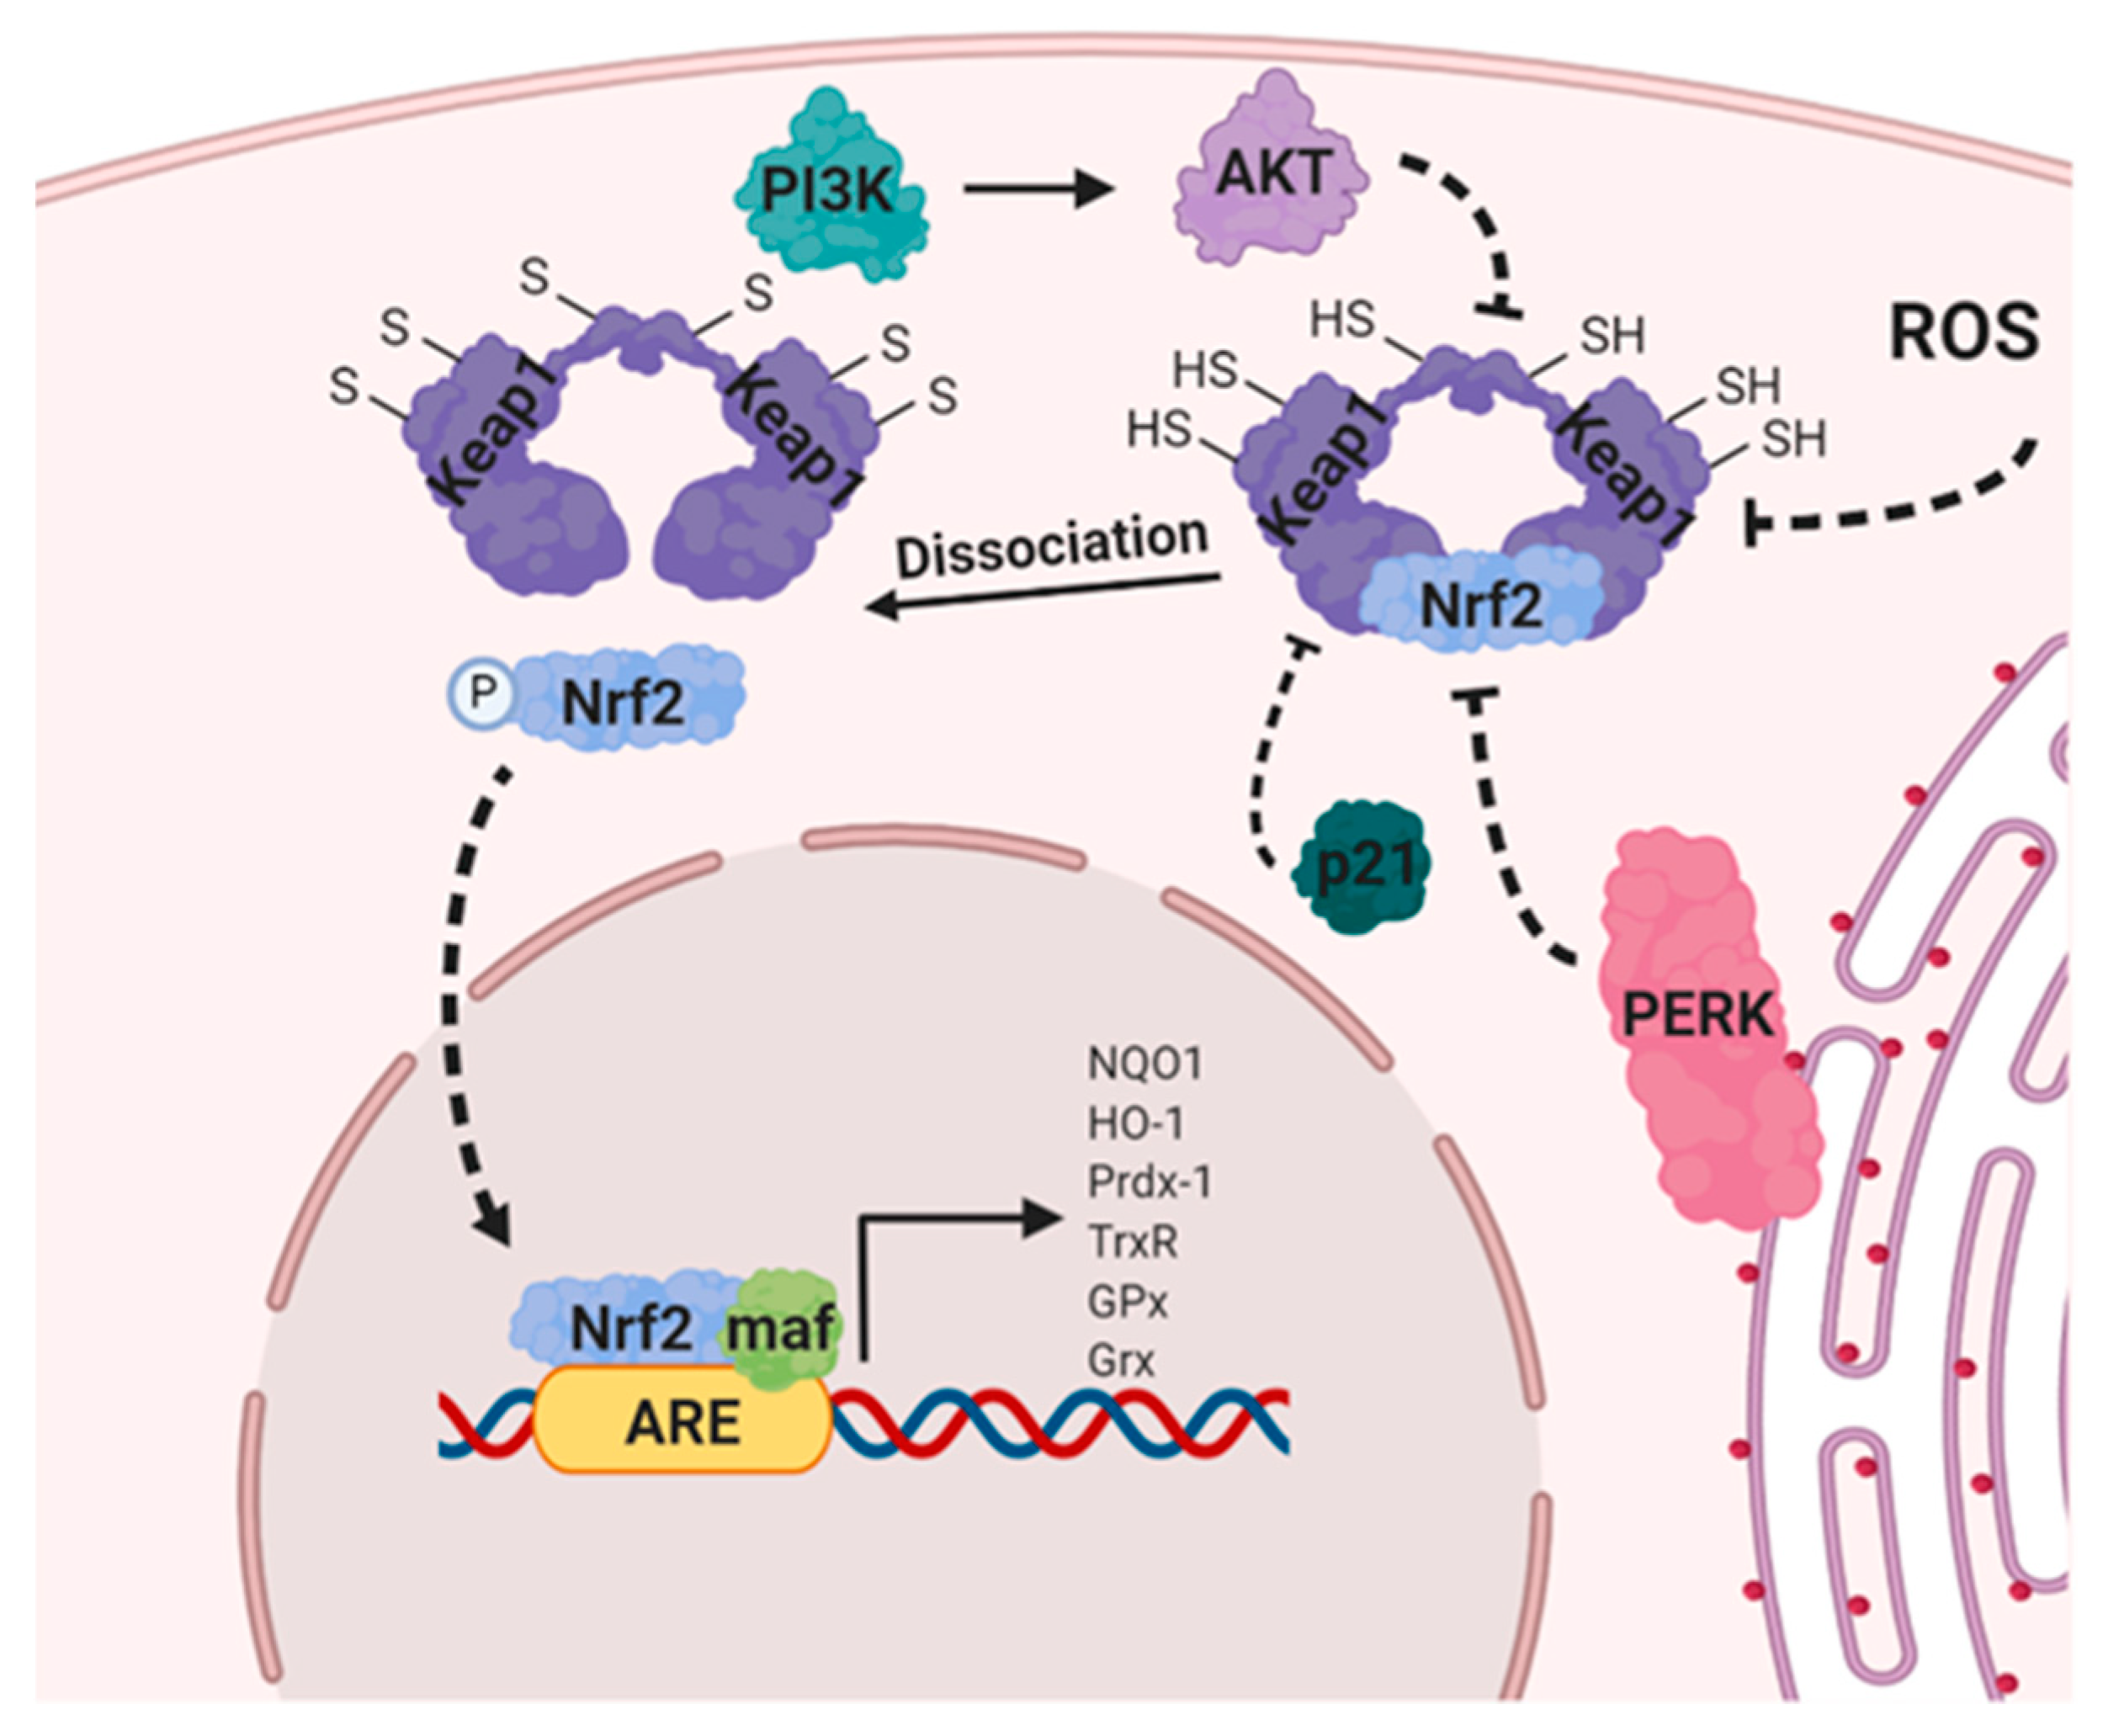
8.3. Nuclear Factor Erythroid 2-Related Factor 2 (NRF2)
9. Targeting ROS through Metabolic Modulators for the Treatment of Cancer
9.1. Orlistat
9.2. Biguandes (Metformin and Phenformin)
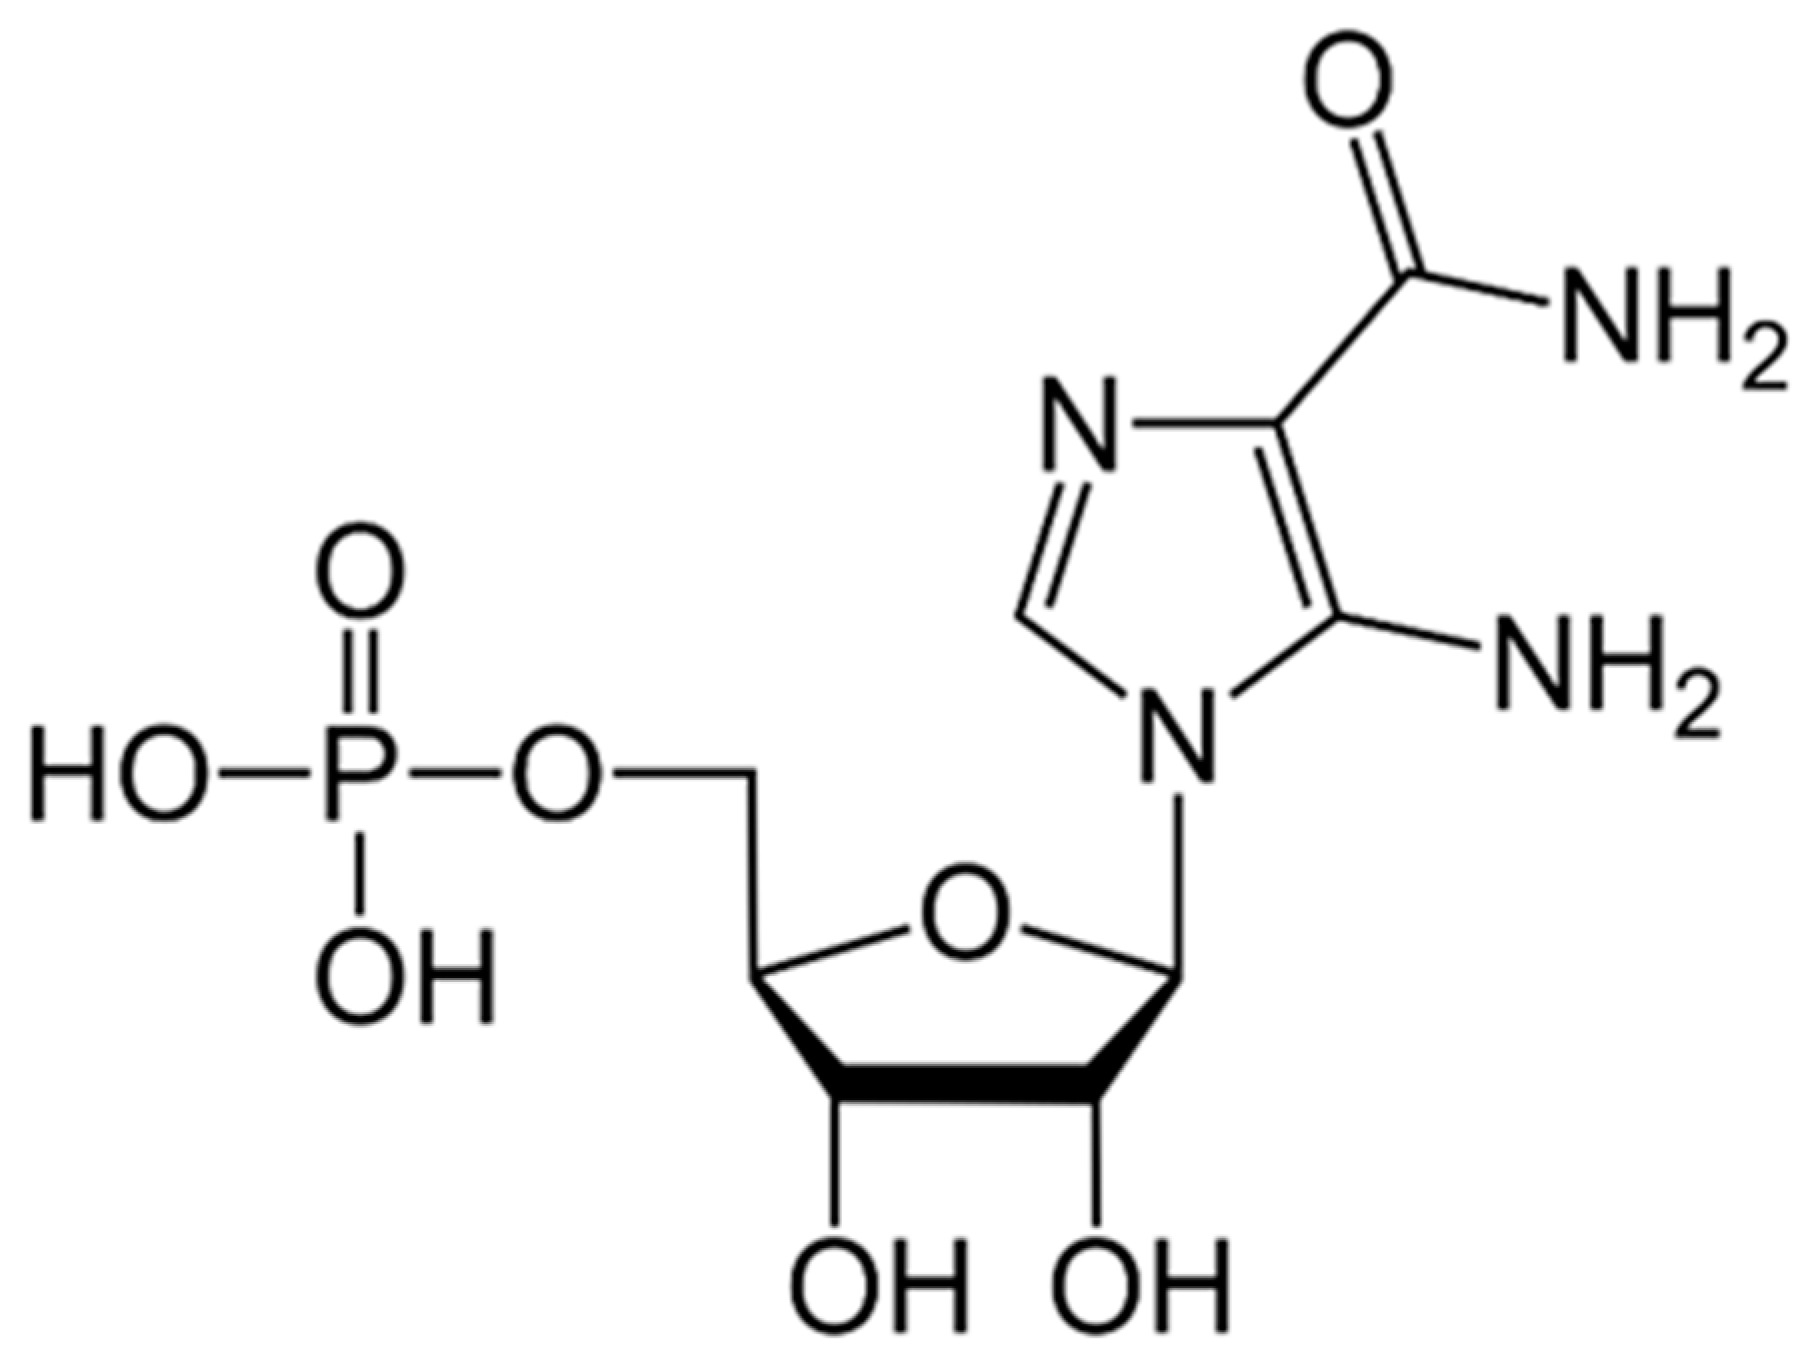
9.3. AICAR
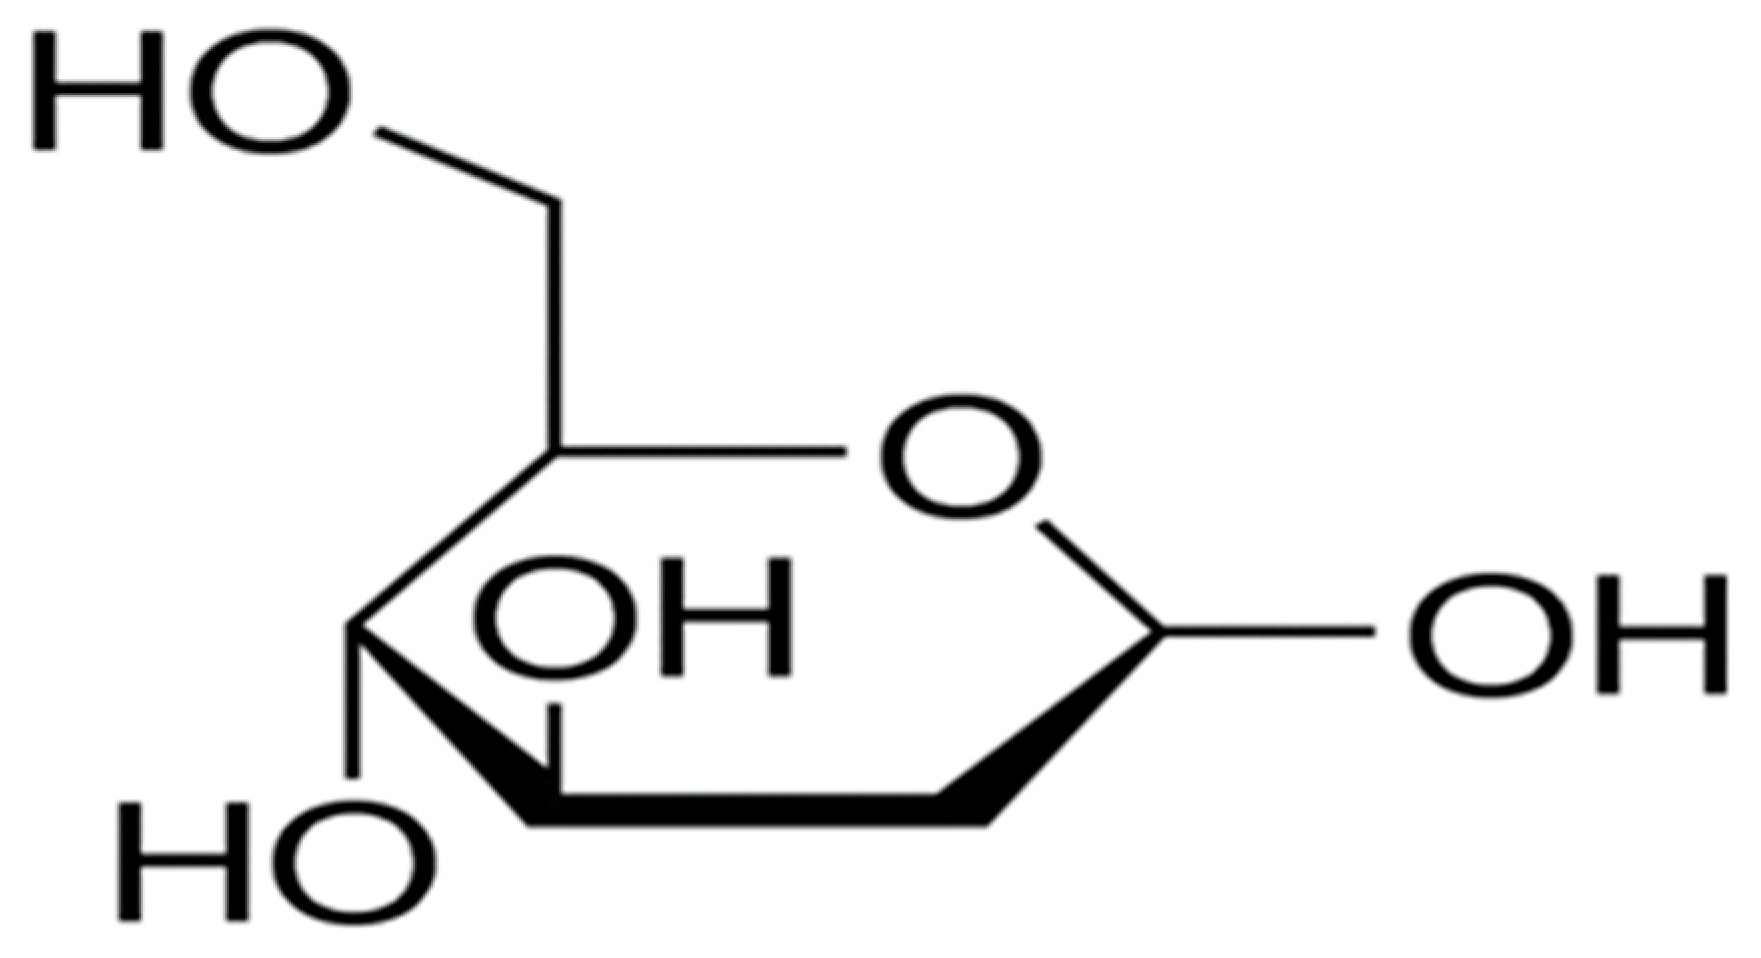
9.4. 2-Deoxyglucose (2DG)
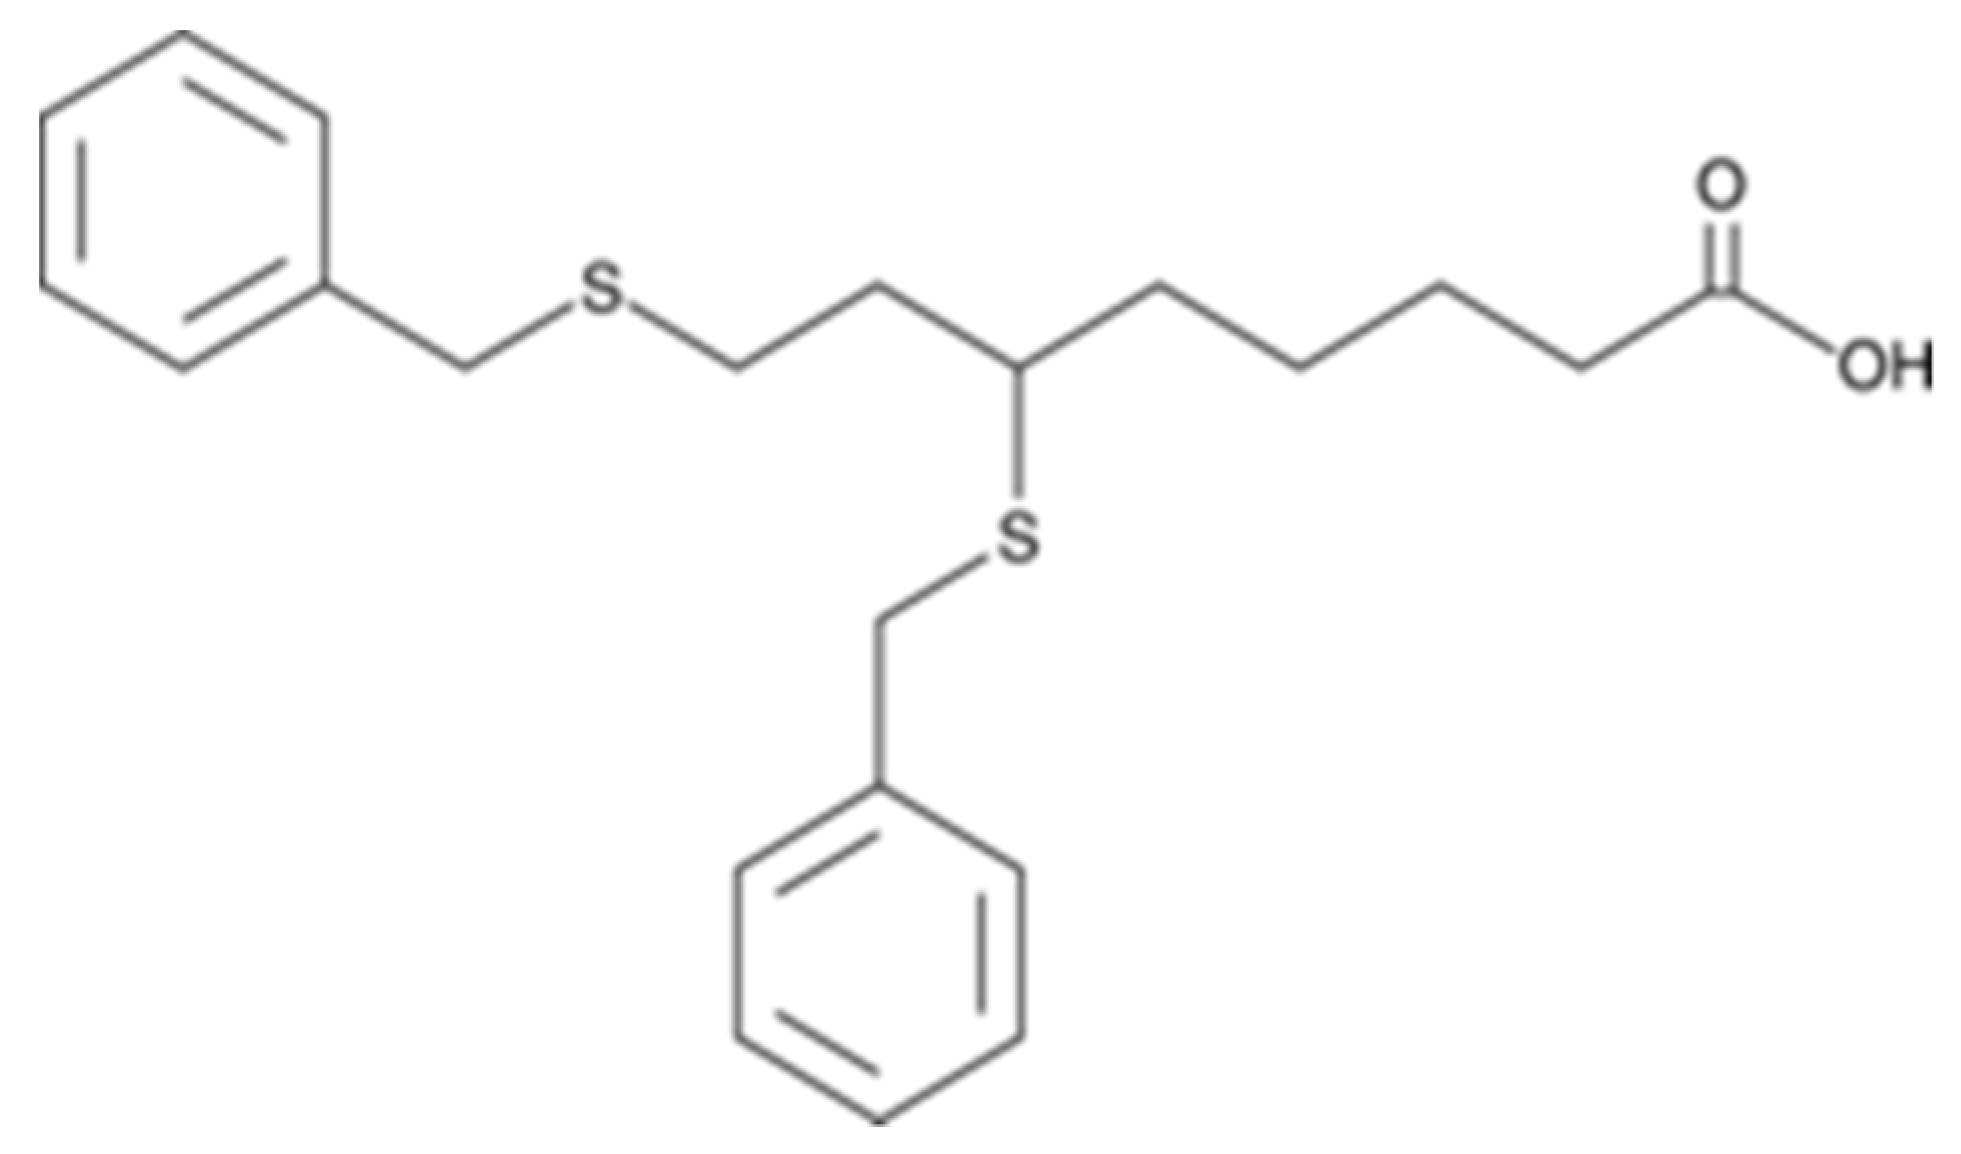
9.5. CPI-613
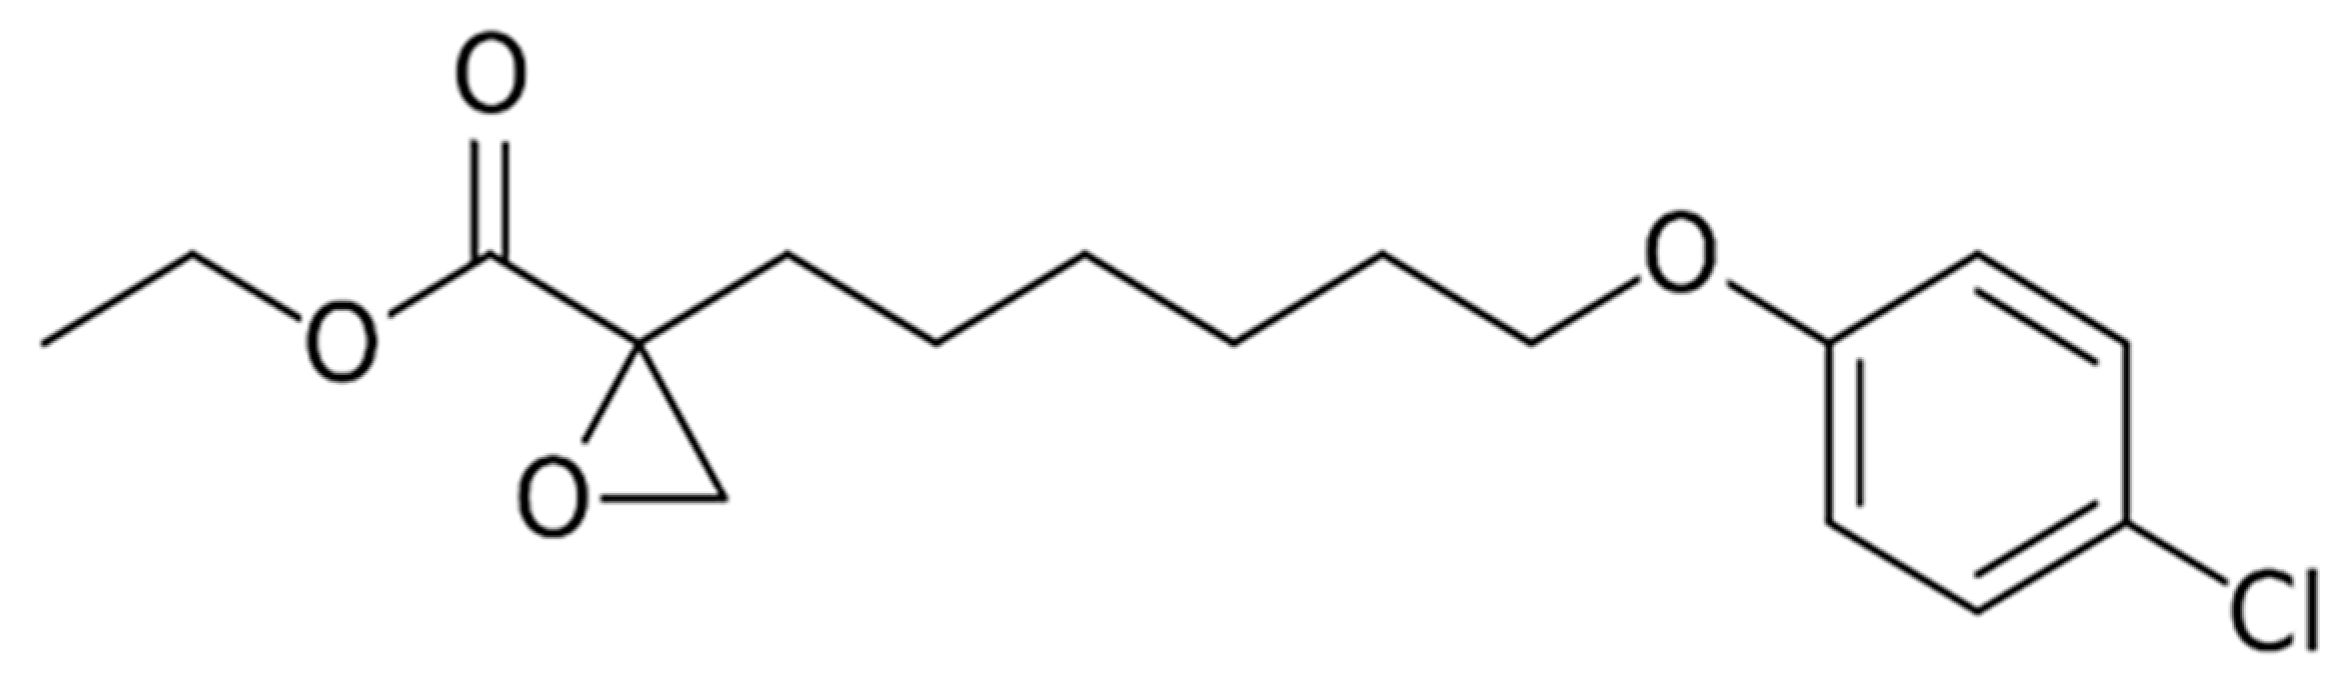
9.6. Etomoxir
10. Conclusion and Clinical Perspective:
Funding
Conflicts of Interest
References
- Sullivan, L.; Chandel, N.S. Mitochondrial reactive oxygen species and cancer. Cancer Metab. 2014, 2, 17. [Google Scholar] [CrossRef] [PubMed] [Green Version]
- Brieger, K.; Schiavone, S.; Miller, F.J.; Krause, K.-H. Reactive oxygen species: From health to disease. Swiss Med. Wkly. 2012, 142, 13659. [Google Scholar] [CrossRef] [PubMed]
- Parvez, S.; Long, M.J.C.; Poganik, J.R.; Aye, Y. Redox Signaling by Reactive Electrophiles and Oxidants. Chem. Rev. 2018, 118, 8798–8888. [Google Scholar] [CrossRef]
- Pizzino, G.; Irrera, N.; Bitto, A.; Pallio, G.; Mannino, F.; Arcoraci, V.; Aliquò, F.; Minutoli, L.; De Ponte, C.; D’Andrea, P.; et al. Cadmium-Induced Oxidative Stress Impairs Glycemic Control in Adolescents. Oxidative Med. Cell. Longev. 2017, 2017, 1–6. [Google Scholar] [CrossRef] [PubMed]
- Niccoli, S.; Boreham, D.R.; Phenix, C.P.; Lees, S.J. Non-radioactive 2-deoxy-2-fluoro-D-glucose inhibits glucose uptake in xenograft tumours and sensitizes HeLa cells to doxorubicin in vitro. PLoS ONE 2017, 12, e0187584. [Google Scholar] [CrossRef] [PubMed] [Green Version]
- Calvani, M.; Subbiani, A.; Vignoli, M.; Favre, C. Spotlight on ROS and beta3-Adrenoreceptors Fighting in Cancer Cells. Oxid. Med. Cell Longev. 2019, 2019, 6346529. [Google Scholar] [CrossRef] [PubMed] [Green Version]
- Winterbourn, C.C. Reconciling the chemistry and biology of reactive oxygen species. Nat. Methods 2008, 4, 278–286. [Google Scholar] [CrossRef]
- Winterbourn, C.C. The Biological Chemistry of Hydrogen Peroxide. Methods Enzymol. 2013, 528, 3–25. [Google Scholar] [CrossRef]
- Lancaster, J.R. Nitric oxide: A brief overview of chemical and physical properties relevant to therapeutic applications. Futur. Sci. OA 2015, 1, 59. [Google Scholar] [CrossRef]
- Trachootham, D.; Lu, W.; Ogasawara, M.A.; Valle, N.R.-D.; Huang, P. Redox Regulation of Cell Survival. Antioxidants Redox Signal. 2008, 10, 1343–1374. [Google Scholar] [CrossRef] [Green Version]
- Gorrini, C.; Harris, I.; Mak, T.W. Modulation of oxidative stress as an anticancer strategy. Nat. Rev. Drug Discov. 2013, 12, 931–947. [Google Scholar] [CrossRef] [PubMed]
- Liu, Y.; Fiskum, G.; Schubert, D. Generation of reactive oxygen species by the mitochondrial electron transport chain. J. Neurochem. 2002, 80, 780–787. [Google Scholar] [CrossRef] [PubMed]
- Meitzler, J.L.; Antony, S.; Wu, Y.; Juhasz, A.; Liu, H.; Jiang, G.; Lu, J.; Roy, K.; Doroshow, J.H. NADPH Oxidases: A Perspective on Reactive Oxygen Species Production in Tumor Biology. Antioxid. Redox Signal. 2014, 20, 2873–2889. [Google Scholar] [CrossRef] [PubMed] [Green Version]
- Bogeski, I.; Niemeyer, B.A. Redox Regulation of Ion Channels. Antioxid. Redox Signal. 2014, 21, 859–862. [Google Scholar] [CrossRef] [PubMed] [Green Version]
- Agarwal, A.; Gupta, S.; Sekhon, L.; Shah, R. Redox Considerations in Female Reproductive Function and Assisted Reproduction: From Molecular Mechanisms to Health Implications. Antioxid. Redox Signal. 2008, 10, 1375–1404. [Google Scholar] [CrossRef] [PubMed]
- Agarwal, A.; Bui, A.D. Oxidation-reduction potential as a new marker for oxidative stress: Correlation to male infertility. Investig. Clin. Urol. 2017, 58, 385–399. [Google Scholar] [CrossRef]
- Lu, J.; Wang, Z.; Cao, J.; Chen, Y.; Dong, Y. A novel and compact review on the role of oxidative stress in female reproduction. Reprod. Boil. Endocrinol. 2018, 16, 80. [Google Scholar] [CrossRef]
- Wink, D.A.; Hines, H.B.; Cheng, R.; Switzer, C.H.; Flores-Santana, W.; Vitek, M.P.; Ridnour, L.A.; Colton, C.A. Nitric oxide and redox mechanisms in the immune response. J. Leukoc. Boil. 2011, 89, 873–891. [Google Scholar] [CrossRef] [Green Version]
- Nauseef, W.M. How human neutrophils kill and degrade microbes: An integrated view. Immunol. Rev. 2007, 219, 88–102. [Google Scholar] [CrossRef]
- Gostner, J.M.; Becker, K.; Fuchs, D.; Sucher, R. Redox regulation of the immune response. Redox Rep. 2013, 18, 88–94. [Google Scholar] [CrossRef]
- Lorenzen, I.; Mullen, L.; Bekeschus, S.; Hanschmann, E.-M. Redox Regulation of Inflammatory Processes Is Enzymatically Controlled. Oxidative Med. Cell. Longev. 2017, 2017, 1–23. [Google Scholar] [CrossRef] [PubMed] [Green Version]
- Schatzman, S.; Culotta, V.C. Chemical Warfare at the Microorganismal Level: A Closer Look at the Superoxide Dismutase Enzymes of Pathogens. ACS Infect. Dis. 2018, 4, 893–903. [Google Scholar] [CrossRef] [PubMed]
- Diehn, M.; Cho, R.W.; Lobo, N.A.; Kalisky, T.; Dorie, M.J.; Kulp, A.N.; Qian, D.; Lam, J.S.; Ailles, L.E.; Wong, M.; et al. Association of reactive oxygen species levels and radioresistance in cancer stem cells. Nature 2009, 458, 780–783. [Google Scholar] [CrossRef] [PubMed]
- Saha, S.K.; Bin Lee, S.; Won, J.; Choi, H.Y.; Kim, K.; Yang, G.-M.; Dayem, A.A.; Cho, S.G. Correlation between Oxidative Stress, Nutrition, and Cancer Initiation. Int. J. Mol. Sci. 2017, 18, 1544. [Google Scholar] [CrossRef] [Green Version]
- Valko, M.; Rhodes, C.; Moncol, J.; Izakovic, M.; Mazur, M. Free radicals, metals and antioxidants in oxidative stress-induced cancer. Chem. Interact. 2006, 160, 1–40. [Google Scholar] [CrossRef]
- Valko, M.; Izakovic, M.; Mazúr, M.; Rhodes, C.J.; Telser, J. Role of oxygen radicals in DNA damage and cancer incidence. Mol. Cell. Biochem. 2004, 266, 37–56. [Google Scholar] [CrossRef]
- Sosa, V.; Moliné, T.; Somoza, R.; Paciucci, R.; Kondoh, H.; Lleonart, M.E. Oxidative stress and cancer: An overview. Ageing Res. Rev. 2013, 12, 376–390. [Google Scholar] [CrossRef]
- Chiang, A.C.; Massagué, J. Molecular Basis of Metastasis. N. Engl. J. Med. 2008, 359, 2814–2823. [Google Scholar] [CrossRef] [Green Version]
- Garrett, R.; Grisham, C.M. Biochemistry, 5th ed.; Brooks/Cole, Cengage Learning: Belmont, CA, USA, 2013; Chapter 18; pp. 535–560. [Google Scholar]
- Weinhouse, S.; Warburg, O.; Burk, D.; Schade, A.L. On Respiratory Impairment in Cancer Cells. Science 1956, 124, 267–272. [Google Scholar] [CrossRef]
- Warburg, O. On the Origin of Cancer Cells. Science 1956, 123, 309–314. [Google Scholar] [CrossRef]
- Warburg, O.; Wind, F.; Negelein, E. The Metabolism of Tumors in the Body. J. Gen. Physiol. 1927, 8, 519–530. [Google Scholar] [CrossRef] [PubMed] [Green Version]
- Kim, S.-Y. Cancer Energy Metabolism: Shutting Power off Cancer Factory. Biomol. Ther. 2018, 26, 39–44. [Google Scholar] [CrossRef] [PubMed] [Green Version]
- Panieri, E.; Santoro, M.M. ROS homeostasis and metabolism: A dangerous liason in cancer cells. Cell Death Dis. 2016, 7, e2253. [Google Scholar] [CrossRef] [PubMed]
- Cairns, R.A.; Harris, I.; Mak, T.W. Regulation of cancer cell metabolism. Nat. Rev. Cancer 2011, 11, 85–95. [Google Scholar] [CrossRef] [Green Version]
- Kroemer, G.; Pouysségur, J. Tumor Cell Metabolism: Cancer’s Achilles’ Heel. Cancer Cell 2008, 13, 472–482. [Google Scholar] [CrossRef]
- Carracedo, A.; Cantley, L.C.; Pandolfi, P.P. Cancer metabolism: Fatty acid oxidation in the limelight. Nat. Rev. Cancer 2013, 13, 227–232. [Google Scholar] [CrossRef]
- Jeon, S.-M.; Hay, N. The dark face of AMPK as an essential tumor promoter. Cell. Logist. 2012, 2, 197–202. [Google Scholar] [CrossRef] [Green Version]
- Kuo, C.-Y.; Ann, D.K. When fats commit crimes: Fatty acid metabolism, cancer stemness and therapeutic resistance. Cancer Commun. 2018, 38, 47. [Google Scholar] [CrossRef] [Green Version]
- Zaugg, K.; Yao, Y.; Reilly, P.T.; Kannan, K.; Kiarash, R.; Mason, J.; Huang, P.; Sawyer, S.K.; Fuerth, B.; Faubert, B.; et al. Carnitine palmitoyltransferase 1C promotes cell survival and tumor growth under conditions of metabolic stress. Genome Res. 2011, 25, 1041–1051. [Google Scholar] [CrossRef] [Green Version]
- Shi, J.; Fu, H.; Jia, Z.; He, K.; Fu, L.; Wang, W. High Expression of CPT1A Predicts Adverse Outcomes: A Potential Therapeutic Target for Acute Myeloid Leukemia. EBioMedicine 2016, 14, 55–64. [Google Scholar] [CrossRef] [Green Version]
- Samudio, I.; Konopleva, M. Targeting leukemia’s "fatty tooth". Blood 2015, 126, 1874–1875. [Google Scholar] [CrossRef] [PubMed] [Green Version]
- Samudio, I.; Harmancey, R.; Fiegl, M.; Kantarjian, H.; Konopleva, M.; Korchin, B.; Kaluarachchi, K.; Bornmann, W.; Duvvuri, S.; Taegtmeyer, H.; et al. Pharmacologic inhibition of fatty acid oxidation sensitizes human leukemia cells to apoptosis induction. J. Clin. Investig. 2009, 120, 142–156. [Google Scholar] [CrossRef] [PubMed] [Green Version]
- Ma, Y.; Wang, W.; Devarakonda, T.; Zhou, H.; Wang, X.-Y.; Salloum, F.N.; Spiegel, S.; Fang, X. Functional analysis of molecular and pharmacological modulators of mitochondrial fatty acid oxidation. Sci. Rep. 2020, 10, 1450–1513. [Google Scholar] [CrossRef] [PubMed]
- Senni, N.; Savall, M.; Cabrerizo Granados, D.; Alves-Guerra, M.C.; Sartor, C.; Lagoutte, I.; Gougelet, A.; Terris, B.; Gilgenkrantz, H.; Perret, C.; et al. beta-catenin-activated hepatocellular carcinomas are addicted to fatty acids. Gut 2019, 68, 322–334. [Google Scholar] [CrossRef]
- Cheng, S.; Wang, G.; Wang, Y.; Cai, L.; Qian, K.; Ju, L.; Liu, X.; Xiao, Y.; Wang, X. Fatty acid oxidation inhibitor etomoxir suppresses tumor progression and induces cell cycle arrest via PPARgamma-mediated pathway in bladder cancer. Clin. Sci. (Lond.) 2019, 133, 1745–1758. [Google Scholar] [CrossRef] [Green Version]
- Yao, C.H.; Liu, G.-Y.; Wang, R.; Moon, S.H.; Gross, R.W.; Patti, G.J. Identifying off-target effects of etomoxir reveals that carnitine palmitoyltransferase I is essential for cancer cell proliferation independent of beta-oxidation. PLoS Biol. 2018, 16, e2003782. [Google Scholar] [CrossRef] [Green Version]
- Yajun, C.; Chen, Y.; Xiaosa, L.; Xiao, W.; Chen, J.; Wang, Z.; Bin, X. Loss of Sun2 promotes the progression of prostate cancer by regulating fatty acid oxidation. Oncotarget 2017, 8, 89620–89630. [Google Scholar] [CrossRef] [Green Version]
- Patra, K.C.; Hay, N. The pentose phosphate pathway and cancer. Trends Biochem. Sci. 2014, 39, 347–354. [Google Scholar] [CrossRef] [Green Version]
- Riganti, C.; Gazzano, E.; Polimeni, M.; Aldieri, E.; Ghigo, D. The pentose phosphate pathway: An antioxidant defense and a crossroad in tumor cell fate. Free. Radic. Boil. Med. 2012, 53, 421–436. [Google Scholar] [CrossRef] [PubMed]
- D’Alessandro, A.; Cervia, D.; Catalani, E.; Gevi, F.; Zolla, L.; Casini, G. Protective effects of the neuropeptides PACAP, substance P and the somatostatin analogue octreotide in retinal ischemia: A metabolomic analysis. Mol. BioSyst. 2014, 10, 1290. [Google Scholar] [CrossRef]
- Lucarelli, G.; Galleggiante, V.; Rutigliano, M.; Sanguedolce, F.; Cagiano, S.; Bufo, P.; Lastilla, G.; Maiorano, E.; Ribatti, D.; Giglio, A.; et al. Metabolomic profile of glycolysis and the pentose phosphate pathway identifies the central role of glucose-6-phosphate dehydrogenase in clear cell-renal cell carcinoma. Oncotarget 2015, 6, 13371–13386. [Google Scholar] [CrossRef] [PubMed] [Green Version]
- Yin, L.; Kufe, T.; Avigan, D.; Kufe, N. Targeting MUC1-C is synergistic with bortezomib in downregulating TIGAR and inducing ROS-mediated myeloma cell death. Blood 2014, 123, 2997–3006. [Google Scholar] [CrossRef] [PubMed] [Green Version]
- Yang, L.; Venneti, S.; Nagarath, D. Glutaminolysis: A Hallmark of Cancer Metabolism. Annu. Rev. Biomed. Eng. 2017, 19, 163–194. [Google Scholar] [CrossRef] [PubMed]
- Izaki, S.; Goto, H.; Yokota, S. Increased chemosensitivity and elevated reactive oxygen species are mediated by glutathione reduction in glutamine deprived neuroblastoma cells. J. Cancer Res. Clin. Oncol. 2008, 134, 761–768. [Google Scholar] [CrossRef] [PubMed]
- Xiang, L.; Mou, J.; Shao, B.; Wei, Y.; Liang, H.; Takano, N.; Semenza, G.L.; Xie, G. Glutaminase 1 expression in colorectal cancer cells is induced by hypoxia and required for tumor growth, invasion, and metastatic colonization. Cell Death Dis. 2019, 10, 40. [Google Scholar] [CrossRef] [PubMed] [Green Version]
- Seltzer, M.J.; Bennett, B.D.; Joshi, A.D.; Gao, P.; Thomas, A.G.; Ferraris, D.; Tsukamoto, T.; Rojas, C.J.; Slusher, B.S.; Rabinowitz, J.D.; et al. Inhibition of glutaminase preferentially slows growth of glioma cells with mutant IDH1. Cancer Res. 2010, 70, 8981–8987. [Google Scholar] [CrossRef] [Green Version]
- Emadi, A.; Jun, S.A.; Tsukamoto, T.; Fathi, A.T.; Minden, M.D.; Dang, C.V. Inhibition of glutaminase selectively suppresses the growth of primary acute myeloid leukemia cells with IDH mutations. Exp. Hematol. 2014, 42, 247–251. [Google Scholar] [CrossRef]
- Li, T.; Le, A. Glutamine Metabolism in Cancer. Adv. Exp. Med. Biol. 2018, 13–32. [Google Scholar] [CrossRef]
- Vanhove, K.; Derveaux, E.; Graulus, G.-J.; Mesotten, L.; Thomeer, M.; Noben, J.-P.; Guedens, W.; Adriaensens, P. Glutamine Addiction and Therapeutic Strategies in Lung Cancer. Int. J. Mol. Sci. 2019, 20, 252. [Google Scholar] [CrossRef] [Green Version]
- Li, L.; Fath, M.A.; Scarbrough, P.M.; Watson, W.H.; Spitz, D.R. Combined inhibition of glycolysis, the pentose cycle, and thioredoxin metabolism selectively increases cytotoxicity and oxidative stress in human breast and prostate cancer. Redox Boil. 2014, 4, 127–135. [Google Scholar] [CrossRef] [Green Version]
- Locasale, J.W. Serine, glycine and one-carbon units: Cancer metabolism in full circle. Nat. Rev. Cancer 2013, 13, 572–583. [Google Scholar] [CrossRef] [PubMed] [Green Version]
- Rosenzweig, A.; Blenis, J.; Gomes, A.P. Beyond the Warburg Effect: How Do Cancer Cells Regulate One-Carbon Metabolism? Front. Cell Dev. Boil. 2018, 6. [Google Scholar] [CrossRef] [PubMed]
- DeNicola, M.G.; Cantley, L.C. Cancer’s Fuel Choice: New Flavors for a Picky Eater. Mol. Cell 2015, 60, 514–523. [Google Scholar] [CrossRef] [PubMed] [Green Version]
- DeNicola, G.M.; Chen, P.-H.; Mullarky, E.; Sudderth, J.A.; Hu, Z.; Wu, D.; Tang, H.; Xie, Y.; Asara, J.M.; Huffman, K.E.; et al. NRF2 regulates serine biosynthesis in non–small cell lung cancer. Nat. Genet. 2015, 47, 1475–1481. [Google Scholar] [CrossRef] [Green Version]
- Cheng, Z.; Ristow, M. Mitochondria and Metabolic Homeostasis. Antioxid. Redox Signal. 2013, 19, 240–242. [Google Scholar] [CrossRef]
- Ristow, M. Oxidative metabolism in cancer growth. Curr. Opin. Clin. Nutr. Metab. Care 2006, 9, 339–345. [Google Scholar] [CrossRef]
- Wen, X.; Wu, J.; Wang, F.; Liu, B.; Huang, C.; Wei, Y. Deconvoluting the role of reactive oxygen species and autophagy in human diseases. Free. Radic. Boil. Med. 2013, 65, 402–410. [Google Scholar] [CrossRef]
- Marzetti, E.; Calvani, R.; Cesari, M.; Buford, T.W.; Lorenzi, M.; Behnke, B.J.; Leeuwenburgh, C. Mitochondrial dysfunction and sarcopenia of aging: From signaling pathways to clinical trials. Int. J. Biochem. Cell Boil. 2013, 45, 2288–2301. [Google Scholar] [CrossRef] [Green Version]
- Fath, M.A.; Diers, A.R.; Aykin-Burns, N.; Simons, A.L.; Hua, L.; Spitz, D.R. Mitochondrial electron transport chain blockers enhance 2-deoxy-D-glucose induced oxidative stress and cell killing in human colon carcinoma cells. Cancer Boil. Ther. 2009, 8, 1228–1236. [Google Scholar] [CrossRef] [Green Version]
- Badur, M.G.; Metallo, C.M. Reverse engineering the cancer metabolic network using flux analysis to understand drivers of human disease. Metab. Eng. 2017, 45, 95–108. [Google Scholar] [CrossRef]
- Chang, C.-H.; Qiu, J.; O’Sullivan, D.; Buck, M.; Noguchi, T.; Curtis, J.D.; Chen, Q.; Gindin, M.; Gubin, M.M.; Van Der Windt, G.J.; et al. Metabolic Competition in the Tumor Microenvironment Is a Driver of Cancer Progression. Cell 2015, 162, 1229–1241. [Google Scholar] [CrossRef] [PubMed] [Green Version]
- Keating, S.E.; Zaiatz-Bittencourt, V.; Loftus, R.M.; Keane, C.; Brennan, K.; Finlay, D.K.; Gardiner, C.M. Metabolic Reprogramming Supports IFN-gamma Production by CD56bright NK Cells. J. Immunol. 2016, 196, 2552–2560. [Google Scholar] [CrossRef] [PubMed] [Green Version]
- O’Neill, L.A.J.; Pearce, E.J. Immunometabolism governs dendritic cell and macrophage function. J. Cell Boil. 2016, 212, 2121. [Google Scholar] [CrossRef] [Green Version]
- Liemburg-Apers, D.; Willems, P.H.; Koopman, W.J.; Grefte, S. Interactions between mitochondrial reactive oxygen species and cellular glucose metabolism. Arch. Toxicol. 2015, 89, 1209–1226. [Google Scholar] [CrossRef] [Green Version]
- Naczki, C.; John, B.; Patel, C.; Lafferty, A.; Ghoneum, A.; Afify, H.; White, M.; Davis, A.; Jin, G.; Kridel, S.J.; et al. SPARC Inhibits Metabolic Plasticity in Ovarian Cancer. Cancers 2018, 10, 385. [Google Scholar] [CrossRef] [PubMed] [Green Version]
- Said, N.; Frierson, H.F.; Sanchez-Carbayo, M.; Brekken, R.A.; Theodorescu, D. Loss of SPARC in bladder cancer enhances carcinogenesis and progression. J. Clin. Investig. 2013, 123, 751–766. [Google Scholar] [CrossRef] [Green Version]
- Serbulea, V.; Deweese, D.; Leitinger, N. The effect of oxidized phospholipids on phenotypic polarization and function of macrophages. Free. Radic. Boil. Med. 2017, 111, 156–168. [Google Scholar] [CrossRef]
- Renner, K.; Singer, K.; Koehl, G.E.; Geissler, E.K.; Peter, K.; Siska, P.J.; Kreutz, M. Metabolic Hallmarks of Tumor and Immune Cells in the Tumor Microenvironment. Front. Immunol. 2017, 8, 248. [Google Scholar] [CrossRef] [Green Version]
- Colegio, O.R.; Chu, N.-Q.; Szabo, A.L.; Chu, T.; Rhebergen, A.M.; Jairam, V.; Cyrus, N.; Brokowski, C.E.; Eisenbarth, S.C.; Phillips, G.M.; et al. Functional polarization of tumour-associated macrophages by tumour-derived lactic acid. Nature 2014, 513, 559–563. [Google Scholar] [CrossRef]
- Ohashi, T.; Akazawa, T.; Aoki, M.; Kuze, B.; Mizuta, K.; Ito, Y.; Inoue, N. Dichloroacetate improves immune dysfunction caused by tumor-secreted lactic acid and increases antitumor immunoreactivity. Int. J. Cancer 2013, 133, 1107–1118. [Google Scholar] [CrossRef]
- Ho, P.-C.; Bihuniak, J.D.; MacIntyre, A.; Staron, M.; Liu, X.; Amezquita, R.; Tsui, Y.-C.; Cui, G.; Micevic, G.; Perales, J.C.; et al. Phosphoenolpyruvate Is a Metabolic Checkpoint of Anti-tumor T Cell Responses. Cell 2015, 162, 1217–1228. [Google Scholar] [CrossRef] [PubMed] [Green Version]
- Freitas, C.M.T.; Johnson, D.K.; Weber, K.S. T Cell Calcium Signaling Regulation by the Co-Receptor CD5. Int. J. Mol. Sci. 2018, 19, 1295. [Google Scholar] [CrossRef] [PubMed] [Green Version]
- Devadas, S.; Zaritskaya, L.; Rhee, S.G.; Oberley, L.; Williams, M.S. Discrete generation of superoxide and hydrogen peroxide by T cell receptor stimulation: Selective regulation of mitogen-activated protein kinase activation and fas ligand expression. J. Exp. Med. 2002, 195, 59–70. [Google Scholar] [CrossRef] [PubMed] [Green Version]
- Kamiński, M.M.; Roth, D.; Sass, S.; Sauer, S.W.; Krammer, P.H.; Gülow, K. Manganese superoxide dismutase: A regulator of T cell activation-induced oxidative signaling and cell death. Biochim. et Biophys. Acta (BBA)-Bioenerg. 2012, 1823, 1041–1052. [Google Scholar] [CrossRef] [Green Version]
- Kamiński, M.M.; Sauer, S.W.; Kaminski, M.; Opp, S.; Ruppert, T.; Grigaravicius, P.; Grudnik, P.; Gröne, H.-J.; Krammer, P.H.; Gülow, K. T cell Activation Is Driven by an ADP-Dependent Glucokinase Linking Enhanced Glycolysis with Mitochondrial Reactive Oxygen Species Generation. Cell Rep. 2012, 2, 1300–1315. [Google Scholar] [CrossRef] [Green Version]
- Scharping, N.E.; Menk, A.V.; Moreci, R.S.; Whetstone, R.D.; Dadey, R.E.; Watkins, S.C.; Ferris, R.L.; Delgoffe, G.M. The Tumor Microenvironment Represses T Cell Mitochondrial Biogenesis to Drive Intratumoral T Cell Metabolic Insufficiency and Dysfunction. Immunity 2016, 45, 374–388. [Google Scholar] [CrossRef] [Green Version]
- Molon, B.; Ugel, S.; Del Pozzo, F.; Soldani, C.; Zilio, S.; Avella, D.; De Palma, A.; Mauri, P.; Monegal, A.; Rescigno, M.; et al. Chemokine nitration prevents intratumoral infiltration of antigen-specific T cells. J. Exp. Med. 2011, 208, 1949–1962. [Google Scholar] [CrossRef]
- Kosti, P.; Maher, J.; Arnold, J. Perspectives on Chimeric Antigen Receptor T-Cell Immunotherapy for Solid Tumors. Front. Immunol. 2018, 9, 1104. [Google Scholar] [CrossRef] [Green Version]
- Ohl, K.; Fragoulis, A.; Klemm, P.; Baumeister, J.; Klock, W.; Verjans, E.; Böll, S.; Möllmann, J.; Lehrke, M.; Costa, I.; et al. Nrf2 Is a Central Regulator of Metabolic Reprogramming of Myeloid-Derived Suppressor Cells in Steady State and Sepsis. Front. Immunol. 2018, 9, 1552. [Google Scholar] [CrossRef] [Green Version]
- Ohl, K.; Tenbrock, K. Reactive Oxygen Species as Regulators of MDSC-Mediated Immune Suppression. Front. Immunol. 2018, 9, 2499. [Google Scholar] [CrossRef] [Green Version]
- Terrén, I.; Orrantia, A.; Vitallé, J.; Zenarruzabeitia, O.; Borrego, F. NK Cell Metabolism and Tumor Microenvironment. Front. Immunol. 2019, 10, 2278. [Google Scholar] [CrossRef]
- Jin, F.; Wu, Z.; Hu, X.; Zhang, J.; Gao, Z.; Han, X.; Qin, J.; Li, C.; Wang, Y. The PI3K/Akt/GSK-3beta/ROS/eIF2B pathway promotes breast cancer growth and metastasis via suppression of NK cell cytotoxicity and tumor cell susceptibility. Cancer Biol. Med. 2019, 16, 38–54. [Google Scholar] [PubMed] [Green Version]
- Paardekooper, L.; Vos, W.; Bogaart, G.V.D. Oxygen in the tumor microenvironment: Effects on dendritic cell function. Oncotarget 2019, 10, 883–896. [Google Scholar] [CrossRef] [PubMed]
- Klysz, D.; Tai, X.; Robert, P.A.; Craveiro, M.; Cretenet, G.; Oburoglu, L.; Mongellaz, C.; Floess, S.; Fritz, V.; Matias, M.I.; et al. Glutamine-dependent α-ketoglutarate production regulates the balance between T helper 1 cell and regulatory T cell generation. Sci. Signal. 2015, 8, ra97. [Google Scholar] [CrossRef] [PubMed] [Green Version]
- Ma, E.H.; Bantug, G.; Griss, T.; Condotta, S.; Johnson, R.M.; Samborska, B.; Mainolfi, N.; Suri, V.; Guak, H.; Balmer, M.L.; et al. Serine Is an Essential Metabolite for Effector T Cell Expansion. Cell Metab. 2017, 25, 345–357. [Google Scholar] [CrossRef] [PubMed]
- Swamy, M.; Pathak, S.; Grzes, K.M.; Damerow, S.; Sinclair, L.V.; Van Aalten, D.M.F.; Cantrell, D.A. Glucose and glutamine fuel protein O-GlcNAcylation to control T cell self-renewal and malignancy. Nat. Immunol. 2016, 17, 712–720. [Google Scholar] [CrossRef] [Green Version]
- Scharping, N.E.; Delgoffe, G.M. Tumor Microenvironment Metabolism: A New Checkpoint for Anti-Tumor Immunity. Vaccines 2016, 4, 46. [Google Scholar] [CrossRef] [Green Version]
- Tkachev, V.; Goodell, S.; Opipari, A.W.; Hao, L.-Y.; Franchi, L.; Glick, G.D.; Ferrara, J.L.M.; Byersdorfer, C. Programmed death-1 controls T cell survival by regulating oxidative metabolism. J. Immunol. 2015, 194, 5789–5800. [Google Scholar] [CrossRef]
- Zelenay, S.; Van Der Veen, A.G.; Böttcher, J.P.; Snelgrove, K.J.; Rogers, N.; Acton, S.E.; Chakravarty, P.; Girotti, M.R.; Marais, R.; Quezada, S.A.; et al. Cyclooxygenase-Dependent Tumor Growth through Evasion of Immunity. Cell 2015, 162, 1257–1270. [Google Scholar] [CrossRef] [Green Version]
- Munn, D.H.; Mellor, A.L. Indoleamine 2,3-dioxygenase and tumor-induced tolerance. J. Clin. Investig. 2007, 117, 1147–1154. [Google Scholar] [CrossRef] [Green Version]
- Munn, D.H.; Mellor, A.L. IDO in the Tumor Microenvironment: Inflammation, Counter-Regulation, and Tolerance. Trends Immunol. 2016, 37, 193–207. [Google Scholar] [CrossRef] [PubMed] [Green Version]
- Cheng, J.; Zhao, L.; Zhang, Y.; Qin, Y.; Guan, Y.; Zhang, T.; Liu, C.; Zhou, J. Understanding the Mechanisms of Resistance to CAR T-Cell Therapy in Malignancies. Front. Oncol. 2019, 9, 1237. [Google Scholar] [CrossRef] [PubMed] [Green Version]
- Ninomiya, S.; Narala, N.; Huye, L.; Yagyu, S.; Savoldo, B.; Dotti, G.; Heslop, H.E.; Brenner, M.K.; Rooney, C.M.; Ramos, C.A. Tumor indoleamine 2,3-dioxygenase (IDO) inhibits CD19-CAR T cells and is downregulated by lymphodepleting drugs. Blood 2015, 125, 3905–3916. [Google Scholar] [CrossRef] [PubMed] [Green Version]
- Masoud, G.N.; Li, W. HIF-1α pathway: Role, regulation and intervention for cancer therapy. Acta Pharm. Sin. B 2015, 5, 378–389. [Google Scholar] [CrossRef] [PubMed] [Green Version]
- Wang, G.L.; Jiang, B.-H.; Rue, E.A.; Semenza, G.L. Hypoxia-inducible factor 1 is a basic-helix-loop-helix-PAS heterodimer regulated by cellular O2 tension. Proc. Natl. Acad. Sci. USA 1995, 92, 5510–5514. [Google Scholar] [CrossRef] [PubMed] [Green Version]
- Wang, G.L.; Semenza, G.L. Purification and Characterization of Hypoxia-inducible Factor 1. J. Boil. Chem. 1995, 270, 1230–1237. [Google Scholar] [CrossRef] [Green Version]
- Kaelin, W.G. The VHL Tumor Suppressor Gene: Insights into Oxygen Sensing and Cancer. Trans. Am. Clin. Clim. Assoc. 2017, 128, 298–307. [Google Scholar]
- Guzy, R.D.; Hoyos, B.; Robin, E.; Chen, H.; Liu, L.; Mansfield, K.D.; Simon, M.C.; Hämmerling, U.; Schumacker, P.T. Mitochondrial complex III is required for hypoxia-induced ROS production and cellular oxygen sensing. Cell Metab. 2005, 1, 401–408. [Google Scholar] [CrossRef] [Green Version]
- Guzy, R.D.; Schumacker, P.T. Oxygen sensing by mitochondria at complex III: The paradox of increased reactive oxygen species during hypoxia. Exp. Physiol. 2006, 91, 807–819. [Google Scholar] [CrossRef]
- Guzy, R.D.; Mack, M.M.; Schumacker, P.T. Mitochondrial Complex III is Required for Hypoxia-Induced ROS Production and Gene Transcription in Yeast. Antioxid. Redox Signal. 2007, 9, 1317–1328. [Google Scholar] [CrossRef]
- Gao, P.; Zhang, H.; Dinavahi, R.; Li, F.; Xiang, Y.; Raman, V.; Bhujwalla, Z.M.; Felsher, D.W.; Cheng, L.; Pevsner, J.; et al. HIF-Dependent Antitumorigenic Effect of Antioxidants In Vivo. Cancer Cell 2007, 12, 230–238. [Google Scholar] [CrossRef] [PubMed] [Green Version]
- Calvani, M.; Comito, G.; Giannoni, E.; Chiarugi, P. Time-Dependent Stabilization of Hypoxia Inducible Factor-1α by Different Intracellular Sources of Reactive Oxygen Species. PLoS ONE 2012, 7, e38388. [Google Scholar] [CrossRef] [PubMed]
- Calvani, M.; Trisciuoglio, D.; Bergamaschi, C.; Shoemaker, R.H.; Melillo, G. Differential Involvement of Vascular Endothelial Growth Factor in the Survival of Hypoxic Colon Cancer Cells. Cancer Res. 2008, 68, 285–291. [Google Scholar] [CrossRef] [PubMed] [Green Version]
- Calvani, M.; Rapisarda, A.; Uranchimeg, B.; Shoemaker, R.H.; Melillo, G. Hypoxic induction of an HIF-1α–dependent bFGF autocrine loop drives angiogenesis in human endothelial cells. Blood 2006, 107, 2705–2712. [Google Scholar] [CrossRef]
- Comito, G.; Calvani, M.; Giannoni, E.; Bianchini, F.; Calorini, L.; Torre, E.; Migliore, C.; Giordano, S.; Chiarugi, P. HIF-1α stabilization by mitochondrial ROS promotes Met-dependent invasive growth and vasculogenic mimicry in melanoma cells. Free. Radic. Boil. Med. 2011, 51, 893–904. [Google Scholar] [CrossRef]
- Patten, D.A.; LaFleur, V.N.; Robitaille, G.A.; Chan, D.A.; Giaccia, A.J.; Richard, D.E. Hypoxia-inducible Factor-1 Activation in Nonhypoxic Conditions: The Essential Role of Mitochondrial-derived Reactive Oxygen Species. Mol. Boil. Cell 2010, 21, 3247–3257. [Google Scholar] [CrossRef] [Green Version]
- Lee, H.-Y.; Lee, T.; Lee, N.; Yang, E.G.; Lee, C.; Lee, J.; Moon, E.-Y.; Ha, J.; Park, H. Src activates HIF-1α not through direct phosphorylation of HIF-1α-specific prolyl-4 hydroxylase 2 but through activation of the NADPH oxidase/Rac pathway. Carcinogenesis 2011, 32, 703–712. [Google Scholar] [CrossRef] [Green Version]
- Kotake-Nara, E.; Saida, K. Characterization of CoCl2-induced reactive oxygen species (ROS): Inductions of neurite outgrowth and endothelin-2/vasoactive intestinal contractor in PC12 cells by CoCl2 are ROS dependent, but those by MnCl2 are not. Neurosci. Lett. 2007, 422, 223–227. [Google Scholar] [CrossRef]
- Kotake-Nara, E.; Saida, K. Endothelin-2/Vasoactive Intestinal Contractor: Regulation of Expression via Reactive Oxygen Species Induced by CoCl22, and Biological Activities Including Neurite Outgrowth in PC12 Cells. Sci. World J. 2006, 6, 176–186. [Google Scholar] [CrossRef]
- Kotake-Nara, E.; Takizawa, S.; Quan, J.; Wang, H.; Saida, K. Cobalt chloride induces neurite outgrowth in rat pheochromocytoma PC-12 cells through regulation of endothelin-2/vasoactive intestinal contractor. J. Neurosci. Res. 2005, 81, 563–571. [Google Scholar] [CrossRef]
- Semenza, G.L. HIF-1 mediates metabolic responses to intratumoral hypoxia and oncogenic mutations. J. Clin. Investig. 2013, 123, 3664–3671. [Google Scholar] [CrossRef] [PubMed] [Green Version]
- Semenza, G.L. HIF-1 mediates the Warburg effect in clear cell renal carcinoma. J. Bioenerg. Biomembr. 2007, 39, 231–234. [Google Scholar] [CrossRef] [PubMed]
- Semenza, G.L. Hypoxia-Inducible Factor 1 (HIF-1) Pathway. Sci. STKE 2007, 2007, cm8. [Google Scholar] [CrossRef] [PubMed]
- Semenza, G.L. HIF-1: Upstream and downstream of cancer metabolism. Curr. Opin. Genet. Dev. 2009, 20, 51–56. [Google Scholar] [CrossRef] [PubMed] [Green Version]
- Fridman, I.A.; Ponomarenko, E.A.; Makarova, O.V.; Postovalova, E.A.; Zolotova, N.A.; Khochanskiy, D.N.; Mkhitarov, V.A.; Tsvetkov, I.S.; Kosyreva, A.M. Morphological Characteristic of Melanoma B16 Progression in C57BL/6 Mice with High and Low Resistance to Hypoxia. Bull. Exp. Boil. Med. 2020, 168, 390–394. [Google Scholar] [CrossRef]
- Vaupel, P.; Multhoff, G. Fatal Alliance of Hypoxia-/HIF-1alpha-Driven Microenvironmental Traits Promoting Cancer Progression. Adv. Exp. Med. Biol. 2020, 1232, 169–176. [Google Scholar]
- Tirpe, A.A.; Gulei, D.; Ciortea, S.M.; Crivii, C.; Berindan-Neagoe, I. Hypoxia: Overview on Hypoxia-Mediated Mechanisms with a Focus on the Role of HIF Genes. Int. J. Mol. Sci. 2019, 20, 6140. [Google Scholar] [CrossRef] [Green Version]
- Nagao, A.; Kobayashi, M.; Koyasu, S.; Chow, C.; Harada, H. HIF-1-Dependent Reprogramming of Glucose Metabolic Pathway of Cancer Cells and Its Therapeutic Significance. Int. J. Mol. Sci. 2019, 20, 238. [Google Scholar] [CrossRef] [Green Version]
- Al Tameemi, W.; Dale, T.P.; Al-Jumaily, R.M.K.; Forsyth, N.R. Hypoxia-Modified Cancer Cell Metabolism. Front. Cell Dev. Boil. 2019, 7, 4. [Google Scholar] [CrossRef] [Green Version]
- Meng, L.; Cheng, Y.; Tong, X.; Gan, S.; Ding, Y.; Zhang, Y.; Wang, C.; Xu, L.; Zhu, Y.; Wu, J.; et al. Tumor Oxygenation and Hypoxia Inducible Factor-1 Functional Inhibition via a Reactive Oxygen Species Responsive Nanoplatform for Enhancing Radiation Therapy and Abscopal Effects. ACS Nano 2018, 12, 8308–8322. [Google Scholar] [CrossRef]
- Shao, J.-B.; Li, Z.; Zhang, N.; Yang, F.; Gao, W.; Sun, Z.-G. Hypoxia-inducible factor 1α in combination with vascular endothelial growth factor could predict the prognosis of postoperative patients with oesophageal squamous cell cancer. Pol. J. Pathol. 2019, 70, 84–90. [Google Scholar] [CrossRef] [PubMed]
- Choi, K.-S.; Bae, M.-K.; Jeong, J.-W.; Moon, H.-E.; Kim, K.-W. Hypoxia-induced angiogenesis during carcinogenesis. J. Biochem. Mol. Biol. 2003, 36, 120–127. [Google Scholar] [CrossRef] [PubMed]
- Brahimi-Horn, M.C.; Pouysségur, J. Harnessing the hypoxia-inducible factor in cancer and ischemic disease. Biochem. Pharmacol. 2007, 73, 450–457. [Google Scholar] [CrossRef] [PubMed]
- Shaw, R.J. Glucose metabolism and cancer. Curr. Opin. Cell Boil. 2006, 18, 598–608. [Google Scholar] [CrossRef] [PubMed]
- Puigserver, P. Tissue-specific regulation of metabolic pathways through the transcriptional coactivator PGC1-α. Int. J. Obes. 2005, 29, S5–S9. [Google Scholar] [CrossRef] [PubMed] [Green Version]
- Puigserver, P.; Rhee, J.; Lin, J.; Wu, Z.; Yoon, J.C.; Zhang, C.Y.; Krauss, S.; Mootha, V.K.; Lowell, B.B.; Spiegelman, B.M. Cytokine stimulation of energy expenditure through p38 MAP kinase activation of PPARgamma coactivator-1. Mol. Cell 2001, 8, 971–982. [Google Scholar] [CrossRef]
- Puigserver, P.; Spiegelman, B.M. Peroxisome Proliferator-Activated Receptor-γ Coactivator 1α (PGC-1α): Transcriptional Coactivator and Metabolic Regulator. Endocr. Rev. 2003, 24, 78–90. [Google Scholar] [CrossRef] [Green Version]
- Bost, F.; Kaminski, L. The metabolic modulator PGC-1α in cancer. Am. J. Cancer Res. 2019, 9, 198–211. [Google Scholar]
- Torrano, V.; Valcarcel, L.; Cortazar, A.R.; Liu, X.; Urosevic, J.; Castillo-Martin, M.; Fernández-Ruiz, S.; Morciano, G.; Caro-Maldonado, A.; Guiu, M.; et al. The metabolic co-regulator PGC1α suppresses prostate cancer metastasis. Nature 2016, 18, 645–656. [Google Scholar] [CrossRef] [Green Version]
- Sancho, P.; Burgos-Ramos, E.; Tavera, A.; Bou Kheir, T.; Jagust, P.; Schoenhals, M.; Barneda, D.; Sellers, K.; Campos-Olivas, R.; Graña, O.; et al. MYC/PGC-1α Balance Determines the Metabolic Phenotype and Plasticity of Pancreatic Cancer Stem Cells. Cell Metab. 2015, 22, 590–605. [Google Scholar] [CrossRef] [Green Version]
- LeBleu, V.S.; O’Connell, J.T.; Herrera, K.N.G.; Wikman, H.; Pantel, K.; Haigis, M.C.; De Carvalho, F.M.; Damascena, A.; Chinen, L.; Rocha, R.M.; et al. PGC-1α mediates mitochondrial biogenesis and oxidative phosphorylation in cancer cells to promote metastasis. Nature 2014, 16, 992–1003. [Google Scholar] [CrossRef] [Green Version]
- Vazquez, F.; Lim, J.-H.; Chim, H.; Bhalla, K.; Girnun, G.; Pierce, K.; Clish, C.; Granter, S.R.; Widlund, H.R.; Spiegelman, B.M.; et al. PGC1α expression defines a subset of human melanoma tumors with increased mitochondrial capacity and resistance to oxidative stress. Cancer Cell 2013, 23, 287–301. [Google Scholar] [CrossRef] [PubMed] [Green Version]
- Luo, C.; Widlund, H.R.; Puigserver, P. PGC-1 Coactivators: Shepherding the Mitochondrial Biogenesis of Tumors. Trends Cancer 2016, 2, 619–631. [Google Scholar] [CrossRef] [PubMed] [Green Version]
- Piskounova, E.; Agathocleous, M.; Murphy, M.M.; Hu, Z.; Huddlestun, S.E.; Zhao, Z.; Leitch, A.M.; Johnson, T.M.; DeBerardinis, R.J.; Morrison, S.J. Oxidative stress inhibits distant metastasis by human melanoma cells. Nature 2015, 527, 186–191. [Google Scholar] [CrossRef] [Green Version]
- Haq, R.; Shoag, J.; Andreu-Pérez, P.; Yokoyama, S.; Edelman, H.; Rowe, G.C.; Frederick, D.T.; Hurley, A.D.; Nellore, A.; Kung, A.; et al. Oncogenic BRAF regulates oxidative metabolism via PGC1α and MITF. Cancer Cell 2013, 23, 302–315. [Google Scholar] [CrossRef] [Green Version]
- Vega, R.B.; Huss, J.M.; Kelly, D.P. The Coactivator PGC-1 Cooperates with Peroxisome Proliferator-Activated Receptor α in Transcriptional Control of Nuclear Genes Encoding Mitochondrial Fatty Acid Oxidation Enzymes. Mol. Cell. Boil. 2000, 20, 1868–1876. [Google Scholar] [CrossRef] [Green Version]
- Andrzejewski, S.; Klimcakova, E.; Johnson, R.M.; Tabariès, S.; Annis, M.G.; McGuirk, S.; Northey, J.J.; Chenard, V.; Sriram, U.; Papadopoli, D.J.; et al. PGC-1α Promotes Breast Cancer Metastasis and Confers Bioenergetic Flexibility against Metabolic Drugs. Cell Metab. 2017, 26, 778–787.e5. [Google Scholar] [CrossRef]
- Andrzejewski, S.; Siegel, P.M.; St-Pierre, J. Metabolic Profiles Associated with Metformin Efficacy in Cancer. Front. Endocrinol. 2018, 9, 372. [Google Scholar] [CrossRef] [Green Version]
- Deblois, G.; Smith, H.W.; Tam, I.S.; Gravel, S.P.; Caron, M.; Savage, P.; Labbé, D.P.; Bégin, L.R.; Tremblay, M.L.; Park, M.; et al. ERRalpha mediates metabolic adaptations driving lapatinib resistance in breast cancer. Nat. Commun. 2016, 7, 12156. [Google Scholar] [CrossRef]
- Tennakoon, J.B.; Shi, Y.; Han, J.J.; Tsouko, E.; White, M.A.; Burns, A.R.; Zhang, A.; Xia, X.; Ilkayeva, O.R.; Xin, L.; et al. Androgens regulate prostate cancer cell growth via an AMPK-PGC-1α-mediated metabolic switch. Oncogene 2013, 33, 5251–5261. [Google Scholar] [CrossRef] [Green Version]
- Jung, B.-J.; Yoo, H.-S.; Shin, S.; Park, Y.-J.; Jeon, S.-M. Dysregulation of NRF2 in Cancer: From Molecular Mechanisms to Therapeutic Opportunities. Biomol. Ther. 2018, 26, 57–68. [Google Scholar] [CrossRef] [PubMed] [Green Version]
- Leboeuf, S.E.; Wu, W.L.; Karakousi, T.R.; Karadal, B.; Jackson, S.R.; Davidson, S.M.; Wong, K.-K.; Koralov, S.B.; Sayin, V.I.; Papagiannakopoulos, T. Activation of Oxidative Stress Response in Cancer Generates a Druggable Dependency on Exogenous Non-essential Amino Acids. Cell Metab. 2020, 31, 339–350.e4. [Google Scholar] [CrossRef] [PubMed]
- Joo, M.S.; Kim, W.D.; Lee, K.Y.; Kim, J.H.; Koo, J.H.; Kim, S.G. AMPK Facilitates Nuclear Accumulation of Nrf2 by Phosphorylating at Serine 550. Mol. Cell. Boil. 2016, 36, 1931–1942. [Google Scholar] [CrossRef] [PubMed] [Green Version]
- Ramos-Gomez, M.; Kwak, M.K.; Dolan, P.; Itoh, K.; Tamamoto, M.; Talalay, P.; Kensler, T.W. Sensitivity to carcinogenesis is increased and chemoprotective efficacy of enzyme inducers is lost in nrf2 transcription factor-deficient mice. Proc. Natl. Acad. Sci. USA 2001, 98, 3410–3415. [Google Scholar] [CrossRef] [PubMed] [Green Version]
- Xu, D.; Xu, M.; Jeong, S.; Qian, Y.; Wu, H.; Xia, Q.; Kong, X. The Role of Nrf2 in Liver Disease: Novel Molecular Mechanisms and Therapeutic Approaches. Front. Pharmacol. 2019, 9, 1428. [Google Scholar] [CrossRef] [PubMed] [Green Version]
- Iida, K. Nrf2 Is Essential for the Chemopreventive Efficacy of Oltipraz against Urinary Bladder Carcinogenesis. Cancer Res. 2004, 64, 6424–6431. [Google Scholar] [CrossRef] [Green Version]
- Cioccoloni, G.; Aquino, A.; Notarnicola, M.; Caruso, M.G.; Bonmassar, E.; Zonfrillo, M.; Caporali, S.; Faraoni, I.; Villivà, C.; Fuggetta, M.P.; et al. Fatty acid synthase inhibitor orlistat impairs cell growth and down-regulates PD-L1 expression of a human T-cell leukemia line. J. Chemother. 2019, 32, 30–40. [Google Scholar] [CrossRef]
- De Almeida, L.Y.; Mariano, F.S.; Bastos, D.C.; Cavassani, K.A.; Raphelson, J.; Mariano, V.S.; Agostini, M.; Moreira, F.S.; Coletta, R.D.; Mattos-Graner, R.O.; et al. The antimetastatic activity of orlistat is accompanied by an antitumoral immune response in mouse melanoma. Cancer Chemother. Pharmacol. 2019, 85, 321–330. [Google Scholar] [CrossRef]
- Schcolnik-Cabrera, A. A combination of inhibitors of glycolysis, glutaminolysis and de novo fatty acid synthesis decrease the expression of chemokines in human colon cancer cells. Oncol. Lett. 2019, 18, 6909–6916. [Google Scholar] [CrossRef] [Green Version]
- Czumaj, A.; Zabielska, J.; Pakiet, A.; Mika, A.; Rostkowska, O.; Makarewicz, W.; Kobiela, J.; Sledzinski, T.; Stelmanska, E. In Vivo Effectiveness of Orlistat in the Suppression of Human Colorectal Cancer Cell Proliferation. Anticancer. Res. 2019, 39, 3815–3822. [Google Scholar] [CrossRef]
- Chuang, H.Y.; Lee, Y.P.; Lin, W.C.; Lin, Y.H.; Hwang, J.J. Fatty Acid Inhibition Sensitizes Androgen-Dependent and -Independent Prostate Cancer to Radiotherapy via FASN/NF-kappaB Pathway. Sci. Rep. 2019, 9, 13284. [Google Scholar] [CrossRef] [PubMed] [Green Version]
- You, B.-J.; Chen, L.-Y.; Hsu, P.-H.; Sung, P.-H.; Hung, Y.-C.; Lee, H.-Z. Orlistat Displays Antitumor Activity and Enhances the Efficacy of Paclitaxel in Human Hepatoma Hep3B Cells. Chem. Res. Toxicol. 2019, 32, 255–264. [Google Scholar] [CrossRef] [PubMed]
- Saleh, A.; Elfayoumi, H.M.; Youns, M.; Barakat, W. Rutin and orlistat produce antitumor effects via antioxidant and apoptotic actions. Naunyn-Schmiedeberg’s Arch. Pharmacol. 2018, 392, 165–175. [Google Scholar] [CrossRef]
- Kridel, S.J.; Houghton, P.J.; Germain, G.S.; Harwood, F.C.; Schuetz, J.D.; Stewart, C.F.; Buchdunger, E.; Traxler, P. Orlistat Is a Novel Inhibitor of Fatty Acid Synthase with Antitumor Activity. Cancer Res. 2004, 64, 2070–2075. [Google Scholar] [CrossRef] [PubMed] [Green Version]
- Souchek, J.; Davis, A.L.; Hill, T.K.; Holmes, M.B.; Qi, B.; Singh, P.K.; Kridel, S.J.; Mohs, A.M. Combination Treatment with Orlistat-Containing Nanoparticles and Taxanes Is Synergistic and Enhances Microtubule Stability in Taxane-Resistant Prostate Cancer Cells. Mol. Cancer Ther. 2017, 16, 1819–1830. [Google Scholar] [CrossRef] [PubMed] [Green Version]
- Pemble, C.W.; Johnson, L.C.; Kridel, S.J.; Lowther, W.T. Crystal structure of the thioesterase domain of human fatty acid synthase inhibited by Orlistat. Nat. Struct. Mol. Boil. 2007, 14, 704–709. [Google Scholar] [CrossRef]
- Yendapally, R.; Sikazwe, D.; Kim, S.S.; Ramsinghani, S.; Fraser-Spears, R.; Witte, A.P.; La-Viola, B. A review of phenformin, metformin, and imeglimin. Drug Dev. Res. 2020. [Google Scholar] [CrossRef]
- Kankotia, S.; Stacpoole, P.W. Dichloroacetate and cancer: New home for an orphan drug? Biochim. et Biophys. Acta (BBA)-Bioenerg. 2014, 1846, 617–629. [Google Scholar] [CrossRef]
- Rubiño, M.E.G.; Carrillo, E.; Alcalá, G.R.; Dominguez-Martin, A.; Marchal, J.A.; Tassi, H.B.; Martín, D. Phenformin as an Anticancer Agent: Challenges and Prospects. Int. J. Mol. Sci. 2019, 20, 3316. [Google Scholar] [CrossRef] [Green Version]
- Pecinová, A.; Drahota, Z.; Kovalcikova, J.; Kovarova, N.; Pecina, P.; Alan, L.; Zima, M.; Houstek, J.; Mráček, T. Pleiotropic Effects of Biguanides on Mitochondrial Reactive Oxygen Species Production. Oxidative Med. Cell. Longev. 2017, 2017, 1–11. [Google Scholar] [CrossRef] [Green Version]
- Hardie, D.G. The LKB1-AMPK pathway-friend or foe in cancer? Cancer Cell 2013, 23, 131–132. [Google Scholar] [CrossRef] [PubMed] [Green Version]
- Hardie, D.G. AMPK: A Target for Drugs and Natural Products with Effects on Both Diabetes and Cancer. Diabetes 2013, 62, 2164–2172. [Google Scholar] [CrossRef] [PubMed] [Green Version]
- Hardie, D.G.; Ross, F.A.; Hawley, S.A. AMP-activated protein kinase: A target for drugs both ancient and modern. Chem. Boil. 2012, 19, 1222–1236. [Google Scholar] [CrossRef] [Green Version]
- Kalender, A.; Selvaraj, A.; Kim, S.Y.; Gulati, P.; Brûlé, S.; Viollet, B.; Kemp, B.E.; Bardeesy, N.; Dennis, P.; Schlager, J.J.; et al. Metformin, Independent of AMPK, Inhibits mTORC1 in a Rag GTPase-Dependent Manner. Cell Metab. 2010, 11, 390–401. [Google Scholar] [CrossRef] [PubMed] [Green Version]
- Vincent, E.E.; Coelho, P.P.; Blagih, J.; Griss, T.; Viollet, B.; Jones, R.G. Differential effects of AMPK agonists on cell growth and metabolism. Oncogene 2014, 34, 3627–3639. [Google Scholar] [CrossRef] [Green Version]
- Petrachi, T.; Romagnani, A.; Albini, A.; Longo, C.; Argenziano, G.; Grisendi, G.; Dominici, M.; Ciarrocchi, A.; Dallaglio, K. Therapeutic potential of the metabolic modulator phenformin in targeting the stem cell compartment in melanoma. Oncotarget 2016, 8, 6914–6928. [Google Scholar] [CrossRef] [Green Version]
- Guo, Z.; Zhao, M.; Howard, E.W.; Zhao, Q.; Parris, A.B.; Ma, Z.; Yang, X. Phenformin inhibits growth and epithelial-mesenchymal transition of ErbB2-overexpressing breast cancer cells through targeting the IGF1R pathway. Oncotarget 2017, 8, 60342–60357. [Google Scholar] [CrossRef] [Green Version]
- Geoghegan, F.; Chadderton, N.; Farrar, G.J.; Zisterer, D.; Porter, R. Direct effects of phenformin on metabolism/bioenergetics and viability of SH-SY5Y neuroblastoma cells. Oncol. Lett. 2017, 14, 6298–6306. [Google Scholar] [CrossRef] [Green Version]
- Khan, H.; Anshu, A.; Prasad, A.; Roy, S.; Jeffery, J.; Kittipongdaja, W.; Yang, D.T.; Schieke, S.M. Metabolic Rewiring in Response to Biguanides Is Mediated by mROS/HIF-1a in Malignant Lymphocytes. Cell Rep. 2019, 29, 3009–3018.e4. [Google Scholar] [CrossRef] [Green Version]
- Lea, M.A.; Kim, H.; Desbordes, C. Effects of Biguanides on Growth and Glycolysis of Bladder and Colon Cancer Cells. Anticancer. Res. 2018, 38, 5003–5011. [Google Scholar] [CrossRef]
- Huang, Y.; Zhou, S.; He, C.; Deng, J.; Tao, T.; Su, Q.; Darko, K.O.; Peng, M.; Yang, X. Phenformin alone or combined with gefitinib inhibits bladder cancer via AMPK and EGFR pathways. Cancer Commun. 2018, 38, 50. [Google Scholar] [CrossRef] [Green Version]
- Zhou, S.; Xu, L.; Cao, M.; Wang, Z.; Xiao, D.; Xu, S.; Deng, J.; Hu, X.; He, C.; Tao, T.; et al. Anticancer properties of novel pyrazole-containing biguanide derivatives with activating the adenosine monophosphate-activated protein kinase signaling pathway. Arch. der Pharm. 2019, 352, e1900075. [Google Scholar] [CrossRef] [PubMed]
- Peng, M.; Deng, J.; Zhou, S.; Xiao, D.; Long, J.; Zhang, N.; He, C.; Mo, M.; Yang, X. Dual Inhibition of Pirarubicin-Induced AKT and ERK Activations by Phenformin Sensitively Suppresses Bladder Cancer Growth. Front. Pharmacol. 2019, 10, 1159. [Google Scholar] [CrossRef] [PubMed]
- Rae, C.; Mairs, R.J. AMPK activation by AICAR sensitizes prostate cancer cells to radiotherapy. Oncotarget 2019, 10, 749–759. [Google Scholar] [CrossRef]
- Dembitz, V.; Tomic, B.; Kodvanj, I.; Simon, J.A.; Bedalov, A.; Visnjic, D. The ribonucleoside AICAr induces differentiation of myeloid leukemia by activating the ATR/Chk1 via pyrimidine depletion. J. Boil. Chem. 2019, 294, 15257–15270. [Google Scholar] [CrossRef] [PubMed] [Green Version]
- Su, C.-C.; Hsieh, K.-L.; Liu, P.-L.; Yeh, H.-C.; Huang, S.-P.; Fang, S.-H.; Cheng, W.-C.; Huang, S.; Chiu, F.-Y.; Lin, I.-L.; et al. AICAR Induces Apoptosis and Inhibits Migration and Invasion in Prostate Cancer Cells Through an AMPK/mTOR-Dependent Pathway. Int. J. Mol. Sci. 2019, 20, 1647. [Google Scholar] [CrossRef] [PubMed] [Green Version]
- Mukhopadhyay, S.; Chatterjee, A.; Kogan, D.; Patel, D.; Foster, D.A. 5-Aminoimidazole-4-carboxamide-1-beta-4-ribofuranoside (AICAR) enhances the efficacy of rapamycin in human cancer cells. Cell Cycle 2015, 14, 3331–3339. [Google Scholar] [CrossRef] [PubMed] [Green Version]
- Guan, T.-J.; Qin, F.-J.; Du, J.-H.; Geng, L.; Zhang, Y.; Li, M. AICAR inhibits proliferation and induced S-phase arrest, and promotes apoptosis in CaSki cells. Acta Pharmacol. Sin. 2007, 28, 1984–1990. [Google Scholar] [CrossRef] [Green Version]
- Vakana, E.; Altman, J.K.; Glaser, H.; Donato, N.J.; Platanias, L.C. Antileukemic effects of AMPK activators on BCR-ABL–expressing cells. Blood 2011, 118, 6399–6402. [Google Scholar] [CrossRef] [Green Version]
- Platanias, L.C.; Vakana, E. AMPK in BCR-ABL expressing leukemias. Regulatory effects and therapeutic implications. Oncotarget 2011, 2, 1322–1328. [Google Scholar] [CrossRef] [Green Version]
- Sengupta, T.K.; Leclerc, G.M.; Hsieh-Kinser, T.T.; Leclerc, G.J.; Singh, I.; Barredo, J.C. Cytotoxic effect of 5-aminoimidazole-4-carboxamide-1-beta-4-ribofuranoside (AICAR) on childhood acute lymphoblastic leukemia (ALL) cells: Implication for targeted therapy. Mol. Cancer 2007, 6, 46. [Google Scholar] [CrossRef] [PubMed] [Green Version]
- Wang, Y.; Cao, F.; Wang, Y.; Yu, J.; Jia, B.-L. Silencing of SAA1 inhibits palmitate- or high-fat diet induced insulin resistance through suppression of the NF-kappaB pathway. Mol. Med. 2019, 25, 17. [Google Scholar] [CrossRef] [PubMed] [Green Version]
- Aft, R.; Zhang, F. Chemosensitizing and cytotoxic effects of 2-deoxy-D-glucose on breast cancer cells. J. Cancer Res. Ther. 2009, 5, 41. [Google Scholar] [CrossRef] [PubMed]
- Lin, X.; Zhang, F.; Bradbury, C.M.; Kaushal, A.; Li, L.; Spitz, D.R.; Aft, R.L.; Gius, D. 2-Deoxy-D-glucose-induced cytotoxicity and radiosensitization in tumor cells is mediated via disruptions in thiol metabolism. Cancer Res. 2003, 63, 3413–3417. [Google Scholar]
- Bénéteau, M.; Zunino, B.; Jacquin, M.A.; Meynet, O.; Chiche, J.; Pradelli, L.A.; Marchetti, S.; Cornille, A.; Carles, M.; Ricci, J.-E. Combination of glycolysis inhibition with chemotherapy results in an antitumor immune response. Proc. Natl. Acad. Sci. USA 2012, 109, 20071–20076. [Google Scholar] [CrossRef] [Green Version]
- Reyes, R.; Wani, N.; Ghoshal, K.; Jacob, S.T.; Motiwala, T. Sorafenib and 2-Deoxyglucose Synergistically Inhibit Proliferation of Both Sorafenib-Sensitive and -Resistant HCC Cells by Inhibiting ATP Production. Gene Expr. 2016, 17, 129–140. [Google Scholar] [CrossRef] [Green Version]
- Tomizawa, M.; Shinozaki, F.; Motoyoshi, Y.; Sugiyama, T.; Yamamoto, S.; Ishige, N. 2-Deoxyglucose and sorafenib synergistically suppress the proliferation and motility of hepatocellular carcinoma cells. Oncol. Lett. 2016, 13, 800–804. [Google Scholar] [CrossRef] [Green Version]
- Gerogianni, I.; Pitaraki, E.; Jagirdar, R.M.; Kouliou, O.; Giannakou, L.; Giannopoulos, S.; Papazoglou, E.; Hatzoglou, C.; Gourgoulianis, K.I.; Zarogiannis, S.G. 2-Deoxy-glucose Enhances the Effect of Cisplatin and Pemetrexed in Reducing Malignant Pleural Mesothelioma Cell Proliferation But Not Spheroid Growth. Anticancer. Res. 2019, 39, 3809–3814. [Google Scholar] [CrossRef]
- Zhang, N.; Li, J.; Wang, F.; Hu, J.; Wang, S.; Sun, Y. 2-Deoxy-D-glucose targeting of glucose metabolism in cancer cells as a potential therapy. Cancer Lett. 2014, 355, 176–183. [Google Scholar] [CrossRef]
- Aft, R.L.; Zhang, F.W.; Gius, D. Evaluation of 2-deoxy-D-glucose as a chemotherapeutic agent: Mechanism of cell death. Br. J. Cancer 2002, 87, 805–812. [Google Scholar] [CrossRef] [Green Version]
- Merchan, J.R.; Kovacs, K.; Railsback, J.W.; Kurtoglu, M.; Jing, Y.; Piña, Y.; Gao, N.; Murray, T.G.; Lehrman, M.A.; Lampidis, T.J. Antiangiogenic Activity of 2-Deoxy-D-Glucose. PLoS ONE 2010, 5, 13699. [Google Scholar] [CrossRef] [PubMed] [Green Version]
- Islamian, J.P.; Aghaee, F.; Farajollahi, A.; Baradaran, B.; Fazel, M. Combined Treatment with 2-Deoxy-D-Glucose and Doxorubicin Enhances the in Vitro Efficiency of Breast Cancer Radiotherapy. Asian Pac. J. Cancer Prev. 2015, 16, 8431–8438. [Google Scholar] [CrossRef] [PubMed]
- Oladghaffari, M.; Monfared, A.S.; Farajollahi, A.; Baradaran, B.; Mohammadi, M.; Shanehbandi, D.; Abadi, M.A.J.; Islamian, J.P. MLN4924 and 2DG Combined Treatment Enhances the Efficiency of Radiotherapy in the Breast Cancer Cells. Int. J. Radiat. Boil. 2017, 93, 1–23. [Google Scholar] [CrossRef] [PubMed]
- Ben Sahra, I.; Laurent, K.; Giuliano, S.; Larbret, F.; Ponzio, G.; Gounon, P.; Le Marchand-Brustel, Y.; Giorgetti-Peraldi, S.; Cormont, M.; Bertolotto, C.; et al. Targeting Cancer Cell Metabolism: The Combination of Metformin and 2-Deoxyglucose Induces p53-Dependent Apoptosis in Prostate Cancer Cells. Cancer Res. 2010, 70, 2465–2475. [Google Scholar] [CrossRef] [Green Version]
- Ben Sahra, I.; Tanti, J.-F.; Bost, F. The combination of metformin and 2 deoxyglucose inhibits autophagy and induces AMPK-dependent apoptosis in prostate cancer cells. Autophagy 2010, 6, 670–671. [Google Scholar] [CrossRef]
- Kurtoglu, M.; Lampidis, T.J. From delocalized lipophilic cations to hypoxia: Blocking tumor cell mitochondrial function leads to therapeutic gain with glycolytic inhibitors. Mol. Nutr. Food Res. 2009, 53, 68–75. [Google Scholar] [CrossRef] [Green Version]
- Kurtoglu, M.; Gao, N.; Shang, J.; Maher, J.C.; Lehrman, M.A.; Wangpaichitr, M.; Savaraj, N.; Lane, A.N.; Lampidis, T.J. Under normoxia, 2-deoxy-D-glucose elicits cell death in select tumor types not by inhibition of glycolysis but by interfering with N-linked glycosylation. Mol. Cancer Ther. 2007, 6, 3049–3058. [Google Scholar] [CrossRef] [Green Version]
- Kurtoglu, M.; Maher, J.C.; Lampidis, T.J. Differential Toxic Mechanisms of 2-Deoxy-D-Glucose versus 2-Fluorodeoxy-D -Glucose in Hypoxic and Normoxic Tumor Cells. Antioxid. Redox Signal. 2007, 9, 1383–1390. [Google Scholar] [CrossRef]
- Raez, L.E.; Papadopoulos, K.; Ricart, A.D.; Chiorean, E.G.; DiPaola, R.S.; Stein, M.N.; Lima, C.M.R.; Schlesselman, J.J.; Tolba, K.; Langmuir, V.K.; et al. A phase I dose-escalation trial of 2-deoxy-d-glucose alone or combined with docetaxel in patients with advanced solid tumors. Cancer Chemother. Pharmacol. 2012, 71, 523–530. [Google Scholar] [CrossRef]
- Mohanti, B.K.; Rath, G.K.; Anantha, N.; Kannan, V.; Das, B.S.; Chandramouli, B.A.; Banerjee, A.K.; Das, S.; Jena, A.; Ravichandran, R.; et al. Improving cancer radiotherapy with 2-deoxy-d-glucose: Phase I/II clinical trials on human cerebral gliomas. Int. J. Radiat. Oncol. 1996, 35, 103–111. [Google Scholar] [CrossRef]
- Pardee, T.S.; Luther, S.; Buyse, M.; Powell, B.L.; Cortes, J. Devimistat in combination with high dose cytarabine and mitoxantrone compared with high dose cytarabine and mitoxantrone in older patients with relapsed/refractory acute myeloid leukemia: ARMADA 2000 Phase III study. Futur. Oncol. 2019, 15, 3197–3208. [Google Scholar] [CrossRef]
- Pardee, T.S.; Anderson, R.G.; Pladna, K.M.; Isom, S.; Ghiraldeli, L.P.; Miller, L.; Chou, J.A.; Jin, G.; Zhang, W.; Ellis, L.R.; et al. A Phase I Study of CPI-613 in Combination with High-Dose Cytarabine and Mitoxantrone for Relapsed or Refractory Acute Myeloid Leukemia. Clin. Cancer Res. 2018, 24, 2060–2073. [Google Scholar] [CrossRef] [Green Version]
- Stuart, S.D.; Schauble, A.; Gupta, S.; Kennedy, A.D.; Keppler, B.K.; Bingham, P.M.; Zachar, Z. A strategically designed small molecule attacks alpha-ketoglutarate dehydrogenase in tumor cells through a redox process. Cancer Metab. 2014, 2, 4. [Google Scholar] [CrossRef] [Green Version]
- Zachar, Z.; Marecek, J.; Maturo, C.; Gupta, S.; Stuart, S.D.; Howell, K.; Schauble, A.; Lem, J.; Piramzadian, A.; Karnik, S.; et al. Non-redox-active lipoate derivates disrupt cancer cell mitochondrial metabolism and are potent anticancer agents in vivo. J. Mol. Med. 2011, 89, 1137–1148. [Google Scholar] [CrossRef]
- Bellio, C.; DiGloria, C.; Spriggs, D.R.; Foster, R.; Growdon, W.B.; Rueda, B.R. The Metabolic Inhibitor CPI-613 Negates Treatment Enrichment of Ovarian Cancer Stem Cells. Cancers 2019, 11, 1678. [Google Scholar] [CrossRef] [Green Version]
- Lee, N.; Jang, W.-J.; Seo, J.H.; Lee, S.; Jeong, C.-H. 2-Deoxy-d-Glucose-Induced Metabolic Alteration in Human Oral Squamous SCC15 Cells: Involvement of N-Glycosylation of Axl and Met. Metab. 2019, 9, 188. [Google Scholar] [CrossRef] [PubMed] [Green Version]
- Li, Y.; Zhao, Z.; Liu, H.; Fetse, J.P.; Jain, A.; Lin, C.-Y.; Cheng, K. Development of a Tumor-Responsive Nanopolyplex Targeting Pancreatic Cancer Cells and Stroma. ACS Appl. Mater. Interfaces 2019, 11, 45390–45403. [Google Scholar] [CrossRef] [PubMed]
- O’Connor, R.S.; Guo, L.; Ghassemi, S.; Snyder, N.W.; Worth, A.J.; Weng, L.; Kam, Y.; Philipson, B.; Trefely, S.; Nunez-Cruz, S.; et al. The CPT1a inhibitor, etomoxir induces severe oxidative stress at commonly used concentrations. Sci. Rep. 2018, 8, 6289. [Google Scholar] [CrossRef] [PubMed] [Green Version]
- Xu, F.Y.; Taylor, W.A.; Hurd, J.A.; Hatch, G.M. Etomoxir mediates differential metabolic channeling of fatty acid and glycerol precursors into cardiolipin in H9c2 cells. J. Lipid Res. 2002, 44, 415–423. [Google Scholar] [CrossRef] [Green Version]
- Hossain, F.; Al-Khami, A.A.; Wyczechowska, D.; Hernandez, C.; Zheng, L.; Reiss, K.; Del Valle, L.; Trillo-Tinoco, J.; Maj, T.; Zou, W.; et al. Inhibition of Fatty Acid Oxidation Modulates Immunosuppressive Functions of Myeloid-Derived Suppressor Cells and Enhances Cancer Therapies. Cancer Immunol. Res. 2015, 3, 1236–1247. [Google Scholar] [CrossRef] [Green Version]
- Estañ, M.C.; Calviño, E.; Calvo, S.; Guillen-Guio, B.; Boyano-Adánez, M.D.C.; De Blas, E.; Rial, E.; Aller, P. Apoptotic Efficacy of Etomoxir in Human Acute Myeloid Leukemia Cells. Cooperation with Arsenic Trioxide and Glycolytic Inhibitors, and Regulation by Oxidative Stress and Protein Kinase Activities. PLoS ONE 2014, 9, e115250. [Google Scholar] [CrossRef] [PubMed]
- Pike, L.S.; Smift, A.L.; Croteau, N.J.; Ferrick, D.A.; Wu, M. Inhibition of fatty acid oxidation by etomoxir impairs NADPH production and increases reactive oxygen species resulting in ATP depletion and cell death in human glioblastoma cells. Biochim. et Biophys. Acta (BBA)-Bioenerg. 2011, 1807, 726–734. [Google Scholar] [CrossRef] [PubMed] [Green Version]
- Dheeraj, A.; Agarwal, C.; Schlaepfer, I.R.; Raben, D.; Singh, R.; Agarwal, R.; Deep, G. A novel approach to target hypoxic cancer cells via combining beta-oxidation inhibitor etomoxir with radiation. Hypoxia (Auckl.) 2018, 6, 23–33. [Google Scholar] [CrossRef] [PubMed] [Green Version]


© 2020 by the authors. Licensee MDPI, Basel, Switzerland. This article is an open access article distributed under the terms and conditions of the Creative Commons Attribution (CC BY) license (http://creativecommons.org/licenses/by/4.0/).
Share and Cite
Ghoneum, A.; Abdulfattah, A.Y.; Warren, B.O.; Shu, J.; Said, N. Redox Homeostasis and Metabolism in Cancer: A Complex Mechanism and Potential Targeted Therapeutics. Int. J. Mol. Sci. 2020, 21, 3100. https://doi.org/10.3390/ijms21093100
Ghoneum A, Abdulfattah AY, Warren BO, Shu J, Said N. Redox Homeostasis and Metabolism in Cancer: A Complex Mechanism and Potential Targeted Therapeutics. International Journal of Molecular Sciences. 2020; 21(9):3100. https://doi.org/10.3390/ijms21093100
Chicago/Turabian StyleGhoneum, Alia, Ammar Yasser Abdulfattah, Bailey Olivia Warren, Junjun Shu, and Neveen Said. 2020. "Redox Homeostasis and Metabolism in Cancer: A Complex Mechanism and Potential Targeted Therapeutics" International Journal of Molecular Sciences 21, no. 9: 3100. https://doi.org/10.3390/ijms21093100