Article

Early Functional Impairment in Experimental Glaucoma Is Accompanied by Disruption of the GABAergic System and Inceptive Neuroinflammation

by
Oliver W. Gramlich
1,2,3,*,
Cheyanne R. Godwin
1,2,
David Wadkins
1,2,
Benjamin W. Elwood
1,2 and
Markus H. Kuehn
1,2
1
Department of Ophthalmology and Visual Sciences, The University of Iowa, Iowa City, IA 52242, USA
2
VA Center for the Prevention and Treatment of Visual Loss, Iowa City VA Health Care System, Iowa City, IA 52246, USA
3
Department of Neuroscience and Pharmacology, The University of Iowa, Iowa City, IA 52242, USA
*
Author to whom correspondence should be addressed.
Int. J. Mol. Sci. 2021, 22(14), 7581; https://doi.org/10.3390/ijms22147581
Submission received: 27 May 2021 / Revised: 9 July 2021 / Accepted: 13 July 2021 / Published: 15 July 2021
(This article belongs to the Special Issue Towards an Understanding of Retinal Diseases and Novel Treatment)

Abstract

:
Glaucoma is a leading cause of irreversible blindness worldwide, and increased intraocular pressure (IOP) is a major risk factor. We aimed to determine if early functional and molecular differences in the glaucomatous retina manifest before significant retinal ganglion cell (RGC) loss is apparent. Adenoviral vectors expressing a pathogenic form of myocilin (Ad5.MYOC) were used to induce IOP elevation in C57BL/6 mice. IOP and pattern electroretinograms (pERG) were recorded, and retinas were prepared for RNA sequencing, immunohistochemistry, or to determine RGC loss. Ocular injection of Ad5.MYOC leads to reliable IOP elevation, resulting in significant loss of RGC after nine weeks. A significant decrease in the pERG amplitude was evident in eyes three weeks after IOP elevation. Retinal gene expression analysis revealed increased expression for 291 genes related to complement cascade, inflammation, and antigen presentation in hypertensive eyes. Decreased expression was found for 378 genes associated with the γ-aminobutyric acid (GABA)ergic and glutamatergic systems and axon guidance. These data suggest that early functional changes in RGC might be due to reduced GABAA receptor signaling and neuroinflammation that precedes RGC loss in this glaucoma model. These initial changes may offer new targets for early detection of glaucoma and the development of new interventions.

1. Introduction

Glaucoma is a neurodegenerative eye disorder, which is characterized by the irreversible degeneration of retinal ganglion cells (RGC), leading to visual impairment and blindness [1,2]. In addition to age, elevated intraocular pressure (IOP) is a major risk factor for glaucoma [3,4,5]. The multifactorial pathobiology of elevated IOP and RGC death is complex and involves changes in connective tissue composition and biomechanical support, blood flow and vascular insufficiency [6,7], metabolic and oxidative stress [8,9,10], neuroinflammatory and immune mechanisms [11,12], but also genetic factors [13], such as mutations in the myocilin (MYOC) gene [14].
McDowell et al. first described a viral vector-inducible glaucoma model in mice on the background of the human MYOC mutation [15]. The authors describe that the administration of an adenoviral 5 (Ad5) vector expressing MYOC (Ad5.MYOC) with a pathogenic mutation into the posterior chamber resulted in IOP elevation with moderate degeneration of the optic nerve. Whilst the pathogenesis of MYOC-induced IOP elevation is not completely understood, McDowell et al. hypothesized that mutated MYOC is misfolded and causes endoplasmic reticulum and cellular stress in trabecular meshwork (TM) cells. In turn, this leads to TM dysfunction and subsequent IOP elevation. We recently used this model to demonstrate a contribution of lymphocytes to progressive RGC loss in advanced glaucoma [16]. In this study, our goal was to determine the magnitude of RGC degeneration after three and nine weeks of chronic IOP elevation. Our second objective is to determine pattern electroretinography (pERG) abnormalities and correlate these with alterations in gene expression occurring as early as three weeks after induced ocular hypertension.
Previous studies using the bead occlusion model, in which ocular hypertension is induced by the injection of microbeads into the anterior chamber, demonstrate altered RGC responses to light, which is determined ex vivo by multielectrode array recording prior to RGC loss [17,18,19]. These studies further suggest that not only RGC but also the inner retinal circuit is functionally impaired by IOP elevation. There is increasing evidence that synaptic integrity in the inner plexiform layer is affected in glaucoma [20,21], which might be linked to the disruption of the γ-aminobutyric acid (GABA)-ergic and glutamatergic systems [22,23] and could explain the functional impact seen in electrophysiological responses. Furthermore, excessive mechanical stress occurring from IOP elevation triggers stretch and swelling-induced adenosine triphosphate release in the retina. This IOP-related mechanosensitive mechanism(s) includes metabolic stress in Müller cells and subsequently in RGCs, Ca2+-dependent dendritic and axonal remodeling, and inflammatory responses [24].
Our findings indicate pERG deficits as early as three weeks after Ad5.MYOC injection. At this early timepoint, no significant RGC loss could be determined, but the functional changes are accompanied by changes in gene transcription indicating disturbances in GABAA receptor signaling and GABA recycling, as well as activation of the complement cascade and inceptive neuroinflammation. These findings provide a molecular basis for the observed functional deficits in glaucoma and further underscore that neuroinflammation is an early event in glaucomatous neurodegeneration [21,25,26,27,28]. Additionally, we could determine a significant RGC loss in eyes after nine weeks of chronic IOP elevation, further demonstrating that RGC loss in this model is progressive and requires several weeks to become patent.

2. Results

2.1. Intraocular Injection of Ad5 Viral Vector Expressing Myocilin Y437H Results in Chronic IOP Elevation and RGC Loss

Following intraocular Ad5.MYOC administration, Ad5-desensitized C57BL/6 mice developed significant IOP elevation within one week, and IOP remained chronically elevated at an average of 22.8 ± 2.6 mmHg throughout the time course of nine weeks. The IOP of uninjected contralateral eyes remained at baseline values of about 13.5 ± 0.5 mmHg (Figure 1A). To rule out that intraocular injection of viral vectors per se causes IOP elevation or RGC loss, another cohort of mouse eyes (n = 10) were injected with an empty construct of the Ad5 vector (Ad5.empty). Throughout a time course of 9 weeks after ocular delivery, no changes from baseline IOP were noted in these Ad5.empty injected eyes (average IOP: 11.9 ± 0.61 mmHg).
Nine weeks after Ad5.MYOC injection, analysis of retinal wholemounts indicated a prominent loss of RGC in eyes with ocular hypertension. RGC loss in hypertensive eyes is statistically most significant in the peripheral area of retinas (1455 ± 242 Brn3a+ cells/mm2) when compared to RGC density in both their uninjected contralateral eyes (1768 ± 199 Brn3a+ cells/mm2, p = 0.015) and to Ad5.empty vector-injected control eyes (1945 ± 256 Brn3a+ cells/mm2, p = 0.0004). RCG reduction in glaucomatous eyes is also evident in the mid-peripheral region (2898 ± 664 Brn3a+ cells/mm2) when compared to the contralateral eyes (3496 ± 258 Brn3a+ cells/mm2, p = 0.029) or control eyes injected with the Ad5.empty construct (3618 ± 445 Brn3a+ cells/mm2, p = 0.012). In the central retina, RGC loss was observed in some eyes, but statistical significance was not reached (Figure 1B,D). The density of Brn3a+ RGC in Ad5.empty injected eyes was similar to that of contralateral control eyes in the peripheral (Ad5.empty: 1945 ± 256 Brn3a+ cells/mm2 vs. uninjected: 2014 ± 271 Brn3a+ cells/mm2, p = 0.62), mid-peripheral (Ad5.empty: 3618 ± 445 Brn3a+ cells/mm2 vs. uninjected: 3749 ± 248 Brn3a+ cells/mm2; p = 0.50), and central areas (Ad5.empty: 4034 ± 474 Brn3a+ cells/mm2 vs. uninjected: 4236 ± 213 Brn3a+ cells/mm2; p = 0.31, t-test values were corrected for multiple comparison). Regression analysis of glaucomatous eyes reveals a strong correlation between IOP data and RGC density in the peripheral and central retina, whereas higher Area Under Curve (AUC) IOP relates to the highest RGC loss (Figure 1C).
These data strongly indicate that in Ad5-desensitized C57BL/6 mice, intraocular administration of the Ad5.MYOC viral vector is safe for the eye and that observed IOP changes in injected eyes are due to the effects of the transgene. In our hands, intraocular injection of Ad5.MYOC injection is an effective and highly reproducible method to induce chronic ocular hypertension with subsequent RGC loss.

2.2. Slow Progressive RGC Degeneration after Ad5.MYOC Induced IOP Elevation

To examine functional and molecular changes occurring early in Ad5.MYOC induced ocular hypertension, retinas of a second cohort of mice were harvested three weeks after Ad5.MYOC injection to determine RGC loss and for RNA sequencing. In accordance with our previous results, intraocular Ad5.MYOC administration led to chronic IOP elevation within one week after injection with an average of 19.7 ± 6.2 mmHg, while uninjected contralateral eyes maintained a mean IOP of 12.3 ± 1.4 mmHg (Figure 2A), and normal IOP was observed in naive control mice. Analysis of the RGC density between naive eyes and eyes exposed to ocular hypertension for three weeks does not indicate significant differences in the periphery (Ad5.MYOC: 2093 ± 311 Brn3a+ cells/mm2 vs. naïve controls: 2153 ± 461 Brn3a+ cells/mm2, p = 0.99), mid-periphery (Ad5.MYOC: 3128 ± 279 Brn3a+ cells/mm2 vs. naïve controls: 3396 ± 599 Brn3a+ cells/mm2, p = 0.74) and central area of the retina (Ad5.MYOC: 3621 ± 126 Brn3a+ cells/mm2 vs. naïve controls: 3851 ± 292 Brn3a+ cells/mm2, p = 0.84, Figure 2B). These findings demonstrate that retinal damage after 3 weeks of ocular hypertension is extremely light and, in concert with those obtained from eyes after nine weeks of elevated IOP, highlight the progressive nature of RGC loss in this disease model (Figure 2C).

2.3. IOP Elevation Causes Rapid Retinal Expression of Inflammation Markers and Downregulation of GABAA Receptor Subunits and Glutamine Synthetase

Retinal gene expression analysis from eyes after three weeks of increased IOP revealed a significant increase in expression for 291 genes, notably those encoding stress-related proteins such as ɣ-crystallin B (control: 214 ± 96 FPKM vs. Ad5.MYOC: 830 ± 435 FPKM, p = 0.033), ɣ-crystallin C (control: 176 ± 65 FPKM vs. Ad5.MYOC: 699 ± 399 FPKM, p = 0.041) and also GFAP (control: 986 ± 376 FPKM vs. Ad5.MYOC: 2445 ± 626 FPKM, p = 0.007). Increased gene expression was also evident in retinas of hypertensive eyes for complement proteins including C1q, C4, and the C1-inhibitor SerpinG1. The initiation of the complement cascade is accompanied by increased expression of the microglia/macrophages associated marker Cx3cr1 and of genes linked to antigen processing and presentation, in particular Ctss, Tapbp, and H2-t23 (Table 1). Cluster analysis confirmed that the upregulated genes are linked to the complement cascade but also to antigen processing and presentation, immune cells, and cytokine–cytokine receptor signaling (Figure 3A).
Changes in gene expression encoding ribosomal subunits were also observed (Table 1) that are linked to immune response-related genes via Rps27a (control: 3821 ± 118 FPKM vs. Ad5.MYOC: 4650 ± 348 FPKM, p = 0.004), which is a component of the 40S subunit. Rps27a is also known as Ubiquitin B and is one of four genes encoding ubiquitin. The primary function of ubiquitin is to clear abnormal and improperly folded proteins by targeting them for degradation by the 26S proteasome. No differences were observed in the expression of genes indicative of ischemic events. Decreased expression was found for 378 genes, most striking for glutamine synthetase (Glul, control: 33,233 ± 4840 FPKM vs. Ad5.MYOC: 47,282 ± 621 FPKM, p = 0.001). Furthermore, the expression of genes related to the GABAergic system and genes associated with neuron projection and axonal guidance were found to be significantly decreased (Figure 3B). These include genes with functions related to GABAA receptor and GABA neurotransmitter recycling, genes required for cholinergic and glutamatergic synapse formation, and axonal guidance (Table 1).
Taken together, our gene expression data point to an inceptive neuroinflammation early after IOP elevation with activation of the complement cascade and an increase of cellular immune cell function. This early immune response is accompanied by decreased expression of important components of signal transduction in the neuro-retinal circuit.

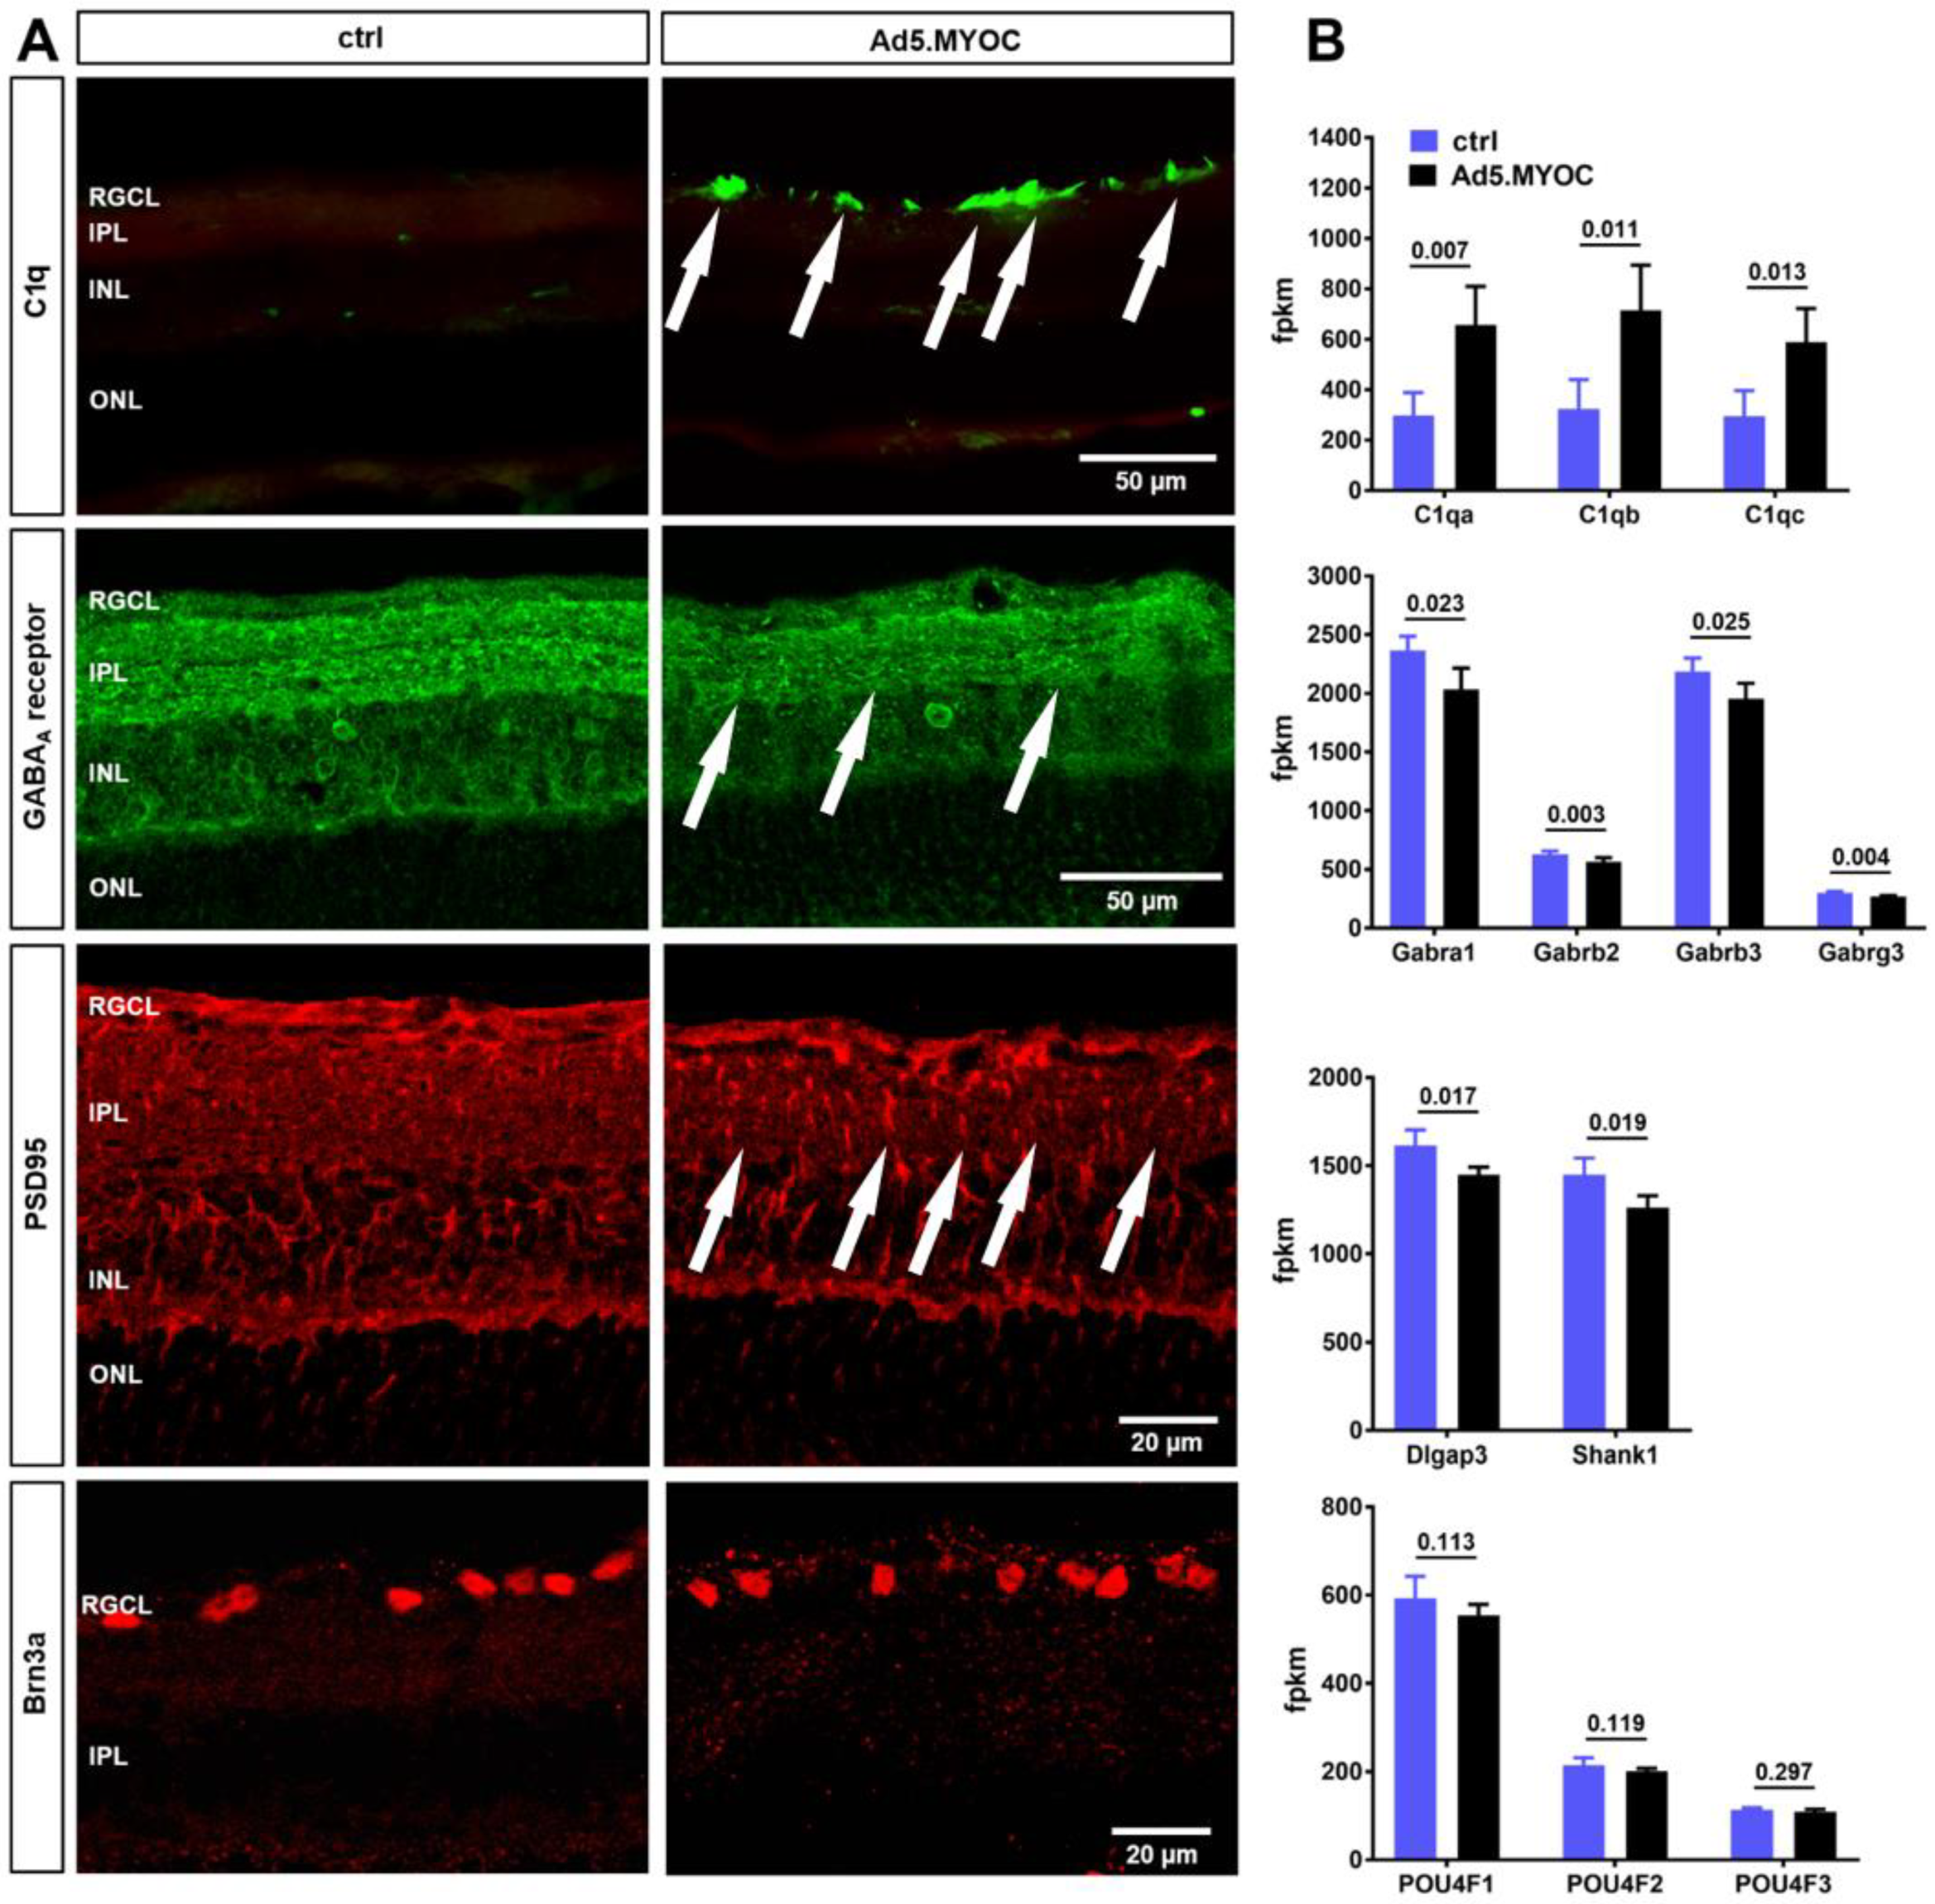
2.4. Hypertensive Eyes Display Retinal C1q Accumulation Accompanied by Reduced GABAA Receptor and PSD95 Immunolabeling

To further confirm the increased expression of inflammatory markers in the retina after Ad5.MYOC injection, we conducted immunostaining for C1q in retinal cross-sections of eyes after three weeks of elevated IOP. Abundant C1q deposition was observed in the retinal nerve fiber layer and the RGC layer of hypertensive eyes, but punctuated C1q labeling was also evident in the inner plexiform layer (IPL, Figure 4A). This increase in C1q labeling is concordant with increased expression levels of the genes C1qa, C1qb, and C1qc (Figure 4B). Conversely, immunolabeling for the GABAA receptor revealed disruption of the three specific GABAA receptor positive strata that are normally present in the IPL and are clearly visible in our controls. Overall, immunolabeling of the GABAA receptor was notably weaker in the IPL. A decrease of GABAA receptor positive neurons was also observed in the inner nuclear layer of retinas from hypertensive eyes when compared to controls (Figure 4A). This decrease is mirrored by reduced expression levels of genes related to the GABAA pathway including Gabra1, Gabrb2 and 3, and Gabrg3 (Figure 4B).
Analogous to GABAA receptor patterns, PSD95 immunohistochemistry revealed decreased labeling of this synaptic marker in the IPL of retinas exposed to ocular hypertension (Figure 4A). A corresponding decrease in SH3 and multiple ankyrin repeat domains protein 1 (Shank1) and Disks large-associated protein 3 (Dlgap3) genes in the Postsynaptic density protein 95 (PSD95) complex was also seen (Figure 4B). PSD95 labeling is typically pronounced in the outer plexiform layer and is also present there in our model. Labeling intensities do not differ between the glaucomatous group and controls in this region, indicating that postsynaptic modification occurred specifically in RGC.
Our finding that a significant RGC loss had not yet occurred after three weeks of ocular hypertension is further supported by the observation that expression levels of genes of the POU4 family, which are related to RGC survival and health, are similar in eyes after Ad5.MYOC administration and controls (Figure 4A,B). Thus, other observed changes in transcript levels are a result of modulation of gene expression rather than loss of RGC.
These results confirm our previous findings of increased complement activation but also demonstrate decreased GABAA receptor and PSD95 gene expression and immunolabeling after Ad5.MYOC-mediated IOP elevation.

2.5. IOP Elevation Causes Decline in Pattern ERG Amplitudes

We further wanted to investigate whether the molecular changes in the GABAergic system and in synaptic plasticity that occur early after IOP elevation result in corresponding functional deficits. In addition, we wanted to rule out that functional changes are a consequence of ocular Ad5.vector injections per se. Therefore, we compared pERG data obtained from a third cohort of mice (including naïve controls) three weeks after Ad5.MYOC-induced hypertension and eyes injected with Ad5.empty vector. Similar to our previous findings, only eyes having received Ad5.MYOC display significant IOP elevation with an average of 17.6 ± 1 mmHg when compared to a mean IOP of 11.7 ± 1.5 mmHg (p < 0.001) in naïve eyes and to 11.5 ± 1.2 mmHg (p < 0.001) in Ad5.empty-injected eyes. Eyes with Ad5.MYOC-induced IOP elevation displayed a decrease of approximately 1/3 of their P1 to N2 amplitude (Figure 5A). This reduction is significant in comparison to the amplitudes of Ad5.empty-injected eyes (Ad5.MYOC: 14.1 ± 4 µV vs. Ad5.empty: 23.8 ± 8.5 µV, p = 0.048) as well as to those of age-matched naive controls (control: 25.9 ± 6.7 µV, p = 0.004; Figure 5B). Shortening or prolonged latencies have not been detected in any hypertensive eyes after Ad5.MYOC injection.
These data demonstrate that the administration of an Ad5.empty viral construct does not provoke functional changes in the retina. However, ocular administration of an Ad5.vector expressing MYOC with subsequent IOP elevation leads to significant functional impairment that precedes RGC loss.

3. Discussion

3.1. Intraocular Injection of Ad5.MYOC Leads to Ocular Hypertension, Functional Decline, and Eventual RGC Loss

In this study, we employed intraocular injection of adenovirus 5 vector expressing a pathogenic form of human Myocilin, Ad5.MYOCY437H, to induce chronic ocular hypertension in C57BL/6 mice to investigate early events. In our hands, the increase in IOP, as well as the profile and magnitude of IOP elevation are comparable to those described earlier [15,16]. The degeneration of RGC is not associated with the intraocular administration of the viral vector itself, since the injection of empty Ad5 viral vector into the anterior chamber causes neither IOP elevation nor RGC loss. Thus, Ad5.MYOC-mediated IOP elevation is a simple, safe, and reliable approach to induce glaucomatous changes in mice.
Here, we report that functional impairment of the retina as determined by pERG is present shortly after IOP elevation and that these changes precede significant RGC degeneration. RGC dysfunction is evident through significantly decreased amplitude in hypertensive eyes when compared to both contralateral uninjected eyes and to eyes of the naïve control group, which were observed prior to apparent RGC loss. This observation is in accordance with clinical glaucoma studies [29,30,31] and preclinical models of glaucoma [32,33,34] in which pERG was used to detect RGC (dys-)function.

3.2. Functional Impairment in Hypertensive Eyes Is Accompanied by Synaptic Degeneration, Altered Glutamine Synthase, and Decreased GABAA-Receptor Expression

Our gene expression data may help to explain the origin of the functional impairment early after IOP elevation. In general, gene expression changes observed in our model are similar to those reported elsewhere and include the increased expression for GFAP as a marker for gliosis [35], stress proteins [36], and the downregulation of the glutamate synthetase [37]. We also found a significant increase in the expression of classical complement cascade proteins, especially for C1q. Activation of the complement system has been previously shown in glaucoma animal models [38,39,40] and human glaucomatous retinas [41,42]. Importantly, no differences in gene expression levels between glaucomatous and controls eyes were noticed for members of the Pou4 family (including Pou4F1-encoding Brn3a), suggesting that RGC are still relatively healthy 3 weeks after chronic IOP elevation. This finding was further confirmed by Brn3a immunolabeling in retinal wholemounts for the quantitation of RGC loss, demonstrating undiminished RGC density at this early time point. Thus, it is reasonable to conclude that the changes in retinal gene expression and electrophysiology reported here precede RGC loss in hypertensive eyes.
The observed decrease in the expression of genes related to GABAA receptor signaling, accompanied by impairment of GABA recycling due to decreased glutamine synthase, and the downregulation of genes related to cholinergic and glutamatergic synapses are consistent with the observed functional impairment. In addition to RGC, GABAA receptors are expressed on horizontal, bipolar, and amacrine cells [43] and play an extraordinarily complex role in signal transduction [44,45]. Depending on the nature of GABAA receptor positive neurons and the amount of GABA present, the GABAergic system can act either inhibitory or excitatory. Our immunohistochemistry shows that ocular hypertension leads to reduced GABAA receptor subunit expression as well as to decreased GABAA receptor immunolabeling in the IPL and in INL neurons. One explanation for these findings is that an early retinal response to elevated IOP impairs GABAA-mediated signal transduction between INL neurons and RGC, which would lead to observed pERG deficits.
A decrease in glutamine synthase levels has also been observed in a variety of experimental glaucoma models [46,47]. Reduced levels of this enzyme could lead to increased glutamate levels and potentially to a microenvironment of glutamate toxicity [48,49], but more directly, they will cause the depletion of available intracellular glutamine, which is an important excitatory neurotransmitter [50,51]. It has been shown that the inhibition of glutamine synthase suppresses the b-wave response and blocks glutamatergic neurotransmission [52], which may further contribute to the decrease in amplitudes seen in our glaucoma model. Finally, it is also plausible that the reduction in metabotropic glutamate receptors (mGluR) 2 and 6 (Table 1) in the glaucomatous retinas has an important role in impaired electrical input into RGC. mGluR6 is believed to be expressed on bipolar cells, and reduced mGluR6 expression would directly alter bipolar cell function [53] and RGCs only indirectly i.e., by propagation of altered bipolar cell signaling. This notion of impaired outer retinal function is further supported by other studies in which the reduction of a- and b-wave amplitudes after induction of ocular hypertension as well as impaired bipolar cell function in the context of glaucoma have been reported [54,55,56].
While reduction in glutamatergic signaling is likely to result in decreased synaptic transmission, the decline in transcript levels for Shank1 and Dlgap3 (alias SAP90/PSD-95-Associated Protein 3), which are both components of the PSD95 synaptic complex [57,58], is indicative of physical synaptic uncoupling. In our glaucoma model, PSD95 immunolabeling is reduced in the RGC layer and IPL of hypertensive eyes in a pattern similar to that observed in the DBA/2J glaucoma mouse model where a decline in PSD95 indicates synaptic loss [21]. Furthermore, decreased PSD95 immunolabeling accompanied by a reduction in RGC function has also been reported in mice after short-term IOP elevation [59].
Taken together, the selective downregulation of GABAA receptors, decreased glutamine synthase levels, and loss of glutamatergic synapses are likely responsible for the pERG deficits. However, it remains to be determined whether these processes act in concert with one another or if one of them is primarily responsible for the change in RGC function.

3.3. Inceptive Neuroinflammation Features C1q Deposition and Antigen Presentation

As we have previously shown [38], C1q is predominantly located in the nerve fiber layer and RGC layer of the glaucomatous retina. Here, a similar C1q staining pattern, as well as some punctuated C1q immunolabeling in the IPL of retinas exposed to ocular hypertension, was observed. It is possible that C1q deposition is directly involved in synaptic removal, which is a suggested mechanism of synaptic stripping [60], but C1q deposition is certainly indicative of neuroinflammation. It is intriguing that we also detected a profound increase of Ctss expression at this early stage of glaucomatous damage. Ctss encodes Cathepsin S, which has a critical role in loading antigens to the MHCII complex for the presentation of B-cells, microglia, and macrophages, as well as dendritic cells [61,62]. A recent pathway analysis of GWAS data revealed an association of several histocompatibility (MHC) subtypes along with Ctss and heat shock protein (HSP) 70, HSPA1B, with primary open angle glaucoma [63]. In our study, we detected increased retinal expression of H2-T23, a mouse MHCI complex, as well as Tap binding protein (Tapbp), which is crucial for the immune response of HSP-involved antigen cross-presentation [64,65].
Furthermore, the increased expression of Rps27a, alias Ubiquitin B, and its association with the ribosomal 40S subunit, as well as with genes of the proteasomal degradation pathway (Psmb10 [66], Socs3 [67], Herc6 [68]), is indicative that the ubiquitin–proteasome system is activated in the retina of hypertensive eyes. Studies report activation of the ubiquitin–proteasome system in retinal degeneration, including glaucoma, as a result of increased occurrence of misfolded proteins in response to oxidative stress and NF-κB signaling [68,69]. In its role as an immunoproteasome, Psmb10 is also involved in MHCI antigen presentation [66]. Together, these findings are indicative of MHCI complex-mediated presentation of HSP-derived peptides to cytotoxic CD8 T-cells and are similar to those obtained in our earlier study describing gene expression changes in canine retinas with advanced glaucoma [70,71,72].
HSPs and HSP autoimmunity appear to play a critical role in the pathophysiology of glaucoma [73,74], and it has been demonstrated that ocular delivery or systemic immunization of rodents with HSPs elicits RGC loss [74,75,76]. A more recent study reveals that IOP elevation causes an HSP-specific T-cell response in mice and that RGC loss can be induced by transferring HSP-specific T-cells from glaucomatous donor mice into healthy recipient mice [77]. While it is currently unclear how the immune response to HSP in glaucoma is initiated, there is mounting evidence that it is contributing to RGC loss [78]. Our findings in this study indicate that an HSP-induced immune response might have its origin in the retina and that enhanced antigen presentation occurs very early, prior to significant RGC loss.
In summary, Ad5.MYOC-induced IOP elevation in MYOC desensitized mice leads to slow progressive RGC loss that is accompanied by a declined pERG amplitude. The functional changes seem to be linked to the decreased expression of genes related to neurotransmitter recycling and receptor expression in the GABAergic and glutamatergic systems and to inceptive neuroinflammatory processes. Of particular interest for further studies is our observation of HSP-related antigen presentation, which may point to a potential mechanism for the development of an autoimmune response in glaucoma.

4. Materials and Methods

4.1. Animals

All animal experiments have been approved by the University of Iowa and the Iowa City VA IACUC and were conducted in accordance with the ARVO Statement for the Use of Animals in Ophthalmic and Vision Research. C57BL/6/J (B6) mouse breeder pairs were purchased from The Jackson Laboratory (Bar Harbor, ME, USA) and housed at the University of Iowa on a 12 h light–dark cycle (6 a.m. to 6 p.m.) with food ad libitum. Equal numbers of both sexes were used in our experiments, and all animals were euthanized by CO2 inhalation followed by cervical dislocation.

4.2. Myocilin Vector-Induced Glaucoma Model

An adenoviral vector expressing the pathogenic Y437H form of human Myocilin, Ad5RSVmyocillinTyr437HisFlag (Ad5.MYOC) was used to induce IOP elevation [15,16]. Control eyes received an empty (null) vector variant of Ad5CMV (Ad5.empty). Both vector constructs were obtained from the Vector Core at University of Iowa, IA, USA. Newborn pups (P2–P5) were desensitized to Ad5 viruses by a subcutaneous injection of 3 μL of the Ad5.MYOC with a titer of 3 × 10⁶ pfu into the lower back. At two months of age, desensitized mice were anesthetized using 4% isoflurane (Baxter, Deerfield, IL, USA) for induction and 2.5% isoflurane for maintenance at a flow rate of 1 L O2/min. 1% tropicamide (Sandoz, Princeton, NJ, USA) and 0.5% proparacaine hydrochloride (Bausch + Lomb, Bridgewater, NJ, USA) eye drops were administered for dilation and local anesthesia, respectively. A 10 μL Hamilton syringe with a 30-gauge needle was inserted into a dorsolateral location of the eye posterior to the limbus, and 3 μL of the Ad5.MYOC with a titer of 9 × 10⁷ pfu were injected over a time of 30 s. Prior to injection, aqueous humor was allowed to escape, so that the injection of an additional volume did not cause undue IOP elevation. After injection, the needle was kept in place for another 30 s to avoid washout. Pulsation and coloration of blood vessels were monitored through a surgical microscope (Omano, Roanoke, VA, USA) to ensure that ischemic damage did not occur. In the first in vivo study, a group of mice (n = 10) received a unilateral intraocular injection to determine IOP elevation and RGC loss nine weeks after Ad5.MYOC injection. A control group (n = 8) received injections of 3 μL Ad5.empty vector.
In the second cohort, which was designed to evaluate changes prior to RGC loss, experimental mice received a bilateral Ad5.MYOC injection, and tissue was harvested three weeks thereafter for RNA sequencing (n = 8), RGC quantitation (n = 10), and immunohistochemistry (n = 7). Data were compared to those derived from age-matched naïve animals (n = 5 for RNA sequencing, n = 8 for RGC quantitation, and n = 8 for immunohistochemistry).
Finally, pERG responses were examined in a third cohort of mice (n = 5/group) three weeks after bilateral Ad5.MYOC or Ad5.empty injections, and recordings were compared to a naïve control group. Animals were euthanized after pERG recordings, and eyes of both groups were subsequently used for immunohistochemistry.

4.3. Tonometry

An iCare Tonolab rebound tonometer (iCare, Espoo, Finland) was used to monitor the IOP in experimental and control eyes, as previously described [79]. Briefly, mice were anesthetized with isoflurane as described above and the average IOP of 5 consecutive measurements was calculated. IOP was measured between 10 a.m. and 1 p.m. by an investigator masked to the animals’ status. Measurements were obtained prior to ocular viral vector administration and then weekly throughout the study.

4.4. Pattern ERG Recording

Mice were anesthetized with an intraperitoneal injection of ketamine (30 mg/kg, Mylan, Canonsburg, PA, USA), xylazine (5 mg/kg, Akorn Inc., Lake Forest, IL, USA), and acepromazine (2.3 mg/kg, Diamondback drugs, Scottsdale, AZ, USA). A drop of GenTeal gel (Alcon Laboratories, Fort Worth, TX, USA) was placed on the corneal surface to maintain corneal integrity, after pupil dilation using 1% tropicamide. pERG responses were recorded using alternating, reversing, black and white vertical stimuli at 1 Hz (2 reversals per second), and 50 candela/m2 delivered by the pattern stimulator of a Diagnosys Celeris system (Diagnosys LLC, Lowell, MA, USA). Then, 300 traces were recorded per eye, and averaged waveforms were calculated in which amplitudes (µV) were measured from the P1 peak to the N2 trough. All pERG measurements were recorded while maintaining constant body temperature between 37 °C and 38 °C using the system’s heat pads.

4.5. Analysis of RGC Survival

To analyze RGC density, eyes were fixed in 4% paraformaldehyde for two hours and rinsed in PBS. Retinas were dissected and permeabilized in 0.3% Triton-X100/PBS for 6 h followed by three freeze and thaw cycles and blocking in 1%BSA/0.3% Triton-X100/PBS for 1 h at room temperature. Retinas were incubated with goat-anti Brn3a primary antibody [80] (Santa Cruz, TX, diluted 1:200 in 1%BSA/0.3% Triton-X100/1% DMSO/PBS) at 4 °C for 48 h on a rocker platform. After washes in PBS, binding was visualized following incubation in a donkey anti-goat Alexa Fluor 546 secondary antibody solution (Invitrogen, Carlsbad, CA, USA, 1:200 in PBS) for 3 h at room temperature in the dark. After extensive washing in PBS, retinas were wholemounted using Vectashield (Vector Laboratories, Burlingame, CA, USA), and eight images from each retina were taken at predetermined locations peripherally, mid-peripherally, and centrally at 20× magnification using an Olympus BX41 microscope (Olympus, Center Valley, PA, USA). These 24 images represent 23.8% of the total mouse retinal area [81]. Brn3a+ cells were counted manually by a masked observer using the cell counter plugin for ImageJ software (National Institutes of Health, Bethesda, MD, USA). RGC density per mm2 was calculated by averaging the 8 values per area of each retina.

4.6. RNA-Sequencing

Elevated IOP was induced in the eyes of C57BL/6 mice as described above. Three weeks after elevation of IOP, eyes were harvested, and total RNA was extracted. Four pools of RNA, each containing material from two eyes obtained from two distinct animals, were generated from eyes with elevated IOP as well as 4 pools from naïve mice. Each pool was converted to a sequencing library and sequenced on a HiSeq4000 sequencing system (Illumina, San Diego, CA, USA) generating, on average, 19.4 million reads for each pool. Reads were aligned to the mm10 reference genome using STAR aligner software [82], and gene and transcript level expression values in length normalized transcripts per million were generated using the R package FeatureCounts. Differential gene expression analysis was carried out using DEseq2 [83], and the resulting data were further analyzed using Ingenuity Pathway analysis and String (https://string-db.org/; accessed on 18 May 2018) [84]. Cluster analysis was performed by String DB software using gene lists of significantly up-regulated or down-regulated genes with a cut-off p-value > 0.05 and a high confidence interaction score setting of 0.7.

4.7. Immunohistology

To analyze structural changes to the retina, eyes from animals with three weeks IOP elevation post Ad5.MYOC injection and from control mice were fixed in 4% paraformaldehyde for two hours and rinsed in PBS. After cryopreservation using sucrose embedding, sagittal 7 µm sections were washed three times for 5 min in PBS and blocked in 1%BSA/PBS for 1 h at room temperature. Sections were incubated with rat-anti C1q (Abcam, Cambridge, UK, diluted 1:50 in 1%BSA/PBS), goat-anti Brn3a (Santa Cruz, Dallas, TX, USA, diluted 1:200 in 1%BSA/PBS), goat-anti PSD95 (Abcam, diluted 1:1000 in 1%BSA/PBS), or rabbit-anti GABAA Receptor A1 (Millipore Sigma, Burlington, MA, USA, 1:500 in 1%BSA/PBS) at 4 °C overnight. Then, slides were washed and incubated for three hours at room temperature in goat anti-rat Alexa Fluor 488 (Invitrogen, Carlsbad, CA, USA, 1:500 in PBS) donkey anti-goat Alexa Fluor 546 (Invitrogen, 1:500 in PBS) or donkey anti-rabbit Alexa Fluor 488 (Invitrogen, 1:500 in PBS). Slides were washed three times for 5 min in PBS followed by a rinse in 70% EtOH and distilled water. After coverslipping using Aquamount, dry slides were imaged on a Zeiss 710 confocal microscope (Carl Zeiss, Thornwood, NY, USA).

4.8. Statistics

IOP and RGC data are given as mean ± standard deviation (SD). For statistics including more than two groups, p-values are calculated using ANOVA followed by Turkey’s post hoc test. RNA seq. data are displayed as mean values of fragments per kilobase of transcript per million mapped reads (FPKM) ± SD. p-values between control retinas and retinas three weeks after Ad5.MYOC-induced ocular hypertension were calculated using Student’s t-test. All calculations were performed using GraphPad Prism v7.04 (GraphPad Software, San Diego, CA, USA), and p-values < 0.05 were considered statistically significant.

5. Conclusions

The intraocular administration of Ad5 viral construct expressing a pathogenic variant of myocilin leads to robust and chronic IOP elevation in mice and results in a slow-progressive RGC loss. Early retinal changes in hypertensive eyes feature key characteristics of glaucomatous degeneration including glial activation, inceptive neuroinflammation, activation of the complement system, and synaptic loss. These molecular changes are accompanied by functional impairment i.e., a significant decline of the pERG amplitude before RGC loss becomes apparent. Furthermore, our RNA sequencing data with subsequent pathway analysis indicate increased antigen presentation in conjunction with HSP-mediated proteolysis as a response to activation of the ubiquitin–proteasome system. This observation merits further investigation and may provide a possible mechanism as to how autoimmune responses in glaucoma are initiated.

Author Contributions

Conceptualization, O.W.G. and M.H.K.; methodology, O.W.G.; software, D.W. and O.W.G.; validation, O.W.G. and M.H.K.; formal analysis, O.W.G. and M.H.K.; investigation, C.R.G., D.W. and B.W.E.; resources, O.W.G.; data curation, O.W.G., C.R.G., D.W., B.W.E. and M.H.K.; writing—original draft preparation, O.W.G. and C.R.G.; writing—review and editing, M.H.K., D.W. and B.W.E.; visualization, O.W.G. and B.W.E.; supervision, M.H.K.; project administration, O.W.G.; funding acquisition, M.H.K. All authors have read and agreed to the published version of the manuscript.

Funding

This research was funded by Merit Review Award 1 I01 RX002860 and Center Grant 1I50RX003002-01 from the United States (U.S.) Department of Veterans Affairs Rehabilitation Research and Development Service as well as an unrestricted grant to the University of Iowa Department of Ophthalmology from Research to Prevent Blindness.

Institutional Review Board Statement

All animal experiments have been approved by the University of Iowa (6091850 approved 10/14/2016, 1790601 approved 6/13/2017, 2190101 approved 1/11/2021) and Iowa City VA IACUC (1490401 approved 4/9/2014, 1890402 approved 4/25/2018) and were conducted in accordance with the ARVO Statement for the Use of Animals in Ophthalmic and Vision Research.

Informed Consent Statement

Not applicable.

Data Availability Statement

RNA-sequencing data will be made available upon request. Please contact the corresponding author.

Acknowledgments

This work was supported by Merit Review Award 1 I01 RX002860 and Center Grant 1I50RX003002-01 from the United States (U.S.) Department of Veterans Affairs Rehabilitation Research and Development Service as well as an unrestricted grant to the University of Iowa Department of Ophthalmology from Research to Prevent Blindness. The contents do not represent the views of the U.S. Department of Veterans Affairs or the United States Government.

Conflicts of Interest

The authors declare no conflict of interest.

References

  1. Weinreb, R.N.; Aung, T.; Medeiros, F.A. The pathophysiology and treatment of glaucoma: A review. JAMA 2014, 311, 1901–1911. [Google Scholar] [CrossRef] [Green Version]
  2. Weinreb, R.N.; Khaw, P.T. Primary open-angle glaucoma. Nat. Rev. Dis Primers 2016, 2, 16067. [Google Scholar] [CrossRef] [PubMed]
  3. Coleman, A.L.; Miglior, S. Risk factors for glaucoma onset and progression. Surv. Ophthalmol. 2008, 53 (Suppl. 1), S3–S10. [Google Scholar] [CrossRef]
  4. Leske, M.C.; Heijl, A.; Hussein, M.; Bengtsson, B.; Hyman, L.; Komaroff, E. Factors for glaucoma progression and the effect of treatment: The early manifest glaucoma trial. Arch. Ophthalmol. 2003, 121, 48–56. [Google Scholar] [CrossRef] [PubMed]
  5. Leske, M.C.; Heijl, A.; Hyman, L.; Bengtsson, B.; Dong, L.; Yang, Z. Predictors of long-term progression in the early manifest glaucoma trial. Ophthalmology 2007, 114, 1965–1972. [Google Scholar] [CrossRef] [PubMed]
  6. O’Brien, C.; Butt, Z. Blood flow velocity in the peripheral circulation of glaucoma patients. Ophthalmologica 1999, 213, 150–153. [Google Scholar] [CrossRef] [PubMed]
  7. Flammer, J.; Orgül, S.; Costa, V.P.; Orzalesi, N.; Krieglstein, G.K.; Serra, L.M.; Renard, J.-P.; Stefánsson, E. The impact of ocular blood flow in glaucoma. Prog. Retin. Eye Res. 2002, 21, 359–393. [Google Scholar] [CrossRef]
  8. Inman, D.M.; Harun-Or-Rashid, M. Metabolic Vulnerability in the Neurodegenerative Disease Glaucoma. Front. Neurosci 2017, 11, 146. [Google Scholar] [CrossRef] [PubMed]
  9. Chrysostomou, V.; Rezania, F.; Trounce, I.; Crowston, J.G. Oxidative stress and mitochondrial dysfunction in glaucoma. Curr. Opin. Pharmacol. 2013, 13, 12–15. [Google Scholar] [CrossRef] [PubMed]
  10. Harun-Or-Rashid, M.; Pappenhagen, N.; Zubricky, R.; Coughlin, L.; Jassim, A.H.; Inman, D.M. MCT2 overexpression rescues metabolic vulnerability and protects retinal ganglion cells in two models of glaucoma. Neurobiol. Dis. 2020, 141, 104944. [Google Scholar] [CrossRef]
  11. Soto, I.; Howell, G.R. The complex role of neuroinflammation in glaucoma. Cold Spring Harb. Perspect. Med. 2014, 4, a017269. [Google Scholar] [CrossRef]
  12. Bell, K.; Gramlich, O.W.; Von Thun Und Hohenstein-Blaul, N.; Beck, S.; Funke, S.; Wilding, C.; Pfeiffer, N.; Grus, F.H. Does autoimmunity play a part in the pathogenesis of glaucoma? Prog. Retin. Eye Res. 2013, 36, 199–216. [Google Scholar] [CrossRef] [PubMed]
  13. Gharahkhani, P.; Jorgenson, E.; Hysi, P.; Khawaja, A.P.; Pendergrass, S.; Han, X.; Ong, J.S.; Hewitt, A.W.; Segrè, A.V.; Rouhana, J.M.; et al. Genome-wide meta-analysis identifies 127 open-angle glaucoma loci with consistent effect across ancestries. Nat. Commun. 2021, 12, 1258. [Google Scholar] [CrossRef] [PubMed]
  14. Fingert, J.H.; Stone, E.M.; Sheffield, V.; Alward, W.L. Myocilin glaucoma. Surv. Ophthalmol. 2002, 47, 547–561. [Google Scholar] [CrossRef]
  15. McDowell, C.M.; Luan, T.; Zhang, Z.; Putliwala, T.; Wordinger, R.; Millar, J.C.; John, S.W.; Pang, I.-H.; Clark, A.F. Mutant human myocilin induces strain specific differences in ocular hypertension and optic nerve damage in mice. Exp. Eye Res. 2012, 100, 65–72. [Google Scholar] [CrossRef] [Green Version]
  16. Gramlich, O.W.; Godwin, C.R.; Heuss, N.D.; Gregerson, D.S.; Kuehn, M.H. T and B Lymphocyte Deficiency in Rag1−/− Mice Reduces Retinal Ganglion Cell Loss in Experimental Glaucoma. Investig. Ophthalmol. Vis. Sci. 2020, 61, 18. [Google Scholar] [CrossRef] [PubMed]
  17. Della Santina, L.; Inman, D.; Lupien, C.B.; Horner, P.J.; Wong, R.O.L. Differential progression of structural and functional alterations in distinct retinal ganglion cell types in a mouse model of glaucoma. J. Neurosci. 2013, 33, 17444–17457. [Google Scholar] [CrossRef] [PubMed]
  18. Sabharwal, J.; Seilheimer, R.L.; Tao, X.; Cowan, C.; Frankfort, B.J.; Wu, S.M. Elevated IOP alters the space-time profiles in the center and surround of both ON and OFF RGCs in mouse. Proc. Natl. Acad. Sci. USA 2017, 114, 8859–8864. [Google Scholar] [CrossRef] [PubMed] [Green Version]
  19. Puyang, Z.; Chen, H.; Liu, X. Subtype-dependent Morphological and Functional Degeneration of Retinal Ganglion Cells in Mouse Models of Experimental Glaucoma. J. Nat. Sci. 2015, 1, e103. [Google Scholar]
  20. Berry, R.H.; Qu, J.; John, S.W.M.; Howell, G.R.; Jakobs, T.C. Synapse Loss and Dendrite Remodeling in a Mouse Model of Glaucoma. PLoS ONE 2015, 10, e0144341. [Google Scholar] [CrossRef] [Green Version]
  21. Williams, P.A.; Tribble, J.R.; Pepper, K.W.; Cross, S.D.; Morgan, B.P.; Morgan, J.E.; John, S.W.M.; Howell, G.R. Inhibition of the classical pathway of the complement cascade prevents early dendritic and synaptic degeneration in glaucoma. Mol. Neurodegener. 2016, 11, 26. [Google Scholar] [CrossRef] [PubMed] [Green Version]
  22. Zhou, X.; Zhang, R.; Zhang, S.; Wu, J.; Sun, X. Activation of 5-HT1A Receptors Promotes Retinal Ganglion Cell Function by Inhibiting the cAMP-PKA Pathway to Modulate Presynaptic GABA Release in Chronic Glaucoma. J. Neurosci. 2019, 39, 1484–1504. [Google Scholar] [CrossRef] [Green Version]
  23. Zhou, X.; Zong, Y.; Zhang, R.; Zhang, X.; Zhang, S.; Wu, J.; Sun, X. Differential Modulation of GABAA and NMDA Receptors by an alpha7-nicotinic Acetylcholine Receptor Agonist in Chronic Glaucoma. Front. Mol. Neurosci. 2017, 10, 422. [Google Scholar] [CrossRef] [Green Version]
  24. Krizaj, D.; Ryskamp, D.A.; Tian, N.; Tezel, G.; Mitchell, C.H.; Slepak, V.Z.; Shestopalov, V.I. From mechanosensitivity to inflammatory responses: New players in the pathology of glaucoma. Curr. Eye Res. 2014, 39, 105–119. [Google Scholar] [CrossRef] [PubMed]
  25. Guo, Y.; Johnson, E.C.; Cepurna, W.O.; Dyck, J.A.; Doser, T.; Morrison, J.C. Early gene expression changes in the retinal ganglion cell layer of a rat glaucoma model. Investig. Ophthalmol. Vis. Sci. 2011, 52, 1460–1473. [Google Scholar] [CrossRef] [Green Version]
  26. Morrison, J.C.; Cepurna, W.O.; Tehrani, S.; Choe, T.E.; Jayaram, H.; Lozano, D.C.; Fortune, B.; Johnson, E.C. A Period of Controlled Elevation of IOP (CEI) Produces the Specific Gene Expression Responses and Focal Injury Pattern of Experimental Rat Glaucoma. Investig. Opthalmol. Vis. Sci. 2016, 57, 6700–6711. [Google Scholar] [CrossRef] [Green Version]
  27. Williams, P.A.; Howell, G.R.; Barbay, J.M.; Braine, C.E.; Sousa, G.; John, S.W.M.; Morgan, J.E. Retinal ganglion cell dendritic atrophy in DBA/2J glaucoma. PLoS ONE 2013, 8, e72282. [Google Scholar] [CrossRef] [PubMed]
  28. Risner, M.L.; Pasini, S.; Cooper, M.; Lambert, W.; Calkins, D.J. Axogenic mechanism enhances retinal ganglion cell excitability during early progression in glaucoma. Proc. Natl. Acad. Sci. USA 2018, 115, E2393–E2402. [Google Scholar] [CrossRef] [Green Version]
  29. Bach, M.; Unsoeld, A.S.; Philippin, H.; Staubach, F.; Maier, P.; Walter, H.S.; Bomer, T.G.; Funk, J. Pattern ERG as an early glaucoma indicator in ocular hypertension: A long-term, prospective study. Investig. Ophthalmol. Vis. Sci. 2006, 47, 4881–4887. [Google Scholar] [CrossRef] [PubMed] [Green Version]
  30. Wilsey, L.J.; Fortune, B. Electroretinography in glaucoma diagnosis. Curr. Opin. Ophthalmol. 2016, 27, 118–124. [Google Scholar] [CrossRef] [Green Version]
  31. Preiser, D.; Lagrèze, W.A.; Bach, M.; Poloschek, C.M. Photopic negative response versus pattern electroretinogram in early glaucoma. Investig. Ophthalmol. Vis. Sci. 2013, 54, 1182–1191. [Google Scholar] [CrossRef] [PubMed] [Green Version]
  32. Porciatti, V.; Saleh, M.; Nagaraju, M. The pattern electroretinogram as a tool to monitor progressive retinal ganglion cell dysfunction in the DBA/2J mouse model of glaucoma. Investig. Ophthalmol. Vis. Sci. 2007, 48, 745–751. [Google Scholar] [CrossRef] [Green Version]
  33. Zode, G.S.; Kuehn, M.H.; Nishimura, D.Y.; Searby, C.; Mohan, K.; Grozdanic, S.D.; Bugge, K.; Anderson, M.; Clark, A.F.; Stone, E.M.; et al. Reduction of ER stress via a chemical chaperone prevents disease phenotypes in a mouse model of primary open angle glaucoma. J. Clin. Investig. 2011, 121, 3542–3553. [Google Scholar] [CrossRef] [PubMed] [Green Version]
  34. Sandalon, S.; Könnecke, B.; Levkovitch-Verbin, H.; Simons, M.; Hein, K.; Sättler, M.B.; Bähr, M.; Ofri, R. Functional and structural evaluation of lamotrigine treatment in rat models of acute and chronic ocular hypertension. Exp. Eye Res. 2013, 115, 47–56. [Google Scholar] [CrossRef] [PubMed]
  35. Gallego, B.I.; Salazar, J.J.; De Hoz, R.; Rojas, B.; I Ramírez, A.; Navarro, M.Á.S.; Ortín-Martínez, A.; Soriano, F.J.V.; Avilés-Trigueros, M.; Pérez, M.P.V.; et al. IOP induces upregulation of GFAP and MHC-II and microglia reactivity in mice retina contralateral to experimental glaucoma. J. Neuroinflamm. 2012, 9, 92. [Google Scholar] [CrossRef] [PubMed] [Green Version]
  36. Piri, N.; Kwong, J.M.; Caprioli, J. Crystallins in retinal ganglion cell survival and regeneration. Mol. Neurobiol. 2013, 48, 819–828. [Google Scholar] [CrossRef] [PubMed] [Green Version]
  37. Kompass, K.S.; A Agapova, O.; Li, W.; Kaufman, P.L.; A Rasmussen, C.; Hernandez, M.R. Bioinformatic and statistical analysis of the optic nerve head in a primate model of ocular hypertension. BMC Neurosci. 2008, 9, 93. [Google Scholar] [CrossRef] [PubMed] [Green Version]
  38. Ding, Q.J.; Cook, A.C.; Dumitrescu, A.; Kuehn, M.H. Lack of immunoglobulins does not prevent C1q binding to RGC and does not alter the progression of experimental glaucoma. Investig. Ophthalmol. Vis. Sci. 2012, 53, 6370–6377. [Google Scholar] [CrossRef] [Green Version]
  39. Kuehn, M.H.; Kim, C.Y.; Ostojic, J.; Bellin, M.; Alward, W.L.; Stone, E.M.; Sakaguchi, D.; Grozdanic, S.D.; Kwon, Y. Retinal synthesis and deposition of complement components induced by ocular hypertension. Exp. Eye Res. 2006, 83, 620–628. [Google Scholar] [CrossRef] [PubMed]
  40. Ahmed, F.; Brown, K.M.; Stephan, D.A.; Morrison, J.C.; Johnson, E.C.; Tomarev, S.I. Microarray Analysis of Changes in mRNA Levels in the Rat Retina after Experimental Elevation of Intraocular Pressure. Investig. Ophthalmol. Vis. Sci. 2004, 45, 1247–1258. [Google Scholar] [CrossRef] [PubMed] [Green Version]
  41. Tezel, G.; Yang, X.; Luo, C.; Kain, A.D.; Powell, D.W.; Kuehn, M.H.; Kaplan, H.J. Oxidative stress and the regulation of complement activation in human glaucoma. Investig. Ophthalmol. Vis. Sci. 2010, 51, 5071–5082. [Google Scholar] [CrossRef]
  42. Stasi, K.; Nagel, D.; Yang, X.; Wang, R.-F.; Ren, L.; Podos, S.M.; Mittag, T.; Danias, J. Complement component 1Q (C1Q) upregulation in retina of murine, primate, and human glaucomatous eyes. Investig. Ophthalmol. Vis. Sci. 2006, 47, 1024–1029. [Google Scholar] [CrossRef] [Green Version]
  43. Wassle, H.; Koulen, P.; Brandstätter, J.H.; Fletcher, E.; Becker, C.-M. Glycine and GABA receptors in the mammalian retina. Vis. Res. 1998, 38, 1411–1430. [Google Scholar] [CrossRef] [Green Version]
  44. Euler, T.; Wassle, H. Different contributions of GABAA and GABAC receptors to rod and cone bipolar cells in a rat retinal slice preparation. J. Neurophysiol. 1998, 79, 1384–1395. [Google Scholar] [CrossRef]
  45. Eggers, E.D.; Lukasiewicz, P.D. Multiple pathways of inhibition shape bipolar cell responses in the retina. Vis. Neurosci. 2011, 28, 95–108. [Google Scholar] [CrossRef] [Green Version]
  46. Chen, C.T.; Alyahya, K.; Gionfriddo, J.R.; Dubielzig, R.R.; Madl, J.E. Loss of glutamine synthetase immunoreactivity from the retina in canine primary glaucoma. Vet. Ophthalmol. 2008, 11, 150–157. [Google Scholar] [CrossRef]
  47. Moreno, M.C.; Sande, P.; Marcos, H.A.; De Zavalía, N.; Sarmiento, M.I.K.; Rosenstein, R.E. Effect of glaucoma on the retinal glutamate/glutamine cycle activity. FASEB J. 2005, 19, 1161–1162. [Google Scholar] [CrossRef] [PubMed] [Green Version]
  48. Ishikawa, M. Abnormalities in glutamate metabolism and excitotoxicity in the retinal diseases. Scientifica 2013, 2013, 528940. [Google Scholar] [CrossRef] [PubMed] [Green Version]
  49. Shaked, I.; Ben-Dror, I.; Vardimon, L. Glutamine synthetase enhances the clearance of extracellular glutamate by the neural retina. J. Neurochem. 2002, 83, 574–580. [Google Scholar] [CrossRef] [PubMed] [Green Version]
  50. Harada, T.; Harada, C.; Nakamura, K.; Quah, H.-M.A.; Okumura, A.; Namekata, K.; Saeki, T.; Aihara, M.; Yoshida, H.; Mitani, A.; et al. The potential role of glutamate transporters in the pathogenesis of normal tension glaucoma. J. Clin. Investig. 2007, 117, 1763–1770. [Google Scholar] [CrossRef] [Green Version]
  51. Bak, L.K.; Schousboe, A.; Waagepetersen, H.S. The glutamate/GABA-glutamine cycle: Aspects of transport, neurotransmitter homeostasis and ammonia transfer. J. Neurochem. 2006, 98, 641–653. [Google Scholar] [CrossRef]
  52. Barnett, N.L.; Pow, D.V.; Robinson, S.R. Inhibition of Muller cell glutamine synthetase rapidly impairs the retinal response to light. Glia 2000, 30, 64–73. [Google Scholar] [CrossRef]
  53. Dhingra, A.; Vardi, N. “mGlu Receptors in the Retina”—WIREs Membrane Transport and Signaling. Wiley Interdiscip Rev. Membr. Transp. Signal 2012, 1, 641–653. [Google Scholar] [CrossRef] [Green Version]
  54. Cuenca, N.; Pinilla, I.; Fernández-Sánchez, L.; Salinas-Navarro, M.; Alarcón-Martínez, L.; Avilés-Trigueros, M.; De La Villa, P.; De Imperial, J.M.; Villegas-Pérez, M.P.; Vidal-Sanz, M. Changes in the inner and outer retinal layers after acute increase of the intraocular pressure in adult albino Swiss mice. Exp. Eye Res. 2010, 91, 273–285. [Google Scholar] [CrossRef] [PubMed]
  55. Pang, J.J.; Frankfort, B.J.; Gross, R.L.; Wu, S.M. Elevated intraocular pressure decreases response sensitivity of inner retinal neurons in experimental glaucoma mice. Proc. Natl. Acad. Sci. USA 2015, 112, 2593–2598. [Google Scholar] [CrossRef] [Green Version]
  56. Shen, Y.; Luo, X.; Liu, S.; Shen, Y.; Nawy, S.; Shen, Y. Rod bipolar cells dysfunction occurs before ganglion cells loss in excitotoxin-damaged mouse retina. Cell Death Dis. 2019, 10, 905. [Google Scholar] [CrossRef] [PubMed] [Green Version]
  57. Naisbitt, S.; Kim, E.; Tu, J.C.; Xiao, B.; Sala, C.; Valtschanoff, J.; Weinberg, R.J.; Worley, P.F.; Sheng, M. Shank, a novel family of postsynaptic density proteins that binds to the NMDA receptor/PSD-95/GKAP complex and cortactin. Neuron 1999, 23, 569–582. [Google Scholar] [CrossRef] [Green Version]
  58. Takeuchi, M.; Hata, Y.; Hirao, K.; Toyoda, A.; Irie, M.; Takai, Y. SAPAPs. A family of PSD-95/SAP90-associated proteins localized at postsynaptic density. J. Biol. Chem. 1997, 272, 11943–11951. [Google Scholar] [CrossRef] [PubMed] [Green Version]
  59. Crowston, J.G.; Kong, Y.X.G.; Trounce, I.; Dang, T.M.; Fahy, E.T.; Bui, B.; Morrison, J.C.; Chrysostomou, V. An acute intraocular pressure challenge to assess retinal ganglion cell injury and recovery in the mouse. Exp. Eye Res. 2015, 141, 3–8. [Google Scholar] [CrossRef]
  60. Stevens, B.; Allen, N.J.; Vazquez, L.E.; Howell, G.R.; Christopherson, K.S.; Nouri, N.; Micheva, K.D.; Mehalow, A.K.; Huberman, A.D.; Stafford, B.; et al. The classical complement cascade mediates CNS synapse elimination. Cell 2007, 131, 1164–1178. [Google Scholar] [CrossRef] [Green Version]
  61. Riese, R.J.; Wolf, P.R.; Brömme, D.; Natkin, L.R.; Villadangos, J.; Ploegh, H.L.; A Chapman, H. Essential role for cathepsin S in MHC class II-associated invariant chain processing and peptide loading. Immunity 1996, 4, 357–366. [Google Scholar] [CrossRef] [Green Version]
  62. Shi, G.P.; Villadangos, J.; Dranoff, G.; Small, C.; Gu, L.; Haley, K.J.; Riese, R.; Ploegh, H.L.; A Chapman, H. Cathepsin S required for normal MHC class II peptide loading and germinal center development. Immunity 1999, 10, 197–206. [Google Scholar] [CrossRef] [Green Version]
  63. Bailey, J.N.; Yaspan, B.L.; Pasquale, L.R.; Hauser, M.A.; Kang, J.H.; Loomis, S.J.; Brilliant, M.; Budenz, D.L.; Christen, W.G.; Fingert, J.; et al. Hypothesis-independent pathway analysis implicates GABA and acetyl-CoA metabolism in primary open-angle glaucoma and normal-pressure glaucoma. Hum. Genet. 2014, 133, 1319–1330. [Google Scholar] [CrossRef] [PubMed] [Green Version]
  64. Murshid, A.; Gong, J.; Calderwood, S.K. The role of heat shock proteins in antigen cross presentation. Front. Immunol. 2012, 3, 63. [Google Scholar] [CrossRef] [Green Version]
  65. Binder, R.J. Functions of heat shock proteins in pathways of the innate and adaptive immune system. J. Immunol. 2014, 193, 5765–5771. [Google Scholar] [CrossRef] [Green Version]
  66. Kasahara, M.; Flajnik, M.F. Origin and evolution of the specialized forms of proteasomes involved in antigen presentation. Immunogenetics 2019, 71, 251–261. [Google Scholar] [CrossRef]
  67. Williams, J.J.; Munro, K.M.; Palmer, T.M. Role of Ubiquitylation in Controlling Suppressor of Cytokine Signalling 3 (SOCS3) Function and Expression. Cells 2014, 3, 546–562. [Google Scholar] [CrossRef] [Green Version]
  68. Campello, L.; Esteve-Rudd, J.; Cuenca, N.; Martín-Nieto, J. The ubiquitin-proteasome system in retinal health and disease. Mol. Neurobiol. 2013, 47, 790–810. [Google Scholar] [CrossRef] [PubMed]
  69. Quaranta, L.; Bruttini, C.; Micheletti, E.; Konstas, A.G.; Michelessi, M.; Oddone, F.; Katsanos, A.; Sbardella, D.; De Angelis, G.; Riva, I. Glaucoma and neuroinflammation: An overview. Surv. Ophthalmol. 2021, 66, 693–713. [Google Scholar] [CrossRef] [PubMed]
  70. Imani, F.; Soloski, M.J. Heat shock proteins can regulate expression of the Tla region-encoded class Ib molecule Qa-1. Proc. Natl. Acad. Sci. USA 1991, 88, 10475–10479. [Google Scholar] [CrossRef] [Green Version]
  71. Davies, A.; Kalb, S.; Liang, B.; Aldrich, C.J.; Lemonnier, F.A.; Jiang, H.; Cotter, R.; Soloski, M.J. A peptide from heat shock protein 60 is the dominant peptide bound to Qa-1 in the absence of the MHC class Ia leader sequence peptide Qdm. J. Immunol. 2003, 170, 5027–5033. [Google Scholar] [CrossRef] [Green Version]
  72. Jiang, B.; Harper, M.; Kecova, H.; Aldamus, G.; Kardon, R.; Grozdanic, S.D.; Kuehn, M.H. Neuroinflammation in advanced canine glaucoma. Mol. Vis. 2010, 16, 2092–2108. [Google Scholar]
  73. Joachim, S.C.; Bruns, K.; Lackner, K.J.; Pfeiffer, N.; Grus, F.H. Antibodies to alpha B-Crystallin, Vimentin, and Heat Shock Protein 70 in Aqueous Humor of Patients with Normal Tension Glaucoma and IgG Antibody Patterns Against Retinal Antigen in Aqueous Humor. Curr. Eye Res. 2007, 32, 501–509. [Google Scholar] [CrossRef] [PubMed]
  74. Joachim, S.C.; Wax, M.B.; Seidel, P.; Pfeiffer, N.; Grus, F.H. Enhanced characterization of serum autoantibody reactivity following HSP 60 immunization in a rat model of experimental autoimmune glaucoma. Curr. Eye Res. 2010, 35, 900–908. [Google Scholar] [CrossRef]
  75. Wax, M.B.; Tezel, G.; Yang, J.; Peng, G.; Patil, R.V.; Agarwal, N.; Sappington, R.; Calkins, D.J. Induced autoimmunity to heat shock proteins elicits glaucomatous loss of retinal ganglion cell neurons via activated T-cell-derived fas-ligand. J. Neurosci. 2008, 28, 12085–12096. [Google Scholar] [CrossRef] [Green Version]
  76. Grotegut, P.; Hoerdemann, P.J.; Reinehr, S.; Gupta, N.; Dick, H.B.; Joachim, S.C. Heat Shock Protein 27 Injection Leads to Caspase Activation in the Visual Pathway and Retinal T-Cell Response. Int. J. Mol. Sci. 2021, 22, 513. [Google Scholar] [CrossRef] [PubMed]
  77. Chen, H.; Cho, K.-S.; Vu, T.H.K.; Shen, C.-H.; Kaur, M.; Chen, G.; Mathew, R.; McHam, M.L.; Fazelat, A.; Lashkari, K.; et al. Commensal microflora-induced T cell responses mediate progressive neurodegeneration in glaucoma. Nat. Commun. 2018, 9, 3209. [Google Scholar] [CrossRef]
  78. Tang, J.; Tang, Y.; Yi, I.; Chetn, D.F. The role of commensal microflora-induced T cell responses in glaucoma neurodegeneration. Prog. Brain Res. 2020, 256, 79–97. [Google Scholar] [PubMed]
  79. Kim, C.Y.; Kuehn, M.H.; Anderson, M.; Kwon, Y. Intraocular pressure measurement in mice: A comparison between Goldmann and rebound tonometry. Eye 2007, 21, 1202–1209. [Google Scholar] [CrossRef]
  80. Nadal-Nicolas, F.M.; Jiménez-Loópez, M.; Sobrado-Calvo, P.; Nieto-Loópez, L.; Cánovas-Martínez, I.; Salinas-Navarro, M.; Vidal-Sanz, M.; Agudo, M. Brn3a as a marker of retinal ganglion cells: Qualitative and quantitative time course studies in naive and optic nerve-injured retinas. Investig. Ophthalmol. Vis. Sci. 2009, 50, 3860–3868. [Google Scholar] [CrossRef] [Green Version]
  81. Hedberg-Buenz, A.; Christopher, M.A.; Lewis, C.J.; Fernandes, K.A.; Dutca, L.M.; Wang, K.; Scheetz, T.; Abramoff, M.; Libby, R.T.; Garvin, M.K.; et al. Quantitative measurement of retinal ganglion cell populations via histology-based random forest classification. Exp. Eye Res. 2015, 146, 370–385. [Google Scholar] [CrossRef] [Green Version]
  82. Dobin, A.; Davis, C.A.; Schlesinger, F.; Drenkow, J.; Zaleski, C.; Jha, S.; Batut, P.; Chaisson, M.; Gingeras, T.R. STAR: Ultrafast universal RNA-seq aligner. Bioinformatics 2013, 29, 15–21. [Google Scholar] [CrossRef] [PubMed]
  83. Love, M.I.; Huber, W.; Anders, S. Moderated estimation of fold change and dispersion for RNA-seq data with DESeq2. Genome Biol. 2014, 15, 550. [Google Scholar] [CrossRef] [PubMed] [Green Version]
  84. Jensen, L.J.; Kuhn, M.; Stark, M.; Chaffron, S.; Creevey, C.; Muller, J.; Doerks, T.; Julien, P.; Roth, A.; Simonovic, M.; et al. STRING 8—A global view on proteins and their functional interactions in 630 organisms. Nucleic Acids Res. 2009, 37, D412–D416. [Google Scholar] [CrossRef] [PubMed]
Figure 1. IOP and RGC density in Ad5.MYOC injected eyes. (A) Chronic IOP elevation is evident as early as one week after Ad5.MYOC vector injection into the anterior chamber of left eyes (Ad5.MYOC (OS), black squares) when compared to either normotensive contralateral eyes (Ad5.MYOC uninjected (OD), gray squares) or eyes having received Ad5.empty vector (Ad5.empty, blue circles; * p ˂ 0.001). (B) Loss of Brn3a+ RGC in hypertensive eyes nine weeks after intraocular Ad5.MYOC injection when compared to their contralateral uninjected eyes or to RGC density in Ad5.empty vector-injected eyes. Data in A and B are given as mean ± SD. Every point reflects counts from an individual eye. ns = not significant p > 0.05. (C) Regression analysis of RGC density in Ad5.MYOC injected eyes and Area Under Curve (AUC) IOP values demonstrate strong correlation, especially when using peripheral RGC data. (D) Representative images of Brn3a immunostaining of retinal wholemounts display reduced RGC density in the peripheral and mid-peripheral areas after IOP elevation (far right column).
Ijms 22 07581 g001
Figure 2. IOP and RCG density three weeks after induction of ocular hypertension. (A) The IOP profile indicates substantial induction of ocular hypertension using intraocular Ad5.MYOC injection when compared to their contralateral uninjected eyes. * p < 0.05 (B) Analysis of RGC density at that early time point indicates no significant loss in hypertensive eyes when compared to age-matched controls. Every point reflects counts from an individual eye. (C) Analysis of the percentage RGC loss after three and nine weeks of OHT indicates a slow progressive RGC loss, which is most prominent in the peripheral part of the retina.
Ijms 22 07581 g002
Figure 3. Retinal gene expression cluster analysis of hypertensive eyes using GO and KEGG pathway analysis. (A) Increased gene expression in glaucomatous retina early after induced pressure elevation is related to immune response, activation of the complement system, and increased expression of ribosomal genes related to the ubiquitin–proteasome system. (B) Decreased expression is found for genes encoding GABAA receptor subunits involving ligand–receptor interaction. Two additional clusters are found for the decreased expression of genes associated with axonal guidance and neuron projection.
Ijms 22 07581 g003
Figure 4. C1q accumulation and altered synaptic labeling in glaucomatous retinas. (A) Retinas of hypertensive eyes (Ad5.MYOC) display obvious accumulation of complement component C1 in the retinal ganglion cell layer (RGCL, arrows) when compared to naïve control retinas (ctrl). Decreased immunolabeling is evident for GABAA receptor and PDS95, indicating synaptic loss in the inner plexiform layer (IPL, arrows). Decrease in Brn3a positive cells was not noticed after 3 weeks of chronic IOP elevation (INL = inner nuclear layer, ONL = outer nuclear layer). (B) Changes in immunohistochemical labeling are in accordance with expression changes of corresponding genes. Values of fragments per kilobase of transcript per million mapped reads (FPKM) are given as mean ± SD and p-values were calculated using Student’s t-test.
Ijms 22 07581 g004
Figure 5. Pattern electroretinography (pERG) three weeks after IOP elevation. (A) Overlay of averaged traces demonstrating functional impairment in the 1 Hz pERG of hypertensive eyes (Ad5.MYOC, black squares) while age-matched naïve controls (ctrl, blue circles) and mice having received the empty Ad5 construct (Ad5.empty, gray squares) show normal pERG waveforms. (B) The P1 to N2 amplitude is significantly decreased when compared to naïve or Ad5.empty eyes. Scatter plots reflect data from individual eyes per group.
Ijms 22 07581 g005
Table 1. Gene expression changes after three weeks of Ad5.MYOC-induced ocular hypertension (Ad5.MYOC) when compared to naïve age-matched controls.
Downregulated mRNA Expression
GeneWT (FPKM ± SD)Glaucoma (FPKM ± SD)t Test
GABAA receptor and GABA neurotransmitter recyclingAdcy21871 ± 811671 ± 820.0133
Cacna1d979 ± 32874 ± 570.0182
Gabbr21790 ± 531543 ± 870.0029
Gabra12367 ± 1212034 ± 1820.0226
Gabrb2628 ± 29565 ± 360.0328
Gabrb32188 ± 1131954 ± 1100.0249
Gabrg3300 ± 11268 ± 90.0037
Gad16470 ± 3795441 ± 3970.0095
Gad21269 ± 681113 ± 760.0226
Glul47,282 ± 62133,233 ± 48400.0012
Gnao18319 ± 3387421 ± 5070.0257
Gng21226 ± 421066 ± 820.0132
Slc6a110,796 ± 6619056 ± 9130.0214
Slc38a15525 ± 2054845 ± 4050.0244
Cholinergic and glutamatergic synapsesAdcy21871 ± 811671 ± 820.0133
Cacna1d979 ± 32874 ± 570.0182
Camk4566 ± 33502 ± 230.0183
Chrm2195 ± 3172 ± 60.0004
Chrna4624 ± 34556 ± 340.0290
Dlgap31616 ± 871449 ± 430.0166
Glul47,282 ± 62133,233 ± 48400.0012
Gnao18319 ± 3387421 ± 5070.0257
Gng21226 ± 421066 ± 820.0132
Gria21711 ± 561469 ± 700.0016
Grm2339 ± 12299 ± 240.0284
Grm62334 ± 1632005 ± 1000.0136
Kcnj2217 ± 3195 ± 70.0015
Prkca6764 ± 1275909 ± 3500.0037
Shank11449 ± 951263 ± 670.0186
Slc5a7311 ± 17268 ± 100.0054
Slc38a15525 ± 2054845 ± 4060.0244
Axon guidanceDpysl21726 ± 561518 ± 760.0046
Dpysl51231 ± 241094 ± 560.0042
Efnb3522 ± 39451 ± 320.0327
Epha81215 ± 71997 ± 640.0038
L1cam1877 ± 1191655 ± 830.0223
Plxna11114 ± 63998 ± 470.0254
Rgs3726 ± 38646 ± 380.0251
Robo21986 ± 1121742 ± 1390.0334
Sema4g1067 ± 46905 ± 800.0123
Sema6b791 ± 37708 ± 280.0115
Slit1523 ± 24468 ± 180.0109
Slit22512 ± 1792146 ± 1380.0176
Srgap34500 ± 1933953 ± 2760.0176
Unc5b338 ± 12292 ± 280.0228
Upregulated mRNA Expression
GeneWT (FPKM ± SD)Glaucoma (FPKM ± SD)t Test
Antigen processing and presentationCtss561 ± 2071319 ± 3540.0101
H2-T23248 ± 48452 ± 1410.0336
Ifi30151 ± 12201 ± 290.0184
Psme2500 ± 19600 ± 490.0090
Tapbp1709 ± 1362287 ± 2680.0085
Complement cascadeA2m476 ± 1571269 ± 2970.0033
C1qa297 ± 92656 ± 1540.0072
C1qb324 ± 116715 ± 1790.0107
C1qc295 ± 102589 ± 1330.0125
C3ar152 ± 465 ± 60.0109
C4b835 ± 5992781 ± 11200.0221
Cfh309 ± 44412 ± 540.0248
Cfi68 ± 283 ± 90.0199
Pros1359 ± 41513 ± 1110.0405
Serping1411 ± 1861081 ± 4890.0430
Cytokine–cytokine receptor signaling Ccr544 ± 353 ± 40.0117
Csf1r444 ± 112865 ± 1750.0066
Cx3cr1199 ± 34306 ± 540.0153
Cxcl1041 ± 253 ± 90.0416
Dock261 ± 476 ± 80.0194
Gnb38209 ± 66311,825 ± 13070.0026
Hck41 ± 250 ± 50.0225
Il10ra62 ± 375 ± 60.0066
Jak3138 ± 13206 ± 400.0175
Ltbr198 ± 18252 ± 380.0430
Ncf165 ± 581 ± 90.0233
Osmr269 ± 55507 ± 1290.0146
Stat11613 ± 2932730 ± 7700.0351
Stat21117 ± 881343 ± 1580.0467
Stat31815 ± 2803209 ± 8460.0204
Tnfrsf1a308 ± 60517 ± 1390.0334
Vav150 ± 361 ± 60.0173
Clusters of differentiation Cd5257 ± 574 ± 90.0177
Cd5363 ± 376 ± 90.0296
Cd63975 ± 691351 ± 2230.0183
Cd6883 ± 9108 ± 160.0323
Cd7246 ± 455 ± 40.0171
Ribosomal subunitsRpl102480 ± 743010 ± 2500.0067
Rpl13a7349 ± 2478843 ± 7890.0112
Rpl173028 ± 1343756 ± 3620.0092
Rpl192983 ± 1333615 ± 2680.0055
Rpl322190 ± 692631 ± 1900.0048
Rpl412805 ± 983427 ± 3370.0121
Rpl97008 ± 3408670 ± 9610.0172
Rplp04190 ± 1385225 ± 4780.0059
Rplp15660 ± 986845 ± 5580.0058
Rps102794 ± 873379 ± 2840.0077
Rps122473 ± 1052973 ± 2230.0066
Rps144689 ± 2186181 ± 7860.0106
Rps155240 ± 1466408 ± 6230.0107
Rps183420 ± 1354242 ± 3790.0065
Rps192340 ± 1132826 ± 2280.0088
Rps202210 ± 582656 ± 2080.0061
Rps243900 ± 1054802 ± 3660.0032
Rps253129 ± 1383762 ± 3160.0105
Rps27a3820 ± 1184650 ± 3480.0040
Rps36347 ± 1707880 ± 8420.0118
Rps93916 ± 1424702 ± 3110.0037
Rras225 ± 16299 ± 530.0373
Rtp463 ± 480 ± 110.0207
Publisher’s Note: MDPI stays neutral with regard to jurisdictional claims in published maps and institutional affiliations.

