Abstract
Background: Metformin is commonly used to treat gestational diabetes mellitus. This study investigated the effect of maternal metformin intervention during obese glucose-intolerant pregnancy on the gonadal white adipose tissue (WAT) of 8-week-old male and female mouse offspring. Methods: C57BL/6J female mice were provided with a control (Con) or obesogenic diet (Ob) to induce pre-conception obesity. Half the obese dams were treated orally with 300 mg/kg/d of metformin (Ob-Met) during pregnancy. Gonadal WAT depots from 8-week-old offspring were investigated for adipocyte size, macrophage infiltration and mRNA expression of pro-inflammatory genes using RT-PCR. Results: Gestational metformin attenuated the adiposity in obese dams and increased the gestation length without correcting the offspring in utero growth restriction and catch-up growth caused by maternal obesity. Despite similar body weight, the Ob and Ob-Met offspring of both sexes showed adipocyte hypertrophy in young adulthood. Male Ob-Met offspring had increased WAT depot weight (p < 0.05), exaggerated adipocyte hyperplasia (p < 0.05 vs. Con and Ob offspring), increased macrophage infiltration measured via histology (p < 0.05) and the mRNA expression of F4/80 (p < 0.05). These changes were not observed in female Ob-Met offspring. Conclusions: Maternal metformin intervention during obese pregnancy causes excessive adiposity, adipocyte hyperplasia and WAT inflammation in male offspring, highlighting sex-specific effects of prenatal metformin exposure on offspring WAT.
1. Introduction
The prevalence of obesity is rising at sufficiently rapid rates such that over 50% of women of child-bearing age in the UK are currently overweight or obese [1]. Obesity is not only associated with adverse metabolic and cardiovascular events in the adult female [2], but, when present during pregnancy, it also has long-term ‘programming effects’ on exposed offspring that increase their risk of obesity, insulin resistance, type 2 diabetes and the metabolic syndrome [3].
Women with obesity are four times more likely to develop gestational diabetes mellitus (GDM) during pregnancy [4]. Metformin is the first-line pharmacological treatment for GDM in many countries, including the UK, when lifestyle interventions are ineffective, and its use has been increasing worldwide [5,6]. In pregnancy, metformin improves glucose tolerance in women with GDM, and metformin treatment is associated with a lower gestational weight gain compared to insulin or placebo in GDM or obese glucose-tolerant women, respectively [7,8]. Its oral administration, lack of requirement for refrigerated storage, and cost-effectiveness also make it more appropriate than insulin for use in low-resource settings. Therefore, it is plausible that metformin use in pregnancy might offer a suitable intervention to mitigate or negate the adverse effects of an obese diabetic intrauterine environment on offspring health globally. However, metformin readily crosses the placenta [9], and offspring follow-up in human randomised controlled trials investigating maternal metformin treatment remains sparse, with few studies reporting offspring outcomes beyond infancy [10,11,12,13,14,15]. However, the fact that several studies have reported an increased adiposity in children exposed to maternal metformin treatment in pregnancy warrants further investigation into the long-term effects [10,12,13]. Animal studies are therefore essential to determine the direct and indirect effects of maternal and in utero metformin exposure on offspring adiposity, adipose tissue biology and metabolic health. Moreover, animal studies allow the investigation of potentially sexually dimorphic effects, whereas human follow-up studies are often insufficiently powered to perform this analysis.
In our well-established mouse model of maternal diet-induced obesity [16], dams are fed an obesogenic diet high in both fat and sugar before mating and are consequently obese, hyperleptinaemic and hyperinsulinaemic at conception and develop glucose intolerance in pregnancy [16,17,18]. It was previously found that male offspring of obese dams develop obesity from 12 weeks of age, while adipocyte hypertrophy is present from as early as 8 weeks of age [16,19,20]. We and others have shown that the programming effects of maternal obesity on male rodent offspring adiposity and adipose tissue function can be ameliorated by maternal exercise intervention [17,21,22]. Although the effects of early life exposure to metformin on offspring body composition have been reported in several rodent models [23,24,25,26,27,28,29], the effects of clinically relevant maternal metformin intervention exclusively during obese glucose-intolerant pregnancy (and not lactation) on offspring WAT have not been studied. Furthermore, growing evidence indicates that programming effects can be sexually dimorphic, with males and females responding differently or showing a different time course of response to a suboptimal in utero environment [30], highlighting the importance of including both male and female offspring in this study.
This study therefore aimed to investigate the effect of maternal metformin intervention during obese glucose-intolerant pregnancy on 8-week-old offspring gonadal WAT using a mouse model of diet-induced obesity. Importantly, as it has emerged that there can be sex-specific effects of in utero exposures, this study included both male and female offspring. We report that maternal obesity caused gonadal adipocyte hypertrophy, which was not corrected by the metformin intervention. Instead, the metformin intervention increased adipocyte hyperplasia, macrophage infiltration and gonadal WAT inflammation in male but not female offspring.
2. Results
2.1. Metformin Attenuates Fat Mass in Diet-Induced Obese Dams
Ob and Ob-Met dams were fed an obesogenic diet prior to mating, and hence had a higher body weight and fat mass than Con dams did in late gestation (Table 1). The metformin intervention decreased maternal body weight and fat mass (but not lean mass) at E15.5. Maternal obesity caused a reduction in litter size (from 7 to 6 pups per litter, Table 1). This reduction was not prevented by maternal metformin treatment (Table 1). Maternal obesity also led to a decreased pup weight on postnatal day 2 (PN2) (from 1.9 to 1.6 g per pup, Table 1). This growth restriction was not prevented by maternal metformin administration (Table 1), despite the increased gestation length observed in metformin-treated obese pregnancies (Table 1).

Table 1.
Dam body composition and pregnancy outcomes. * p < 0.05, ** p < 0.01, *** p < 0.001, **** p < 0.0001 vs. Con, # p < 0.05, ## p < 0.01, ### p < 0.001 vs. Ob using one-way ANOVA with Tukey’s multiple comparison test, Kruskal–Wallis test for nonparametric data (gestation length and litter size) or ANOVA performed on log-transformed data (PN2 weight). E15.5 = embryonic day 15.5. ns = not significant. PN2 = postnatal day 2.
2.2. Maternal Metformin Treatment Induces Adiposity in Male but Not Female Offspring
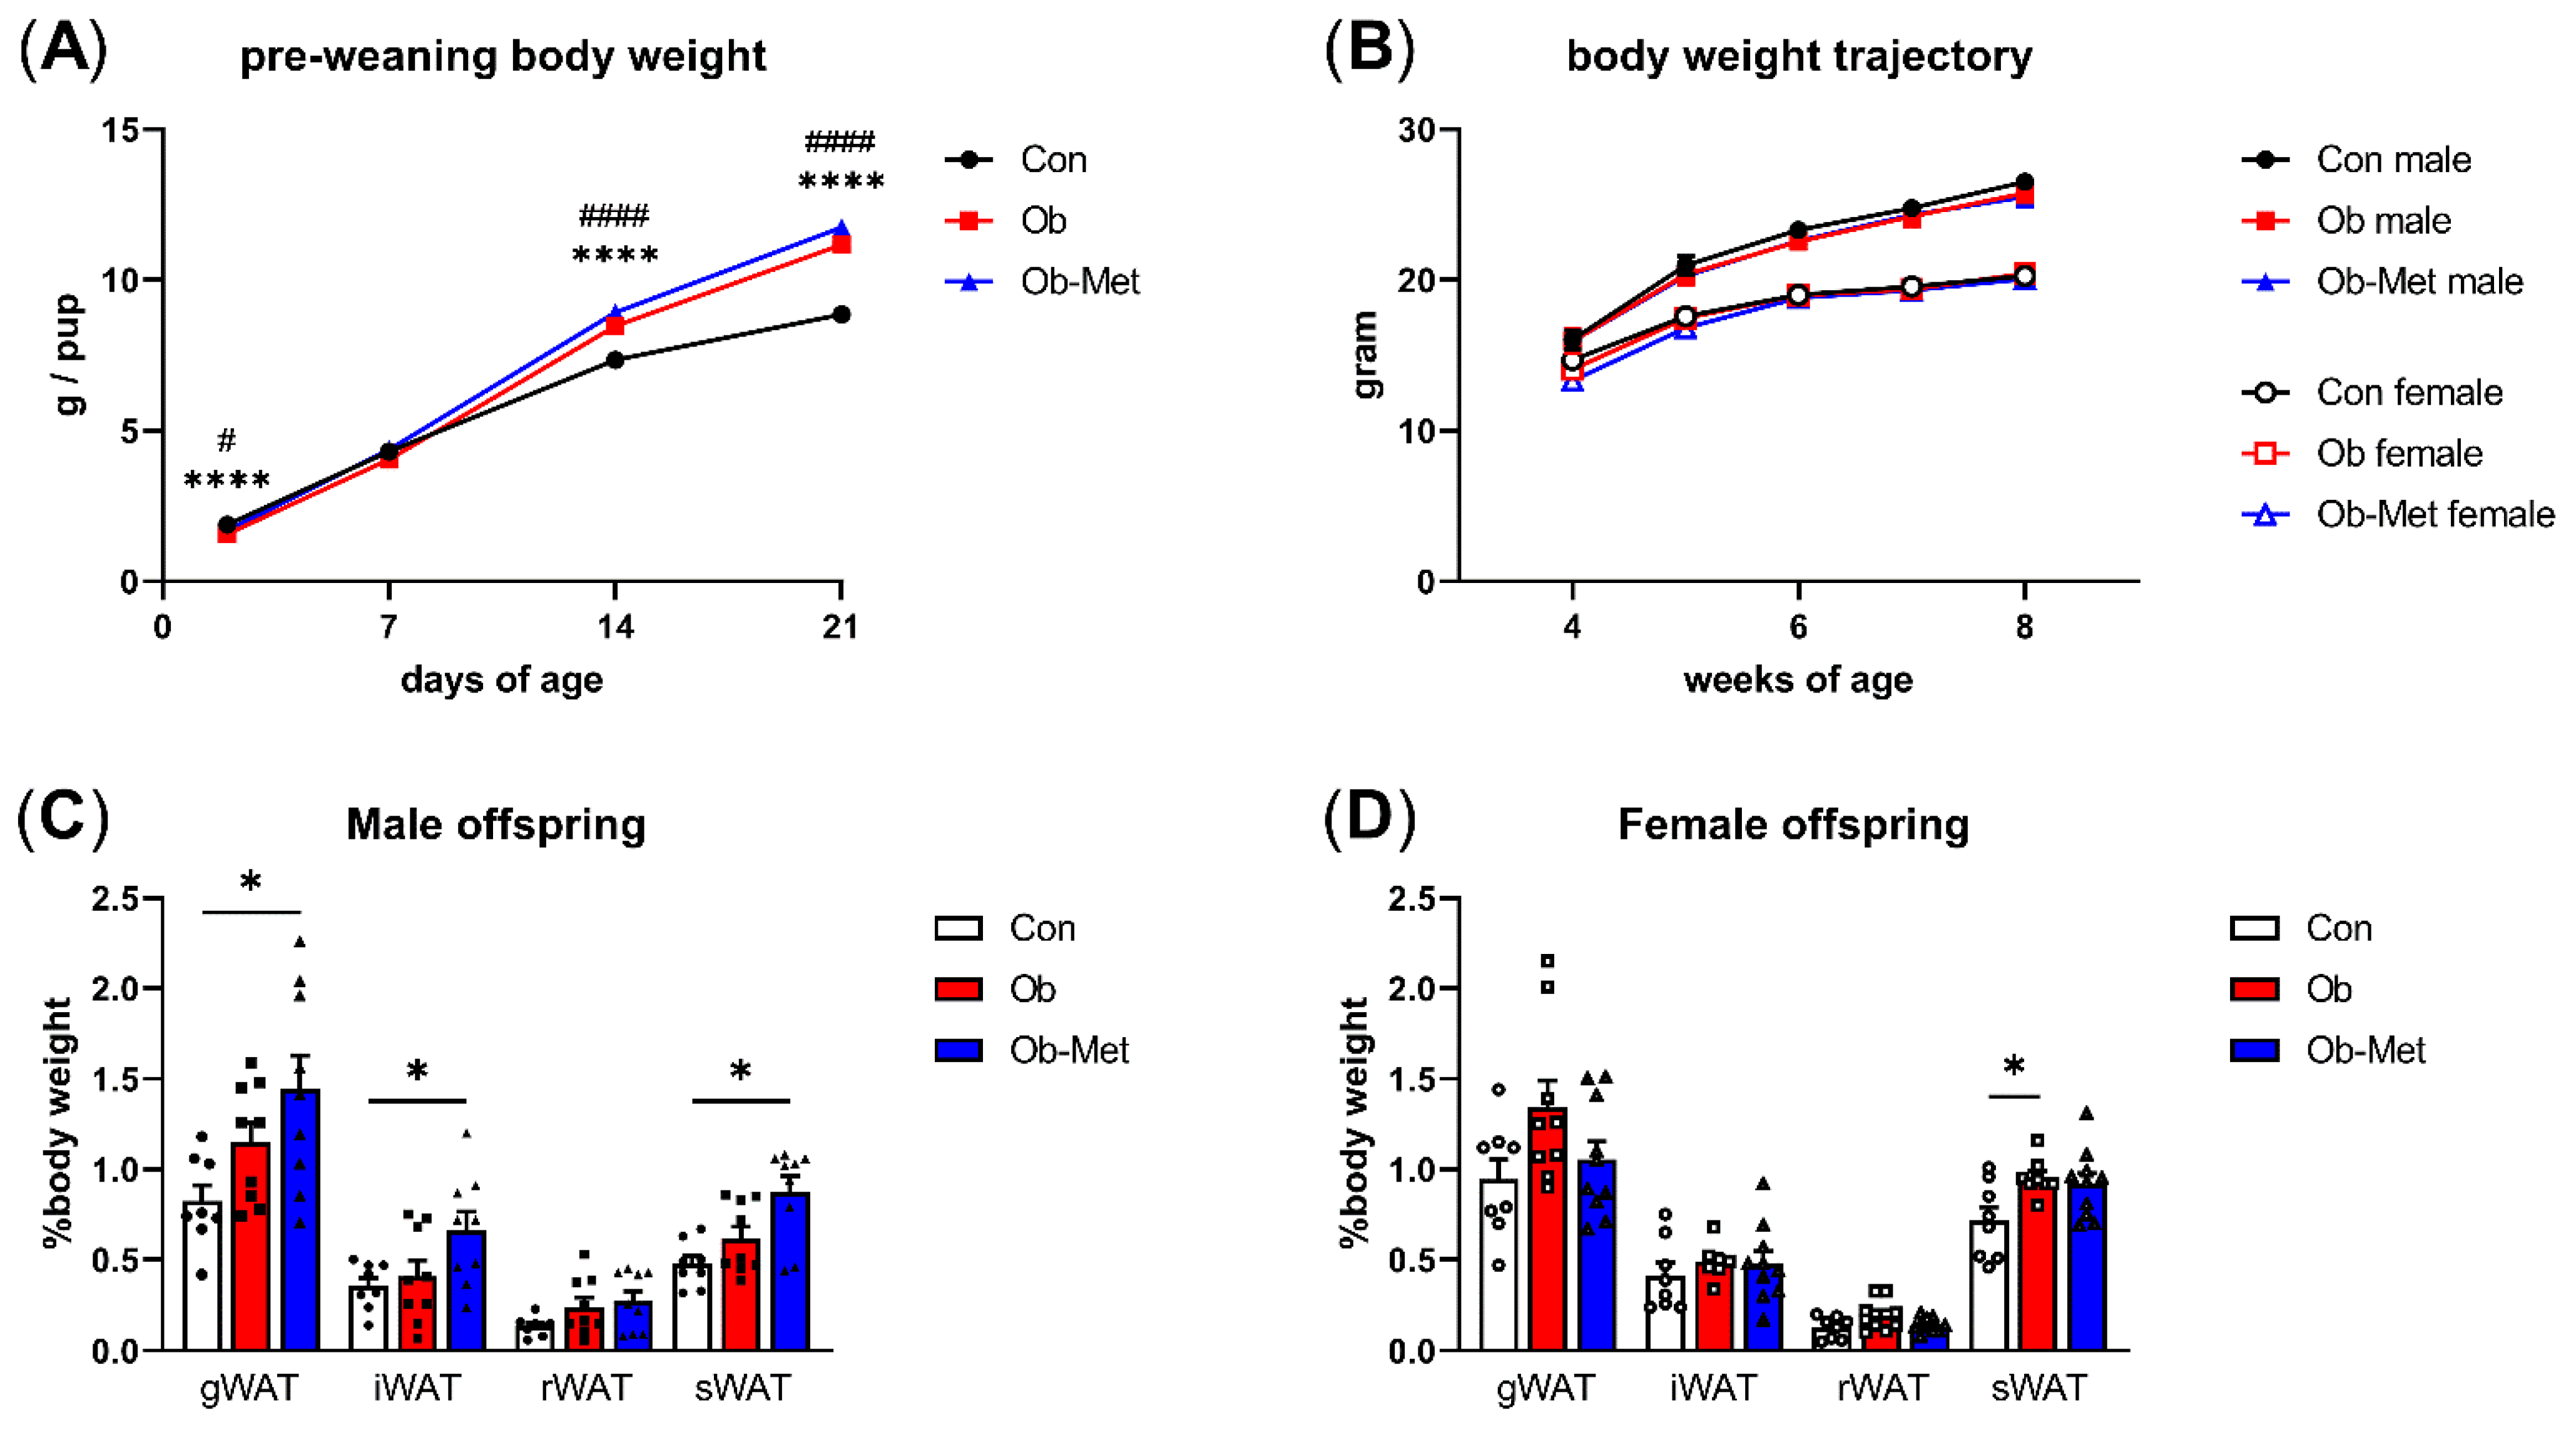
Pups born to Ob dams were lighter at PN2 but displayed catch-up growth leading to higher pup weights than the controls by PN14, and this difference remained at PN21. This was not corrected by the metformin intervention (Figure 1A). After weaning, there were no differences in body weight between any of the three groups up to 8 weeks of age (Figure 1B). However, the weights of the gonadal, intraperitoneal, and subcutaneous WAT depots at 8 weeks of age were significantly increased in male Ob-Met offspring (Figure 1C). This was not observed in female Ob-Met offspring (Figure 1D).
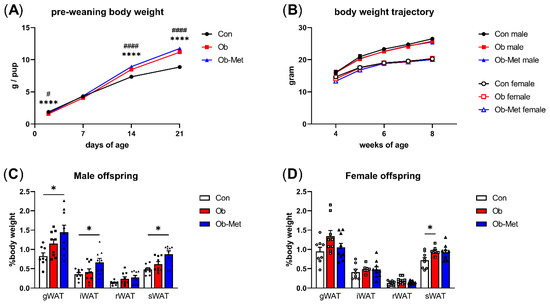
Figure 1.
Offspring growth and adiposity in 8-week-old offspring. (A) Growth trajectory of neonatal offspring (n = 26–33 independent litters per group, sexes combined). **** p < 0.0001 vs. Con vs. Ob, # p < 0.05, #### p < 0.001 Con vs. Ob-Met using two-way ANOVA with Tukey’s multiple comparison test. (B) Post-weaning body weight trajectory in male and female offspring until 8 weeks of age (n = 10–14 independent litters per group). (C,D) Weight of white adipose tissue (WAT) depots collected at 8 weeks of age relative to offspring body weight (n = 8–10 independent litters per group). Outliers were excluded from (C) iWAT and sWAT; female Ob (Grubb’s method, outlier excluded values 1.03% and 1.45%, respectively). * p < 0.05 using one-way ANOVA with Tukey’s multiple comparison test. gWAT = gonadal depot, iWAT = intraperitoneal depot, rWAT = retroperitoneal depot, sWAT = subcutaneous depot. Con (circles, solid line) = offspring of control-fed dams, Ob (squares, dashed line) = offspring of obese dams, Ob-Met (triangles, dotted and dashed line) = offspring of obese metformin-treated dams. Panels (B–D): closed symbols denote male offspring; open symbols denote female offspring.
2.3. Metabolic Health Is Not Affected by Maternal Obesity or Metformin Exposure
Serum insulin did not significantly differ between groups in either male (Con 50 ± 6, Ob 67 ± 6, Ob-Met 73 ± 10 pmol/L, p = 0.1697, one-way ANOVA) or female offspring (Con 77 ± 15, Ob 67 ± 7, Ob-Met 52 ± 4 pmol/L, p = 0.1417, one-way ANOVA). Similarly, there was no difference in glucose tolerance, as measured by the intraperitoneal glucose tolerance test in male (Con 1340 ± 51, Ob 1448 ± 57, Ob-Met 1343 ± 67 AUC, p = 0.3463, one-way ANOVA) or female offspring (Con 1209 [1183–1321], Ob 1274 [1106–1379], Ob-Met 1235 [1160–1416] AUC, p = 0.9920, Kruskal–Wallis test).
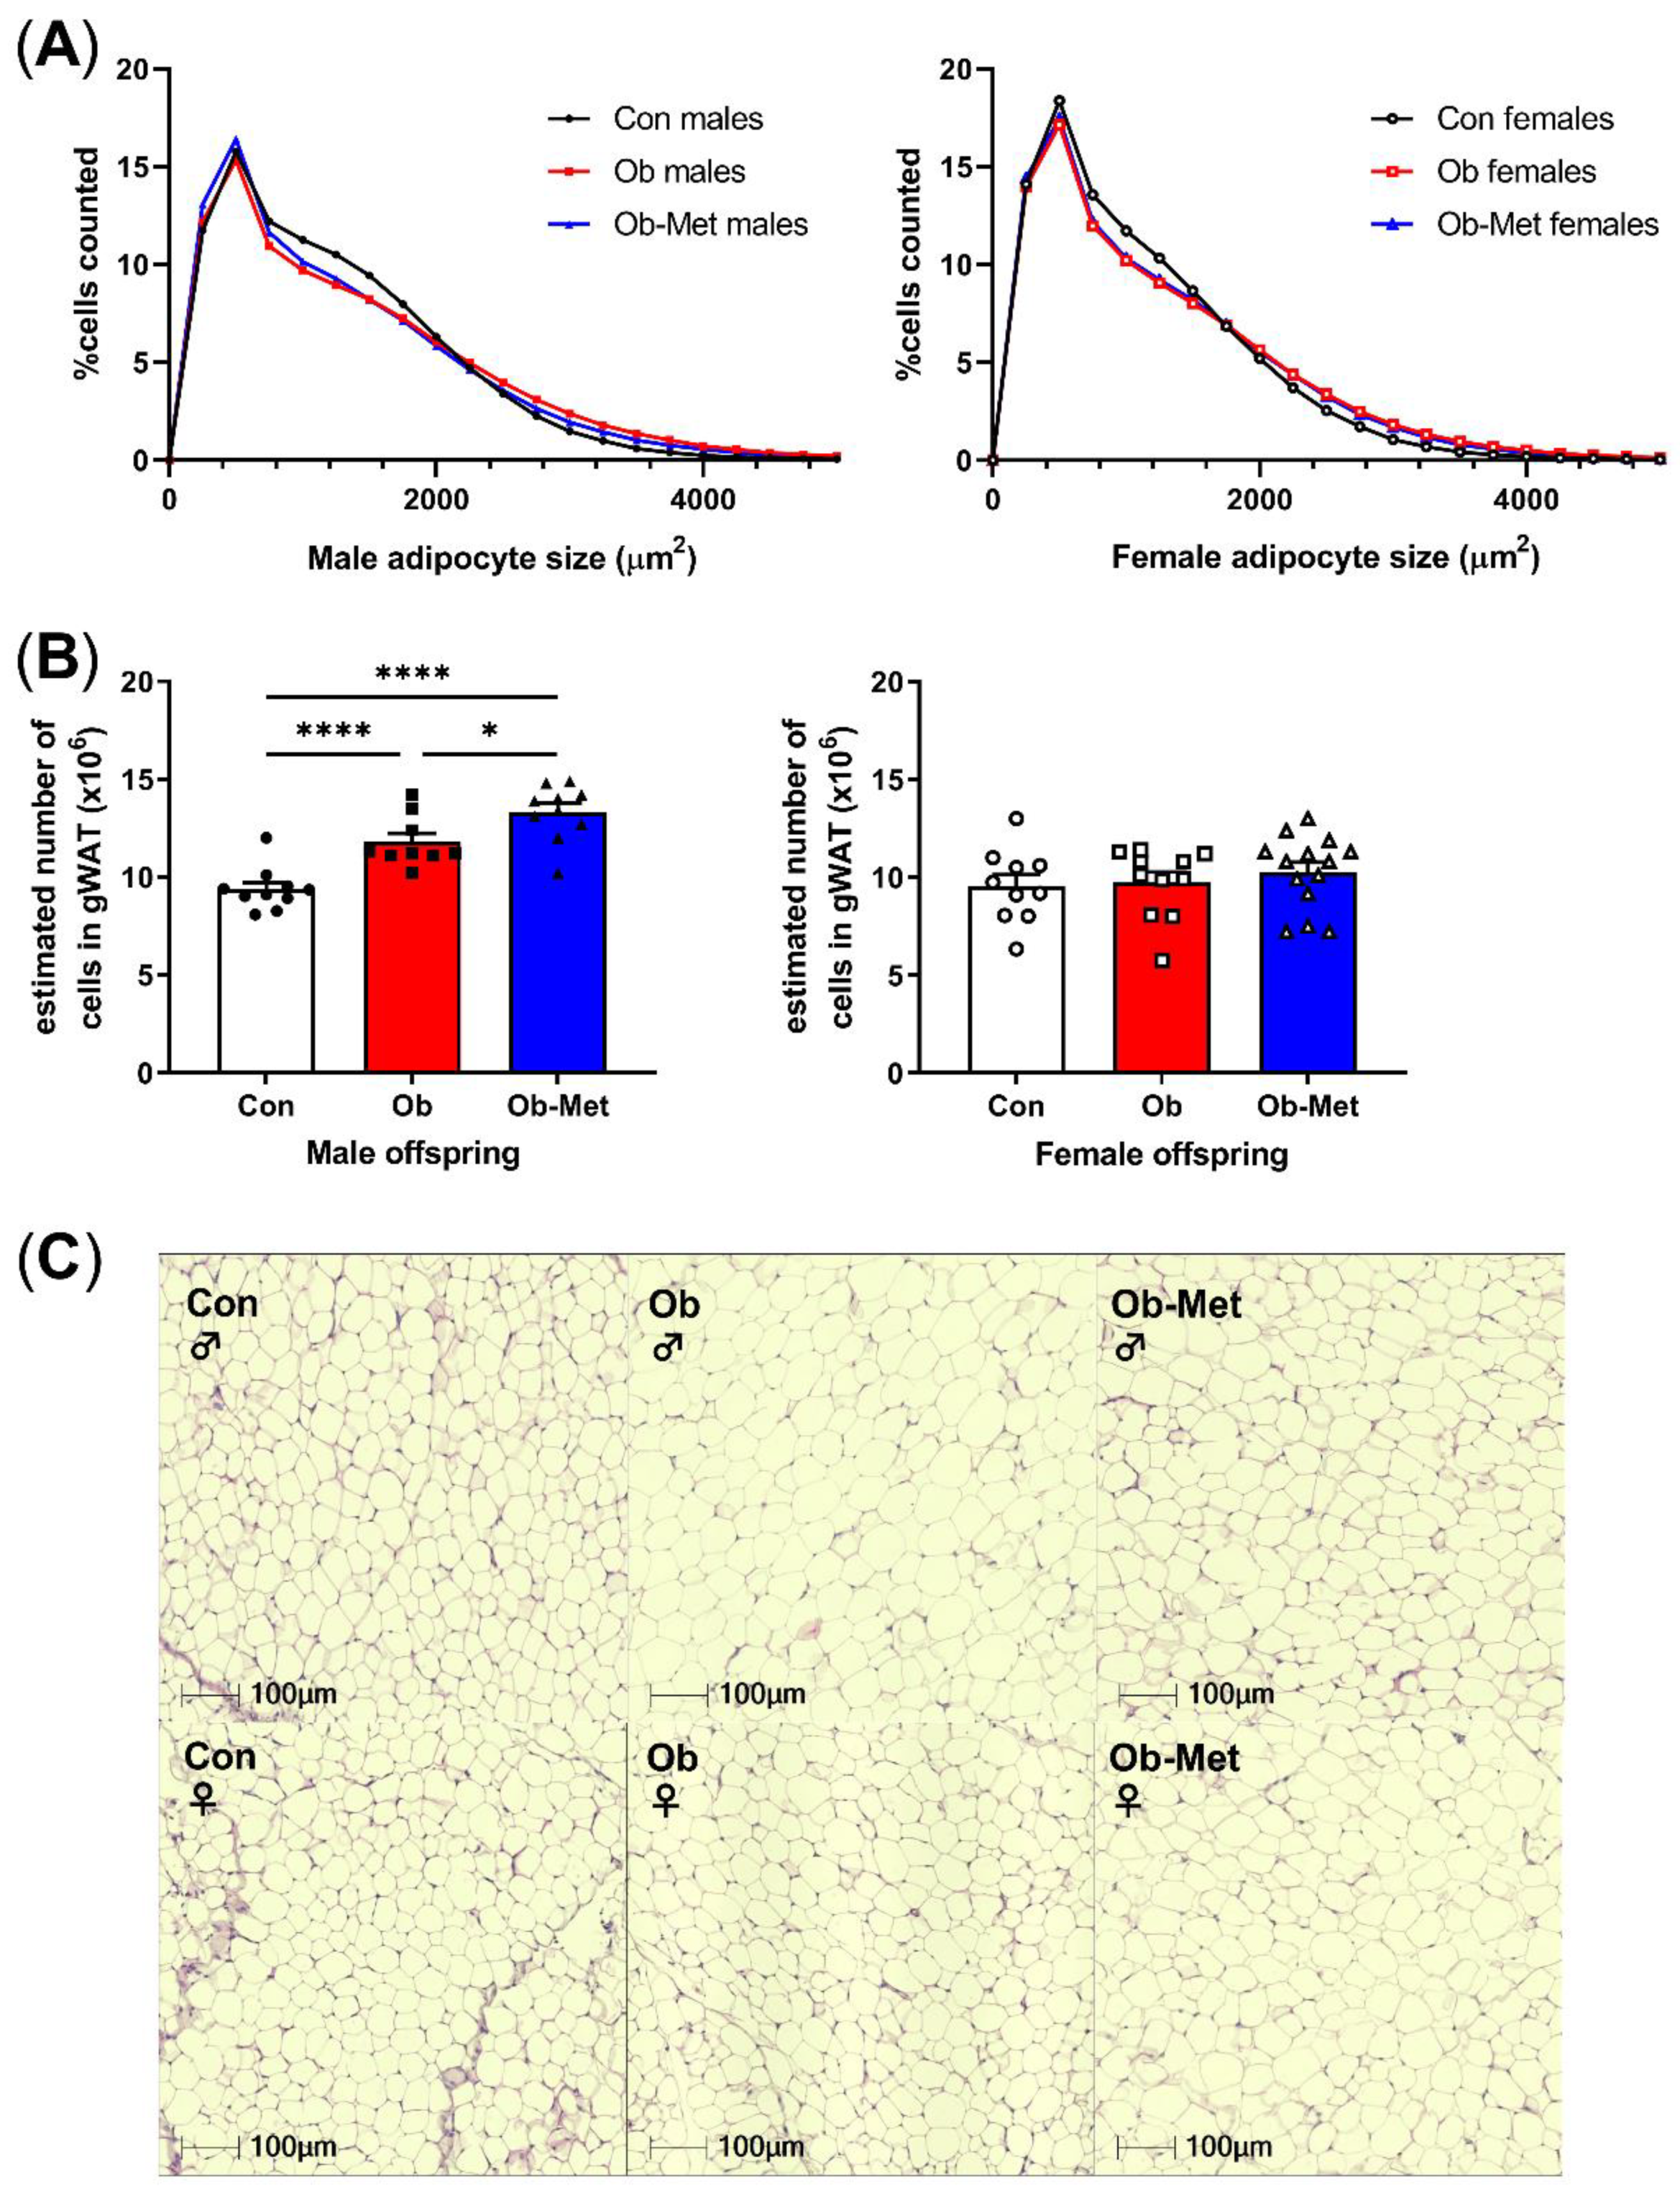
2.4. Gonadal WAT Cellularity Is Altered by Maternal Obesity and Metformin Intervention
Male and female Ob and Ob-Met offspring showed gonadal adipocyte hypertrophy indicated by the rightward shift in the adipocyte size distribution compared to Con offspring (Figure 2A,C, p < 0.0001 for the interaction between the maternal environment and adipocyte size, two-way ANOVA). This was particularly apparent in the larger adipocyte range, although male Ob-Met offspring also showed an increase in small adipocytes (Figure 2A, left). Maternal obesity increased the estimated adipocyte number in male but not female offspring, and this was exaggerated by exposure to maternal metformin treatment with male offspring of obese metformin-treated dams having significantly more adipocytes than male offspring of obese (and control) dams did (Figure 2B).
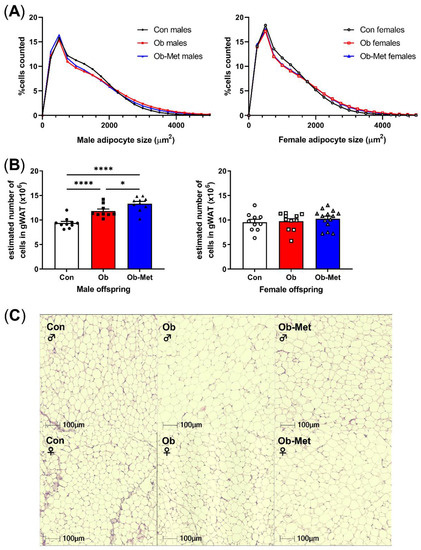
Figure 2.
Cellularity of 8-week-old gonadal adipocytes. (A) Adipocyte size distribution in male (left) and female (right) 8-week-old offspring. (B) Estimated adipocyte number in the collected gonadal white adipose tissue (WAT) depot. * p < 0.05, **** p < 0.0001 using one-way ANOVA with Tukey’s multiple comparison test. (C) Representative images of H&E-stained sections used for cell size analysis. Con (circles, solid line) = offspring of control-fed dams, Ob (squares, dashed line) = offspring of obese dams, Ob-Met (triangles, dotted and dashed line) = offspring of obese metformin-treated dams. Closed symbols denote male offspring; open symbols denote female offspring. n = 9–14 independent litters per group. Outliers were excluded from (B); male Con (Grubb’s method, outlier excluded value 6.28 × 10⁶).
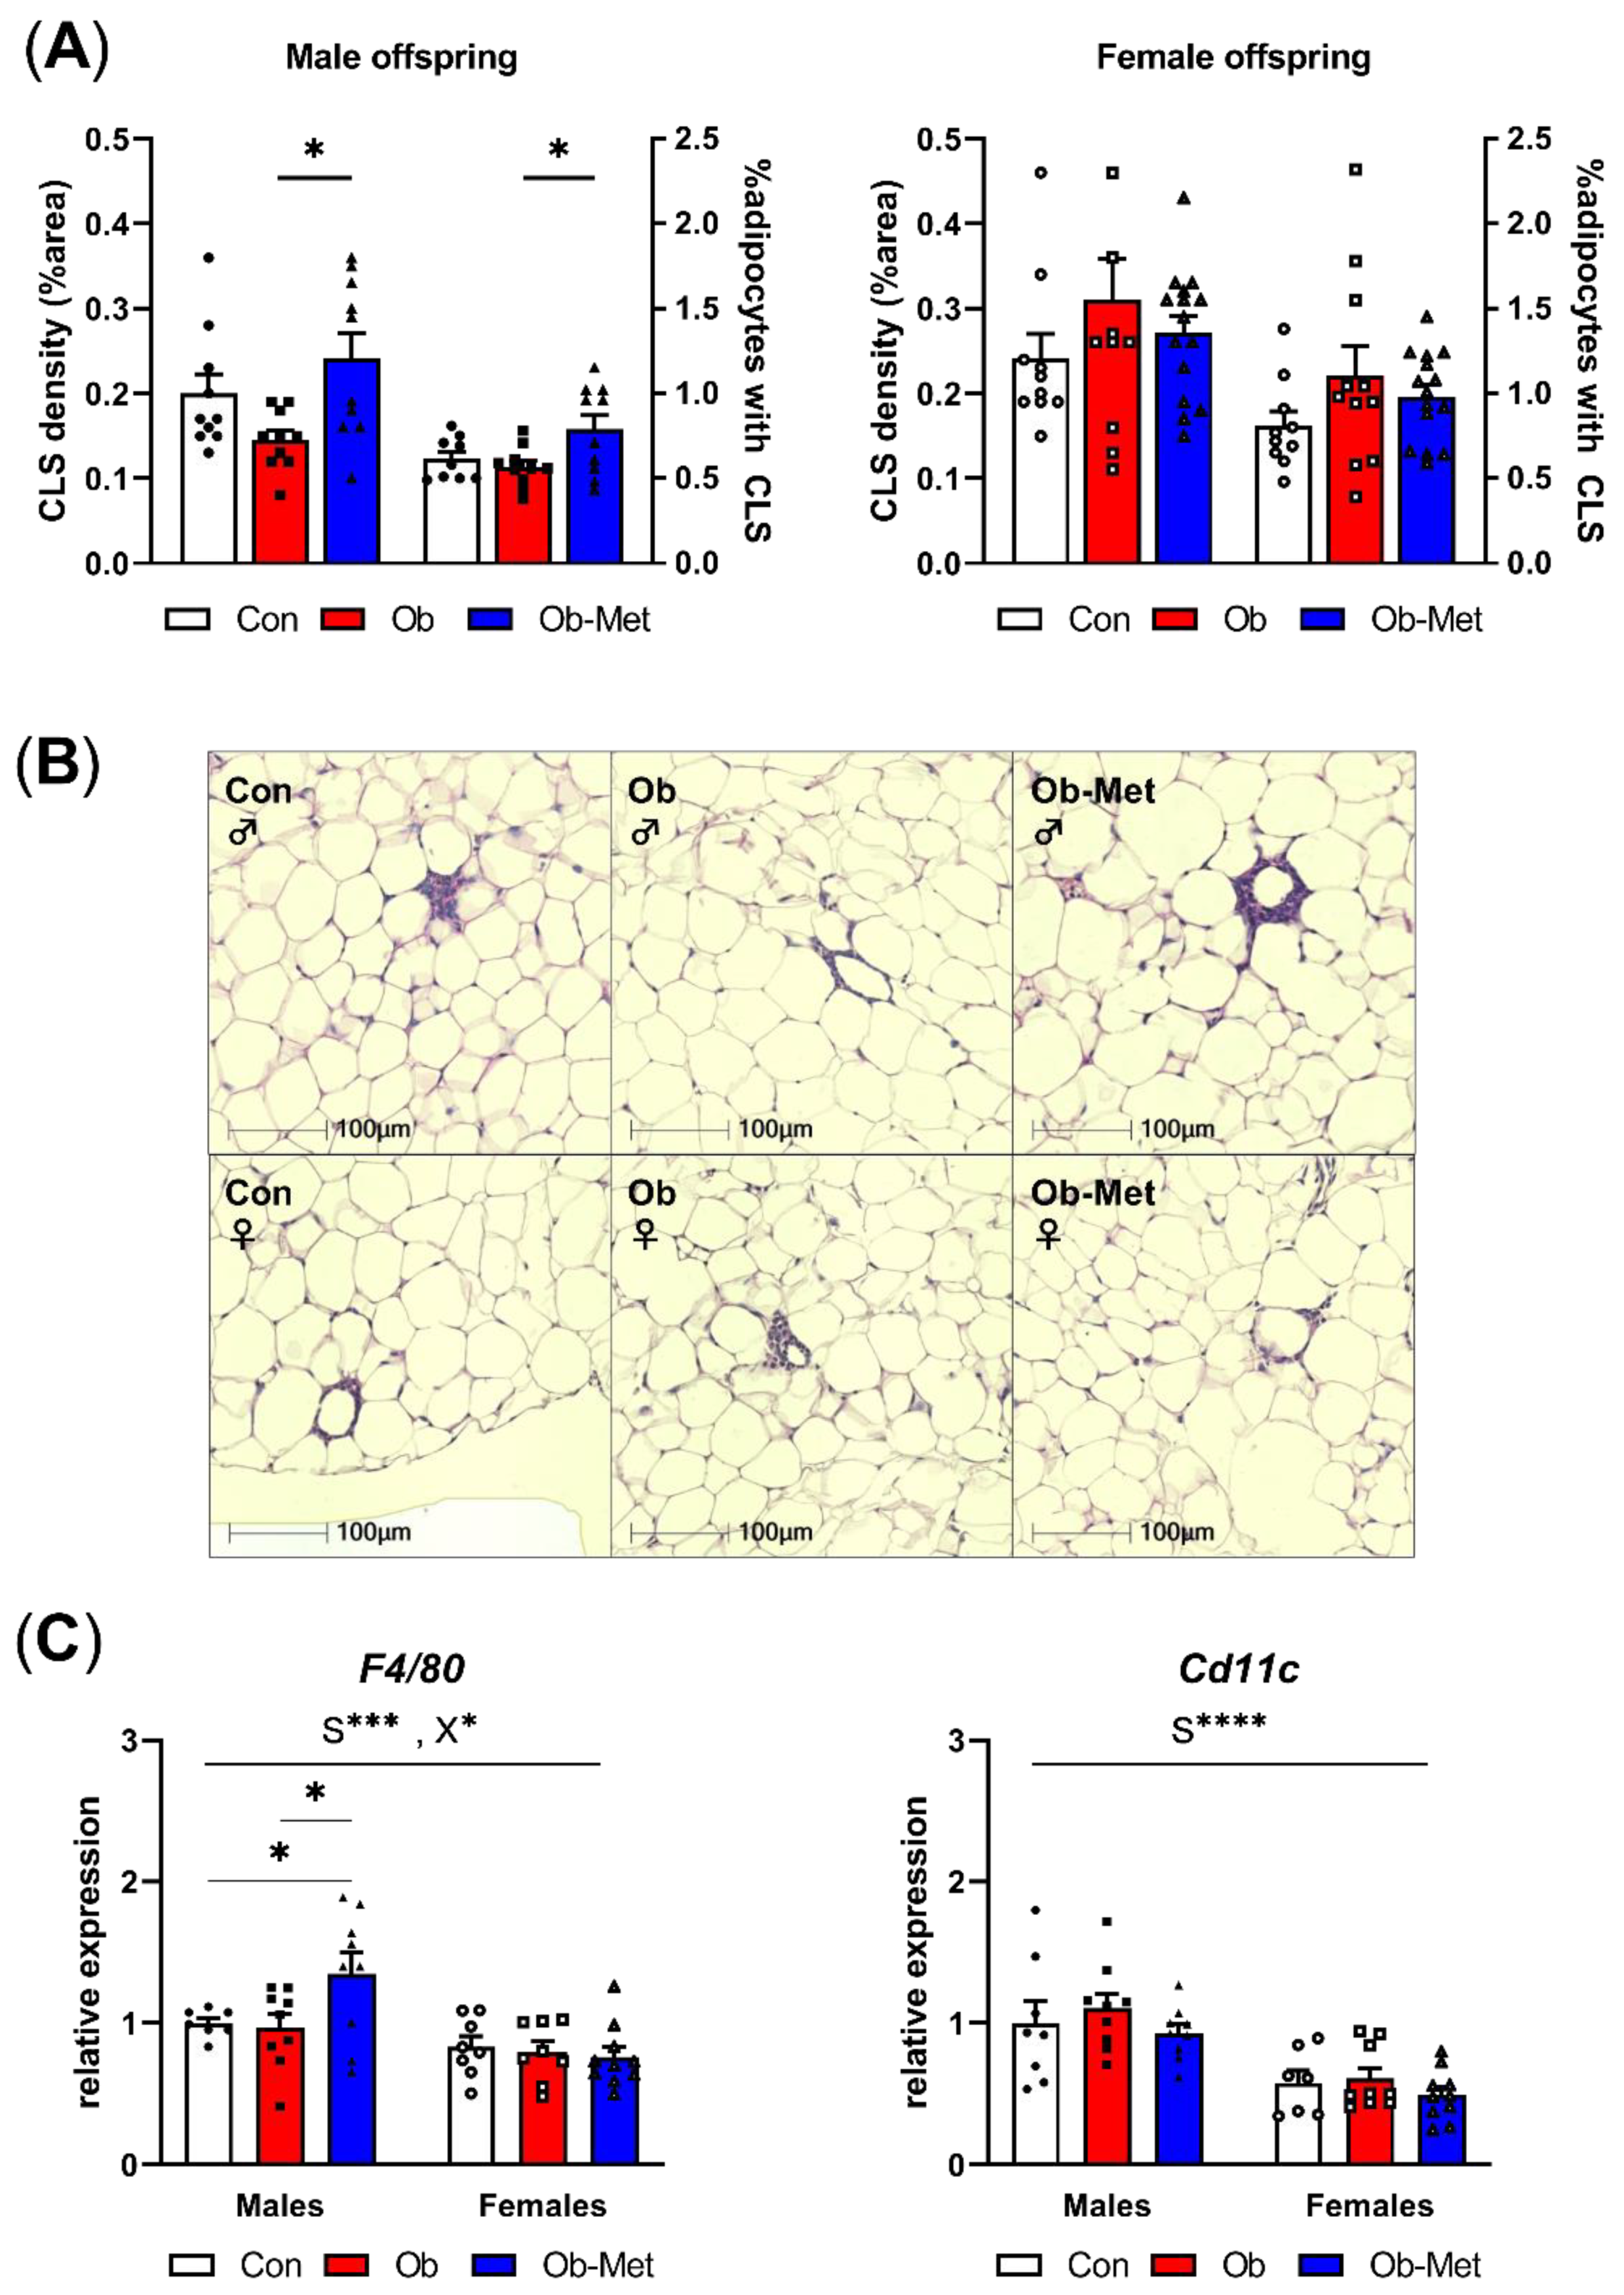
2.5. Maternal Metformin Introduces Gonadal WAT Inflammation in Male Offspring
Male Ob-Met offspring showed increased CLS in adipose tissue, indicating a pro-inflammatory signature of the gonadal WAT (Figure 3A,B). This was not seen in female offspring. Accordingly, the expression of the macrophage marker F4/80 was specifically increased in male Ob-Met offspring compared to both Con and Ob offspring WAT (Figure 3C). Cd11c (a pro-inflammatory M1-type macrophage marker) expression was not affected by maternal obesity or metformin treatment. Overall, F4/80 and Cd11c expressions were lower in female compared to male WAT.
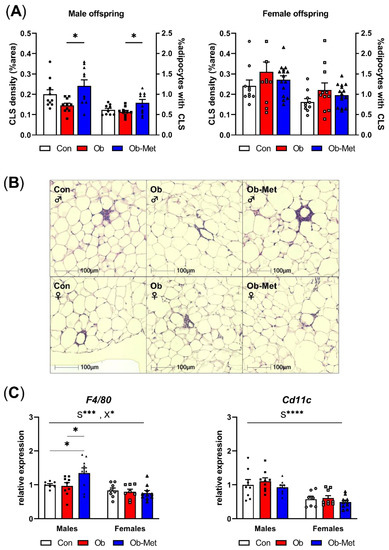
Figure 3.
Inflammation in gonadal white adipose tissue. (A) Presence of crown-like structures (CLS) in gonadal white adipose tissue (WAT) of 8-week-old male (left) and female (right) offspring, expressed as percentage area of the WAT tissue and as the number of CLS divided by the number of adipocytes in the section (n = 10–15 independent litters per group). * p < 0.05 using one-way ANOVA with Tukey’s multiple comparison test. (B) Representative images of H&E-stained sections used for CLS analysis. (C) mRNA expression of macrophage markers in gonadal WAT relative to the expression of housekeeper gene Ppia and the male Con group (n = 7–10 independent litters per group). * p < 0.05, *** p < 0.001, **** p < 0.0001 for the main effect of sex (S), interaction between sex and the maternal environment (X) or Tukey’s multiple comparison using two-way ANOVA. Outliers were excluded from (A) CLS density; female Con (Grubb’s method, outlier excluded value 0.46%), and (A) %adipocytes with CLS; male Con (Grubb’s method, outlier excluded value 1.19%). From (C) F4/80, two data points were excluded due to pipetting errors (male Con and female Ob). From (C) Cd11c, one data point was excluded due to pipetting errors (female Con).
3. Discussion
This study showed that maternal metformin treatment during obese pregnancy decreased maternal fat mass and body weight in late gestation, but failed to correct the decreased litter size, growth restriction with catch-up growth phenotype and adipocyte hypertrophy in offspring exposed to maternal obesity. Moreover, in 8-week-old male offspring, maternal metformin intervention exaggerated the adiposity phenotype characterised by excessive adipocyte hyperplasia, macrophage infiltration and expression of pro-inflammatory genes. This was not observed in female offspring.
Metformin is known to reduce body weight in nonpregnant type 2 diabetic patients [31], and an effect of metformin to lower gestational weight gain is a common observation in human trials in GDM, polycystic ovary syndrome (PCOS) and obese women [8,32,33]. Our findings of lower body weight and fat mass, consistent with a protective effect of metformin on diet-induced obesity in late gestation, are therefore in accordance with human data, supporting the validity of our model in assessing other effects of metformin treatment during pregnancy, including the potential long-term effects of metformin exposure in utero on offspring health. As metformin can cross the placenta and enter the foetal circulation, attaining similar circulating concentrations to those in the mother, the need for long-term follow-up studies has been highlighted [34]. As these studies are both challenging to carry out and take many years in humans, animal models are important to address this question.
Maternal obesity during pregnancy is associated with an increased risk of both small and large for gestational age babies [35]. Consistent with previous studies in the model [16,36,37], we observed growth restriction followed by catch-up growth in offspring exposed to maternal obesity. The combination of low birth weight and accelerated postnatal growth is associated with long-term adverse effects on offspring cardiometabolic health in human studies [38,39,40,41] and animal models [42,43]. The metformin intervention did not correct (or worsen) this pattern of early growth. However, our study is the first to report that metformin intervention in the obese mouse dam increased gestation time by one day. Therefore, the equivalent growth restriction observed in both Ob and Ob-Met pups, despite the delay in parturition, might suggest that metformin-exposed foetuses would be further growth-restricted compared to nonexposed foetuses if assessed on the same gestational day.
The mechanism by which metformin causes adiposity in male offspring is unclear. Metformin is known to activate AMPK, causing inhibition of mTOR, decreased cell proliferation, suppression of protein synthesis and cell cycle arrest [34]. Such a mechanism acting on foetal tissue could explain the relative growth restriction observed, which is masked in terms of birthweight due to the delay in parturition. Providing metformin in obese pregnancy but not lactation may thus reflect a model of growth restriction (due to metformin) with catch-up growth (following metformin removal at birth) similar to studies in which recuperated offspring displayed rapid post-natal growth following in utero low-protein exposure [42]. This was also proposed by Salomäki et al. who drew a comparison between their model of gestational metformin treatment to chow-fed dams and developmental programming by maternal undernutrition [26]. Indeed, when looking at studies investigating male offspring adiposity in nontransgenic rodent models (including the current study), metformin was only detrimental to offspring body composition in situations where this cellular ‘starvation’ was followed by restored or increased energy balance in lactation, whereas continued metformin treatment or switching to a healthy diet postnatally was associated with protective effects [23,25,26]. Whether this relates to direct effects of metformin signalling on foetal development or indirectly through effects on maternal metabolism is unclear. Combined with the increased gestation length in this study and the human data summarised above, this suggests that metformin may adversely affect intrauterine development, particularly for male offspring.
At 8 weeks of age, the body weight and weight of both visceral (epididymal, intraperitoneal and retroperitoneal) and subcutaneous WAT depots did not differ between Con and Ob offspring despite evidence of gonadal adipocyte hypertrophy in both sexes, in accordance with previous reports in male offspring [19]. In contrast, maternal metformin treatment introduced male-specific increased adiposity, while female offspring were unaffected. The increased adiposity in male Ob-Met compared to Ob offspring was likely driven by hyperplasia as adipocyte size was unaffected by the metformin intervention. This early life hypercellularity may predispose offspring to becoming obese later in life by increasing the lifelong lipid-storage capacity of WAT. In addition to being increased in mass, the hypertrophic gonadal WAT of males exposed to metformin in utero displayed increased CLS density and mRNA expression of the macrophage marker F4/80, indicative of enhanced macrophage infiltration. This was not seen in Ob offspring, indicating a more progressive WAT dysfunction phenotype in Ob-Met offspring despite similar levels of hypertrophy, a known stimulus for macrophage invasion [44]. The percentage of adipocytes surrounded by CLS, a marker of adipocyte death [44,45], was also increased in Ob-Met compared to Ob offspring. This suggests that in utero metformin exposure increased the adipocyte death rate in male Ob-Met WAT, leading to the recruitment of immune cells, phagocytosis of necrotic adipocytes and production of pro-inflammatory mediators. The increased prevalence of CLS in Ob-Met gonadal WAT may be related to the increased hyperplasia as ‘obesity-induced adipocyte death’ has been suggested as the limiting factor to adipocyte hypertrophy and may underlie the switch from hypertrophic to hyperplastic adiposity [44]. Inflammation is a major contributor to adipose tissue insulin resistance. However, no adverse metabolic phenotype was observed in Ob-Met offspring at this age. This is not surprising, as WAT inflammation is known to precede systemic hyperinsulinaemia [46], suggesting that metabolic alterations may develop at a later age.
Female offspring were relatively protected against programmed adiposity in this study with no effects of either maternal obesity or metformin on weights of the visceral WAT depots. Female 8-week-old offspring also showed a lower expression of pro-inflammatory genes compared to males, consistent with reports that basal cytokine and chemokine expressions are higher in male compared to female WAT [47]. In contrast to males, there was no maternal environment effect on CLS formation in female offspring, indicating a sexually dimorphic susceptibility to WAT inflammation in a programming context. This is in accordance with previous reports showing that maternal high-fat feeding in pregnancy leads to macrophage invasion in chow-fed male offspring, while female offspring required a postnatal high-fat diet to show upregulated pro-inflammatory gene expression. Even then, the phenotype was milder than that in high-fat-diet-fed males [48]. The mechanisms underlying the sex differences in our study are unknown, but anti-inflammatory actions of oestrogen in female offspring are suggested as one explanation [48]. Sexual dimorphism in a developmental programming context is becoming increasingly recognised, with male offspring often more vulnerable to suboptimal in utero exposures than female offspring are, and subsequently displaying earlier and/or more severe phenotypes in adulthood. This may be related to sexually dimorphic patterns and the timing of development, different hormonal intrauterine and postnatal environments and the observation that males grow faster in utero than females do [49,50].
The murine data we report here are broadly consistent with the limited data available in humans. We showed in a recent meta-analysis of human randomised controlled trials that metformin treatment in gestational diabetic pregnancies is associated with decreased birth weight compared to those treated with insulin [51]. Although usually interpreted as beneficial (prevention of macrosomia), this may reflect the relative growth restriction that is masked by the obesogenic glucose-intolerant environment. Accordingly, we showed that the decreased birth weight observed in metformin-treated human GDM pregnancies is followed by increased postnatal growth, leading to heavier infants compared to insulin-treated GDM [51]. The longest human follow-up of metformin-treated GDM pregnancies to date is from the MiG trial in Australasia. In 2011, this trial reported an increased adiposity in two-year-old metformin-exposed offspring. As no detectable change was seen in visceral fat mass at this age, the authors proposed that this might reflect expansion of the more metabolically beneficial subcutaneous depot [52]. Our current animal study, however, does not support depot-specificity but instead shows a global adiposity phenotype involving both subcutaneous and visceral depots, the latter of which was also shown by another mouse study [26]. Therefore, it is interesting to note that further follow-up from the MiG trial has since shown that adiposity in 9-year-old offspring was indeed globally increased [10]. Furthermore, our meta-analysis of GDM intervention trials also confirmed that compared to insulin, the lower birth weight and accelerated postnatal growth in metformin-exposed babies lead to childhood adiposity [51], consistent with the current mouse study.
Similar to findings in a GDM context, a placebo-controlled trial in PCOS women showed excessive postnatal growth in metformin-exposed offspring with body weight and BMI diverging from the placebo arm from 6 months of age [12]. Moreover, further follow-up of offspring born to metformin-treated PCOS women up to 10 years of age showed increased overweight and obesity [12,13], with an increased proportion of metabolically abnormal obese children in the metformin arm. In contrast, trials in obese glucose-tolerant women failed to show a relationship between metformin exposure and offspring adiposity at least up to 4 years of age [8,14,53], highlighting the importance of the longer-term follow-up of metformin-exposed offspring.
In addition to the different clinical indications, it is important to note that the timing of metformin administration differs between women treated for GDM (in the second or third trimester) and those with PCOS or type 2 diabetes (before or at conception) or studies in nondiabetic obese women (end of the first trimester). However, the common outcome of increased offspring adiposity in the context of PCOS and GDM suggests that exposure during the last trimester is critical in relation to effects on adiposity. Unfortunately, most human studies are not sufficiently powered to analyse potential sexual dimorphism in offspring outcomes. The paucity of long-term offspring follow-up in humans means that more evidence is required to determine potential critical time windows of exposure, sexual dimorphism in foetal responses, as well as the interaction with maternal metabolic status.
In conclusion, maternal metformin treatment during obese pregnancy decreased maternal fat mass in late gestation, providing a less obese intrauterine environment for developing foetuses, and consistent with beneficial effects on maternal physiology. However, maternal metformin treatment did not prevent foetal growth restriction, despite an increase in gestation length, or the postnatal catch-up growth phenotype in offspring of obese dams. These findings suggest that beneficial effects in maternal physiology do not necessarily translate to improved physiology in the offspring. Furthermore, we observed sex-specific effects of maternal metformin on offspring adiposity, with exposed males demonstrating increased adiposity and adipose tissue inflammation that were not observed in the females. These findings highlight the presence of sexually dimorphic responses to in utero exposures and the need to consider immediate, as well as postnatal, effects of treatments during pregnancy on mother and child. Given the importance of ageing in exaggerating programmed phenotypes and in the development of metabolic disease pathology, it is imperative that these offspring are followed up to determine whether these alterations in adipose biology in young adult life become pathological in later life.
4. Materials and Methods
4.1. Animal Model
All mouse work was performed according to the UK Home Office Animals (Scientific Procedures) Act 1986 Amendment Regulations 2012 and the University of Cambridge Animal and Welfare Ethical Review Board, approved under project licence P5FDF0206, 23 March 2017. As previously described [17], female C57BL/6J mice were randomly assigned to either a standard laboratory chow (RM1, 7% sugars, 3% fat) or a high-fat diet (10% sugars, 20% fat) supplemented with sweetened condensed milk (55% sugar, 8% fat) and vitamin and mineral pre-mix (AIN-93G-MX, Special Diets Services, Witham, UK) from weaning. After 6 weeks, they were mated for a primary pregnancy to ensure breeding effectiveness. Obese dams were mated for the experimental pregnancy when they reached a critical threshold of 12 g absolute fat mass, as measured by noninvasive time-domain nuclear magnetic resonance (TD-NMR, Bruker Minispec LF series, Bruker Optik GmbG, Essex, Germany), whereas control dams remained below 5 g absolute fat mass at mating. Dams were fed their respective diets ad libitum throughout pregnancy and lactation. Half of obese dams were treated orally with 300 mg/kg/d of metformin-hydrochloride supplemented in the condensed milk from one week pre-mating until embryonic day 19 (E18.5). This clinically relevant dose has previously been used in murine models and equates to a dose similar to those provided to pregnant women [26]. The body composition of dams in all three groups was measured by TD-NMR on E15.5. Litter size was standardised to six pups per litter on PN2. Male and female offspring were weaned onto RM1 at PN21 and housed in littermate pairs of the same sex until culling at 8 weeks of age using rising CO2 concentration. Excised adipose tissues from fed animals or following a 16 h fast were formalin-fixed or snap-frozen on dry ice, respectively.
4.2. Gene Expression
Gonadal adipose tissue was lysed on ice in QIAzol Lysis Reagent (Qiagen, Hilden, Germany) using the TissueRuptor II (Qiagen). RNA was extracted using the miRNeasy MiniKit (Qiagen) with DNase digestion (RNase-Free DNase Set, Qiagen) according to the manufacturer’s protocols. RNA concentration was determined using a NanoDrop 1000 Spectrophotometer (ThermoScientific, UK) and RNA quality was assessed using gel electrophoresis. cDNA was generated using the HiCapacity RT kit (Applied Biosystems, USA) with addition of the RNAse inhibitor (Applied Biosystems) using the Veriti™ 96-Well Thermal Cycler (Applied Biosystems). Real-time quantitative PCR was performed in duplicate using a SYBR™ Select Master Mix (Applied Biosystems) and the QuantStudio™ 7 Flex Real-Time PCR System (Applied Biosystems). Data were normalised using the comparative CT method against the expression of Ppia (which was unaffected by experimental group or sex) relative to the expression in the male control group. Primer sequences are shown in Table 2.
Table 2.
Primer sequences for RT-PCR.
4.3. Histological Analysis
Formalin-fixed gonadal adipose tissue was processed, embedded and sectioned, and 3 μm sections were stained with haematoxylin and eosin (H&E). Whole sections were scanned using the Axioscan digital slide scanner (Zeiss, Germany). Images were analysed using HALO analysis software (Indica labs, USA) using DenseNet AI Plugin classifiers (‘crown-like structures’ or CLS analysis) and the Vacuole Quantification tool (adipocyte cell size) adapted to the H&E-stained WAT sections. The estimated adipocyte number was calculated based on methods previously described [28] by dividing the total volume of gonadal WAT (estimated from the tissue weight and density of rodent visceral WAT) by the mean adipocyte volume derived from the cross-sectional area measured by HALO. The percentage adipocytes surrounded by CLS, a marker of adipocyte death [44], was calculated by normalising the number of CLS by the number of adipocytes per section.
4.4. Intraperitoneal Glucose Tolerance Test
Following an overnight fast, offspring were injected intraperitoneally with 1 g/kg of glucose solution. Blood glucose was measured from the tail vein at baseline and 15, 30, 60 and 120 min post-injection (AlphaTRAK2, Zoetis, Parsippany-Troy Hills, NJ, USA). The area under the glucose excursion curve during the glucose tolerance test was computed using the trapezoid rule in Prism 8.0 (GraphPad, La Jolla, CA, USA).
4.5. Serum Analysis
Terminal blood was collected following a 16 h fast by cardiac puncture. Serum was collected after centrifugation at 3000× g and stored at −80 °C. Serum insulin was measured using the Ultra-Sensitive Mouse Insulin ELISA Kit (Crystal Chem, Elk Grove Village, IL, USA).
4.6. Statistical Analysis
Data are presented as means ± SEM and were analysed using Prism 8.0 software (GraphPad) using one-way ANOVA, two-way ANOVA or nonparametric alternatives where appropriate. Outliers were determined by the Grubb’s method and excluded as described in the figure legends. A p-value of p < 0.05 was considered statistically significant. In all cases, n refers to the number of independent litters represented.
Author Contributions
Conceptualization, S.E.O.; formal analysis, J.M.S. and C.E.A.; funding acquisition, S.E.O.; investigation, J.M.S., H.L.B., T.J.A. and D.S.F.-T.; methodology, H.L.B., D.S.F.-T. and S.E.O.; project administration, J.M.S. and S.E.O.; supervision, S.E.O.; visualization, J.M.S. and S.E.O.; writing—original draft, J.M.S.; writing—review and editing, H.L.B., D.S.F.-T. and C.E.A. All authors have read and agreed to the published version of the manuscript.
Funding
This research was funded by the British Heart Foundation, grants RG/17/12/33167, PG/13/46/30329 and studentship to JMS FS/16/53/32729, and the Medical Research Council, grants MC_UU_00014/4 and MR/T016701/1.
Institutional Review Board Statement
All mouse work was performed according to the Home Office Animals (Scientific Procedures) Act 1986 Amendment Regulations 2012, after ethical review by the University of Cambridge Animal and Welfare Ethical Review Board, approved under project licence P5FDF0206, 23 March 2017.
Informed Consent Statement
Not applicable.
Data Availability Statement
As the manuscript does not include any omics data, the data presented in this study are available on request from the corresponding author as appropriate (such as for use in meta-analyses) following publication. The data are not publicly available.
Acknowledgments
The authors would like to acknowledge and thank Claire Custance for expert technical assistance.
Conflicts of Interest
The authors declare no conflict of interest. The funders had no role in the design of the study; in the collection, analyses, or interpretation of data; in the writing of the manuscript, or in the decision to publish the results.
References
- Mullins, E.W.S.; Davies, S.C. Annual Report of the Chief Medical Officer, 2014, The Health of the 51%: Women; Department of Health: London, UK, 2015.
- Poirier, P.; Giles, T.D.; Bray, G.A.; Hong, Y.; Stern, J.S.; Pi-Sunyer, F.X.; Eckel, R.H. Obesity and cardiovascular disease: Pathophysiology, evaluation, and effect of weight loss. Arterioscler. Thromb. Vasc. Biol. 2006, 26, 968–976. [Google Scholar] [CrossRef] [PubMed]
- Drake, A.J.; Reynolds, R.M. Impact of maternal obesity on offspring obesity and cardiometabolic disease risk. Reproduction 2010, 140, 387–398. [Google Scholar] [CrossRef] [PubMed]
- Chu, S.Y.; Callaghan, W.M.; Kim, S.Y.; Schmid, C.H.; Lau, J.; England, L.J.; Dietz, P.M. Maternal obesity and risk of gestational diabetes mellitus. Diabetes Care 2007, 30, 2070–2076. [Google Scholar] [CrossRef] [Green Version]
- Cesta, C.E.; Cohen, J.M.; Pazzagli, L.; Bateman, B.T.; Bröms, G.; Einarsdóttir, K.; Furu, K.; Havard, A.; Heino, A.; Hernandez-Diaz, S.; et al. Antidiabetic medication use during pregnancy: An international utilization study. BMJ Open Diabetes Res. Care 2019, 7, e000759. [Google Scholar] [CrossRef] [PubMed] [Green Version]
- National Institute for Health and Care Excellence. Diabetes in pregnancy: Management from preconception to the postnatal period (NG3). 2015. Available online: https://www.nice.org.uk/guidance/NG3 (accessed on 1 July 2021).
- Barrett, H.L.; Gatford, K.L.; Houda, C.M.; De Blasio, M.J.; McIntyre, H.D.; Callaway, L.K.; Nitert, M.D.; Coat, S.; Owens, J.A.; Hague, W.M.; et al. Maternal and neonatal circulating markers of metabolic and cardiovascular risk in the metformin in gestational diabetes (MiG) trial: Responses to maternal metformin versus insulin treatment. Diabetes Care 2013, 36, 529–536. [Google Scholar] [CrossRef] [Green Version]
- Syngelaki, A.; Nicolaides, K.H.; Balani, J.; Hyer, S.; Akolekar, R.; Kotecha, R.; Pastides, A.; Shehata, H. Metformin versus Placebo in Obese Pregnant Women without Diabetes Mellitus. N. Engl. J. Med. 2016, 374, 434–443. [Google Scholar] [CrossRef] [PubMed]
- Eyal, S.; Easterling, T.R.; Carr, D.; Umans, J.G.; Miodovnik, M.; Hankins, G.D.V.; Clark, S.M.; Risler, L.; Wang, J.; Kelly, E.J.; et al. Pharmacokinetics of metformin during pregnancy. Drug Metab. Dispos. 2010, 38, 833–840. [Google Scholar] [CrossRef] [Green Version]
- Rowan, J.A.; Rush, E.C.; Plank, L.D.; Lu, J.; Obolonkin, V.; Coat, S.; Hague, W.M. Metformin in gestational diabetes: The offspring follow-up (MiG TOFU): Body composition and metabolic outcomes at 7–9 years of age. BMJ Open Diabetes Res. Care 2018, 6, e000456. [Google Scholar] [CrossRef] [PubMed] [Green Version]
- Rø, T.B.; Ludvigsen, H.V.; Carlsen, S.M.; Vanky, E. Growth, body composition and metabolic profile of 8-year-old children exposed to metformin in utero. Scand. J. Clin. Lab. Investig. 2012, 72, 570. [Google Scholar] [CrossRef] [PubMed]
- Hanem, L.G.E.; Salvesen, Ø.; Juliusson, P.B.; Carlsen, S.M.; Nossum, M.C.F.; Vaage, M.Ø.; Ødegård, R.; Vanky, E. Intrauterine metformin exposure and offspring cardiometabolic risk factors (PedMet study): A 5–10 year follow-up of the PregMet randomised controlled trial. Lancet Child Adolesc. Health 2019, 3, 166–174. [Google Scholar] [CrossRef]
- Hanem, L.G.E.; Stridsklev, S.; Júlíusson, P.B.; Salvesen, Ø.; Roelants, M.; Carlsen, S.M.; Ødegård, R.; Vanky, E. Metformin Use in PCOS Pregnancies Increases the Risk of Offspring Overweight at 4 Years of Age: Follow-Up of Two RCTs. J. Clin. Endocrinol. Metab. 2018, 103, 1612–1621. [Google Scholar] [CrossRef] [Green Version]
- Panagiotopoulou, O.; Syngelaki, A.; Georgiopoulos, G.; Simpson, J.; Akolekar, R.; Shehata, H.; Nicolaides, K.; Charakida, M. Metformin use in obese mothers is associated with improved cardiovascular profile in the offspring. Am. J. Obstet. Gynecol. 2020, 223, 246.e1–246.e10. [Google Scholar] [CrossRef]
- Tertti, K.; Toppari, J.; Virtanen, H.E.; Sadov, S.; Rönnemaa, T. Metformin treatment does not affect testicular size in offspring born to mothers with gestational diabetes. Rev. Diabet. Stud. 2016, 13, 59–65. [Google Scholar] [CrossRef] [Green Version]
- Samuelsson, A.M.; Matthews, P.A.; Argenton, M.; Christie, M.R.; McConnell, J.M.; Jansen, E.H.J.M.; Piersma, A.H.; Ozanne, S.E.; Twinn, D.F.; Remacle, C.; et al. Diet-induced obesity in female mice leads to offspring hyperphagia, adiposity, hypertension, and insulin resistance: A novel murine model of developmental programming. Hypertension 2008, 51, 383–392. [Google Scholar] [CrossRef] [Green Version]
- Fernandez-Twinn, D.S.; Gascoin, G.; Musial, B.; Carr, S.; Duque-Guimaraes, D.; Blackmore, H.L.; Alfaradhi, M.Z.; Loche, E.; Sferruzzi-Perri, A.N.; Fowden, A.L.; et al. Exercise rescues obese mothers’ insulin sensitivity, placental hypoxia and male offspring insulin sensitivity. Sci. Rep. 2017, 7, 44650. [Google Scholar] [CrossRef] [PubMed] [Green Version]
- Ingvorsen, C.; Thysen, A.H.; Fernandez-Twinn, D.; Nordby, P.; Nielsen, K.F.; Ozanne, S.E.; Brix, S.; Hellgren, L.I. Effects of pregnancy on obesity-induced inflammation in a mouse model of fetal programming. Int. Obes. 2014, 38, 1–28. [Google Scholar] [CrossRef]
- Alfaradhi, M.Z.; Kusinski, L.C.; Fernandez-Twinn, D.S.; Pantaleão, L.C.; Carr, S.K.; Ferland-McCollough, D.; Yeo, G.S.H.; Bushell, M.; Ozanne, S.E. Maternal obesity in pregnancy developmentally programs adipose tissue inflammation in young, lean male mice offspring. Endocrinology 2016, 157, 4246–4256. [Google Scholar] [CrossRef] [Green Version]
- De Almeida Faria, J.; Duque-Guimarães, D.; Carpenter, A.A.M.; Loche, E.; Ozanne, S.E. A post-weaning obesogenic diet exacerbates the detrimental effects of maternal obesity on offspring insulin signaling in adipose tissue. Sci. Rep. 2017, 7, 44949. [Google Scholar] [CrossRef] [PubMed] [Green Version]
- Vega, C.C.; Reyes-Castro, L.A.; Bautista, C.J.; Larrea, F.; Nathanielsz, P.W.; Zambrano, E. Exercise in obese female rats has beneficial effects on maternal and male and female offspring metabolism. Int. J. Obes. 2015, 39, 712–719. [Google Scholar] [CrossRef] [PubMed] [Green Version]
- Stanford, K.I.; Lee, M.-Y.Y.; Getchell, K.M.; So, K.; Hirshman, M.F.; Goodyear, L.J. Exercise Before and During Pregnancy Prevents the Deleterious Effects of Maternal High-Fat Feeding on Metabolic Health of Male Offspring. Diabetes 2015, 64, 427–433. [Google Scholar] [CrossRef] [PubMed] [Green Version]
- Tong, J.F.; Yan, X.; Zhao, J.X.; Zhu, M.J.; Nathanielsz, P.W.; Du, M. Metformin mitigates the impaired development of skeletal muscle in the offspring of obese mice. Nutr. Diabetes 2011, 1, e7. [Google Scholar] [CrossRef] [Green Version]
- Salomäki-Myftari, H.; Vähätalo, L.H.; Ailanen, L.; Pietilä, S.; Laiho, A.; Hänninen, A.; Pursiheimo, J.-P.; Munukka, E.; Rintala, A.; Savontaus, E.; et al. Neuropeptide Y overexpressing female and male mice show divergent metabolic but not gut microbial responses to prenatal metformin exposure. PLoS ONE 2016, 11, e0163805. [Google Scholar] [CrossRef]
- Salomäki, H.; Heinäniemi, M.; Vähätalo, L.H.; Ailanen, L.; Eerola, K.; Ruohonen, S.T.; Pesonen, U.; Koulu, M. Prenatal metformin exposure in a maternal high fat diet mouse model alters the transcriptome and modifies the metabolic responses of the offspring. PLoS ONE 2014, 9, e115778. [Google Scholar] [CrossRef] [Green Version]
- Salomäki, H.; Vähätalo, L.H.; Laurila, K.; Jäppinen, N.T.; Penttinen, A.M.; Ailanen, L.; Ilyasizadeh, J.; Pesonen, U.; Koulu, M. Prenatal Metformin Exposure in Mice Programs the Metabolic Phenotype of the Offspring during a High Fat Diet at Adulthood. PLoS ONE 2013, 8, e56594. [Google Scholar] [CrossRef]
- Gregg, B.E.; Botezatu, N.; Brill, J.D.; Hafner, H.; Vadrevu, S.; Satin, L.S.; Alejandro, E.U.; Bernal-Mizrachi, E. Gestational exposure to metformin programs improved glucose tolerance and insulin secretion in adult male mouse offspring. Sci. Rep. 2018, 8, 5745. [Google Scholar] [CrossRef] [PubMed] [Green Version]
- Carlson, Z.; Hafner, H.; Mulcahy, M.; Bullock, K.; Zhu, A.; Bridges, D.; Bernal-Mizrachi, E.; Gregg, B. Lactational Metformin Exposure Programs Offspring White Adipose Tissue Glucose Homeostasis and Resilience to Metabolic Stress in a Sex-Dependent Manner. Am. J. Physiol. Endocrinol. Metab. 2020, 318, E600–E612. [Google Scholar] [CrossRef] [PubMed]
- Álvarez, D.; Ceballo, K.; Olguín, S.; Martinez-Pinto, J.; Maliqueo, M.; Fernandois, D.; Sotomayor-Zárate, R.; Cruz, G. Prenatal metformin treatment improves ovarian function in offspring of obese rats. J. Endocrinol. 2018, 239, 325–338. [Google Scholar] [CrossRef] [Green Version]
- Armitage, J.A.; Khan, I.Y.; Taylor, P.D.; Nathanielsz, P.W.; Poston, L. Developmental programming of the metabolic syndrome by maternal nutritional imbalance: How strong is the evidence from experimental models in mammals? J. Physiol. 2004, 561, 355–377. [Google Scholar] [CrossRef]
- Stumvoll, M.; Nurjhan, N.; Perriello, G.; Dailey, G.; Gerich, J.E. Metabolic Effects of Metformin in Non-Insulin-Dependent Diabetes Mellitus. N. Engl. J. Med. 1995, 333, 550–554. [Google Scholar] [CrossRef]
- Butalia, S.; Gutierrez, L.; Lodha, A.; Aitken, E.; Zakariasen, A.; Donovan, L. Short- and long-term outcomes of metformin compared with insulin alone in pregnancy: A systematic review and meta-analysis. Diabet. Med. 2017, 34, 27–36. [Google Scholar] [CrossRef]
- Løvvik, T.S.; Carlsen, S.M.; Salvesen, Ø.; Steffensen, B.; Bixo, M.; Gómez-Real, F.; Lønnebotn, M.; Hestvold, K.V.; Zabielska, R.; Hirschberg, A.L.; et al. Use of metformin to treat pregnant women with polycystic ovary syndrome (PregMet2): A randomised, double-blind, placebo-controlled trial. Lancet Diabetes Endocrinol. 2019, 7, 256–266. [Google Scholar] [CrossRef] [Green Version]
- Barbour, L.A.; Scifres, C.; Valent, A.M.; Friedman, J.E.; Buchanan, T.A.; Coustan, D.; Aagaard, K.; Thornburg, K.L.; Catalano, P.M.; Galan, H.L.; et al. A cautionary response to SMFM statement: Pharmacological treatment of gestational diabetes. Am. J. Obstet. Gynecol. 2018, 219, 367.e1–367.e7. [Google Scholar] [CrossRef]
- Rajasingam, D.; Seed, P.T.; Briley, A.L.; Shennan, A.H.; Poston, L. A prospective study of pregnancy outcome and biomarkers of oxidative stress in nulliparous obese women. Am. J. Obstet. Gynecol. 2009, 200, 395.e1–395.e9. [Google Scholar] [CrossRef] [PubMed]
- Loche, E.; Blackmore, H.L.; Carpenter, A.A.; Beeson, J.H.; Pinnock, A.; Ashmore, T.J.; Aiken, C.E.; de Almeida-Faria, J.; Schoonejans, J.M.; Giussani, D.A.; et al. Maternal diet-induced obesity programmes cardiac dysfunction in male mice independently of post-weaning diet. Cardiovasc. Res. 2018, 114, 1372–1384. [Google Scholar] [CrossRef] [PubMed] [Green Version]
- De Barros Mucci, D.; Kusinski, L.C.; Wilsmore, P.; Loche, E.; Pantaleão, L.C.; Ashmore, T.J.; Blackmore, H.L.; Fernandez-Twinn, D.S.; do Carmo, M.D.G.T.; Ozanne, S.E. Impact of maternal obesity on placental transcriptome and morphology associated with fetal growth restriction in mice. Int. J. Obes. 2020, 44, 1087–1096. [Google Scholar] [CrossRef] [Green Version]
- Ravelli, A.C.J.; Van Der Meulen, J.H.P.; Michels, R.P.J.; Osmond, C.; Barker, D.J.P.; Hales, C.N.; Bleker, O.P. Glucose tolerance in adults after prenatal exposure to famine. Lancet 1998, 351, 173–177. [Google Scholar] [CrossRef]
- Ravelli, A.C.J.; Van Der Meulen, J.H.P.; Osmond, C.; Barker, D.J.P.; Bleker, O.P. Obesity at the age of 50 y in men and women exposed to famine prenatally. Am. J. Clin. Nutr. 1999, 70, 811–816. [Google Scholar] [CrossRef]
- Roseboom, T.J.; Van der Meulen, J.H.P.; Osmond, C.; Barker, D.J.P.; Ravelli, A.C.J.; Schroeder-Tanka, J.M.; van Montfrans, G.A.; Michels, R.P.J.; Bleker, O.P. Coronary heart disease after prenatal exposure to the Dutch famine, 1944–45. Heart 2000, 84, 595–598. [Google Scholar] [CrossRef] [Green Version]
- Roseboom, T.J.; Van der Meulen, J.H.P.; Osmond, C.; Barker, D.J.P.; Ravelli, A.C.J.; Bleker, O.P. Plasma lipid profiles in adults after prenatal exposure to the Dutch famine. Am. J. Clin. Nutr. 2000, 72, 1101–1106. [Google Scholar] [CrossRef]
- Berends, L.M.; Fernandez-Twinn, D.S.; Martin-Gronert, M.S.; Cripps, R.L.; Ozanne, S.E. Catch-up growth following intra-uterine growth-restriction programmes an insulin-resistant phenotype in adipose tissue. Int. J. Obes. 2013, 37, 1051–1057. [Google Scholar] [CrossRef] [Green Version]
- Berends, L.M.; Dearden, L.; Tung, Y.C.L.; Voshol, P.; Fernandez-Twinn, D.S.; Ozanne, S.E. Programming of central and peripheral insulin resistance by low birthweight and postnatal catch-up growth in male mice. Diabetologia 2018, 61, 2225–2234. [Google Scholar] [CrossRef] [PubMed] [Green Version]
- Cinti, S.; Mitchell, G.; Barbatelli, G.; Murano, I.; Ceresi, E.; Faloia, E.; Greenberg, A.S.; Obin, M.S. Adipocyte death defines macrophage localization and function in adipose tissue of obese mice and humans. J. Lipid Res. 2005, 46, 2347–2355. [Google Scholar] [CrossRef] [PubMed] [Green Version]
- Strissel, K.J.; Stancheva, Z.; Miyoshi, H.; Perfield, J.W.; DeFuria, J.; Jick, Z.; Greenberg, A.S.; Obin, M.S. Adipocyte death, adipose tissue remodeling, and obesity complications. Diabetes 2007, 56, 2910–2918. [Google Scholar] [CrossRef] [Green Version]
- Xu, H.; Barnes, G.T.; Yang, Q.; Tan, G.; Yang, D.; Chou, C.J.; Sole, J.; Nichols, A.; Ross, J.S.; Tartaglia, L.A.; et al. Chronic inflammation in fat plays a crucial role in the development of obesity-related insulin resistance. J. Clin. Investig. 2003, 112, 1821–1830. [Google Scholar] [CrossRef]
- Varghese, M.; Griffin, C.; McKernan, K.; Eter, L.; Lanzetta, N.; Agarwal, D.; Abrishami, S.; Singer, K. Sex differences in inflammatory responses to adipose tissue lipolysis in diet-induced obesity. Endocrinology 2019, 160, 293–312. [Google Scholar] [CrossRef] [Green Version]
- Yokomizo, H.; Inoguchi, T.; Sonoda, N.; Sakaki, Y.; Maeda, Y.; Inoue, T.; Hirata, E.; Takei, R.; Ikeda, N.; Fujii, M.; et al. Maternal high-fat diet induces insulin resistance and deterioration of pancreatic β-cell function in adult offspring with sex differences in mice. Am. J. Physiol. Endocrinol. Metab. 2014, 306, E1163–E1175. [Google Scholar] [CrossRef] [Green Version]
- Aiken, C.E.; Ozanne, S.E. Sex differences in developmental programming models. Reproduction 2013, 145, 145–146. [Google Scholar] [CrossRef] [Green Version]
- Dearden, L.; Bouret, S.G.; Ozanne, S.E. Sex and gender differences in developmental programming of metabolism. Mol. Metab. 2018, 15, 8–19. [Google Scholar] [CrossRef]
- Tarry-Adkins, J.L.; Aiken, C.E.; Ozanne, S.E. Neonatal, infant, and childhood growth following metformin versus insulin treatment for gestational diabetes: A systematic review and meta-analysis. PLoS Med. 2019, 16, e1002848. [Google Scholar] [CrossRef] [PubMed] [Green Version]
- Rowan, J.A.; Rush, E.C.; Obolonkin, V.; Battin, M.; Wouldes, T.; Hague, W.M. Metformin in gestational diabetes: The offspring follow-up (MiG TOFU)—Body composition at 2 years of age. Diabetes Care 2011, 34, 2279–2284. [Google Scholar] [CrossRef] [PubMed] [Green Version]
- Chiswick, C.A.; Reynolds, R.M.; Denison, F.C.; Drake, A.J.; Forbes, S.; Newby, D.E.; Walker, B.R.; Quenby, S.; Wray, S.; Weeks, A.; et al. Effect of metformin on maternal and fetal outcomes in obese pregnant women (EMPOWaR): A randomised, double-blind, placebo-controlled trial. Lancet Diabetes Endocrinol. 2015, 3, 778–786. [Google Scholar] [CrossRef] [Green Version]
Publisher’s Note: MDPI stays neutral with regard to jurisdictional claims in published maps and institutional affiliations. |
© 2021 by the authors. Licensee MDPI, Basel, Switzerland. This article is an open access article distributed under the terms and conditions of the Creative Commons Attribution (CC BY) license (https://creativecommons.org/licenses/by/4.0/).