Article

Follistatin-Like-1 (FSTL1) Is a Fibroblast-Derived Growth Factor That Contributes to Progression of Chronic Kidney Disease

by
Nicholas A. Maksimowski
1,*,
Xuewen Song
2,
Eun Hui Bae
3,
Heather Reich
2,4,
Rohan John
4,5,6,
York Pei
1,2,4,
James W. Scholey
1,2,4,6,7 and
Nephrotic Syndrome Study Network (NEPTUNE)
1
Institute of Medical Science, University of Toronto, Toronto, ON M5S 1A8, Canada
2
Division of Nephrology, University Health Network, Toronto, ON M5G 2C4, Canada
3
Departments of Internal Medicine, Chonnam National University Medical School, Gwangju 61469, Korea
4
Toronto General Hospital Research Institute, University Health Network, Toronto, ON M5G 2C4, Canada
5
Department of Laboratory Medicine and Pathobiology, University of Toronto, Toronto, ON M5G 2C4, Canada
6
Department of Pathology, University Health Network, Toronto, ON M5G 2C4, Canada
7
Department of Physiology, University of Toronto, Toronto, ON M5G 2C4, Canada
*
Author to whom correspondence should be addressed.
Membership of Nephrotic Syndrome Study Network (NEPTUNE) is provided in the Acknowledgments.
Int. J. Mol. Sci. 2021, 22(17), 9513; https://doi.org/10.3390/ijms22179513
Submission received: 4 August 2021 / Revised: 25 August 2021 / Accepted: 26 August 2021 / Published: 1 September 2021
(This article belongs to the Section Molecular Pathology, Diagnostics, and Therapeutics)

Abstract

:
Our understanding of the mechanisms responsible for the progression of chronic kidney disease (CKD) is incomplete. Microarray analysis of kidneys at 4 and 7 weeks of age in Col4a3-/- mice, a model of progressive nephropathy characterized by proteinuria, interstitial fibrosis, and inflammation, revealed that Follistatin-like-1 (Fstl1) was one of only four genes significantly overexpressed at 4 weeks of age. mRNA levels for the Fstl1 receptors, Tlr4 and Dip2a, increased in both Col4a-/- mice and mice subjected to unilateral ureteral obstruction (UUO). RNAscope® (Advanced Cell Diagnostics, Newark CA, USA) localized Fstl1 to interstitial cells, and in silico analysis of single cell transcriptomic data from human kidneys showed Fstl1 confined to interstitial fibroblasts/myofibroblasts. In vitro, FSTL1 activated AP1 and NFκB, increased collagen I (COL1A1) and interleukin-6 (IL6) expression, and induced apoptosis in cultured kidney cells. FSTL1 expression in the NEPTUNE cohort of humans with focal segmental glomerulosclerosis (FSGS), membranous nephropathy (MN), and IgA nephropathy (IgAN) was positively associated with age, eGFR, and proteinuria by multiple linear regression, as well as with interstitial fibrosis and tubular atrophy. Clinical disease progression, defined as dialysis or a 40 percent reduction in eGFR, was greater in patients with high baseline FSTL1 mRNA levels. FSTL1 is a fibroblast-derived cytokine linked to the progression of experimental and clinical CKD.

1. Introduction

The prevalence and progression of chronic kidney disease (CKD) remains a global clinical challenge, and the development of end stage kidney disease is a costly outcome requiring therapies like dialysis and kidney transplantation. This underscores the important need to develop new and effective treatments to lessen the burden of CKD, but we require a better understanding of the pathogenesis of CKD progression in order to identify new targets for therapy [1].
The decline in glomerular filtration in CKD, including diseases that affect the kidney glomerulus, is associated with pathology in the kidney tubulointerstitium. These changes include interstitial inflammation and fibrosis, loss of the peritubular capillary network and loss of tubular epithelial cell number and volume, recognized as tubular atrophy [1,2]. Indeed, tubulointerstitial fibrosis strongly correlates with GFR decline in a number of kidney diseases including glomerulopathies [3]. Blockade of the renin angiotensin system remains the first line approach to limiting progression of CKD and reducing end stage kidney disease (ESKD), especially in the setting of proteinuria, while new data suggest that the use of sodium glucose co-transport-2 (SGLT2) inhibitors may affect progression broadly, and this is an active area of ongoing investigation [4]. There remains an unmet need for new and targeted therapies to slow the progression of CKD towards ESKD.
In order to identify new treatment targets for CKD, we studied Col4a3-/- mice with homozygous deletion of the gene that encodes the a3 chain of collagen IV. Mutations in genes encoding the a3.a4.a5 collagen IV network led to glomerular basement membrane (GBM) structural abnormalities that occur at the time of the normal molecular switch from the a1.a2.a1 collagen IV to the mature collagen IV. This change in basement membrane proteins leads to depletion of podocytes, progressive glomerular sclerosis, tubulointerstitial inflammation and fibrosis, and the development of kidney failure [5,6]. Although developed as a model of Alport Syndrome, the disease phenotype re-capitulates classic features of proteinuric CKD in humans. In this regard, recent clinical studies have implicated collagen IVa3 in the pathogenesis of some forms of focal segmental glomerulosclerosis and in the pathogenesis of diabetic nephropathy [5,7].
We performed unbiased global gene-expression profiling in kidneys of Col4a3-/- and wild-type (WT) mice at 4 and 7 weeks of age. Surprisingly, we identified only four differentially expressed genes in 4 week old mice. Follistatin-like-1 (Fstl1) was one of the genes, and the early increase in expression persisted through to 7 weeks of age. Studies have implicated FSTL1 in lung development and fibrosis, as well as cardiac injury, but information about its role in the pathogenesis of experimental CKD is incomplete [8,9,10,11]. Moreover, there are no studies of FSTL1 in humans with CKD associated with proteinuria.
In the current report, we sought to address this gap. We studied the expression and localization of FSTL1 in Col4a3-/- mice, and related expression to genes implicated in kidney fibrosis, inflammation, and apoptosis. We also studied the effect of FSTL1 on cultured human kidney cells, and then extended the work to mice with unilateral ureteral obstruction. Finally, we utilized human transcriptomic data as well as functional and structural data from the NEPTUNE Consortium to determine if FSTL1 expression relates to kidney function, interstitial fibrosis, and progression of CKD in humans.

2. Results

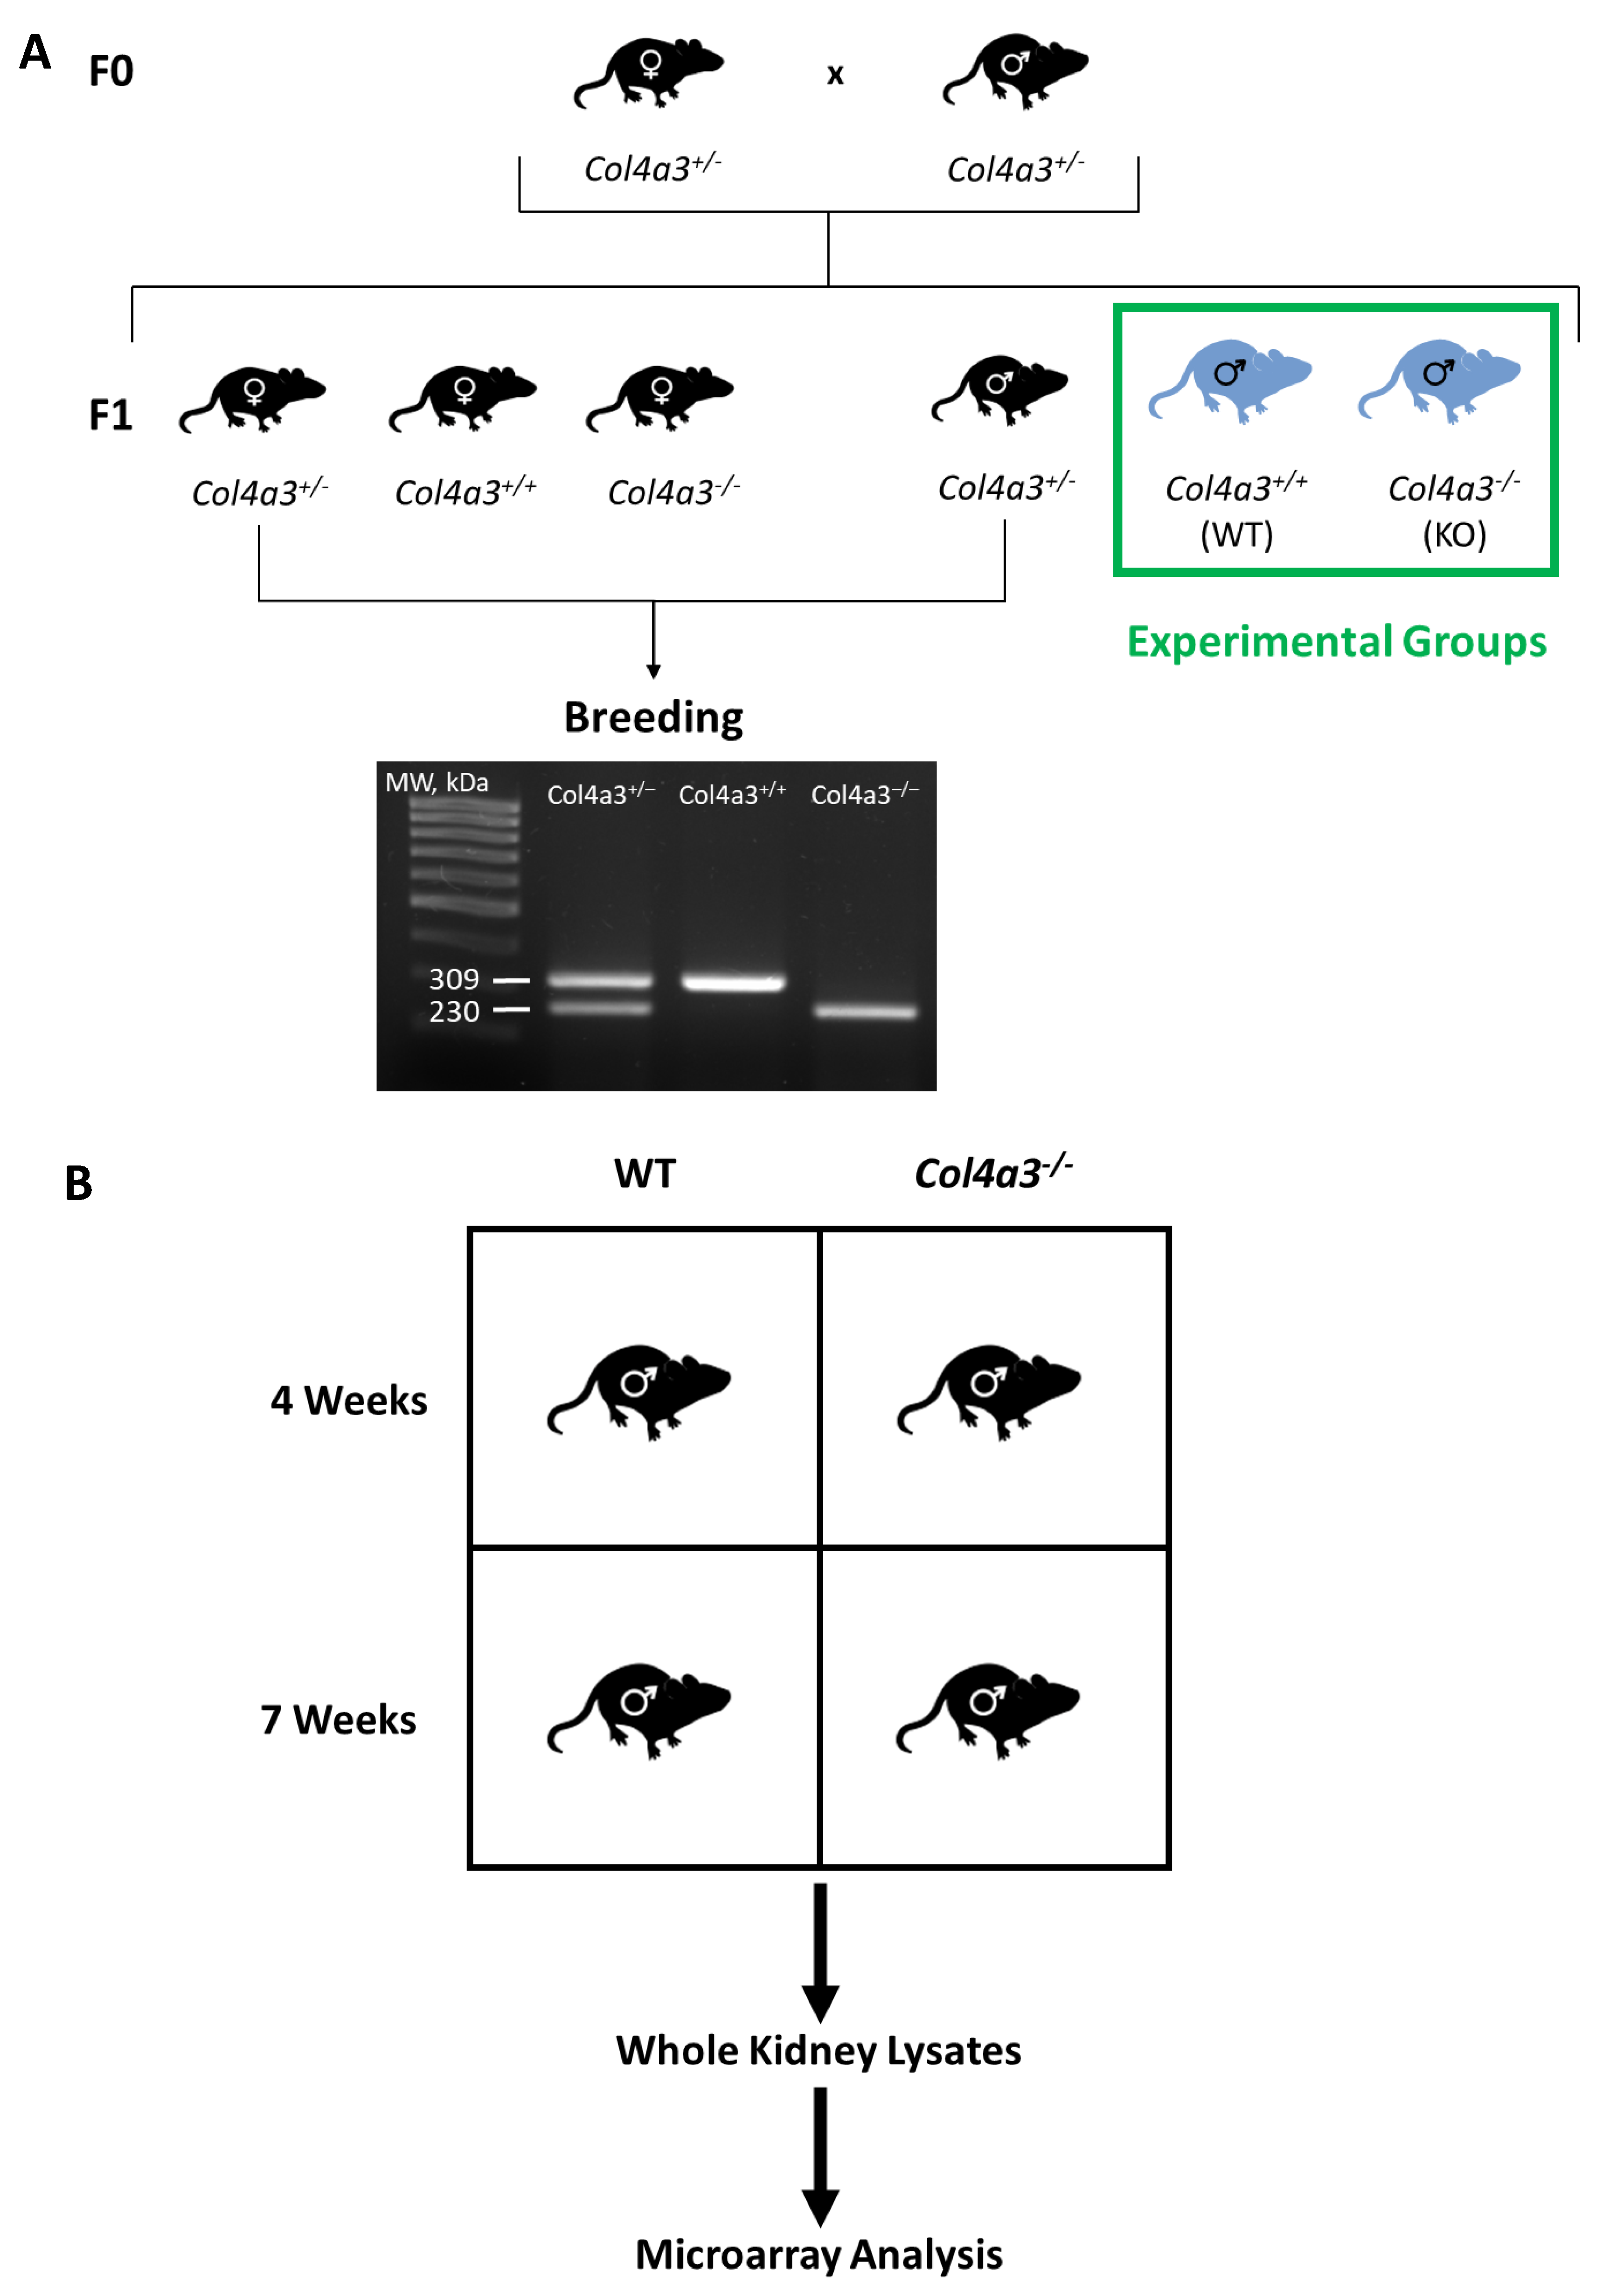
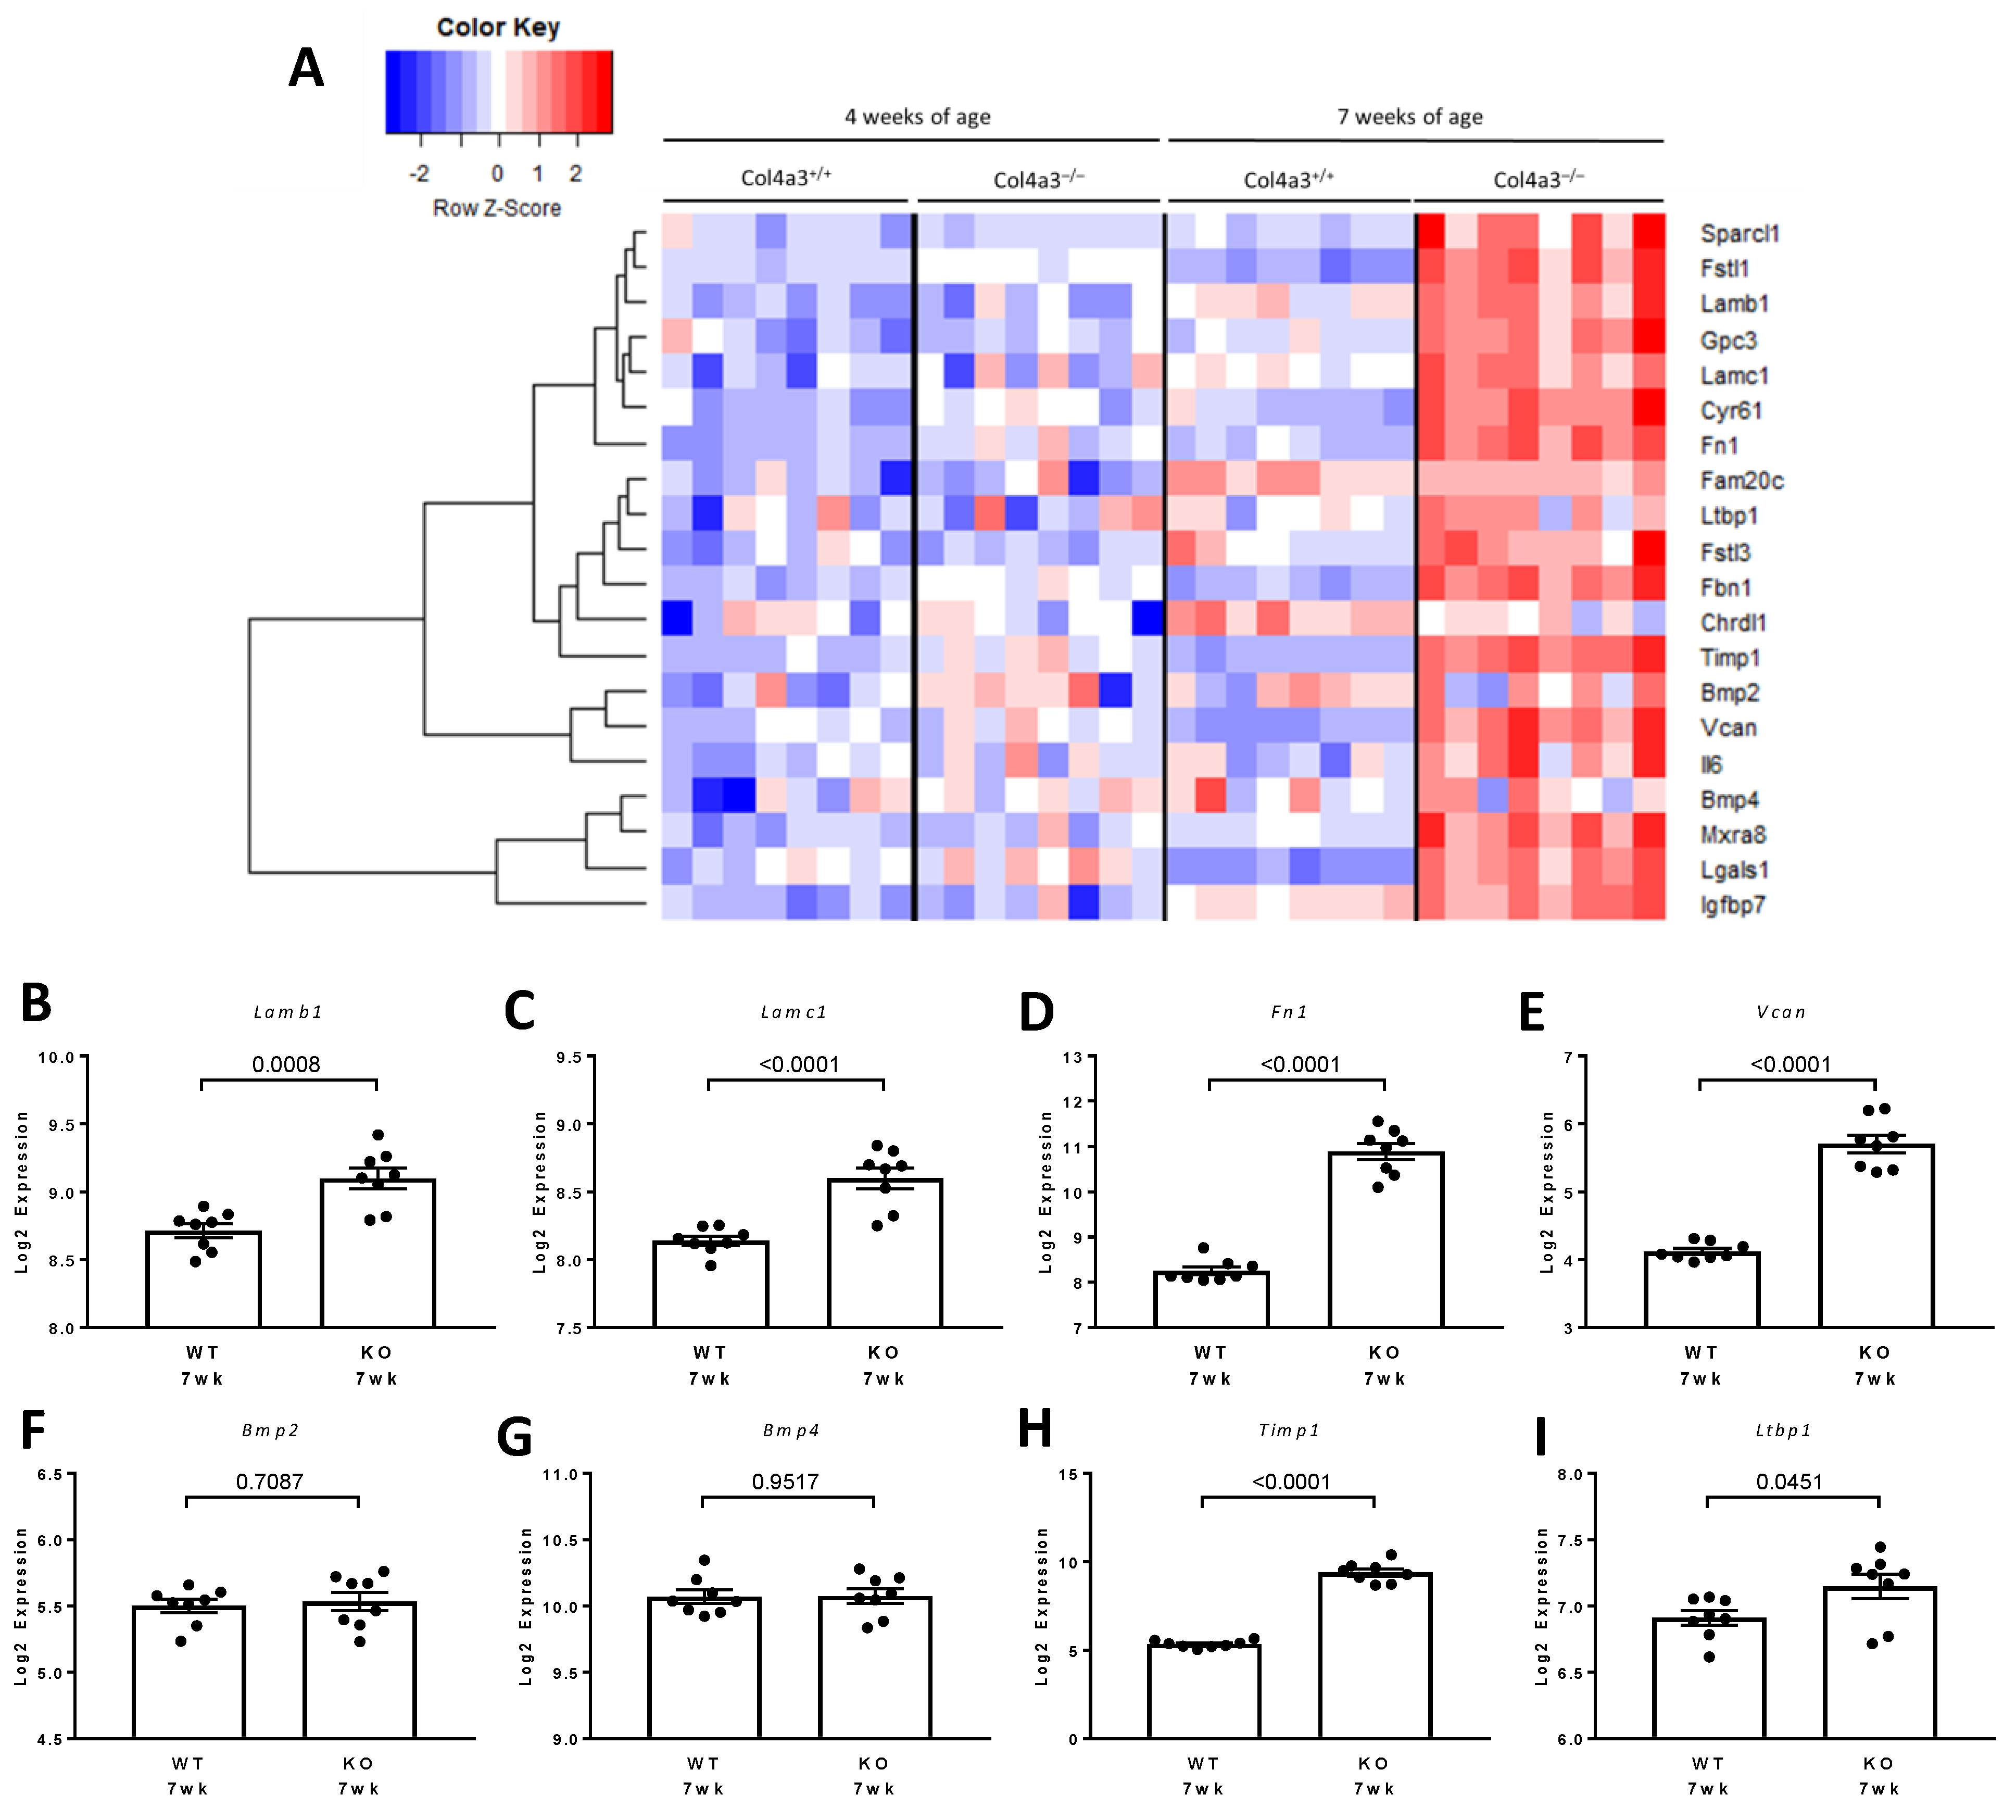
2.1. Breeding Strategy for Col4a3-/- Mice and Experimental Design

We generated Col4a3-/- (KO) and Col4a3+/+ (WT) male mice, and studied gene expression in whole kidneys from 4 and 7 week old mice (Figure 1A). Body weights and kidney weights were similar in the two groups at 4 and 7 weeks of age. KO mice exhibited a 3-fold increase in the urinary albumin excretion rate (UalbV) at 4 weeks of age (p < 0.05). The UalbV continued to increase in the KO mice, reaching a 7-fold increase at 7 weeks of age (Table 1).
Figure 2 shows light micrographic images of kidneys from WT mice and Col4a3-/- mice (at 7 weeks of age). Panel A shows PAS-stained sections of glomeruli and tubules from WT mice and Col4a3-/- mice and Masson Trichome (MTC) stains to show interstitial fibrosis (green in lower right panel).
The molecular switch from the immature collagen IV network (a1a2a1) to the mature collagen IV network (a3a4a5) is evident in the heat map of collagen gene expression at 4 and 7 weeks of age in the Col4a3-/- (KO) and Col4a3+/+ (WT) mice (Figure 3A). At 7 weeks of age Col4a3 and Col4a4 were more highly expressed than Col4a1 and Col4a2 in the Col4a3+/+ mice, but the persistence of Col4a1 and Col4a2 expression is evident in the Col4a3-/- mice while levels of Col4a3, Col4a4, Col4a5 and Col4a2 are down-regulated (Figure 3B–G). The decrease in mRNA levels for Col4a3 is expected but it is interesting to note that deletion of the gene for Col4a3 leads to reduced expression of Col4a4 and Col4a5 relative to the Col4a3+/+ mice (Figure 3E,F).
There were five genes differentially expressed in Col4a3-/- mice compared to Col4a3+/+ mice at 4 weeks of age. These five genes were identified using Significance Analysis of Microarrays (SAM) and a FDR of <1% (Figure 4). Expression levels at both 4 weeks (Figure 5A–F) and 7 weeks (Figure 5G–K) of age are depicted in Figure 5. As expected, Col4a3 mRNA levels were lower in Col4a3-/- mice compared to Col4a3+/+ mice (Figure 5A) while Zfp747, a zinc finger transcription factor, was also decreased in the kidneys of 4 week old Col4a3-/- mice (Figure 5F). The expression of Follistatin-like 1 (Fstl1), Microfibril associated protein 4 (Mfap4), and Caldesmon 1 (Cald1) were all increased in Col4a3-/- mice compared to Col4a3+/+ mice at 4 weeks of age (Figure 5C–E) and the differential expression was also present at 7 weeks of age (Figure 5H–J). FSTL1 is an extracellular growth factor. MFAP4 is an extracellular protein implicated in cell-matrix interactions and it binds to collagen. CALD1 is an intracellular protein that binds actin and may regulate cell contraction. It is tempting to speculate that these later two up-regulated genes may serve to help stabilize the immature collagen network that persists in the Col4a3-/- mice and facilitate the structural integrity of the glomerular podocyte. As a start, we focused on Fstl1.
We performed Western blot analyses of the kidneys of 4 and 7 week old WT and Col4a3 KO mice (Figure 6). There was a significant increase in the protein expression of FSTL1 at 4 and 7 weeks of age. The magnitude of change was less in the mice at 4 weeks of age, as expected from our mRNA analyses. FSTL1 is a secreted glycoprotein protein. As such, the glycosylation state plays a role in its molecular weight [12]. Therefore, both bands were used to quantify FSTL1 expression. The findings are concordant with our mRNA analyses.

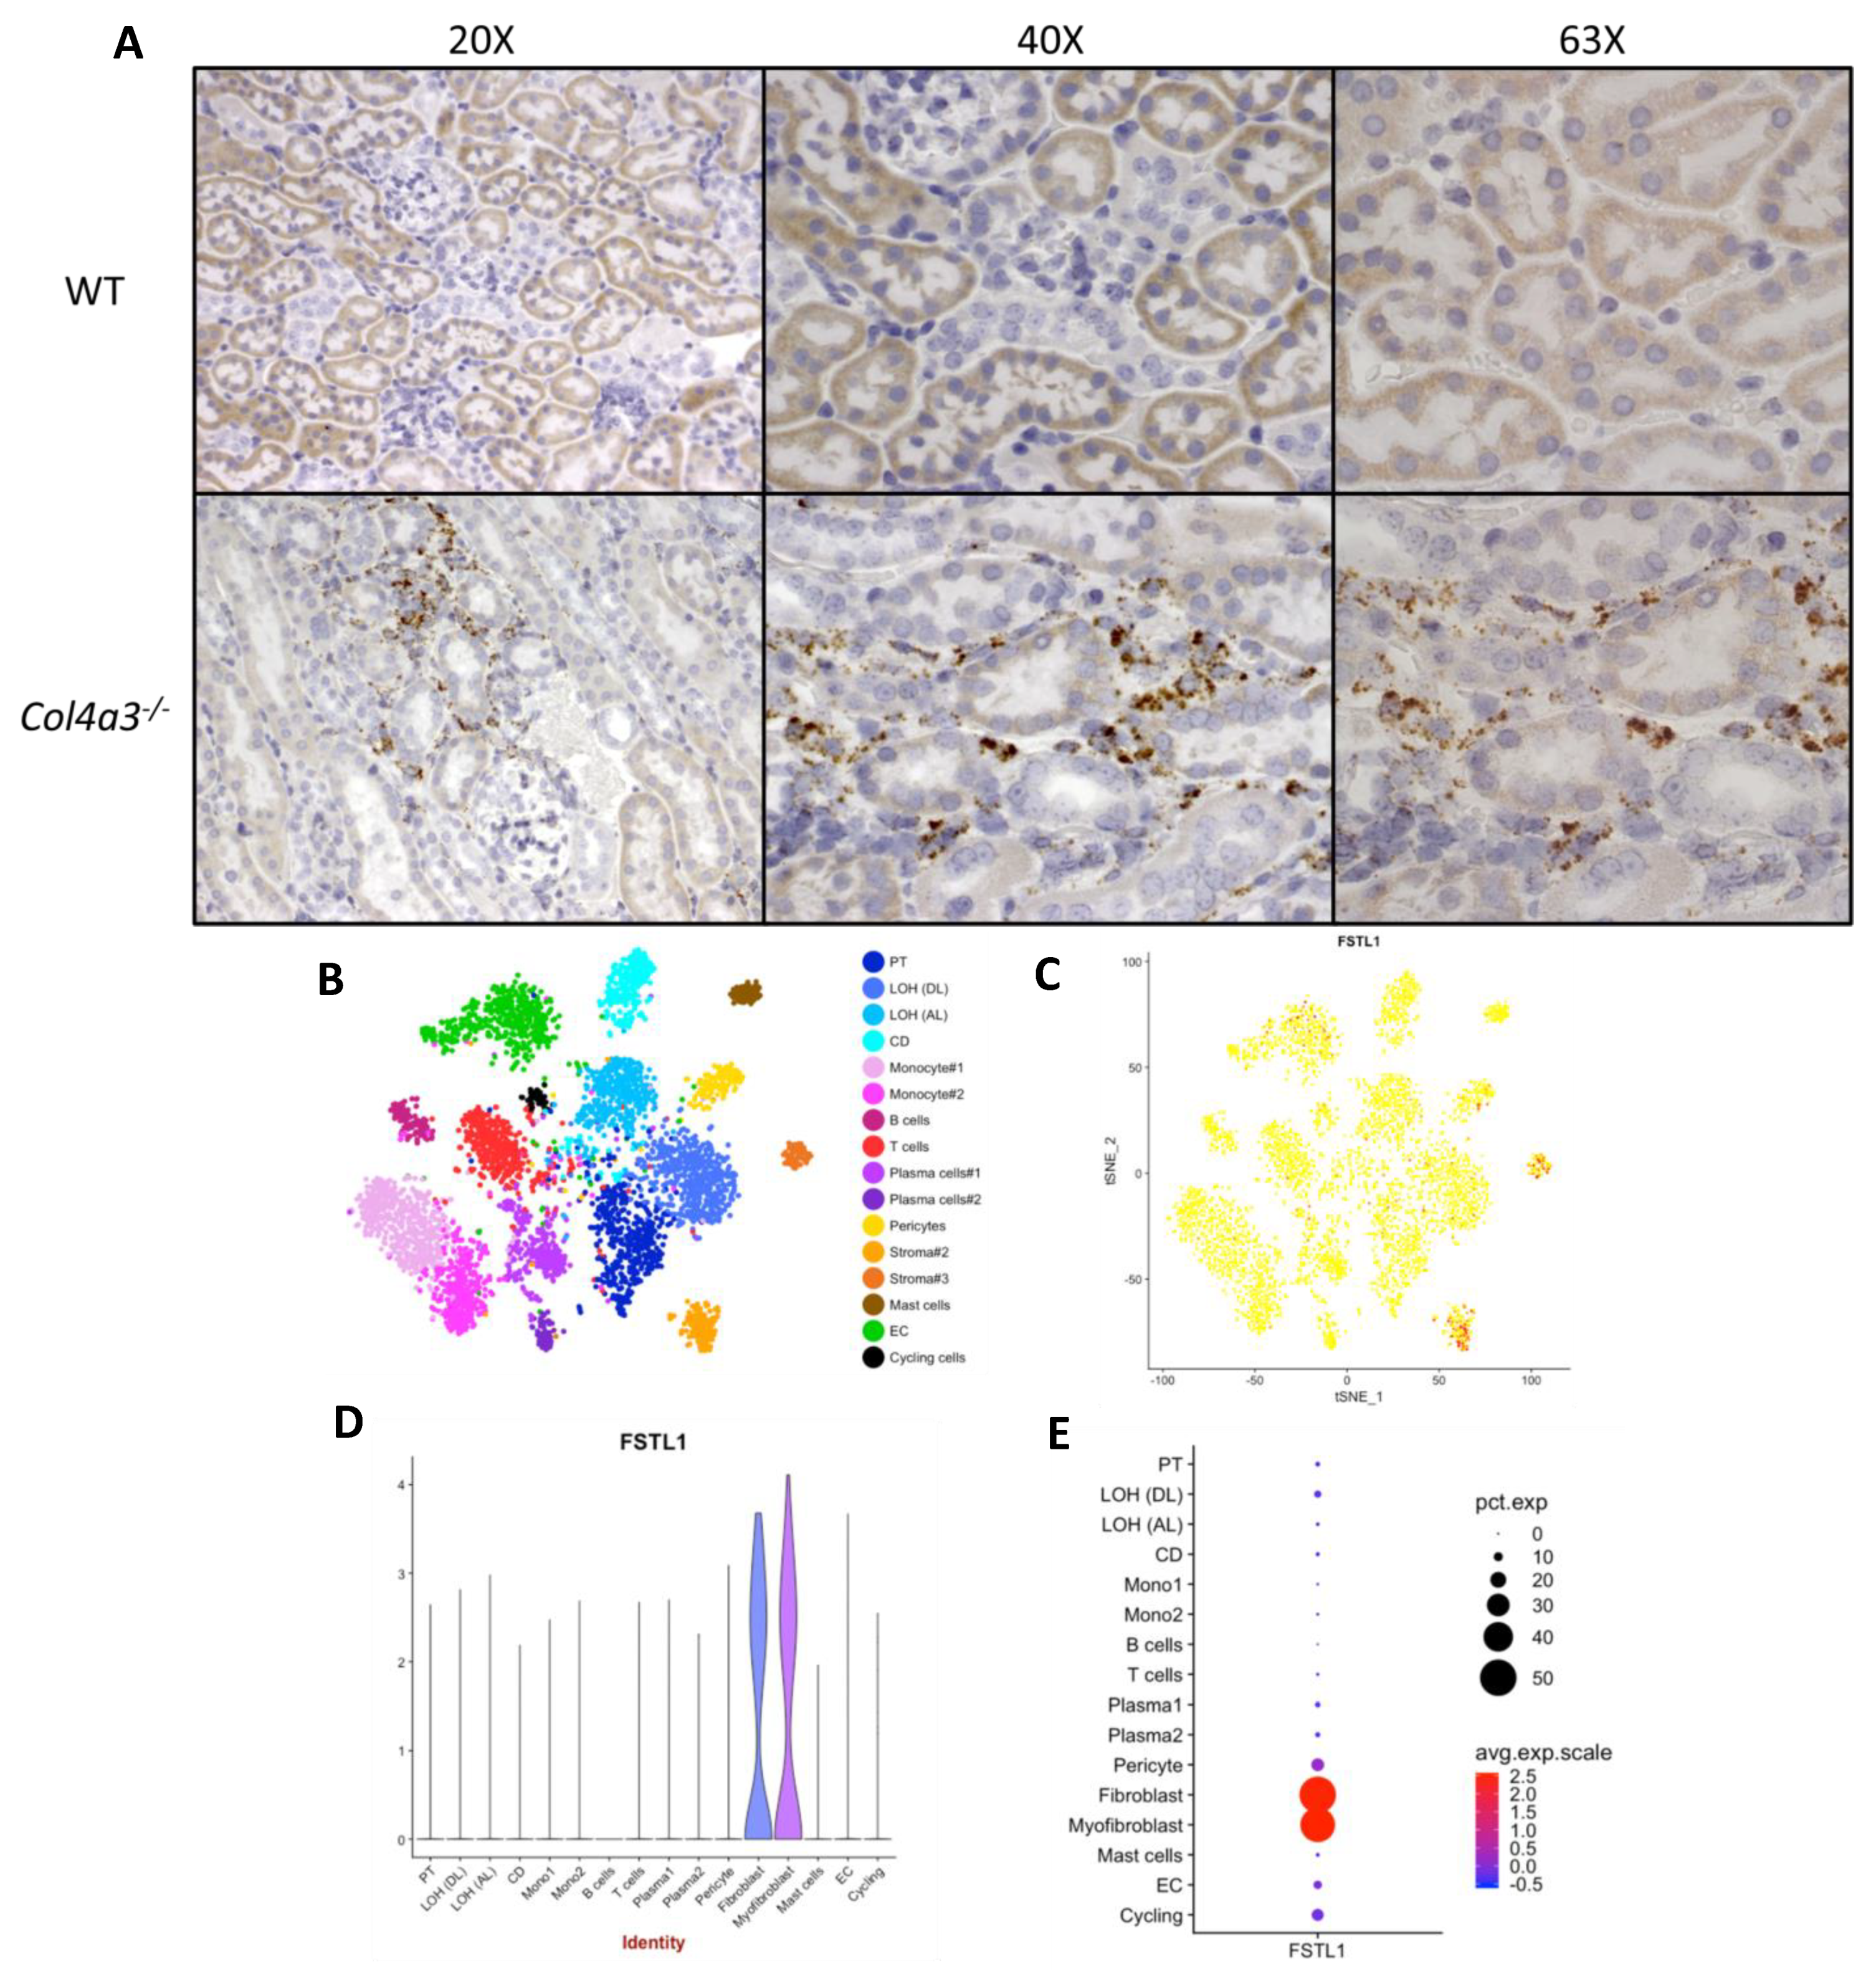
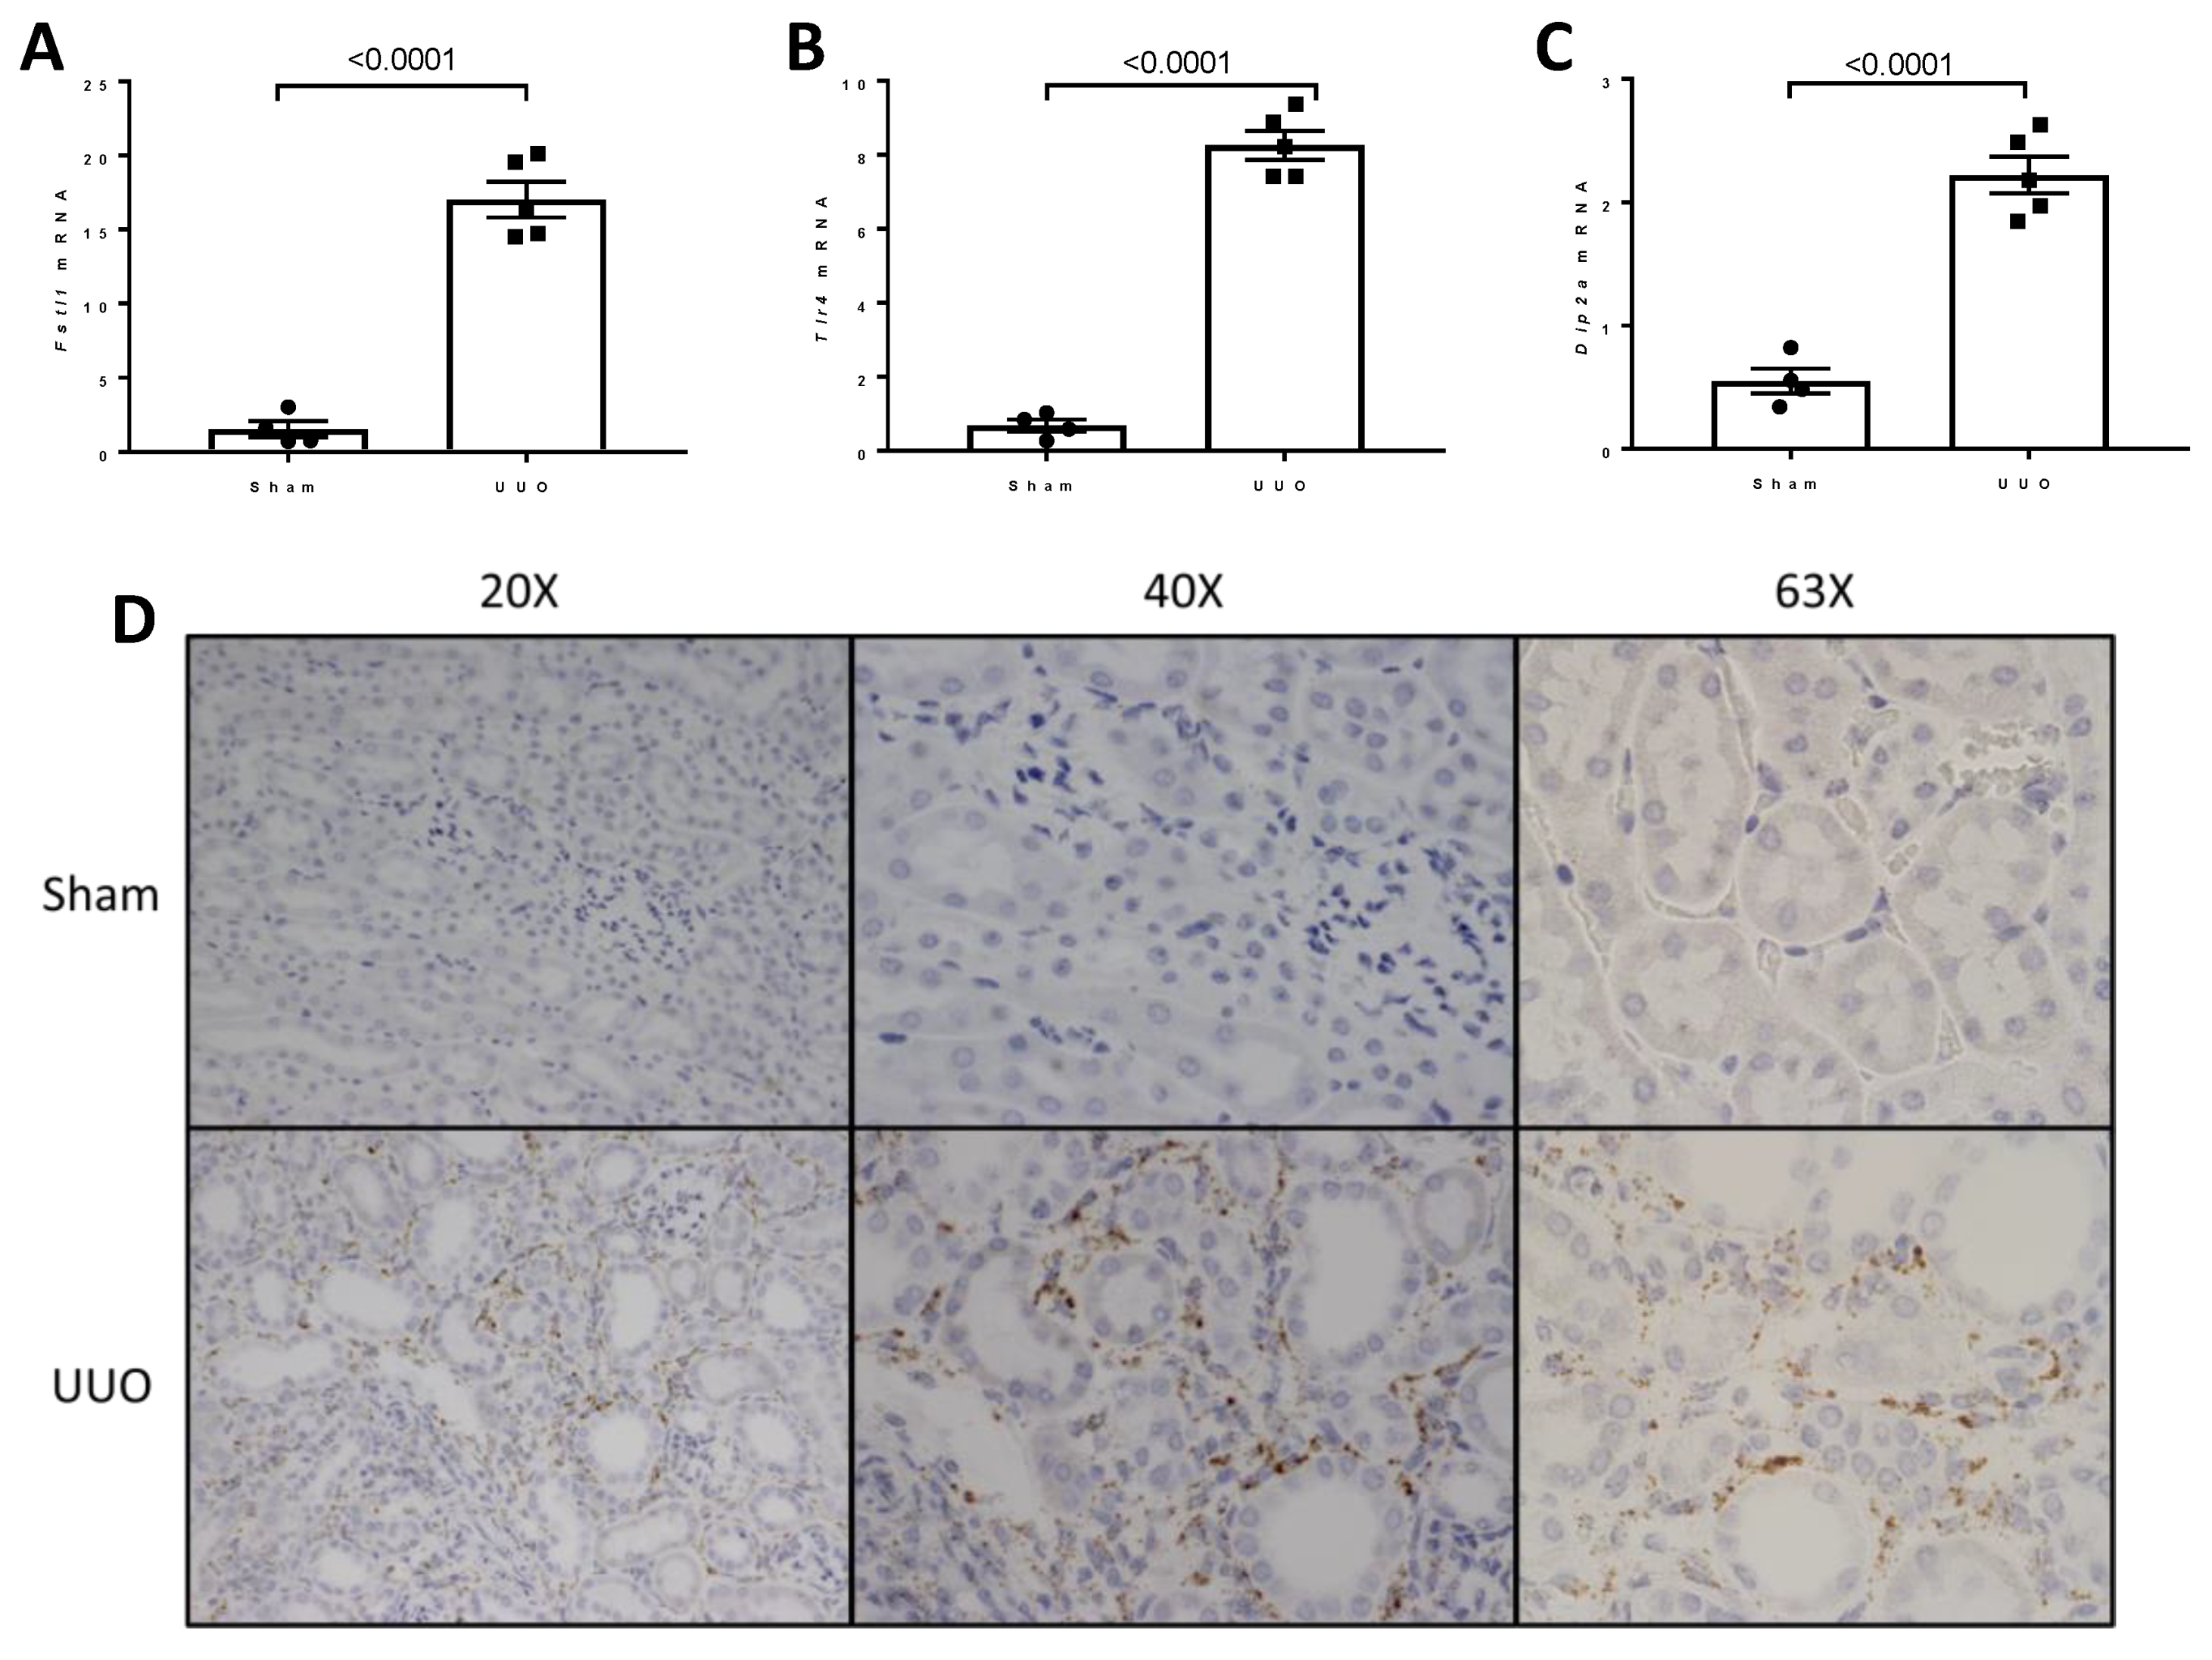
2.2. Localization of Fstl1 in the Kidney

To identify the cellular origin of FSTL1 expression we first used RNAscope® to localize Fstl1 in 7 week old Col4a3-/- and Col4a3+/+ mice. Figure 7A shows representative light micrographs. Very little expression was identified in the Col4a3+/+ mice but in accord with the microarray analysis, there was a marked increase in Fstl1 expression in the kidneys of the 7 week old Col4a3-/- mice. The cells expressing Fstl1 were present in the kidney cortex and uniformly in the interstitial space, either in capillary endothelial cells, pericytes, or resident interstitial fibroblasts. We then studied publicly available single single-cell RNA sequencing (scRNA-seq) data from human kidneys with transplant nephropathy. Figure 7B–E shows this analysis. Fstl1 expression localized to fibroblasts and myofibroblasts in the kidney, with very little expression in pericytes or endothelial cells in this human dataset.

2.3. Expression of Cognate Receptors for FSTL1 in the Kidney

FSTL1 signal transduction involves three receptor proteins: TLR4, CD14 and DIP2A. This led us to examine expression levels of these putative cognate receptors. As illustrated in the heat map and analyses in Figure 8A, we identified transcript levels for all three proteins. Expression levels of Tlr4 and Cd14 are significantly higher in the kidneys of 4 and 7 week old Col4a3-/- mice compared to Col4a3+/+ mice (Figure 8D,E,H,I). There was no significant increase in Dip2a expression at either time point (Figure 8C,G).
AP1 is a transcription factor that is a dimer of a family of proteins and the most classical dimer is composed of the proteins FOS and JUN, characterized as early response genes. We utilized a list of genes for proteins of the AP1 family [13] and then performed an unsupervised hierarchical cluster analysis of AP1 gene expression in the kidneys of our mice. Figure 9 depicts the expression levels of these genes. There is a generalized but not universal upregulation of the expression of these AP1 genes at 7 weeks of age in the Col4a3 KO mice.

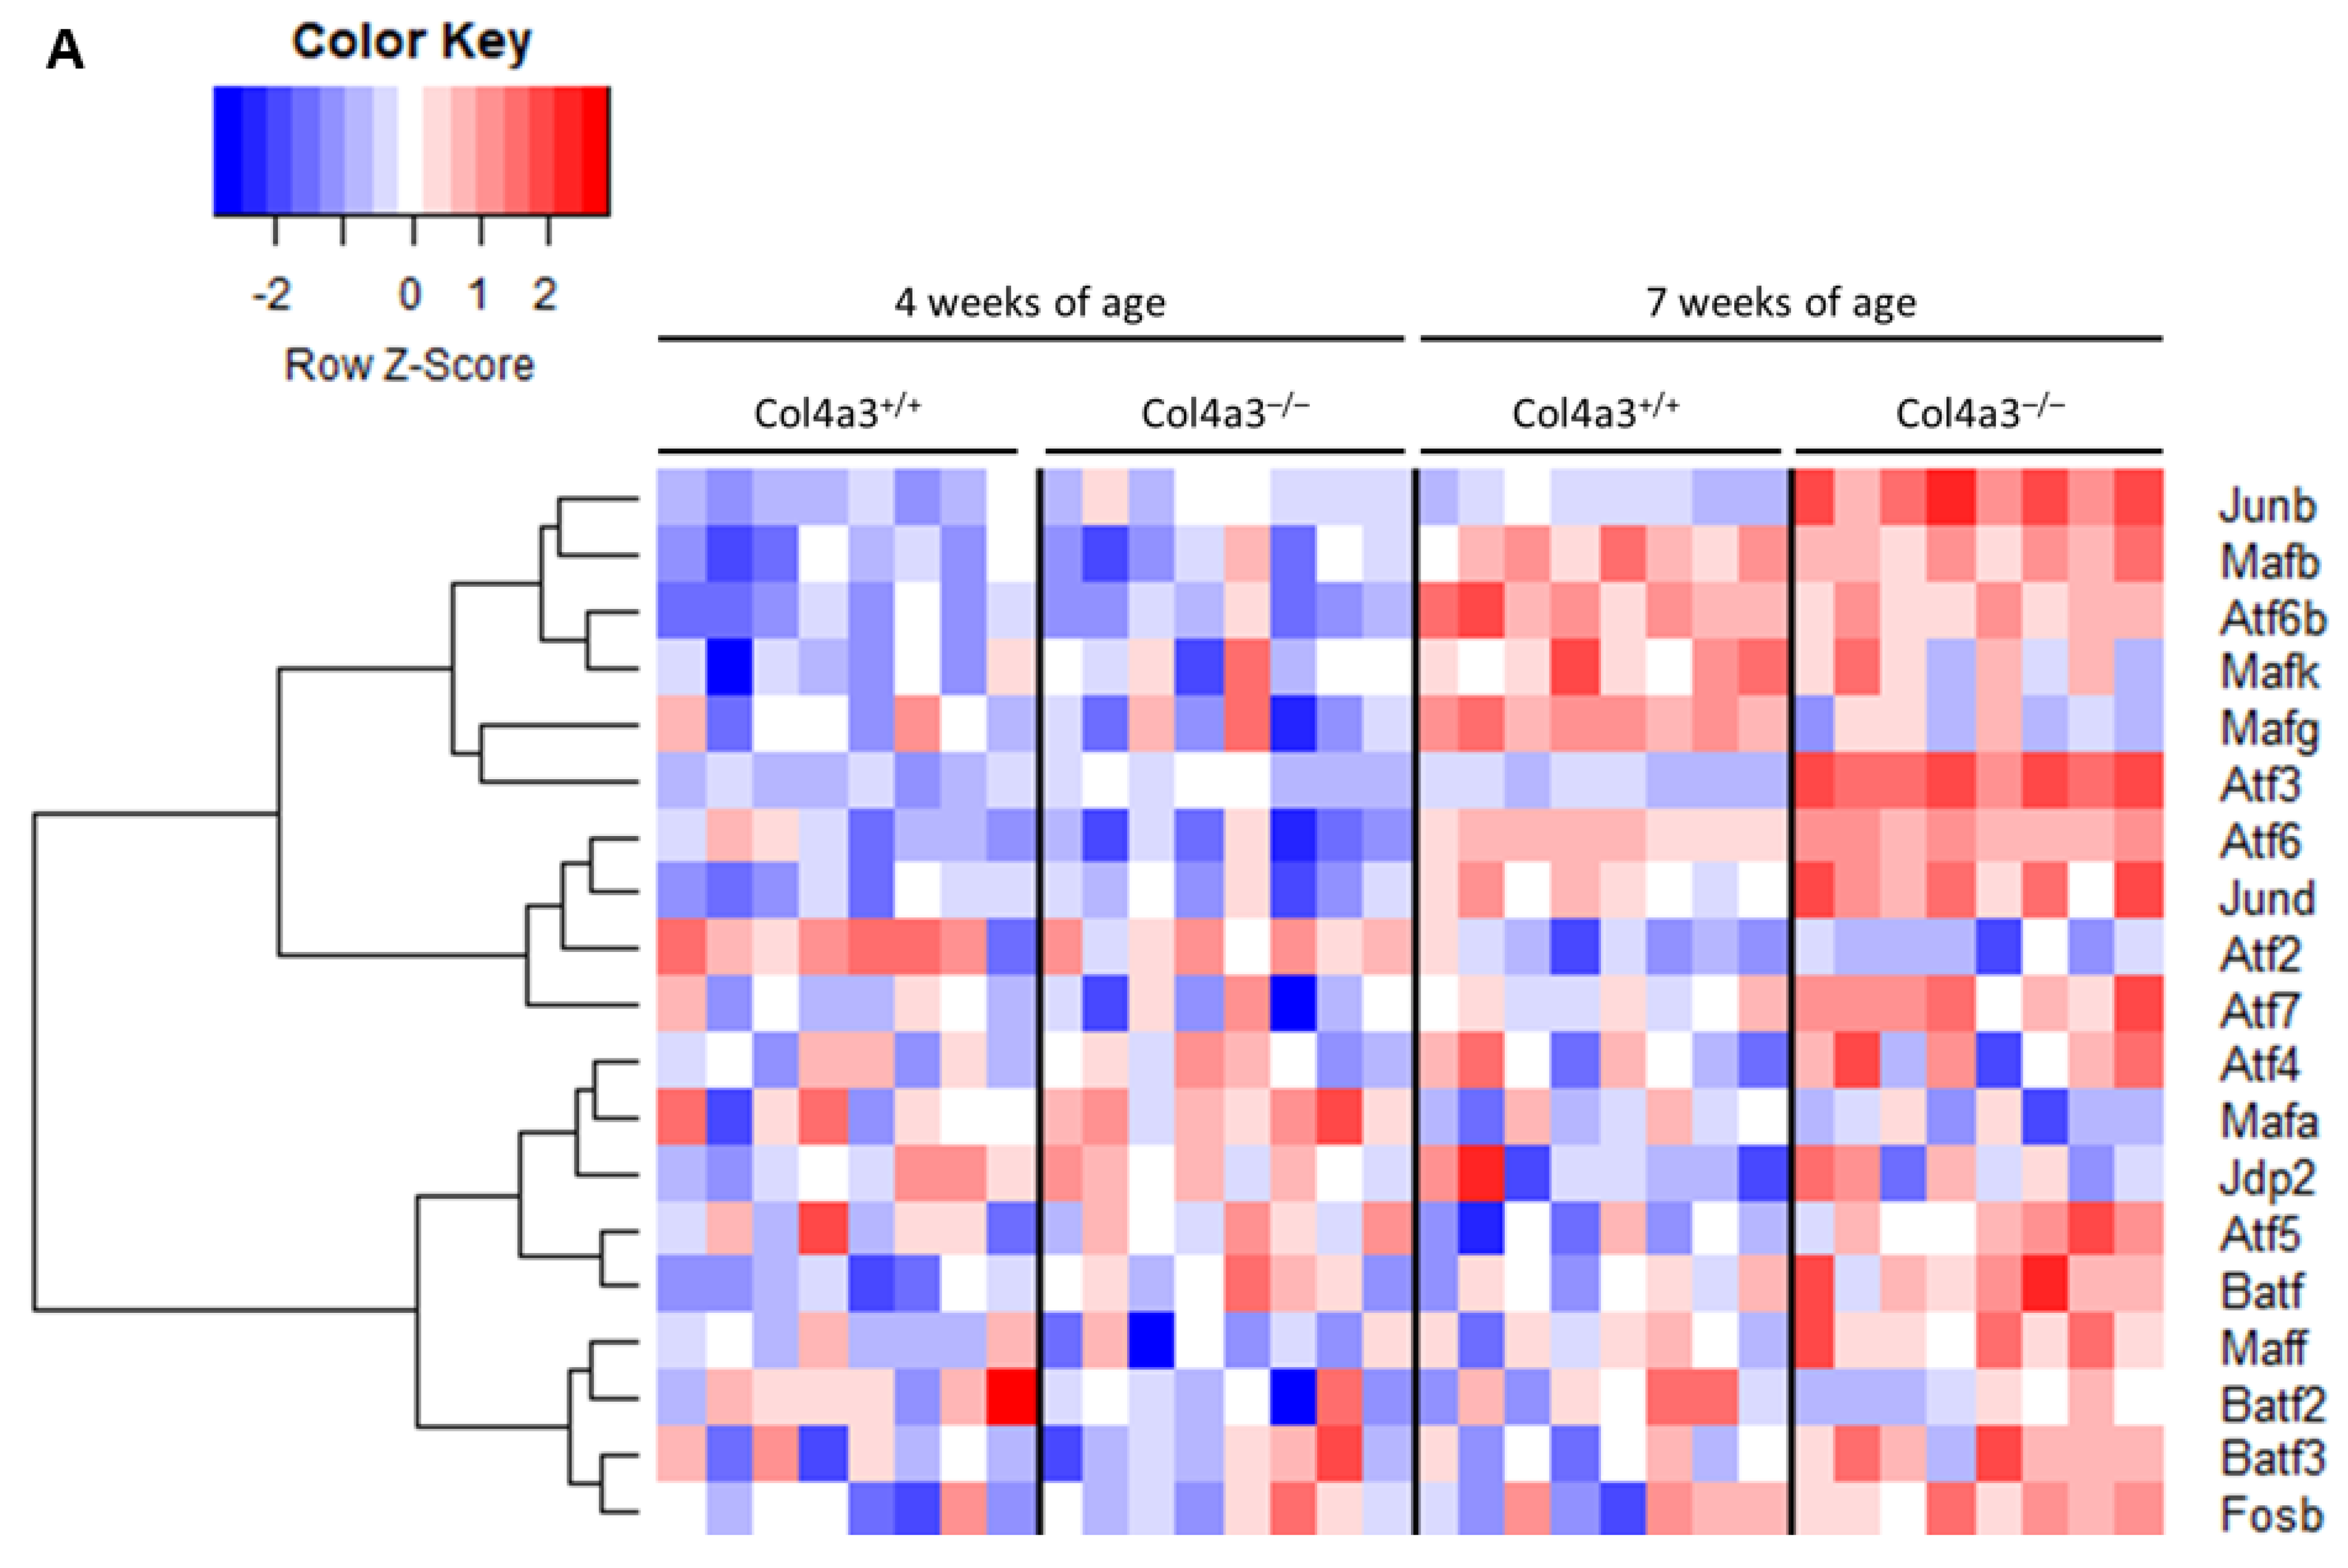
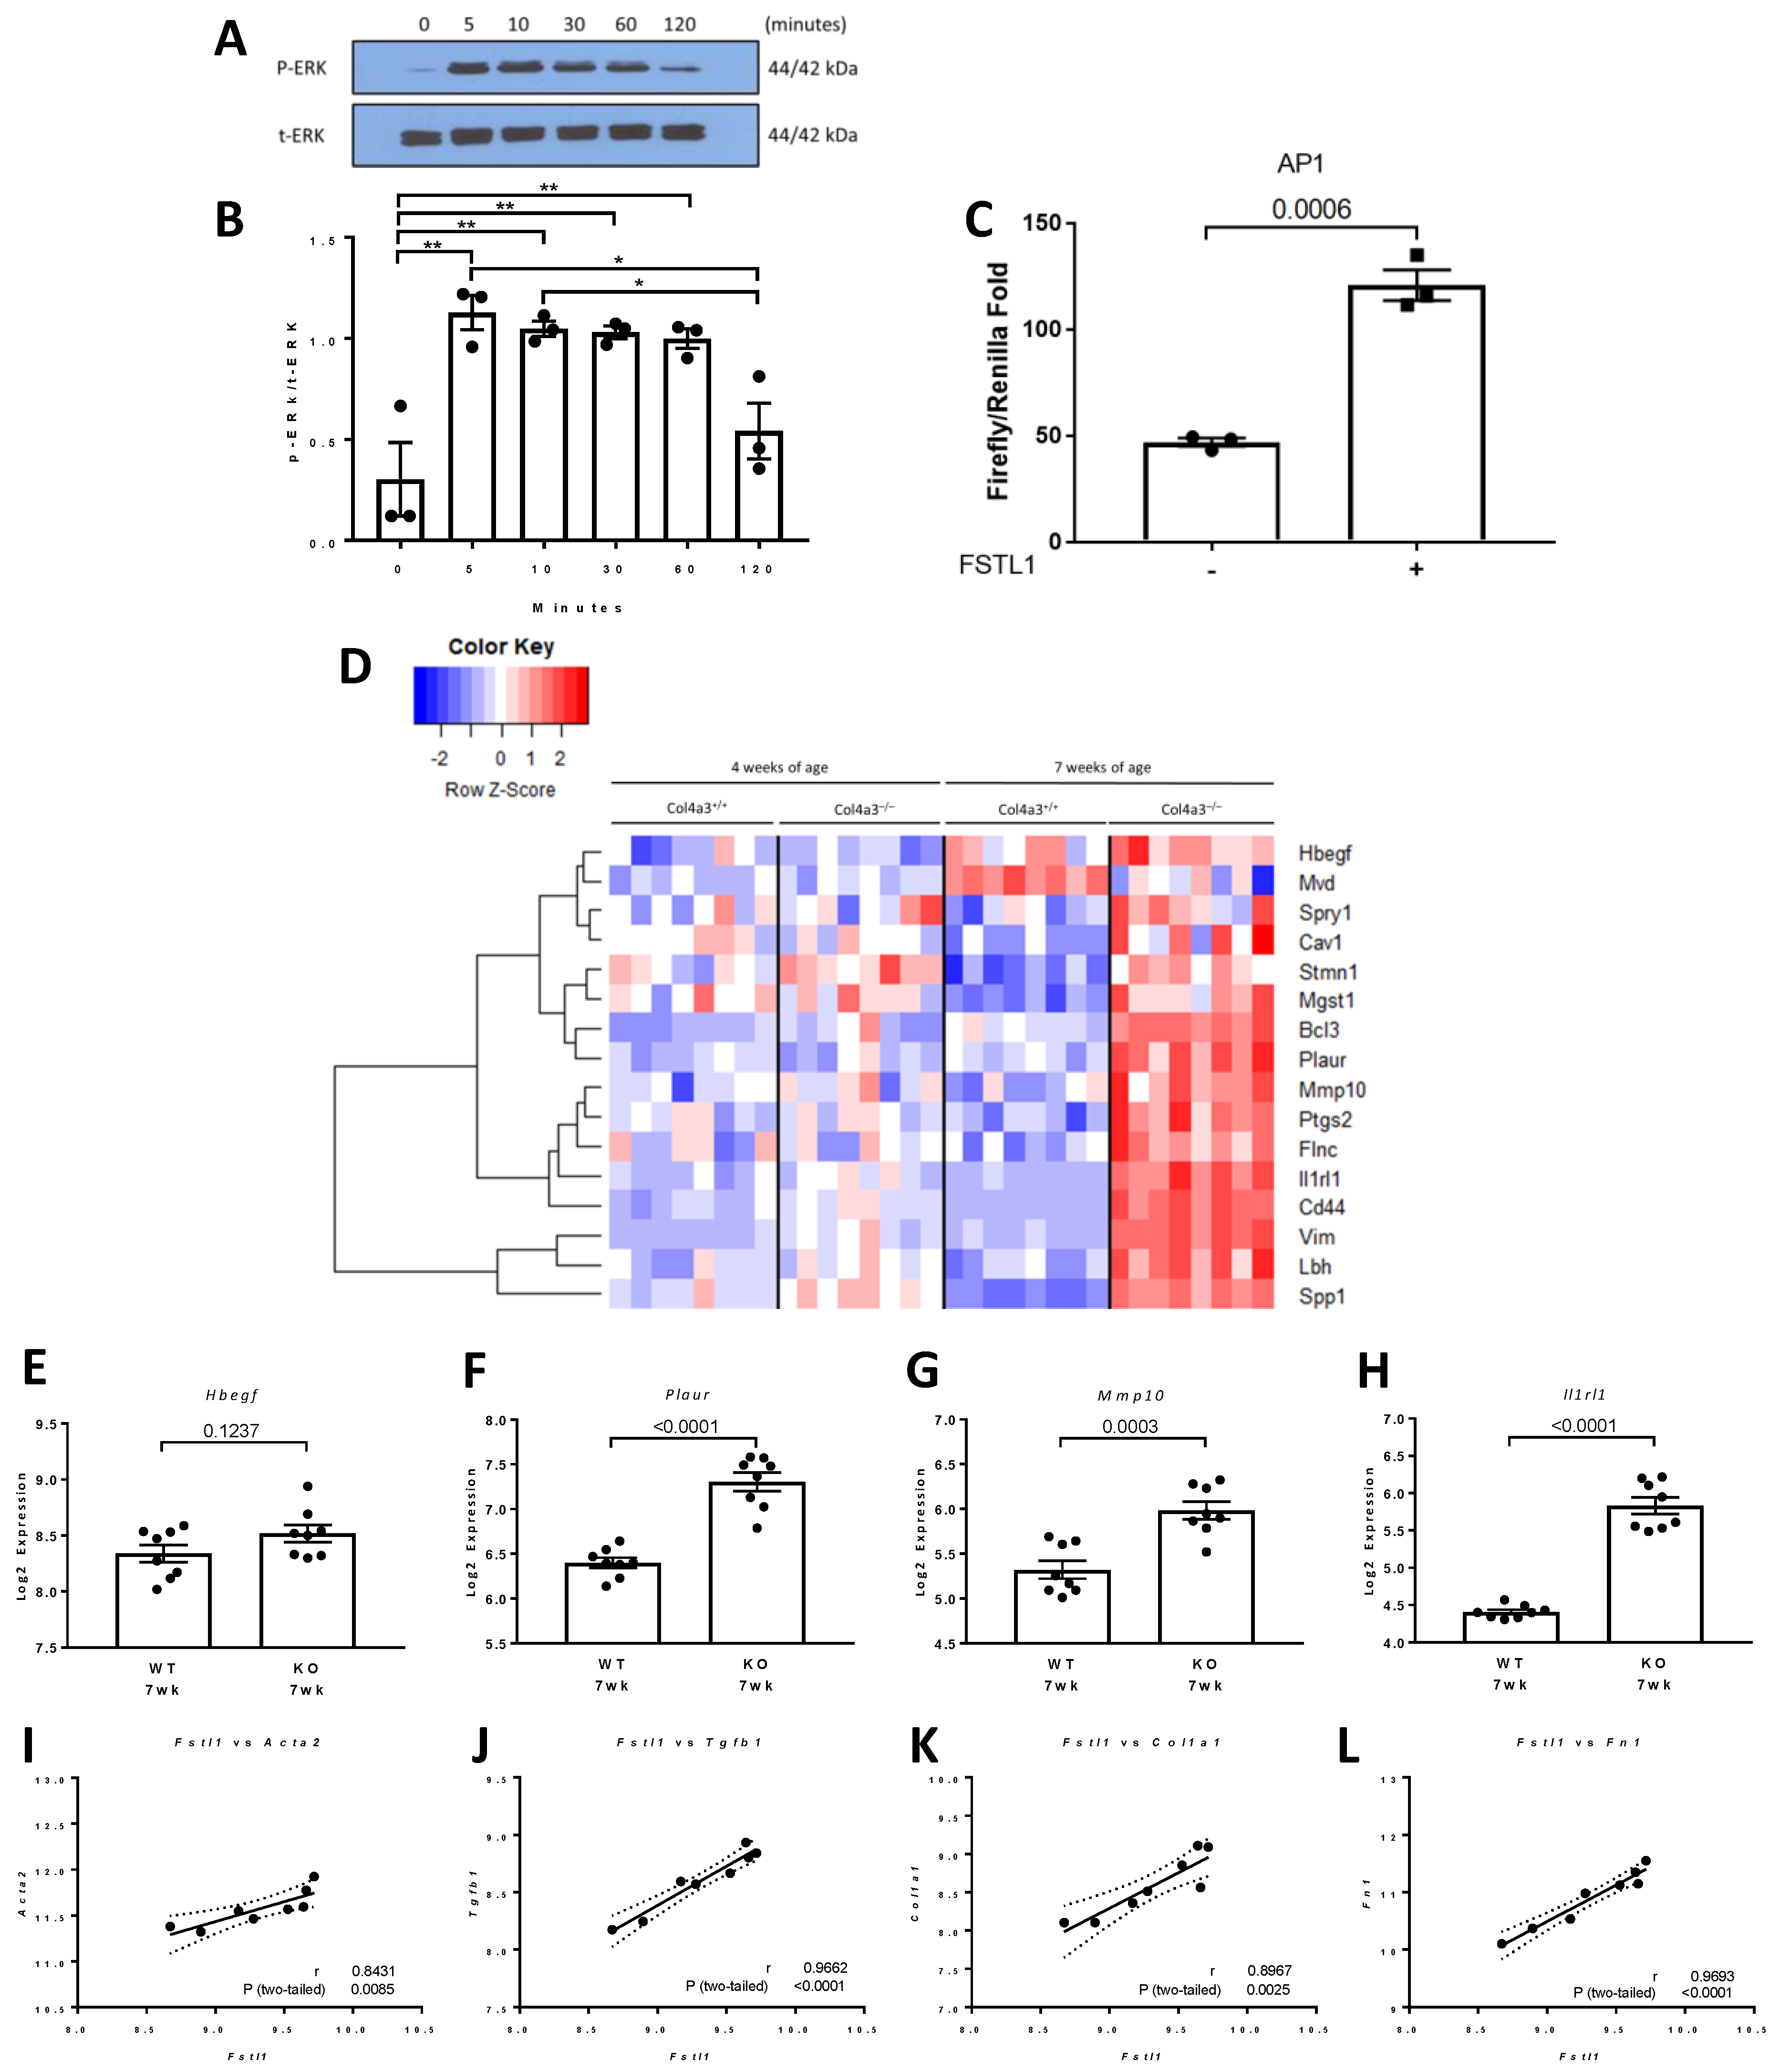
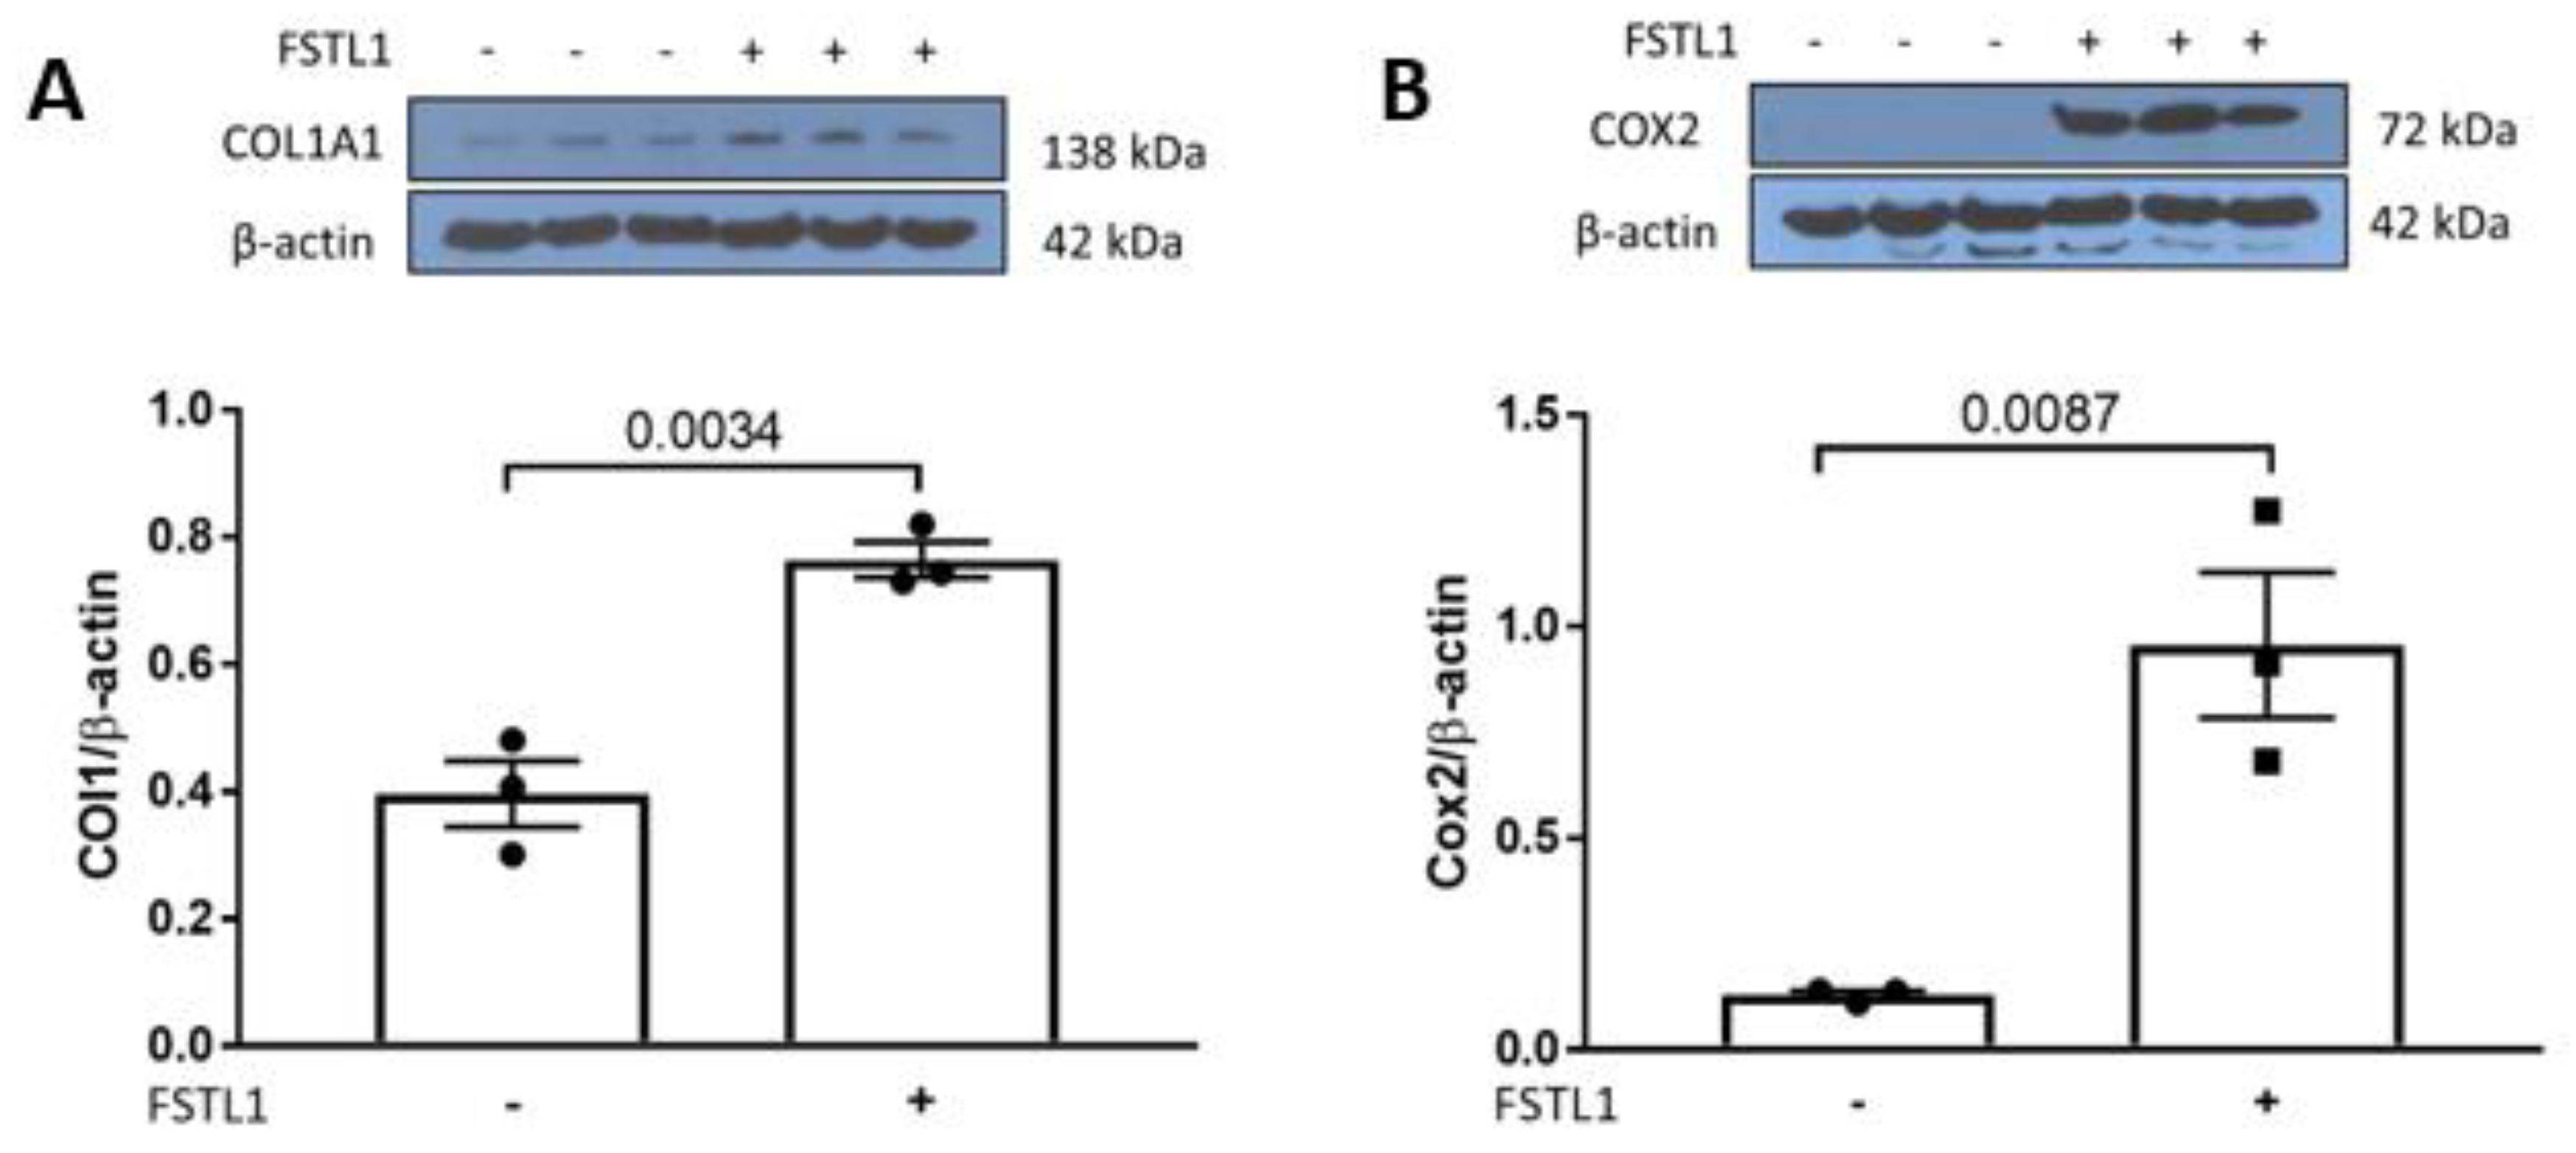
2.4. p42/44 MAPK and Activator Protein 1 (AP1) Signaling in Response to rhFSTL1

We have previously implicated tubular epithelial cells, mainly of the proximal tubule and collecting duct, as well as interstitial fibroblasts in the progression of chronic kidney disease in Col4a3-/- mice [5,6]. We therefore chose to study the effect of FSTL1 on p42/p44 MAPK phosphorylation and AP1-mediated gene expression in HK2 cells. Treatment with rhFSTL1 led to time-dependent phosphorylation of p42/44 MPAK (ERK) (Figure 10A,B). Biopsies from patients with fibrotic conditions, including kidney fibrosis, showed higher levels of nuclear AP1 transcription factors, while activation of AP1 can lead to interstitial fibrosis in several organs. Next, we studied the effect of rhFSTL1 on AP1 activation in kidney epithelial HK2 cells. We transfected HK2 cells with an AP1 luciferase reporter plasmid and measured promoter activity in response to rhFSTL1 stimulation. Treatment with rhFSTL1 was associated with 2 to 3-fold activation of AP1-mediated gene expression, as assessed by luciferase activity (p < 0.0006) (Figure 10C). Connie and coworkers defined a set of 17 genes regulated by AP1. We studied the expression of this AP1 signature in the 4 and 7 week old Col4a3-/- and Col4a3+/+ mice. The heat map in Figure 10D illustrates the gene expression pattern. The majority of genes in the AP1 signature are up-regulated in 7 week old Col4a3-/- mice compared to Col4a3+/+ mice, and the magnitude of the changes in a selected set of these genes (Hbegf, Plaur, Mmp10, and Ilr1) is shown in Figure 10E–H. Finally, we related Fstl1 expression to the expression of four of these genes that are key fibrosis-associated genes, namely, alpha smooth muscle actin (Acta2) (r = 0.84, p < 0.0085) (Figure 10I), transforming growth factor beta 1 (Tgfb1) (r = 0.96, p < 0.001) (Figure 10J), collagen 1a1 (Col1a1) (r = 0.90, p < 0.0025) (Figure 10K), and fibronectin-1 (Fn1) (r = 0.97, p < 0.0001) (Figure 10L) by qPCR.

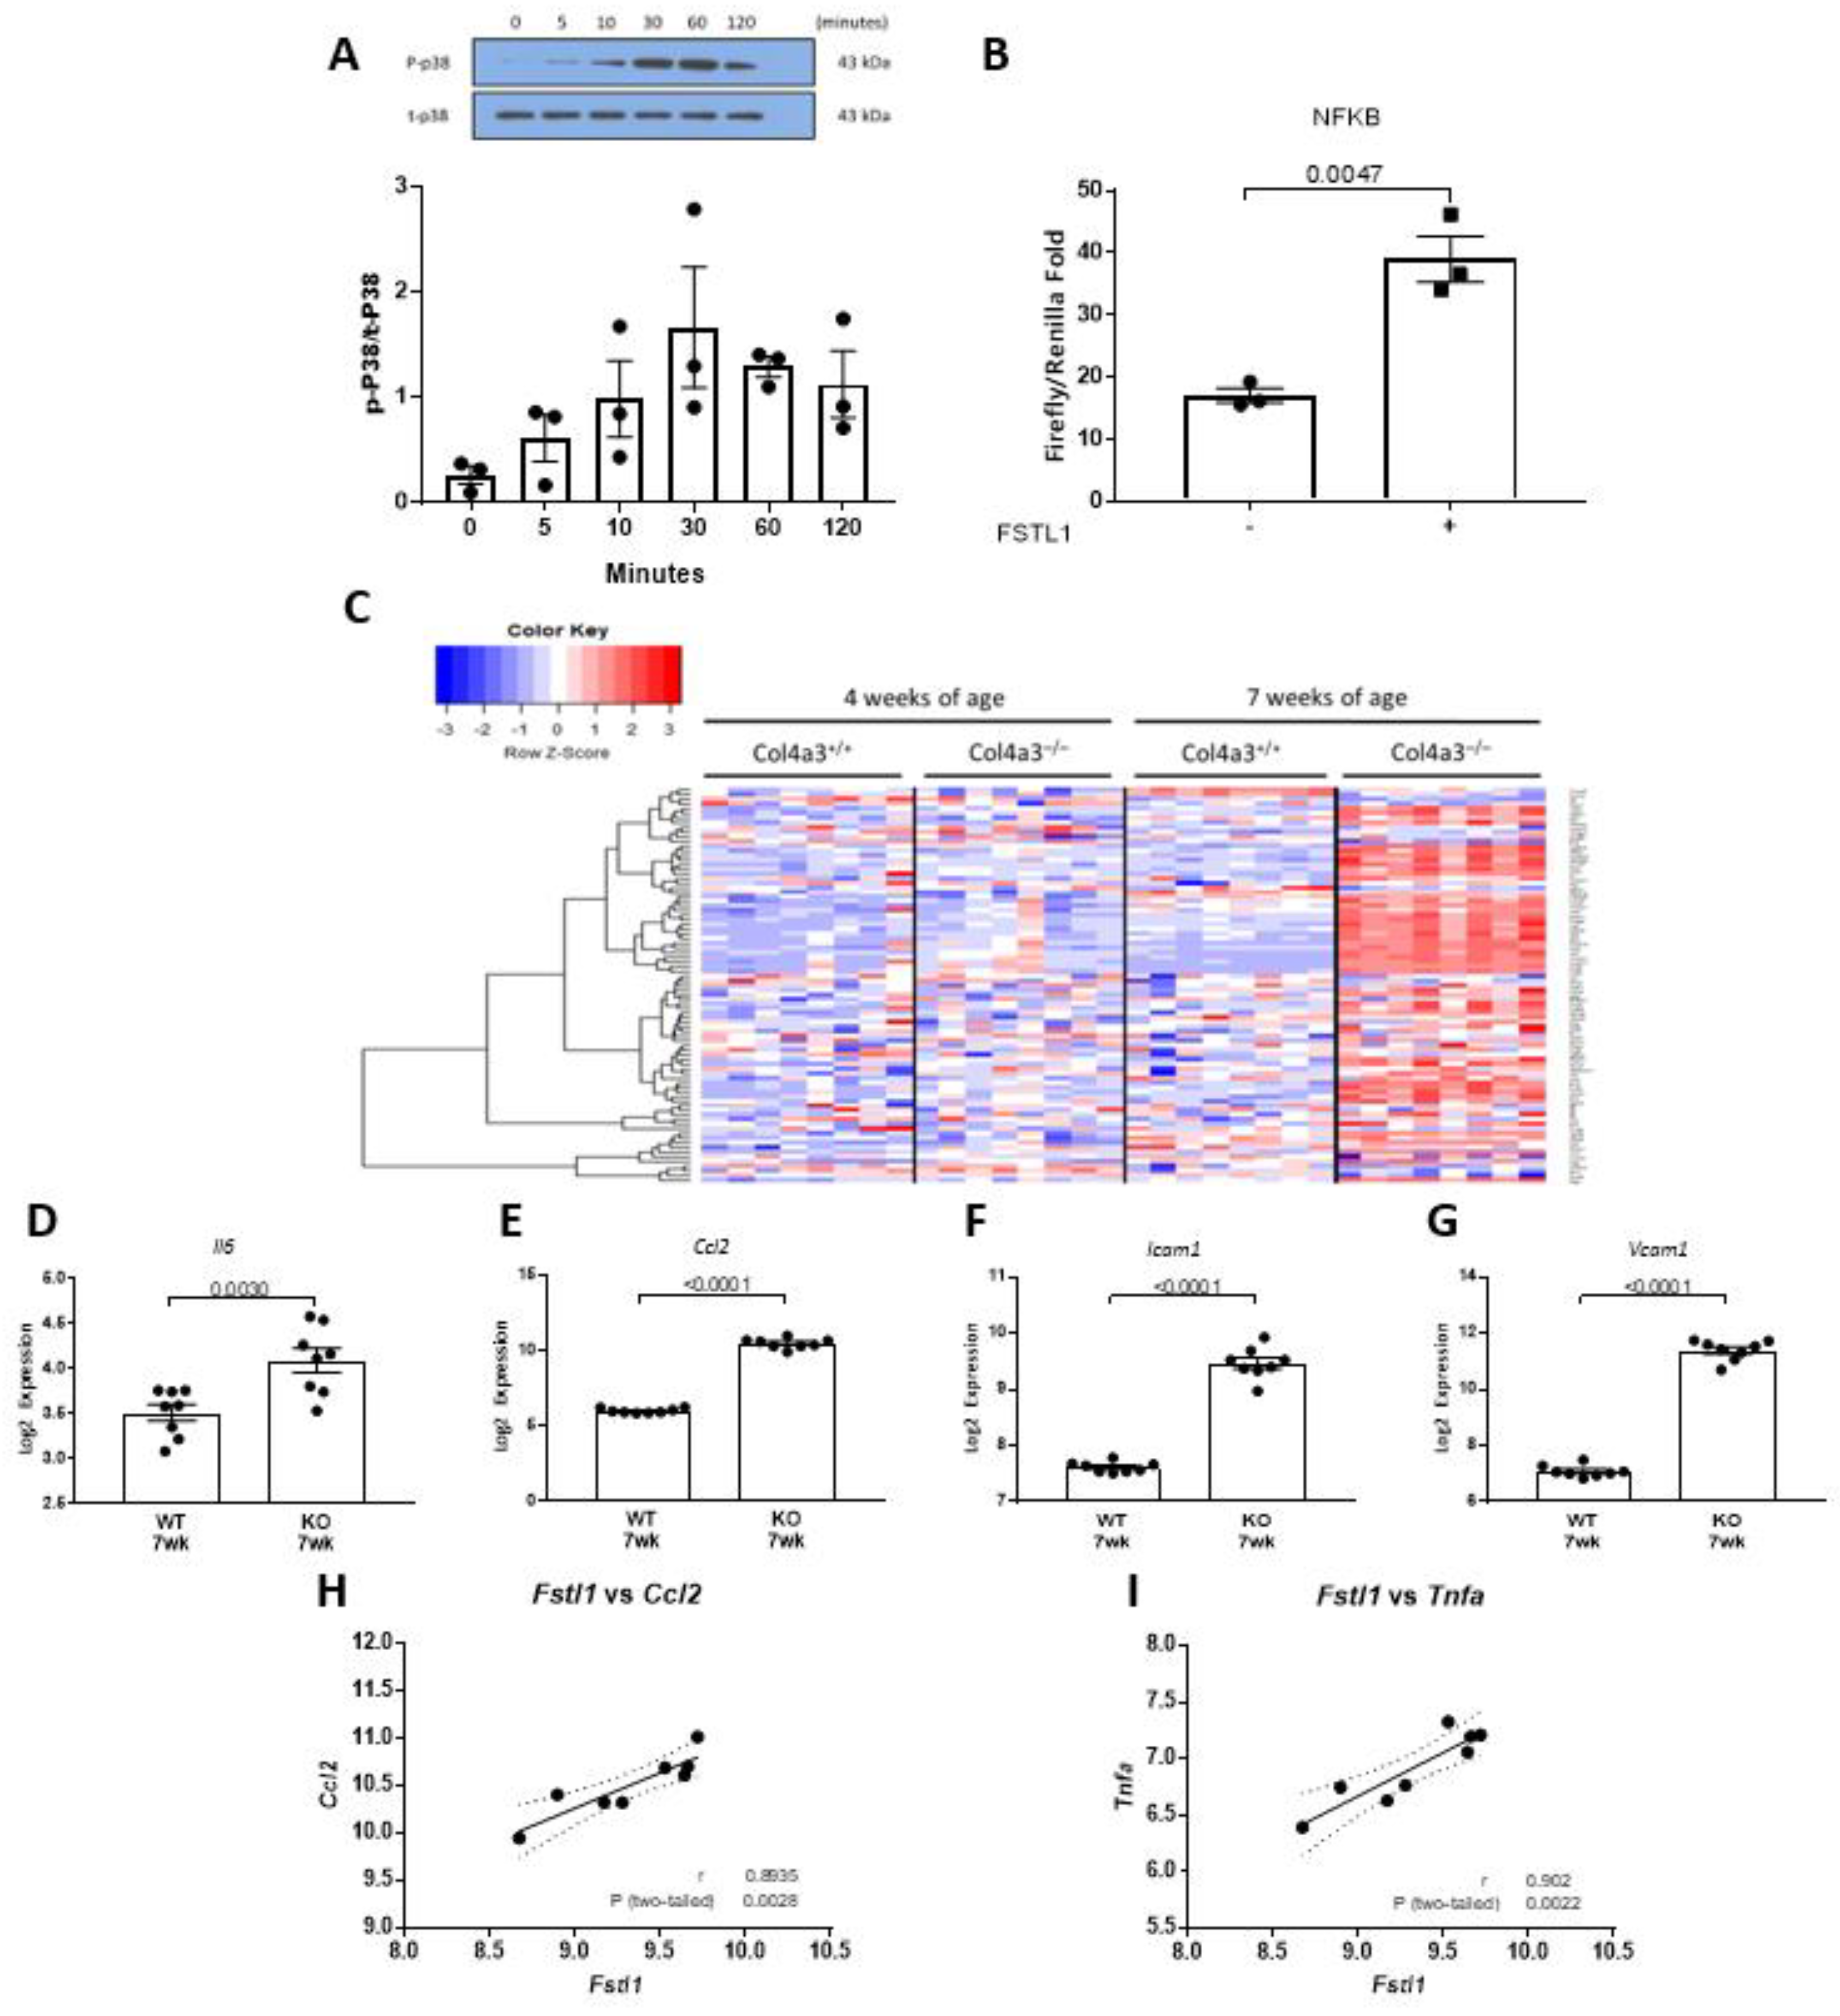
2.5. p38 MAPK and NFκB Signaling in Response to Fstl1

We have also implicated infiltrating inflammatory cells and cytokines in the progression of chronic kidney disease in Col4a3-/- mice. Since MAPKs, including p38, promote inflammation, we explored activation of p38 by rhFSTL1 in HK2 cells. We first studied the effect of rhFSTL1 on p38 MAPK phosphorylation. Treatment with rhFSTL1 led to time-dependent phosphorylation of p38 MAPK (Figure 11A). We next studied the effect of rhFSTL1 on NFκB activation in kidney epithelial HK2 cells. We transfected HK2 cells with an NFκB luciferase reporter plasmid and measured promoter activity in response to rhFSTL1 stimulation. rhFSTL1 was associated with a 2-fold activation of NFκB-mediated gene expression, as assessed by luciferase activity (p < 0.0047) (Figure 11B). Pahl and coworkers assembled a list of 113 genes regulated by NFκB. We studied the expression of this NFκB signature in the 4 and 7 week old Col4a3-/- and Col4a3+/+ mice. The heat map in Figure 11C illustrates the gene expression pattern that emerged from this unsupervised hierarchical analysis. The majority of genes in the NFκB signature are up-regulated in 7 week old Col4a3-/- mice compared to Col4a3+/+ mice. The expression levels of Il6 (p = 0.003) (Figure 11D), Ccl2 (p = 0.003) (Figure 11E), Icam1 (p = 0.003) (Figure 11F), and Vcam1 (p = 0.003) (Figure 11G) were significantly greater in 7 week old Col4a3-/- mice than in Col4a3+/+ mice. Finally, we related Fstl1 expression levels to the expression of 2 of these genes that are important inflammation-associated genes, namely, monocyte chemoattractant proptein-1 or Ccl2 (r = 0.89, p < 0.0028) (Figure 11H) and Tnfa (r = 0.90, p < 0.0022) (Figure 11I) by qPCR. Western blot analysis showed that rhFSTL1 increased COL1A1 (p = 0.0034) and COX2 protein expression in HK2 cells (p = 0.0087) (Figure 12B).

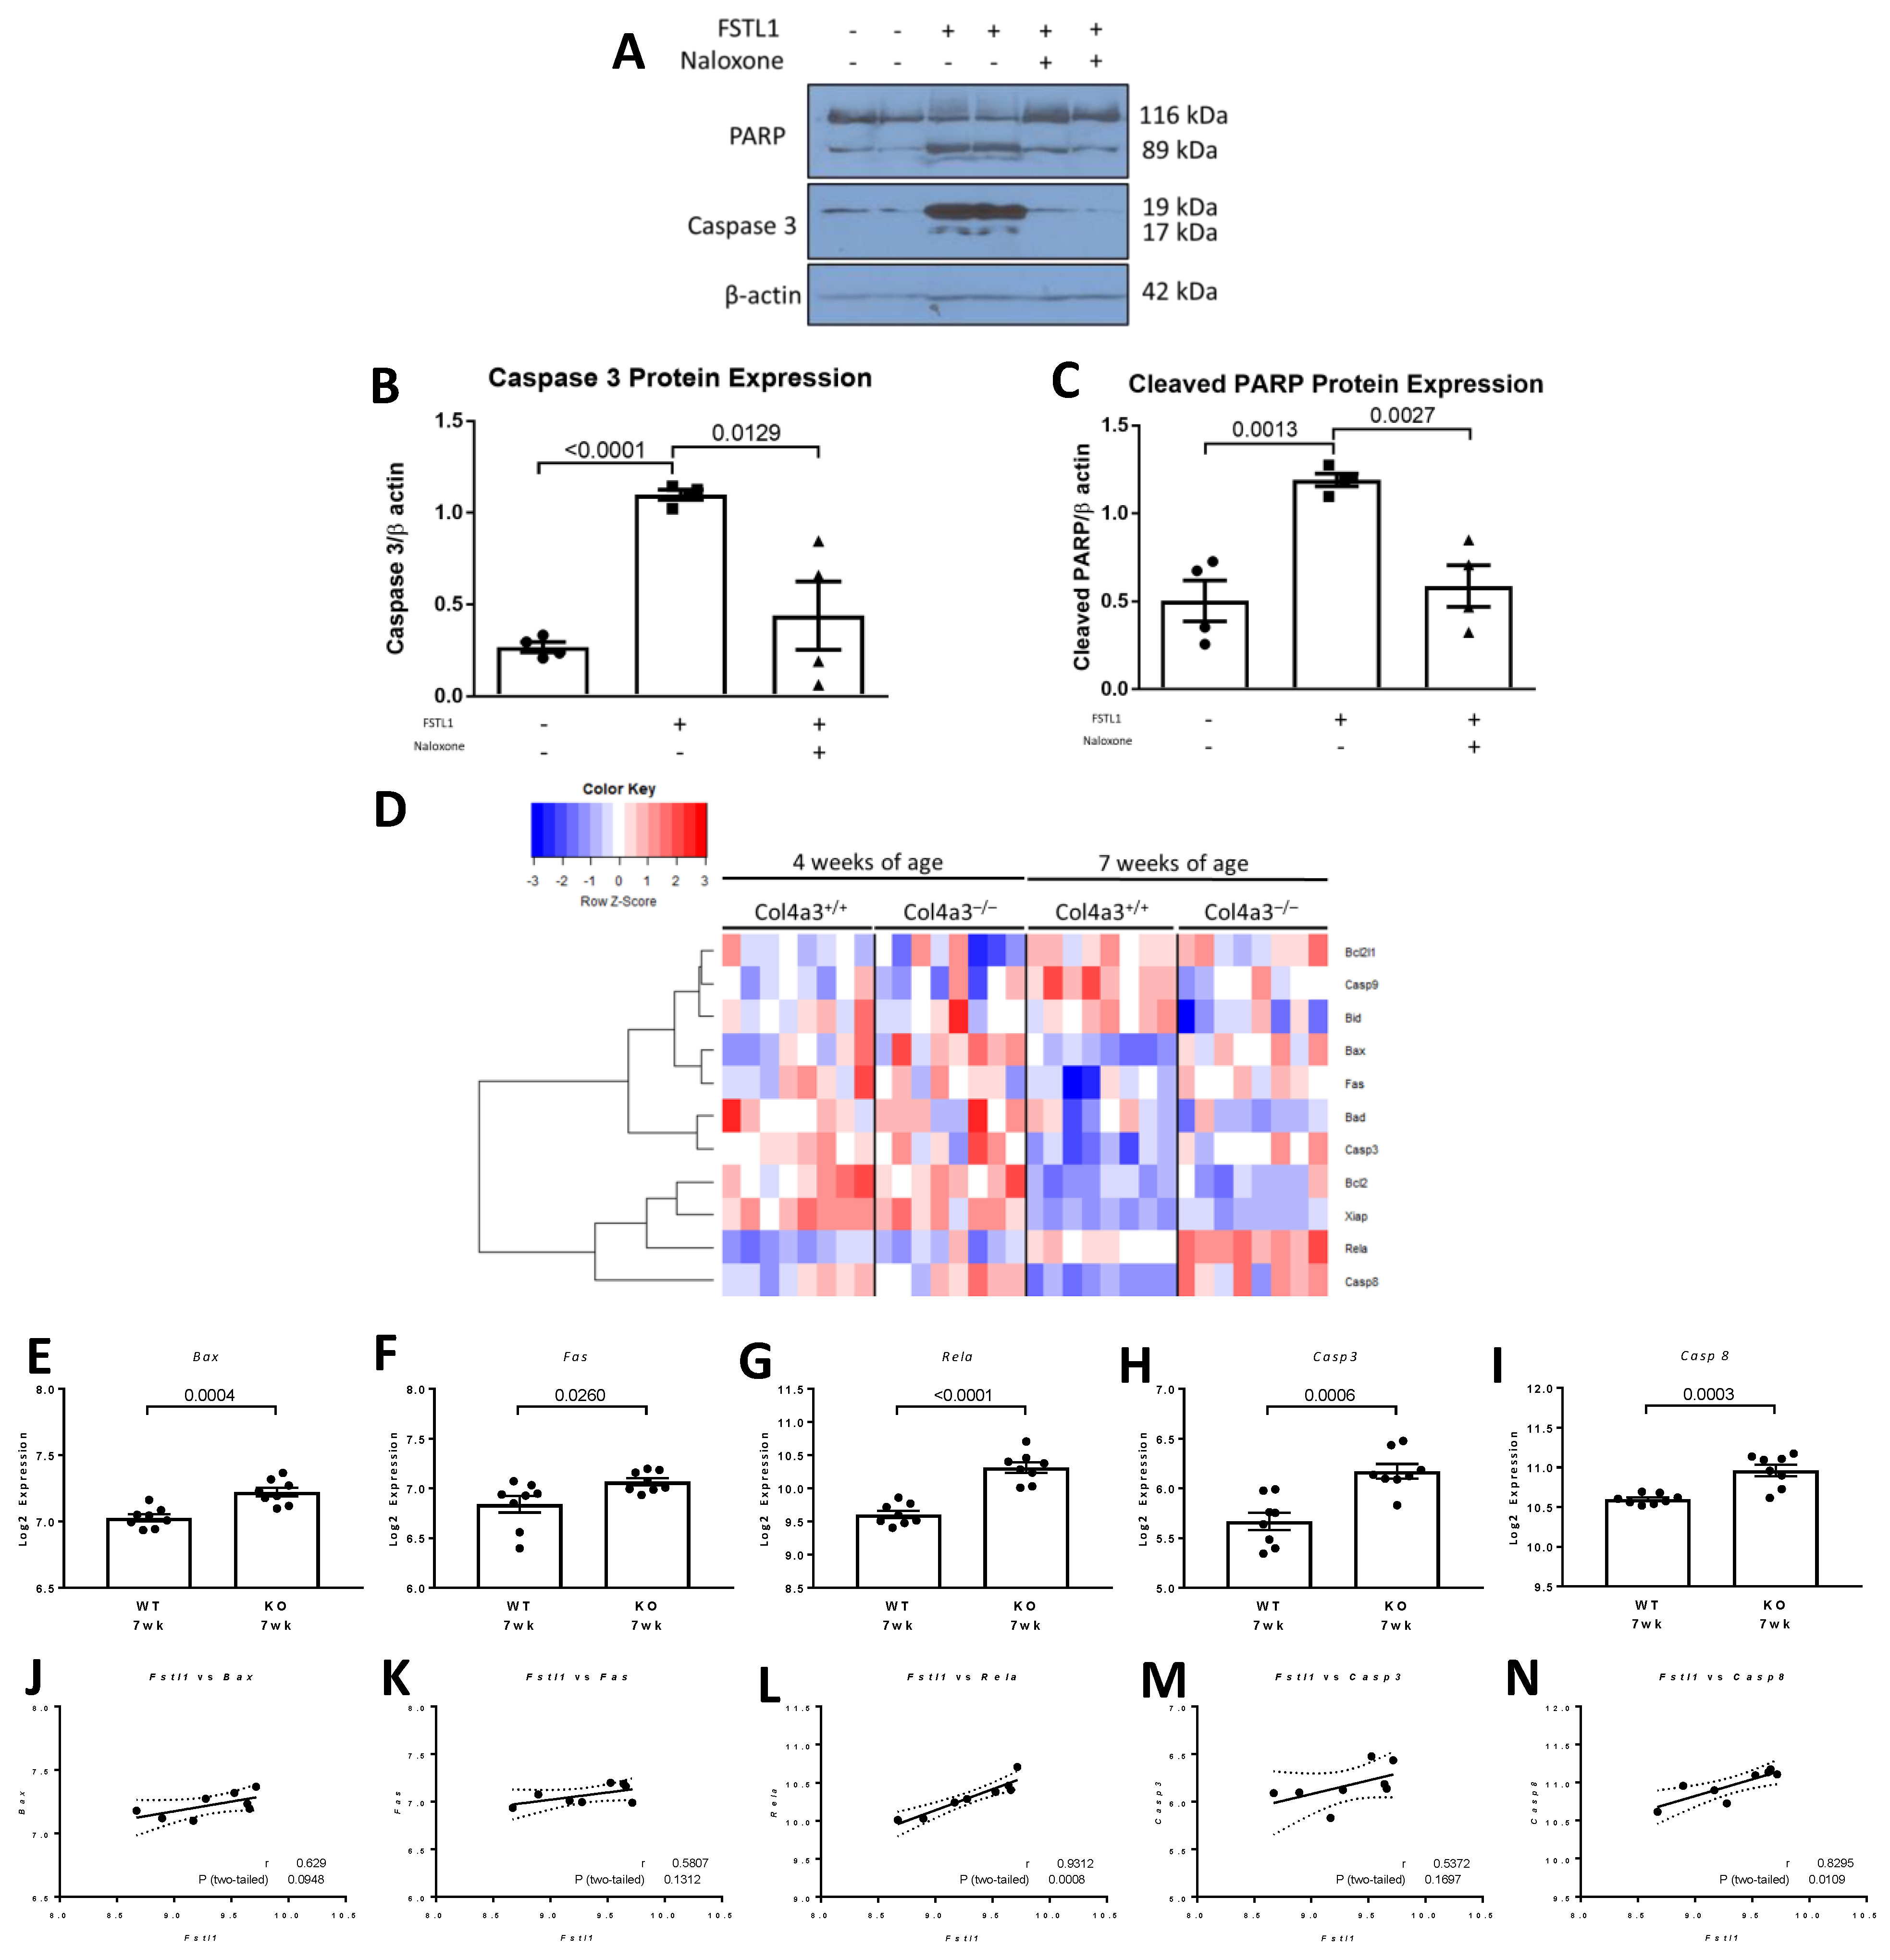
2.6. Apoptosis in Response to rhFSTL1

Pathology studies have shown that tubular atrophy and cell loss are features of chronic kidney disease but a role for FSTL1 in apoptosis in the kidney is unknown. Accordingly, we studied the effect of rhFSTL1 on apoptosis in HK2 cells. Treatment with rhFSTL1 increased PARP cleavage and CASP3 activation, as assessed by Western blot analysis (Figure 13A). Densitometry showed a 3-fold rise in CASP3 activation (p < 0.0001) and a 2-fold rise in PARP cleavage (p = 0.0013) (Figure 13B,C, respectively). Interestingly, pre-treatment with naloxone, a TLR4 receptor antagonist attenuated the effects of rhFSTL1 on these measures of apoptosis (Figure 13B,C). We then studied the expression of 12 genes implicated in apoptosis in 4 and 7 week old Col4a3-/- and Col4a3+/+ mice. The heat map in Figure 13C illustrates the gene expression pattern that emerged from this unsupervised hierarchical cluster analysis. There was no dominant expression pattern in the 7 week old Col4a3-/- mice compared to 7 week old Col4a3+/+ mice. However, the expression levels of several pro-apoptotic genes including Bax (p = 0.0004) (Figure 13E), Fas (p = 0.026) (Figure 13F), Rela (p < 0.001) (Figure 13G), Casp3 (p < 0.0006) (Figure 13H), and Casp8 (p = 0.0003) (Figure 13I), were significantly greater in 7 week old Col4a3-/- mice than in Col4a3+/+ mice. Finally, we related Fstl1 expression levels to the expression of these six pro-apoptotic genes: Bax (r = 0.63, p = 0.0948) (Figure 13J), Fas (r = 0.58, p = 0.13) (Figure 13K), Rela (r = 0.93, p < 0.0008) (Figure 13L), Casp3 (r = 0.54, p < 0.16) (Figure 13M), and Casp8 (r = 0.83, p = 0.011) (Figure 13N). Although the relationships for all six genes exhibited similar trends, only two associations were statistically significant: Rela and Casp8.

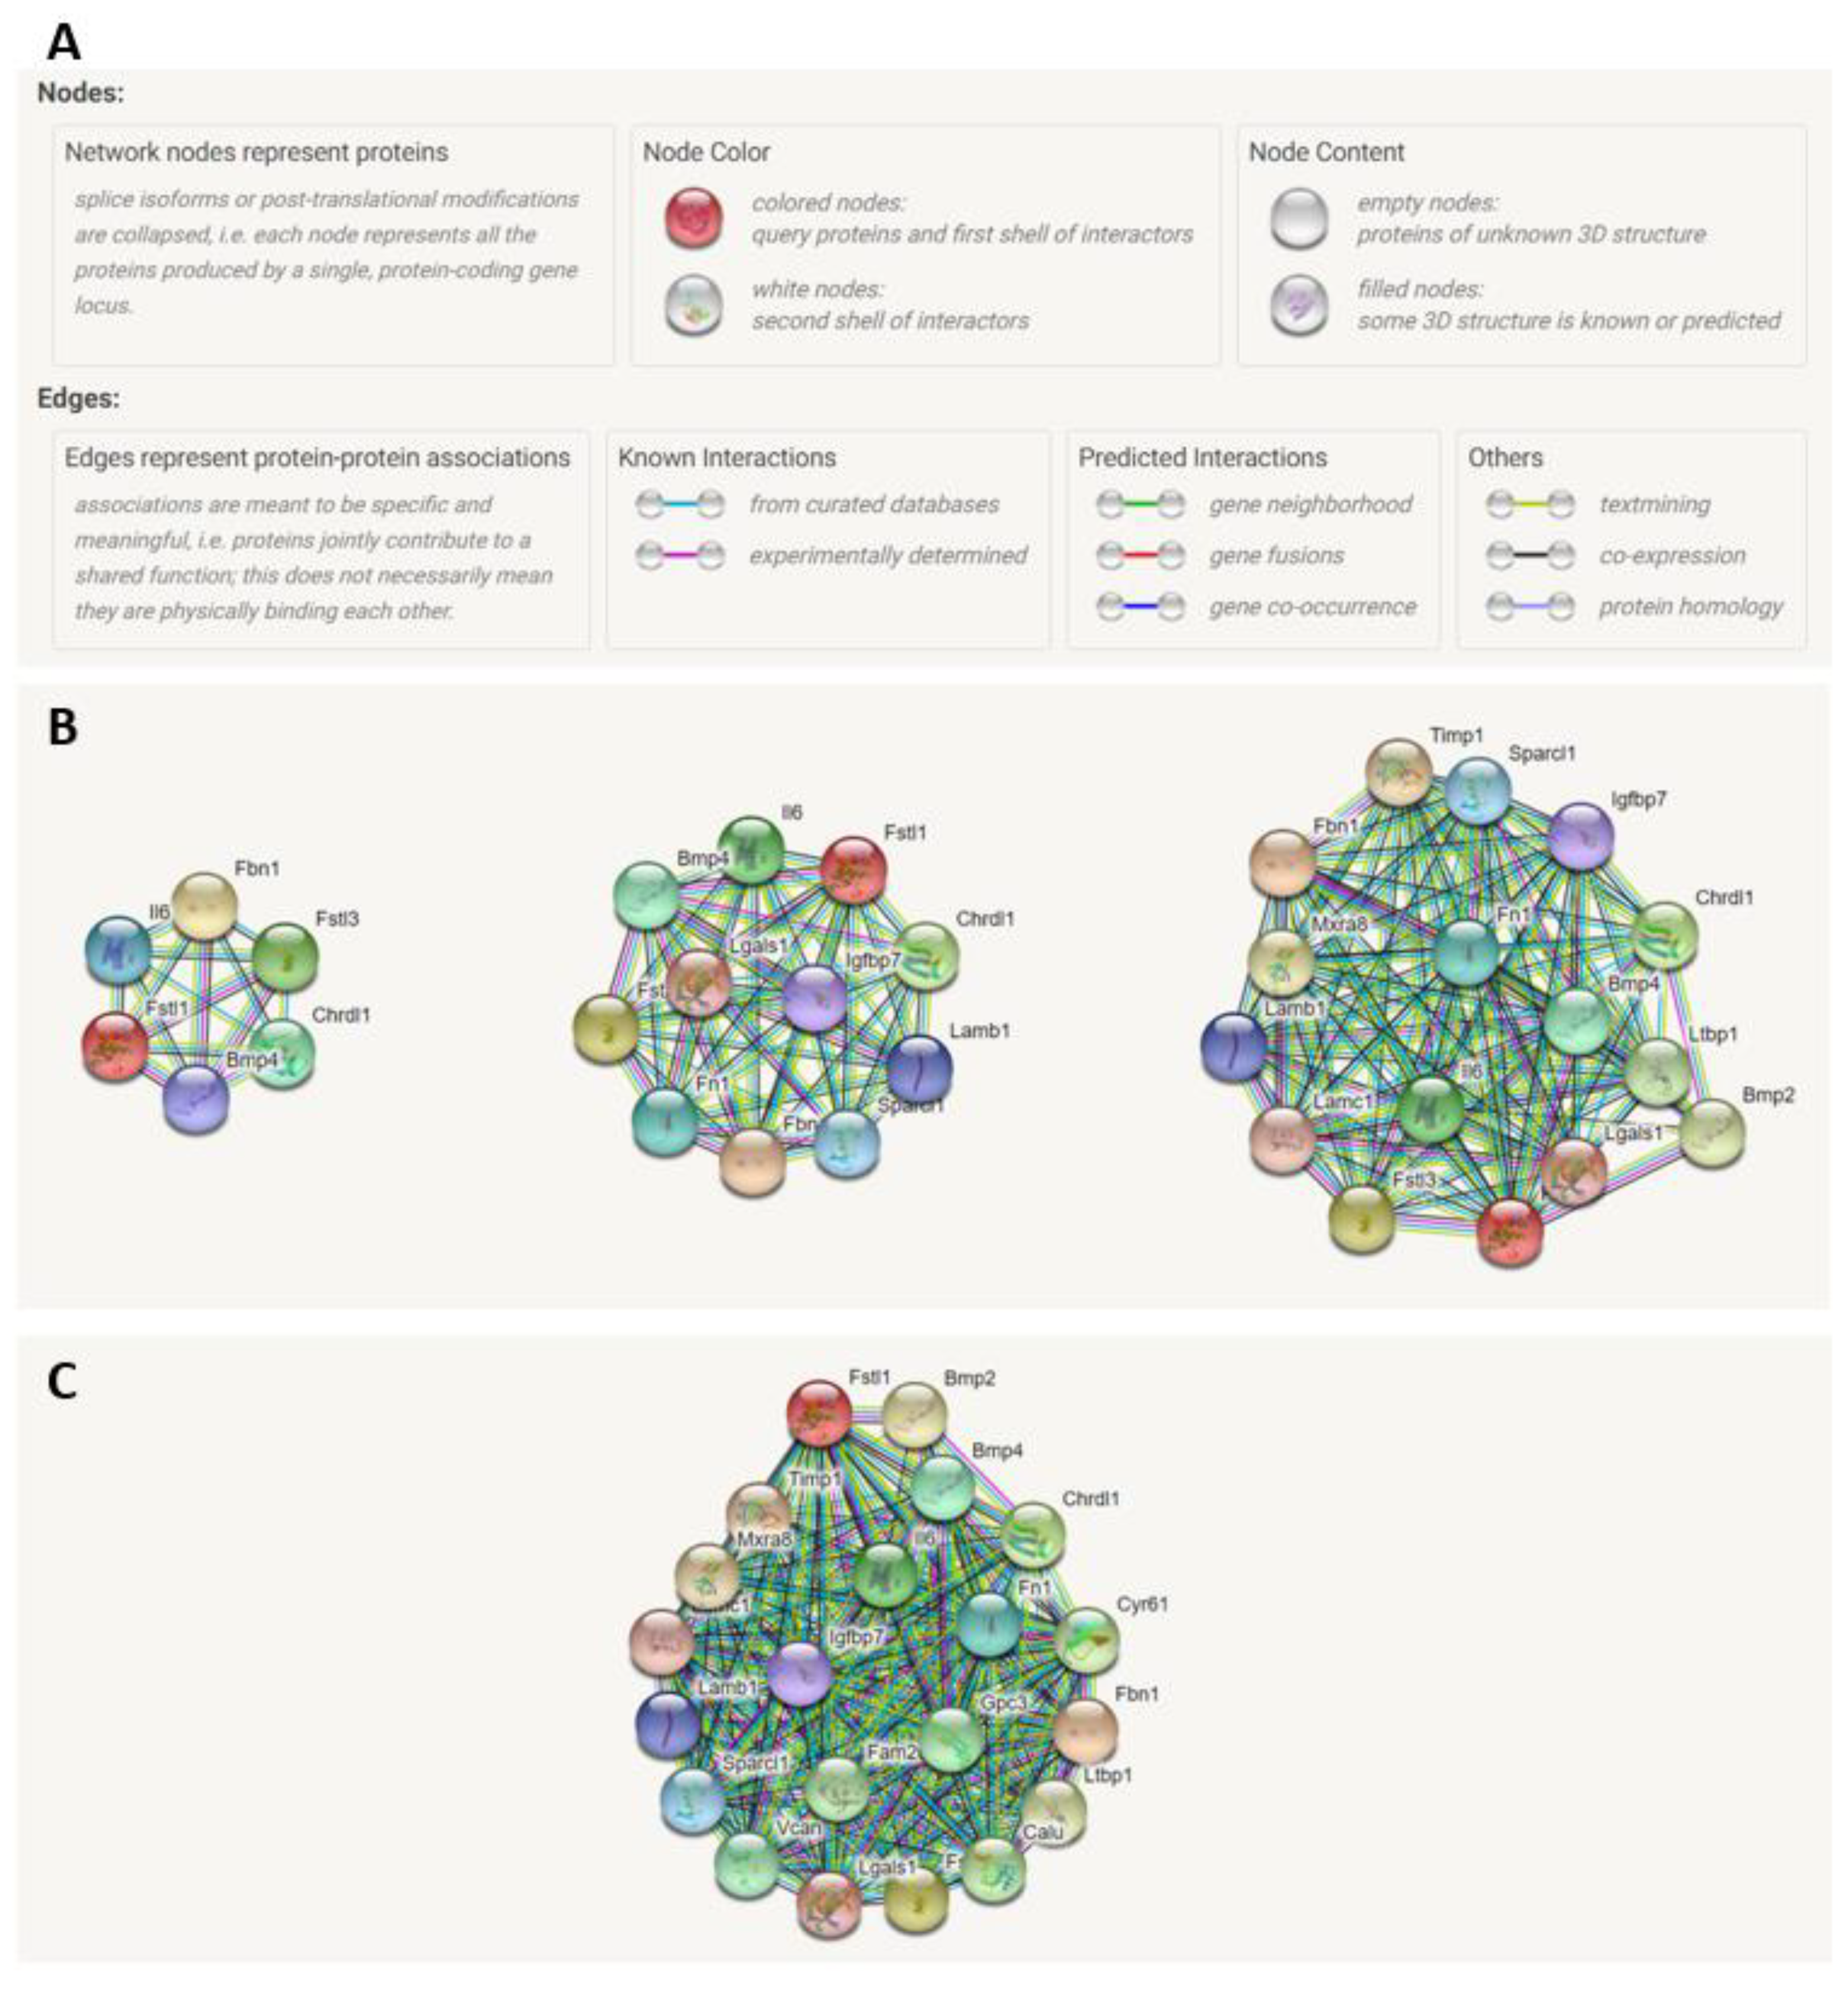
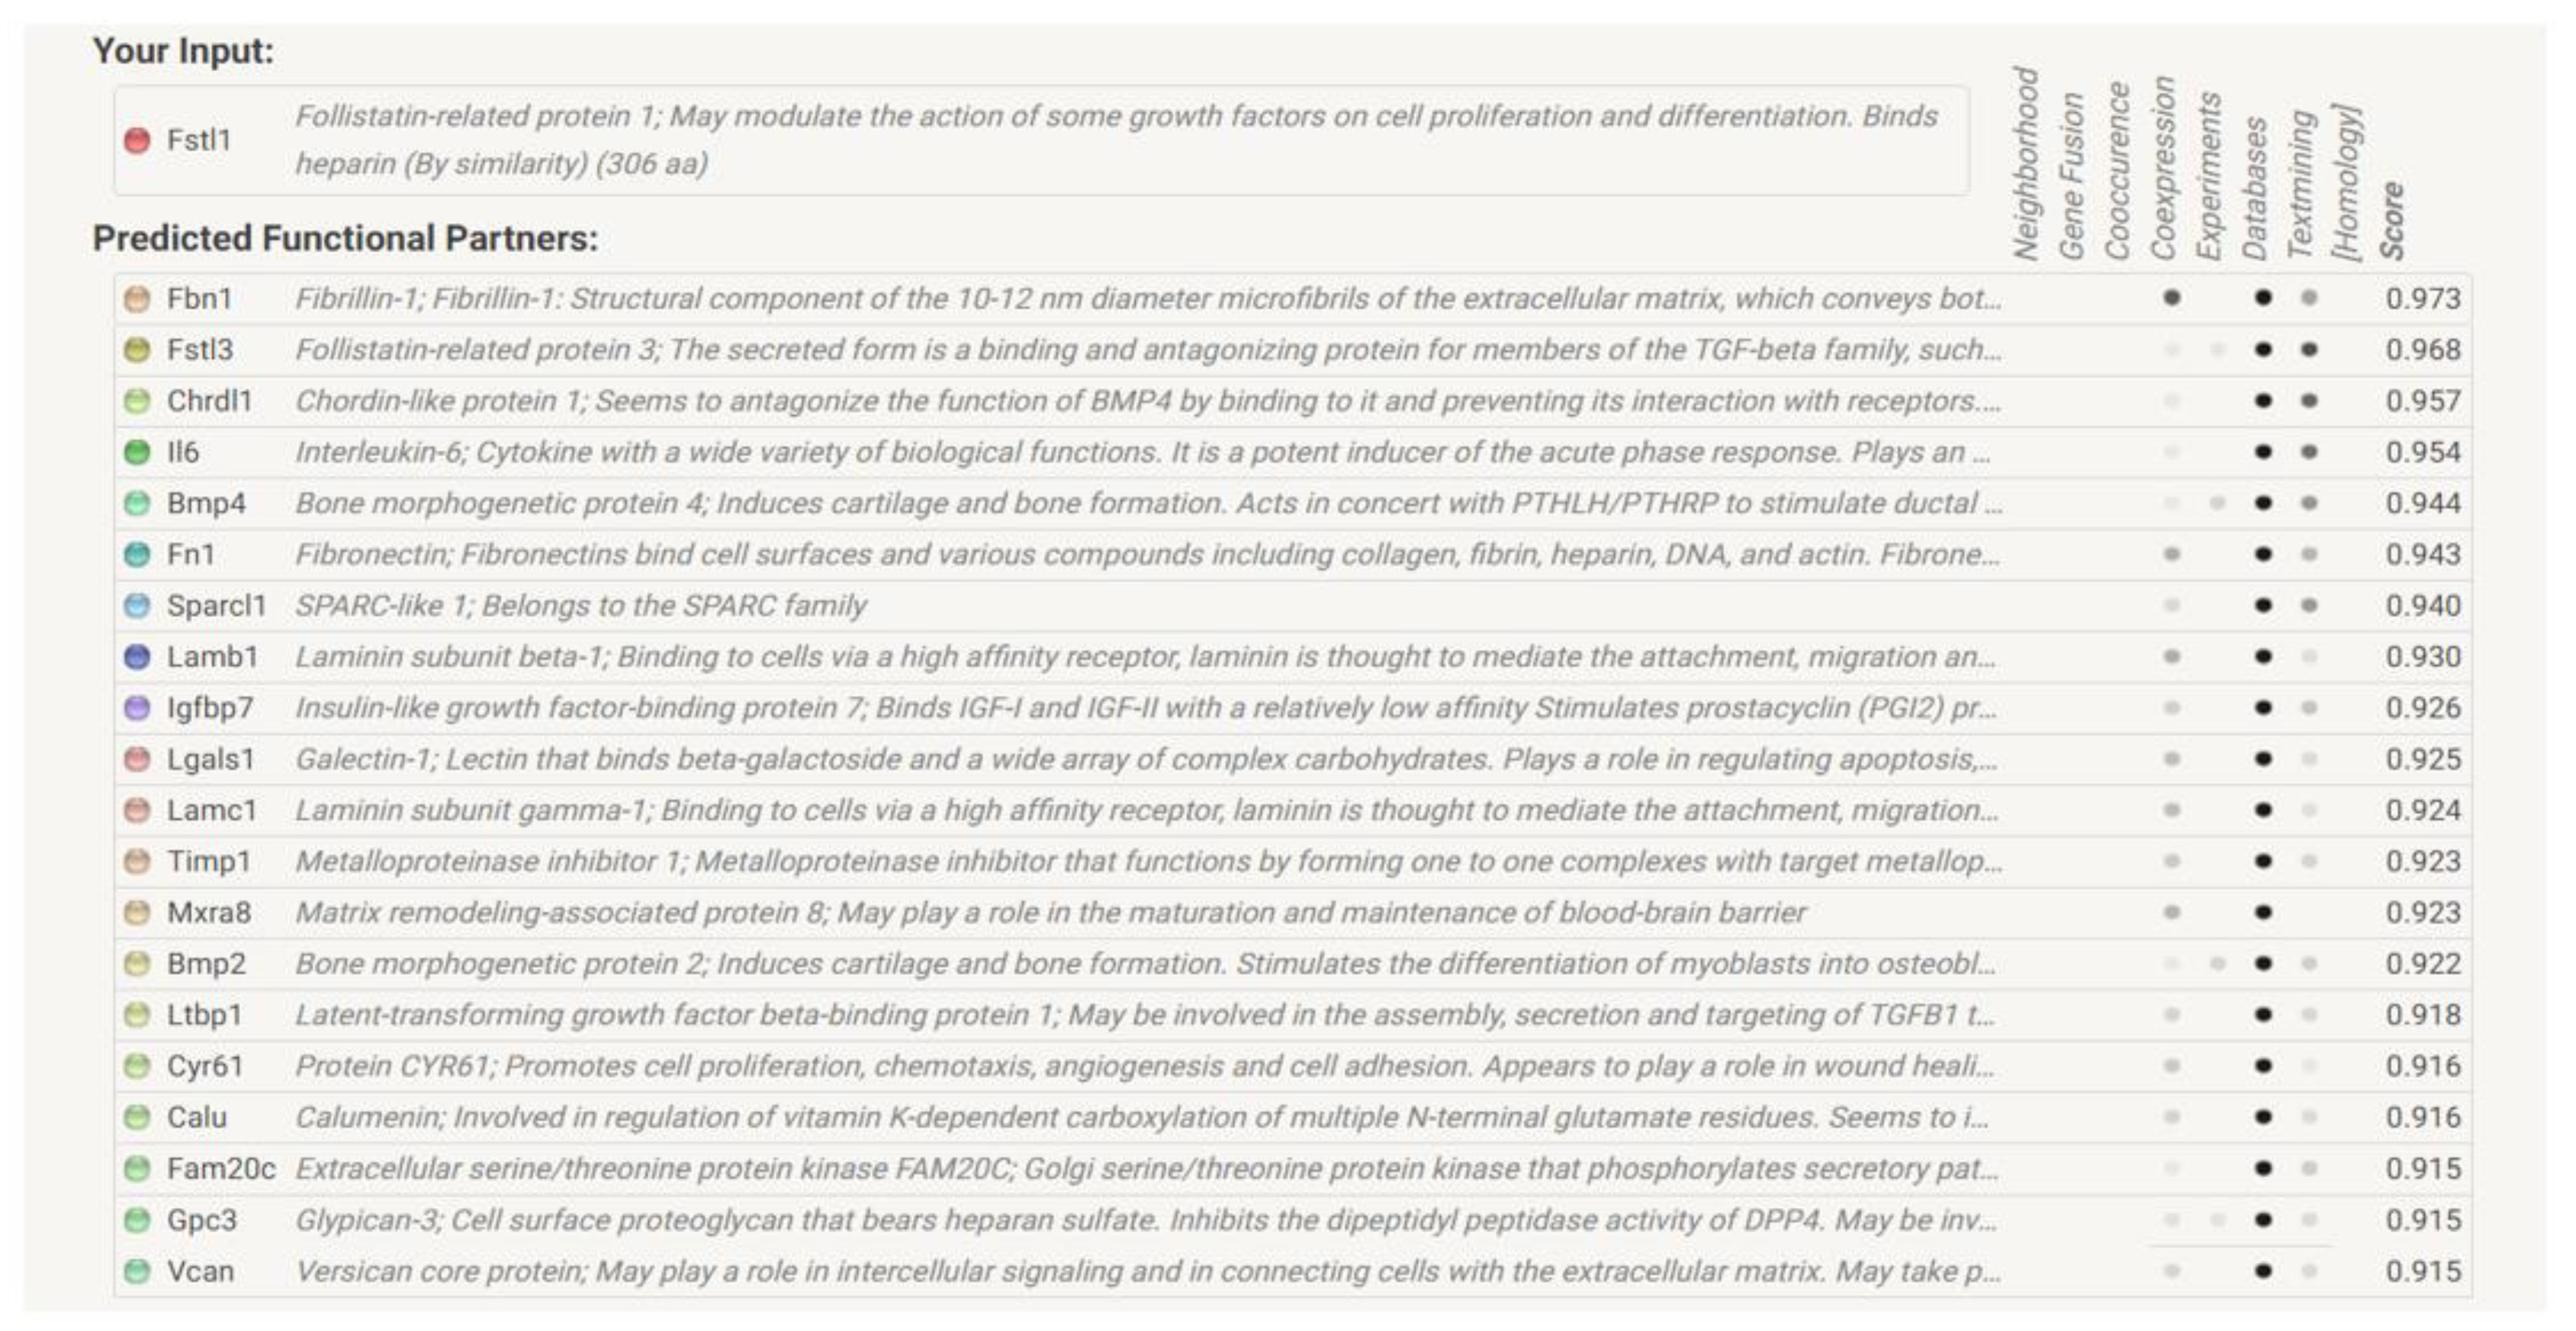
2.7. STRING Analysis of FSTL1 Protein–Protein Interactions

We next used STRING analysis to generate a list of proteins that may interact with FSTL1. Figure 14B shows the network as the number of proteins and interactions increase, and colored lines show the type of interaction between two nodes or proteins. The three shells shown in Figure 14B represent a protein–protein interaction network that starts with five proteins, which is then increased to 10 proteins, and then 15 proteins. Figure 14C shows a shell with 20 FSTL1-interacting proteins. We designated the list of 20 proteins generated by this STRING analysis of interactions to be an FSTL1 signature.
Figure 15 shows the 20 proteins comprising the largest network. This lists the protein names and provides the color code for the corresponding node (protein). We then examined mRNA levels of these proteins in microarray expression data from 4 and 7 week old Col4a3-/- and Col4a3+/+ mice. Figure 16A illustrates the gene expression pattern that emerged from an unsupervised hierarchical analysis in the four groups. In general, most of the genes representing the FSTL1 signature were over-expressed in the 7 week old Col4a3-/-. We explored the relative expression of eight representative genes in this signature (Figure 16B–I). The expression of the extracellular proteins LAMB1 (p = 0.0008) (Figure 16B), LAMC1 (p < 0.0001) (Figure 16C), and FN1 (p < 0.001) (Figure 16D), and VCAN (p < 0.001) (Figure 16E) were all significantly increased in the 7 week old Col4a3-/- compared to the 7 week old Col4a3+/+ mice. The expression levels of 2 bone morphogenic proteins, BMP2 and BMP4, were similar in the 7 week old Col4a3-/- and Col4a3+/+ mice (Figure 16F,G). Interestingly, expression levels of two proteins in the FSTL1 signature that regulate the accumulation of extracellular matrix proteins, TIMP1 and LTBP1, were also increased in 7 week old Col4a3-/- mice compared to 7 week old Col4a3+/+ mice (Figure 16H,I).

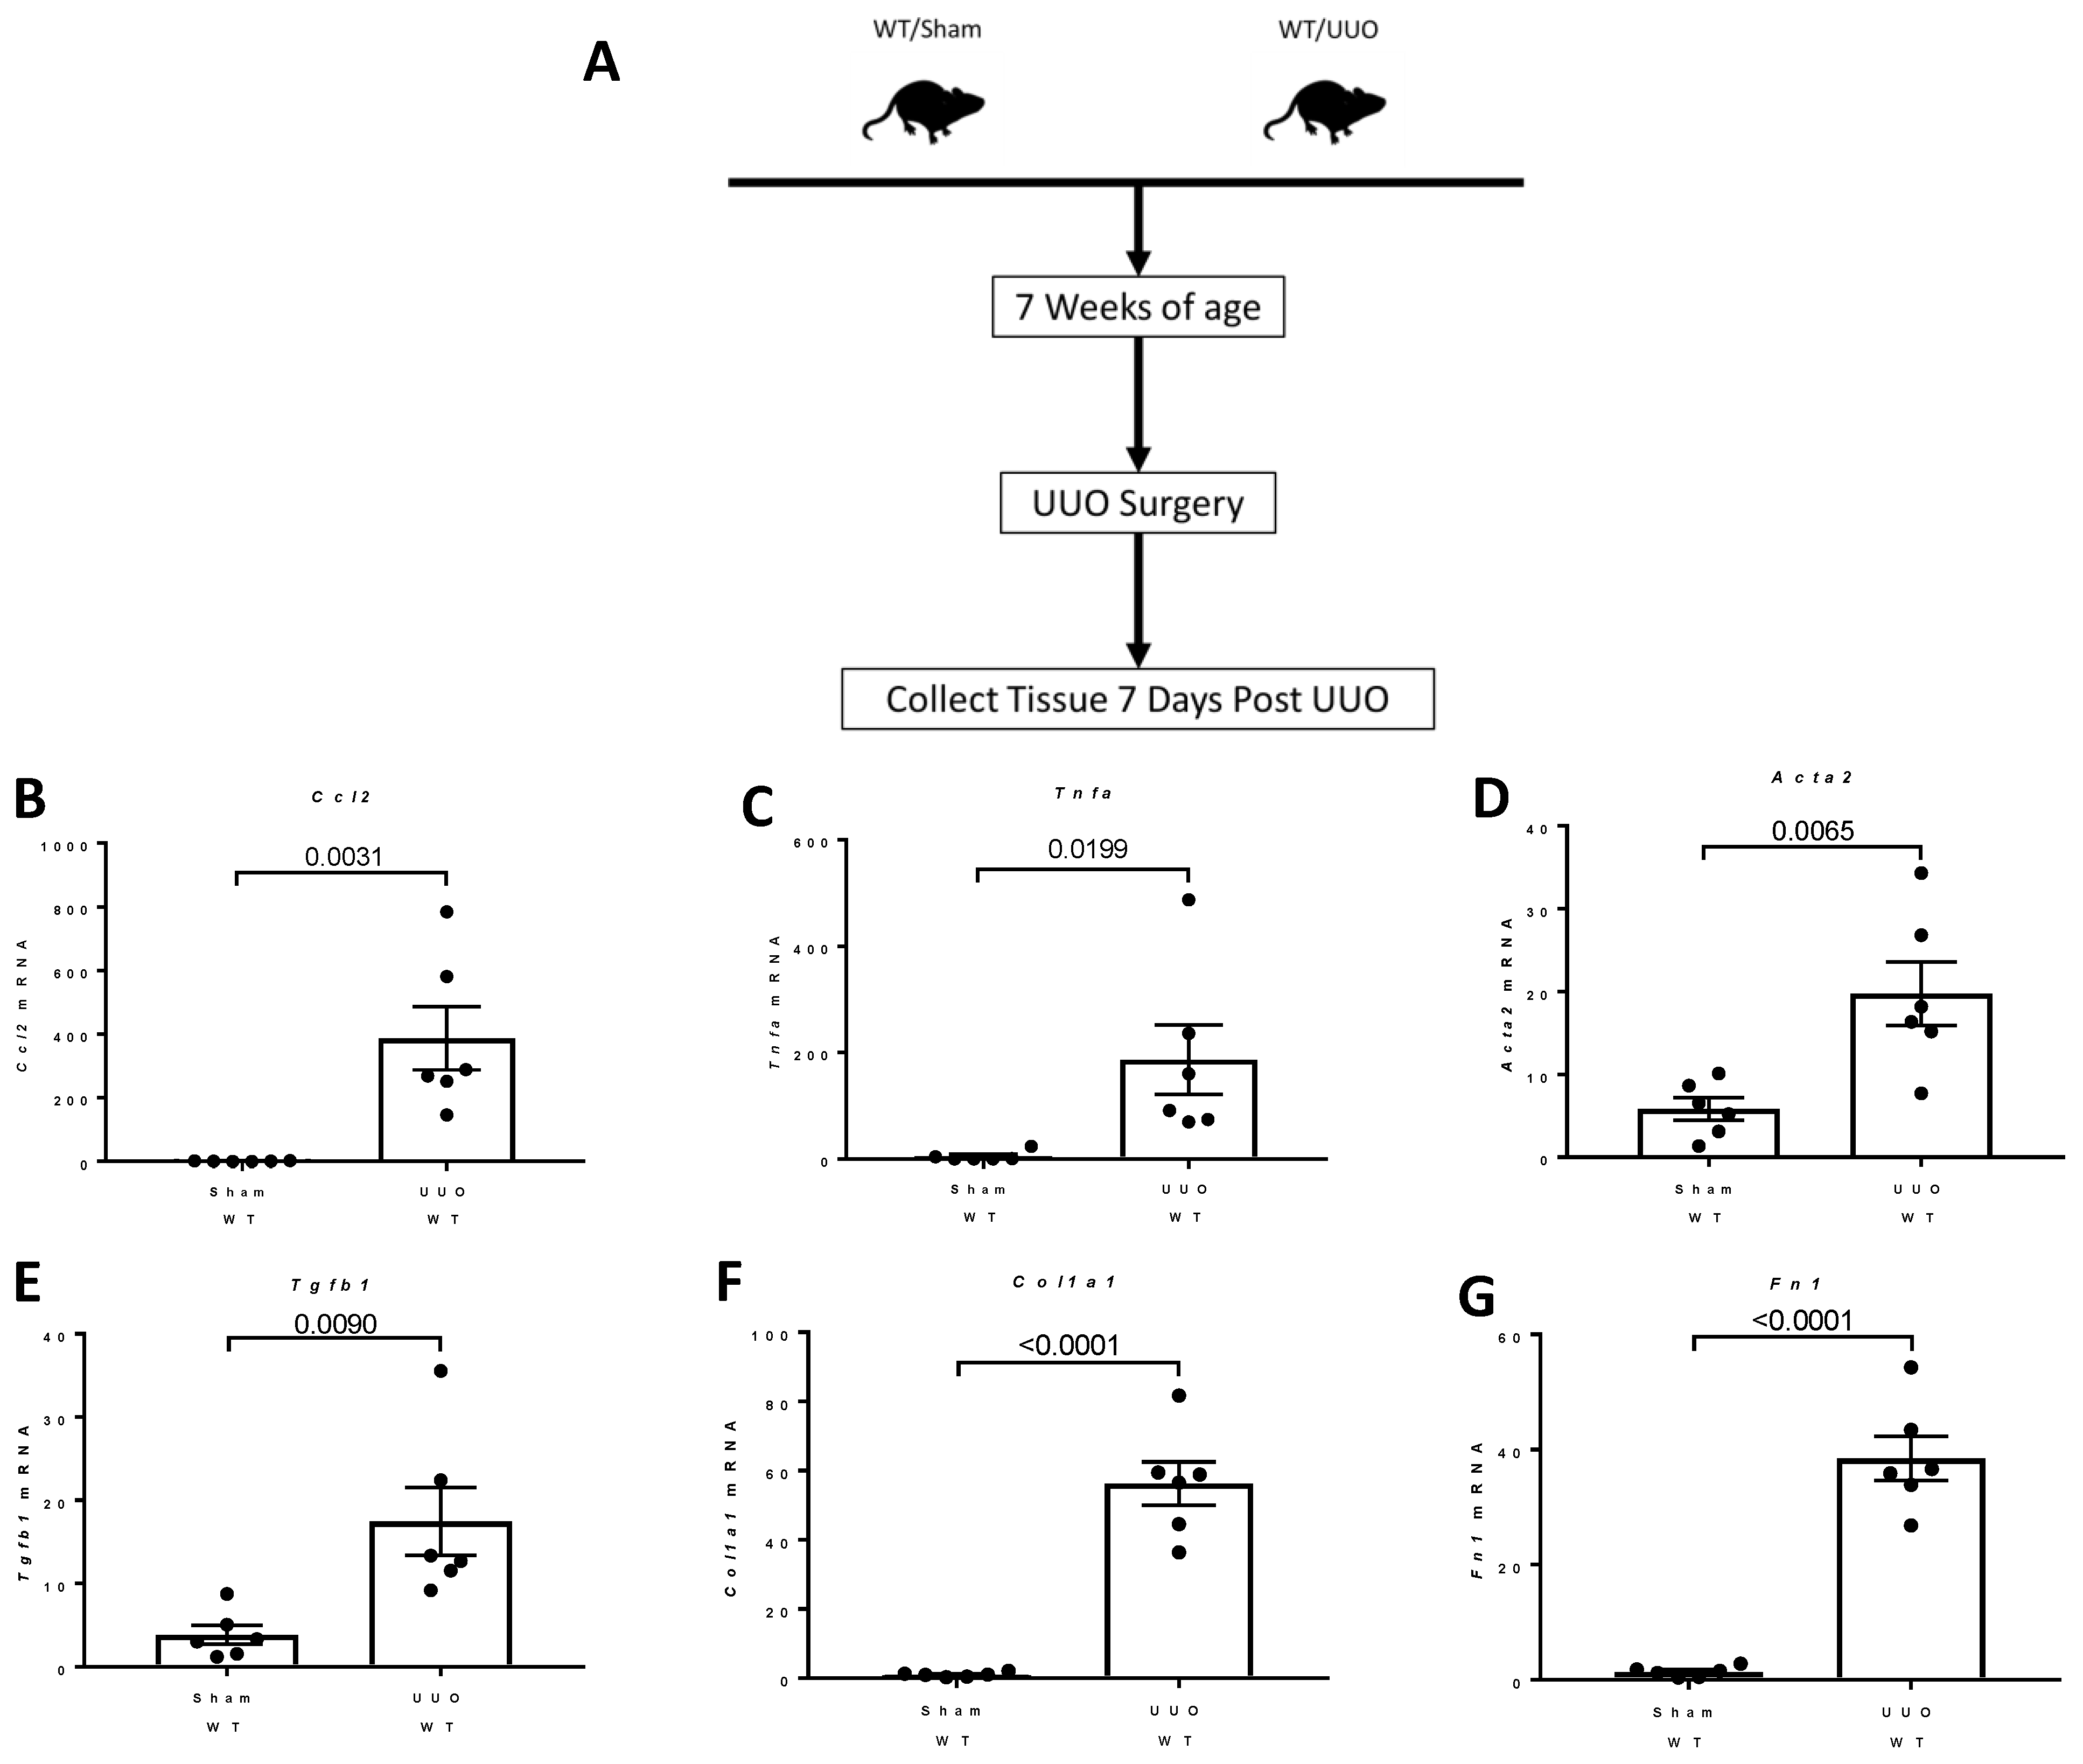
2.8. Studies of the Expression of Fstl1 and Its Cognate Receptors in Mice Subjected to Unilateral Ureteral Obstruction (UUO)

UUO is associated with the rapid development of inflammation and fibrosis, and is a standard model of CKD. Figure 17A shows the experimental design. Under isoflurane anesthesia, 7 week old wild type mice were subjected to sham surgery or ligation of the left ureter (UUO). mRNA analysis and RNAscope® analysis of Fstl1 mRNA localization was performed in the left kidney after 7 days. Figure 17B–G shows the analysis of expression of genes implicated in inflammation, Ccl2 (Figure 17B) and Tnfa (Figure 17C), and genes involved in fibrosis, Acta2 (Figure 17D), Tgfb1 (Figure 17E), Col1a1 (Figure 17F), and Fn1 (Figure 17G) by qPCR. As expected, the expression of this set of genes is markedly up-regulated in mice subjected to UUO compared to sham-operated mice. We characterized kidney inflammation and fibrosis in the UUO mouse in previous studies [14]. UUO recapitulates many of the cellular processes responsible for progressive kidney injury which is a commonly used model of CKD [15,16]. Figure 18 depicts light micrographic images of kidneys from sham-operated and UUO mice (7 days after surgery). Figure 19 shows the analysis of expression of Fstl1 (Figure 19D) and the cognate receptors Tlr4 (Figure 19B) and Dip2a (Figure 19C). The expression of all three genes is up-regulated in mice subjected to UUO compared to sham-operated mice at 7 days. Remarkably, the expression of Fstl1 rose almost 10-fold (p < 0.0001). We then used RNAscope® to localize Fstl1 in both groups of mice. Figure 19B shows representative light micrographs at 20× and 40× magnification. It was difficult to discern any Fstl1 expression by RNAscope® in the kidneys of mice subjected to sham operation. However, in mice subjected to UUO, cells expressing Fstl1 were present in the interstitial space, just as we had observed in the 7 week old Col4a3-/- mice.

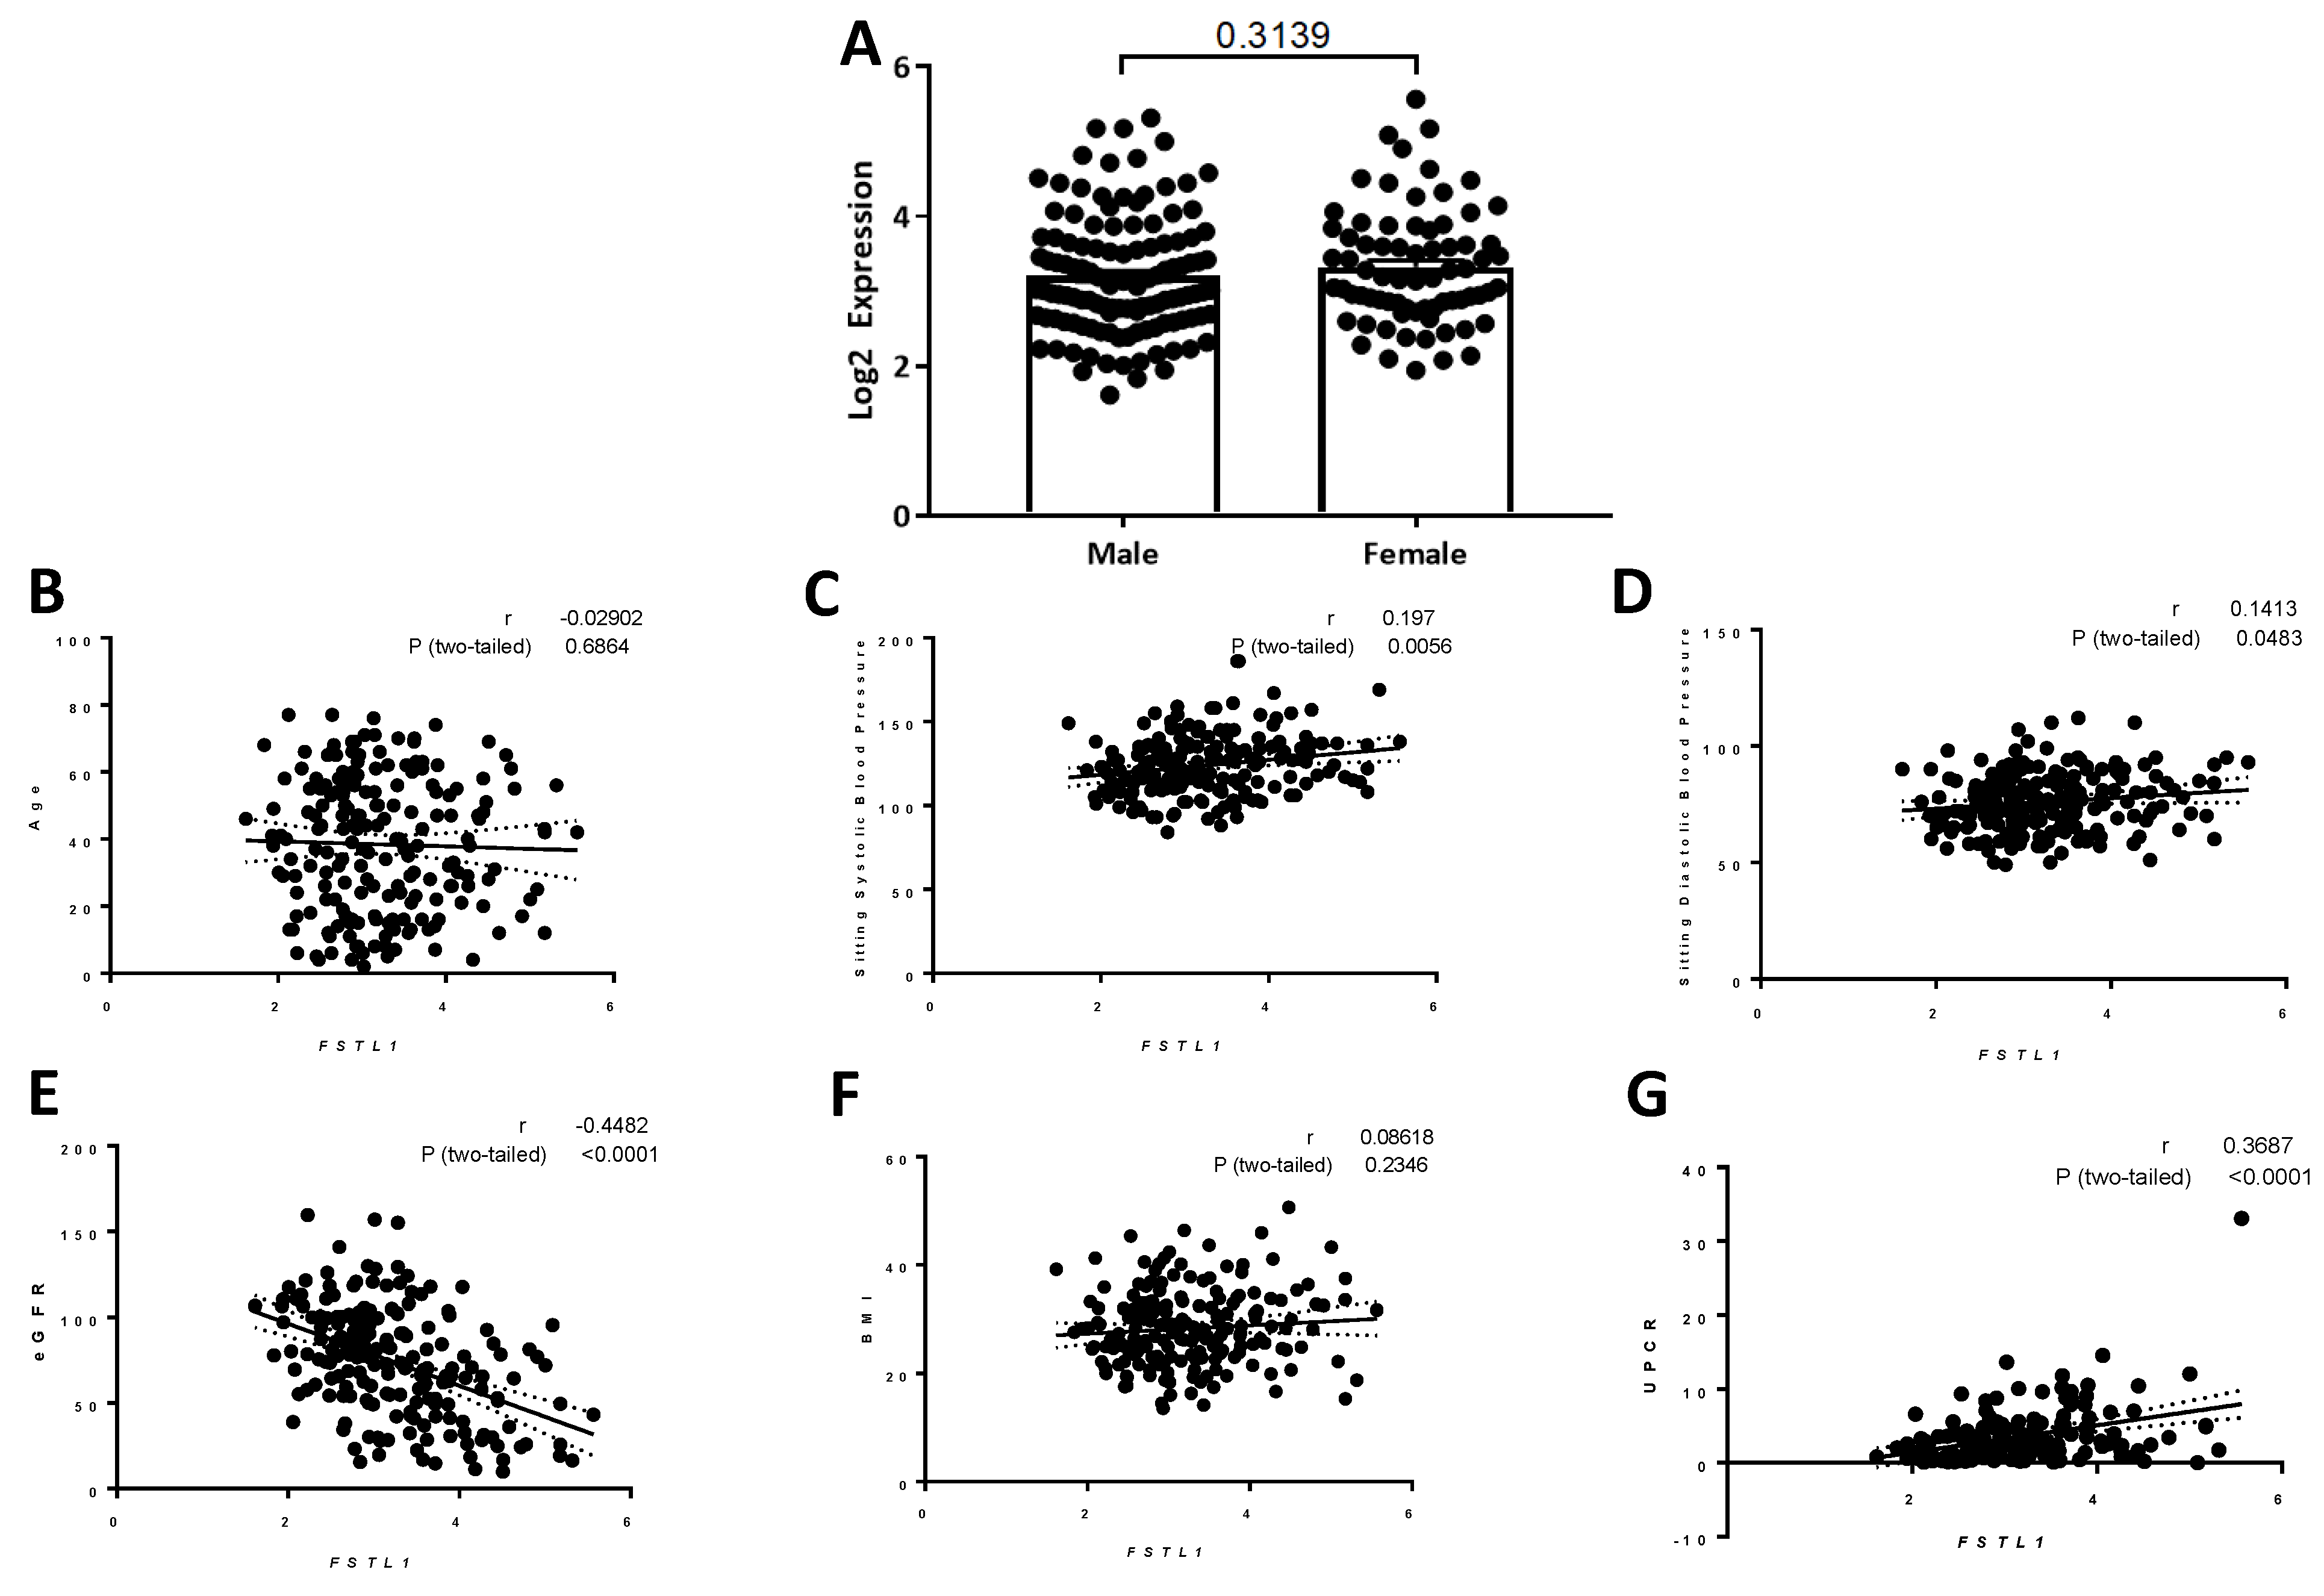
2.9. Studies of the Expression of Kidney Fstl1 Expression in the NEPTUNE Cohort

2.9.1. Patient Characteristics

We studied three NEPTUNE cohorts. Table 2 shows clinical and pathologic indices of the 3 cohorts. There were 111 subjects in the focal segmental glomerulosclerosis (FSGS) cohort: 66 males and 45 females; 39 subjects in the IgA nephropathy (IgAN) cohort: 28 males and 11 females; and 61 subjects in the membranous nephropathy (MN) cohort: 39 males and 22 females (Table 2). There were missing values for some clinical and laboratory parameters, and we did not input missing values for our analyses. The average age of the FSGS group was 32.6 ± 2.0 years with a mean eGFR of 72.9 ± 3.2 mL/min/1.73 m2. The average age of the IgAN group was 36.1 ± 2.7 years with a mean eGFR of 67.5 ± 5.6 mL/min/1.73 m2. The average age of the MN group was 50.9 ± 1.8 years with a mean eGFR of 80.3 ± 3.2 mL/min/1.73 m2. Table 2 shows the mean values for the timed urine protein, creatinine, and albumin measures in each group. A loss of function over the course of follow-up, defined as a 40 percent decline in eGFR with an eGFR of less than 90 mL/min/1.73 m2, was observed in 27 subjects in the FSGS cohort, 10 subjects in the IgAN cohort, and 13 subjects in the MN cohort.

2.9.2. Correlation of FSTL1 mRNA Expression with Clinical Variables

We first studied FSTL1 mRNA expression in micro-dissected kidney tubulointerstitial samples in all three cohorts as a group. Tubulointerstitial FSTL1 mRNA expression was similar in females compared to males (p = 0.31; Figure 20A) and did not correlate with age (Figure 20B) or BMI (Figure 20G). There were modest correlations with sitting systolic blood pressure (r = 0.20, p = 0.0056) (Figure 20C) and sitting diastolic blood pressure (r = 0.14, p = 0.048) (Figure 20D). There was a relationship between FSTL1 mRNA expression and eGFR (r = -0.49, p < 0.0001) (Figure 20E) such that the higher the mRNA levels for FSTL1, the lower the eGFR. There was also a significant relationship between centrally measured and timed UPCR values and FSTL1 mRNA levels (Figure 20F). Multiple linear regression analysis showed that FSTL1 expression related to age, eGFR, and UPCR but not to sex or sitting blood pressure measures (Table 3).

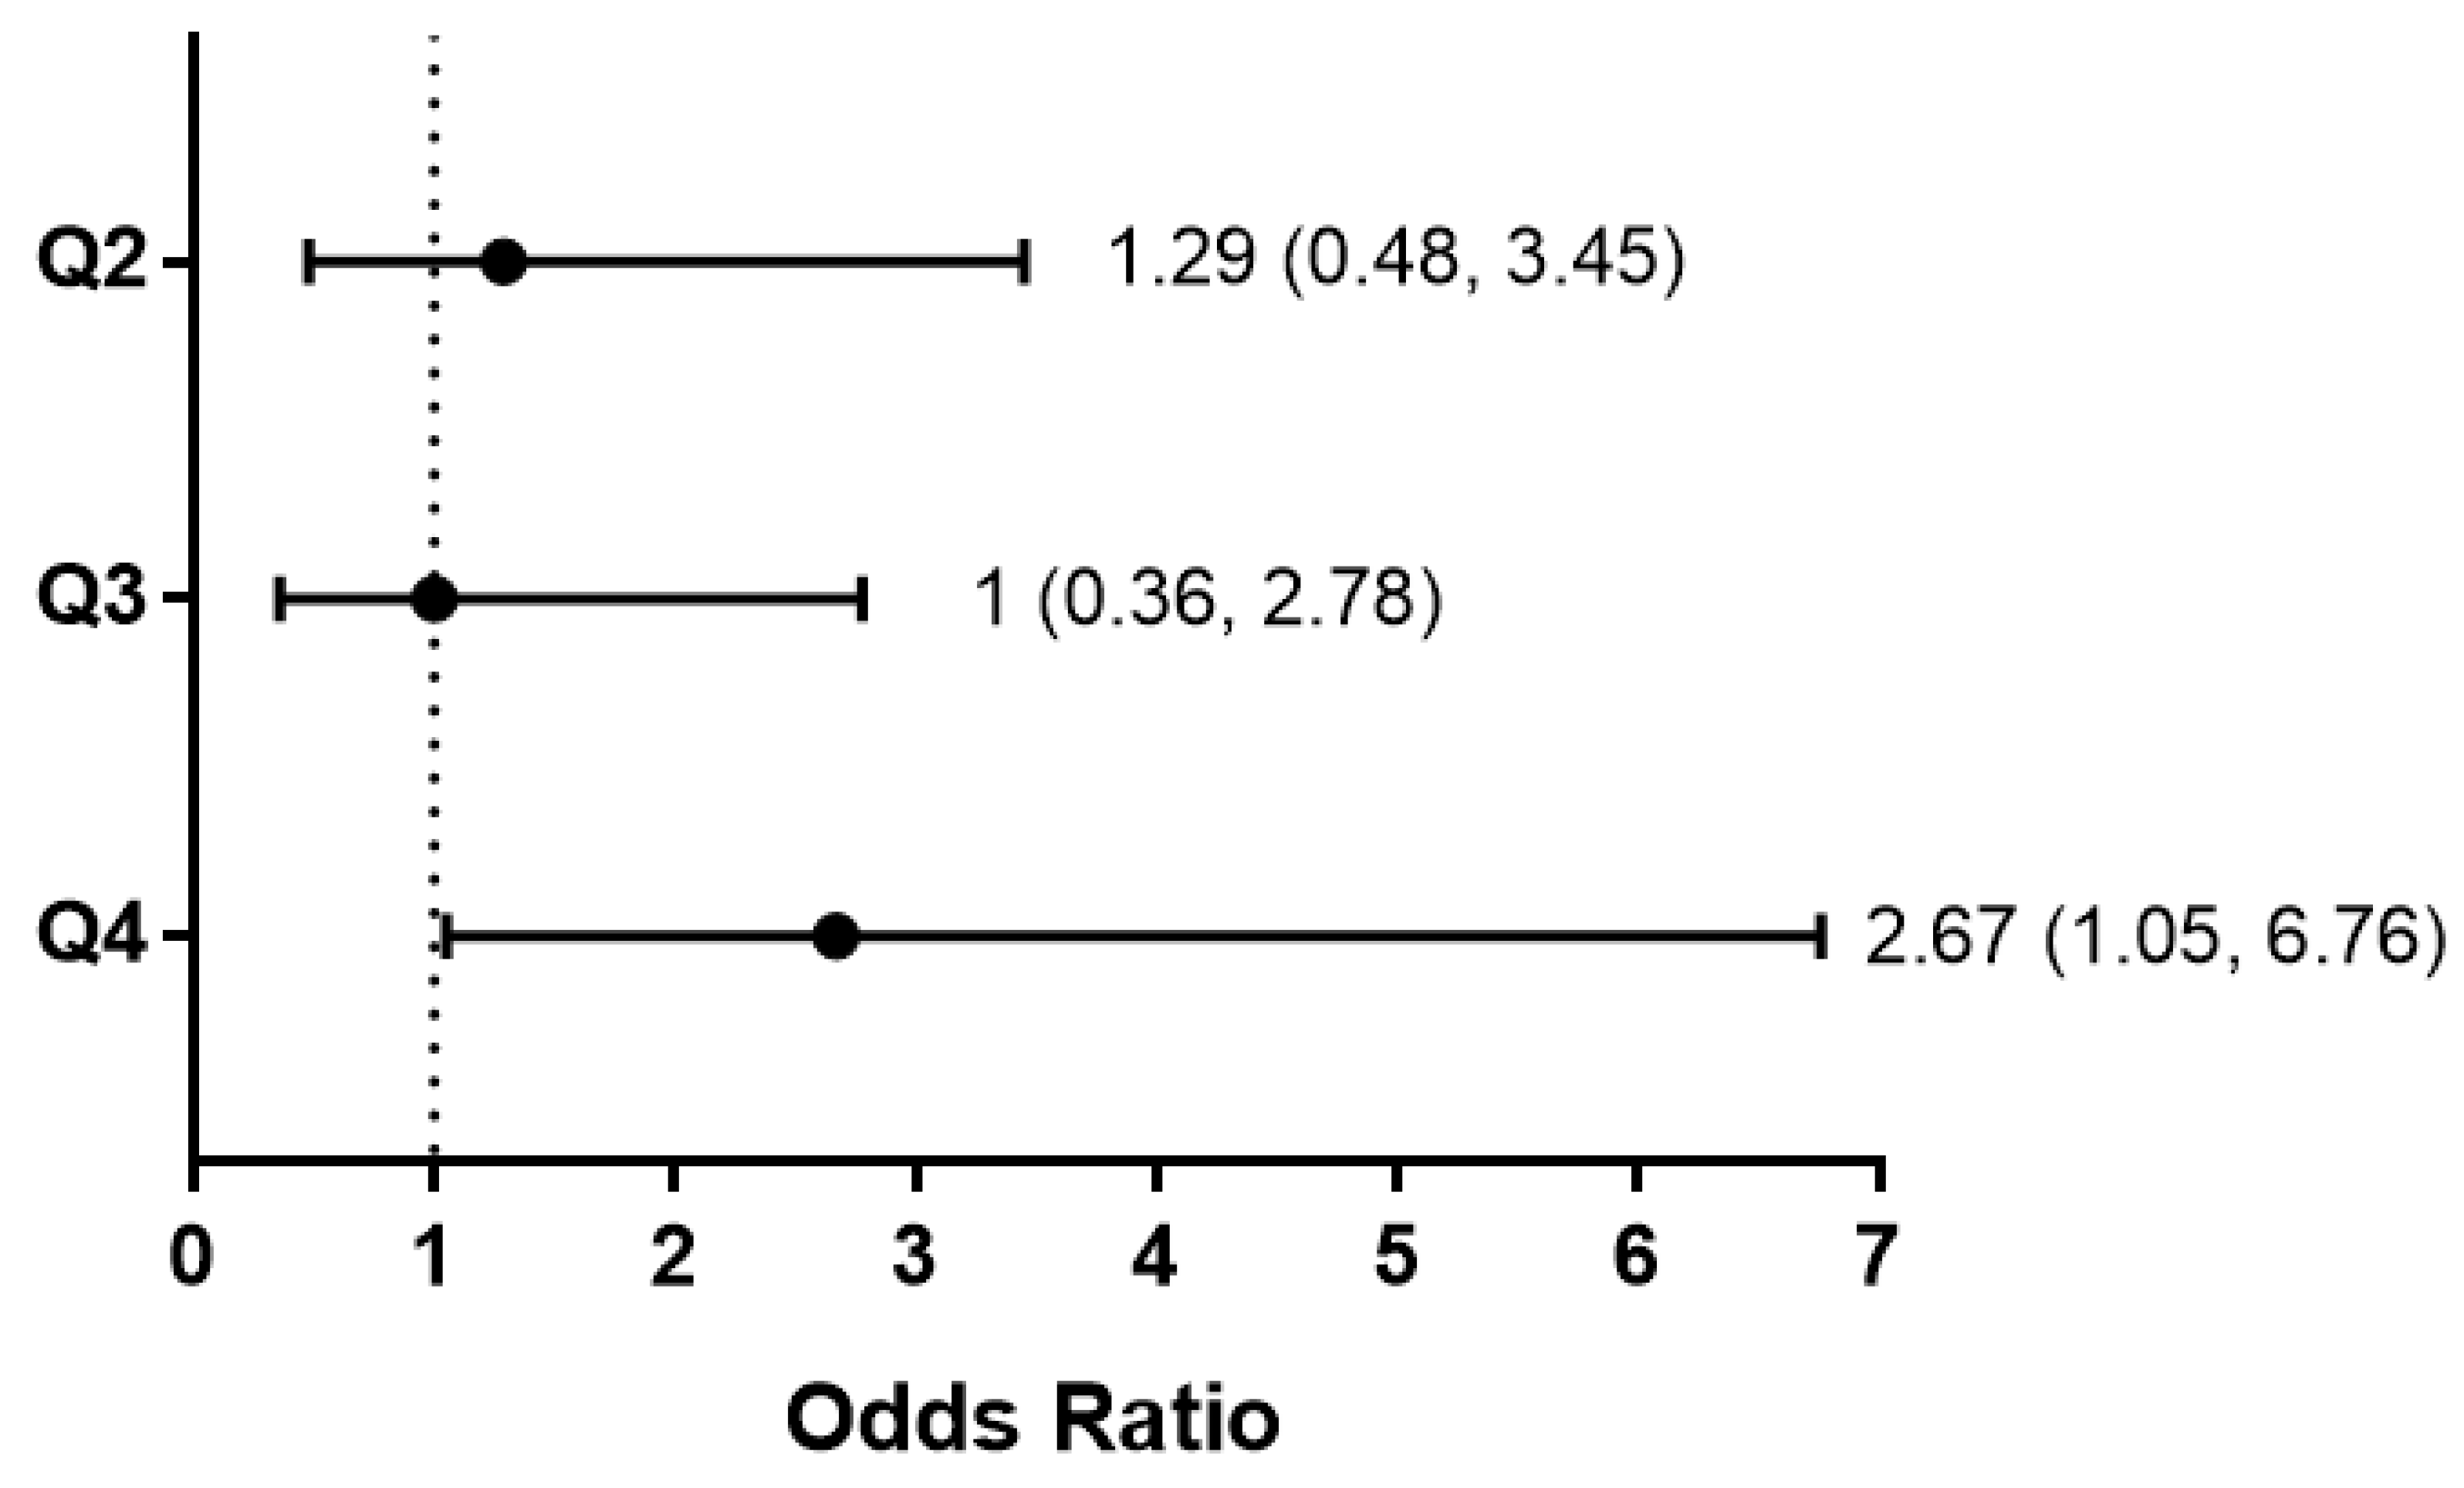
2.9.3. FSTL1 mRNA Levels and Kidney Outcomes

Kidney disease progression was defined as a composite reaching ESKD or a 40% loss of eGFR (with a baseline eGFR<90). Table 4 shows the percent and number of individuals reaching the composite outcome for kidney disease progression in FSGS, IgAN, and MN, divided into four groups based on the quartiles for FSTL1 mRNA levels at the time of biopsy. In the first three quartiles, 18 to 22 percent of the individuals reached the composite endpoint while 38 percent reached the composite outcome in the fourth quartile with the highest FSTL1 mRNA levels. Figure 21 is a forest plot showing the unadjusted odds ratio and confidence intervals of reaching the composite outcome for the second to fourth quartiles compared to the first quartile (lowest FSTL1 mRNA levels). The unadjusted odds ratio was 2.67 (1.05, 6.76) for subjects in the fourth quartile.
We then compared baseline measures of eGFR, interstitial fibrosis (IF), and tubular atrophy (TA) in subjects in the first and fourth quartiles for FSTL1 mRNA levels (Figure 22). Values for eGFR were significantly lower in subjects in the fourth quartile (p < 0.001) (Figure 22A). Values for IF (Figure 22B) and TA (Figure 22C) were significantly higher in subjects in the fourth quartile (p < 0.001, and p < 0.001, respectively). In accordance with the measures of IF, mean mRNA levels for genes implicated in kidney fibrosis, namely, COL1A1 (Figure 22D), ACTA2 (Figure 22E), and TGFB1 (Figure 22F), were greater in the fourth quartile group compared to the first quartile group (p < 0.001 for each mRNA). In accordance with the measures of TA, mean mRNA levels for genes implicated in apoptosis, namely, CASP3 (Figure 22G), CASP8 (Figure 22H), and BAX (Figure 22I), were greater in the fourth quartile group compared to the first quartile group (p < 0.001 for both CASP3 and CASP8, and p = 0.0017 for BAX) (Figure 22C). There were also differences in the mean mRNA levels for genes implicated in inflammation: TNFA (p = 0.0002) (Figure 22J) and CCL2 (p < 0.0001) (Figure 22K) but not for FN1 (Figure 22L).

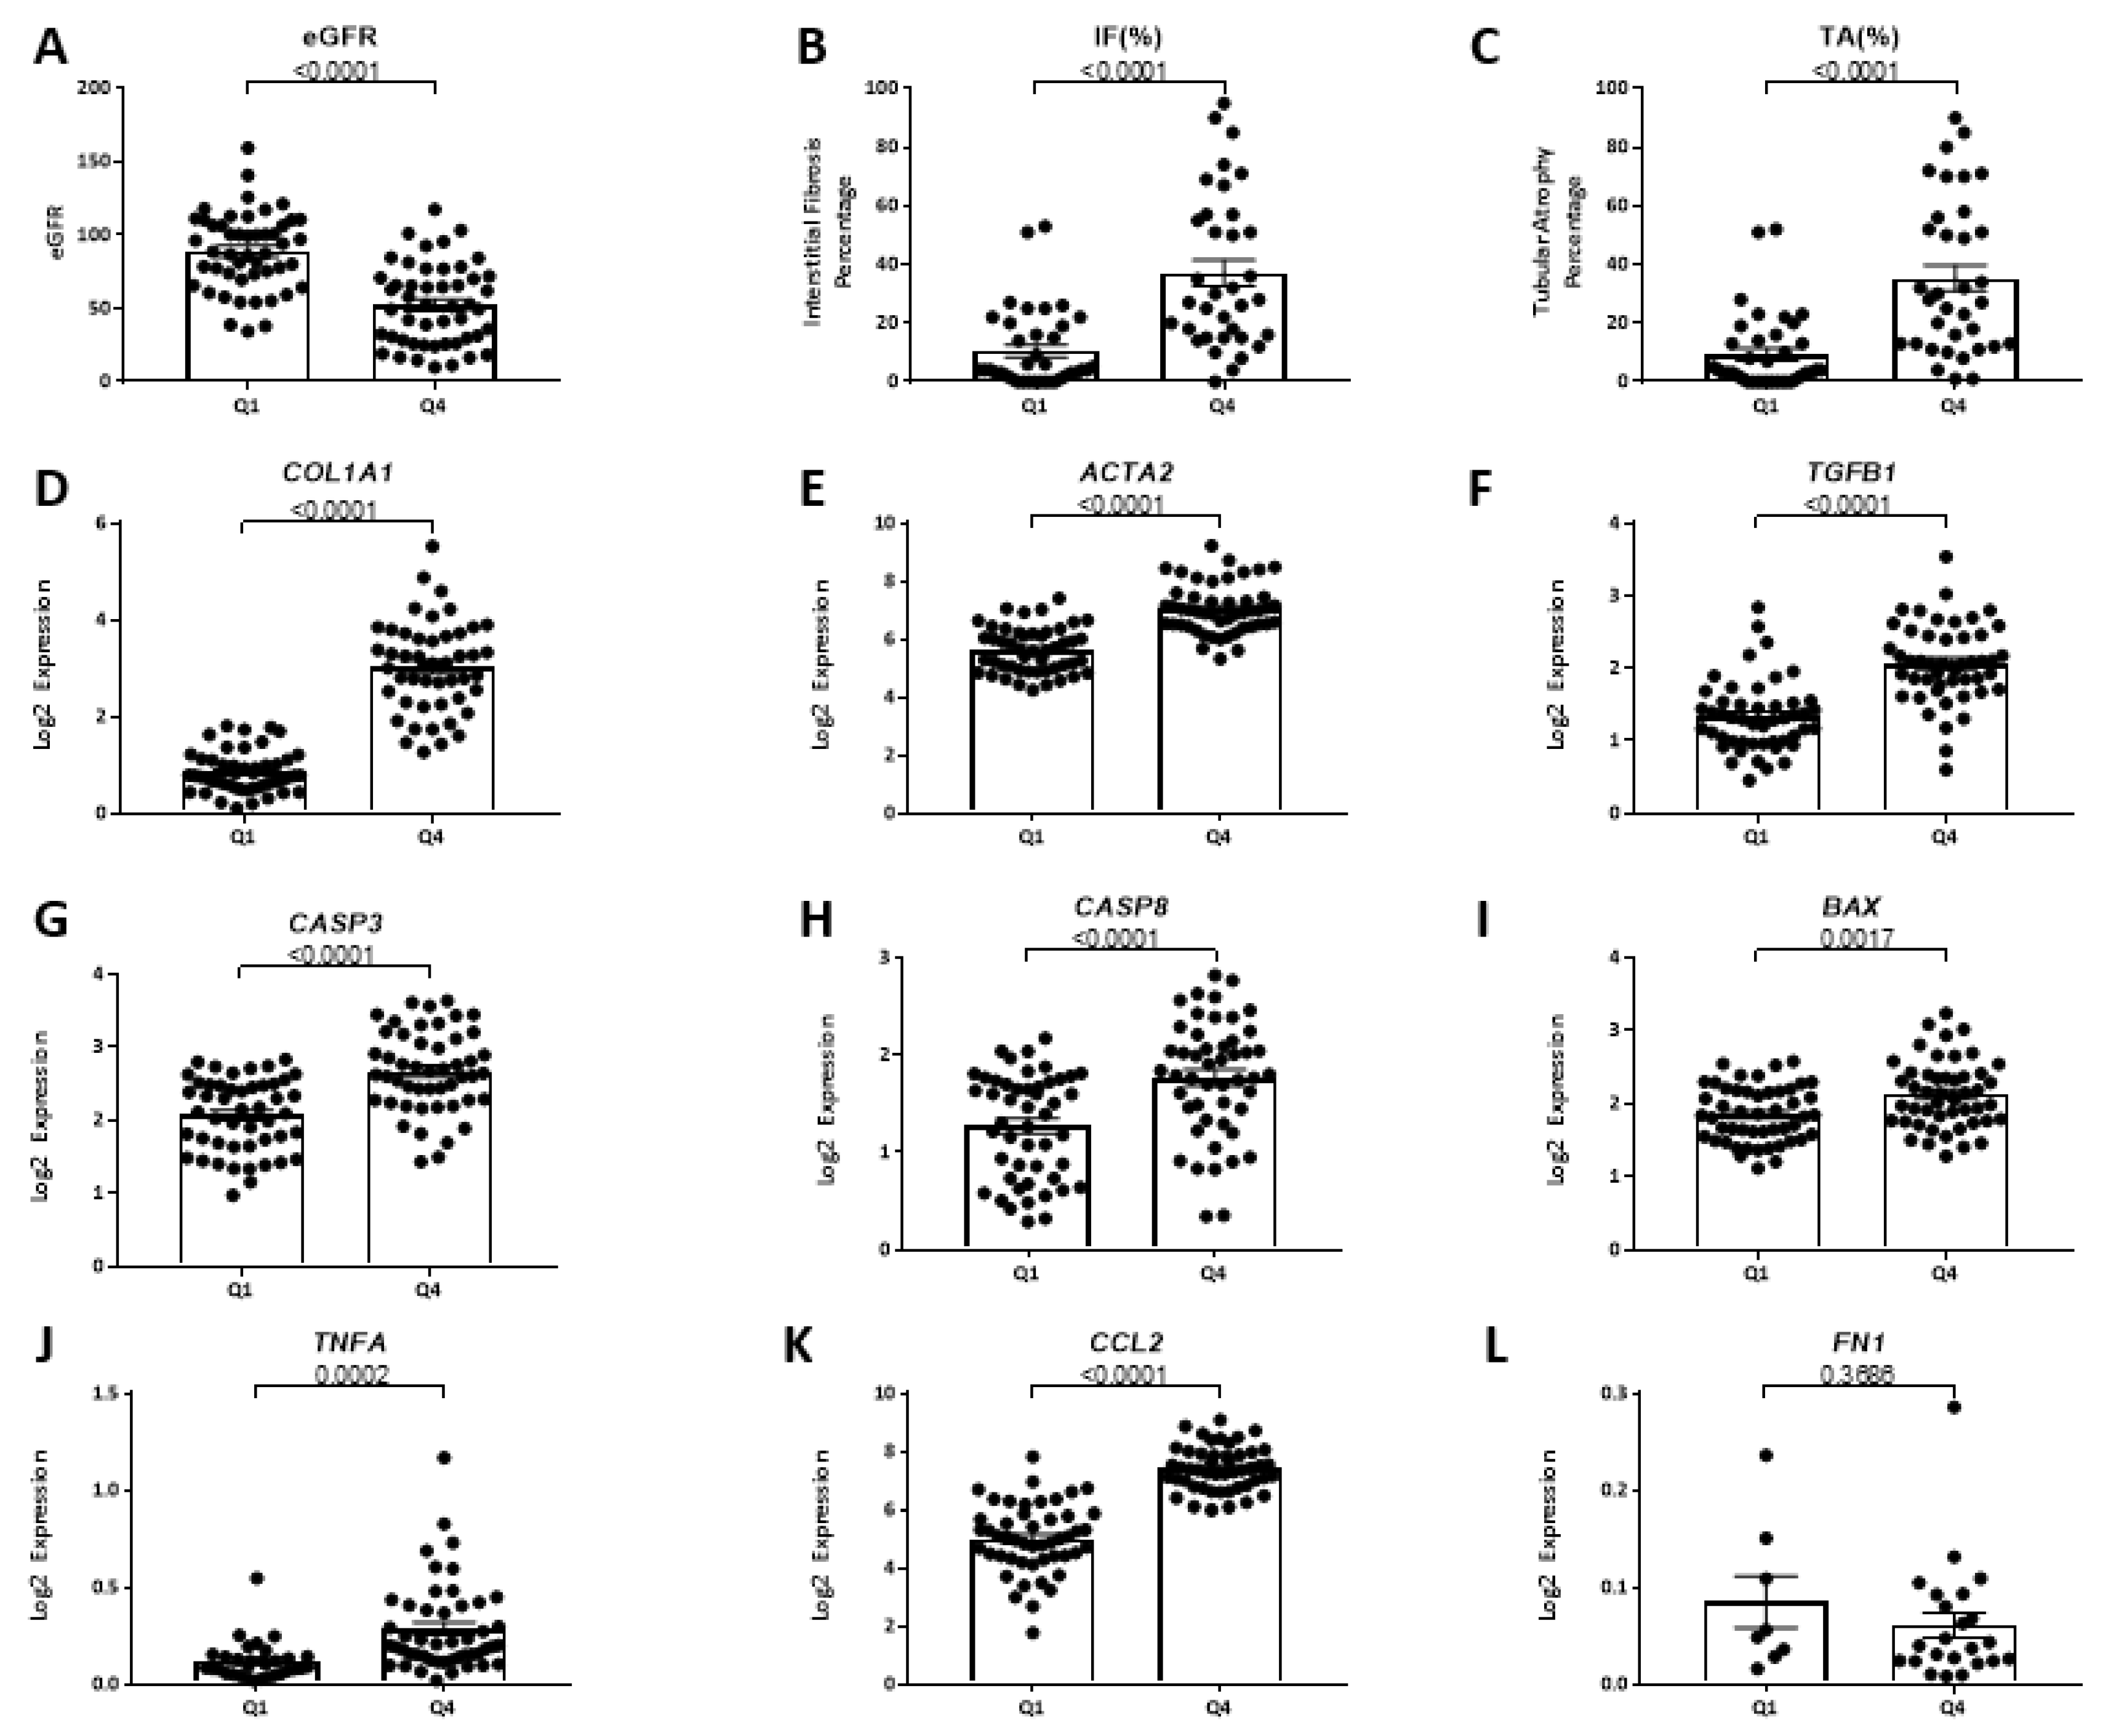
2.9.4. FSTL1 mRNA Levels and Kidney Structure and Function

We then studied associations between eGFR, IF, TA, and FSTL1 mRNA levels separately in each of the three cohorts. FSTL1 mRNA levels were strongly associated with eGFR in each cohort: FSGS (r = −0.45, p < 0.0001) (Figure 23A), IgAN (r = −0.68, p < 0.0011) (Figure 23B), and MN (r = −0.41, p < 0.001) (Figure 23C). FSTL1 mRNA levels were also strongly associated with IF in each cohort: FSGS (r = −0.45, p < 0.0001) (Figure 23D), IgAN (r = −0.75, p < 0.0001) (Figure 23E), and MN (r = −0.54, p < 0.00014) (Figure 23F). Finally, FSTL1 mRNA levels were strongly associated with TA in each cohort: FSGS (r = −0.45, p < 0.0001) (Figure 23G), IgAN (r = −0.75, p < 0.0001) (Figure 23H), and MN (r = −0.53, p < 0.0007) (Figure 23I).

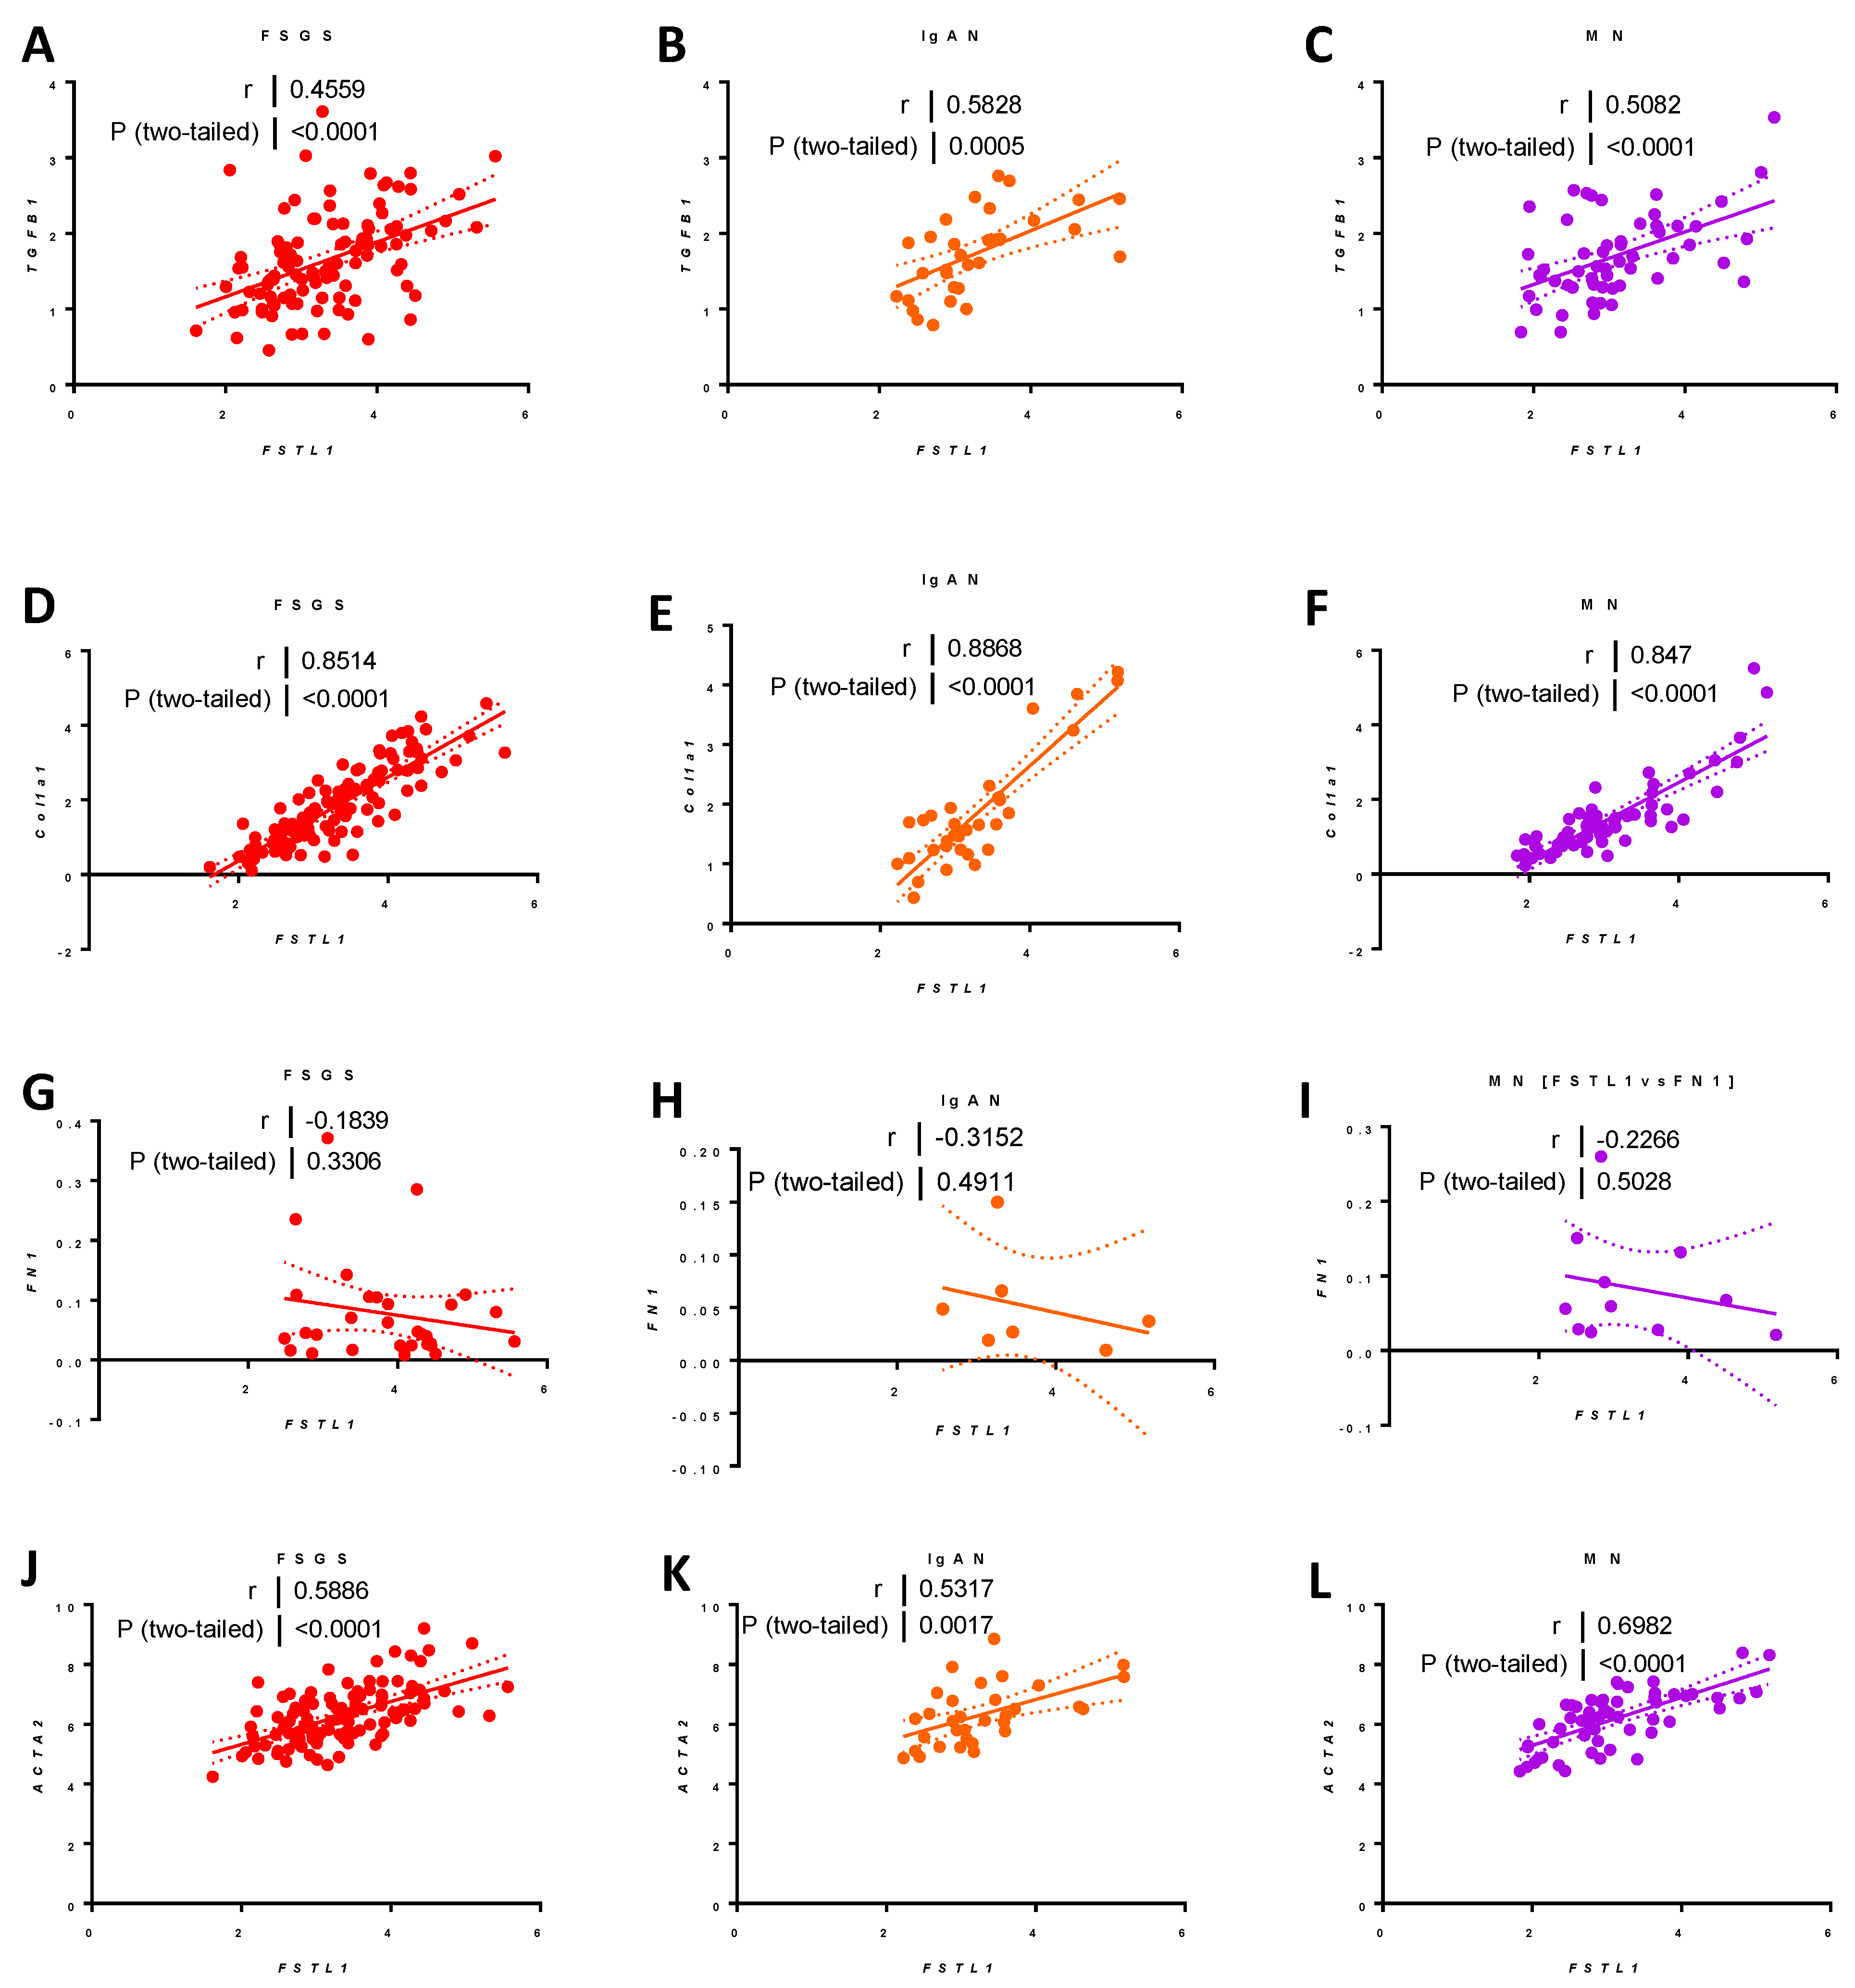
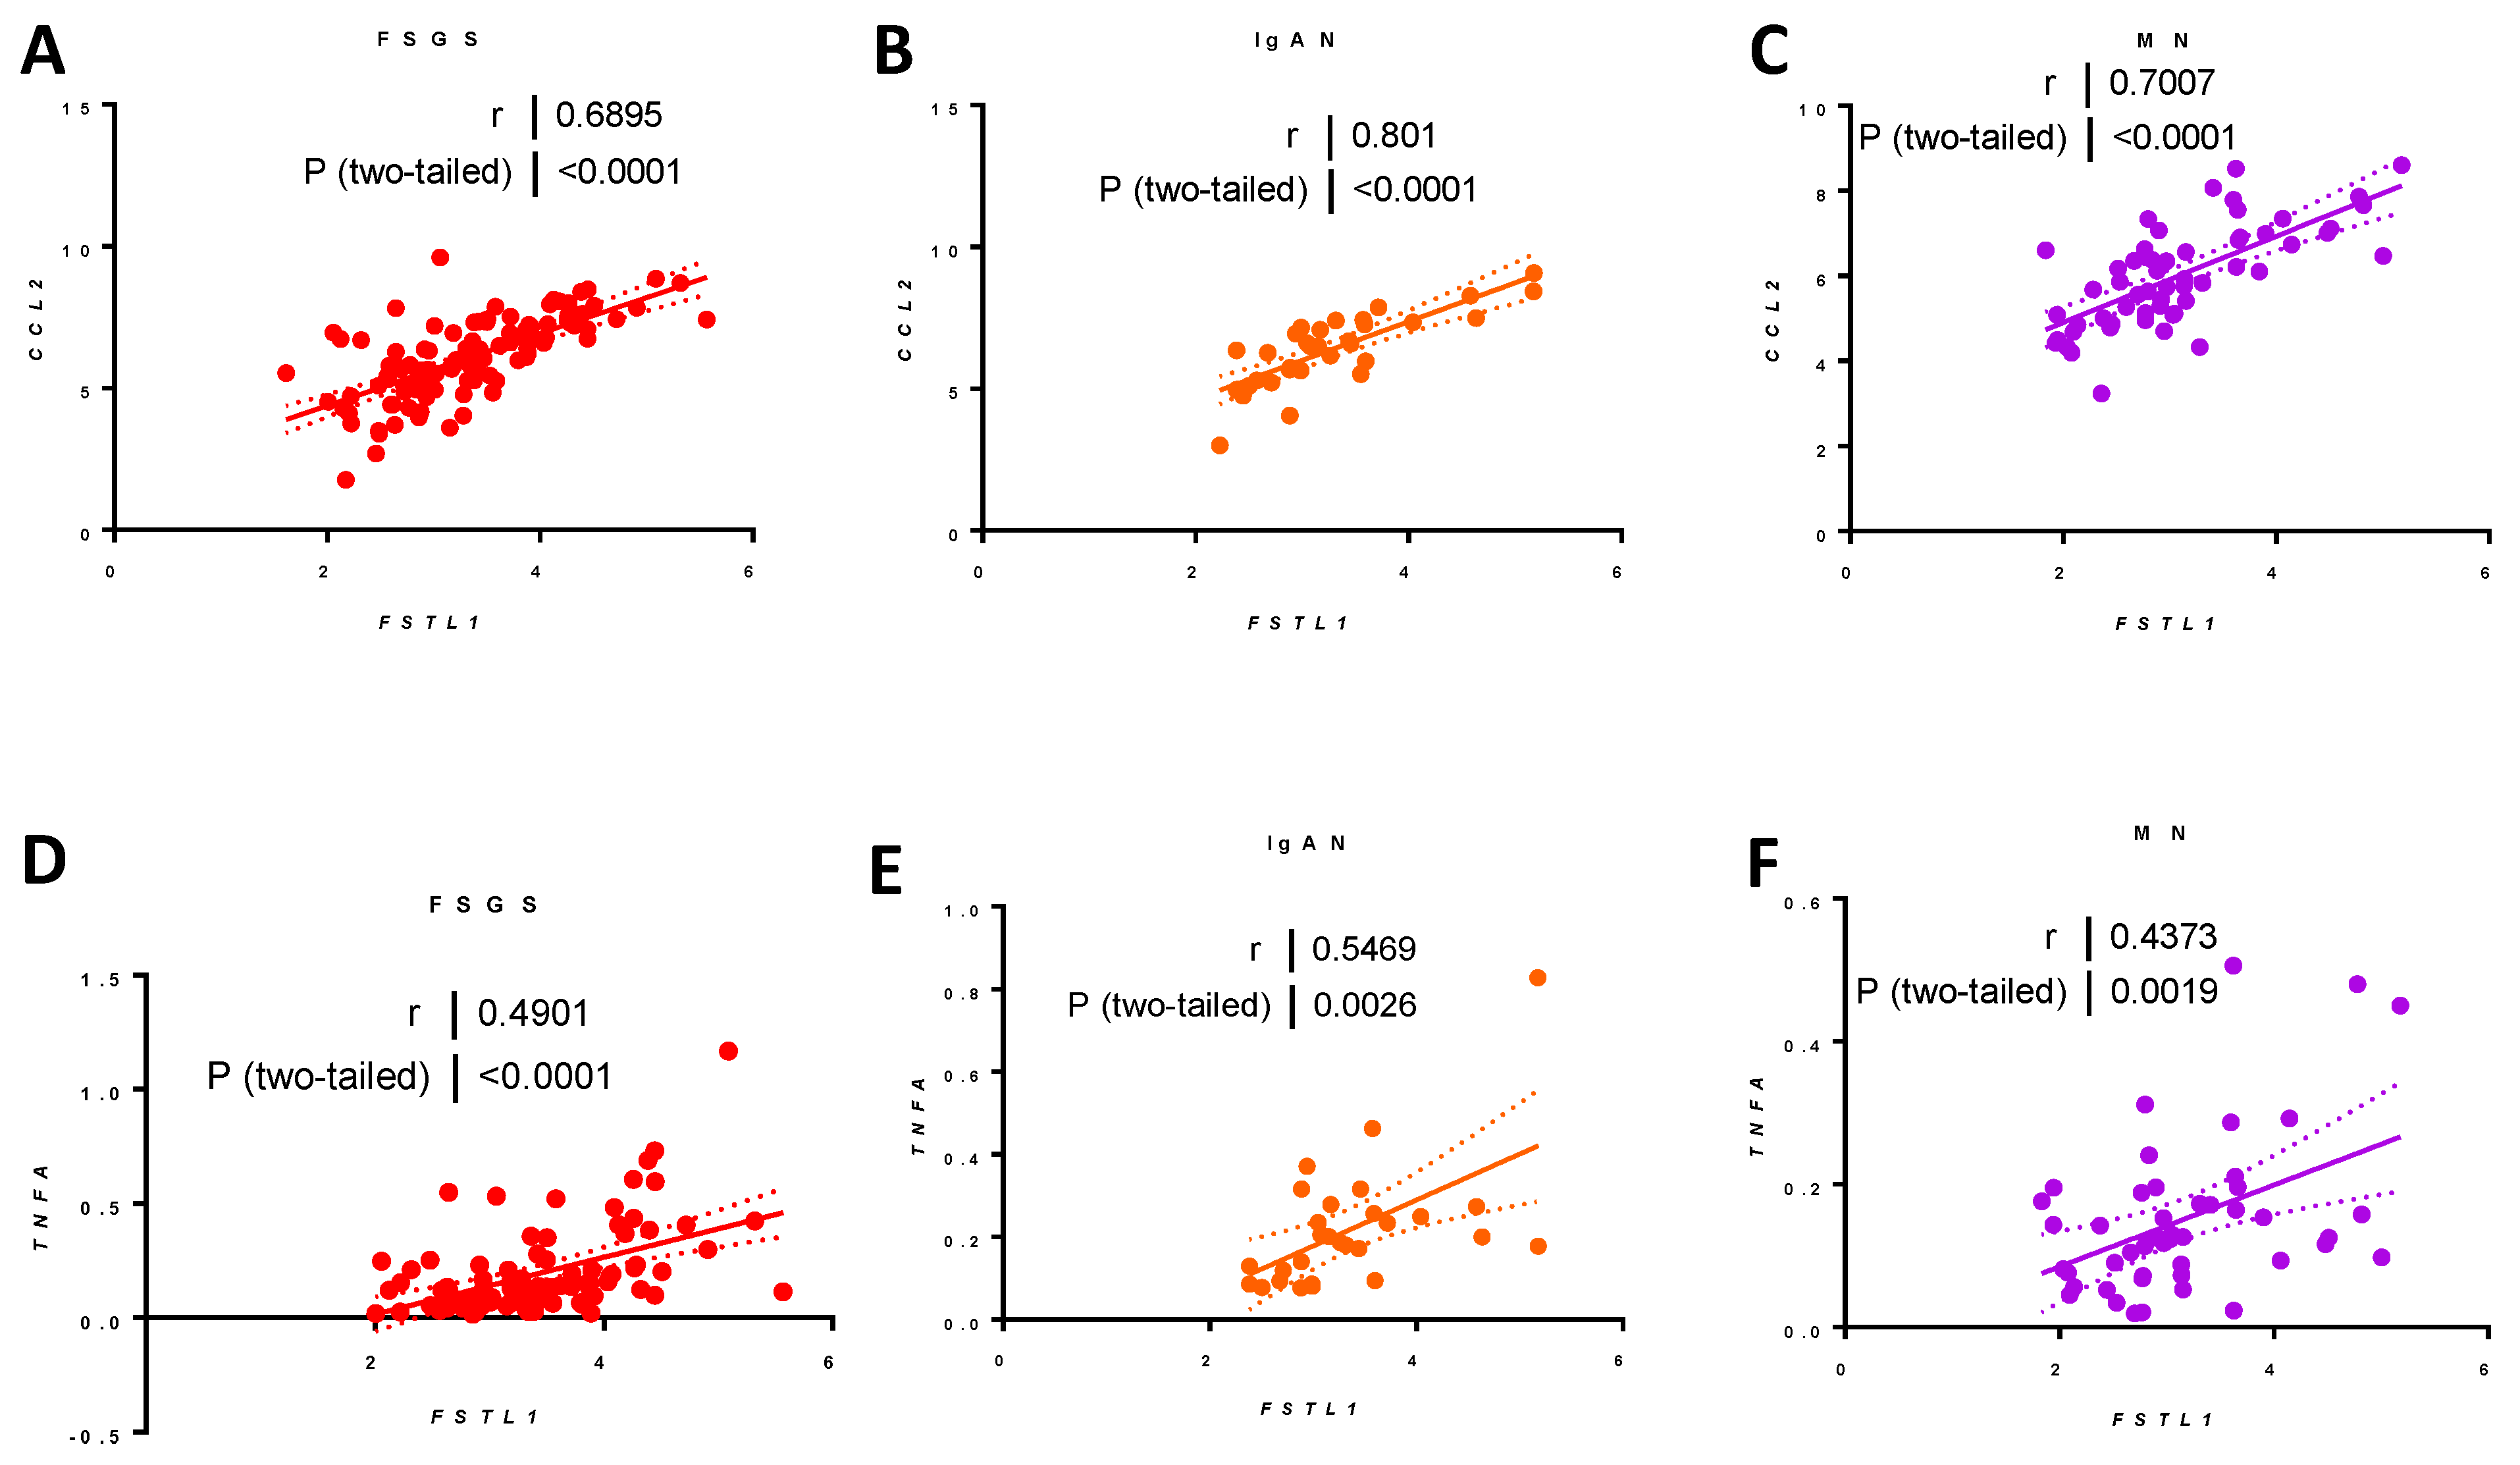
2.9.5. Associations between FSTL1 mRNA Levels and Genes Implicated in Fibrosis, Inflammation, and Apoptosis, in Each of the Three Cohorts

FSTL1 mRNA levels were strongly associated with TGFB1 mRNA levels in each cohort: FSGS (r = 0.46, p < 0.0001) (Figure 24A), IgAN (r = 0.58, p < 0.0005) (Figure 24B), and MN (r = 0.51, p < 0.001) (Figure 24C). FSTL1 mRNA levels were strongly associated with COL1A1 mRNA levels: FSGS (r = 0.85, p < 0.0001) (Figure 24D), IgAN (r = 0.89, p < 0.0001) (Figure 24E), and MN (r = 0.85, p < 0.00014) (Figure 24F) and for ACTA2 mRNA levels: FSGS (r = 0.59, p < 0.0001) (Figure 24J), IgAN (r = 0.53, p < 0.0001) (Figure 24K), and MN (r = 0.70, p < 0.00014) (Figure 24L). There was a trend that occurred for FN1 that did not reach statistical significance (Figure 24G–I).
FSTL1 mRNA levels were strongly associated with CCL2 mRNA levels: FSGS (r = 0.69, p < 0.0001) (Figure 25A), IgAN (r = 0.80, p < 0.0011) (Figure 25B), and MN (r = 0.70, p < 0.001) (Figure 25C) and associated with TNFA mRNA levels: FSGS (r = 0.49, p < 0.0001) (Figure 25D), IgAN (r = 0.55, p < 0.0001) (Figure 25E), and MN (r = 0.44, p < 0.00014) (Figure 25F).
Finally, we looked at apoptosis-related genes. FSTL1 mRNA levels were modestly associated with BAX mRNA levels: FSGS (r = 0.29, p < 0.0036) (Figure 26A), IgAN (r = 0.32, p < 0.06) (Figure 26B), and MN (r = 0.26, p < 0.06) (Figure 26C). FSTL1 mRNA levels were more strongly associated with CASP3 mRNA levels: FSGS (r = 0.44, p < 0.0001) (Figure 26D), IgAN (r = 0.38, p < 0.03) (Figure 26E), and MN (r = 0.41, p < 0.0018) (Figure 26F), and CASP8 mRNA levels in FSGS (r = 0.37, p < 0.0001) (Figure 26G) and MN (r = 0.40, p < 0.0028) (Figure 26I). There was a trend that occurred for CASP8 that did not reach statistical significance in IgAN (Figure 26H).

3. Discussion

There is still a limited understanding of the mechanism(s) responsible for the progression of CKD [17]. Here, we present an experimental design and microarray-based approach to identify new genes that may play a role in the progression of tubule-interstitial (TI) injury. We utilized Col4a3-/- mice because they develop early proteinuria followed by TI inflammation and fibrosis leading to mortality by 9–10 weeks of age [5,7]. Proteinuria is an important risk factor for loss of kidney function in human kidney disease [18]. Although developed as a model of Alport Syndrome, studies of Col4a3-/- mice may also provide insights into the pathogenesis of a wider spectrum of kidney disease because the Col4a3 gene plays a role in both sporadic and familial FSGS as well as diabetic nephropathy [19,20]. Moreover, changes in the TI of the kidney, in particular fibrosis and tubular atrophy, correlate inversely with GFR [21,22].
We first conducted an analysis of differential gene expression in 4 week old and 7 week old Col4a3+/+ mice and Col4a3-/- mice. Albuminuria is already elevated at 4 weeks of age, but as we have previously reported, there is little focal glomerulosclerosis, interstitial fibrosis, or inflammation evident in light microscopy. Electronic microscopy will show focal thinning and splitting of the GBM [5,7]. Serum creatinine levels are similar in 4 week old Col4a3+/+ mice and 4 week old Col4a3-/- mice so that GFR has not yet declined. As expected, Col4a3-/- mice already exhibit higher levels of expression of the mature collagens, Col4a3, Col4a4 than Col4a5, at 4 weeks of age, compared to the immature collagens, Col4a1 and Col4a2. This developmental switch in collagen gene expression does not occur in Col4a3-/- mice, and the maintenance of expression of Col4a1 and Col4a2 is especially evident at 7 weeks of age. This abnormal gene expression pattern is associated with even higher albumin excretion rates and a rise in serum creatinine in the Col4a3-/- mice [7].
Our first major observation was that only four genes, apart from Col4a3, were differentially expressed in the kidneys of 4 week old Col4a3+/+ mice compared to 4 week old Col4a3-/-. Zfp747 was the only other down-regulated gene. Zfp747 is one of approximately 350 genes in the family of Kruppell-associated box (KRAB) domain-containing zinc finger proteins. The function of this protein is unknown although other family members have been implicated in the regulation of gene transcription and DNA methylation. It has not been studied in kidney disease. The gene Mfap4 encoding microfibril associated protein 4 was up-regulated at 4 weeks of age. This extracellular matrix protein binds to collagens, elastin, and fibrillin-1, and it is a paralog of fibronectin. Recent studies have linked Mfap4 to liver fibrosis, cardiac dysfunction, and kidney fibrosis [23,24,25]. The gene Cald1 encodes caldesmin-1, an intracellular protein that regulates cell contraction and interacts with the actin cytoskeleton. Interestingly, Cald1 mRNA levels are also elevated in the glomeruli of humans with diabetic nephropathy [26]. There was a sustained increase in expression of both Mfap4 and Cald1 in the kidneys of 7 week old Col4a3-/- mice.
Fstl1 was the third gene in which the mRNA levels were elevated at 4 weeks of age, and we chose to focus our studies on Fstl1 because it is a secreted extracellular protein known to be a ligand for Toll-like receptors [27]. Fstl1 has been linked to pulmonary fibrosis and inflammation, particularly in experimental arthropathies [28,29]. Fstl1 may play a role in cisplatin-induced acute kidney injury [30]. Studies in a remnant kidney model of CKD suggested that it functioned as an endocrine factor produced by the heart, secreted, and then delivered to the kidney by renal blood flow [30]. In contrast, the Protein Atlas suggested that it was endogenously expressed in kidney tubular epithelial cells, and studies suggested that in UUO kidneys, Fstl1 was expressed in cells of the loop of Henle and/or collecting duct [31]. Accordingly, our next major finding was that Fstl1 is expressed in cells in the interstitial compartment of the kidney. Our RNAScope© analysis also showed that there is very little expression in normal kidneys. Single cell transcriptomic data localized expression to fibroblasts/myofibroblasts and not in tubular epithelial cells. We previously described cell populations contributing to progression signature gene expression, and one of the important themes that emerged from this work was that fibroblasts contributed to CKD progression in Col4a3-/- mice [6]. Taken together, these findings show that Fstl1 is fibroblast-derived.
To further explore the potential paracrine role of Fstl1 in the kidney we next looked at the expression of putative Fstl1 receptors in the kidney: three receptors have been identified. The first is Toll-like receptor-four (Tlr4) [27]. Tlr4 is expressed in tubular epithelial cells as well as in infiltrating monocytes/macrophages Leucocytes, including macrophages, and renal epithelial cells express the Tlr4 receptor, and it does play a role in kidney injury [32]. Zhang and coworkers showed that deletion of the gene for Tlr4 attenuated cisplatin-induced kidney injury. In order to determine if the effect is due to loss of Tlr4 in myeloid cells or loss of Tlr4 in renal tubular cells the investigators generated bone marrow chimeric mice. They found that the protective effect of Tlr4 gene deletion was due to loss of expression in kidney tubular cells [32]. This work supports our notion that FSTL1 could function as a paracrine factor in the kidney to affect the progression of chronic kidney disease by engaging Tlr4 receptors on kidney tubular cells. Cd14 is also linked to the ligand-like function of Fstl1, and it is predominantly expressed in monocytes/macrophages [27]. Interestingly tubular epithelial expression of Cd14 is up-regulated in murine models of kidney injury [33]. Disco Interacting Protein 2 Homolog A (Dip2a) is the third receptor linked to Fstl1 cell signaling but little is known about the intracellular pathways activated by the receptor [34]. Vascular tissue including the kidney expresses Dip2a [12,34]. We next found that both Tlr4 and Cd14 were up-regulated in Col4a3-/- mice. Tlr4 expression was increased at 7 weeks of age while Cd14 was already increased at 4 weeks of age in Col4a3-/- mice compared to Col4a3+/+ mice. These findings support the hypothesis that activation of this ligand/receptor pathway increases in Col4a3-/- mice and thus Fstl1 can readily function in a paracrine manner in the kidney.
To test this hypothesis in vitro, we studied the effect of rhFSTL1 on cultured kidney epithelial cells and focused on three biological processes important in chronic kidney disease pathogenesis: fibrosis, inflammation, and apoptosis. AP1-mediated gene expression is postulated to play a key role in the regulation of gene expression related to fibrosis [35]. rhFSTL1 activates ERK in a time-dependent manner, and AP1 is downstream of ERK activation. rhFSTL1 also activated AP1-mediated gene expression in kidney tubular cells based on the activation of an AP1 promoter construct that drove firefly luciferase expression. It is possible that fibroblast derived FSTL1 could function in a paracrine manner to activate canonical MAPK (ERK) signaling in tubular cells converging on AP1. We then compared the expression levels of a defined set of genes that are regulated by AP1 in 4 and 7 week old Col4a3-/- mice compared to Col4a3+/+ mice. There was a marked increase in the expression of the majority of the AP1-mediated genes including plasminogen activator, urokinase receptor (Plaur), matrix metalloproteinase 10 (Mmp10), and interleukin1 receptor-like1 (Il1rl1). Plaur promotes plasmin formation and plays a role in the regulation of extracellular matrix protein degradation as well as the activation of growth factors including TGFB1. Mmp10 also regulates extracellular matrix protein degradation [36]. Taken together, the changes in the expression of these two genes emphasize the important role of extracellular matrix remodeling in the progression of fibrosis in the kidneys of Col4a3-/- mice. Il1rl1 is a member of the interleukin 1 receptor family, and it may be pro-inflammatory linking AP1-regulated gene expression to inflammation in the kidney [37]. Although it is very unlikely that FSTL1 is the only ligand contributing to the activation of these genes in vivo, we also saw strong correlations between Fstl1 mRNA levels and the mRNA levels of alpha smooth muscle actin (Acta2), transforming growth factor beta (Tgfb1), Col1a1, and Fn1. Indeed, over 80–90 percent of the variability in the levels of these genes is associated with the variability in Fstl1. Western blot analysis showed that rhFSTL1 led to an increase in COL1A1 protein expression.
We then studied the effect of rhFSTL1 on cultured kidney epithelial cells and focused on inflammation. NFκB-mediated gene expression is postulated to play a key role in the regulation of gene expression related to inflammation [38]. One of the canonical MAPKs, p38, is classically upstream of NFκB. rhFSTL1 activates p38 in a time-dependent manner, and NFκB is downstream of ERK activation [39]. rhFSTL1 also activated NFκB-mediated gene expression in kidney tubular cells based on the activation of an NFκB promoter construct that also drove firefly luciferase expression. It is therefore possible that fibroblast-derived FSTL1 could function in a paracrine manner to activate canonical MAPK (p38) signaling in tubular cells converging on NFκB. We next compared the expression levels of a defined set of genes that are regulated by NFκB in 4 and 7 week old Col4a3-/- mice compared to Col4a3+/+ mice. There were marked increases in expression in most of the NFκB -mediated genes including Il6, Ccl2, Icam1, and Vcam1. The latter three genes play a role in the recruitment of inflammatory cells including monocytes/macrophages to the kidney [40,41]. These observations are consistent with our recent report that a progression gene signature in Col4a3-/- mice reflected at least in part, increased infiltrating inflammatory cells [6]. Again, FSTL1 is not the only ligand to increase expression of these genes in vivo, but we were able to see strong correlations between Fstl1 mRNA levels and the mRNA levels of Ccl2 and Tnfa, two cytokines implicated in the progression of chronic kidney disease [42]. Almost 90 percent of the variability in the levels of these genes relates to the variability in Fstl1, based on Spearman correlation analysis. Western blot analysis showed that rhFSTL1 led to an increase in COX2 protein expression.
Finally, we then studied the effect of rhFSTL1 on cultured kidney epithelial cells and focused on apoptosis because tubular atrophy is a common finding in chronic kidney disease [43]. rhFSTL1 treatment led to PARP cleavage and CASP3 activation in kidney tubular cells in vitro. Interestingly, this effect was downstream of TLR4 because pre-treatment with the TLR4 receptor antagonist, naloxone, abrogated the effect. Fibroblast derived FSTL1 could function in a paracrine manner to induce apoptosis in adjacent kidney tubular cells and contribute to the loss of kidney tubular cell mass or tubular atrophy. We next compared expression levels of a set of genes that play a role in apoptosis in 4 and 7 week old Col4a3-/- mice compared to Col4a3+/+ mice. There was a marked increase in expression in most of the apoptosis genes, including Bax, Fas, Rela, Casp3, and Casp8, although it is again likely that many different ligands influence the expression of these genes in vivo. We were able to see strong correlations between Fstl1 mRNA levels and the mRNA levels of Bax, Rela, and Casp8. Fstl1 accounted for between 60 and 90 percent of the variability in the levels of these genes, based on Spearman correlation analysis.
Taken together, these in vivo and in vitro findings suggest that FSTL1 promotes the progression of chronic kidney disease in Col4a3-/- mice and that it functions in a paracrine manner to influence the biology of tubular cells and infiltrating monocytes/macrophages, although we did not examine the latter directly. Adams and coworkers studied the role of FSTL1 in acute kidney injury secondary to cisplatin and they suggested that FSTL1 was protective [30]. They utilized a mouse with a hypomorphic Fstl1 gene and found that there was less inflammation in the hypomorphic mice and more kidney injury after administration of cisplain. This is interesting because they examined mRNA levels of Il6 and Tnfa. They assessed tubular injury by measuring Kim1, and these findings suggest that the role of FSTL1 in kidney injury may be context specific [30]. Our finding of the localization of Fstl1 in the interstitial compartment of the kidney is the first study to employ an in situ hybridization-like technique. Antibody-based studies have previously localized FSTL1 to the loop of Henle [30,44], but RNAScope© is not dependent on antibody specificity or confounded by kidney cell auto-fluorescence. This may account for our novel finding. Single cell transcriptomic data from human kidneys confirmed that Fstl1 was restricted to the interstitial compartment and localized in fibroblasts and activated myofibroblasts. Moreover, studies of cutaneous wound healing strongly implicated FSTL1 in scar formation, and localized its expression to fibroblasts, in accordance with our work [45,46].
A novel feature of our studies was the definition of an Fstl1 gene signature. In order to perform an unbiased assessment of the potential role of Fstl1 in the progression of CKD in Col4a3-/- mice we completed an in silico analysis of FSTL1 protein–protein interactions using STRING analysis. This analysis was independent of our studies of gene expression, and it generated a novel network of proteins linked to FSTL1 based on evidence in the experimental literature—in a sense, an FSTL1 signature. We created four networks consisting of 5 to 20 proteins by limiting the output of the number of interacting proteins. A colored node represents each protein in the network. The color of the edge connecting two nodes indicates the type of interaction. For example, “experimentally derived” data linking FSTL1 to another protein is a purple edge while “gene co-occurrence” between FSTL1 and another protein is a dark blue edge.
In STRING, each protein–protein interaction generates scores that in combination yield a final interaction score. The interaction score does not indicate the strength or even the specificity of the protein–protein interaction, but the final score does indicate the confidence or likelihood that an interaction is true given the evidence used to calculate the score. The scores can range from 0 to 1. The higher the score the greater the confidence [47]. Scores for the individual proteins in the FSTL1 interaction network are shown in the last column of Figure 15, Panel A and range from 0.915–0.973, suggesting that the analysis yielded proteins with a high likelihood of interacting with FSTL1.
We then generated a heat map based on the expression levels of the genes for the proteins in the 20 protein STRING diagram. Several of the genes in this list of proteins were over-expressed in the 7 week old Col4a3-/- mice compared to the 7 week old Col4a+/+ mice as illustrated in the heat map. A number of extracellular matrix proteins are part of this FSTL1 signature, including laminins (LAMB1and LAMC) and fibronectin (FN1) along with extracellular proteins that regulate matrix protein turnover. This group included the tissue inhibitor of metalloproteinase-one (TIMP1) and Latent Transforming Growth Factor Beta Binding Protein-one (LTBP1), the latter a protein involved in the activity of TGFB1, a pro-fibrotic cytokine. Bone morphogenic proteins were also part of the STRING network (BMP2 and BMP4). Together with our observations on AP1, the STRING analysis also relates FSTL1 to re-modeling of the extracellular matrix and the development of interstitial fibrosis, a critical event that is characteristic of progressive CKD [48].
We extended our studies of Fstl1 and its receptors Tlr4 and Dip2a in another experimental model of chronic kidney disease: murine UUO. This model of kidney injury is associated with marked increases in the expression of genes involved in kidney fibrosis (Acta2, Tgfb1, Col1a1, and Fn1) and inflammation (Ccl2 and Tnfa) 7 days after ligation of the ureter. There was a 10-fold increase in Fstl1 and an 8-fold increase in Tlr4 expression after 7 days. Dip2a also increased 4-fold. An RNAScope© analysis also showed that there is very little expression in the normal kidney and that the increase in Fstl1 in the UUO kidney occurs in the interstitial compartment, as we had observed in the Col4a3-/- mice. Fstl1 and its cognate receptors are therefore up-regulated in two different models of experimental CKD, one associated with early glomerular injury and progressive proteinuria and another associated with urinary tract obstruction. These observations spurred us to extend our analysis of Col4a3-/- mice to human CKD.
Our studies of human CKD involved subjects recruited to the NEPTUNE consortium study of proteinuric CKD with three common kidney diseases: focal segmental glomerulosclerosis (FSGS), IgA nephropathy (IgAN) and membranous nephropathy (MGN). We examined these diseases because each is a glomerular disease process characterized by progressive injury, declining function, and proteinuria. Interestingly, COL4A mutations have emerged in patients with CKD beyond Alport syndrome, including FSGS, increasing the relevance of our studies in Col4a3-/- mice [19]. There are several strengths related to the use of this cohort of patients. First, extensive clinical data and long-term follow-up of kidney outcomes are available. Kidney biopsy samples were microdissected at baseline and gene expression profiles were derived from both the glomerular and tubule-interstitial compartments. In addition, kidney biopsy samples were subjected to protocol assessment of kidney injury including tubulo-interstitial fibrosis (IF) and tubular atrophy (TA). These experimental protocols allow for the study of gene expression and the relationship of gene expression to both clinical variables and pathological assessment of the kidney biopsy. Finally, the protocol-driven collection of longitudinal clinical data allows for the study of relationships between gene expression and kidney outcomes.
We first studied the three cohorts as a single group to relate FSTL1 expression to clinical variables like age, sex, BMI, blood pressure, eGFR, and urinary protein excretion (UPCR). We chose to look at sex because it is an important determinant of kidney outcomes while BMI and blood pressure relate to poor kidney outcomes. We first observed that FSTL1 expression in the kidney tubule-interstitial compartment was similar in males than females at baseline (recruitment to NEPTUNE). Univariate analysis of FSTL1 mRNA levels and age, BMI, blood pressure (both sitting systolic and diastolic pressure) showed no significant relationships between these variables and FSTL1 mRNA levels. In contrast, there was a significant inverse relationship between eGFR and FSTL1 mRNA levels such that the higher the FSTL1 expression, the lower the eGFR value at recruitment to NEPTUNE. Interestingly, we observed a positive relationship between the UPCR. This suggests that proteinuria may be an important determinant of FSTL1 expression, although we did not define a causal relationship. Given the above findings, we performed a multiple linear regression analysis in which we related FSTL1 expression to age, sex, BPSS, BPSD, eGFR, and UPCR. Age, eGFR, and UPCR were associated with FSTL1 expression in the three groups of subjects as a whole.
In an unadjusted analysis of the relationship between FSTL1 mRNA quartiles and the composite clinical outcome of ESKD or a 40% loss of kidney function, we found that the odds ratio of reaching this composite was 2.67 (1.05, 6.76) in the highest quartile of FSTL1 mRNA levels compared to the first, second, and third quartiles. We compared mean values for eGFR, interstitial fibrosis (IF), and tubular atrophy (TA) between the first and fourth quartile for FSTL1 mRNA levels and mean values for eGFR were significantly lower in the fourth quartile compared to the first quartile while mean values for IF and TA were greater. In accord with the increase in IF mean values for the mRNA levels of COL1A1, ACTA2, and TGFB1 were all increased in the fourth quartile compared to the first quartile. In a similar manner, genes for the apoptosis proteins, CASP3 and CASP8 were higher in the fourth quartile like the measures of TA. There was also an increase in genes related to inflammation (CCL2 and TNFA). Taken together, high FSTL1 mRNA levels in the kidney identify subjects with lower eGFR, more chronic kidney injury based on IF and TA, and higher levels of genes implicated in fibrosis, inflammation, and apoptosis, cellular processes responsible for progressive loss of function.
We next divided the NEPTUNE cohort into the three groups based on underlying pathological diagnosis and looked at the correlation between FSTL1 mRNA levels and kidney function IF, and TA in each cohort separately. The relationships in all three groups re-capitulated the analysis of the whole group. There were positive associations between FSTL1 levels and genes involved in fibrosis and apoptosis that were similar in all three cohorts. Once again, these relationships do not establish causality but together strengthen the hypothesis that kidney expression of FSTL1 contributes to progressive loss of function, kidney fibrosis, and loss of functioning nephron mass, and taken together with our in vitro observations do not support the hypothesis that FSTL1 limits kidney injury. Moreover, changes in kidney expression of FSTL1 are important and it is tempting to speculate that paracrine effects of fibroblast-derived FSTL1 are responsible for the relationships that we have identified in experimental and clinical CKD.
An important limitation of the current study is that we did not establish the mechanism(s) responsible for the early and sustained increase in kidney FSTL1 expression in Col4a3-/- mice. Sundaram and coworkers were studying the role of FSTL1 keratinocytes in chronic wound healing [45]. FSTL1 promotes wound healing by virtue of its effects on fibrosis, analogous to the role we think that it plays in chronic kidney disease [45]. Chronic fibrotic disease may be wound healing gone awry, at least in part, as first articulated by Wayne Border in a review on TGFB1 [49]. Sundaram discovered that a post-transcriptional switch regulated expression of FSTL1. This switch is due to microRNA-198 (miR-198) encoded in the 3′-umtranslated FSTL1 transcript. A protein called KH-type splicing regulatory protein (KHSRP) influences the processing of the FSTL1 mRNA transcript and decreases translation to the mature protein. TGFB1 reduces the expression of KHSRP and increases the translation of FSTL1 [45].
There was no increase in Tgfb1 mRNA levels in the 4 week old Col4a3-/- mice, but activation of TGFB1 is independent of transcript levels so it may still promote early increases in FSTL1 if there is a release of mature TGFB1 from its latent complex [50]. Increased reactive oxygen species can activate TGFB1 and the binding and internalization of albumin by proximal tubule cells generate superoxides [50,51]. Such an effect could contribute to early TGFB1 activation in the kidney interstitial space in Col4a3-/- mice. There was a three-fold rise in albuminuria in the 4-week-old Col4a3-/- mice compared to the 4-week-old Col4a3+/+ mice. This mechanism cannot account for the rise in Fstl1 in the UUO mice because this model of kidney injury is not associated with albuminuria. However, UUO is associated with increased oxidative stress likely due to mechanical strain on the tubular epithelial cells. Moreover, we did see increases in Tgfb1 mRNA levels in the UUO mice.
Although increased oxidative stress may be a common pathway leading to TGFB1 activation and a subsequent increase in FSTL1 in the kidney, it is also possible that activation of the renin angiotensin system contributes to TGFB1 activation. Border and coworkers reported that angiotensin II also activates TGFB1 [52]. Angiotensin II generation increases in both the Col4a3-/- mice and in mice subjected to UUO [53]. Overall, the contribution of these processes to the increase in FSTL1 occurring in the kidney will require future study.
Our study has other limitations. We did not perform any immunohistochemistry of FSTL1 or any dual labeling immunohistochemistry to improve localization to particular kidney segments. The utilization of a kidney single cell transcriptional dataset along with RNAscope® in our experimental model allowed us to take an independent approach to the localization of FSTL1. Dual labeling is thus a future goal so that we may gain a better understating of the kidney cells responsible for the secretion of FSTL1.
We did not study the impact of deletion of the gene for Fstl1 in either the Col4a3-/- mice or in the mice subjected to UUO. Deletion of the gene for Fstl1 is neonatal lethal. This has limited past approaches to the use of hypomorphic alleles. The generation of a fibroblast-specific Fstl1 gene knockout mouse is the most definitive approach to defining the effect of Fstl1 on progressive fibrosis, but the generation of a mouse that also has Col4a3 gene deletion would require a complex breeding strategy. Subjecting transgenic mice to UUO would be more straightforward with the caveat that this mouse model is not associated with proteinuria. Moreover, future work will be required to determine kidney tissue concentrations of FSTL1 to better support in vitro studies of the effect of FSTL1 on kidney cells and mononuclear cells, including studies on cell proliferation. Another important limitation of our report is the absence of an attempt to block FSTL1 activity. Neutralizing antibodies have blocked FSTL1 bioactivity in models of lung injury [54] but the specific reagents used by these investigators are not commercially available. Finally, our analysis of the relationship between FSTL1 levels and kidney outcomes in the NEPTUNE cohort was unadjusted. Therefore, our analysis is exploratory, hypothesis-generating, and meant to support a more definitive future analysis using Kaplan–Meier (K-M) survival curve and Cox proportional-hazards modeling. The predictive value of FSTL1 remains to be determined. Finally, we did not relate urinary FSTL1 to expression in the kidney and to interstitial fibrosis in the kidney. This analysis would help determine if urinary FSTL1 might be a non-invasive marker of kidney fibrosis.
In conclusion, our studies show that FSTL1 is a fibroblast-derived cytokine expressed in the kidney and up-regulated in both experimental and clinical chronic kidney disease. Our in vivo, in vitro, and in silico analyses suggest that FSTL1 contributes to fibrosis, inflammation, and apoptosis in the kidney. FSTL1 may be a new treatment target in chronic kidney disease.

4. Material and Methods

4.1. Animals

All animal experiments conducted in this study were approved by the University of Toronto Faculty of Medicine Animal Care Committee (protocol no. 20011495) per the Regulations of the Animals for Research Act in Ontario and the Guidelines of the Canadian Council on Animal Care. Col4a3-/- mice (stock no. 002908) on the 129X1/SvJ background, WT controls (stock no. 000691), and C57BL/6J mice (stock no.000664) were purchased from The Jackson Laboratory (Bar Harbor, ME, USA). Mice were housed at the Division of Comparative Medicine (University of Toronto, Toronto, ON, Canada) in a 12-h dark–light cycle and fed standard rodent diet (2018 Teklad global 18% protein) purchased from Envigo (Huntingdon, UK), with free access to water. Only male mice were used in this study. Mice were randomly assigned to control and treatment groups. Investigators were not blinded unless otherwise stated. Numbers of biological replicates are stated within figure legends.

4.2. Cell Culture

Immortalized human proximal tubule epithelial (HK-2) cells were cultured in Gibco DMEM/F-12 (Thermo Fisher Scientific, Waltham, MA, USA) supplemented with 10% fetal bovine serum (Thermo Fisher Scientific), 10 ng/mL epidermal growth factor (MilliporeSigma, Burlington, MA, USA), 5 μg/mL transferrin (MilliporeSigma), 5 μg/mL insulin (MilliporeSigma), 0.05 μM hydrocortisone (MilliporeSigma), 50 U/mL penicillin (Thermo Fisher Scientific), and 50 μg/mL streptomycin (Thermo Fisher Scientific). Cells were maintained at 37 °C with 5% CO2. HK-2 cells were subcultured in six-well plates and then starved of serum overnight. For phosphorylated ERK and p38 immunoblots, cells were treated with DMEM/F-12 medium for control and 125 ng/mL rhFSTL1 (Novus Biologicals NBP2-23056) in DMEM/F-12 medium for either 5, 10, 30, 60, or 120 min. For PARP and CASP3, cells were treated with DMEM/F-12 medium for control, 125 ng/mL rhFSTL1 in DMEM/F-12 medium for 16 h, or 1 μm of Naloxone in DMEM/F12 for 8 h the subsequently treated with 125 ng/mL rhFSTL1 in DMEM/F-12 medium for 16 h. For COX2, cells were treated with DMEM/F-12 medium for control or 125 ng/mL rhFSTL1 in DMEM/F-12 medium for 18 h. For COL1A1, cells were treated with DMEM/F-12 medium for control or 125 ng/mL rhFSTL1 in DMEM/F-12 medium for 48 h.

4.3. Immunoblotting

Total protein extract was transferred to a tube with 5× SDS sample loading buffer and boiled at 95 °C for 5 min. Proteins were separated by SDS-PAGE and then transferred onto PVDF membranes. Membranes were blocked and subsequently incubated with primary antibodies overnight at 4 °C. Primary antibodies were used at a dilution of 1:1000, except where otherwise indicated. The following rabbit primary antibodies were purchased from Cell Signaling Technology: phospho-p44/42 MAPK (ERK1/2; cat no. 9101), p44/42 MAPK (ERK1/2; cat no. 9102), phospho-p38 MAPK (1:500; cat no. 9211), p38 MAPK (1:500; cat no. 9212), COX2 (cat no. 12282), PARP (cat no. 9542), CASP3 (cat no. 9664). COL1a1 was purchased from Cedarlane (product code: CL50151AP-1) The mouse primary antibody for b-actin (1:4000; cat no. A5441) was purchased from MilliporeSigma. Membranes were incubated with HRP-conjugated goat anti-rabbit (cat no. 7074) and bands were detected by enhanced chemiluminescence with the Luminata Forte Western HRP Substrate (MilliporeSigma). Densitometry was performed with Scion Image (Scion Corporation, Frederick, MD). For FSTL1 membranes were blocked and subsequently incubated with FSTL1 (R&D system, cat no. AF1738) overnight at 4 °C at a dilution of 0.1 µg/mL. Membranes were then incubated with HRP-conjugated mouse anti-goat IgG antibody (merck-millipore). Bands were detected using (ImageQuant LAS 4000 mini, GE Healthcare) and Densitometry was performed with Scion Image (Scion Corporation, Frederick, MD, USA).

4.4. RNAscope®

RNA Chromogenic in situ hybridization Visualization of mRNA transcript was performed using RNAScope® 2.5 (Advanced Cell Diagnostics, Hayward, CA, USA), according to the manufacturer’s instructions. A 20ZZ probe (RNAscope® Target Probe C1) was designed and named Mm-Fstl1 targeting 100–1102 of NM_008047.5.

4.5. Luciferase

Cells were transfected with Renilla luciferase control reporter vector pRL-TK and a luciferase reporter for either NFκB or AP-1 vector and incubated with fresh growth medium (DMEM/F-12) for 24 h, and then starved of serum (serum-free DMEM/F-12) for 24 h. Cells were then treated with 125 ng/mL rhFSTL1 for 24 h. The control group was treated with serum free DMEM/F-12 for 24 h. Reporter activities were measured using the Promega, Madison Wisconsin dual-luciferase assay kit. The luciferase activity was normalized to the Renilla luciferase activity.

4.6. Quantitative PCR

Total RNA was purified using the RNeasy Mini Kit (Qiagen, Hilden, Germany) by following the manufacturer’s protocol. cDNA was synthesized from purified template RNA with the QuantiTect Reverse Transcription Kit (Qiagen). Quantitative PCR was performed with Applied Biosystems TaqMan Gene Expression Assays (Thermo Fisher Scientific) run on a ViiA 7 Real-Time PCR System (Thermo Fisher Scientific). The mouse TaqMan Gene Expression Assays that were used include: Mm00433371_m1; Fstl1, Mm00445273_m1; Tlr4, Mm01150153_m1; Dip2a, Mm00441242_m1; Ccl2, Mm00443258_m1; Tnfa, Mm00725412_s1; Acta2, Mm01178820_m1; Tgfb1, Mm00801666_g1; Col1a1, Mm01256744_m1; Fn1. Values were determined using the relative standard curve method. Gapdh served as the housekeeping gene.

4.7. Histological Staining

Three-micrometer formalin-fixed, paraffin-embedded kidney sections were used for periodic acid-Schiff (PAS), Masson’s trichrome (MTC), and α-SMA (SMA) staining. The rabbit primary antibody for α-SMA (cat no. ab5694) was purchased from Abcam. PAS and MTC as well as α-SMA were performed at the University Health Network Pathology Research Program Laboratory (Toronto, ON, Canada).

4.8. Heatmaps

Heatmaps were generated using the gplots package in RStudio version 3.5.2.

4.9. Unilateral Ureteral Obstruction (UUO)

Unilateral ureteral obstruction (UUO) 7 week old male C57BL/6J, mice were anesthetized with inhalational 3% isoflurane and administered analgesic (buprenorphine, 0.1 mg/kg s.c.). A midline dorsal incision was made to expose the left kidney ureter which was ligated with a 4–0 suture. The contralateral (right) kidney served as the control. Body temperature was maintained during the procedure using a 37 °C heating pad. Incisions were closed using 4–0 sutures. After 7 days, the mice were euthanized, and kidneys were harvested.

4.10. Data Collection and Study Cohort

Percutaneous kidney biopsies were obtained from patients after informed consent and with approval of the local ethics committees at each of the participating kidney centers. Written consent and assent were obtained. This covers all aspects of the study including clinical data, biospecimens and any derivatives. Clinical and gene expression information from patients is accessible in a non-identifiable manner. The University of Michigan institutional review board in the Department of Medicine (UMich IRBMED) is the institutional review board of record [55].
Biopsies from 211 subjects (78 females and 133 males) with nephrotic syndrome (FSGS, IgAN, MN) were microdissected into glomerular and tubulointerstitial components. Kidney biopsy tissue was manually micro-dissected to separate the tubulointerstitial compartment from the glomerular compartment. Total RNA was isolated, reverse transcribed, linearly amplified and hybridized on an Affymetrix 2.1 ST platform as described previously [55,56,57]. Gene expression was normalized, quantified, and annotated at the Entrez Gene level.
Visual assessment was performed according to the Nephrotic Syndrome Study Network Digital Pathology Scoring System (NDPSS), on de-identified whole slide images of kidney biopsies according to the NEPTUNE digital pathology protocol (NDPP) [55]. Visual quantitative assessment of IF and TA was reported as 0–100%. Pathological assessment of IF and TA was performed according.
Estimated glomerular filtration rate (eGFR) (mL/min/1.73 m2) was calculated using the Chronic Kidney Disease Epidemiology Collaboration (CKD-EPI) formula for participants ≥18 years old and the modified CKiD-Schwartz formula for participants <18 years old. Progression of eGFR was evaluated with a composite of 40% decline in eGFR from baseline or ESKD. ESKD was defined as the initiation of dialysis, receipt of kidney transplant or eGFR < 15 mL/min/1.73 m2 at two visits.

4.11. Statistics

Statistics Numbers of cohorts and n values for each experiment are indicated in figure legends. Unless stated otherwise, data are reported as the mean ± SEM. Statistical analyses were performed using GraphPad Prism 7 (GraphPad Software, San Diego, CA, USA). p values were determined by two-tailed Student’s t-tests for comparisons between two groups or one-way ANOVA with Tukey’s multiple comparisons tests for comparisons between three groups or more.

Author Contributions

Conceptualization, N.A.M. and J.W.S., Y.P.; generated experimental data, N.A.M., X.S.; formal analysis, N.A.M., X.S., R.J.; writing—original draft preparation, N.A.M., J.W.S., Y.P.; writing—review and editing, N.A.M., J.W.S., Y.P., H.R., R.J., X.S., E.H.B.; J.W.S. and Y.P. contributed to the manuscript equally. All authors have read and agreed to the published version of the manuscript.

Funding

This research was funded by the Nephrotic Syndrome Study Network Consortium (NEPTUNE). The Nephrotic Syndrome Rare Disease Clinical Research Network III (NEPTUNE) is part of the Rare Diseases Clinical Research Network (RDCRN), funded by the National Institutes of Health (NIH) and led by the National Center for Advancing Translational Sciences (NCATS) through its Office of Rare Diseases Research (ORDR). NEPTUNE (U54DK083912) is funded under a collaboration between NCATS and the National Institute of Diabetes and Digestive and Kidney Diseases (NIDDK). Additional funding and/or programmatic support is provided by the University of Michigan, NephCure Kidney International and the Halpin Foundation. All RDCRN consortia are supported by the RDCRN Data Management and Coordinating Center (DMCC) (U2CTR002818).

Institutional Review Board Statement

The study was conducted according to the guidelines of the Declaration of Helsinki, and approved by the University Health Network Research Ethics Board (CAPCR ID: 09-0122 May 21, 2009). All animal experiments were approved by the University of Toronto Faculty of Medicine Animal Care Committee and the Research Ethics Board (protocol #20011495) and conducted in accordance to Canadian Council on Animal Care (CCAC) guidelines.

Informed Consent Statement

Informed consent was obtained from all subjects involved in the study.

Acknowledgments

We thank team members from The Centre for Phenogenomics, the University Health Network PRP Laboratory, and The Centre for Applied Genomics, for their technical assistance. We would also like to thank Rachel Laframboise for contributing to the editing and proofreading of this manuscript. Suh from the Department of Internal Medicine, Chonnam National University Medical School and Chonnam National University Hospital, Gwangju, Korea for providing histology images. This work was supported by grants from the Canadian Institutes of Health Research (JWS), The Kidney Foundation of Canada (JWS), and the Alport Syndrome Foundation (JWS). Some of the instruments used in this study were supported by The 3D (Diet, Digestive Tract and Disease) Centre funded by the Canadian Foundation for Innovation and Ontario Research Fund, project numbers 19442 and 30961. Some of this work has been presented in abstract form at ASN Kidney Week. Members of the Nephrotic Syndrome Study Network (NEPTUNE): NEPTUNE Enrolling Centers: Cleveland Clinic, Cleveland, OH: K Dell *, J Sedor **, M Schachere #, J Negrey #. Children’s Hospital, Los Angeles, CA: K Lemley *, S Tang #. Children’s Mercy Hospital, Kansas City, MO: T Srivastava *, S Morrison #. Cohen Children’s Hospital, New Hyde Park, NY: C Sethna *, O Bullaro #. Columbia University, New York, NY: P Canetta *, A Pradhan #. Emory University, Atlanta, GA: L Greenbaum *, C Wang **, C Kang #. Harbor-University of California Los Angeles Medical Center: S Adler *, J LaPage #. John H. Stroger Jr. Hospital of Cook County, Chicago, IL: A Athavale *, M Itteera. Johns Hopkins Medicine, Baltimore, MD: M Atkinson *, T Dell #. Mayo Clinic, Rochester, MN: F Fervenza *, M Hogan **, J Lieske *, V Chernitskiy #. Montefiore Medical Center, Bronx, NY: F Kaskel *, M Ross *, P Flynn #. NIDDK Intramural, Bethesda MD: J Kopp *, J Blake #. New York University Medical Center, New York, NY: H Trachtman *, O Zhdanova **, F Modersitzki #, S Vento #. Stanford University, Stanford, CA: R Lafayette *, K Mehta #. Temple University, Philadelphia, PA: C Gadegbeku *, S Quinn-Boyle #. University Health Network Toronto: M Hladunewich **, H Reich **, P Ling #, M Romano #. University of Miami, Miami, FL: A Fornoni *, C Bidot #. University of Michigan, Ann Arbor, MI: M Kretzler *, D Gipson *, A Williams #, C Klida #. University of North Carolina, Chapel Hill, NC: V Derebail *, K Gibson *, E Cole #, J Ormond-Foster #. University of Pennsylvania, Philadelphia, PA: L Holzman *, K Meyers **, K Kallem #, A Swenson #. University of Texas Southwestern, Dallas, TX: K Sambandam *, Z Wang #, M Rogers #. University of Washington, Seattle, WA: A Jefferson *, S Hingorani **, K Tuttle **§, M Bray #, E Pao #, A Cooper #§. Wake Forest University Baptist Health, Winston-Salem, NC: JJ Lin *, Stefanie Baker #. Data Analysis and Coordinating Center: M Kretzler *, L Barisoni **, J Bixler, H Desmond, S Eddy, D Fermin, C Gadegbeku **, B Gillespie **, D Gipson **, L Holzman **, V Kurtz, M Larkina, S Li, S Li, CC Lienczewski, J Liu, T Mainieri, L Mariani **, M Sampson **, J Sedor **, A Smith, A Williams, J Zee. Digital Pathology Committee: Carmen Avila-Casado (University Health Network, Toronto), Serena Bagnasco (Johns Hopkins University), Joseph Gaut (Washington University in St Louis), Stephen Hewitt (National Cancer Institute), Jeff Hodgin (University of Michigan), Kevin Lemley (Children’s Hospital of Los Angeles), Laura Mariani (University of Michigan), Matthew Palmer (University of Pennsylvania), Avi Rosenberg (Johns Hopkins University), Virginie Royal (University of Montreal), David Thomas (University of Miami), Jarcy Zee (University of Pennsylvania) Co-Chairs: Laura Barisoni (Duke University) and Cynthia Nast (Cedar Sinai). * Principal Investigator; ** Co-investigator; # Study Coordinator. § Providence Medical Research Center, Spokane, WA.

Conflicts of Interest

The authors declare no conflict of interest. The funders had no role in the design of the study; in the collection, analyses, or interpretation of data; in the writing of the manuscript, or in the decision to publish the results.

References

  1. Saucedo, A.L.; Perales-Quintana, M.M.; Paniagua-Vega, D.; Sanchez-Martinez, C.; Cordero-Perez, P.; Minsky, N.W. Chronic Kidney Disease and the Search for New Biomarkers for Early Diagnosis. Curr. Med. Chem. 2018, 25, 3719–3747. [Google Scholar] [CrossRef]
  2. Prakoura, N.; Chatziantoniou, C. Periostin and Discoidin Domain Receptor 1: New Biomarkers or Targets for Therapy of Renal Disease. Front. Med. 2017, 4, 52. [Google Scholar] [CrossRef] [PubMed] [Green Version]
  3. Zhang, M.-Z.; Sasaki, K.; Li, Y.; Li, Z.; Pan, Y.; Jin, G.-N.; Wang, Y.; Niu, A.; Wang, S.; Fan, X.; et al. The Role of the EGF Receptor in Sex Differences in Kidney Injury. J. Am. Soc. Nephrol. 2019, 30, 1659–1673. [Google Scholar] [CrossRef] [PubMed]
  4. Escobar, C.; Aranda, U.; Palacios, B.; Capel, M.; Sicras, A.; Sicras, A.; Hormigo, A.; Alcázar, R.; Manito, N.; Botana, M. Epidemiology, clinical profile, management, and two-year risk complications among patients with chronic kidney disease in Spain. Nefrologia 2021, in press. [Google Scholar] [CrossRef]
  5. Bae, E.H.; Fang, F.; Williams, V.R.; Konvalinka, A.; Zhou, X.; Patel, V.B.; Song, X.; John, R.; Oudit, G.Y.; Pei, Y.; et al. Murine recombinant angiotensin-converting enzyme 2 attenuates kidney injury in experimental Alport syndrome. Kidney Int. 2017, 91, 1347–1361. [Google Scholar] [CrossRef]
  6. Williams, V.R.; Konvalinka, A.; Song, X.; Zhou, X.; John, R.; Pei, Y.; Scholey, J.W. Connectivity mapping of a chronic kidney disease progression signature identified lysine deacetylases as novel therapeutic targets. Kidney Int. 2020, 98, 116–132. [Google Scholar] [CrossRef] [PubMed]
  7. Bae, E.H.; Konvalinka, A.; Fang, F.; Zhou, X.; Williams, V.; Maksimowski, N.; Song, X.; Zhang, S.-L.; John, R.; Oudit, G.Y.; et al. Characterization of the intrarenal renin-angiotensin system in experimental alport syndrome. Am. J. Pathol. 2015, 185, 1423–1435. [Google Scholar] [CrossRef] [PubMed]
  8. Liu, X.; Liu, Y.; Yang, Z.; Ning, W. Cell type specific expression of Follistatin-like 1 (Fstl1) in mouse embryonic lung development. J. Mol. Histol. 2018, 49, 399–409. [Google Scholar] [CrossRef]
  9. Chen, Z.; Fang, Y.; Zhang, S.; Li, L.; Wang, L.; Zhang, A.; Yuan, Z.; Wang, P.; Zhou, H.; Cui, W.; et al. Haplodeletion of Follistatin-Like 1 Attenuates Radiation-Induced Pulmonary Fibrosis in Mice. Int. J. Radiat. Oncol. Biol. Phys. 2019, 103, 208–216. [Google Scholar] [CrossRef] [PubMed]
  10. Zhao, Y.; Sun, J.; Zhang, W.; Peng, M.; Chen, J.; Zheng, L.; Zhang, X.; Yang, H.; Liu, Y. Follistatin-Like 1 Protects against Doxorubicin-Induced Cardiomyopathy through Upregulation of Nrf2. Oxid. Med. Cell. Longev. 2020, 2020, 3598715. [Google Scholar] [CrossRef] [PubMed]
  11. Hayakawa, S.; Ohashi, K.; Shibata, R.; Kataoka, Y.; Miyabe, M.; Enomoto, T.; Joki, Y.; Shimizu, Y.; Kambara, T.; Uemura, Y.; et al. Cardiac myocyte-derived follistatin-like 1 prevents renal injury in a subtotal nephrectomy model. J. Am. Soc. Nephrol. 2015, 26, 636–646. [Google Scholar] [CrossRef] [PubMed] [Green Version]
  12. Mattiotti, A.; Prakash, S.; Barnett, P.; van den Hoff, M.J.B. Follistatin-like 1 in development and human diseases. Cell. Mol. Life Sci. 2018, 75, 2339–2354. [Google Scholar] [CrossRef] [PubMed]
  13. Garces de Los Fayos Alonso, I.; Liang, H.-C.; Turner, S.D.; Lagger, S.; Merkel, O.; Kenner, L. The Role of Activator Protein-1 (AP-1) Family Members in CD30-Positive Lymphomas. Cancers 2018, 10, 93. [Google Scholar] [CrossRef] [Green Version]
  14. Kassiri, Z.; Oudit, G.Y.; Kandalam, V.; Awad, A.; Wang, X.; Ziou, X.; Maeda, N.; Herzenberg, A.M.; Scholey, J.W. Loss of TIMP3 enhances interstitial nephritis and fibrosis. J. Am. Soc. Nephrol. 2009, 20, 1223–1235. [Google Scholar] [CrossRef] [Green Version]
  15. Bascands, J.-L.; Schanstra, J.P. Obstructive nephropathy: Insights from genetically engineered animals. Kidney Int. 2005, 68, 925–937. [Google Scholar] [CrossRef] [PubMed] [Green Version]
  16. Chevalier, R.L.; Forbes, M.S.; Thornhill, B.A. Ureteral obstruction as a model of renal interstitial fibrosis and obstructive nephropathy. Kidney Int. 2009, 75, 1145–1152. [Google Scholar] [CrossRef] [PubMed] [Green Version]
  17. Tinti, F.; Lai, S.; Noce, A.; Rotondi, S.; Marrone, G.; Mazzaferro, S.; Di Daniele, N.; Mitterhofer, A.P. Chronic Kidney Disease as a Systemic Inflammatory Syndrome: Update on Mechanisms Involved and Potential Treatment. Life 2021, 11, 419. [Google Scholar] [CrossRef] [PubMed]
  18. Liu, W.; Peng, L.; Tian, W.; Li, Y.; Zhang, P.; Sun, K.; Yang, Y.; Li, X.; Li, G.; Zhu, X. Loss of phosphatidylserine flippase β-subunit Tmem30a in podocytes leads to albuminuria and glomerulosclerosis. Dis. Models Mech. 2021, 14, dmm048777. [Google Scholar] [CrossRef]
  19. Ammar, S.; Kanoun, H.; Kammoun, K.; Domingo-Gallego, A.; Ruiz, P.; Lorente-Grandoso, L.; Pybus, M.; Maalej, B.; Boudawara, T.; Kamoun, H.; et al. Next-generation sequencing in patients with familial FSGS: First report of collagen gene mutations in Tunisian patients. J. Hum. Genet. 2021, 66, 795–803. [Google Scholar] [CrossRef]
  20. Salem, R.M.; Todd, J.N.; Sandholm, N.; Cole, J.B.; Chen, W.-M.; Andrews, D.; Pezzolesi, M.G.; McKeigue, P.M.; Hiraki, L.T.; Qiu, C.; et al. Genome-Wide Association Study of Diabetic Kidney Disease Highlights Biology Involved in Glomerular Basement Membrane Collagen. J. Am. Soc. Nephrol. 2019, 30, 2000–2016. [Google Scholar] [CrossRef] [Green Version]
  21. Maksimowski, N.A.; Scholey, J.W.; Williams, V.R. Nephrotic Syndrome Study Network (NEPTUNE) Sex and kidney ACE2 expression in primary focal segmental glomerulosclerosis: A NEPTUNE study. PLoS ONE 2021, 16, e0252758. [Google Scholar] [CrossRef] [PubMed]
  22. Maksimowski, N.; Williams, V.R.; Scholey, J.W. Kidney ACE2 expression: Implications for chronic kidney disease. PLoS ONE 2020, 15, e0241534. [Google Scholar] [CrossRef]
  23. Madsen, B.S.; Thiele, M.; Detlefsen, S.; Sørensen, M.D.; Kjaergaard, M.; Møller, L.S.; Rasmussen, D.N.; Schlosser, A.; Holmskov, U.; Trebicka, J.; et al. Prediction of liver fibrosis severity in alcoholic liver disease by human microfibrillar-associated protein 4. Liver Int. 2020, 40, 1701–1712. [Google Scholar] [CrossRef] [PubMed]
  24. Wang, H.-B.; Yang, J.; Shuai, W.; Yang, J.; Liu, L.-B.; Xu, M.; Tang, Q.-Z. Deletion of Microfibrillar-Associated Protein 4 Attenuates Left Ventricular Remodeling and Dysfunction in Heart Failure. J. Am. Heart Assoc. 2020, 9, e015307. [Google Scholar] [CrossRef]
  25. Pan, Z.; Yang, K.; Wang, H.; Xiao, Y.; Zhang, M.; Yu, X.; Xu, T.; Bai, T.; Zhu, H. MFAP4 deficiency alleviates renal fibrosis through inhibition of NF-κB and TGF-β/Smad signaling pathways. FASEB J. 2020, 34, 14250–14263. [Google Scholar] [CrossRef]
  26. Wang, Z.; Wang, Z.; Zhou, Z.; Ren, Y. Crucial genes associated with diabetic nephropathy explored by microarray analysis. BMC Nephrol. 2016, 17, 128. [Google Scholar] [CrossRef] [Green Version]
  27. Guo, J.; Liang, W.; Li, J.; Long, J. Knockdown of FSTL1 inhibits oxLDL-induced inflammation responses through the TLR4/MyD88/NF-κB and MAPK pathway. Biochem. Biophys. Res. Commun. 2016, 478, 1528–1533. [Google Scholar] [CrossRef]
  28. Wang, B.; Li, J.; Tian, F. Downregulation of lncRNA SNHG14 attenuates osteoarthritis by inhibiting FSTL-1 mediated NLRP3 and TLR4/NF-κB pathway through miR-124-3p. Life Sci. 2021, 270, 119143. [Google Scholar] [CrossRef]
  29. Ni, S.; Li, C.; Xu, N.; Liu, X.; Wang, W.; Chen, W.; Wang, Y.; van Wijnen, A.J. Follistatin-like protein 1 induction of matrix metalloproteinase 1, 3 and 13 gene expression in rheumatoid arthritis synoviocytes requires MAPK, JAK/STAT3 and NF-κB pathways. J. Cell. Physiol. 2018, 234, 454–463. [Google Scholar] [CrossRef] [PubMed] [Green Version]
  30. Adams, D.C.; Karolak, M.J.; Larman, B.W.; Liaw, L.; Nolin, J.D.; Oxburgh, L. Follistatin-like 1 regulates renal IL-1β expression in cisplatin nephrotoxicity. Am. J. Physiol. Renal Physiol. 2010, 299, F1320–F1327. [Google Scholar] [CrossRef] [PubMed] [Green Version]
  31. Feng, D.; Ngov, C.; Henley, N.; Boufaied, N.; Gerarduzzi, C. Characterization of Matricellular Protein Expression Signatures in Mechanistically Diverse Mouse Models of Kidney Injury. Sci. Rep. 2019, 9, 16736. [Google Scholar] [CrossRef] [PubMed]
  32. Zhang, B.; Ramesh, G.; Uematsu, S.; Akira, S.; Reeves, W.B. TLR4 signaling mediates inflammation and tissue injury in nephrotoxicity. J. Am. Soc. Nephrol. 2008, 19, 923–932. [Google Scholar] [CrossRef]
  33. Morrissey, J.; Guo, G.; McCracken, R.; Tolley, T.; Klahr, S. Induction of CD14 in tubular epithelial cells during kidney disease. J. Am. Soc. Nephrol. 2000, 11, 1681–1690. [Google Scholar] [CrossRef]
  34. Zhang, L.; Mabwi, H.A.; Palange, N.J.; Jia, R.; Ma, J.; Bah, F.B.; Sah, R.K.; Li, D.; Wang, D.; Bah, F.B.M.; et al. Expression Patterns and Potential Biological Roles of Dip2a. PLoS ONE 2015, 10, e0143284. [Google Scholar] [CrossRef]
  35. Tan, Y.; Cao, H.; Li, Q.; Sun, J. The role of transcription factor Ap1 in the activation of the Nrf2/ARE pathway through TET1 in diabetic nephropathy. Cell Biol. Int. 2021. [Google Scholar] [CrossRef] [PubMed]
  36. Yan, Y.; Liu, J.; Lawrence, A.; Dykstra, M.J.; Fannin, R.; Gerrish, K.; Tucker, C.J.; Scappini, E.; Dixon, D. Prolonged cadmium exposure alters benign uterine fibroid cell behavior, extracellular matrix components, and TGFB signaling. FASEB J. 2021, 35, e21738. [Google Scholar] [CrossRef]
  37. Surmiak, M.; Kosałka-Węgiel, J.; Polański, S.; Sanak, M. Endothelial cells response to neutrophil-derived extracellular vesicles miRNAs in anti-PR3 positive vasculitis. Clin. Exp. Immunol. 2021, 204, 267–282. [Google Scholar] [CrossRef] [PubMed]
  38. Sanchez-Niño, M.D.; Poveda, J.; Sanz, A.B.; Mezzano, S.; Carrasco, S.; Fernandez-Fernandez, B.; Burkly, L.C.; Nair, V.; Kretzler, M.; Hodgin, J.B.; et al. Fn14 in podocytes and proteinuric kidney disease. Biochim. Biophys. Acta 2013, 1832, 2232–2243. [Google Scholar] [CrossRef] [PubMed] [Green Version]
  39. Arab, H.H.; Ashour, A.M.; Alqarni, A.M.; Arafa, E.-S.A.; Kabel, A.M. Camel Milk Mitigates Cyclosporine-Induced Renal Damage in Rats: Targeting p38/ERK/JNK MAPKs, NF-κB, and Matrix Metalloproteinases. Biology 2021, 10, 442. [Google Scholar] [CrossRef]
  40. Wilkening, A.; Krappe, J.; Mühe, A.M.; Lindenmeyer, M.T.; Eltrich, N.; Luckow, B.; Vielhauer, V. C-C chemokine receptor type 2 mediates glomerular injury and interstitial fibrosis in focal segmental glomerulosclerosis. Nephrol. Dial. Transplant. 2020, 35, 227–239. [Google Scholar] [CrossRef]
  41. Huang, J.; Wan, D.; Li, J.; Chen, H.; Huang, K.; Zheng, L. Histone acetyltransferase PCAF regulates inflammatory molecules in the development of renal injury. Epigenetics 2015, 10, 62–72. [Google Scholar] [CrossRef] [Green Version]
  42. Han, H.; Zhu, J.; Wang, Y.; Zhu, Z.; Chen, Y.; Lu, L.; Jin, W.; Yan, X.; Zhang, R. Renal recruitment of B lymphocytes exacerbates tubulointerstitial fibrosis by promoting monocyte mobilization and infiltration after unilateral ureteral obstruction. J. Pathol. 2017, 241, 80–90. [Google Scholar] [CrossRef]
  43. Guan, Y.-M.; Diao, Z.-L.; Huang, H.-D.; Zheng, J.-F.; Zhang, Q.-D.; Wang, L.-Y.; Liu, W.-H. Bioactive peptide apelin rescues acute kidney injury by protecting the function of renal tubular mitochondria. Amino Acids 2021, 53, 1229–1240. [Google Scholar] [CrossRef] [PubMed]
  44. Liu, Y.; Tan, X.; Liu, W.; Chen, X.; Hou, X.; Shen, D.; Ding, Y.; Yin, J.; Wang, L.; Zhang, H.; et al. Follistatin-like protein 1 plays a tumor suppressor role in clear-cell renal cell carcinoma. Chin. J. Cancer 2018, 37, 2. [Google Scholar] [CrossRef] [Green Version]
  45. Sundaram, G.M.; Ismail, H.M.; Bashir, M.; Muhuri, M.; Vaz, C.; Nama, S.; Ow, G.S.; Vladimirovna, I.A.; Ramalingam, R.; Burke, B.; et al. EGF hijacks miR-198/FSTL1 wound-healing switch and steers a two-pronged pathway toward metastasis. J. Exp. Med. 2017, 214, 2889–2900. [Google Scholar] [CrossRef] [PubMed] [Green Version]
  46. Sundaram, G.M.; Common, J.E.A.; Gopal, F.E.; Srikanta, S.; Lakshman, K.; Lunny, D.P.; Lim, T.C.; Tanavde, V.; Lane, E.B.; Sampath, P. “See-saw” expression of microRNA-198 and FSTL1 from a single transcript in wound healing. Nature 2013, 495, 103–106. [Google Scholar] [CrossRef]
  47. Von Mering, C. STRING: Known and predicted protein-protein associations, integrated and transferred across organisms. Nucleic Acids Res. 2004, 33, D433–D437. [Google Scholar] [CrossRef]
  48. Hanai, S.; Uchimura, K.; Takahashi, K.; Ishii, T.; Mitsui, T.; Furuya, F. Hypoxia-induced thyroid hormone receptor expression regulates cell-cycle progression in renal tubule epithelial cells. Endocr. J. 2021. [Google Scholar] [CrossRef]
  49. Gaedeke, J.; Noble, N.A.; Border, W.A. Curcumin blocks multiple sites of the TGF-beta signaling cascade in renal cells. Kidney Int. 2004, 66, 112–120. [Google Scholar] [CrossRef] [Green Version]
  50. Shi, M.; Zhu, J.; Wang, R.; Chen, X.; Mi, L.; Walz, T.; Springer, T.A. Latent TGF-β structure and activation. Nature 2011, 474, 343–349. [Google Scholar] [CrossRef] [Green Version]
  51. Dickson, L.E.; Wagner, M.C.; Sandoval, R.M.; Molitoris, B.A. The proximal tubule and albuminuria: Really! J. Am. Soc. Nephrol. 2014, 25, 443–453. [Google Scholar] [CrossRef] [PubMed] [Green Version]
  52. Kagami, S.; Border, W.A.; Miller, D.E.; Noble, N.A. Angiotensin II stimulates extracellular matrix protein synthesis through induction of transforming growth factor-beta expression in rat glomerular mesangial cells. J. Clin. Investig. 1994, 93, 2431–2437. [Google Scholar] [CrossRef] [Green Version]
  53. Le, Y.; Zheng, Z.; Xue, J.; Cheng, M.; Guan, M.; Xue, Y. Effects of exendin-4 on the intrarenal renin-angiotensin system and interstitial fibrosis in unilateral ureteral obstruction mice: Exendin-4 and unilateral ureteral obstruction. J. Renin-Angiotensin-Aldosterone Syst. 2016, 17. [Google Scholar] [CrossRef] [Green Version]
  54. Dong, Y.; Geng, Y.; Li, L.; Li, X.; Yan, X.; Fang, Y.; Li, X.; Dong, S.; Liu, X.; Li, X.; et al. Blocking follistatin-like 1 attenuates bleomycin-induced pulmonary fibrosis in mice. J. Exp. Med. 2015, 212, 235–252. [Google Scholar] [CrossRef]
  55. Barisoni, L.; Nast, C.C.; Jennette, J.C.; Hodgin, J.B.; Herzenberg, A.M.; Lemley, K.V.; Conway, C.M.; Kopp, J.B.; Kretzler, M.; Lienczewski, C.; et al. Digital pathology evaluation in the multicenter Nephrotic Syndrome Study Network (NEPTUNE). Clin. J. Am. Soc. Nephrol. 2013, 8, 1449–1459. [Google Scholar] [CrossRef] [Green Version]
  56. Barisoni, L.; Troost, J.P.; Nast, C.; Bagnasco, S.; Avila-Casado, C.; Hodgin, J.; Palmer, M.; Rosenberg, A.; Gasim, A.; Liensziewski, C.; et al. Reproducibility of the NEPTUNE descriptor-based scoring system on whole-slide images and histologic and ultrastructural digital images. Mod. Pathol. 2016, 29, 671–684. [Google Scholar] [CrossRef] [PubMed] [Green Version]
  57. Mariani, L.H.; Martini, S.; Barisoni, L.; Canetta, P.A.; Troost, J.P.; Hodgin, J.B.; Palmer, M.; Rosenberg, A.Z.; Lemley, K.V.; Chien, H.-P.; et al. Interstitial fibrosis scored on whole-slide digital imaging of kidney biopsies is a predictor of outcome in proteinuric glomerulopathies. Nephrol. Dial. Transplant. 2018, 33, 310–318. [Google Scholar] [CrossRef] [Green Version]
Figure 1. Schematic diagram summarizing experimental workflow. (A) breeding strategy for generating experimental groups for analysis. (B) Whole kidney samples from 4 and 7 week old wild type (WT) and Col4a3-/- (KO) mice were subjected to microarray expression profiling.
Ijms 22 09513 g001
Figure 2. Comparisons of the Kidney Tissue Morphology of Kidney of WT and Col4a3-/- mice. Images from glomerulus (left) and tubulointerstitium (right) are presented. Periodic Acid Schiff staining (PAS); Masson’s trichrome staining (MTC). In Col4a3-/- mice, crescents are packing the Bowman’s space (red arrows). Detachment of tubular epithelial cells from basement membrane (red arrowheads), tubular cast (red asterisks), and collagen deposits (black arrows) are also indicated. Scale bars, 50 μm.
Ijms 22 09513 g002
Figure 3. Microarray expression of collagen 4 alpha 1-6. (A) Heatmap with unsupervised hierarchical cluster analysis of col4 genes in kidneys of 4 and 7 week old Col4a3-/- and wild-type mice (n = 8 per group). Each column reflects a kidney sample, and each row represents an individual gene. Red and blue color intensities correlate with the scaled up-regulation and downregulation of the gene, respectively. (BG) Graphical representation of microarray expression from panel A. Values are mean ± SEM. p values were determined by 1-way ANOVA. * p value < 0.05. ** p value < 0.01. *** p value < 0.001. **** p value < 0.0001.
Ijms 22 09513 g003
Figure 4. Differential Gene Expression in WT vs. KO mice at 4 Weeks of Age. Explanation of the statistical parameters used to identify the 5 differently expressed genes at 4 weeks of age in WT vs. KO mice.
Ijms 22 09513 g004
Figure 5. Microarray expression of genes differentially expressed at 4 and 7 weeks of age. (A) Heatmap with unsupervised hierarchical cluster analysis of the five genes that were differentially expressed at 4 weeks of age in the kidneys of Col4a3-/- mice. The analysis shows the gene expression in kidneys of 4 and 7 week old Col4a3-/- and wild-type mice (n = 8 per group). (BF) Graphical representation of mRNA levels in 4 week old wild type mice versus 4 week old Col4a3-/- mice. (GK) Graphical representation of microarray expression in 7 week old wild type versus 7 week old Col4a3-/- mice. Values are mean ± SEM, and significance was defined as a p value of < 0.05 by Student’s t tests.
Ijms 22 09513 g005
Figure 6. FSTL1 Protein Expression in WT and KO mouse kidney. (A) Representative immunoblot and quantification of FSTL1 in 4 week WT and KO mouse kidney. (B) Representative immunoblot and quantification of FSTL1 in 7 week WT and KO mouse kidney. Values are the mean ± SEM (black bars). p values were determined by Student’s t tests, and significance was defined as a p value < 0.05.
Ijms 22 09513 g006
Figure 7. Fstl1 expression localization in the kidney. (A) Light microscopic images at three magnifications of RNAscope® Fstl1 localization in wild type mice (upper three panels) and Col4a3-/- mice (lower three panels). (BE) Cell Clustering and Fstl1 expression from the Kidney Interactive Transcriptomics (KIT), human rejecting kidney allograft biopsy cells (http://humphreyslab.com/SingleCell, accessed on 15 March 2021).
Ijms 22 09513 g007
Figure 8. Fstl1 and cognate receptor expression. (A) Heatmap with unsupervised hierarchical cluster analysis of Fstl1, Dip2a, Cd14, and Tlr4 genes in kidneys of 4 and 7 week old Col4a3-/- and wild-type mice (n = 8 per group). (BE) Graphical representation of microarray expression in 4 week old wild type versus 4 week old Col4a3-/- mice. (FI) Graphical representation of microarray expression in 7 week old wild type versus 7 week old Col4a3-/- mice. Values are mean ± SEM, and significance was defined as a p value of < 0.05 by Student’s t tests.
Ijms 22 09513 g008
Figure 9. AP1 Heatmap. (A) Heatmap with unsupervised hierarchical cluster analysis of AP1 genes in kidneys of 4 and 7 week old Col4a3-/- and wild-type mice (n = 8 per group).
Ijms 22 09513 g009
Figure 10. p42/p44 MAPK (ERK) activation and AP1-related gene expression. (A) Representative immunoblots for phosphorylated (P-ERK) and total (t-ERK) extracellular signal-regulated kinase in immortalized human proximal tubule epithelial cells that were treated with rhFSTL1 for either 0, 5, 10, 30, 60, or 120 min. (B) Densitometry intensities were quantified and normalized to total ERK (n = 3). Values are mean ± SEM. p values were determined by one-way ANOVA. Significance was defined as a p value of < 0.05. (C) Immortalized human proximal tubule epithelial cells were transfected with an AP1 luciferase reporter plasmid. The experimental group of cells were incubated in rhFSTL1 for 24 h (n = 3 per group). Luciferase activity was subsequently determined. Values are the mean ± SEM (black bars). Values are mean ± SEM, and significance was defined as a p value of < 0.05 by Student’s t tests. (D) Heat map with unsupervised hierarchical cluster analysis of AP1 related genes in kidneys of 4 and 7 week old Col4a3-/- and wild-type mice (n = 8 per group). (EH) Graphical representation of selected mRNA levels in 7 week old wild type versus 7 week old Col4a3-/- mice. Values are mean ± SEM, and significance was defined as a p value of < 0.05 by Student’s t tests. (IL) Fstl1 mRNA levels were correlated with Acta2, Tgfb1, Col1a1, and Fn1 mRNA levels. Pearson’s correlation coefficient (r) was determined, and two-tailed p values derived. Linear regression generated the line of best fit (solid lines) with 95% confidence intervals (dotted lines). Significance was defined as a p value < 0.05. * p value < 0.05. ** p value < 0.01.
Ijms 22 09513 g010
Figure 11. p38 MAPK activation and NFκB-related expression. (A) Representative immunoblots for phosphorylated (P-p38) and total (t-p38) p38 in immortalized human proximal tubule epithelial cells that were treated with rhFSTL1 for either 0, 5, 10, 30, 60, or 120 min. Densitometry intensities were quantified and normalized to total p38 (n = 3). Values are mean ± SEM, and p values were determined by one-way ANOVA. Significance was defined as a p value of < 0.05. (B) Immortalized human proximal tubule epithelial cells were transfected with an NFκB luciferase reporter plasmid. Cells were incubated in rhFSTL1 for 24 h (n = 3 per group) and luciferase activity was determined. Values are the mean ± SEM (black bars). Significance was defined as a p value of < 0.05. (C) Heatmap with unsupervised hierarchical cluster analysis of NFκB related genes in kidneys of 4 and 7 week old Col4a3-/- and wild-type mice (n = 8 per group). (DG) Graphical representation of selected gene mRNA levels in 7 week old wild type versus 7 week old Col4a3-/- mice. Values are the mean ± SEM (black bars). p values were determined by Student’s t tests, and significance was defined as a p value < 0.05. (H,I) Fstl1 mRNA levels were correlated with Ccl2 and Tnfa mRNA levels. Pearson’s correlation coefficient (r) was determined, and two-tailed p values derived. Linear regression generated the line of best fit (solid lines) with 95% confidence intervals (dotted lines). Significance was defined as a p value < 0.05.
Ijms 22 09513 g011
Figure 12. rhFSTL1 treatment of cultured human kidney cells. (A) Representative Western blots for collagen type I alpha1 chain (COL1a1) and β-actin in immortalized human proximal tubule epithelial cells treated with rhFSTL1 for 24 h. Densitometry intensities were quantified and normalized to total (n = 3). (B) Representative Western blots for cyclooxygenase 2 (COX2) and β-actin in immortalized human proximal tubule epithelial cells that were treated with rhFSTL1 for 24 h. Densitometry intensities were quantified and normalized to total (n = 3). Values are the mean ± SEM (black bars). p values were determined by Student’s t tests, and significance was defined as a p value < 0.05.
Ijms 22 09513 g012
Figure 13. Fstl1 apoptosis. (A) Representative Western blots for poly (ADP-Ribose) polymerase 1 (PARP), Caspase 3 (CASP3), and β-actin in immortalized human proximal tubule epithelial cells treated with rhFSTL1 ± naloxone for 24 h. (B,C) Quantitative densitometry of immunoblots for PARP and CASP3, respectively. Intensities were quantified and normalized to β-actin (n = 3). Values are the mean ± SEM (black bars). p values were determined by Student’s t tests, and significance was defined as a p value of <0.05. (D) Heat map with unsupervised hierarchical cluster analysis of apoptotic-related genes in kidneys of 4 and 7 week old Col4a3-/- and wild-type mice (n = 8 per group). (EI) Graphical representation of mRNA levels for selected apoptosis-related genes in 7 week old wild type versus 7 week old Col4a3-/- mice. Values are the mean ± SEM (black bars). p values were determined by Student’s t tests, and significance was defined as a p value < 0.05. (JN) Fstl1 mRNA levels were correlated with Bax, Fas, Rela, Casp3, and Casp8 mRNA levels in 7 week old Col4a3-/- mice. Pearson’s correlation coefficient (r) was determined, and two-tailed p values derived. Linear regression generated the line of best fit (solid lines) with 95% confidence intervals (dotted lines). Significance was defined as a p value of <0.05.
Ijms 22 09513 g013
Figure 14. Protein–protein interaction (PPI) analysis of FSTL1. (A) Descriptions of nodes and edges used in the PPI interaction map. (B) STRING interaction map showing protein–protein association between FSTL1 and 5, 10, and 15 proteins. (C) STRING interaction map showing protein–protein association between FSTL1 and 20 proteins (listed in Figure 15 with the confidence scores generated by STRING).
Ijms 22 09513 g014
Figure 15. STRING interaction map showing protein–protein association between Fstl1 and 20 proteins.
Ijms 22 09513 g015
Figure 16. Expression analysis of FSTL1 signature genes derived from the STRING analysis of the FSTL1 protein–protein interaction (PPI) network. (A) Heat map with unsupervised hierarchical cluster analysis of the FSTL1 driven PPI network genes in kidneys of 4 and 7 week old Col4a3-/- mice and wild-type mice (n = 8 per group). (BI) Graphical representation of mRNA levels for selected FSTL1 signature genes in 7 week old wild type versus 7 week old Col4a3-/- mice. Values are the mean ± SEM (black bars). p values were determined by Student’s t tests, and significance was defined as a p value < 0.05.
Ijms 22 09513 g016
Figure 17. Unilateral ureteral obstruction (UUO) and Fstl1 expression. (A) Schematic diagram summarizing experimental workflow and collection of tissue from 7 week old C57B6 mice subjected to sham (n = 4) or UUO (n = 5) surgery. 7 days after surgery, mice were sacrificed, and kidney tissue was collected for analysis of mRNA levels. (B,C) Graphical representation of mRNA levels for selected genes implicated in kidney inflammation (Ccl2, Tnfa) in 7 week old wild type sham versus 7 week old UUO mice. Values are mean ± SEM (black bars). p values were determined by Student’s t tests, and significance was defined as a p value < 0.05. (DG) Graphical representation of mRNA levels for selected genes implicated in kidney fibrosis (Acta2, Tgfb1, Col1a1, Fn1) in 7 week old wild type sham versus 7 week old UUO mice. Values are mean ± SEM (black bars). p values were determined by Student’s t tests, and significance was a p value < 0.05.
Ijms 22 09513 g017
Figure 18. Fstl1 Histology of sham and UUO mice. Periodic acid–Schiff (PAS) (left panels), Masson Trichrome (MTC) (middle panels), and alpha-Smooth Muscle Actin (SMA) (right panels) in sham-operated mice (upper panels) and mice subjected to UUO for 7 days (lower panels).
Ijms 22 09513 g018
Figure 19. Fstl1 expression and localization in UUO. (AC) mRNA levels for Fstl1 and its putative receptors (Tlr4 and Dip2a) were determined by quantitative polymerase chain reaction in kidneys of C57B6 mice (sham n = 4, UUO n = 5). Values are the mean ± SEM (black bars). p values were determined by Student’s t test, and significance was defined as a p value of < 0.05. (D) Light microscopic images at three magnifications of RNASCOPE® Fstl1 localization in sham-operated mice (upper three panels) and mice subjected to UUO for 7 days (lower three panels).
Ijms 22 09513 g019
Figure 20. Relationship of tubulointerstitial FSTL1 expression to clinical variables in the cohort of FSGS, IgAN, and MN. (A) FSTL1 mRNA levels in male subjects compared to female subjects. (BG) FSTL1 mRNA levels correlated against (B) age, (C) sitting systolic blood pressure, (D) sitting diastolic blood pressure, (E) estimated glomerular filtration rate (eGFR), (F) Urine Protein to Creatinine Ratio (UPCR), and (G) Body Mass Index (BMI). Pearson’s correlation coefficient (r) was determined, and two-tailed p values derived. Significance was determined as a p value of <0.05. Linear regression generated the line of best fit (solid lines) with 95% confidence intervals (dotted lines). Significance was determined as a p value of <0.05.
Ijms 22 09513 g020
Figure 21. Forest Plot of End Point Analysis. The odds ratio (OR) with 95 percent confidence intervals for reaching the end point in the second, third, and fourth quartiles of baseline FSTL1 mRNA levels. The first quartile was the reference group. The OR was not adjusted for baseline clinical variables.
Ijms 22 09513 g021
Figure 22. A Comparison of Baseline Laboratory Variables and Gene Expression Levels Between First and Fourth FSTL1 Quartiles. (A) eGFR. (B) Interstitial fibrosis percentage (IF). (C) tubular atrophy percentage (TA). (D) Collagen Type I Alpha 1 Chain (COL1A1) expression. (E) Actin Alpha 2, Smooth Muscle (ACTA2) expression. (F) Transforming growth factor beta (TGFB1) expression. (G) Caspase 3 (CASP3) expression. (H) Caspase 8 (CASP8) expression. (I) BCL2 Associated X, Apoptosis Regulator (BAX) expression. (J) Tumor Necrosis Factor (TNFA) expression. (K) C-C Motif Chemokine Ligand 2 (CCL2) expression. (L) Fibronectin 1 (FN1) expression. Values are the mean ± SEM (black bars). p values were determined by Student’s t tests, and significance was defined as a p value < 0.05.
Ijms 22 09513 g022
Figure 23. Clinical FSTL1 expression in FSGS (red), IgAN (orange), and MN (purple). (A) eGFR correlated to FSTL1 mRNA levels in FSGS patients. (B) eGFR correlated to FSTL1 mRNA levels in IgAN patients. (C) eGFR correlated to FSTL1 mRNA levels in MN patients. (D) Interstitial fibrosis (IF) correlated to FSTL1 mRNA levels in FSGS patients. (E) Interstitial fibrosis (IF) correlated to FSTL1 mRNA levels in IgAN patients. (F) Interstitial fibrosis (IF) correlated to FSTL1 mRNA levels in MN patients. (G) Tubular atrophy (TA) correlated to FSTL1 mRNA levels in FSGS patients. (H) Tubular atrophy (TA) correlated to FSTL1 mRNA levels in IgAN patients. (I) Tubular atrophy (TA) correlated to FSTL1 mRNA levels in MN patients. Pearson’s correlation coefficient (r) was determined, and two-tailed p values derived. Significance was determined as a p value of <0.05. Linear regression generated the line of best fit (solid lines) with 95% confidence intervals (dotted lines).
Ijms 22 09513 g023
Figure 24. Relationship of FSTL1 mRNA Levels to the Expression of Genes Implicated in Fibrosis in FSGS (red), IgAN (orange), and MN (purple). Table 1. expression correlated to FSTL1 mRNA levels in FSGS (A), in IgAN (B), and MN (C). COL1A1 expression correlated to FSTL1 mRNA levels in FSGS (D), in IgAN (E), and in MN (F). FN1 expression correlated to FSTL1 mRNA levels in FSGS (G), in IgAN (H), and MN (I). ACTA2 expression correlated to FSTL1 mRNA levels in FSGS (J), in IgAN (K), and MN (L). Pearson’s correlation coefficient (r) was determined, and two-tailed p values derived. Significance was determined as a p value of <0.05. Linear regression generated the line of best fit (solid lines) with 95% confidence intervals (dotted lines).
Ijms 22 09513 g024
Figure 25. Relationship of FSTL1 mRNA Levels to the Expression of Genes Implicated in Inflammation in FSGS (red), IgAN (orange), and MN (purple). CCL2 expression correlated to FSTL1 mRNA levels in FSGS (A), in IgAN (B), and MN (C). TNFA expression correlated to FSTL1 mRNA levels in in FSGS (D), in IgAN (E), and MN (F). Pearson’s correlation coefficient (r) with two-tailed p values were calculated. Significance was determined as a p value of <0.05. Linear regression generated the line of best fit (solid lines) with 95% confidence intervals (dotted lines).
Ijms 22 09513 g025
Figure 26. Relationship of FSTL1 mRNA levels to the Expression of Genes implicated in Apoptosis in FSGS (red), IgAN (orange), and MN (purple). BAX expression correlated to FSTL1 mRNA levels in FSGS (A), in IgAN (B), and MN (C). CASP3 expression correlated to FSTL1 mRNA levels in in FSGS (D), in IgAN (E), and MN (F). CASP8 expression correlated to FSTL1 mRNA levels in in FSGS (G), in IgAN (H), and MN (I). Pearson’s correlation coefficient (r) with two-tailed p values were calculated. Significance was determined as a p value of <0.05. Linear regression generated the line of best fit (solid lines) with 95% confidence intervals (dotted lines).
Ijms 22 09513 g026
Table 1. Clinical characteristic for Alport and wild-type mice.
4 Weeks7 Weeks
WT (n = 8)KO (n = 8)WT (n = 8)KO (n = 8)
Body weight (g)16.63 ± 0.7417.60 ± 0.4621.17 ± 0.5019.51 ± 0.93
LKW(g)/BW (Kg)7.08 ± 0.177.61 ± 0.337.43 ± 0.188.82 ± 0.17
RKW(g)/BW (Kg)7.08 ± 0.177.69 ± 0.317.69 ± 0.078.84 ± 0.21
PCr (μMol/L)16.80 ± 1.3216.00 ± 1.0018.25 ± 1.6535.80 ± 14.06
UalbV (mg/dl)20.45 ± 2.2565.66 ± 6.3320.14 ± 1.45144.31 ± 12.84
Body weight, left kidney weight to body weight ratio, right kidney weight to body weight ratio, protein creatinine, and urinary albumin levels for 4 and 7 week old wild type (WT) and Col4a3-/- (KO) mice (values are mean ± SEM).
Table 2. Demographic and clinical characteristics of patients with FSGS, IgAN, and MN.
ALLFSGSIgANMN
Age38.54 ± 1.36432.62 ± 1.95736.08 ± 2.66450.89 ± 1.792
Sex (male/female)(133/78)(66/45)(28/11)(39/22)
BMI28.51 ± 0.493827.39 ± 0.728428.24 ± 0.930830.72 ± 0.8484
Sitting Systolic123.6 ± 1.209122.7 ± 1.558123.1 ± 2.67125.5 ± 2.575
Sitting Diastolic76 ± 0.859274.96 ± 1.21275.85 ± 1.93677.97 ± 1.557
Hematocrit %39.08 ± 0.38938.83 ± 0.563538.54 ± 0.898739.88 ± 0.654
eGFR74.06 ± 2.21472.93 ± 3.24767.46 ± 5.55980.32 ± 3.255
Centrally measured timed urine protein243.8 ± 23.2199.3 ± 27.74119.9 ± 18.73385.6 ± 52.7
Centrally measured timed urine creatinine69.01 ± 3.53669.07 ± 5.28662.35 ± 5.86972.86 ± 6.701
Centrally measured timed urine albumin1778 ± 1691492 ± 208.3927 ± 146.72737 ± 382
Interstitial fibrosis (%)18.71 ± 1.65820.98 ± 2.49620.65 ± 3.15512.38 ± 2.179
Tubular atrophy (%)17.48 ± 1.65419.44 ± 2.48919.62 ± 3.17511.71 ± 2.22
Patient reached ESKD or 40% loss of eGFR (and eGFR<90)50271013
FSGS, focal segmental glomerulosclerosis; IgAN, IgA nephropathy; MN, membranous glomerulonephropathy. BMI, body mass index; eGFR, estimated glomerular filtration rate. Values are mean ± SEM.
Table 3. Multiple linear regression analysis of FSTL1 expression.
Model: y = β0 + β1x1 + β2x2 + β3x3 + β4x4 + β5x5 + β6x6
PredictorCoefficientEstimateStandard Errort-Statisticp-Value
FSTL1β04.09030.43919.3144<0.001
Ageβ1−0.00990.0029−3.41470.0008
Sexβ20.09760.10780.90540.3667
BPSSβ30.00350.00410.86160.3903
BPSDβ4−0.00310.0057−0.55220.5817
eGFRβ5−0.01340.0018−7.4402<0.001
UPCRβ60.0710.01315.4027<0.001
Age; Sex; Systolic, sitting systolic blood pressure; Diastolic, sitting diastolic blood pressure; eGFR, estimated glomerular filtration rate; UPCR, centrally measured timed urinary protein creatinine ratio.
Table 4. FSTL1 quartile expression. Baseline FSTL1 mRNA levels divided into quartiles.
Quartile Analysis
Quartile1234
Percentage (%)18%22%18%38%
n9/4911/499/4918/48
Range1.6–2.72.7–3.13.1–3.73.7–5.6
The number (n) and percentage of patients in each FSTL1 quartile that reached the composite endpoint. The composite end point has two components: End Stage Kidney Failure (ESKD) or a 40 percent decrease in eGFR compared to baseline eGFR (with a baseline eGFR < 90 mls/min).
Publisher’s Note: MDPI stays neutral with regard to jurisdictional claims in published maps and institutional affiliations.

