Article

Selection and Validation of Candidate Reference Genes for Gene Expression Analysis by RT-qPCR in Rubus

1
Jiangsu Key Laboratory for the Research and Utilization of Plant Resources, Institute of Botany, Jiangsu Province and Chinese Academy of Sciences, The Jiangsu Provincial Platform for Conservation and Utilization of Agricultural Germplasm, Qian Hu Hou Cun No. 1, Nanjing 210014, China
2
Co-Innovation Center for Sustainable Forestry in Southern China, College of Forestry, Nanjing Forestry University, 159 Longpan Road, Nanjing 210037, China
*
Authors to whom correspondence should be addressed.
Int. J. Mol. Sci. 2021, 22(19), 10533; https://doi.org/10.3390/ijms221910533
Submission received: 25 August 2021 / Revised: 19 September 2021 / Accepted: 27 September 2021 / Published: 29 September 2021
(This article belongs to the Special Issue Tree Genetic Engineering, Genome Editing and Genomics)

Abstract

:
Due to the lack of effective and stable reference genes, studies on functional genes in Rubus, a genus of economically important small berry crops, have been greatly limited. To select the best internal reference genes of different types, we selected four representative cultivars of blackberry and raspberry (red raspberry, yellow raspberry, and black raspberry) as the research material and used RT-qPCR technology combined with three internal stability analysis software programs (geNorm, NormFinder, and BestKeeper) to analyze 12 candidate reference genes for the stability of their expression. The number of most suitable internal reference genes for different cultivars, tissues, and fruit developmental stages of Rubus was calculated by geNorm software to be two. Based on the results obtained with the three software programs, the most stable genes in the different cultivars were RuEEF1A and Ru18S. Finally, to validate the reliability of selected reference genes, the expression pattern of the RuCYP73A gene was analyzed, and the results highlighted the importance of appropriate reference gene selection. RuEEF1A and Ru18S were screened as reference genes for their relatively stable expression, providing a reference for the further study of key functional genes in blackberry and raspberry and an effective tool for the analysis of differential gene expression.

1. Introduction

Blackberry and raspberry are important members of the genus Rubus, which belongs to Rosaceae, a moderately large family, with an estimated 85 genera and more than 2000 sexual species [1]. At present, there are many excellent cultivars of blackberry and raspberry worldwide with different fruit colors, such as yellow, red, and black. Blackberry and raspberry fruits are rich in anthocyanins, organic acids, dietary fiber, vitamins, and minerals [1,2]. They also have antioxidant, anticancer, and anti-cardiovascular medicinal properties [3]. With increasing attention given to healthy diets, blackberry and raspberry fruits have shown broad developmental prospects because of their unique flavor and medicinal effects [4,5].
Quantitative real-time fluorescent polymerase chain reaction (RT-qPCR) is a commonly used method for the determination of gene expression and has been widely used in disease diagnosis and detection, drug development, and scientific research [6,7,8,9]. This method has many advantages, such as quantitative accuracy, repeatability, and high sensitivity [7,9]. When RT-qPCR is used to calculate the relative expression level of target genes (data standardization processing), it is necessary to combine relatively stable reference genes for correction and homogenization to improve the accuracy of quantitative results [8,10]. The commonly used reference genes are usually stable housekeeping genes, which are expressed in all kinds of cells and code for proteins necessary to maintain the basic biological activities of cells, for example, the 18S gene, the most abundant ribosomal RNA in eukaryotic organisms, EEF1A and EEF1B proteins of the elongation factor 1 (EEF1) gene family in eukaryotes, polyubiquitin (UBC), ubiquitin (UBQ), F-box family protein (F-box) and actin (ACT) [11,12]. Ideal reference genes require relatively constant expression under different treatments, in different tissues or organs, and at different developmental stages of cells. However, studies have shown that in actual experiments, no reference genes can be expressed stably under all conditions [7,8,13]. If unscreened reference genes are used, experimental data will be biased, and the reliability of target gene expression results will be affected. Therefore, reference genes with relatively stable expression should be screened according to specific experimental materials and conditions.
In recent years, studies on internal reference gene screening for different species, cultivars, and tissues have been developed. The most appropriate internal reference genes have been selected from fruit plants such as strawberry [6], blueberry [8], and pear [9] for mechanistic studies of growth and development, fruit ripening, and stress responses. However, there is no report on internal reference gene screening related to blackberry and raspberry. With the development of transcriptome sequencing technology, genes related to anthocyanin synthesis, hormone signal transduction, and metabolic pathways in Rubus plants have been mined based on transcriptome data. None of the above studies carried out the functional verification of related genes among different cultivars. Therefore, in this study, based on blackberry transcriptome sequencing data, predicted coding DNA sequence (CDS) data, and other information, 12 genes were chosen as candidate reference genes. The RT-qPCR technique was used to detect the expression level of candidate internal reference genes in different organs and fruit different development stages of Rubus. Then, geNorm, NormFinder, and BestKeeper software programs were used for a comprehensive analysis of the expression stability of the candidate genes. The aims of this study were to (i) evaluate the expression stability of 12 candidate reference genes, and (ii) screen/select the most stable internal reference genes expressed in different cultivars of Rubus (blackberry and raspberry), and different tissues/organs and fruit development stages, to provide the reference basis for the further study of fruit development and key functional genes in blackberry and raspberry.

2. Results

2.1. Selection and Expression Levels of Reference Genes

In this study, 12 genes (Ru18S, Ru30S, Ru40S, RuTUBA, RuEEF1A, RuEEF1B, RuEF4A, RuF-box, RuUBC, RuUBQ, RuPA, and RuPGK) were selected as candidate reference genes. The primer annealing temperature was between 60 °C and 61 °C, and the amplification product length was between 72 bp (RuF-box) and 193 bp (RuEEF1B) (Table 1). The green fruits, immature fruits and mature fruits, leaves, stems, and stem apexes of raspberry and blackberry were used as templates to amplify different candidate reference genes. The specificity of the primers was evaluated by the RT-qPCR solution curve, and the results showed that all the target reference genes had a specific single peak; that is, all the primers had good specificity and could be used for the RT-qPCR analysis of gene expression. The expression level analysis of 12 candidate reference genes showed significant differences in cycle threshold (Ct) values among all 72 samples, and there were also differences in Ct values of internal reference genes between different cultivars of raspberry and blackberry (Figure 1). For all samples, the Ct values ranged from 22.101 to 31.549, with a mean of 25.453. The ranges of RuEEF1A (24.607–25.381) and Ru18S (23.037–23.893) gene expressions were smallest, and the ranges of RuPA (22.322–29.277) and RuPGK (22.249–28.238) gene expressions were largest.

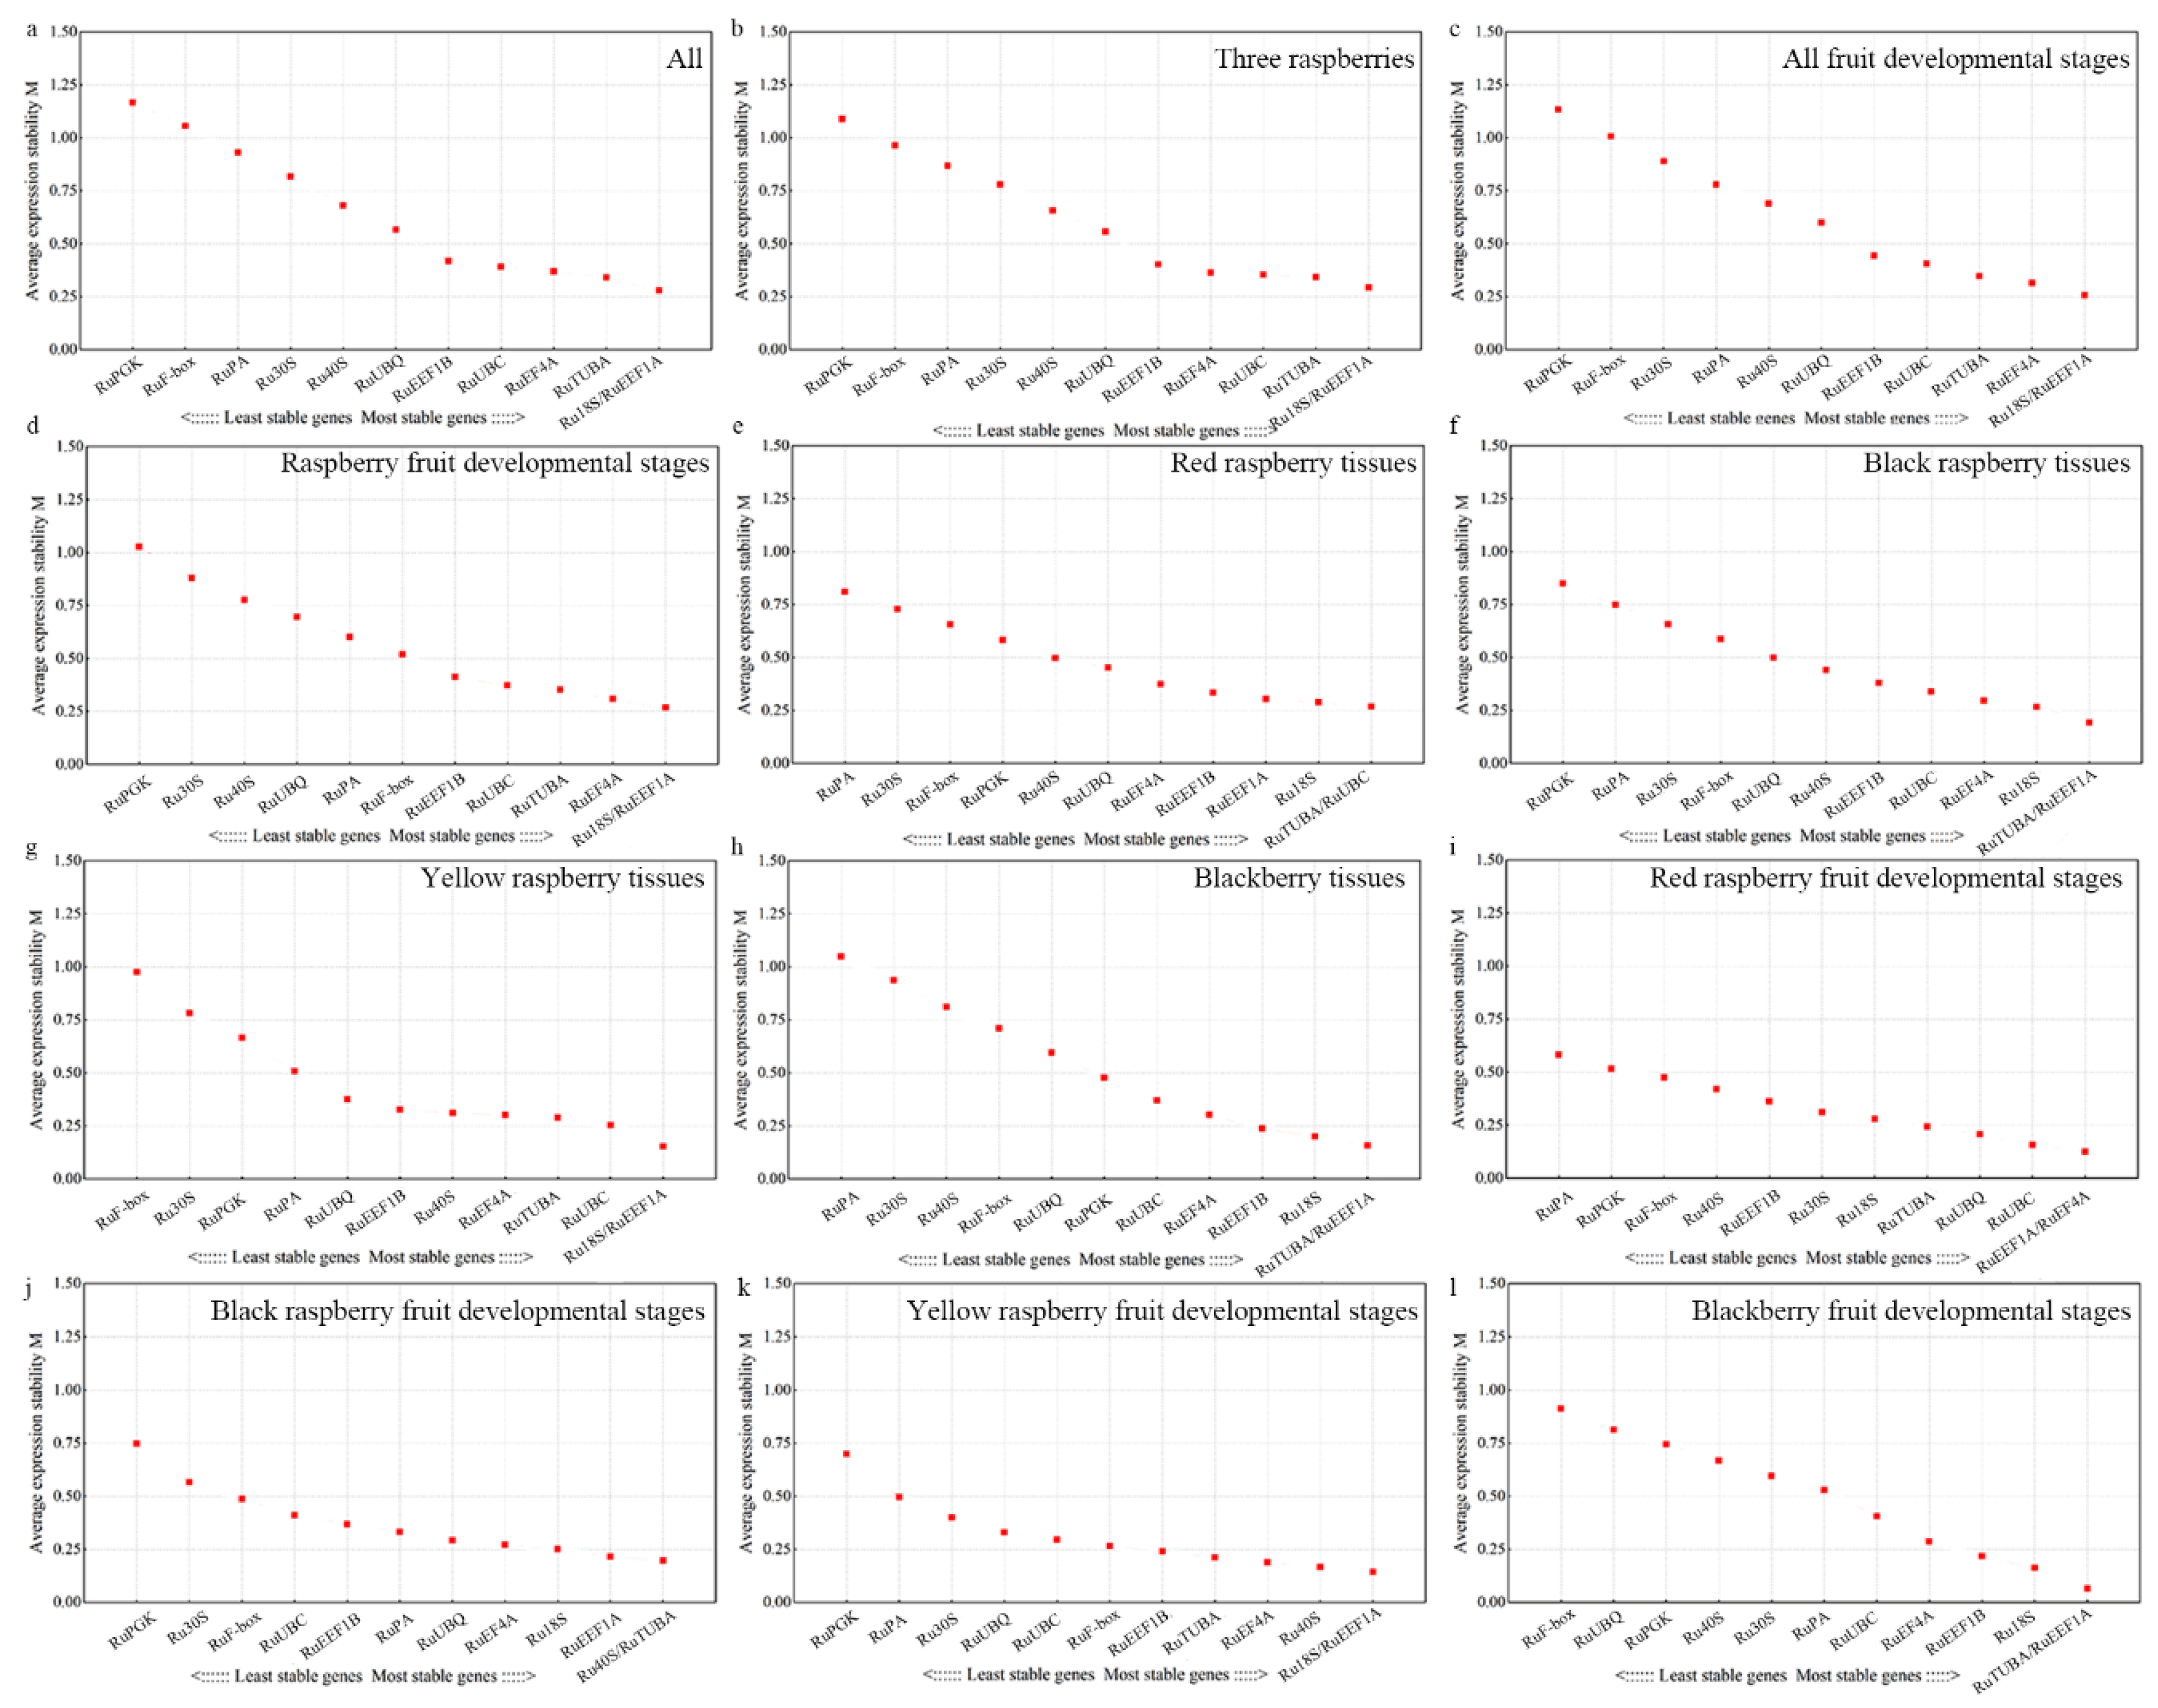
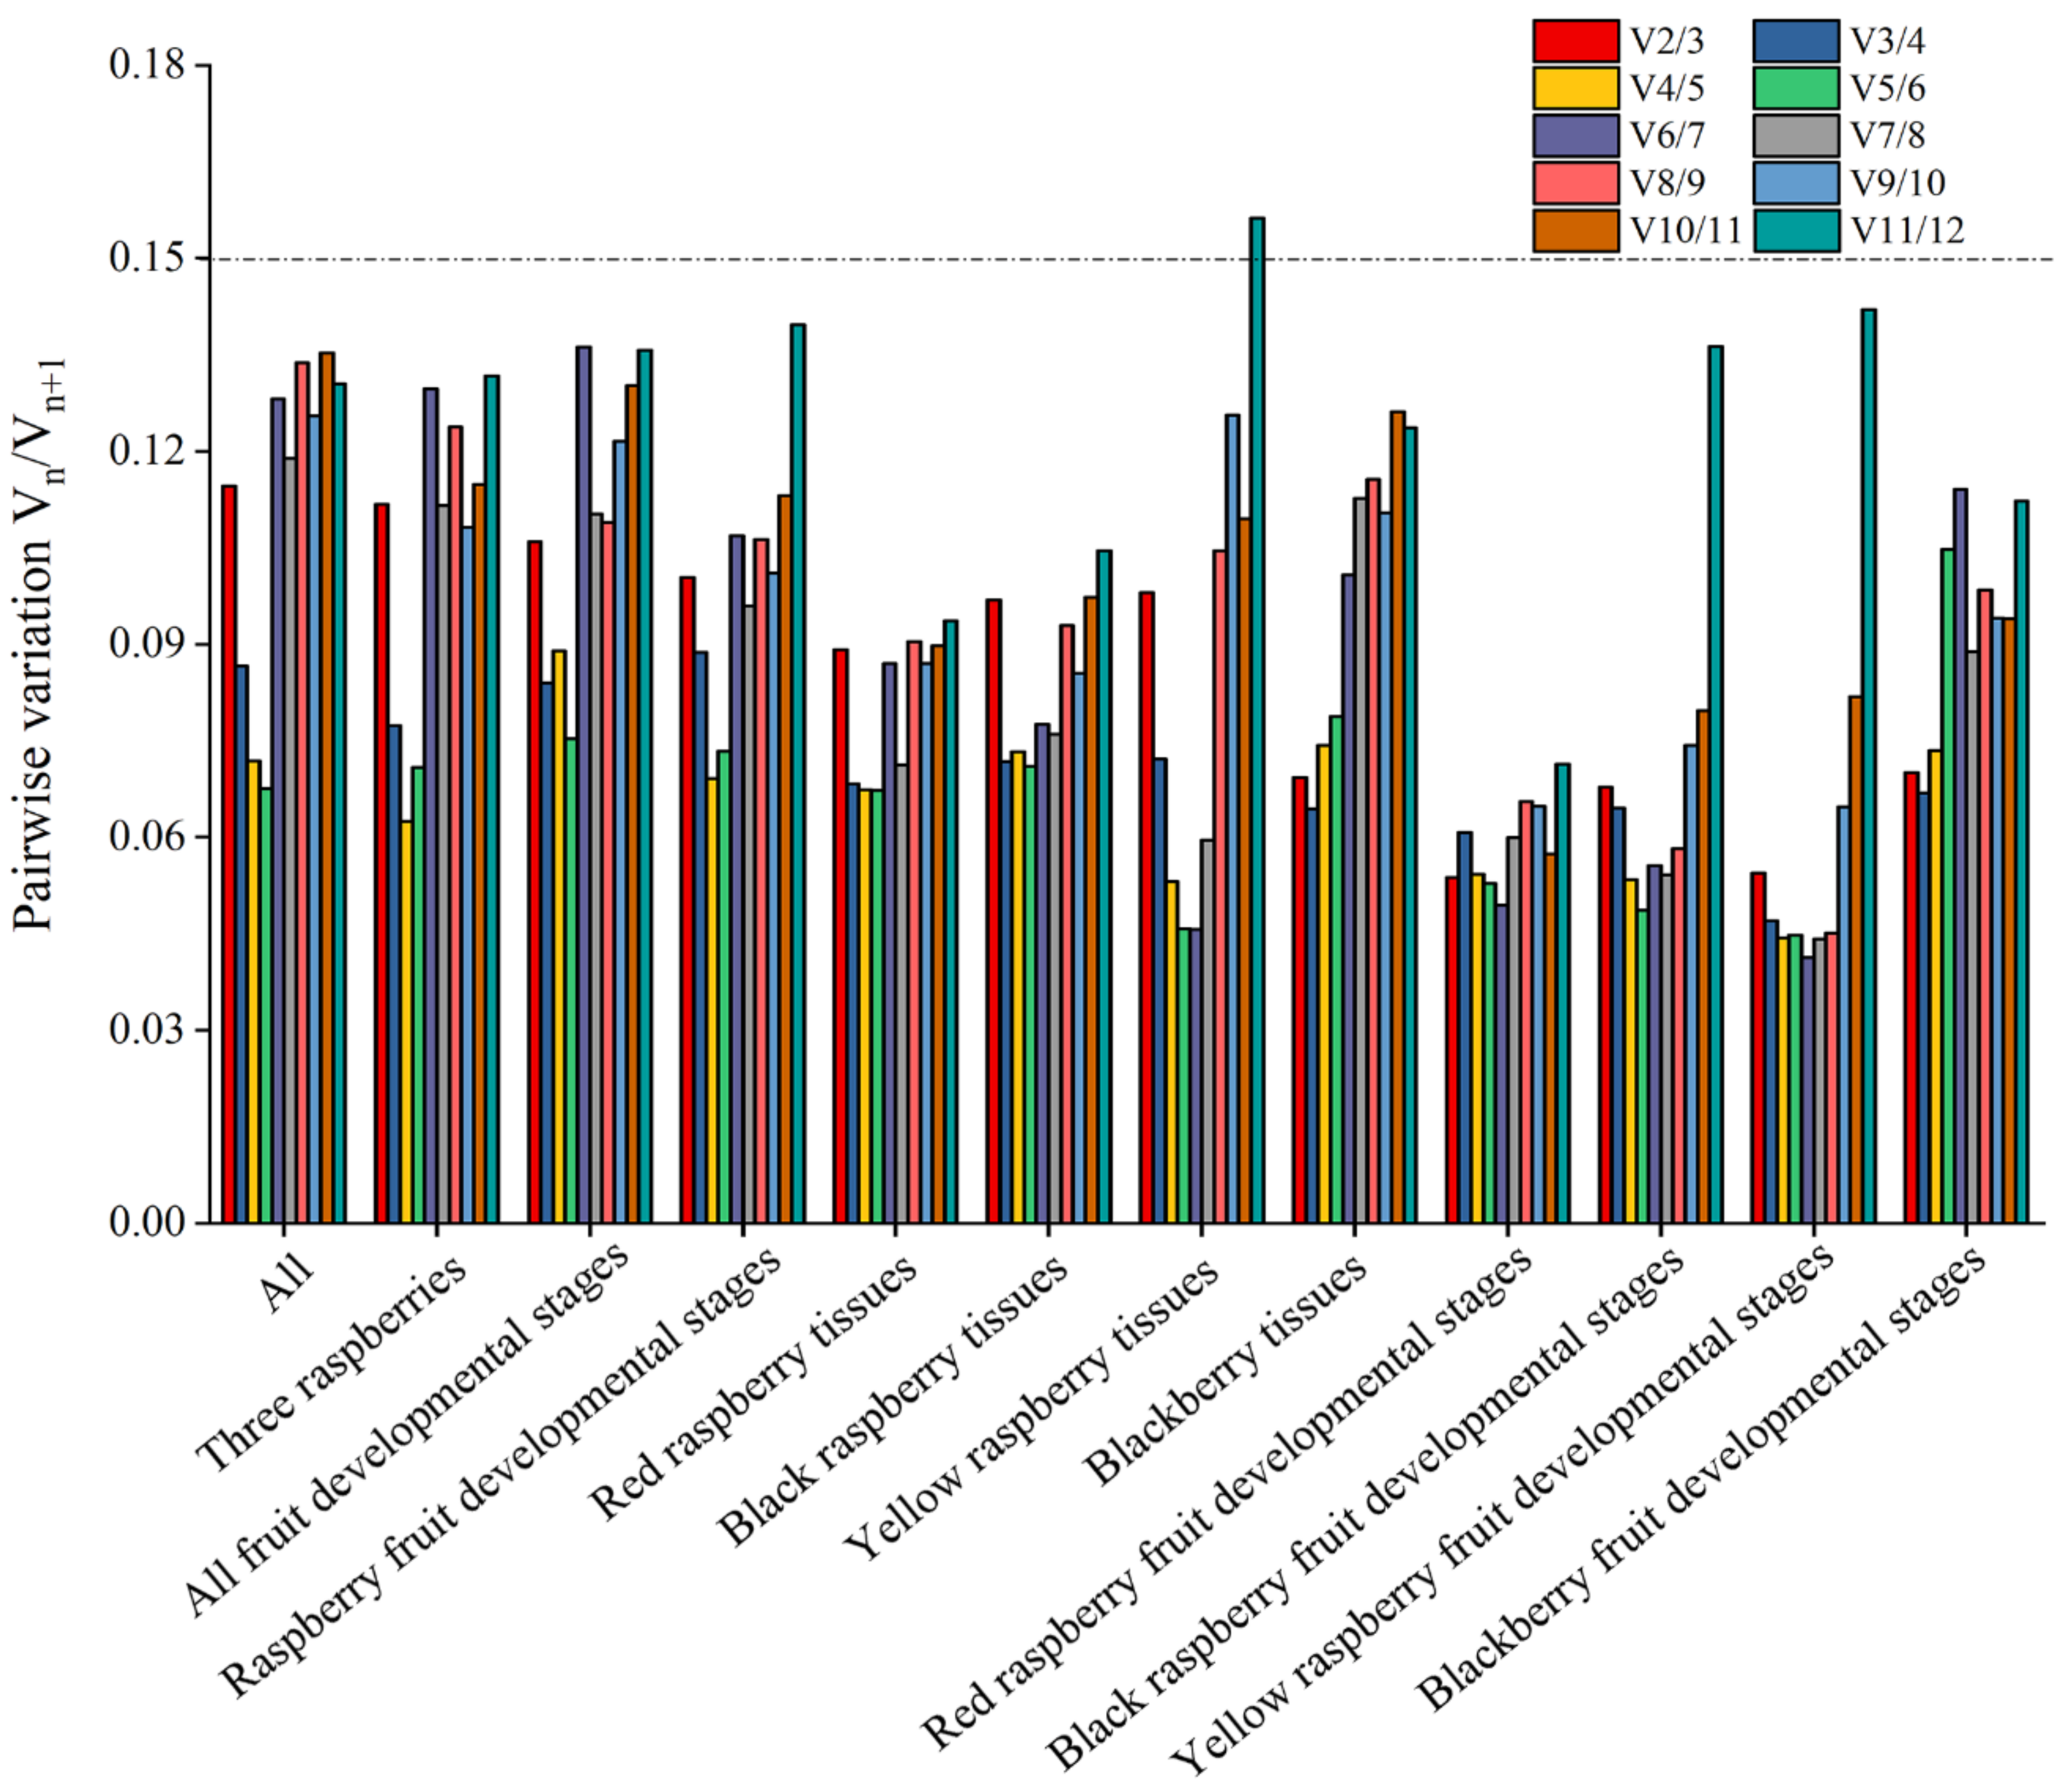
2.2. Estimation of Stability by geNorm Analysis

The geNorm software algorithm uses the mean expression stability measurement (M) value and paired variation (V) value of standardized factors to determine the stability of candidate reference genes and the number of suitable internal reference genes. An M value less than 1.5 indicates that the gene is suitable for internal reference; otherwise, it is not suitable for internal reference. The lower the value of M, the more stable the expression of reference genes. In all 72 samples, Ru18S and RuEEF1A were the most stable reference genes, followed by RuTUBA and RuEF4A (Figure 2a). Moreover, Ru18S and RuEEF1A were the most stable genes among the three raspberry cultivars, all fruit developmental stages, raspberry fruit developmental stages, yellow raspberry tissues, and fruit developmental stages (Figure 2b–d,g,k). RuTUBA and RuEEF1A were the most stable in the blackberry tissues and fruit developmental stages (Figure 2h,l). The most stable reference genes in the black raspberry tissues, red raspberry tissues, and red raspberry fruit developmental stages were RuTUBA/RuUBC, RuTUBA/RuEEF1A, and RuEEF1A/RuEF4A (Figure 2e,f,i), respectively. Interestingly, the M values of all candidate reference genes in black raspberry and red raspberry were less than 1.25.
In addition, the paired variation V value of the normalization factor after the introduction of a new gene can also be calculated in the geNorm program, and the optimal number of internal parameters can be determined according to the value of Vn/Vn + 1. The ratio of V2/3 in all samples was less than the recommended value of 0.15 (Figure 3), indicating that the number of internal reference genes used in the comprehensive analysis of all samples should be at least two. In other experimental groups, V2/3 was also less than 0.15, indicating that the optimal number of reference genes to use was two (Figure 3).

2.3. Estimation of Stability by NormFinder

Similar to geNorm, the stability of each candidate reference gene in NormFinder software is also based on the stability (S) value of candidate reference genes. The lower the S value is, the higher the stability is. In all samples and across all three raspberry and blackberry fruit developmental stages, the candidate Ru18S reference gene was the most stable (Figure 4a,b,i). Among all (raspberry and blackberry) fruit, three raspberries, red raspberry and yellow raspberry fruit developmental stages, the RuEF4A gene was the most stable reference gene (Figure 4c,d,i,k). In the red raspberry tissues and yellow raspberry tissues, the RuUBC gene was the most stable reference gene (Figure 4e,g). In the black raspberry tissues and blackberry tissues, the most stable internal reference gene was RuEEF1A (Figure 4f,h), while in the black raspberry fruit developmental stages, the stability of the internal reference genes was as follows: Ru18S > RuEEF1A > RuEF4A (Figure 4j). In the comprehensive analysis, RuPGK showed the lowest stability, accounting for 7/12 (Figure 4).

2.4. Estimation of Stability by BestKeeper

According to the Ct value of each gene, BestKeeper software directly calculates three variables: the coefficient of variation (CV), standard deviation (SD), and correlation coefficient. In general, stable reference genes have a small SD value, and genes with an SD value greater than 1 are considered unstable genes. The SD value of the RuEEF1A gene among all samples, three raspberries, and all fruit developmental stages, yellow raspberry tissues, blackberry tissues, and blackberry fruit developmental stages, was lowest, so the RuEEF1A reference gene was the most stable among the six groups (Table 2). The stability of the Ru18S gene was highest in four groups (raspberry fruit developmental stages, red raspberry tissues, red raspberry fruit developmental stages, and yellow raspberry fruit developmental stages). In addition, in the black raspberry tissues and black raspberry fruit developmental stages, the stability of the three most stable potential reference genes was in the order RuTUBA > Ru18S > RuEEF1A (Table 2).

2.5. Comprehensive Ranking Analysis

Due to the different principles of the three statistical algorithms (geNorm, NormFinder, and BestKeeper), the results for the most stable reference genes were not completely consistent. To obtain more accurate and reliable analysis results, it is necessary to jointly analyze the ranking results of the three algorithms. Hence, the sum of the gene stability rankings with the three algorithms was used as a new variable, representing the comprehensive evaluation of gene expression stability in this study (Table 3). The smaller the sequence value, the higher the stability of gene expression. The comprehensive analysis showed that the RuEEF1A and Ru18S genes were the most stable internal reference genes among all the samples for the three raspberries, all fruit developmental stages, and yellow raspberry tissues (Table 3). Except for the stability of the Ru18S gene in the fruit developmental stages of red raspberry, in which it ranked fourth, in all other samples, it ranked in the top three.
The RuEEF1A reference gene was the fourth most stable in red raspberry tissue, while in the other groups, it was in the top three. In short, RuPGK was the least stable reference gene, and RuEEF1A and Ru18S were the most stable reference gene combinations in all sample analyses.

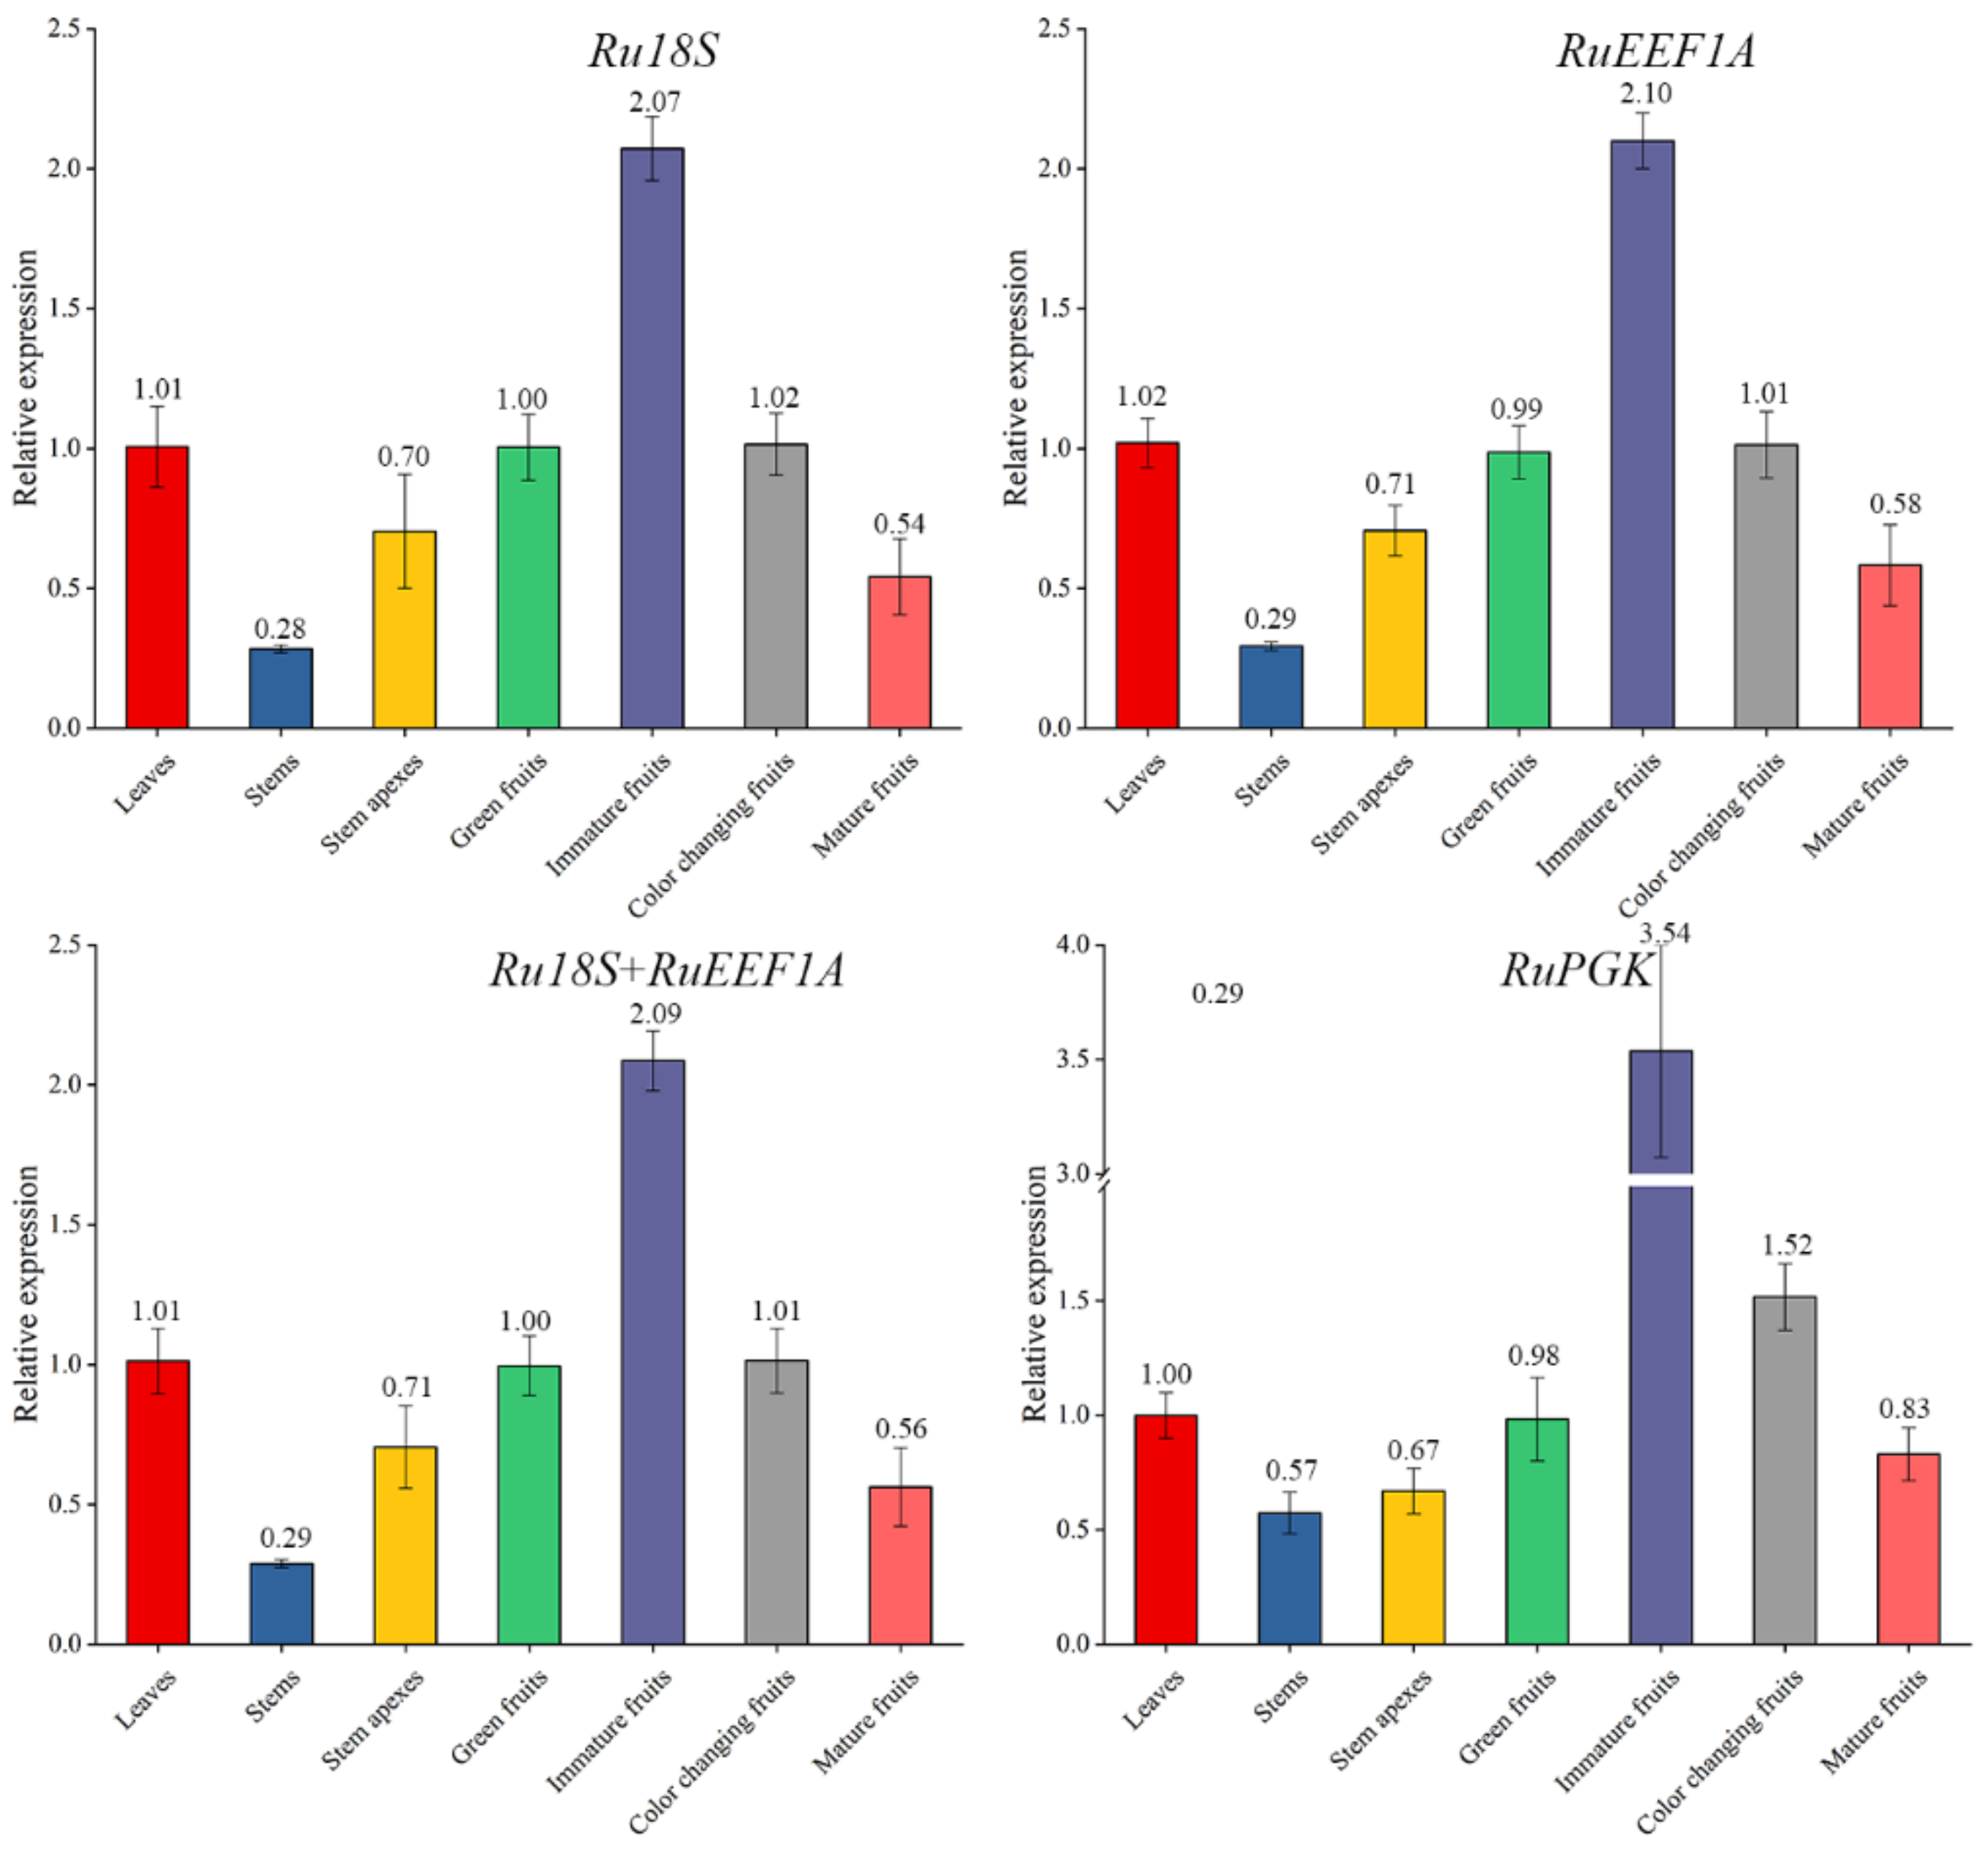
2.6. Validation of the Selected Candidate Reference Genes

According to the transcriptome data of blackberry fruit maturation, we found that the RuCYP73A enzyme gene in the flavonoid biosynthesis pathway was significantly differentially expressed among the fruit developmental stages. Moreover, through our preliminary research analysis, we found that the expression of RuCYP73A was also different in different organs or fruit development stages. Based on this, to validate the reliability of the stable reference genes, the relative expression patterns of the RuCYP73A gene were examined using different combinations of reference genes in different tissues and fruit developmental stages of blackberry. The two most stable reference genes (RuEEF1A and Ru18S) and the least stable reference gene (RuPGK) selected from the analyses described above were used either alone or in combination for RT-qPCR analyses. Although the overall relative expression patterns of the RuCYP73A gene showed similar trends, a difference was observed when the data were normalized to those of the different reference genes (Figure 5). Similar expression patterns were observed when we used the single genes as reference genes. However, when the least stable gene (RuPGK) was used as the reference gene, the expression levels of RuCYP73A showed significant fluctuations, and the expression patterns of green fruits and fruits with changing colors were not consistent with those observed when more appropriate reference genes were used (Figure 5).

3. Discussion

In recent years, with molecular biology methods being applied to various research fields, the study of gene expression and regulatory mechanisms has become a hot spot. RT-qPCR technology has the advantages of high precision, throughput, and sensitivity, and has become an important tool for molecular biology research. The analysis of gene expression by RT-qPCR is an important method commonly used to understand biological regulatory mechanisms [14]. Due to the accuracy of RT-qPCR results being easily affected by sample difference, tissue specificity, extracted RNA quality, and other factors, the expression analysis of genes requires normalization to reference genes [14]. Several studies have shown that the β-actin and glyceraldehyde-3-phosphate dehydrogenase (GAPDH) were selected as the RT-qPCR internal reference genes in Rubus niveus and Rubus idaeus, respectively [15,16]. However, studies on the reference genes of Rubus have not been systematically reported. In this study, 12 commonly used candidate reference genes were screened based on transcriptome data to study the internal reference genes of raspberry and blackberry in different organs and at different fruit developmental stages. The results showed that the RuEEF1A and Ru18S genes had the highest stability and were the most suitable reference genes of Rubus, laying the foundation for gene expression analysis and functional studies of blackberry and raspberry in the future.
The key to the standardization of gene expression levels is to screen suitable reference genes. An internal reference gene is a gene that is relatively stable in organisms regardless of changes in conditions or different tissues or parts [17,18]. Ideal reference genes are usually characterized by stable expression under different physiological conditions [18,19]. Unfortunately, the expression of each gene is affected by a variety of factors and varies under different experimental conditions or in different tissues [19,20]. The selection of reference genes is not universal. It is important to screen reference genes with relatively stable expression under specific experimental conditions [21]. Common reference genes may be involved in important components of the cytoskeleton (TUA and TUB) or in basic biochemical metabolic processes in organisms (UBQ) [22] and are relatively stable in corresponding tissues and organs [23,24]. Brunner et al. [25] analyzed the expression stability of 10 reference genes in different tissues of poplar and found that UBQ was the gene with the highest expression stability among all materials. The results of this study are different, and the stability of reference genes is different in different species. In addition, 18S ribosomal RNA is the most abundant ribosomal RNA in eukaryotic organisms and is often used to analyze internal genes. This study concluded that the 18S expression was relatively stable for blackberry and raspberry internal genes. As a component of chloroplast ribosomes, 30S was preferred as a stable internal parameter at different developmental stages of different tissues and seeds of the oil crop Plukenetia volubilis, but its expression was most unstable during flower development [26]. As a component of the eukaryotic ribosomal subunit, the 40S ribosomal RNA was the most stable gene in all samples of Tuber melanosporum during development [27]. The 30S and 40S genes in this study showed moderate stability and were not the most stable reference genes. Therefore, the expression stability of the same reference gene is different among different species.
GeNorm [28], BestKeeper [29], NormFinder, the ΔCt [30] approach, and the stability index [25], in addition to other mathematical methods, have been used to assess the stability of internal genes [31]. The GeNorm and NormFinder algorithms are similar in that geNorm selects a pair of optimal reference genes under different conditions, rather than a single gene [32], while NormFinder only selects a relatively appropriate reference gene [33]. In contrast to the former two, BestKeeper determines relatively stable genes by directly calculating Ct values [34]. Due to the analysis software programs having different screening principles and emphases, the internal reference genes will be different. Therefore, the stability of internal reference genes was evaluated by the comprehensive use of geNorm, BestKeeper, and NormFinder in this study. The ranking values of the 12 candidate internal reference genes with the three statistical algorithms were added, and the sum was used as a new variable, representing the comprehensive evaluation of gene expression stability. The smaller the sequence value, the higher the stability of gene expression. In the study of gene expression analysis, using a single internal reference gene for correction and standardization sometimes cannot meet the experimental requirements and ensure the accuracy of the experimental results. Therefore, to reduce various errors in the experiment, it is necessary to introduce two or more internal reference genes for standardized correction [12]. Through comprehensive evaluation combined with validation analysis, RuEEF1A and Ru18S were identified as relatively suitable reference genes. The EEF1A and 18S genes have not previously been used as reference genes for raspberry and blackberry, which further illustrates the importance of this study. However, several studies have shown that Ru18S is not a suitable reference gene for Stevia rebaudiana [35] and Zanthoxylum bungeanum [36], again demonstrating that the reference genes are different in different species.

4. Material and Methods

4.1. Plant Materials

The yellow raspberry cultivar ‘Colde Summit,’ red raspberry cultivar ‘Heritage,’ black raspberry cultivar ‘Bristol,’ and blackberry cultivar ‘Chester’ were used as the experimental materials. The green fruits, immature fruits and mature fruits, leaves, stems, and stem apexes were collected and stored in dry ice immediately. After that, these materials were placed in an ultralow-temperature refrigerator at −80 °C until RNA extraction. There were 3 biological replicates per sample. Blackberry and raspberry plants were grown at the test base of Nanjing Lishui White Horse Industrial Park, Institute of Botany, Jiangsu Province and the Chinese Academy of Sciences. These Rubus plants grow in the Lishui area (Nanjing, Jiangsu, China) (119°09′ E, 31°35′ N) with mild and humid climate, sufficient light, and simultaneous rain and heat. The specific climatic conditions are an annual average temperature of 16.4 °C, annual average relative humidity of 76%, annual average precipitation of 1204.3 mm, annual average rainy days of 123 days, and annual average sunshine of 1980 h.

4.2. Primer Design for Candidate Reference Genes

According to the transcriptome sequencing data of blackberry (accession number: PRJNA680622), 12 genes were selected as candidate reference genes based on the CDS results of annotation information from the NCBI Nr database, namely, 18S ribosomal RNA (Ru18S), 30S ribosomal RNA (Ru30S), 40S ribosomal RNA (Ru40S), tubulin alpha chain-like protein (RuTUBA), elongation factor 1-alpha (RuEEF1A), elongation factor 1-beta (RuEEF1B), eukaryotic initiation factor 4A (RuEF4A), F-box family protein (RuF-box), polyubiquitin (RuUBC), ubiquitin (RuUBQ), phospholipase A (RuPA), and phosphoglycerate kinase (RuPGK). The primers used for RT-qPCR were designed using Oligo 6.0 software (Table 1). The annealing temperature was between 60 and 61 °C, and the primers were sent to Nanjing TSINGKE Biological Technology Co., Ltd., for synthesis.

4.3. Total RNA Extraction and cDNA Synthesis

RNA was extracted from different cultivars and tissues and at different fruit developmental stages from blackberry and raspberry according to the instructions of the Plant Total RNA Extraction Kit (Bioteke, Beijing, China). RNA quality was detected by 1.5% (w/v) agarose gel electrophoresis, and RNA concentration and purity were detected by a NanoDrop 2000 (Thermo, Waltham, USA). Total RNA (1 µg) from each sample was reverse-transcribed into cDNA using a PrimeScript RT kit (Takara, Dalian, China) according to the instructions. The obtained cDNA was diluted 5 times and stored in a −20 °C refrigerator for subsequent RT-qPCR experiments.

4.4. RT-qPCR Amplification

TB Green Premix Ex Taq II (Tli RNaseH Plus) (Takara, Dalian, China) was used for RT-qPCR. The system was 20 µL in total and contained 10 µL of TB Green Premix, 0.6 µL of upstream and downstream primers (10 µmol/L), 0.6 μL of Rox Reference Dye II, 1.5 μL of cDNA template, and ddH2O to the final volume. The ABI Viia 7 real-time PCR Platform was used. The reaction procedures were as follows: (i) holding stage: predenaturation at 95 °C for 30 s; (ii) PCR stage: 40 cycles were performed at 95 °C for 3 s and 60 °C for 30 s; (iii) melt curve stage (at the end of the amplification reaction, the product specificity was detected by the melt curve): 95 °C for 15 s, 60 °C for 60 s, and 95 °C for 15 s.

4.5. Data Processing and Analysis

The RT-qPCR data (all sample cycle thresholds, Ct values) of different cultivars, tissues, and fruit developmental stages of blackberry and raspberry were collated and summarized by Excel 2013 software. Under the precondition that the algorithm principles were strictly followed, the reference gene stability analysis software programs geNorm [28], BestKeeper [37], and NormFinder [29] were used to evaluate the expression stability of different reference genes in blackberry and raspberry. In brief, geNorm software was used to calculate the M value based on the pairwise variation between two reference genes, and the genes with the lowest expression stability were gradually eliminated. If the M value is less than 1.5, it can be considered as an internal reference gene. The smaller the M value, the higher the stability. GeNorm software determined the number of ideal candidate reference genes by calculating the V value of pairing variation. The default V value is 0.15; when Vn/n + 1 is less than 0.15, the number of internal reference genes of RT-qPCR should be n without introducing n + 1, to determine the optimal number of required internal reference genes [28]. NormFinder calculated the S value for reference genes according to variance analysis, and the smaller S is, the higher the stability [29]. BestKeeper evaluated the expression stability of all candidate reference genes by calculating the SD and CV of the original Ct values. When the SD is more than 1, the gene cannot be used as an internal reference gene. The lower the SD value, the lower the CV value, and the higher the R value, the more stable the expression of the candidate reference genes [37].

4.6. Validation of Selected Reference Genes

To verify the effect of the selection of different reference genes on the final standardization results, the relative expression level of the RuCYP73A gene in the different tissues and fruit developmental stages of blackberry was analyzed by using a single stably or unstably expressed gene or a combination of stable reference genes. The fold change in gene expression was calculated by the 2−∆∆ct method.

5. Conclusions

We analyzed the expression levels of 12 candidate reference genes in four cultivars of Rubus, blackberry, black raspberry, red raspberry, and yellow raspberry, in different tissues and at different fruit developmental stages. Based on the comprehensive ranking analysis with three statistical algorithms, geNorm, NormFinder, and BestKeeper, it was found that there were differences in the optimal reference gene combinations among experimental groups, which indicated that none of the genes were suitable for use as a normalized reference gene under all the experimental conditions. The expression of the RuEEF1A and Ru18S genes in all the samples was the most relatively stable, and these were the most suitable thermostatic reference genes of blackberry and raspberry, laying a foundation for accurate gene expression analyses in the future. In summary, we recommend the use of at least two internal reference genes in further experiments.

Author Contributions

Y.W. and C.Z. designed the study and performed the experiments; Y.W., H.Y. and L.L. analyzed the data; Y.W. wrote the manuscript; W.W. provided the plants; W.L. and W.W. revised the manuscript. All authors have read and agreed to the published version of the manuscript.

Funding

The research was supported by the National Natural Science Foundation of China (No. 32101566), Natural Science Foundation of Jiangsu Province (No. BK20210165), and Jiangsu Institute of Botany Talent Fund (JIBTF202105).

Institutional Review Board Statement

Not applicable.

Informed Consent Statement

All authors have consented to this publication.

Data Availability Statement

The data and materials supporting the conclusions of this study are included within the article.

Conflicts of Interest

The authors declare no conflict of interest.

References

  1. García-Seco, D.; Zhang, Y.; Gutierrez-Mañero, F.J.; Martin, C.; Ramos-Solano, B. RNA-Seq analysis and transcriptome assembly for blackberry (Rubus sp. Var. Lochness) fruit. BMC Genom. 2015, 16, 5. [Google Scholar] [CrossRef] [PubMed] [Green Version]
  2. Travisany, D.; Ayala-Raso, A.; Di Genova, A.; Monsalve, L.; Bernales, M.; Martínez, J.P.; González-Agüero, M.; Defilippi, B.; Cherian, S.; Maass, A.; et al. RNA-Seq analysis and transcriptome assembly of raspberry fruit (Rubus idaeus ¨Heritage¨) revealed several candidate genes involved in fruit development and ripening. Sci. Hortic. 2019, 254, 26–34. [Google Scholar] [CrossRef]
  3. Zafra-Rojas, Q.Y.; González-Martínez, B.E.; Cruz-Cansino, N.D.S.; López-Cabanillas, M.; Suárez-Jacobo, A.; Cervantes-Elizarrarás, A.; Ramírez-Moreno, E. Effect of Ultrasound on In Vitro Bioaccessibility of Phenolic Compounds and Antioxidant Capacity of Blackberry (Rubus fruticosus) Residues cv. Tupy. Plant Foods Hum. Nutr. 2020, 75, 608–613. [Google Scholar] [CrossRef] [PubMed]
  4. Strik, B.C.; Clark, J.R.; Finn, C.E.; Bañados, M.P. Worldwide Blackberry Production. HortTechnology 2007, 17, 205–213. [Google Scholar] [CrossRef] [Green Version]
  5. Vlad, I.A.; Goji, G.; Dinulică, F.; Bartha, S.; Vasilescu, M.M.; Mihaiescu, T. Consuming Blackberry as a Traditional Nutraceutical Resource from an Area with High Anthropogenic Impact. Forests 2019, 10, 246. [Google Scholar] [CrossRef] [Green Version]
  6. Galli, V.; Borowski, J.M.; Perin, E.C.; Messias, R.D.S.; Labonde, J.; Pereira, I.D.S.; Silva, S.D.D.A.; Rombaldi, C.V. Validation of reference genes for accurate normalization of gene expression for real time-quantitative PCR in strawberry fruits using different cultivars and osmotic stresses. Gene 2015, 554, 205–214. [Google Scholar] [CrossRef]
  7. Lin, Y.; Zhang, A.; Yang, S.; Huang, L. Reference gene selection for real-time quantitative PCR normalization in Hemarthria compressa and Hemarthria altissima leaf tissue. Mol. Biol. Rep. 2019, 46, 4763–4769. [Google Scholar] [CrossRef]
  8. Deng, Y.; Li, Y.; Sun, H. Selection of reference genes for RT-qPCR normalization in blueberry (Vaccinium corymbosum × angustifolium) under various abiotic stresses. FEBS Open Bio 2020, 10, 1418–1435. [Google Scholar] [CrossRef]
  9. Chen, C.; Yuan, M.; Song, J.; Liu, Y.; Xia, Z.; Yuan, Y.; Wang, W.; Xie, Q.; Guan, X.; Chen, Q.; et al. Genome-wide identification and testing of superior reference genes for transcript normalization during analyses of flesh development in Asian pear cultivars. Sci. Hortic. 2020, 271, 109459. [Google Scholar] [CrossRef]
  10. Joseph, J.T.; Poolakkalody, N.J.; Shah, J.M. Plant reference genes for development and stress response studies. J. Biosci. 2018, 43, 173–187. [Google Scholar] [CrossRef]
  11. Hwang, J.; Oh, C.-S.; Kang, B.-C. Translation elongation factor 1B (eEF1B) is an essential host factor for Tobacco mosaic virus infection in plants. Virology 2013, 439, 105–114. [Google Scholar] [CrossRef] [PubMed] [Green Version]
  12. Mo, J.; Xu, J.; Jin, W.; Yang, L.; Yin, T.; Shi, J. Identification of Reference Genes for Quantitative Gene Expression Studies in Pinus massoniana and Its Introgression Hybrid. Forests 2019, 10, 787. [Google Scholar] [CrossRef] [Green Version]
  13. Karuppaiya, P.; Yan, X.-X.; Liao, W.; Wu, J.; Chen, F.; Tang, L. Identification and validation of superior reference gene for gene expression normalization via RT-qPCR in staminate and pistillate flowers of Jatropha curcas—A biodiesel plant. PLoS ONE 2017, 12, e0172460. [Google Scholar] [CrossRef]
  14. Bustin, S.A.; Benes, V.; Garson, J.; Hellemans, J.; Huggett, J.; Kubista, M.; Mueller, R.; Nolan, T.; Pfaffl, M.; Shipley, G.L.; et al. The MIQE Guidelines: Minimum Information for Publication of Quantitative Real-Time PCR Experiments. Clin. Chem. 2009, 55, 611–622. [Google Scholar] [CrossRef] [Green Version]
  15. Chiluisa-Utreras, V.; Vaca, I.; Chicaiza, O.; Peñaherrera, S. Analysis of the expression of β-actin, RuANS and RuMYB10 genes involved in the biosynthesis of anthocyanin using RT-qPCR in Rubus niveus in the Rumiñahui Canton. J. Berry Res. 2017, 7, 195–201. [Google Scholar] [CrossRef] [Green Version]
  16. Gotame, T.P.; Cullen, D.W.; Graham, J.; Hedley, P.E.; Smith, K.; Morris, J.; Andersen, L.; Petersen, K.K. Effect of short-term exposure to high-temperature on total gene expression in the leaves of four raspberry (Rubus idaeus L.) cultivars. J. Hortic. Sci. Biotech. 2014, 89, 532–541. [Google Scholar] [CrossRef]
  17. Jain, N.; Vergish, S.; Khurana, J.P. Validation of house-keeping genes for normalization of gene expression data during diurnal/circadian studies in rice by RT-qPCR. Sci. Rep. 2018, 8, 3203. [Google Scholar] [CrossRef] [Green Version]
  18. Shabrangy, A.; Roustan, V.; Reipert, S.; Weidinger, M.; Roustan, P.-J.; Stoeger, E.; Weckwerth, W.; Ibl, V. Using RT-qPCR, Proteomics, and Microscopy to Unravel the Spatio-Temporal Expression and Subcellular Localization of Hordoindolines Across Development in Barley Endosperm. Front. Plant Sci. 2018, 9, 775. [Google Scholar] [CrossRef]
  19. Kumar, D.; Das, P.K.; Sarmah, B.K. Reference gene validation for normalization of RT-qPCR assay associated with germination and survival of rice under hypoxic condition. J. Appl. Genet. 2018, 59, 419–430. [Google Scholar] [CrossRef] [Green Version]
  20. Hernandez, P.F.V.; Núñez, M.M.; Rivas, M.R.; Portillo, R.E.V.; Bibbins-Martínez, M.D.; Suárez, S.L.; Cárdenas, F.F.R. Reference genes for RT-qPCR normalisation in different tissues, developmental stages and stress conditions of amaranth. Plant Biol. 2018, 20, 713–721. [Google Scholar] [CrossRef]
  21. Sun, H.; Jiang, X.; Sun, M.; Cong, H.; Qiao, F. Evaluation of reference genes for normalizing RT-qPCR in leaves and suspension cells of Cephalotaxus hainanensis under various stimuli. Plant Methods 2019, 15, 31. [Google Scholar] [CrossRef] [PubMed] [Green Version]
  22. Huggett, J.F.; Dheda, K.; Bustin, S.; Zumla, P.S.A. Real-time RT-PCR normalisation; strategies and considerations. Genes Immun. 2005, 6, 279–284. [Google Scholar] [CrossRef] [PubMed] [Green Version]
  23. Takamori, L.M.; Pereira, A.V.C.; Souza, G.M.; Vieira, L.G.E.; Ribas, A.F. Identification of Endogenous Reference Genes for RT-qPCR Expression Analysis in Urochloa brizantha Under Abiotic Stresses. Sci. Rep. 2017, 7, 8502. [Google Scholar] [CrossRef] [PubMed]
  24. Zhou, L.; Niu, J.; Quan, S. Identification of appropriate reference genes for RT-qPCR analysis in Juglans regia L. PLoS ONE 2018, 13, e0209424. [Google Scholar] [CrossRef] [PubMed]
  25. Brunner, A.M.; Yakovlev, I.A.; Strauss, S.H. Validating internal controls for quantitative plant gene expression studies. BMC Plant Biol. 2004, 4, 14. [Google Scholar] [CrossRef] [Green Version]
  26. Niu, L.; Tao, Y.-B.; Chen, M.-S.; Fu, Q.; Li, C.; Dong, Y.; Wang, X.; He, H.; Xu, Z.-F. Selection of Reliable Reference Genes for Gene Expression Studies of a Promising Oilseed Crop, Plukenetia volubilis, by Real-Time Quantitative PCR. Int. J. Mol. Sci. 2015, 16, 12513–12530. [Google Scholar] [CrossRef] [Green Version]
  27. Zarivi, O.; Cesare, P.; Ragnelli, A.M.; Aimola, P.; Leonardi, M.; Bonfigli, A.; Colafarina, S.; Poma, A.M.; Miranda, M.; Pacioni, G. Validation of reference genes for quantitative real-time PCR in Périgord black truffle (Tuber melanosporum) developmental stages. Phytochemistry 2015, 116, 78–86. [Google Scholar] [CrossRef]
  28. Vandesompele, J.; De Preter, K.; Pattyn, F.; Poppe, B.; Van Roy, N.; De Paepe, A.; Speleman, F. Accurate normalization of real-time quantitative RT-PCR data by geometric averaging of multiple internal control genes. Genome Biol. 2002, 3, 1–12. [Google Scholar] [CrossRef] [Green Version]
  29. Andersen, C.L.; Jensen, J.L.; Ørntoft, T.F. Normalization of Real-Time Quantitative Reverse Transcription-PCR Data: A Model-Based Variance Estimation Approach to Identify Genes Suited for Normalization, Applied to Bladder and Colon Cancer Data Sets. Cancer Res. 2004, 64, 5245–5250. [Google Scholar] [CrossRef] [Green Version]
  30. Silver, N.; Best, S.; Jiang, J.; Thein, S.L. Selection of housekeeping genes for gene expression studies in human reticulocytes using real-time PCR. BMC Mol. Biol. 2006, 7, 33. [Google Scholar] [CrossRef] [Green Version]
  31. Shi, X.-Q.; Guo, W.-C.; Wan, P.-J.; Zhou, L.-T.; Ren, X.-L.; Ahmat, T.; Fu, K.-Y.; Li, G.-Q. Validation of reference genes for expression analysis by quantitative real-time PCR in Leptinotarsa decemlineata (Say). BMC Res. Notes 2013, 6, 93. [Google Scholar] [CrossRef] [Green Version]
  32. Zhang, J.; Xie, W.; Yu, X.; Zhang, Z.; Zhao, Y.; Wang, N.; Wang, Y. Selection of Suitable Reference Genes for RT-qPCR Gene Expression Analysis in Siberian Wild Rye (Elymus sibiricus) under Different Experimental Conditions. Genes 2019, 10, 451. [Google Scholar] [CrossRef] [PubMed] [Green Version]
  33. Ruduś, I.; Kępczyński, J. Reference gene selection for molecular studies of dormancy in wild oat (Avena fatua L.) caryopses by RT-qPCR method. PLoS ONE 2018, 13, e0192343. [Google Scholar] [CrossRef] [PubMed] [Green Version]
  34. Hossain, S.; Ahmed, R.; Haque, S.; Alam, M.; Islam, S. Identification and validation of reference genes for real-time quantitative RT-PCR analysis in jute. BMC Mol. Biol. 2019, 20, 13. [Google Scholar] [CrossRef] [PubMed]
  35. Lucho, S.R.; do Amaral, M.N.; Benitez, L.C.; Milech, C.; Kleinowski, A.M.; Bianchi, V.J.; Braga, E.J.B. Validation of reference genes for RT-qPCR studies in Stevia rebaudiana in response to elicitor agents. Physiol. Mol. Biol. Plants 2018, 24, 767–779. [Google Scholar] [CrossRef] [PubMed]
  36. Fei, X.; Shi, Q.; Yang, T.; Fei, Z.; Wei, A. Expression Stabilities of Ten Candidate Reference Genes for RT-qPCR in Zanthoxylum bungeanum Maxim. Molecules 2018, 23, 802. [Google Scholar] [CrossRef] [PubMed] [Green Version]
  37. Pfaffl, M.W.; Tichopad, A.; Prgomet, C.; Neuvians, T.P. Determination of stable housekeeping genes, differentially regulated target genes and sample integrity: BestKeeper—Excel-based tool using pair-wise correlations. Biotechnol. Lett. 2004, 26, 509–515. [Google Scholar] [CrossRef] [PubMed]
Figure 1. Cycle threshold (Ct) values of 12 candidate reference genes in all 72 samples, blackberry and raspberry. Ct distribution is presented as a box-plot, indicating the 25th and 75th percentiles. Lines across the boxes represent the median. The whisker caps indicate the maximum and minimum values. The dots represent the outlier.
Ijms 22 10533 g001
Figure 2. The average expression stability (M) values of the 12 candidate reference genes using geNorm analysis. Results from (a) All 72 samples; (b) Three raspberries; (c) All fruit developmental stages; (d) Raspberry fruit developmental stages; (e) Red raspberry tissues; (f) Black raspberry tissues; (g) Yellow raspberry tissues; (h) Blackberry tissues; (i) Red raspberry fruit developmental stages; (j) Black raspberry fruit developmental stages; (k) Yellow raspberry fruit developmental stages; (l) Blackberry fruit developmental stages. The least stable genes are listed on the left, while the most stable genes are listed on the right.
Ijms 22 10533 g002
Figure 3. geNorm analysis of paired variation V values of 12 candidate reference genes. Vn/Vn + 1 values are used to determine the optimal number of reference genes. The cut-off value to determine the optimal number of reference genes for RT-qPCR normalization is 0.15.
Ijms 22 10533 g003
Figure 4. Gene expression stability of 12 candidate reference genes using NormFinder analysis. The lower the stability value, the more stable the expression level. (a) All 72 samples; (b) Three raspberries; (c) All fruit developmental stages; (d) Raspberry fruit developmental stages; (e) Red raspberry tissues; (f) Black raspberry tissues; (g) Yellow raspberry tissues; (h) Blackberry tissues; (i) Red raspberry fruit developmental stages; (j) Black raspberry fruit developmental stages; (k) Yellow raspberry fruit developmental stages; (l) Blackberry fruit developmental stages.
Ijms 22 10533 g004
Figure 5. Expression patterns of RuCYP73A normalized to the top two stable genes (Ru18S and RuEEF1A) and an unstable gene (RuPGK).
Ijms 22 10533 g005
Table 1. Primer sequences of candidate reference genes.
Gene NameForward Primer (5′-3′)Reverse Primer (5′-3′)Product Length (bp)
Ru18SACGTCATCCTCCGGCAAAGCACGACGAAGCTCGCAAGTACAC103
Ru30SACCCGACTTGCGTCCTACACTAGCGCTTGACCCATTGGAAGC119
Ru40SGGGACCAAGCCATGGGTAAGCCTAAGCTGCGGCTGTGGACTG105
RuTUBAATCCTTCTCGAGGGCGGCAAAAGCGTGCGTTTGTGCACTG93
RuEEF1ACCTTTCGCGCTCAGCCTTGAAAGTCGACCACCACGGGTCA150
RuEEF1BCCACCATGGCCGTCACCTTCGACGAAACGCAGCCGTACCA193
RuEF4AGTGCAGCAGGTCTCGCTTGTTGGCAACACCCTTCCTCCCA106
RuF-boxGGGATCCATTGCCAGCAGCAGCAGCCGGAGAAGGATGTCTG72
RuUBCAGGGAATCCCACCGGACCAGTCAGCCAAAGTGCGACCATCC73
RuUBQGGCCGCACCCTTGCAGATTATGCATCCCACCACGTAGACGA77
RuPAGCTTCAGCAAGACTCCCATAAGGCCAGGCAGAGCTCGTTGGTTGT104
RuPGKACTAGGGTCCGTGCTGCTGTCAGCAAATCCACCACAACCCACA191
Table 2. Stability analysis of 12 candidate reference genes based on BestKeeper software.
RankAll SamplesThree RaspberriesAll Fruit Developmental StagesRaspberry Fruit Developmental StagesRed Raspberry TissuesBlack Raspberry Tissues
Gene NameSDCV (%)Gene NameSDCV (%)Gene NameSDCV (%)Gene NameSDCV (%)Gene NameSDCV (%)Gene NameSDCV (%)
1RuEEF1A0.130.52RuEEF1A0.140.56RuEEF1A0.110.45Ru18S0.130.55Ru18S0.140.59RuTUBA0.130.53
2Ru18S0.170.73Ru18S0.150.63Ru18S0.140.59RuEEF1A0.140.56RuTUBA0.160.62Ru18S0.140.58
3RuTUBA0.220.88RuTUBA0.240.96RuTUBA0.251.01RuEF4A0.220.87RuEEF1A0.170.66RuEEF1A0.180.73
4RuUBC0.281.16RuUBC0.241.02RuEF4A0.251.00RuTUBA0.291.15RuUBC0.241.00RuEF4A0.240.94
5RuEF4A0.31.18RuEF4A0.291.14RuUBC0.361.48RuUBC0.311.28RuEEF1B0.301.21RuUBC0.281.17
6RuEEF1B0.331.34RuEEF1B0.371.48RuEEF1B0.391.55RuEEF1B0.411.63RuEF4A0.311.25RuEEF1B0.291.16
7RuUBQ0.812.99RuUBQ0.843.08RuPA0.712.67RuF-box0.501.64Ru40S0.481.95Ru40S0.341.28
8Ru40S0.983.89Ru40S0.963.85RuUBQ0.893.25RuPA0.552.11RuUBQ0.521.95RuUBQ0.531.86
9RuPA1.154.35RuPA1.011.25Ru40S0.963.81RuUBQ0.873.18RuPGK0.733.06RuF-box0.812.71
10Ru30S1.214.91RuF-box1.053.54RuF-box0.983.26Ru40S1.094.32RuF-box0.762.52Ru30S0.833.31
11RuPGK1.234.86Ru30S1.194.85Ru30S1.174.68RuPGK1.174.68Ru30S1.064.34RuPA0.913.42
12RuF-box1.304.44RuPGK1.255.01RuPGK1.214.78Ru30S1.275.18RuPA1.094.25RuPGK1.234.97
RankYellow Raspberry TissuesBlackberry TissuesRed Raspberry Fruit Developmental StagesBlack Raspberry Fruit Developmental StagesYellow Raspberry Fruit Developmental StagesBlackberry Fruit Developmental Stages
Gene NameSDCV (%)Gene NameSDCV (%)Gene NameSDCV (%)Gene NameSDCV (%)Gene NameSDCV (%)Gene NameSDCV (%)
1RuEEF1A0.070.28RuEEF1A0.060.25Ru18S0.140.60RuTUBA0.120.46Ru18S0.080.36RuEEF1A0.020.08
2Ru18S0.090.36RuTUBA0.090.36RuEF4A0.150.58Ru18S0.130.56RuEEF1A0.100.41RuTUBA0.040.18
3RuEEF1B0.180.72RuEEF1B0.170.70RuEEF1A0.150.61RuEEF1A0.150.59Ru40S0.100.43Ru18S0.160.70
4RuUBC0.190.79Ru18S0.170.71RuUBQ0.180.68RuEF4A0.180.69RuEF4A0.140.55RuEEF1B0.220.88
5RuTUBA0.251.01RuEF4A0.311.22RuTUBA0.190.77Ru40S0.190.71RuTUBA0.150.62RuEF4A0.331.29
6RuEF4A0.251.01RuUBC0.321.32RuUBC0.210.87RuUBQ0.250.86RuEEF1B0.220.89RuUBC0.471.98
7Ru40S0.261.11RuPGK0.572.17Ru30S0.240.96RuPA0.271.04RuF-box0.230.76Ru40S0.582.32
8RuUBQ0.381.41RuUBQ0.732.69RuEEF1B0.411.65RuEEF1B0.381.50RuUBC0.241.00RuPA0.662.42
9RuPA0.833.23RuF-box0.742.64RuF-box0.441.42RuUBC0.391.59RuUBQ0.371.40Ru30S0.692.68
10RuPGK0.903.44Ru40S0.973.81RuPGK0.502.07RuF-box0.581.94Ru30S0.572.49RuPGK0.732.79
11Ru30S1.195.00Ru30S1.044.14Ru40S0.512.04Ru30S0.762.98RuPA0.712.74RuUBQ0.812.92
12RuF-box1.495.11RuPA1.244.57RuPA0.612.29RuPGK1.355.45RuPGK1.335.16RuF-box1.083.80
Table 3. Comprehensive analysis and ranking of 12 candidate reference genes.
RankAll SamplesThree RaspberriesAll Fruit Developmental StagesRaspberry Fruit Developmental Stages
GeneGNBSGeneGNBSGeneGNBSGeneGNBS
1RuEEF1A1214Ru18S1326RuEEF1A1315RuEF4A2136
2Ru18S1326RuEEF1A1416Ru18S1427Ru18S1517
3RuTUBA2136RuTUBA2136RuEF4A2147RuEEF1A1427
4RuUBC44412RuUBC3249RuTUBA3238RuTUBA3249
5RuEF4A35513RuEF4A46515RuUBC45514RuUBC43512
6RuEEF1B56617RuEEF1B55616RuEEF1B56617RuEEF1B56617
7RuUBQ67720RuUBQ67720RuUBQ67821RuF-box69722
8Ru40S78823Ru40S78823Ru40S78924RuPA77822
9Ru30S891027RuPA99927RuPA89724Ru30S10111223
10RuPA910928Ru30S8101129Ru30S9101130RuPGK11121124
11RuF-box10111233RuF-box10111031RuF-box10111031RuUBQ88925
12RuPGK11121134RuPGK11121235RuPGK11121235Ru40S9101029
RankRed Raspberry TissuesBlack Raspberry TissuesYellow Raspberry TissuesBlackberry Tissues
GeneGNBSGeneGNBSGeneGNBSGeneGNBS
1Ru18S2316RuTUBA1214RuEEF1A1315RuEEF1A1113
2RuUBC1146RuEEF1A1135RuUBC2147RuTUBA1326
3RuTUBA1427Ru18S26210Ru18S17210Ru18S2248
4RuEEF1A35311RuEF4A35412RuTUBA32510RuEEF1B34310
5RuEEF1B47516RuUBC48517RuEF4A44614RuEF4A45514
6RuUBQ62816Ru40S64717RuEEF1B66315RuUBC56617
7RuEF4A58619RuEEF1B57618RuUBQ78815RuPGK68721
8Ru40S76720RuUBQ73818Ru40S55717RuUBQ77822
9RuPGK810927RuF-box89926RuPA89926RuF-box810927
10RuF-box991028Ru30S9101029RuPGK9101029Ru40S991028
11Ru30S10111132RuPA10111132Ru30S10111132Ru30S10111132
12RuPA11121235RuPGK11121235RuF-box11121235RuPA11121235
RankRed Raspberry Fruit Developmental StagesBlack Raspberry Fruit Developmental StagesYellow Raspberry Fruit Developmental StagesBlackberry Fruit Developmental Stages
GeneGNBSGeneGNBSGeneGNBSGeneGNBS
1RuEF4A1124Ru18S3126Ru18S1416RuTUBA1124
2RuEEF1A1236RuTUBA1416RuEEF1A1528RuEEF1A1214
3RuUBQ33410RuEEF1A2237Ru40S2338Ru18S2338
4Ru18S55111Ru40S15511RuEF4A3148RuEEF1B34411
5RuUBC24612RuEF4A43411RuTUBA42511RuEF4A45514
6RuTUBA46515RuUBQ56617RuEEF1B56617RuUBC57618
7Ru30S67720RuPA67720RuF-box69722Ru40S86721
8RuEEF1B711826RuEEF1B78823RuUBC77822RuPA610824
9Ru40S881127RuUBC89926RuUBQ88925Ru30S711927
10RuF-box910928RuF-box9101029Ru30S9101029RuPGK981027
11RuPGK1091029Ru30S10111132RuPA10111132RuUBQ1091130
12RuPA11121235RuPGK11121235RuPGK11121235RuF-box11121235
G: gene expression stability ranking in geNorm. N: gene expression stability ranking in NormFinder. B: gene expression stability ranking in BestKeeper. S: the sum of gene stability rankings in the three algorithms.
Publisher’s Note: MDPI stays neutral with regard to jurisdictional claims in published maps and institutional affiliations.

