2.1. Prediction Models for 59 MIEs
We have previously reported a DL-based QSAR approach, called the DeepSnap-DL- system, which uses the Deep Learning GPU Training System (DIGITS) [
37,
38,
39,
40,
41]. In the current study, we present an improved DeepSnap-DL system that uses TensorFlow and Keras. In this system, the flow of image generation and learning is regarded as one unit that can be executed sequentially and automatically to obtain high throughput and high performance (
Figure S1).
To construct prediction models of MIEs for in vivo toxicity responses that affect health outcomes in humans, we downloaded information about the chemical structures and agonist and antagonist activity for a total of 59 MIEs from the Tox21 10K library. The mean number of chemicals in the 59 MIEs was 9699 ± 702, and the highest and lowest numbers of chemicals were, respectively, 12,581 (for the peroxisome proliferator-activated receptor γ antagonist: PPARg_ant, AID: 743199, where AID is the agonist/antagonist identification number, and the antioxidant response element signaling pathway agonist: ARE_ago, AID: 743219) and 8434 (the caspase-2 agonist: Casp2_ago, AID: 1347037) (
Figure S2a). Furthermore, we divided the data for these chemical compounds into two groups based on their activity scores: active chemicals had an activity score ≥ 40, while inactive chemicals had an activity score < 40. The mean percentage of active chemicals among all chemicals was 4.79% ± 3.94%, and the highest and lowest percentages of active chemicals were 21.6% (for the pregnane X receptor agonist: PXR_ago, AID: 1347033) and 0.08% (the transforming growth factor–β agonist: TGFb_ago, AID: 1347035), respectively (
Figure S2b). The data were divided into training, validation, test, and foldout datasets, with the first three datasets used for training and fine-tuning the prediction models. The final evaluation of the constructed models was performed using the foldout dataset.
The mean number of chemicals in the training, validation, and test datasets for the 59 MIEs was 7046 ± 608, and the highest and lowest numbers of chemicals were 9834 (AID: 743199 and AID: 743219) and 6388 (the peroxisome proliferator-activated receptor δ agonist: PPARd_ago, AID: 743227), respectively (
Figure S3a). The mean percentage of active chemicals in the training, validation, and test datasets was 4.77% ± 3.93%, and the highest and lowest percentages of active chemicals were 21.6% (AID: 1347033) and 0.08% (AID: 1347035), respectively (
Figure S3b). In addition, the mean number of chemicals in the foldout dataset of the 59 MIEs was 2654 ± 469, and the highest and lowest numbers of chemicals were 3101 (the ATPase family AAA-domain-containing protein 5 agonist: ATAD5_ago, AID: 720516; the glucocorticoid receptor agonist: GR_ago, AID: 720719; the glucocorticoid receptor antagonist: GR_ant, AID: 720725; the androgen receptor agonist: ARlbd_ago, AID: 743053; the thyroid hormone receptor beta isoform 2 antagonist: TR_ant, AID: 743067; the estrogen nuclear receptor alpha
agonist: ERlbd_ago, AID: 743077; the estrogen nuclear receptor alpha antagonist: ERlbd_ant, AID: 743078; and the estrogen nuclear receptor alpha antagonist: ERfull_ant, AID: 743091) and 843 (AID: 1347037), respectively (
Figure S4a). The mean percentage of active chemicals in the foldout dataset was 4.85% ± 4.16%, and the highest and lowest percentages of active chemicals were 21.7% (the pregnane X receptor agonist: PXR_ago, AID: 1347033) and 0.10% (AID: 1347035), respectively (
Figure S4b). These results indicate that the datasets were highly imbalanced.
Next, using structural information for these chemicals derived from the simplified molecular-input line-entry system (SMILES) format, the SMILES_TO_SDF (Structure Data File) program, which performs conformational import from the SMILES format, produced 3D chemical conformation structures. Molecular images were then generated as snapshots of the 3D structure using the improved DeepSnap-DL method at six angles along the
x,
y, and
z axes. This produced the following different numbers of images: (195°, 195°, 195°), (8 images); (185°, 185°, 185°), (8 images); (176°, 176°, 176°), (27 images); (165°, 165°, 165°), (27 images); (155°, 155°, 155°), (27 images); and (145°, 145°, 145°), (27 images). Using these molecular images as input data for DL, we constructed a total of 59 prediction models for agonists or antagonists of the MIEs and fine-tuned them using the modified DeepSnap-DL system and the training, validation, and test datasets. Finally, we selected the models with the highest performance out of the six angles and evaluated them using the foldout dataset. Among the 59 prediction models, one model (the nuclear factor-kappa B agonist: NFkB_ago, AID: 1159518) did not demonstrate predictive ability (ROC_AUC_valid = 0.5, ROC_AUC_test = 0.5, ROC_AUC_foldout = 0.5, where ROC_AUC_valid, ROC_AUC_test, and ROC_AUC_foldout refer to the area under the corresponding receiver operating characteristic curve in the validation, test, and foldout datasets, respectively). The dataset used in the NFkB_ago prediction model was highly imbalanced. This suggests that the performance of the prediction model may depend on the balance of the input data, as previously reported [
42,
43].
The mean values of ROC_AUC_valid, ROC_AUC_test, and ROC_AUC_foldout were 0.818 ± 0.056, 0.803 ± 0.063, and 0.792 ± 0.076, respectively (
Figure 1). In addition, as illustrated in
Figure 1, the highest prediction performance was observed for the transforming growth factor-β (TGFb) agonist (TGFb_ago, AID: 1347035), with ROC_AUC_valid = 0.952 and ROC_AUC_test = 0.999, and for the progesterone receptor agonist (PR_ago, AID: 1347036), with ROC_AUC_foldout = 0.951. The lowest prediction performance was observed for the vitamin D receptor (VDR) antagonist (VDR_ant, AID: 743242), with ROC_AUC_valid = 0.706, the hypoxia-inducible factor-1 agonist (HIF1_ago, AID: 1224894), with ROC_AUC_test = 0.694, and the thyrotropin-releasing hormone receptor agonist (TRHR_ago, AID: 1347030), with ROC_AUC_foldout = 0.669 (
Figure 1). Furthermore, with respect to the balanced accuracy (BAC), the mean values of BAC_valid, BAC_test, and BAC_foldout where BAC_valid, BAC_test, and BAC_foldout refer to the area-balanced accuracy in the validation, test, and foldout datasets, respectively, were 0.757 ± 0.058, 0.747 ± 0.062, and 0.736 ± 0.069, respectively (
Figure 2). In addition, as illustrated in
Figure 2, the highest prediction performance was observed for the TGFb agonist (TGFb_ago, AID: 1347035), with BAC_valid = 0.952 and BAC_test = 0.999, and for the PR agonist (PR_ago, AID: 1347036), with BAC_foldout = 0.898. The lowest prediction performance was observed for the VDR antagonist (VDR_ant, AID: 743242), with BAC_valid = 0.653, the retinoid X receptor (RXR) agonist (RXR_ago, AID: 1159531), with BAC_test = 0.640, and the TRHR agonist (TRHR_ago, AID: 1347030), with BAC_foldout = 0.627 (
Figure 2).
The mean values of specificity_valid, specificity_test, and specificity_foldout, where specificity_valid, specificity_test, and specificity_foldout refer to the specificity in the validation, test, and foldout datasets, respectively, were 0.755 ± 0.100, 0.754 ± 0.111, and 0.756 ± 0.107, respectively (
Figure S5). In addition, as illustrated in
Figure S5, the highest prediction performance was observed for the HIF1 agonist (HIF1_ago, AID: 1224894), with specificity_valid = 0.980, and for the TGFb agonist (TGFb_ago, AID: 1347035), with specificity_test = 0.997 and specificity_foldout = 0.980. The lowest prediction performance was observed for the sonic hedgehog antagonist (Shh_ago, AID: 1259390), with specificity_valid = 0.490, the VDR antagonist (VDR_ant, AID: 743242), with specificity_test = 0.450, and the androgen-receptor agonist (ARant_ago, AID: 1259387), with specificity_foldout = 0.500 (
Figure S5). The mean values of recall_valid, recall_test, and recall_foldout—where recall_valid, recall_test, and recall_foldout, refer to the recall in the validation, test, and foldout datasets, respectively—were 0.760 ± 0.086, 0.741 ± 0.113, and 0.709 ± 0.132, respectively (
Figure S6). In addition, as illustrated in
Figure S6, the highest prediction performance was observed for the TGFb agonist (TGFb_ago, AID: 1347035), with recall_valid = 1.00 and recall_test = 1.00, and for the thyroid-stimulating hormone receptor 2 agonist (TSHR2_ago, AID: 1259393), with recall_foldout = 0.930. The lowest prediction performance was observed for the VDR antagonist (VDR_ant, AID: 743242), with recall_valid = 0.610, the RXR agonist (RXR_ago, AID: 1159531), with recall_test = 0.470, and the farnesoid X receptor agonist (FXR_ago, AID: 743239), with recall_foldout = 0.040 (
Figure S6).
In a previous study, we reported the construction of prediction models for 35 agonist and antagonist allosteric modulators of nuclear receptors for chemicals using the DeepSnap-DL system with DIGITS [
38]. That study reported that the mean ROC_AUC and BAC were 0.884 ± 0.017 and 0.8471 ± 0.017, respectively [
38]. The results of the present study indicate that the prediction performance of DeepSnap-DL with TensorFlow and Keras is lower than that of DeepSnap-DL with DIGITS. However, DeepSnap-DL with TensorFlow and Keras has the potential for improvement through detailed examinations using different angles.
2.2. Angles and Data Split in DeepSnap-DL
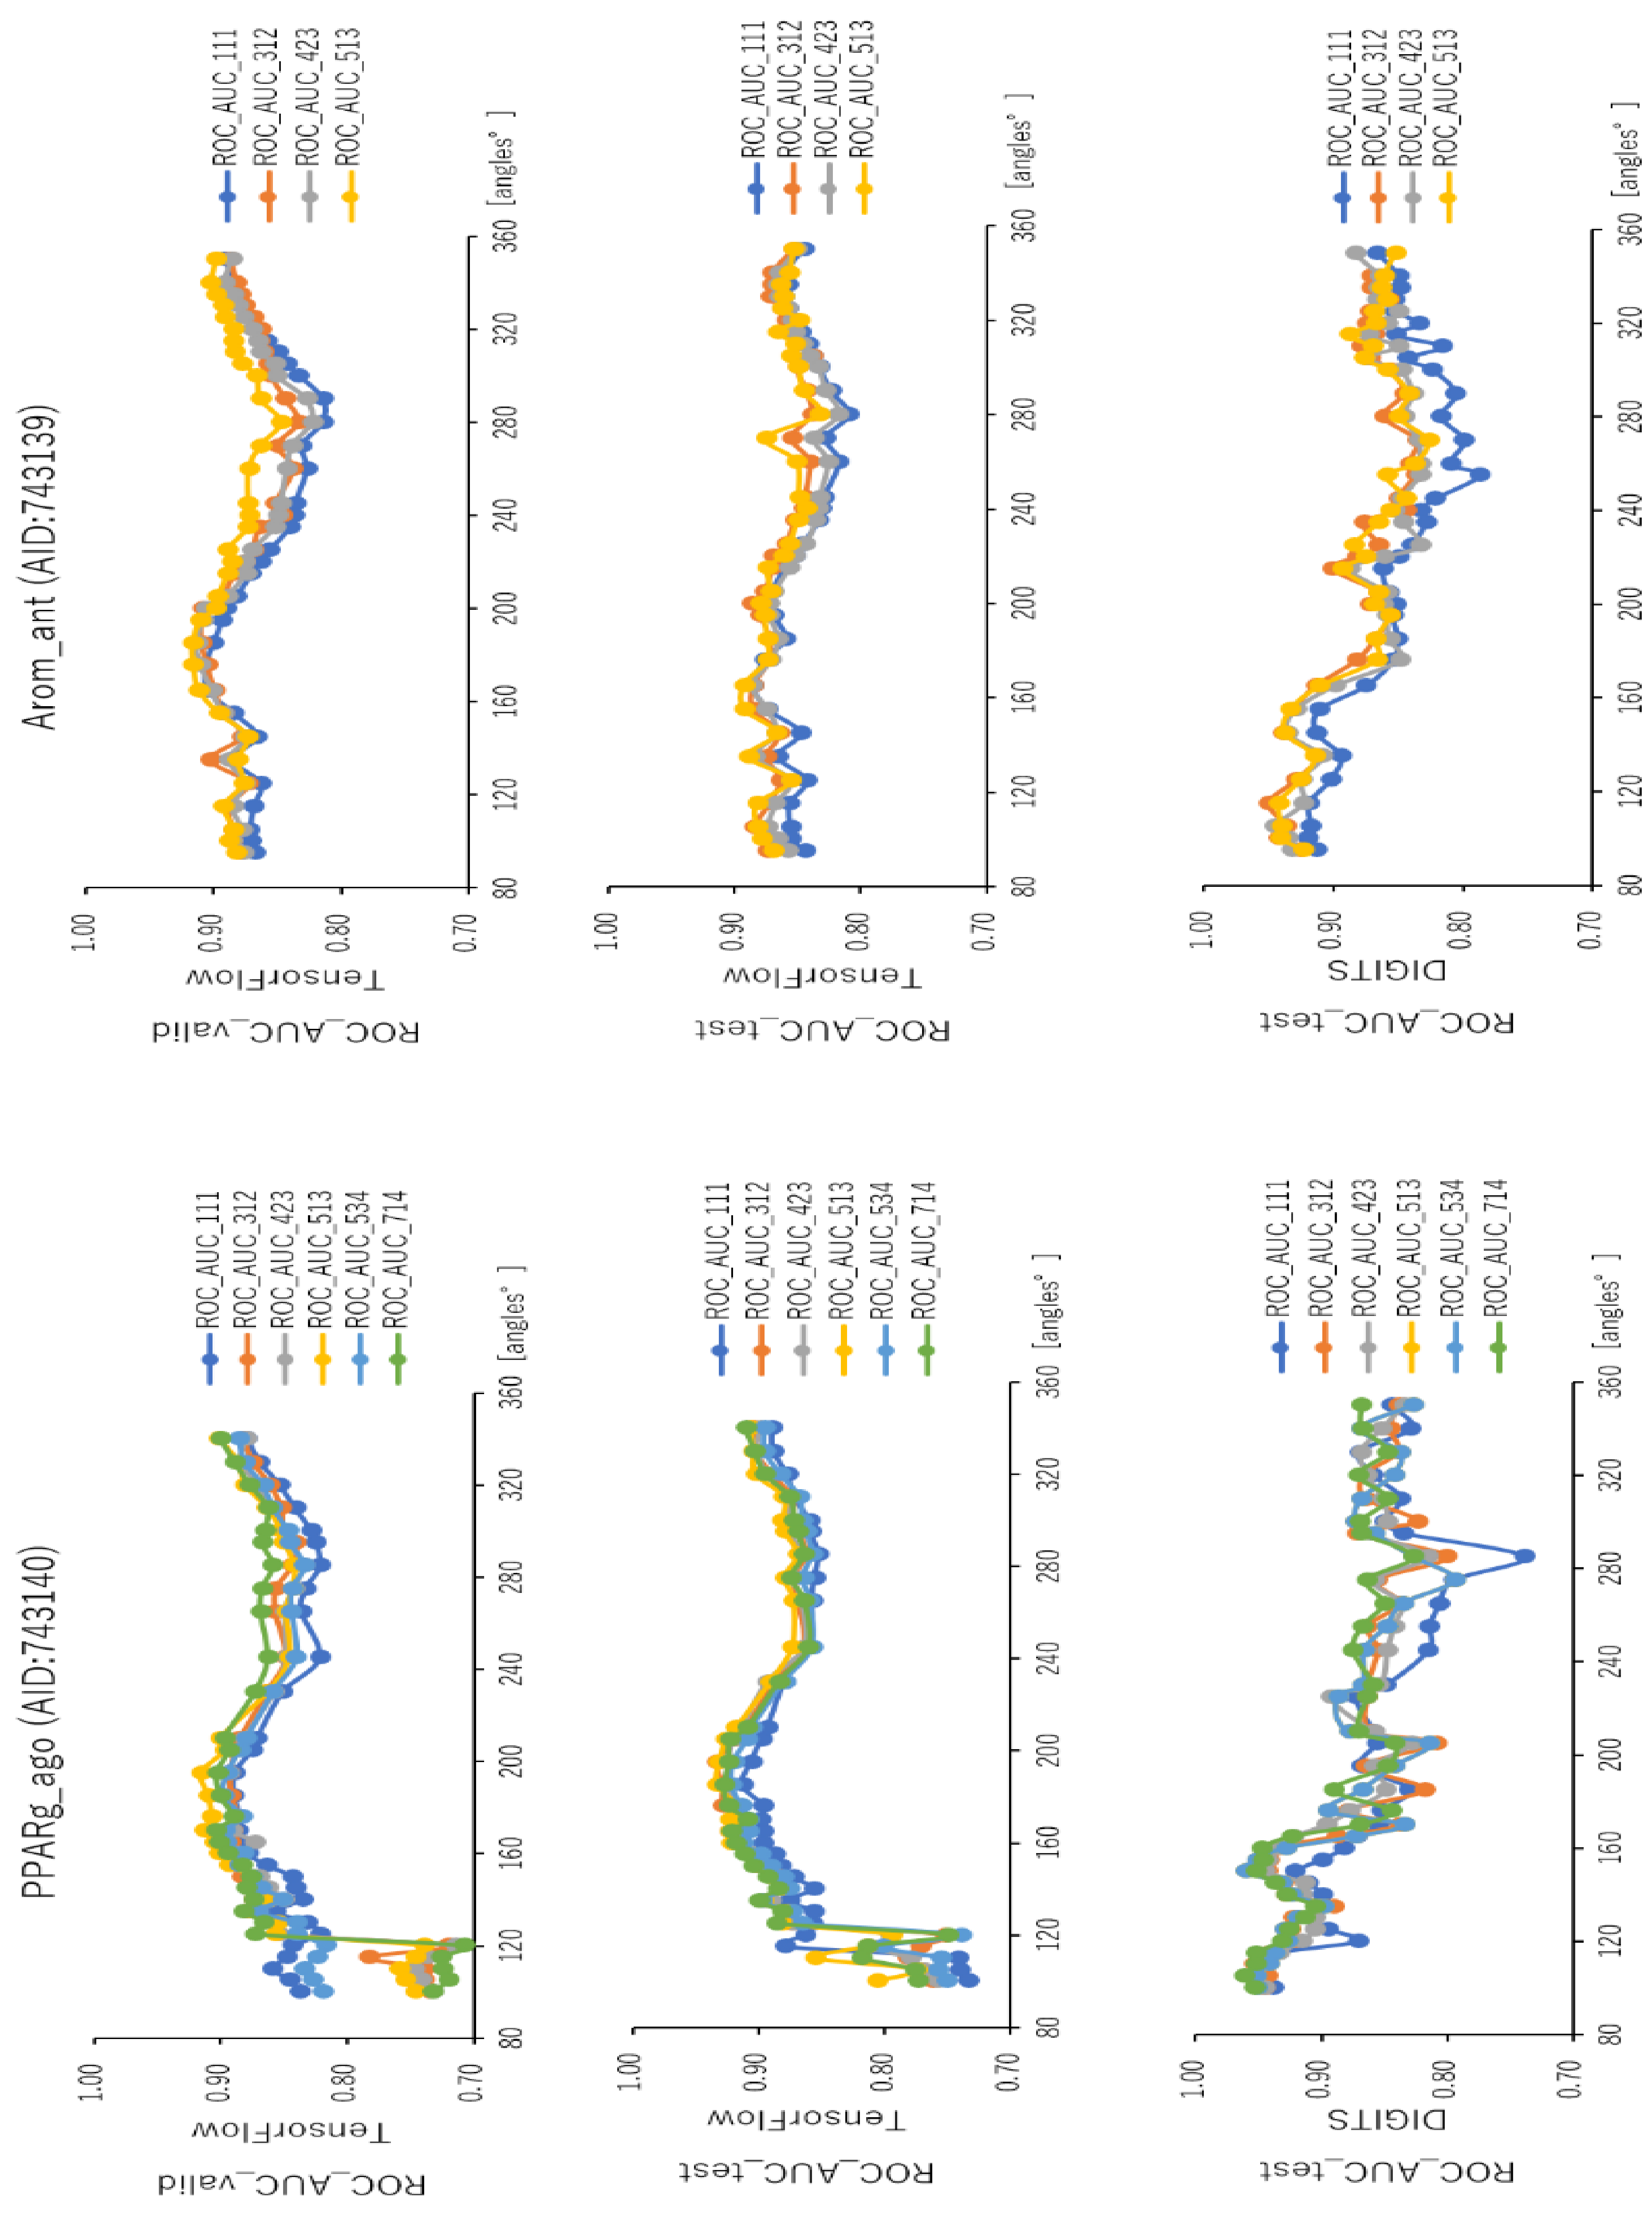
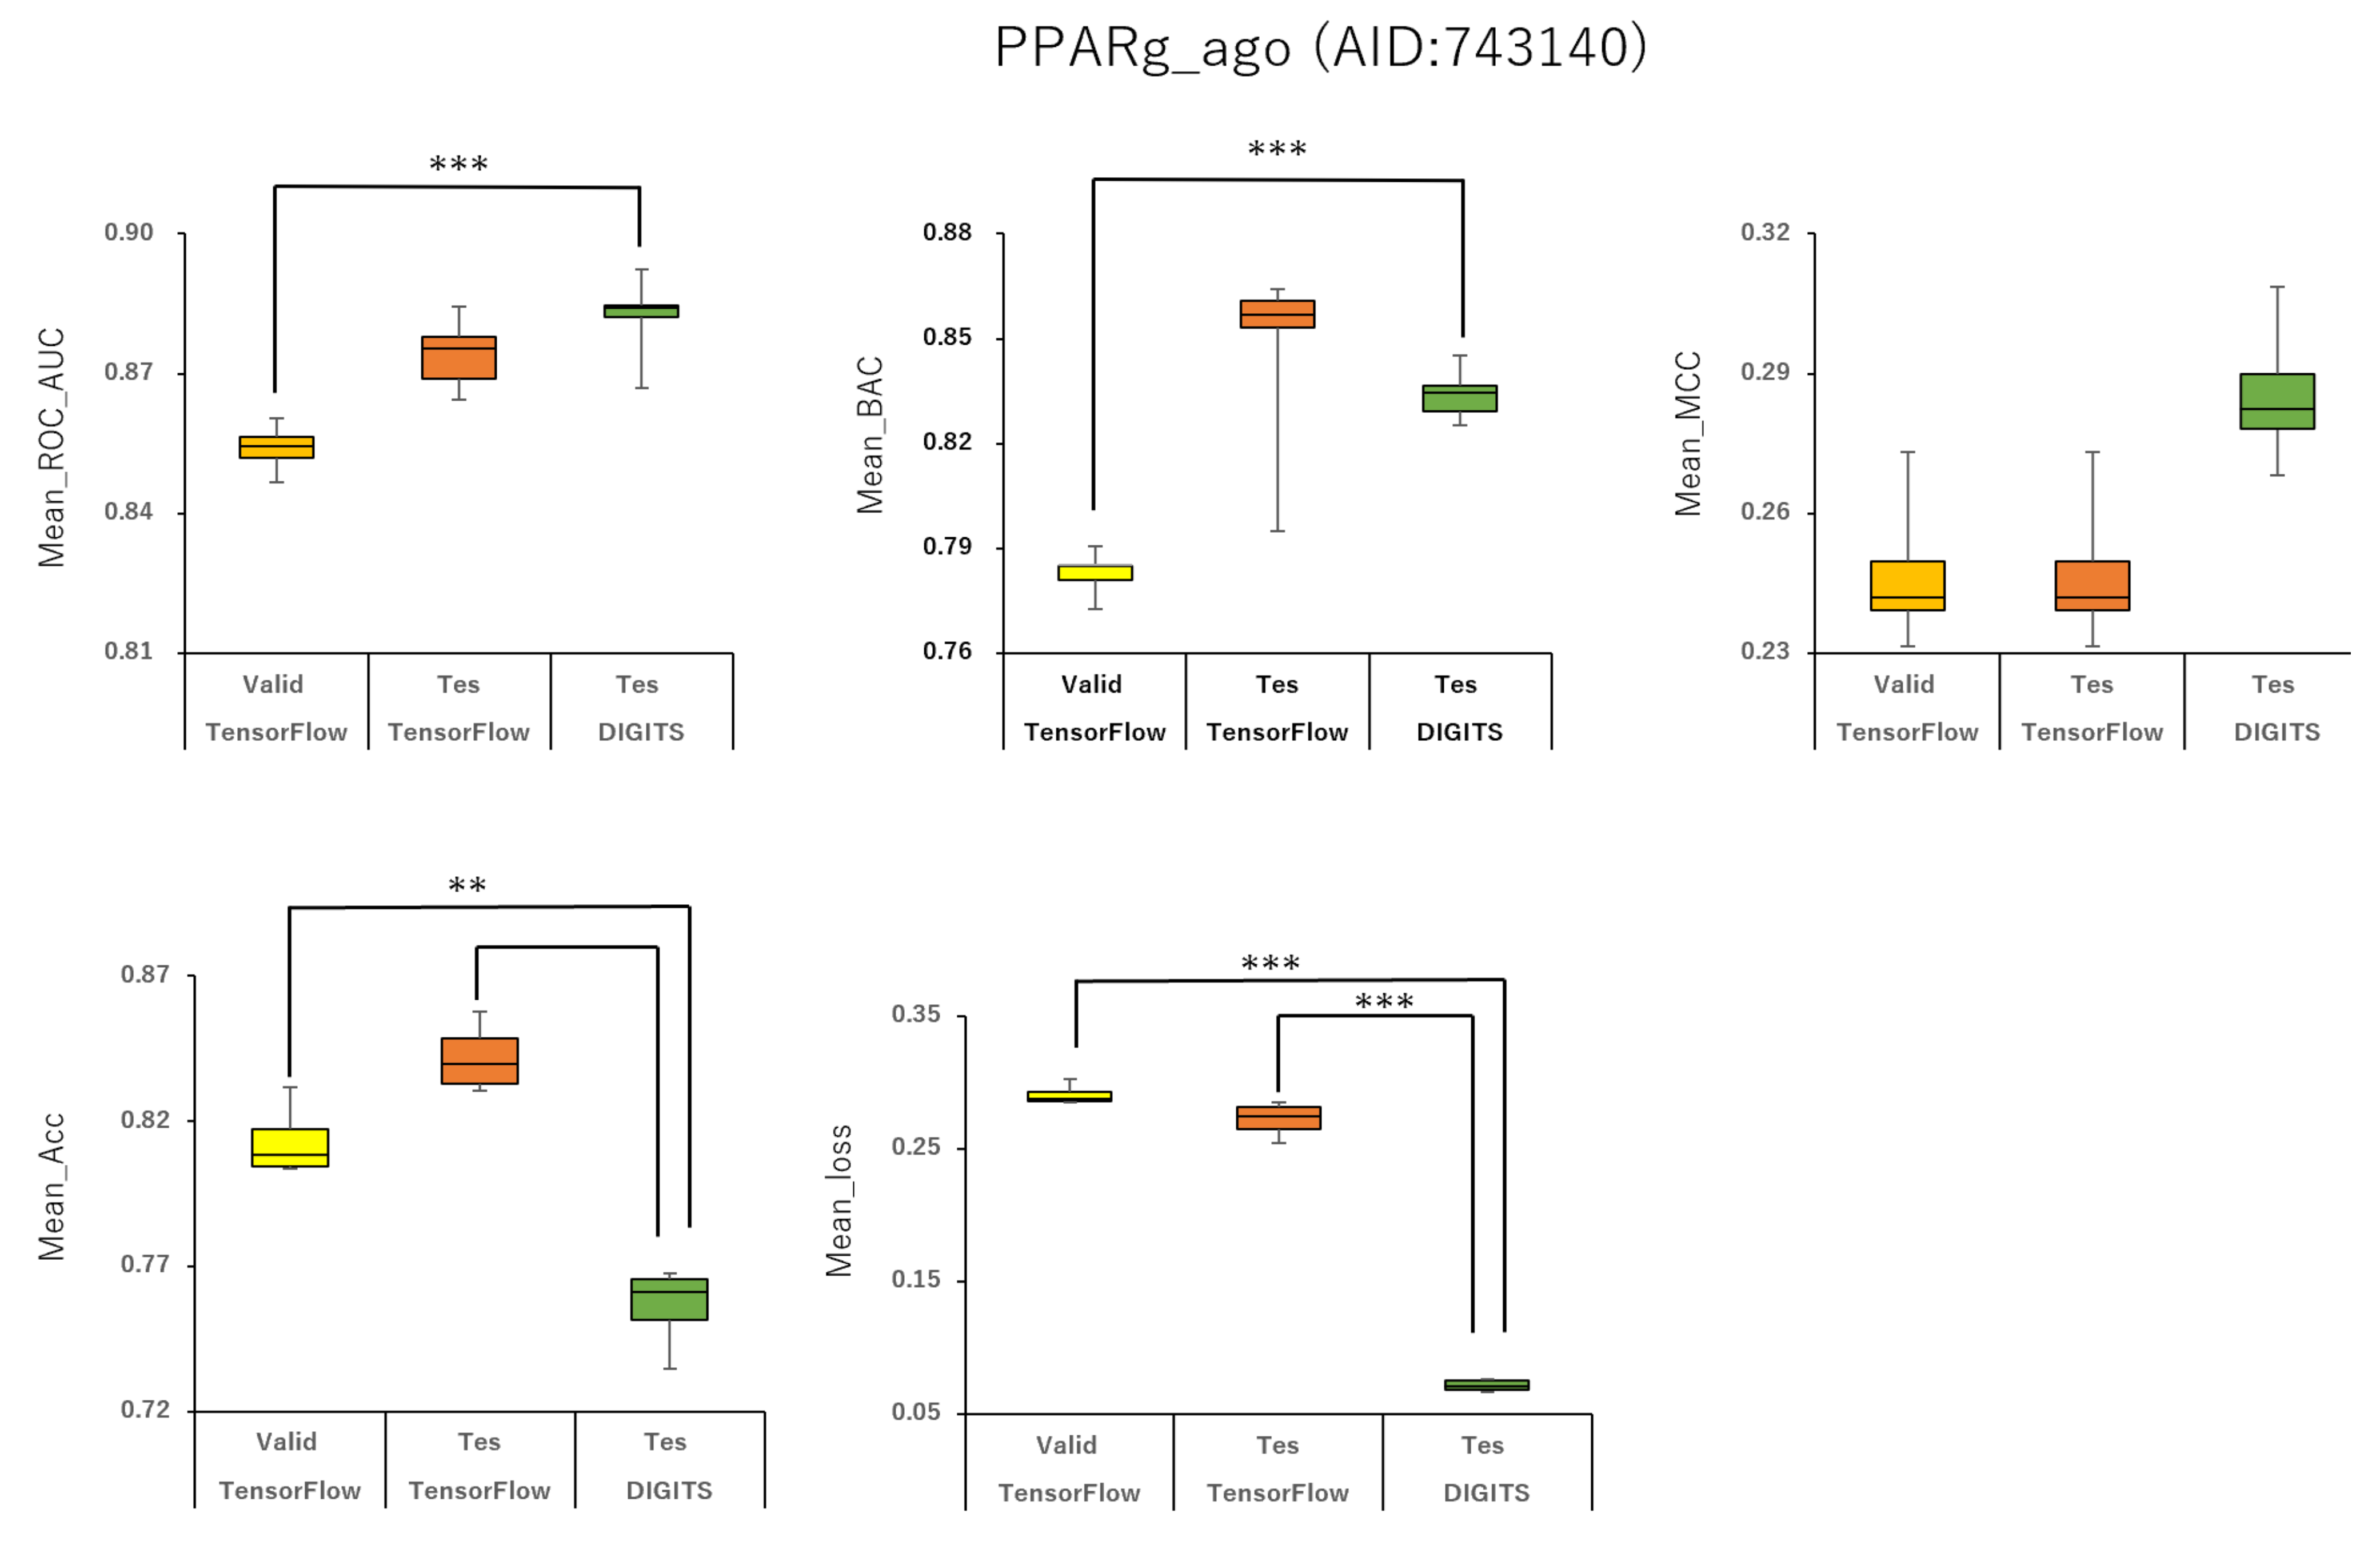
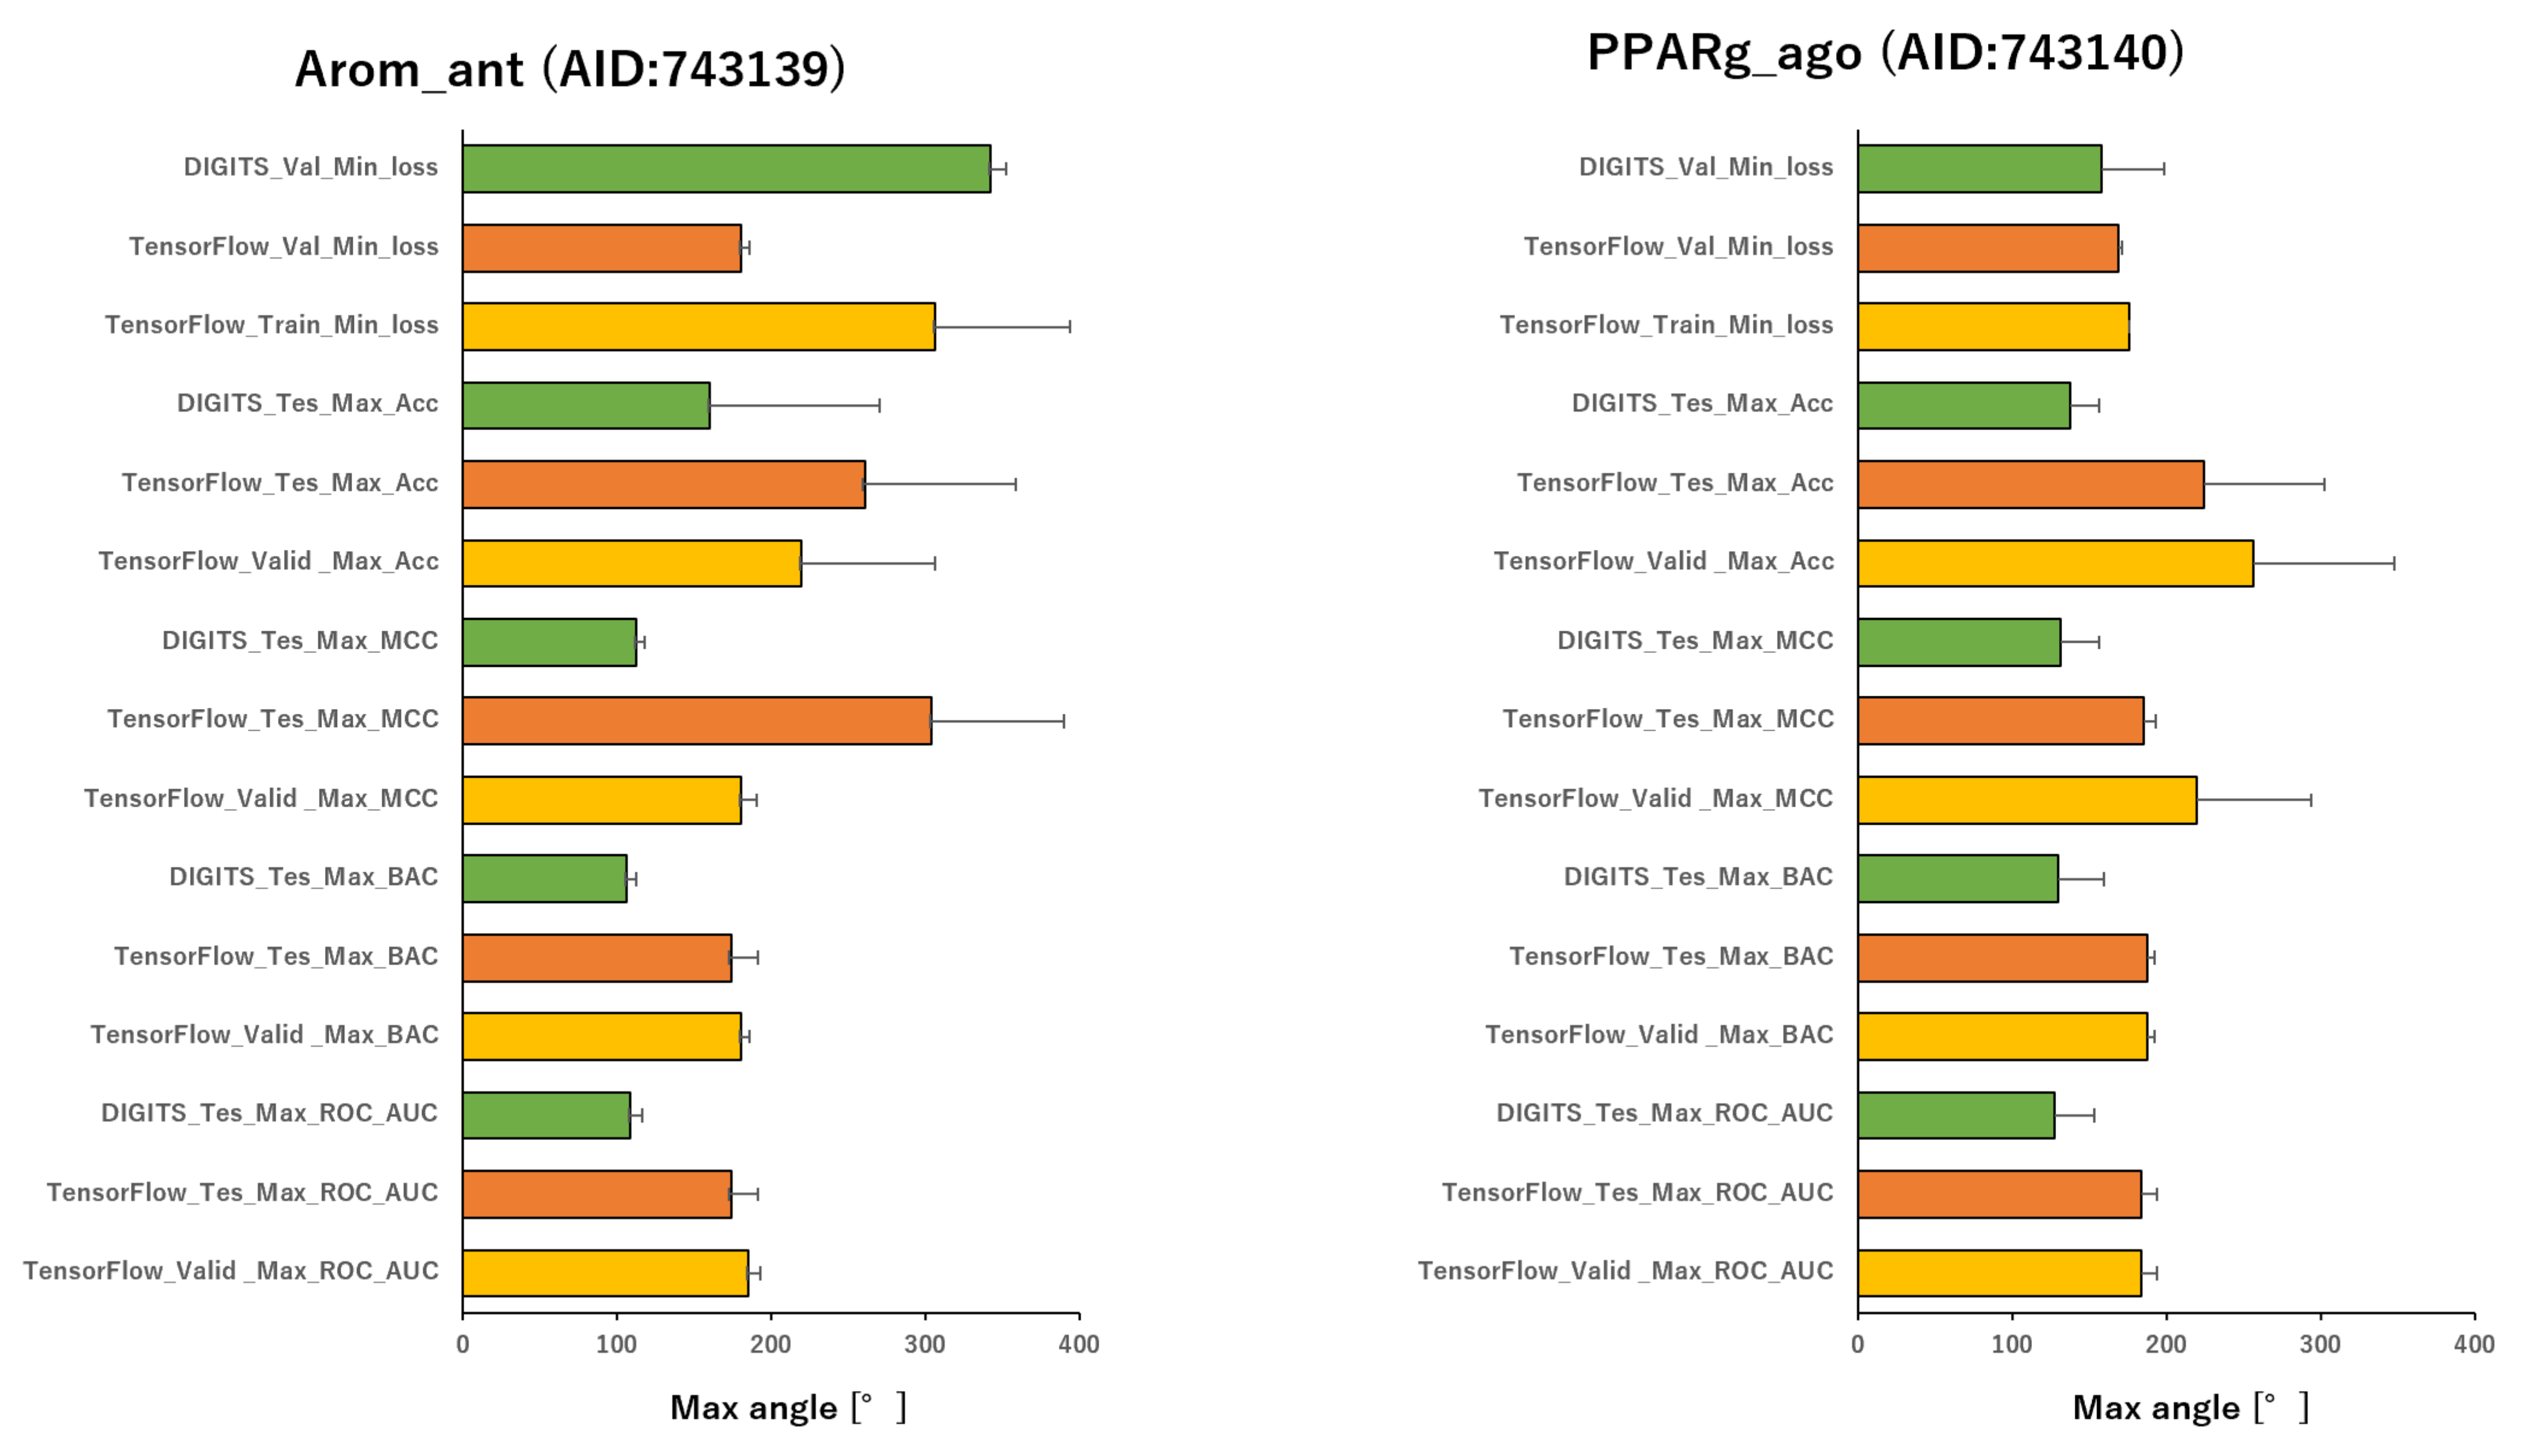
To analyze the influence of different angles on the snapshot generation of DeepSnap and of different splits among the training, validation, and test datasets of the peroxisome proliferator-activated receptor γ(PPARγ) agonist (PPARg_ago, AID:743140), we used 31 different angles from (100°, 100°, 100°) (64 images) to (340°, 340°, 340°) (8 images), and six types of data-split ratios (training:validation:test = 1:1:1, 3:1:2, 4:2:3, 5:1:3, 5:3:4, 7:1:4) in the improved DeepSnap-DL using TensorFlow and Keras. The mean ROC_AUC, BAC, Matthews correlation coefficient (MCC), and accuracy (Acc) values in the validation and test datasets for the 31 angles and six data-split ratios were 0.854 ± 0.005 (ROC_AUC_valid), 0.874 ± 0.007 (ROC_AUC_test), 0.783 ± 0.006 (BAC_valid), 0.848 ± 0.026 (BAC_test), 0.237 ± 0.026 (MCC_valid), 0.273 ± 0.035 (MCC_test), 0.799 ± 0.035 (Acc_valid), and 0.827 ± 0.043 (Acc_test), where MCC_valid, MCC_test, Acc_valid, and Acc_test refer to the MCC and the accuracy in the validation and test datasets, respectively. The mean loss values on the training and validation datasets were 0.287 ± 0.110 (loss_train) and 0.270 ± 0.076 (loss_valid), where loss_train and loss_valid refer to the loss in the training and validation datasets (
Figure 3,
Figure 4,
Figure 5,
Figure 6 and
Figure 7;
Figures S7–S10, left;
Table S1). The highest prediction performance values on the validation and test datasets for the 31 angles and six data-split ratios were 0.915 at 195° (ROC_AUC_valid), 0.934 at 195° (ROC_AUC_test), 0.848 at 185° (BAC_valid), 0.864 at 195° (BAC_test), 0.273 at 176° (MCC_valid), 0.309 at 176° (MCC_test), 0.832 at 170° (Acc_valid), and 0.858 at 176° (Acc_test). The lowest prediction performance values on the training and validation datasets were 0.038 at 176°(loss_train) and 0.122 at 165°and 170° (loss_valid) (
Figure 3,
Figure 4,
Figure 5,
Figure 6 and
Figure 7;
Figures S7–S10, left;
Table S1).
In addition, we used 34 angles from (100°, 100°, 100°) (64 images) to (350°, 350°, 350°) (8 images) and six data-split ratios (training:validation:test = 1:1:1, 3:1:2, 4:2:3, 5:1:3, 5:3:4, and 7:1:4) in DeepSnap-DL with DIGITS [
38,
39,
40,
41]. The mean ROC_AUC, BAC, MCC, and Acc values on the test dataset for the 34 angles and six data-split ratios were 0.882 ± 0.008 (ROC_AUC_test), 0.834 ± 0.007 (BAC_test), 0.245 ± 0.009 (MCC_test), and 0.751 ± 0.016 (Acc_test). The mean loss value on the validation dataset was 0.073 ± 0.006 (loss_valid) (
Figure 3,
Figure 4,
Figure 5,
Figure 6 and
Figure 7;
Figures S7–S10, left;
Table S1). The highest prediction performance values on the test dataset for the 34 angles and six data-split ratios were 0.962 at 105° (ROC_AUC_test), 0.912 at 150° (BAC_test), 0.379 at 115° (MCC_test), and 0.903 at 115° (Acc_test). The lowest prediction performance value on the validation dataset was 0.052 at 176° (loss_valid) (
Figure 3,
Figure 4,
Figure 5,
Figure 6 and
Figure 7;
Figures S7–S10, left;
Table S1).
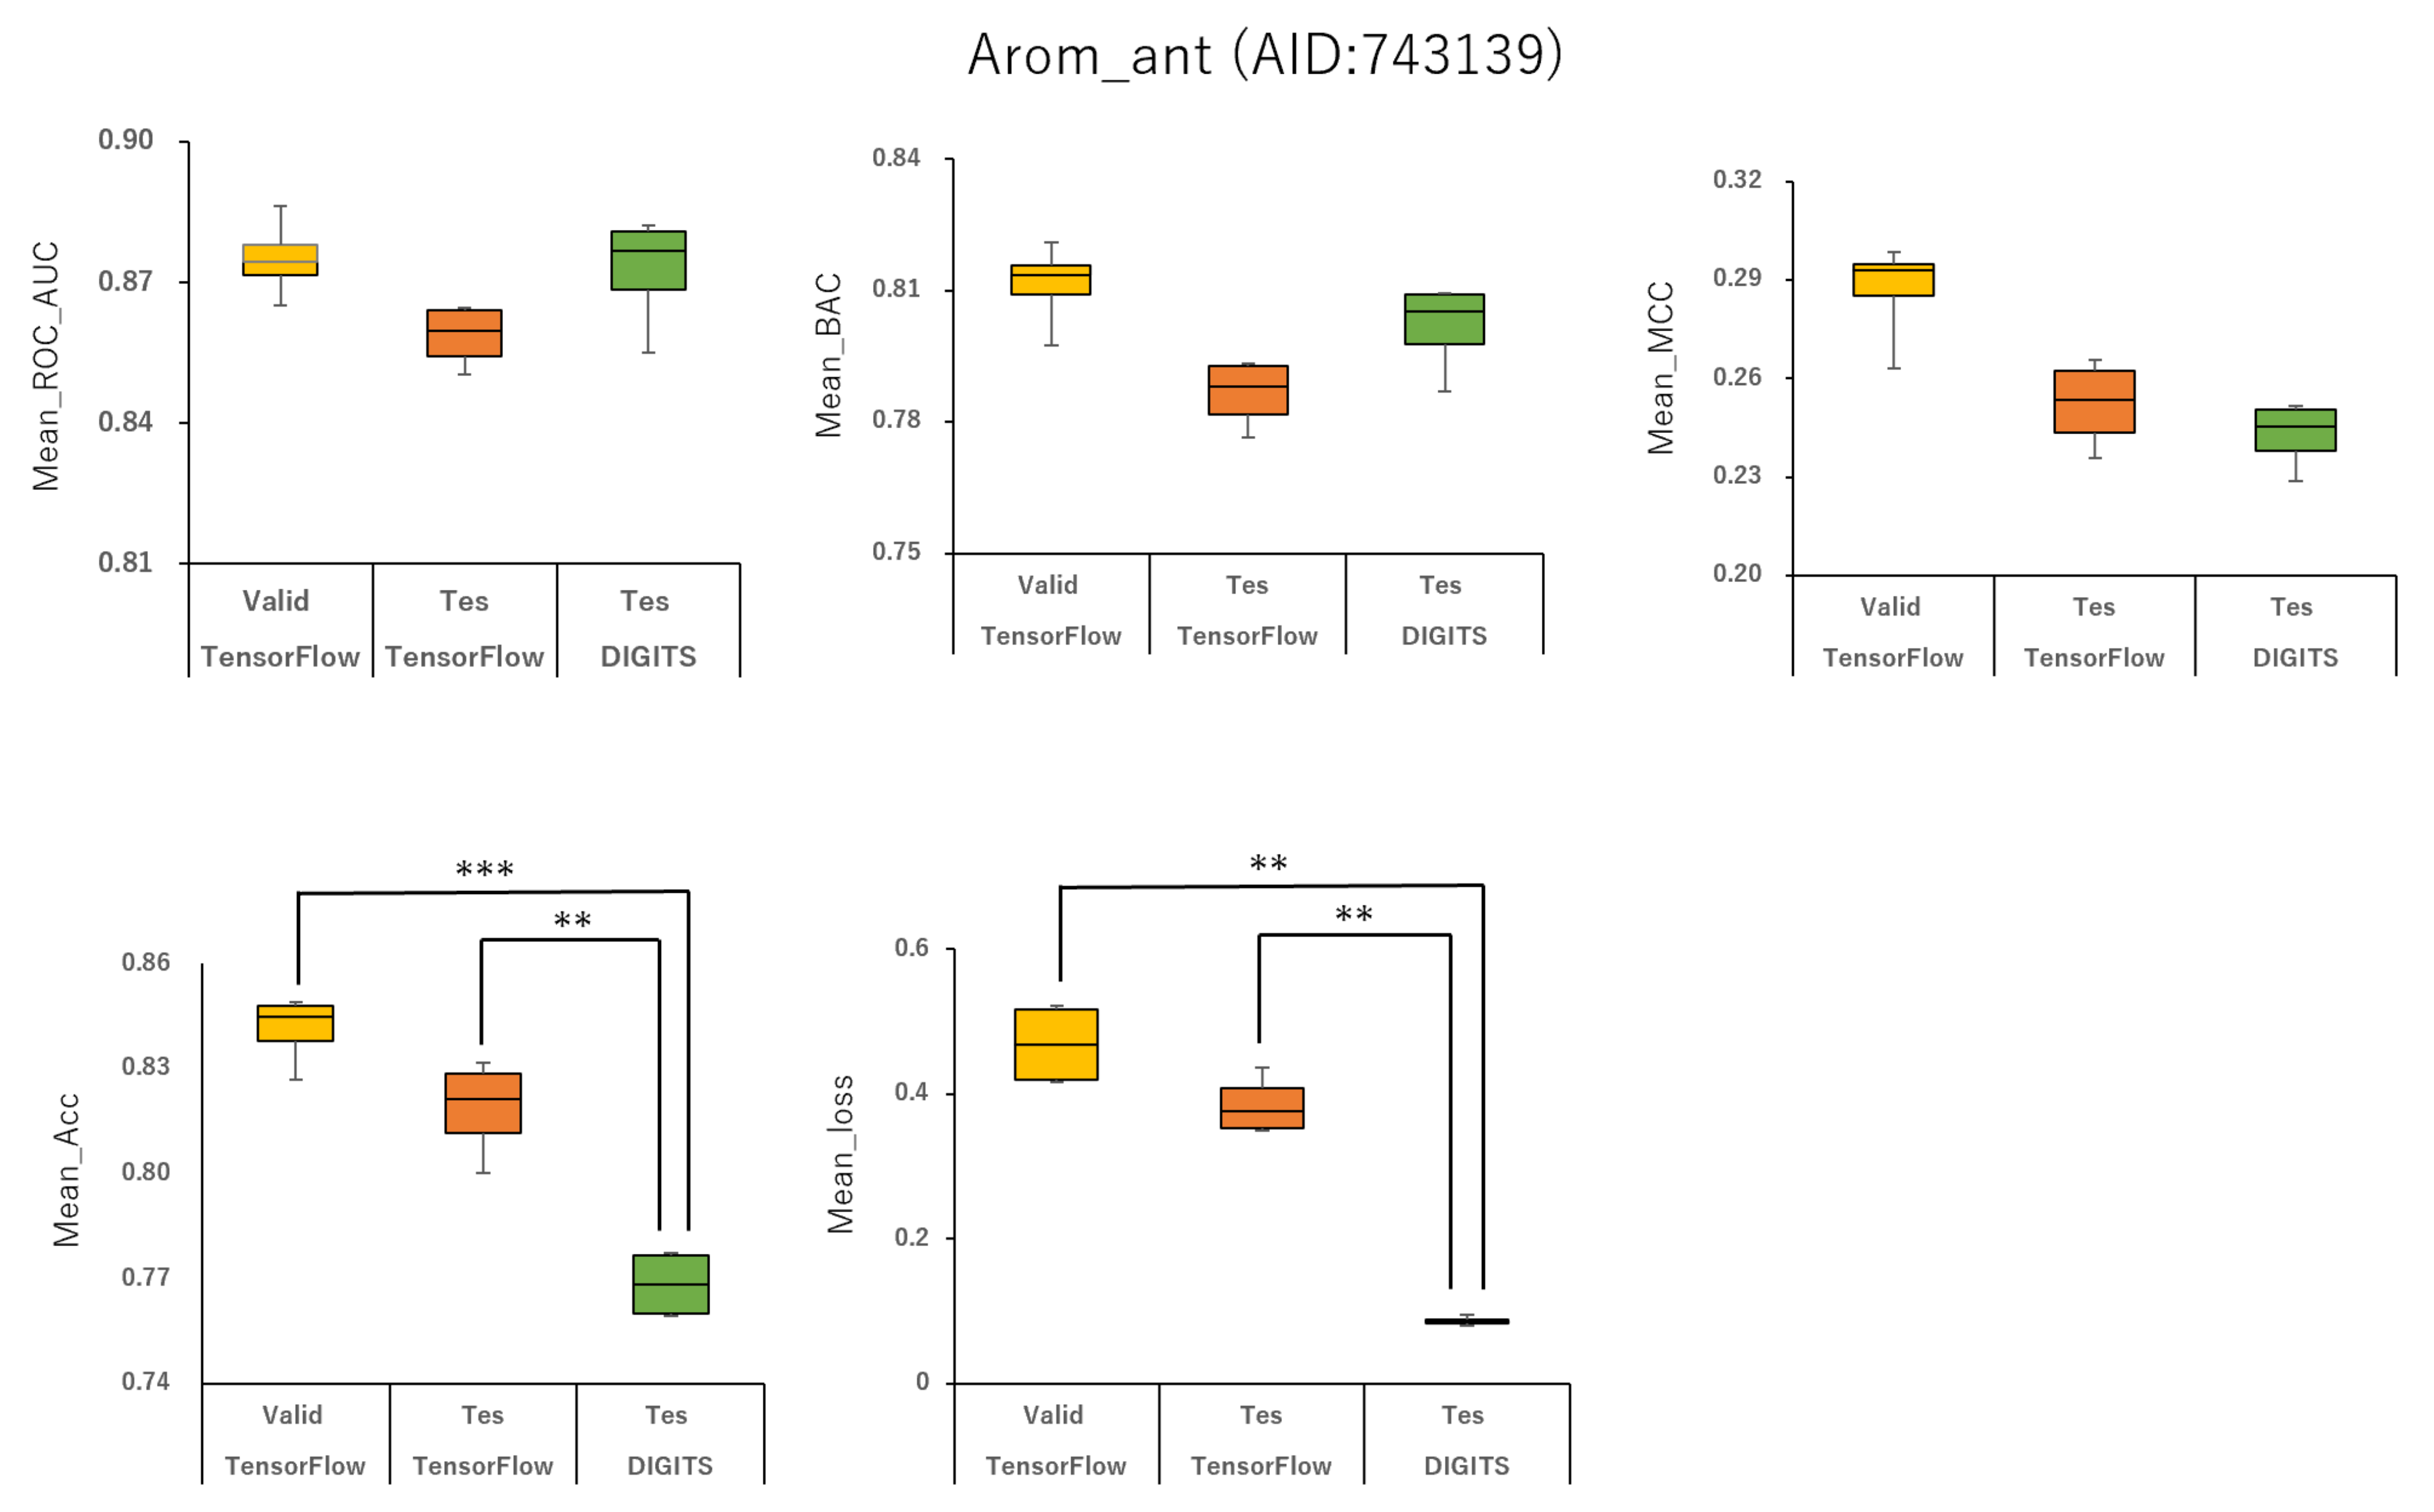
Furthermore, using the aromatase antagonist (Arom_ant, AID:743139), we built prediction models for 34 angles from (95°, 95°, 95°) (64 images) to (350°, 350°, 350°) (8 images) and four data-split ratios (training:validation:test = 1:1:1, 3:1:2, 4:2:3, and 5:1:3) in DeepSnap-DL using TensorFlow and Keras. The mean values of ROC_AUC, BAC, MCC, and Acc on the validation and test datasets for the 34 angles and four data-split ratios were 0.875 ± 0.009 (ROC_AUC_valid), 0.859 ± 0.007 (ROC_AUC_test), 0.811 ± 0.010 (BAC_valid), 0.786 ± 0.008 (BAC_test), 0.287 ± 0.016 (MCC_valid), 0.252 ± 0.014 (MCC_test), 0.841 ± 0.010 (Acc_valid), and 0.819 ± 0.014 (Acc_test). The mean loss values on the training and validation datasets were 0.469 ± 0.125 (loss_train) and 0.385 ± 0.080 (loss_valid) (
Figure 3,
Figure 4,
Figure 7,
Figure 8 and
Figure 9;
Figures S7–S10, right;
Table S2). The highest prediction performance values on the validation and test datasets for the 34 angles and four data-split ratios were 0.917 at 185° (ROC_AUC_valid), 0.893 at 165° (ROC_AUC_test), 0.867 at 176° (BAC_valid), 0.830 at 165° (BAC_test), 0.420 at 176° (MCC_valid), 0.350 at 350° (MCC_test), 0.929 at 176° (Acc_valid), and 0.913 at 176° (Acc_test). The lowest prediction-performance values on the training and validation datasets were 0.022 at 350° (loss_train) and 0.102 at 185° (loss_valid) (
Figure 3,
Figure 4,
Figure 7,
Figure 8 and
Figure 9;
Figures S7–S10, right;
Table S2).
In addition, we used 34 angles from (95°, 95°, 95°) (64 images) to (350°, 350°, 350°) (8 images) and four data-split ratios (training:validation:test = 1:1:1, 3:1:2, 4:2:3, and 5:1:3) in DeepSnap-DL using DIGITS. The mean values of ROC_AUC, BAC, MCC, and Acc on the test dataset for the 34 angles and four data-split ratios were 0.873 ± 0.012 (ROC_AUC_test), 0.802 ± 0.010 (BAC_test), 0.243 ± 0.010 (MCC_test), and 0.768 ± 0.010 (Acc_test). The mean loss value on the validation dataset was 0.087 ± 0.007 (loss_valid) (
Figure 3 and
Figure 4;
Figures S7–S10, right;
Table S2). The highest prediction performance values on the test dataset for the 34 angles and four data-split ratios were 0.950 at 115° (ROC_AUC_test), 0.879 at 105° (BAC_test), 0.356 at 105° (MCC_test), and 0.899 at 105° (Acc_test). The lowest prediction performance value on the validation dataset was 0.069 at 340°and 350° (loss_valid) (
Figure 3,
Figure 4,
Figure 7,
Figure 8 and
Figure 9;
Figure S7–S10, right;
Table S2).
2.3. Learning Rate and Batch Size in DeepSnap-DL
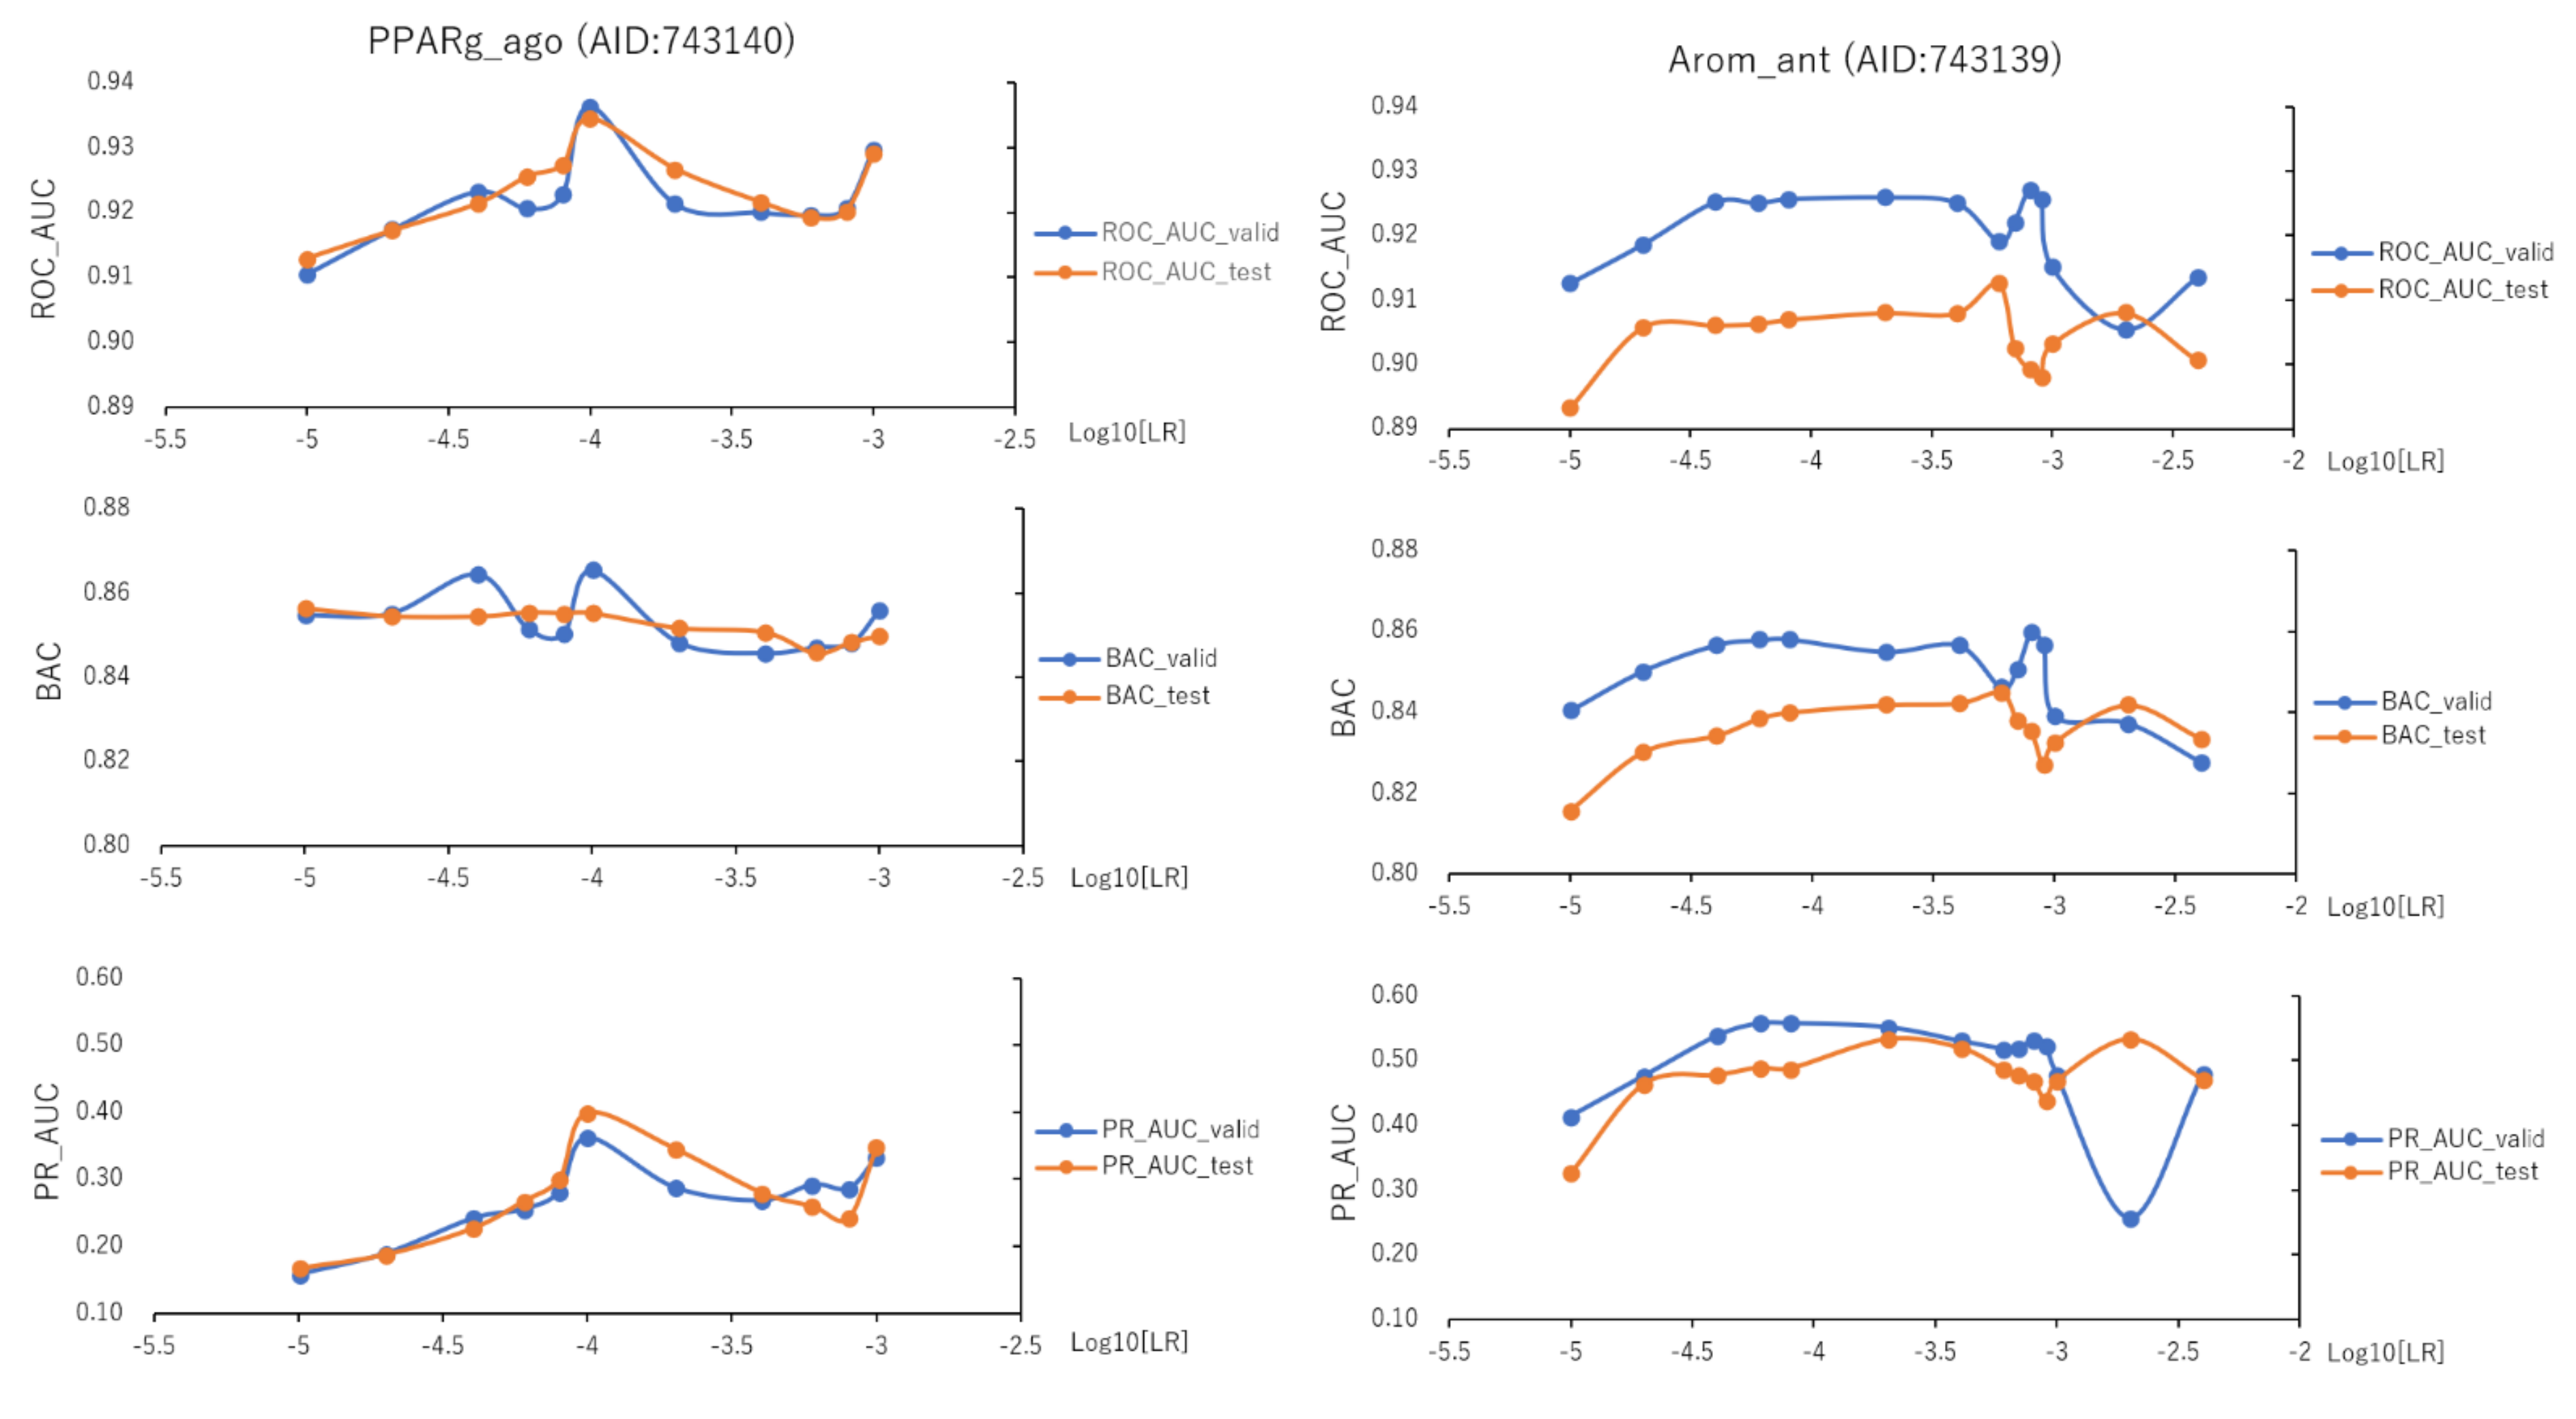
To assess the effect of the hyperparameters in the DeepSnap-DL system on the prediction performance, we optimized 11 learning rates (LRs) from 0.001 to 0.00001 of PPARg_ago using the validation and test datasets (
Figure 10, left;
Figure S11, left;
Table S3). The mean values of ROC_AUC, BAC, PR_AUC (the area under the precision–recall curve), MCC, and Acc on the validation and test datasets for the 11 LRs were 0.916 ± 0.022 (ROC_AUC_valid), 0.916 ± 0.025 (ROC_AUC_test), 0.848 ± 0.018 (BAC_valid), 0.847 ± 0.020 (BAC_test), 0.253 ± 0.077 (PR_AUC_valid), 0.258 ± 0.089 (PR_AUC_test), 0.864 ± 0.024 (F_valid, which is the F-measure (F) value in the validation dataset), 0.868 ± 0.023 (F_tes—which is the F value in the test dataset), 0.791 ± 0.036 (Acc_valid), 0.799 ± 0.036 (Acc_test), 0.259 ± 0.097 (loss_train), 0.239 ± 0.107 (loss_valid), 0.239 ± 0.102 (loss_test), 0.255 ± 0.023 (MCC_valid), and 0.258 ± 0.025 (MCC_test) (
Figure 10, left;
Figure S11, left;
Table S3). The highest prediction performance values on the validation and test datasets for the 11 LRs were 0.936 at LR = 0.0001 (ROC_AUC_valid), 0.934 at LR = 0.0001 (ROC_AUC_test), 0.865 at LR = 0.0001 (BAC_valid), 0.856 at LR = 0.00001 (BAC_test), 0.362 at LR = 0.0001 (PR_AUC_valid), 0.399 at LR = 0.0001 (PR_AUC_test), 0.888 at LR = 0.0001 (F_valid), 0.903 at LR = 0.0001 (F_test), 0.830 at LR = 0.0001 (Acc_valid), 0.854 at LR = 0.0001 (Acc_test), 0.286 at LR = 0.0001 (MCC_valid), and 0.293 at LR = 0.0001 (MCC_test) (
Figure 10, left;
Figure S11, left;
Table S3). The lowest prediction performance values on the training, validation, and test datasets for the 11 LRs were 0.157 at LR = 0.0001 (loss_train), 0.131 at LR = 0.0001 (loss_valid), and 0.147 at LR = 0.0002 (loss_test) (
Figure S11, left;
Table S3).
In addition, we fine-tuned 14 LRs from 0.004 to 0.00001 of Arom_ant using the validation and test datasets (
Figure 10, right;
Figure S11, right;
Table S4). The mean values of ROC_AUC, BAC, PR_AUC, MCC, and Acc on the valid and test datasets for the 14 LRs were 0.920 ± 0.007 (ROC_AUC_valid), 0.904 ± 0.005 (ROC_AUC_test), 0.849 ± 0.010 (BAC_valid), 0.835 ± 0.008 (BAC_test), 0.495 ± 0.079 (PR_AUC_valid), 0.474 ± 0.050 (PR_AUC_test), 0.902 ± 0.017 (F_valid), 0.902 ± 0.005 (F_test), 0.858 ± 0.027 (Acc_valid), 0.858 ± 0.008 (Acc_test), 0.211 ± 0.048 (loss_train), 0.189 ± 0.043 (loss_valid), 0.163 ± 0.043 (loss_test), 0.329 ± 0.030 (MCC_valid), and 0.412 ± 0.011 (MCC_test) (
Figure 10, right;
Figure S11, right;
Table S4). The highest prediction performance values on the validation and test datasets for the 14 LRs were 0.927 at LR = 0.0008 (ROC_AUC_valid), 0.913 at LR = 0.0006 (ROC_AUC_test), 0.860 at LR = 0.0008 (BAC_valid), 0.845 at LR = 0.0006 (BAC_test), 0.557 at LR = 0.00008 (PR_AUC_valid), 0.533 at LR = 0.0002 (PR_AUC_test), 0.925 at LR = 0.00008 (F_valid), 0.845 at LR = 0.0006 (F_test), 0.895 at LR = 0.00008 (Acc_valid), 0.872 at LR = 0.0004 (Acc_test), 0.381 at LR = 0.0008 (MCC_valid), and 0.331 at LR = 0.0004 (MCC_test) (
Figure 10, right;
Figure S11, right;
Table S4). The lowest prediction performance values on the training, validation, and test datasets for the 14 LRs were 0.138 at LR = 0.00008 (loss_train), 0.125 at LR = 0.00006 (loss_valid), and 0.113 at LR = 0.0002 (loss_test) (
Figure S11, right;
Table S4).
To investigate the effect of the batch size (BS) in the improved DeepSnap-DL system on prediction performance, we optimized a total of nine BSs from PPARg_ago, from 2 to 70, using the validation and test datasets (
Figure 11, left;
Figure S12, left;
Table S5). The mean values of ROC_AUC, BAC, PR_AUC, F, Acc, loss, and MCC on the validation and test datasets for the nine BSs were 0.918 ± 0.009 (ROC_AUC_valid), 0.920 ± 0.008 (ROC_AUC_test), 0.851 ± 0.007 (BAC_valid), 0.852 ± 0.006 (BAC_test), 0.233 ± 0.055 (PR_AUC_valid), 0.241 ± 0.045 (PR_AUC_test), 0.868 ± 0.012 (F_valid), 0.870 ± 0.009 (F_test), 0.798 ± 0.018 (Acc_valid), 0.801 ± 0.014 (Acc_test), 0.276 ± 0.084 (loss_train), 0.238 ± 0.081 (loss_valid), 0.213 ± 0.052 (loss_test), 0.259 ± 0.011 (MCC_valid), and 0.260 ± 0.010 (MCC_test) (
Figure 11, left;
Figure S12, left;
Table S5). The highest prediction performance values on the validation and test datasets for the nine BSs were 0.924 at BS = 15 (ROC_AUC_valid), 0.926 at BS = 10 (ROC_AUC_test), 0.859 at BS = 70 (BAC_valid), 0.858 at BS = 70 (BAC_test), 0.309 at BS = 10 (PR_AUC_valid), 0.298 at BS = 30 (PR_AUC_test), 0.884 at BS = 30 (F_valid), 0.882 at BS = 10 (F_test), 0.823 at BS = 30 (Acc_valid), 0.820 at BS = 10 (Acc_test), 0.269 at BS = 30 (MCC_valid), and 0.270 at BS = 10 (MCC_test) (
Figure 11, left;
Figure S12, left;
Table S5). The lowest prediction performance values on the training, validation, and test datasets for the nine BSs were 0.160 at BS = 30 (loss_train), 0.143 at BS = 2 (loss_valid), and 0.140 at BS = 30 (loss_test) (
Figure S12, left;
Table S5).
In addition, we fine-tuned a total of 16 BSs from 5 to 70 of Arom_ant using the validation and test datasets (
Figure 11, right;
Figure S12, right;
Table S6). The mean values of ROC_AUC, BAC, PR_AUC, F, Acc, loss, and MCC on the validation and test datasets for the 16 BSs were 0.921 ± 0.007 (ROC_AUC_valid), 0.906 ± 0.008 (ROC_AUC_test), 0.851 ± 0.010 (BAC_valid), 0.838 ± 0.008 (BAC_test), 0.509 ± 0.029 (PR_AUC_valid), 0.484 ± 0.024 (PR_AUC_test), 0.903 ± 0.010 (F_valid), 0.894 ± 0.005 (F_test), 0.860 ± 0.016 (Acc_valid), 0.853 ± 0.008 (Acc_test), 0.198 ± 0.043 (loss_train), 0.193 ± 0.037 (loss_valid), 0.208 ± 0.037 (loss_test), 0.329 ± 0.019 (MCC_valid), and 0.310 ± 0.009 (MCC_test) (
Figure 11, right;
Figure S12, right;
Table S6). The highest prediction performance values on the validation and test datasets for the 16 BSs were 0.933 at BS = 65 (ROC_AUC_valid), 0.917 at BS = 65 (ROC_AUC_test), 0.864 at BS = 65 (BAC_valid), 0.848 at BS = 30 (BAC_test), 0.561 at BS = 45 (PR_AUC_valid), 0.524 at BS = 70 (PR_AUC_test), 0.919 at BS = 13 (F_valid), 0.912 at BS = 45 (F_test), 0.886 at BS = 13 (Acc_valid), 0.874 at BS = 45 (Acc_test), 0.356 at BS = 13 (MCC_valid), and 0.335 at BS = 45 (MCC_test) (
Figure 11, right;
Figure S12, right;
Table S6). The lowest prediction performance values on the training, validation, and test datasets for the 16 BSs were 0.135 at BS = 60 (loss_train), 0.140 at BS = 45 (loss_valid), and 0.148 at BS = 8 (loss_test) (
Figure S12, right;
Table S6).
2.4. Background Colors in Images Produced by DeepSnap-DL
To examine the effect on prediction performance of the background colors of the snapshot images produced by the improved DeepSnap-DL system, we used a total of nine colors (i.e., blue, cyan, green, magenta, orange, red, wheat, white, and yellow) as different background colors, with seven angles (i.e., 165°, 170°, 176°, 185°, 195°, 200°, and 205°) in the validation and test datasets for PPARg_ago (
Figure 12, left;
Figures S13–S17;
Table S7). The mean values of ROC_AUC, BAC, PR_AUC, F, Acc, loss, and MCC on the validation and test datasets for the nine colors with seven angles were 0.917 ± 0.013 (ROC_AUC_valid), 0.914 ± 0.014 (ROC_AUC_test), 0.851 ± 0.012 (BAC_valid), 0.844 ± 0.013 (BAC_test), 0.247 ± 0.081 (PR_AUC_valid), 0.272 ± 0.098 (PR_AUC_test), 0.864 ± 0.021 (F_valid), 0.865 ± 0.024 (F_test), 0.793 ± 0.032 (Acc_valid), 0.794 ± 0.037 (Acc_test), 0.177 ± 0.082 (loss_train), 0.168 ± 0.083 (loss_valid), 0.169 ± 0.057 (loss_test), 0.261 ± 0.021 (MCC_valid), and 0.255 ± 0.023 (MCC_test) (
Figure 12, left;
Figures S13–S17;
Table S7). The highest prediction performance values among the nine colors on the validation and test datasets were 0.932 ± 0.012 for white (ROC_AUC_valid), 0.931 ± 0.010 for wheat (ROC_AUC_test), 0.862 ± 0.010 for white (BAC_valid), 0.857 ± 0.007 for yellow (BAC_test), 0.347 ± 0.091 for white (PR_AUC_valid), 0.384 ± 0.117 for wheat (PR_AUC_test), 0.877 ± 0.023 for wheat (F_valid), 0.891 ± 0.020 for wheat (F_test), 0.813 ± 0.036 for wheat (Acc_valid), 0.836 ± 0.030 for wheat (Acc_test), 0.278 ± 0.024 for white (MCC_valid), and 0.284 ± 0.018 for wheat (MCC_test) (
Figure 12, left;
Figures S13–S17;
Table S7). The lowest prediction performance values on the training, validation, and test datasets for the nine colors were 0.113 ± 0.056 for white (loss_train), 0.111 ± 0.056 for white (loss_valid), and 0.122 ± 0.023 for white (loss_test) (
Figure S17 Table S7).
We also used a different nine colors (i.e., blue, cyan, green, magenta, orange, red, wheat, white, and yellow) as background colors with the seven angles (i.e., 150°, 155°, 160°, 165°, 170°, 176°, 185°, 195°, 200°, 205°, and 210°) in the validation and test datasets for Arom_ant (
Figure 12, right;
Figures S18–S22;
Table S8). The mean values of ROC_AUC, BAC, PR_AUC, F, Acc, loss, and MCC on the validation and test datasets for the nine colors with 11 angles were 0.919 ± 0.014 (ROC_AUC_valid), 0.895 ± 0.013 (ROC_AUC_test), 0.861 ± 0.023 (BAC_valid), 0.834 ± 0.013 (BAC_test), 0.515 ± 0.097 (PR_AUC_valid), 0.484 ± 0.085 (PR_AUC_test), 0.916 ± 0.018 (F_valid), 0.919 ± 0.015 (F_test), 0.881 ± 0.029 (Acc_valid), 0.886 ± 0.025 (Acc_test), 0.160 ± 0.078 (loss_train), 0.172 ± 0.066 (loss_valid), 0.156 ± 0.043 (loss_test), 0.360 ± 0.051 (MCC_valid), and 0.344 ± 0.034 (MCC_test) (
Figure 12, right;
Figures S15, S16, S19, S20, S22;
Table S8). The highest prediction performance values among the nine colors on the validation and test datasets were 0.927 ± 0.019 for wheat (ROC_AUC_valid), 0.899 ± 0.019 for orange (ROC_AUC_test), 0.874 ± 0.026 for wheat (BAC_valid), 0.839 ± 0.017 for white (BAC_test), 0.581 ± 0.081 for white (PR_AUC_valid), 0.524 ± 0.084 for orange (PR_AUC_test), 0.930 ± 0.015 for wheat (F_valid), 0.924 ± 0.014 for white (F_test), 0.895 ± 0.023 for white (Acc_valid), 0.903 ± 0.024 for wheat (Acc_test), 0.400 ± 0.054 for wheat (MCC_valid), and 0.359 ± 0.038 for white (MCC_test) (
Figure 12, right;
Figures S18–S22;
Table S8). The lowest prediction performance values on the training, validation, and test datasets for the nine colors were 0.122 ± 0.058 for yellow (loss_train), 0.129 ± 0.037 for white (loss_valid), and 0.141 ± 0.024 for wheat (loss_test) (
Figure S22;
Table S8).
In addition, to study the effect of the background colors on the prediction performance of the improved DeepSnap-DL method in greater detail, we selected 11 additional colors (i.e., aquamarine (RGB:0.5,1.0,1.0), blue-white (RGB:0.85,0.85,1.00), Grey70 (RGB:0.7,0.7,0.7), Grey80 (RGB:0.8,0.8,0.8), Grey90 (RGB:0.9,0.9,0.9), light blue (RGB:0.75,0.75,1.00), light pink (RGB:1.00,0.75,0.87), pale cyan (RGB:0.8,1.0,1.0), pale green (RGB:0.65,0.90,0.65), pale yellow (RGB:1.0,1.0,0.5), and violet (RGB:1.0,0.5,1.0)) for the generation of images in DeepSnap with three angles (i.e., 203°, 205°, and 207°) using the validation and test datasets for PPARg_ago (
Figure 13,left;
Figures S23–S25, left;
Table S9). The mean values of ROC_AUC, BAC, PR_AUC, F, Acc, loss, and MCC on the validation and test datasets for the 11 colors with three angles were 0.924 ± 0.004 (ROC_AUC_valid), 0.926 ± 0.007 (ROC_AUC_test), 0.861 ± 0.006 (BAC_valid), 0.850 ± 0.007 (BAC_test), 0.251 ± 0.026 (PR_AUC_valid), 0.339 ± 0.052 (PR_AUC_test), 0.887 ± 0.009 (F_valid), 0.874 ± 0.013 (F_test), 0.829 ± 0.014 (Acc_valid), 0.807 ± 0.020 (Acc_test), 0.207 ± 0.021 (loss_train), 0.184 ± 0.022 (loss_valid), 0.151 ± 0.025 (loss_test), 0.282 ± 0.010 (MCC_valid), and 0.263 ± 0.013 (MCC_test) (
Figure 13, left;
Figures S23–S25, left;
Table S9). The highest prediction performance values among the 11 colors on the validation and test datasets were 0.931 ± 0.002 for light pink (ROC_AUC_valid), 0.935 ± 0.001 for Grey90 (ROC_AUC_test), 0.865 ± 0.003 for aquamarine (BAC_valid), 0.858 ± 0.003 for blue-white (BAC_test), 0.276 ± 0.022 for light pink (PR_AUC_valid), 0.413 ± 0.007 for Grey80 (PR_AUC_test), 0.897 ± 0.009 for Grey80 (F_valid), 0.884 ± 0.012 for light pink (F_test), 0.845 ± 0.015 for Grey80 (Acc_valid), 0.824 ± 0.020 for light pink (Acc_test), 0.295 ± 0.013 for Grey80 (MCC_valid), and 0.275 ± 0.015 for light pink (MCC_test) (
Figure 13, left;
Figures S23–S25, left;
Table S9). The lowest prediction performance values on the training, validation, and test datasets for the 11 colors were 0.173 ± 0.019 for light pink (loss_train), 0.170 ± 0.023 for Grey80 (loss_valid), and 0.129 ± 0.008 for Grey90 (loss_test) (
Figure S25, left;
Table S9).
In addition, we used nine colors (i.e., bright orange (RGB:1.0,0.7,0.2), deep salmon (RGB:1.0,0.5,0.5), gold (RGB:1.00,0.82,0.14), light orange (RGB:1.0,0.8,0.5), light pink (RGB:1.00,0.75,0.87), salmon (RGB:1.0,0.6,0.6), tv_orange (RGB:1.00,0.55,0.15), yellow-orange (RGB:1.00,0.87,0.37), and black (RGB:0,0,0)) to generate images using the improved DeepSnap-DL method with three angles (i.e., 157°, 161°, and 163°) on the validation and test datasets for Arom_ant (
Figure 13, left;
Figures S23–S25, right;
Table S10).
The mean values of ROC_AUC, BAC, PR_AUC, F, Acc, loss, and MCC on the validation and test datasets for the 11 colors with three angles were 0.926 ± 0.006 (ROC_AUC_valid), 0.898 ± 0.005 (ROC_AUC_test), 0.865 ± 0.014 (BAC_valid), 0.836 ± 0.010 (BAC_test), 0.547 ± 0.046 (PR_AUC_valid), 0.487 ± 0.059 (PR_AUC_test), 0.918 ± 0.014 (F_valid), 0.913 ± 0.014 (F_test), 0.884 ± 0.023 (Acc_valid), 0.877 ± 0.023 (Acc_test), 0.151 ± 0.044 (loss_train), 0.136 ± 0.034 (loss_valid), 0.140 ± 0.018 (loss_test), 0.365 ± 0.033 (MCC_valid), and 0.332 ± 0.031 (MCC_test) (
Figure 13, left;
Figures S23–S25, right;
Table S10). The highest prediction performance values among the 11 colors on the validation and test datasets were 0.934 ± 0.005 for tv_orange (ROC_AUC_valid), 0.905 ± 0.002 for tv_orange (ROC_AUC_test), 0.883 ± 0.027 for light orange (BAC_valid), 0.853 ± 0.005 for light pink (BAC_test), 0.614 ± 0.011 for light orange (PR_AUC_valid), 0.553 ± 0.041 for light pink (PR_AUC_test), 0.935 ± 0.009 for light orange (F_valid), 0.938 ± 0.004 for light pink (F_test), 0.911 ± 0.015 for light orange (Acc_valid), 0.918 ± 0.007 for light pink (Acc_test), 0.420 ± 0.012 for light orange (MCC_valid), and 0.404 ± 0.010 for light pink (MCC_test) (
Figure 13, left;
Figures S23–S25, right;
Table S10). The lowest prediction performance values on the training, validation, and test datasets for the 11 colors were 0.110 ± 0.047 for light orange (loss_train), 0.107 ± 0.037 for light pink (loss_valid), and 0.120 ± 0.001 for salmon (loss_test) (
Figure S25, right;
Table S10).


