Article

Modulation of Intestinal Phosphate Transport in Young Goats Fed a Low Phosphorus Diet

Institute for Physiology and Cell Biology, University of Veterinary Medicine Hannover, 30173 Hannover, Germany
*
Author to whom correspondence should be addressed.
Int. J. Mol. Sci. 2021, 22(2), 866; https://doi.org/10.3390/ijms22020866
Submission received: 19 December 2020 / Revised: 7 January 2021 / Accepted: 13 January 2021 / Published: 16 January 2021
(This article belongs to the Special Issue Mechanisms of Phosphate Transport)

Abstract

:
The intestinal absorption of phosphate (Pi) takes place transcellularly through the active NaPi-cotransporters type IIb (NaPiIIb) and III (PiT1 and PiT2) and paracellularly by diffusion through tight junction (TJ) proteins. The localisation along the intestines and the regulation of Pi absorption differ between species and are not fully understood. It is known that 1,25-dihydroxy-vitamin D3 (1,25-(OH)2D3) and phosphorus (P) depletion modulate intestinal Pi absorption in vertebrates in different ways. In addition to the apical uptake into the enterocytes, there are uncertainties regarding the basolateral excretion of Pi. Functional ex vivo experiments in Ussing chambers and molecular studies of small intestinal epithelia were carried out on P-deficient goats in order to elucidate the transepithelial Pi route in the intestine as well as the underlying mechanisms of its regulation and the proteins, which may be involved. The dietary P reduction had no effect on the duodenal and ileal Pi transport rate in growing goats. The ileal PiT1 and PiT2 mRNA expressions increased significantly, while the ileal PiT1 protein expression, the mid jejunal claudin-2 mRNA expression and the serum 1,25-(OH)2D3 levels were significantly reduced. These results advance the state of knowledge concerning the complex mechanisms of the Pi homeostasis in vertebrates.

1. Introduction

The regulation of the mineral homeostasis in vertebrates has been the subject of research for decades. While knowledge about the balance of calcium (Ca) is well advanced, there are still great uncertainties concerning phosphate (Pi). Pi is an essential component of organisms and is involved in many life processes, including energy metabolism, pH buffering and signal transduction. As disturbances in Pi homeostasis cause serious pathologies, the study of Pi balance and its underlying mechanisms including the intestinal absorption are of particular interest. Intestinal Pi absorption from the diet occurs either transcellularly through active transport processes or through paracellular pathways by diffusion. Research on different species has provided inconsistent results regarding the intestinal distribution and regulation of Pi transporters. In mice, it was found that active Pi transport occurs predominantly in the ileum through an Na+-dependent process [1]. Experiments with rats showed that the active Pi transport is most abundant in the duodenum and decreases continuously along the intestinal axis towards the ileum [2]. In adult sheep and growing goats, the ileum has been identified as the main site of active Pi transport [3,4]. The transcellular Pi absorption in the intestine is mediated by secondary active Na+-coupled Pi transporters, which are driven by an Na+-gradient that is generated by the basolateral localised enzyme Na+/K+-adenosine triphosphatase (Na+/K+-ATPase) [5].
The NaPi cotransporter type IIb (NaPiIIb, SLC34A2) was found to be expressed in the intestine and in the lung [6], whereas the NaPi cotransporters type III (PiT1, SLC20A1 and PiT2, SLC20A2) are expressed in various tissues including the intestines, lungs, liver and bones [7]. The expression of both transporter types, NaPiIIb and PiT1/2, is regulated by the supply of phosphorus (P) in different small intestinal segments across the species. Upregulation of Na+-dependent Pi transport by dietary P reduction has been described for the duodenal segment of sheep [4,8]. In this intestinal segment, however, no NaPiIIb could be detected [9], so that the underlying molecular mechanism remained unclear. As in monogastric species, NaPiIIb-mediated Pi transport in the jejunum has been shown in goats [4,10,11], which was stimulated by P depletion [9]. In rats with a P deficiency, the expression of PiT1/2 increased in the duodenum and jejunum, while the expression of PiT2 also increased in the ileum [12]. In addition, in has been shown in monogastric species that 1,25-dihydroxy-vitamin D3 (1,25-(OH)2D3) modulates NaPiIIb as well as PiT1 and PiT2 expression after binding to the vitamin D receptor (VDR) [13,14]. Furthermore, 1,25-(OH)2D3 is the biologically active form of the vitamin D that is synthesised by the conversion of 25-hydroxy-vitamin D3 (25-(OH)D3), mediated by a renal enzyme. The underlying mechanism of the modulation of the Na+-dependent Pi absorption in the intestines differs depending on the species, since NaPiIIb in mice with P deficiency was regulated without involvement of the vitamin D axis [15], and NaPiIIb in goats, despite reduced 1,25-(OH)2D3 levels, remained unchanged [3].
The mechanism of intracellular Pi transport and the basolateral export of Pi is still largely unknown. It is assumed that the xenotropic and polytropic retrovirus receptor 1 (XPR1) is involved in the basolateral export of Pi and in Pi sensing in epithelial cells [16,17]. The passive intestinal Pi absorption takes place according to the electrochemical gradient via tight junction (TJ) proteins, which form selective barriers in the paracellular space between epithelial cells, limiting transepithelial movement of ions, solutes and water [18]. An important group of TJ is represented by the claudins, which can be divided into sealing and permeability-mediating members [19]. It has been found that claudin-2, claudin-12 and claudin-15, which belong to the latter group, form cation-selective, water-permeable pores [20,21]. Claudin-1 is believed to have sealing properties that contribute to the maintenance of the epithelial barrier and epithelial homeostasis [22,23]. Another protein associated with the TJ is the ZO-1, a scaffold protein located at the cytosolic side of the cell membrane, providing structural stability by cross-linking between TJ proteins and the cytoskeleton [24,25]. Occludin is another TJ protein known to mediate the paracellular permeability of macromolecules [26]. Besides the TJ, the adherens-junctions (AJ) are also part of the junctional complex, including cadherin-17, which provides structural stability and integrity of the epithelia [27]. TJ and AJ proteins are modulated by various mediators, such as growth hormones, cytokines and bacterial toxins. A regulation of paracellular mineral transport by 1,25-(OH)2D3 has been demonstrated for claudin-2, claudin-12 and cadherin-17 [21,28]. Little is known about the paracellular Pi transport route and the TJ proteins involved in its mediation.
In order to gain insight into the mechanisms of active and passive Pi transport in the small intestines of growing goats and its regulation by dietary P reduction, functional ex vivo investigations of the duodenal and ileal epithelia in Ussing chamber experiments and molecular determinations of the small intestinal epithelia were carried out. In this study, low P feeding had no effect on the Pi transport rate in the duodenum and ileum. The presence of PiT1 and PiT2 throughout the small intestine was shown, while NaPiIIb expression was restricted to the jejunum and ileum. Both ileal PiT1 and PiT2 mRNA expression increased, whereas protein expression of PiT1 decreased significantly and that of NaPiIIb showed a downward trend in the ileum. Claudin-2 mRNA decreased in the mid jejunum by the dietary P reduction. The regulation of Pi homeostasis in vertebrates is of great complexity and the underlying mechanisms vary widely between species. Therefore, this requires further research for a better understanding.

2. Results

2.1. Intake, Body Weight and Daily Body Weight Gain of Young Goats Fed a Low P Diet

The animals were clinically healthy during the rearing period and the experimental period. The daily energy and Ca supply of both feeding groups and the P supply of the control group were in accordance with the recommendations of the Society of Nutrition Physiology (GfE) for young ruminating goat kids [29]. The daily intake of dry matter (DM), P and Ca from the concentrate was monitored individually for each animal and from the wheat straw estimated by group averages for each animal. The results are summarised in Table 1. The daily body weight gain and the final body weight of goats fed a reduced P diet were significantly reduced compared to goats in the control group (Table 2).

2.2. Concentrations of Pi and Ca in Body Fluids of Young Goats Fed a Low P Diet

In goats fed a reduced P diet, Pi concentrations decreased significantly in all body fluids examined, while Ca concentrations increased significantly in all body fluids with the exception of abomasal fluid, where the increase was not significant (Table 3). The 25-(OH)D3 concentrations increased significantly by 18.7% (p = 0.031), while the 1,25-(OH)2D3 concentrations in the serum of the reduced P feeding group decreased significantly by 27.5% (p = 0.035).

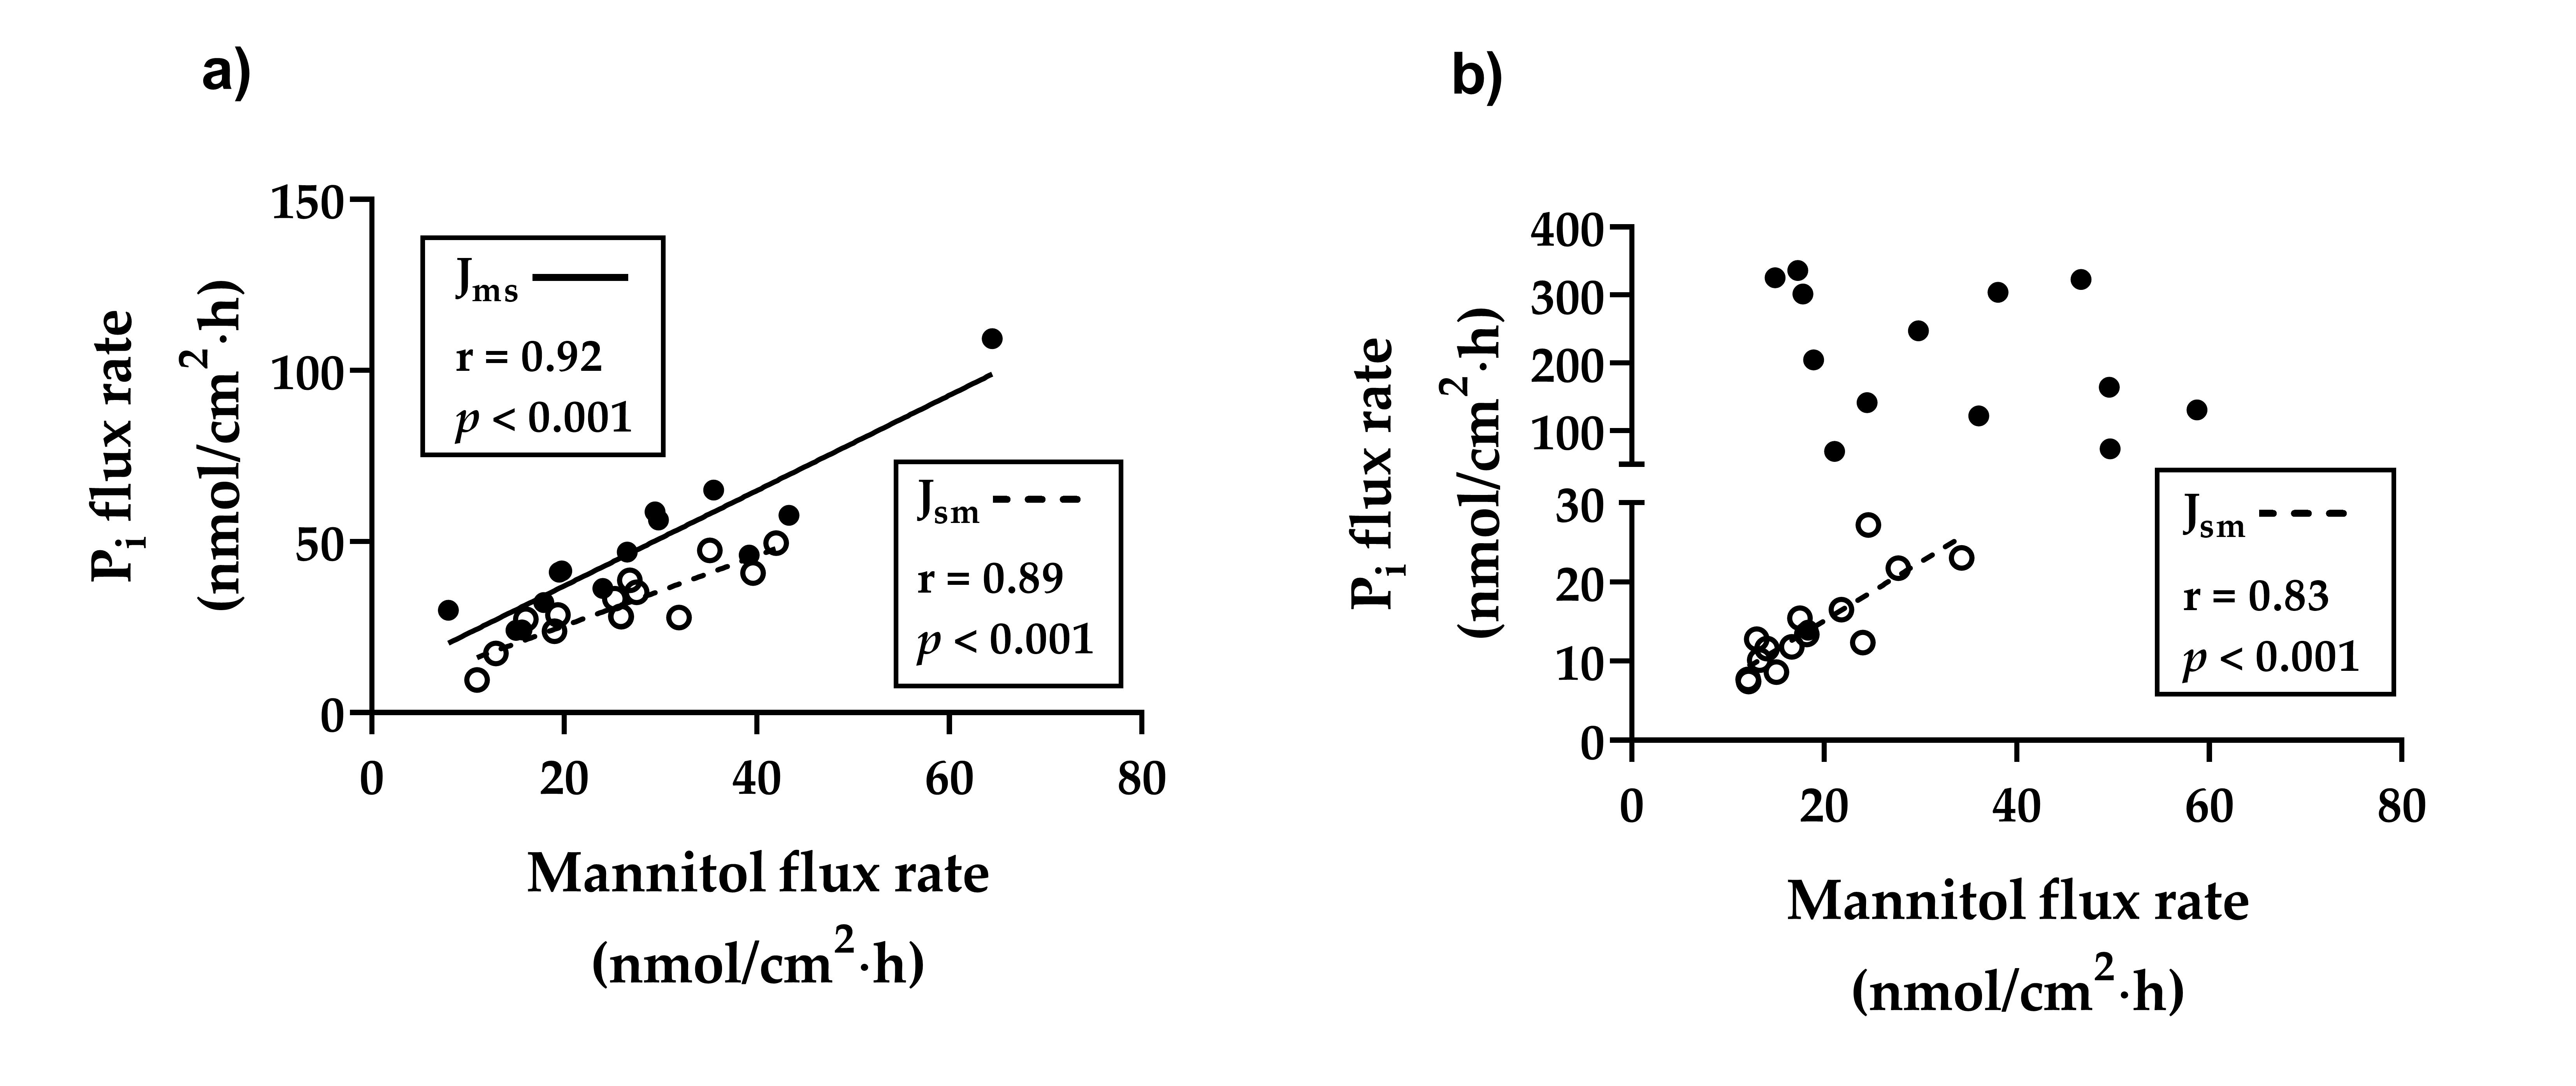
2.3. Flux Rates of Pi Across the Duodenal and Ileal Epithelia of Young Goats Fed a Low P Diet

The Pi net flux rates (Jnet) were significantly higher in the ileum (average of 182.42 nmol/cm2∙h) than in the duodenum (16.67 nmol/cm2∙h) (p < 0.001). The mannitol Jnet flux rates were also significantly higher in the ileum (average of 12.65 nmol/cm2∙h) than in the duodenum (2.12 nmol/cm2∙h) (p < 0.05). In both the duodenal and the ileal segment, the Pi flux rates remained unaffected by dietary P reduction (Table 4). The addition of Na+-arsenate led to a decrease in Pi Jnet by 189% in the duodenum and of 79% in the ileum with no significant differences between both groups. The addition of TAP resulted in a decrease in Pi Jnet of 148% in the duodenum and of 2.54% in the ileum with no significant differences between the feeding groups (data not shown). For both intestinal segments, significant correlations between Pi Jsm and mannitol Jsm were shown by linear regression (Figure 1a,b). Another positive correlation could be shown between Pi Jms and mannitol Jms in the duodenum (Figure 1a), while no correlation was found between Pi Jms and mannitol Jms in the ileum (Figure 1b).

2.4. Electrophysiological Parameters of Duodenal and Ileal Epithelia of Young Goats Fed a Low P Diet

The basal Isc and Gt were neither in the duodenum nor in the ileum in young goats affected by the reduced P feeding regime (Table 5). In duodenal epithelia, the addition of Na+-arsenate led to an increase in Isc (control: p < 0.01; P reduction: p < 0.001) and Gt (control and P reduction: p < 0.01) (Figure 2a,b). In ileal epithelia, the Isc decreased after Na+-arsenate was added (control: p < 0.01; P reduction: p = 0.055), while the Gt reacted with a delayed increase (control: p < 0.01; P reduction: p < 0.05) (Figure 2c,d). The addition of TAP resulted in a transient decrease in Isc in both intestinal segments (duodenum: control and P reduction: p < 0.01; ileum: control and P reduction: p < 0.05), followed by a slight increase in the duodenum of the reduced P feeding group (Figure 3a,c). The Gt decreased in both intestinal segments after the addition of TAP (duodenum: control: p < 0.01, P reduction: p < 0.05; ileum: control and P reduction p < 0.01) (Figure 3b,d). The changes in Isc (∆Isc) and Gt (∆Gt) after adding the inhibitors showed no significant group differences. All data are summarised in Table 6.

2.5. Intestinal mRNA Expression of Na+/K+-ATPase, NaPiIIb, PiT1, PiT2, VDR, XPR1, Cadherin-17, Claudin-1, Claudin-2, Claudin-12, Claudin-15, Occludin and ZO-1 in Young Goats Fed a Low P Diet

In this section, the results are only described in detail if there was at least a tendency for group differences (p < 0.1). For the isolated RNA from intestinal epithelia used for quantitative PCR, the mean RNA integrity numbers with their standard errors were determined in the duodenum (8.11 ± 0.29), mid jejunum (8.28 ± 0.28) and ileum (8.91 ± 0.26). The claudin-2 mRNA expression was significantly decreased in the mid jejunal epithelia of the reduced P feeding group. The PiT1 and PiT2 mRNA expression was significantly increased in the ileal epithelia of the reduced P feeding group. NaPiIIb in the duodenal epithelia and both cadherin-17 and ZO-1 in the ileal epithelia tended to be higher in the reduced P feeding group. All data are summarised in Table 7. The mRNA expression of PiT1 correlated positively with plasma Ca concentrations (Figure 4).

2.6. Intestinal Protein Expressions of Na+/K+-ATPase, NaPiIIb and PiT1 in Ileal Epithelia of Young Goats Fed a Low P Diet

The protein expression of PiT1 decreased significantly and that of NaPiIIb showed a downward trend in the ileal epithelia of the reduced P feeding group, while no changes were found in the protein expression of Na+/K+-ATPase (Table 8). The PiT1 protein expression (Figure 5a), the Na+/K+ATPase protein expression (Na+/K+ATPase protein = (112,467 ± 44,092), plasma Pi = (1,820,969 ± 69,285), r = 0.59, p = 0.025) and the NaPiIIb protein expression (NaPiIIb protein = (183,940 ± 92,068), plasma Pi = (298,931 ± 144,673), r = 0.50, p = 0.07) showed a trend regarding positive correlation with the plasma Pi concentrations, while a negative relationship was detected between the PiT1 protein expression and both the plasma Ca concentrations (Figure 5b) and the serum 25-(OH)D3 levels (Figure 5c).

3. Discussion

The aim of this study was to investigate the influence of dietary P reduction on transepithelial Pi transport at a functional and molecular level along the small intestinal axis of young goats. Changes in mineral homeostasis, such as hypophosphataemia and hypercalcemia are well known in P-deficient animals [30,31,32,33] and are also reflected in other examined body fluids. Hypercalcemia could result from increased resorption of Ca-Pi compounds from the skeleton, in order to compensate for the inadequate supply of P [34].
In addition to hypophosphataemia, which is usually associated with reduced feed consumption [35,36,37,38], the described hypercalcaemia could lead to a depression in feed intake [39,40,41] and thus may have caused the reduction in feed intake and final body weight. Although the underlying control mechanism of decreased feed intake due to low P diets is still unclear, it is believed that hypophosphataemia leads to a central nervous system disorder, as human patients with severe hypophosphataemia suffered from confusion and loss of appetite, which could be resolved by administration of Pi [42]. It is assumed that hypercalcaemia impairs the contractility of the smooth muscles of the gastrointestinal tract and thus causes digestive disorders along with reduced appetite [43,44,45]. In addition, a Pi deficiency in the forestomach of ruminants could lead to reduced microbial fermentation and a lower digestibility of organic matter. However, the Pi concentration measured in the ruminal fluid was well above the minimal requirement of 0.7–2.6 mmol/L and can therefore be excluded as a cause of the reduced body weight gain [46,47,48].
In monogastric species, e.g., pigs, rats and chickens, it was demonstrated that 1,25-(OH)2D3 levels increased due to low P (and/or low Ca) feeding [49,50,51], while in small ruminants this was only the case in response to a depletion of Ca [3], but not of P [52,53]. One reason for the decreased 1,25-(OH)2D3 levels in the present study could be the particularly pronounced hypercalcaemia, since experiments with rats have shown that elevated blood Ca concentrations down-regulate the 1,25-(OH)2D3 levels [54,55].
Both P depletion [4,9,45] and 1,25-(OH)2D3 [10,56,57,58] stimulate Pi absorption in the small intestines of various species, including ruminants. The results of several studies with rodents have indicated that increased intestinal Pi absorption is due to stimulated intestinal NaPiIIb expression, which is mediated by increased 1,25-(OH)2D3 [14,59]. However, in VDR- or 1α hydroxylase-knockout (KO) mice fed a reduced P diet, the expression of NaPiIIb increased as in wild type animals, thus without involvement of the vitamin D axis, demonstrating the existence of a vitamin D-independent mechanism for upregulation of intestinal Pi transport [15]. Earlier experiments with P-depleted mice showed that the upregulation of renal NaPiIIa was mediated by increased expression of the transcription factor µE3 (TFE3), which promotes the expression of the transporter gene via Pi response elements in its promoter sequence [60]. Similar mechanisms are considered to be involved in mediating a diet-induced upregulation of NaPiIIb in the intestine of mice [61] and could, therefore, possibly be applied to ruminants.
In the present study, the duodenal Pi flux rates were relatively low compared to the jejunum [62] and ileum and were in a similar range to duodenal Pi transport from previous experiments with goats [3,4], indicating that the duodenum is of minor importance for intestinal Pi absorption. The applied feeding regime had no effect on Pi transport in the duodenum. This is in line with previous studies in goats that demonstrated increased Pi transport due to low P feeding in the jejunum, while duodenal Pi transport remained unchanged. In addition, it was shown that the upregulation of active jejunal Pi transport is mediated by an increase in NaPiIIb protein expression [9]. Since NaPiIIb is practically non-existent in the duodenum of ruminants and is mainly expressed in the jejunum and ileum [3,63], an upregulation of the active Pi transport induced by low P feeding and mediated by an increase in NaPiIIb, as mentioned above for the jejunum [9], can be excluded for the duodenum of growing goats. In fact, no upregulation of NaPiIIb due to reduced P feeding was demonstrated at the mRNA level in the duodenum and jejunum and neither at the mRNA nor at the protein level in the ileum, suggesting that neither the ileum nor the duodenum is a target of P deficiency induced upregulation of NaPiIIb. An upregulation of jejunal NaPiIIb at the protein level without impairing the transcription rate, as demonstrated in previous studies [9], cannot be ruled out and is very likely. In addition, an extensive part of the duodenal Pi transport in the Ussing chamber experiments occurred via the paracellular pathway, as indicated by the positive correlation between Jms flux rates of Pi and the corresponding mannitol flux rates. Under in vivo conditions, there is an electrical gradient across the intestinal epithelium (negative mucous membrane) [64], which could potentially drive the passive Pi transport even if the plasma Pi exceeds the lumen Pi [65]. Since the electrical gradient is eliminated in Ussing chamber experiments, the actual extent of passive Pi transport under physiological conditions remains unclear.
Relatively high Pi flux rates in the ileum are in agreement with the results of previous experiments in which the ileum was identified as the intestinal segment with the highest Pi transport rate in ruminants [3]. Due to the short length and the localisation of the ileum at the end of the small intestine, as well as the physiological properties of the chymus, which contains lower concentrations of Pi [66], Pi absorption can only be mediated by active transport. The missing correlation between Jms flux rates of Pi and the corresponding mannitol flux rates confirmed that the Pi absorption in the ileum was mainly via the transcellular pathway. Another group of Pi transporters (SLC20) that contribute to active Pi transport includes the NaPi-cotransporters PiT1 and PiT2. The mRNA expression of PiT1 and, for the first time in goats, PiT2 was found in all examined intestinal segments. While PiT1 and PiT2 mRNA remained unchanged in the duodenum, both increased in the ileum due to dietary P reduction. Paradoxically, it was found that ileal PiT1 protein expression was downregulated, which is reflected in unchanged ileal Pi transport. In rats, administering 1,25-(OH)2D3 apparently upregulates intestinal PiT2 [13], while P depletion upregulates both PiT1 and PiT2 [12]. The underlying mechanism of the regulation of PiT1 and PiT2 has not yet been conclusively clarified and is the subject of current research, considering Pi-sensing and the post-translational modulation of their activity by extracellular Pi [67,68]. The fact that PiT1 mRNA expression correlates positively, while its protein expression correlates negatively with plasma Ca, indicates complex regulative mechanisms by the mineral homeostasis. Moreover, a direct effect of plasma Pi on the protein expression of PiT1 cannot be ruled out since a positive correlation was found. However, it is also possible that 25-(OH)D3 is involved in the modulation of PiT1, as it negatively correlates with PiT1 protein expression.
Adding Na+-arsenate led to a significant decrease in duodenal and ileal Pi transport rates, which can be explained by competitive inhibition of the active Pi transporters PiT1 and PiT2 in both segments and also NaPiIIb in the ileum [5]. TAP is known as a blocker of TJ proteins [69] and inhibits the paracellular transport of Pi in a yet unknown way. Adding TAP led to an enormous reduction in Pi transport in the duodenum, since paracellular transport is particularly extensive here, while the reduction in the ileum was negligible, due to the minor role played by the paracellular pathway of Pi in the ileum.
By passing an external current through the epithelium, the potential was clamped to zero in order to eliminate the passive transepithelial driving force, generated by the spontaneous electrical potential across the epithelium. This current is equivalent to the algebraic sum of electrogenic ion movement by active transport and is referred to the short-circuit current (Isc) [70]. A positive value indicates the transport of mainly ions with a positive charge in a serosal direction or negatively charged ions in the opposite direction. The electrophysiological parameters remained unchanged in both the duodenum and the ileum by the dietary P reduction, which in the case of Isc could be due to the unchanged Pi transport rates in the intestinal segments due to the applied feeding regime. For the Gt, it can be concluded that the reduced P feeding had no influence on the integrity and therefore on the permeability of the tissues.
The Isc value measured for the duodenum is similar to those measured in previous studies with sheep and goats [4,62]. It is known that PiT1 and PiT2 preferentially transport monovalent Pi and that according to the Na+:Pi stoichiometry of 2:1, with each Pi-anion, a positive charge is transported in the serosal direction [5,12,71], which results in a positive Isc value. That Isc is highest in the ileum has already been shown in sheep and goats [4,72] and indicates either higher net absorption of cations or higher net secretion of anions than in upper intestinal segments. This can most likely be explained by the greater abundance of PiT1 and PiT2 in the ileum, which shifts a positive charge to the serosal side of the epithelium with each Pi-anion. In addition, NaPiIIb is expressed in the ileum, which participates in active Pi transport and preferentially transports divalent Pi, whereby again, one positive charge is moved to the serosal side of the epithelium [71]. Therefore, the sum of the charge shifts can result in a higher Isc in the ileum compared to the duodenum. The Gt values measured in the duodenum and ileum in the present study are similar to those in previous studies with sheep and goat intestine and confirm the integrity of the epithelium over the duration of the experiment [4,62,72].
The increased Isc in the duodenum after the adding Na+-arsenate indicates an ion current through the epithelium, which could be caused by PiT1 activity [73] or by passive diffusion of cations to the serosal side following the chemical gradient. In the ileum, Na+-arsenate causes a significant reduction in Isc, which can be explained by the competitive inhibition of NaPiIIb, PiT1 and PiT2 [5], which reduces the movement of positive charge to the serosal side. As a TJ blocker, TAP slightly lowered Isc in the duodenum and more clearly in the ileum for a short time, followed by an increase in the duodenum of the P-reduced feeding group, which indicates an induced charge shift across the epithelia after inhibition. Moreover, the blocking of TJ proteins by TAP resulted in significantly reduced Gt values, which indicates a reduced paracellular permeability in the duodenum and ileum.
In order to investigate a potential involvement of the vitamin D axis in the regulation of Pi transport in growing goats it was of interest to investigate whether the VDR, a ligand-dependent transcription factor [74] is modulated by the applied feeding regime. In VDR KO mice, hypocalcaemia and hypophosphataemia occurred, accompanied by skeletal changes as rickets and osteomalacia. The elimination of the vitamin D axis at the receptor level resulted in decreased intestinal Ca absorption, which led to secondary hyperparathyroidism. The rise in the parathyroid hormone, in turn, caused hypophosphataemia due to increased renal Pi secretion [75]. In P-depleted rats, VDR was upregulated in the intestine [76]. Previous studies in P-depleted goats addressed the receptor-binding affinity and found it to be increased in lactating [77], but not in growing goats [32]. In the present study, the VDR mRNA expression in the duodenum, jejunum and ileum did not change due to the applied feeding regime, which supports the assumption that the VDR regulation is not relevant for the upregulation of intestinal Pi absorption in P-depleted growing goats.
For a better understanding of the transcellular Pi pathway, it is of interest to explain not only the apical Pi uptake into the enterocytes, but also the basolateral Pi export. Experiments in cell cultures showed that the depletion of XPR1 induced a decrease in Pi export and that reintroduction of various XPR1 proteins resolved this defect. From these results, it was concluded, that XPR1 is a Pi exporter in vertebrates [17]. In the present study, XPR1 mRNA expression could be found in all examined intestinal segments and the mRNA levels remained unchanged, which indicates that XPR1 mediates the basolateral Pi export in growing goats and is not influenced by P reduced feeding.
In standard or high P diets, passive transepithelial Pi transport, driven by electrochemical gradients, has been shown to be the predominant Pi pathway in rodents, as the luminal Pi concentration exceeded that of the plasma severalfold, providing a chemical gradient for passive transport [65]. In order to investigate a potential modulation of paracellular Pi absorption by reduced dietary P, the present study focused not only on proteins involved in active Pi absorption, but also on TJ proteins, which are potentially involved in the mediation of the paracellular Pi pathway. TJ discriminate ions by charge and size [78] and appear to preferentially transport the monovalent Pi species, which tends to be more abundant at a rather acidic pH [65]. This supports the assumption that in growing goats the paracellular Pi uptake is particularly extensive in the duodenum, where the pH of the chymus is lower than in distally located intestinal segments, as has been shown in sheep [79].
Little is known about the involvement of the TJ proteins mentioned above in the mediation of paracellular Pi transport. Previous research in goats and VDR-KO mice revealed a 1,25-(OH)2D3-dependent regulation of members of the claudin family including claudin-2, which plays an important role in paracellular Ca transport [21,72]. Thus, down-regulation of jejunal claudin-2 expression in the present study is assumed to be a consequence of diminished 1,25-(OH)2D3 levels in P-depleted goats, although no correlation could be found between jejunal claudin-2 mRNA expression and serum 1,25-(OH)2D3.
Both transcellular and paracellular Pi transport in the vertebrate intestine are not yet fully understood. The regulatory mechanisms differ between species and are the subject of ongoing research. The results of this study contribute to a better understanding of the transepithelial Pi signalling pathway and the regulation of Pi transport by dietary P depletion.

4. Materials and Methods

4.1. Animals and Feeding Regimes

The experimental conditions of animal treatment and feeding were approved by the Animal Welfare Officer of the University of Veterinary Medicine Hannover, Hannover, Germany and were in accordance with the German Animal Welfare Law (permit number: 33.19-42502-04-19/3076; Lower Saxonian State Office for Consumer Protection and Food Safety (LAVES); 15 March 2019).
Fourteen male Coloured German goats of about one week of age were randomly assigned by weight-matched pairs into two groups of seven animals each and kept in stable compartments of approximately eight square metres bedded with sawdust. During the rearing, the animals were fed with a commercially available milk replacer and wheat straw ad libitum. From the 6th week of life and over a period of four weeks, the goats were gradually weaned and adapted to the pelleted control diet. Subsequently, the control diet in one group was gradually replaced by a P-reduced experimental diet within five days. The pelleted concentrate was offered to the goats individually twice daily (55 g/kg0.75/d), while straw was offered in group feeding (25% of the concentrate weight). Water was available ad libitum. The feeds offered and refused were measured daily to determine the mean intake per animal. The amount of feed was adjusted weekly to the weight of the animals.

4.2. Diets

The DM, crude ash, CP, crude fat and crude fibre content of the feed was determined by Weende analysis this being the standard method of the Association of German Agricultural Investigation and Research Centre (VDLUFA) [80]. The content of acid-detergent fibre and neutral-detergent fibre was determined using the Van Soest method and corrected to organic matter (ADFom; aNDFom) [81]. The control diet contained 0.42% P, while the reduced P diet contained 0.10% P. The diets were isoenergetic (approximately 12.9 MJ ME/kg DM) and contained comparable amounts of Ca (approximately 12.5 g/kg DM). The components and composition of the diets are summarised in Table 9.

4.3. Intestinal Tissue and Body Fluid Sampling

After an experimental period of five to seven weeks, one animal per day was slaughtered by exsanguination after captive bolt stunning in a group-alternating manner. Blood and saliva samples were taken shortly before the slaughter. Blood samples of 9 mL each were obtained by puncturing the external jugular vein with lithium heparin- and EDTA-coated syringes and serum syringes (Sarstedt AG & Co. KG, Nümbrecht, Germany). The plasma separation was carried out by centrifugation at 2000× g for 15 min at room temperature (RT). Saliva samples were collected using the Salivette® (Sarstedt). For this purpose, a cotton swab was placed in the cheek pouch for 2 min using an artery clamp, before it was centrifuged in the test tube at 1000× g for 2 min at RT. Blood and saliva samples were stored at −20 °C. Intestinal segments (duodenum, mid jejunum and ileum) were exenterated within 5 min after death. For the Ussing chamber experiments, duodenal and ileal segments were rinsed with ice-cold saline (0.9%, w/v), opened along the mesenteric line and kept in a modified glucose-containing Krebs–Henseleit buffer solution with carbogen aeration (95% O2, 5% CO2) for further preparation. For RNA isolation and crude membrane preparation, the tunica mucosa of all intestinal segments was stripped, frozen in liquid nitrogen and stored at −80 °C.

4.4. Ussing Chamber Experiments

Ussing chamber experiments provide insight into transepithelial transport processes with regard to flux rates and electrophysiological parameters. The experiments were conducted with duodenal and ileal tissue samples using twelve chambers for each segment. After stripping off the tunica serosa and tunica muscularis, the remaining tunica mucosa was mounted between the two halves of the incubation chambers with an exposed serosal area of 1.0 cm2, dividing each chamber into a mucosal and serosal compartment. Both sides of the tissue were incubated with 10 mL of 38 °C warm buffer solution, which was continuously aerated with carbogen and maintained at pH 7.4. Both the serosal and the mucosal buffer solutions contained (mmol/L) 113.6 NaCl, 5.4 KCl, 0.2 HCl (1n), 1.2 MgCl2·6H2O, 21.0 NaHCO3, 1.2 CaCl2·2H2O, 1.2 Na2HPO4·2H2O, 1.2 mannitol and 0.01 indomethacin. The serosal buffer additionally contained (mmol/L) 10.0 glucose, 6.0 Na+-gluconate and 7.0 HEPES, while 6.0 NaOH (1n) and 20.0 HEPES were added to the mucosal buffer. Towards the end of the experiment, Na+-arsenate (5 mmol/L) or 2,4,6-triaminopyrimidine (TAP) (20 mmol/L) were added to the mucosal side of four chambers each. As a competitive inhibitor of Na+-dependent Pi transport, Na+-arsenate was used to investigate the transcellular Pi pathway [82]. TAP was used to investigate the paracellular Pi pathway as it blocks TJ proteins [83] and is supposed to inhibit paracellular Pi transport. The remaining four chambers were time controls to which no inhibitors were added.

4.4.1. Flux Rate Studies

The investigation of the transepithelial flux rates of Pi in the duodenum and ileum was based on the radioisotope tracer technique and was conducted in accordance with established protocols using 32P und 3H(-mannitol) as radio isotopic tracers [4]. 32P was used to trace the total transepithelial Pi transports, while (3H-) mannitol marked the paracellular Pi transport [84]. After an equilibration time of 5–10 min, 148 kBq of the respective radioisotope was added to each chamber either to the serosal or mucosal side. For a period of 60 min, samples were taken from the unlabelled side at 15 min intervals and immediately replaced by equal volumes of the respective buffer solution. Additionally, samples were taken from the radioactively labelled side at the beginning and at the end of the experiment. The sampling before and after adding of inhibitors was performed to obtain information about the respective proportion of the transcellular and paracellular Pi transport on total Pi transport. A liquid scintillation counter (Packard BioScience Company, Meriden, CT, USA) was used to determine the radioactivity of the samples. Without electrochemical gradients, unidirectional flux rates of Pi and mannitol from mucosal to serosal (Jms) and in the opposite direction from serosal to mucosal (Jsm) were calculated from the appearance rate of the respective tracer on the unlabelled side using standard equations [85]. The net flux rates (Jnet) were determined by subtracting Jsm from Jms of paired tissues.

4.4.2. Electrophysiological Studies

Using a computer-controlled voltage clamp device (Mussler Scientific Instruments, Aachen, Germany), the potential differences, tissue conductance (Gt) and short circuit currents (Isc) were continuously monitored. The experiments were carried out under short-circuited conditions. The basal values for Gt and Isc were determined as mean values over the time before adding the inhibitor. In order to examine the effects of Na+-arsenate or TAP on the transepithelial transport processes in the duodenum and ileum, changes in Gt and Isc were observed after the addition. Tissue viability was monitored by continuously recording Gt and Isc and by adding glucose (10 mmol/L) to the mucosal side and forskolin (0.01 mmol/L) to the serosal of all chambers at the end of the experiments. The change in Isc in response to the addition of glucose and forskolin indicated epithelial viability and integrity.

4.5. Biochemical Determinations

Inorganic Pi and Ca concentrations were determined colorimetrically in plasma, saliva, ruminal and abomasal fluids by standard spectrometric methods [86,87] (inter-assay CV 4.9% (Pi) and 5.7% (Ca); intra-assay CV 1.4% (Pi) and 3.8% (Ca)), respectively. Serum concentrations of 25-(OH)D3 and 1,25-(OH)2D3 were measured using HPLC or a competitive ELISA (Immundiagnostik AG, Bensheim, Germany).

4.6. RNA Isolation and Reverse Transcription

Using the RNeasy® Plus Mini-Kit (Qiagen GmbH, Hilden, Germany), total RNA was isolated in accordance with the manufacturer’s protocol. The concentration and integrity of the isolated RNA were measured spectrophotometrically using the NanoDrop One (Thermo Fisher Scientific Inc., Waltham, MA, USA) and an RNA 6000 nanoassay for an Agilent 2100 Bioanalyzer (Agilent Technologies, Böblingen, Germany). In accordance with the manufacturer’s protocol, 200 ng of the isolated RNA was reverse-transcripted, using TaqMan™ Reverse Transcription Reagents including random hexamer and oligo dT primers (Applied Biosystems Inc., Thermo Fisher Scientific, Waltham, MA, USA).

4.7. Intestinal mRNA Expression of Na+/K+-ATPase, NaPiIIb, PiT1, PiT2, VDR, XPR1, Cadherin-17, Claudin-1, Claudin-2, Claudin-12, Claudin-15, Occludin and ZO-1

In order to quantify the expression abundances of 18S, claudin-2 and claudin-12 in duodenal, mid jejunal and ileal epithelia, caprine-specific TaqMan™ primers and probes were purchased from TIB MOLBIOL (Berlin, Germany) (Table 10). Reaction mixtures of 20 µL contained TaqMan™ Universal Master Mix (Applied Biosystems Inc.), 16 ng reverse-transcripted complementary DNA (cDNA), 300 nmol/L specific primers and 100 nmol/L specific probe. PCR product amplification (2 min at 50 °C; 10 min at 95 °C; 40 cycles of 15 s at 95 °C and 1 min at 60 °C) and analysis were conducted using a real-time PCR cycler (CFX96TM; Bio-Rad Laboratories GmbH, Munich, Germany). The expression of NaPiIIb, PiT1, PiT2, Na+/K+-ATPase, XPR1, claudin-1, claudin-15, cadherin-17, occludin, ZO-1 and VDR in the duodenal, mid jejunal and ileal epithelia were determined using SYBR Green® PCR assays. Specific primers for expression abundance determinations were in the case of NaPiIIb, PiT1, cadherin-17, occludin and ZO-1 purchased from TIB MOLBIOL GmbH (Berlin, Germany) and in the case of Na+/K+-ATPase, PiT2, VDR, XPR1, VDR, claudin-1 and claudin-15 synthesised by Thermo Fisher Scientific Inc. (Table 11). The reaction mixtures of 20 µL contained SensiFAST™ SYBR No-Rox Mix (BioCat, Heidelberg, Germany), 16 ng reverse-transcribed cDNA and 200 nmol/L specific primers. The PCR product amplification (3 min at 95 °C; 40 cycles of 10 s at 95 °C and 30 s at 60 °C) and analysis were conducted using a real-time PCR cycler (CFX96TM; Bio-Rad Laboratories GmbH). To determine the melt curve, the thermal profile began with an incubation of 10 min at 55 °C with a gradual increase in temperature (0.5 °C/10 s) to 95 °C. Calibration curves generated with cloned PCR fragment standards were used to determine the absolute copy numbers [88]. The specificity of the amplicons was verified by sequencing (Microsynth Seqlab GmbH, Göttingen, Germany) and using NCBI Blast (Bethesda, MD, USA) [89]. The expression abundance of genes of interest was normalised to 18S as a constant expressed reference gene. Each reaction was carried out twice and included a no template control (NTC).

4.8. Intestinal Protein Expression of Na+/K+-ATPase, NaPiIIb and PiT1

The protein expression of Na+/K+-ATPase, NaPiIIb and PiT1 was examined exclusively in the ileal epithelium. This was done with regard to the results of the Ussing chamber experiments and the qPCR results, which indicate that the ileum is an important intestinal segment for Pi transport. For the abundance of NaPiIIb and PiT1, brush border membranes (BBM) were prepared using the method described by Wilkens et al. [88]. Crude membranes (CM) were isolated as described by Wilkens et al. [92] for the determining Na+/K+-ATPase protein expression. The protein concentrations of all cell fractions were measured with a commercial Bradford assay (Serva Electrophresis GmbH, Heidelberg, Germany). For PiT1, 10 µg of BBM were separated by 8.5% SDS-PAGE and transferred onto nitrocellulose membranes. The membranes were blocked in PBST and 5% fat-free milk powder for 1 h at RT. The PiT1 protein was detected in ileal BBM incubating with the diluted antibody (gift from V. Sorribas, Laboratory of Molecular Toxicology, University of Zaragoza, Zaragoza, Spain) in PBST over night at 4 °C. The immunoreactivity of the primary antibodies was detected using an HRP-coupled secondary antibody against rabbit (diluted 1:10,000). The bound antibodies were visualised using enhanced chemiluminescence (SuperSignal, Thermo Fisher Scientific Inc.) in accordance with the manufacturer’s protocol and a ChemiDoc system (Bio-Rad Laboratories GmbH). Immunoblot assays used for detecting of the expression of NaPiIIb and Na+/K+-ATPase proteins in caprine tissue were carried out as described elsewhere [3,93]. Total protein on immunoblots was stained with Indian ink. Densitometric measurements of proteins were performed using Image Lab 5.2.1 software (Bio-Rad Laboratories GmbH). In order to be able to semi-quantify the ileal NaPiIIb, PiT1 and Na+/K+-ATPase proteins, the band intensities for the examined proteins were normalised to the amount of total protein applied per lane.

4.9. Statistical Analysis

The sample size (minimum n 7/group) was calculated using the GPower software 3.1.9.4 based on metabolic data from previous work [3] with a statistical power of 0.8 and α error of 0.05. All data are given as means ± SEM. The statistical software GraphPad Prism version 8.0.1 for Windows (San Diego, CA, USA) [94] was used for data analysis. All data were tested for normal distribution using the Shapiro–Wilk test and analysed for significant differences using the unpaired Student’s t-test. The paired Student’s t-tests were performed for the differences of Gt and Isc values before and after adding of inhibitor substances (∆Isc, ∆Gt). Potential relationships between measured parameters were analysed by Pearson’s correlation and linear regression.

Author Contributions

A.S.M.-B. conceived and design research; J.L.B., K.H. (Kathrin Hansen), N.S., K.H. (Karin Hustedt) and M.B. performed experiments; A.S.M.-B., J.L.B., S.K. and M.B. analysed data; A.S.M.-B., J.L.B., G.B. and S.K. interpreted results of experiments; J.L.B. prepared figures; J.L.B. drafted manuscript. All authors edited, revised and approved the final version of the manuscript. All authors have read and agreed to the published version of the manuscript.

Funding

The H. Wilhelm Schaumann Foundation financially supported this project by funding a doctoral scholarship. This publication was supported by Deutsche Forschungsgemeinschaft and University of Veterinary Medicine Hannover, Foundation within the funding programme Open Access Publishing.

Institutional Review Board Statement

The study was conducted according to the guidelines of the Declaration of Helsinki, and approved by the Institutional Review Board (or Ethics Committee) of the University of Veterinary Medicine Hannover (protocol code 33.19-42502-04-19/3076: 15 March 2019).

Informed Consent Statement

Not applicable.

Data Availability Statement

The data presented in this study are available on request from the corresponding author.

Acknowledgments

The financial support of the H. Wilhelm Schaumann Foundation is gratefully acknowledged Special thanks go to Anna Gülicher for performing the Western blot analyses, to Kerstin Kiri and Dirk Voigtländer for the technical support with the Ussing chamber experiments, and to Yvonne Armbrecht and Michael Rohde for caring for the animals. Moreover, the authors would like to thank Frances Sherwood-Brock for proofreading the manuscript. Finally, we would like to thank Jürg Biber, Institute of Physiology, University of Zurich, Switzerland for providing the anti NaPiIIb antibody.

Conflicts of Interest

The authors declare no conflict of interest.

Abbreviations

1,25-(OH)2D3 1,25-dihydroxy-vitamin D3
25-(OH)D325-hydroxy-vitamin D3
AJAdherens-junctions
BBMBrush border membranes
CaCalcium
CPCrude protein
DMDry matter
K+Potassium
MEMetabolisable energy
NNitrogen
Na+Sodium
Na+/K+-ATPaseSodium-potassium adenosine triphosphatase
NaPiIIbType IIb sodium-dependent phosphate transporter
PPhosphorus
PiInorganic phosphate
RTRoom temperatur
PiT1/2Type III sodium-dependent phosphate transporter 1/2
TJTight-junctions
VDRVitamin D receptor
XPR1xenotropic and polytropic retrovirus receptor 1
ZO-1Zonula occludens protein-1

References

  1. Radanovic, T.; Wagner, C.A.; Murer, H.; Biber, J. Regulation of intestinal phosphate transport. I. Segmental expression and adaptation to low-P(i) diet of the type IIb Na(+)-P(i) cotransporter in mouse small intestine. Am. J. Physiol. Gastrointest. Liver Physiol. 2005, 288, G496–G500. [Google Scholar]
  2. Giral, H.; Caldas, Y.; Sutherland, E.; Wilson, P.; Breusegem, S.; Barry, N.; Blaine, J.; Jiang, T.; Wang, X.X.; Levi, M. Regulation of rat intestinal Na-dependent phosphate transporters by dietary phosphate. Am. J. Physiol. Ren. Physiol. 2009, 297, F1466–F1475. [Google Scholar]
  3. Elfers, K.; Wilkens, M.R.; Breves, G.; Muscher-Banse, A.S. Modulation of intestinal calcium and phosphate transport in young goats fed a nitrogen- and/or calcium-reduced diet. Br. J. Nutr. 2015, 114, 1949–1964. [Google Scholar] [PubMed] [Green Version]
  4. Schröder, B.; Kappner, H.; Failing, K.; Pfeffer, E.; Breves, G. Mechanisms of intestinal phosphate transport in small ruminants. Br. J. Nutr. 1995, 74, 635–648. [Google Scholar] [PubMed] [Green Version]
  5. Virkki, L.V.; Biber, J.; Murer, H.; Forster, I.C. Phosphate transporters: A tale of two solute carrier families. Am. J. Physiol. Ren. Physiol. 2007, 293, F643–F654. [Google Scholar]
  6. Feild, J.A.; Zhang, L.; Brun, K.A.; Brooks, D.P.; Edwards, R.M. Cloning and functional characterization of a sodium-dependent phosphate transporter expressed in human lung and small intestine. Biochem. Biophys. Res. Commun. 1999, 258, 578–582. [Google Scholar] [PubMed]
  7. Forster, I.C.; Hernando, N.; Biber, J.; Murer, H. Phosphate transporters of the SLC20 and SLC34 families. Mol. Asp. Med. 2013, 34, 386–395. [Google Scholar]
  8. Shirazi-Beechey, S.P.; Beechey, R.B.; Penny, J.; Vayro, S.; Buchan, W.; Scott, D. Mechanisms of phosphate-transport in sheep intestine and parotid-gland—Response to variation in dietary phosphate supply. Exp. Physiol. 1991, 76, 231–241. [Google Scholar]
  9. Huber, K.; Walter, C.; Schröder, B.; Breves, G. Phosphate transport in the duodenum and jejunum of goats and its adaptation by dietary phosphate and calcium. Am. J. Physiol. Regul. I 2002, 283, R296–R302. [Google Scholar]
  10. Schröder, B.; Breves, G. Mechanisms of phosphate uptake into brush border membrane vesicles from goat jejunum. J. Comp. Physiol. B Biochem. Syst. Environ. Physiol. 1996, 166, 230–240. [Google Scholar]
  11. Huber, K.; Walter, C.; Schröder, B.; Biber, J.; Murer, H.; Breves, G. Epithelial phosphate transporters in small ruminants. Ann. N. Y. Acad. Sci. 2000, 915, 95–97. [Google Scholar] [PubMed]
  12. Candeal, E.; Caldas, Y.A.; Guillen, N.; Levi, M.; Sorribas, V. Intestinal phosphate absorption is mediated by multiple transport systems in rats. Am. J. Physiol. Gastrointest. Liver Physiol. 2017, 312, G355–G366. [Google Scholar]
  13. Katai, K.; Miyamoto, K.; Kishida, S.; Segawa, H.; Nii, T.; Tanaka, H.; Tani, Y.; Arai, H.; Tatsumi, S.; Morita, K.; et al. Regulation of intestinal Na+-dependent phosphate co-transporters by a low-phosphate diet and 1,25-dihydroxyvitamin D3. Biochem. J. 1999, 343, 705–712. [Google Scholar] [PubMed]
  14. Hattenhauer, O.; Traebert, M.; Murer, H.; Biber, J. Regulation of small intestinal Na-P(i) type IIb cotransporter by dietary phosphate intake. Am. J. Physiol. 1999, 277, G756–G762. [Google Scholar] [PubMed]
  15. Capuano, P.; Radanovic, T.; Wagner, C.A.; Bacic, D.; Kato, S.; Uchiyama, Y.; St-Arnoud, R.; Murer, H.; Biber, J. Intestinal and renal adaptation to a low-Pi diet of type II NaPi cotransporters in vitamin D receptor- and 1alphaOHase-deficient mice. Am. J. Physiol. Cell Physiol. 2005, 288, C429–C434. [Google Scholar]
  16. Wild, R.; Gerasimaite, R.; Jung, J.Y.; Truffault, V.; Pavlovic, I.; Schmidt, A.; Saiardi, A.; Jessen, H.J.; Poirier, Y.; Hothorn, M.; et al. Control of eukaryotic phosphate homeostasis by inositol polyphosphate sensor domains. Science 2016, 352, 986–990. [Google Scholar] [PubMed] [Green Version]
  17. Giovannini, D.; Touhami, J.; Charnet, P.; Sitbon, M.; Battini, J.L. Inorganic phosphate export by the retrovirus receptor XPR1 in metazoans. Cell Rep. 2013, 3, 1866–1873. [Google Scholar]
  18. Van Itallie, C.M.; Anderson, J.M. The molecular physiology of tight junction pores. Physiology 2004, 19, 331–338. [Google Scholar]
  19. Markov, A.G.; Veshnyakova, A.; Fromm, M.; Amasheh, M.; Amasheh, S. Segmental expression of claudin proteins correlates with tight junction barrier properties in rat intestine. J. Comp. Physiol. B 2010, 180, 591–598. [Google Scholar]
  20. Rosenthal, R.; Gunzel, D.; Piontek, J.; Krug, S.M.; Ayala-Torres, C.; Hempel, C.; Theune, D.; Fromm, M. Claudin-15 forms a water channel through the tight junction with distinct function compared to claudin-2. Acta Physiol. 2020, 228, e13334. [Google Scholar]
  21. Fujita, H.; Sugimoto, K.; Inatomi, S.; Maeda, T.; Osanai, M.; Uchiyama, Y.; Yamamoto, Y.; Wada, T.; Kojima, T.; Yokozaki, H.; et al. Tight junction proteins claudin-2 and -12 are critical for vitamin D-dependent Ca2+ absorption between enterocytes. Mol. Biol. Cell 2008, 19, 1912–1921. [Google Scholar] [CrossRef] [PubMed] [Green Version]
  22. Nishii, N.; Oshima, T.; Li, M.; Eda, H.; Nakamura, K.; Tamura, A.; Ogawa, T.; Yamasaki, T.; Kondo, T.; Kono, T.; et al. Lubiprostone induces claudin-1 and protects intestinal barrier function. Pharmacology 2020, 105, 102–108. [Google Scholar] [CrossRef] [PubMed]
  23. Furuse, M.; Hata, M.; Furuse, K.; Yoshida, Y.; Haratake, A.; Sugitani, Y.; Noda, T.; Kubo, A.; Tsukita, S. Claudin-based tight junctions are crucial for the mammalian epidermal barrier: A lesson from claudin-1-deficient mice. J. Cell Biol. 2002, 156, 1099–1111. [Google Scholar] [CrossRef] [PubMed]
  24. Stevenson, B.R.; Siliciano, J.D.; Mooseker, M.S.; Goodenough, D.A. Identification of ZO-1: A high molecular weight polypeptide associated with the tight junction (zonula occludens) in a variety of epithelia. J. Cell Biol. 1986, 103, 755–766. [Google Scholar] [CrossRef] [PubMed] [Green Version]
  25. Van Itallie, C.M.; Fanning, A.S.; Bridges, A.; Anderson, J.M. ZO-1 stabilizes the tight junction solute barrier through coupling to the perijunctional cytoskeleton. Mol. Biol. Cell 2009, 20, 3930–3940. [Google Scholar] [CrossRef] [Green Version]
  26. Al-Sadi, R.; Khatib, K.; Guo, S.; Ye, D.; Youssef, M.; Ma, T. Occludin regulates macromolecule flux across the intestinal epithelial tight junction barrier. Am. J. Physiol. Gastrointest. Liver Physiol. 2011, 300, G1054–G1064. [Google Scholar] [CrossRef] [Green Version]
  27. Angst, B.; Marcozzi, C.; Magee, A. The cadherin superfamily: Diversity in form and function. J. Cell Sci. 2001, 114, 629–641. [Google Scholar]
  28. Kutuzova, G.D.; Deluca, H.F. Gene expression profiles in rat intestine identify pathways for 1,25-dihydroxyvitamin D(3) stimulated calcium absorption and clarify its immunomodulatory properties. Arch. Biochem. Biophys. 2004, 432, 152–166. [Google Scholar] [CrossRef]
  29. Drochner, W.; Ernährungsphysiologie, G.F.; Bedarfsnormen, A.F. Recommendations for the Supply of Energy and Nutrients to Goats = Empfehlungen zur Energie- und Nährstoffversorgung der Ziegen; DLG-Verlags-GmbH: Frankfurt am Main, Germany, 2003. [Google Scholar]
  30. Field, A.C.; Suttle, N.F.; Nisbet, D.I. Effect of diets low in calcium and phosphorus on development of growing lambs. J. Agric. Sci. 1975, 85, 435–442. [Google Scholar] [CrossRef]
  31. Lee, D.B.; Brautbar, N.; Walling, M.W.; Silis, V.; Coburn, J.W.; Kleeman, C.R. Effect of phosphorus depletion on intestinal calcium and phosphorus absorption. Am. J. Physiol. 1979, 236, E451–E457. [Google Scholar] [CrossRef]
  32. Schröder, B.; Pfeffer, E.; Failing, K.; Breves, G. Binding properties of goat intestinal vitamin D receptors as affected by dietary calcium and/or phosphorus depletion. Zentralbl. Veterinarmed. A 1995, 42, 411–417. [Google Scholar] [CrossRef] [PubMed]
  33. Fox, J.; Pickard, D.W.; Care, A.D.; Murray, T.M. Effect of low phosphorus diets on intestinal calcium absorption and the concentration of calcium-binding protein in intact and parathyroidectomized pigs. J. Endocrinol. 1978, 78, 379–387. [Google Scholar] [CrossRef] [PubMed]
  34. Baylink, D.; Wergedal, J.; Stauffer, M. Formation, mineralization, and resorption of bone in hypophosphatemic rats. J. Clin. Investig. 1971, 50, 2519–2530. [Google Scholar] [CrossRef] [PubMed]
  35. Grunberg, W.; Witte, S.; Cohrs, I.; Golbeck, L.; Brouwers, J.F.; Muller, A.E.; Schmicke, M. Liver phosphorus content and liver function in states of phosphorus deficiency in transition dairy cows. PLoS ONE 2019, 14, e0219546. [Google Scholar] [CrossRef] [PubMed] [Green Version]
  36. Fuller, T.J.; Nichols, W.W.; Brenner, B.J.; Peterson, J.C. Reversible depression in myocardial performance in dogs with experimental phosphorus deficiency. J. Clin. Investig. 1978, 62, 1194–1200. [Google Scholar] [CrossRef]
  37. Harper, A.F.; Kornegay, E.T.; Schell, T.C. Phytase supplementation of low-phosphorus growing-finishing pig diets improves performance, phosphorus digestibility, and bone mineralization and reduces phosphorus excretion. J. Anim. Sci. 1997, 75, 3174–3186. [Google Scholar] [CrossRef] [PubMed]
  38. Milton, J.T.B.; Ternouth, J.H. Phosphorus-metabolism in ruminants .2. Effects of inorganic phosphorus concentration upon food-intake and digestibility. Aust. J. Agric. Res. 1985, 36, 647–654. [Google Scholar] [CrossRef]
  39. Kamphues, J.; Muller, E.; Drochner, W. Clinical effects of an extreme Ca overdose in feed for growing piglets. Tierarztl. Prax. 1990, 18, 251–254. [Google Scholar]
  40. Wimsatt, J.; Marks, S.L.; Campbell, T.W.; Johnson, J.D.; Nachreiner, R.F. Dietary vitamin D toxicity in a household of pot-bellied pigs (Sus scrofa). J. Vet. Intern. Med. 1998, 12, 42–44. [Google Scholar] [CrossRef]
  41. Midkiff, A.M.; Chew, D.J.; Randolph, J.F.; Center, S.A.; DiBartola, S.P. Idiopathic hypercalcemia in cats. J. Vet. Intern. Med. 2000, 14, 619–626. [Google Scholar] [CrossRef]
  42. Lichtman, M.A.; Miller, D.R.; Freeman, R.B. Erythrocyte adenosine triphosphate depletion during hypophosphatemia in a uremic subject. N. Engl. J. Med. 1969, 280, 240–244. [Google Scholar] [CrossRef] [PubMed]
  43. Finch, N.C. Hypercalcaemia in cats: The complexities of calcium regulation and associated clinical challenges. J. Feline Med. Surg. 2016, 18, 387–399. [Google Scholar] [CrossRef] [PubMed] [Green Version]
  44. Ragno, A.; Pepe, J.; Badiali, D.; Minisola, S.; Romagnoli, E.; Severi, C.; D’erasmo, E. Chronic constipation in hypercalcemic patients with primary hyperparathyroidism. Eur. Rev. Med. Pharmacol. Sci. 2012, 16, 884–889. [Google Scholar] [PubMed]
  45. Jungbluth, H.; Binswanger, U. Unidirectional duodenal and jejunal calcium and phosphorus transport in the rat: Effects of dietary phosphorus depletion, ethane-1-hydroxy-1,1-diphosphonate and 1,25 dihydroxycholecalciferol. Res. Exp. Med. 1989, 189, 439–449. [Google Scholar] [CrossRef]
  46. Breves, G.; Schröder, B. Comparative aspects of gastrointestinal phosphorus metabolism. Nutr. Res. Rev. 1991, 4, 125–140. [Google Scholar] [CrossRef]
  47. Muschen, H.; Petri, A.; Breves, G.; Pfeffer, E. Response of lactating goats to low phosphorus intake .1. Milk-yield and fecal excretion of P and Ca. J. Agric. Sci. 1988, 111, 255–263. [Google Scholar] [CrossRef]
  48. Kincaid, R.; Rodehutscord, M. Phosphorus metabolism in the rumen reducing the environmental impact of cattle operations. In Nitrogen and Phosphorus Nutrition of Cattle: Reducing the Environmental Impact of Cattle Operations; CABI Publishing: Wallington, UK, 2005; pp. 187–194. [Google Scholar]
  49. Hughes, M.R.; Brumbaugh, P.F.; Hussler, M.R.; Wergedal, J.E.; Baylink, D.J. Regulation of serum 1alpha,25-dihydroxyvitamin D3 by calcium and phosphate in the rat. Science 1975, 190, 578–580. [Google Scholar] [CrossRef]
  50. Sommerville, B.A.; Maunder, E.; Ross, R.; Care, A.D.; Brown, R.C. Effect of dietary calcium and phosphorus depletion on vitamin D metabolism and calcium binding protein in the growing pig. Horm. Metab. Res. 1985, 17, 78–81. [Google Scholar] [CrossRef]
  51. Baxter, L.A.; DeLuca, H.F. Stimulation of 25-hydroxyvitamin D3-1alpha-hydroxylase by phosphate depletion. J. Biol. Chem. 1976, 251, 3158–3161. [Google Scholar] [CrossRef]
  52. Young, V.R.; Richards, W.P.; Lofgreen, G.P.; Luick, J.R. Phosphorus depletion in sheep and ratio of calcium to phosphorus in diet with reference to calcium and phosphorus absorption. Br. J. Nutr. 1966, 20, 783–794. [Google Scholar] [CrossRef]
  53. Abdel-Hafeez, H.M.; Manas-Almendros, M.; Ross, R.; Care, A.D.; Marshall, D.H. Effects of dietary phosphorus and calcium on the intestinal absorption of Ca in sheep. Br. J. Nutr. 1982, 47, 69–77. [Google Scholar] [CrossRef] [PubMed]
  54. Bushinsky, D.A.; Riera, G.S.; Favus, M.J.; Coe, F.L. Evidence that blood ionized calcium can regulate serum 1,25(OH)2D3 independently of parathyroid hormone and phosphorus in the rat. J. Clin. Investig. 1985, 76, 1599–1604. [Google Scholar] [CrossRef] [PubMed] [Green Version]
  55. Matsumoto, T.; Ikeda, K.; Morita, K.; Fukumoto, S.; Takahashi, H.; Ogata, E. Blood Ca2+ modulates responsiveness of renal 25(OH)D3-1 alpha-hydroxylase to PTH in rats. Am. J. Physiol. 1987, 253, E503–E507. [Google Scholar] [CrossRef] [PubMed]
  56. Kowarski, S.; Schachter, D. Effects of vitamin D on phosphate transport and incorporation into mucosal constituents of rat intestinal mucosa. J. Biol. Chem. 1969, 244, 211–217. [Google Scholar] [CrossRef]
  57. Hernando, N.; Pastor-Arroyo, E.M.; Marks, J.; Schnitzbauer, U.; Knopfel, T.; Burki, M.; Bettoni, C.; Wagner, C.A. 1,25(OH)2 vitamin D3 stimulates active phosphate transport but not paracellular phosphate absorption in mouse intestine. J. Physiol. 2020. [Google Scholar] [CrossRef] [PubMed]
  58. Danisi, G.; Bonjour, J.P.; Straub, R.W. Regulation of Na-dependent phosphate influx across the mucosal border of duodenum by 1,25-dihydroxycholecalciferol. Pflug. Arch. 1980, 388, 227–232. [Google Scholar] [CrossRef]
  59. Cao, M.; Fang, R.; Chen, J.; He, J. Vitamin D3 increased intestinal Na/Pi-IIb and CYP27B1 mRNA level in rats fed low-phosphorus diets. Anim. Nutr. 2016, 2, 211–217. [Google Scholar] [CrossRef]
  60. Kido, S.; Miyamoto, K.; Mizobuchi, H.; Taketani, Y.; Ohkido, I.; Ogawa, N.; Kaneko, Y.; Harashima, S.; Takeda, E. Identification of regulatory sequences and binding proteins in the type II sodium/phosphate cotransporter NPT2 gene responsive to dietary phosphate. J. Biol. Chem. 1999, 274, 28256–28263. [Google Scholar] [CrossRef] [Green Version]
  61. Segawa, H.; Kaneko, I.; Yamanaka, S.; Ito, M.; Kuwahata, M.; Inoue, Y.; Kato, S.; Miyamoto, K. Intestinal Na-P(i) cotransporter adaptation to dietary P(i) content in vitamin D receptor null mice. Am. J. Physiol. Ren. Physiol. 2004, 287, F39–F47. [Google Scholar] [CrossRef] [Green Version]
  62. Starke, S.; Reimers, J.; Muscher-Banse, A.S.; Schröder, B.; Breves, G.; Wilkens, M.R. Gastrointestinal transport of calcium and phosphate in lactating goats. Livest. Sci. 2016, 189, 23–31. [Google Scholar] [CrossRef]
  63. Foote, A.P.; Lambert, B.D.; Brady, J.A.; Muir, J.P. Phosphate transporter expression in Holstein cows. J. Dairy Sci. 2011, 94, 1913–1916. [Google Scholar] [CrossRef] [PubMed]
  64. Geall, M.G.; Summerskill, W.H. Electric-potential difference—A neglected parameter of gut integrity and function? Gut 1969, 10, 418–421. [Google Scholar] [CrossRef] [PubMed] [Green Version]
  65. Knöpfel, T.; Himmerkus, N.; Guenzel, D.; Bleich, M.; Hernando, N.; Wagner, C.A. Paracellular transport of phosphate along the intestine. Am. J. Physiol. Gastrointest. Liver Physiol. 2019, 317, G233–G241. [Google Scholar] [CrossRef] [PubMed]
  66. Ikuta, K.; Segawa, H.; Sasaki, S.; Hanazaki, A.; Fujii, T.; Kushi, A.; Kawabata, Y.; Kirino, R.; Sasaki, S.; Noguchi, M.; et al. Effect of Npt2b deletion on intestinal and renal inorganic phosphate (Pi) handling. Clin. Exp. Nephrol. 2018, 22, 517–528. [Google Scholar] [CrossRef]
  67. Salaun, C.; Gyan, E.; Rodrigues, P.; Heard, J.M. Pit2 assemblies at the cell surface are modulated by extracellular inorganic phosphate concentration. J. Virol. 2002, 76, 4304–4311. [Google Scholar] [CrossRef] [Green Version]
  68. Rodrigues, P.; Heard, J.M. Modulation of phosphate uptake and amphotropic murine leukemia virus entry by posttranslational modifications of PIT-2. J. Virol. 1999, 73, 3789–3799. [Google Scholar] [CrossRef] [Green Version]
  69. Moreno, J.H. Blockage of gallbladder tight junction cation-selective channels by 2,4,6-triaminopyrimidinium (TAP). J. Gen. Physiol. 1975, 66, 97–115. [Google Scholar] [CrossRef] [Green Version]
  70. Clarke, L.L. A guide to Ussing chamber studies of mouse intestine. Am. J. Physiol. Gastrointest. Liver Physiol. 2009, 296, G1151–G1166. [Google Scholar] [CrossRef] [Green Version]
  71. Marks, J.; Debnam, E.S.; Unwin, R.J. Phosphate homeostasis and the renal-gastrointestinal axis. Am. J. Physiol. Ren. Physiol. 2010, 299, F285–F296. [Google Scholar] [CrossRef] [Green Version]
  72. Elfers, K.; Marr, I.; Wilkens, M.R.; Breves, G.; Langeheine, M.; Brehm, R.; Muscher-Banse, A.S. Expression of tight junction proteins and cadherin 17 in the small intestine of young goats offered a reduced N and/or Ca diet. PLoS ONE 2016, 11, e0154311. [Google Scholar] [CrossRef] [Green Version]
  73. Ravera, S.; Virkki, L.V.; Murer, H.; Forster, I.C. Deciphering PiT transport kinetics and substrate specificity using electrophysiology and flux measurements. Am. J. Physiol. Cell Physiol. 2007, 293, C606–C620. [Google Scholar] [CrossRef] [PubMed] [Green Version]
  74. Haussler, M.R.; Whitfield, G.K.; Haussler, C.A.; Hsieh, J.C.; Thompson, P.D.; Selznick, S.H.; Dominguez, C.E.; Jurutka, P.W. The nuclear vitamin D receptor: Biological and molecular regulatory properties revealed. J. Bone Miner. Res. 1998, 13, 325–349. [Google Scholar] [CrossRef] [PubMed]
  75. Demay, M.B. Mechanism of vitamin D receptor action. Ann. N. Y. Acad. Sci. 2006, 1068, 204–213. [Google Scholar] [CrossRef] [PubMed]
  76. Sriussadaporn, S.; Wong, M.S.; Pike, J.W.; Favus, M.J. Tissue specificity and mechanism of vitamin D receptor up-regulation during dietary phosphorus restriction in the rat. J. Bone Miner. Res. 1995, 10, 271–280. [Google Scholar] [CrossRef]
  77. Schröder, B.; Breves, G.; Pfeffer, E. Binding properties of duodenal 1,25-dihydroxyvitamin D3 receptors as affected by phosphorus depletion in lactating goats. Comp. Biochem. Physiol. Comp. Physiol. 1990, 96, 495–498. [Google Scholar] [CrossRef]
  78. Frizzell, R.A.; Schultz, S.G. Ionic conductances of extracellular shunt pathway in rabbit ileum. Influence of shunt on transmural sodium transport and electrical potential differences. J. Gen. Physiol. 1972, 59, 318–346. [Google Scholar] [CrossRef] [Green Version]
  79. Ben-Ghedalia, D.; Tagari, H.; Zamwel, S.; Bondi, A. Solubility and net exchange of calcium, magnesium and phosphorus in digesta flowing along the gut of the sheep. Br. J. Nutr. 1975, 33, 87–94. [Google Scholar] [CrossRef] [Green Version]
  80. Naumann, C.; Bassler, R. Verband Deutscher Landwirtschaftlicher Untersuchungs- und Forschungsanstalten. Methodenbuch Band III. Die chemische Untersuchung von Futtermitteln. Mit Ergänzungslieferungen 1983, 1988, 1993, 1997 (Association of German Agriculture Testing and Research Institutes. Methods Book Volume III. The Chemical Analysis of Feed. With Additional Deliveries in 1983, 1988, 1993, 1997); VDLUFA-Verlag: Darmstadt, Germany, 1976. [Google Scholar]
  81. Van Soest, P.J.; Robertson, J.B.; Lewis, B.A. Methods for dietary fiber, neutral detergent fiber, and nonstarch polysaccharides in relation to animal nutrition. J. Dairy Sci. 1991, 74, 3583–3597. [Google Scholar] [CrossRef]
  82. Busch, A.; Wagner, C.; Schuster, A.; Waldegger, S.; Biber, J.; Murer, H.; Lang, F. Properties of electrogenic Pi transport by a human renal brush border Na+/Pi transporter. J. Am. Soc. Nephrol. JASN 1996, 6, 1547–1551. [Google Scholar]
  83. Simmons, N.L.; Naftalin, R.J. Bidirectional sodium ion movements via the paracellular and transcellular routes across short-circuited rabbit ileum. Biochim. Biophys. Acta 1976, 448, 426–450. [Google Scholar] [CrossRef]
  84. Auchere, D.; Tardivel, S.; Gounelle, J.C.; Drueke, T.; Lacour, B. Role of transcellular pathway in ileal Ca2+ absorption: Stimulation by low-Ca2+ diet. Am. J. Physiol. 1998, 275, G951–G956. [Google Scholar] [CrossRef] [PubMed]
  85. Schultz, S.G.; Zalusky, R. Ion transport in isolated rabbit ileum. I. Short-circuit current and Na fluxes. J. Gen. Physiol. 1964, 47, 567–584. [Google Scholar] [CrossRef] [PubMed] [Green Version]
  86. Sarkar, B.C.; Chauhan, U.P. A new method for determining micro quantities of calcium in biological materials. Anal. Biochem. 1967, 20, 155–166. [Google Scholar] [CrossRef]
  87. Kruse-Jarres, J. Klinische Chemie, Spezielle Klinische Analytik (Clinical Chemistry, Special Clinical Analysis); Urban & Fischer Mchn: Stuttgart, Germany, 1979; p. 288. [Google Scholar]
  88. Wilkens, M.R.; Kunert-Keil, C.; Brinkmeier, H.; Schröder, B. Expression of calcium channel TRPV6 in ovine epithelial tissue. Vet. J. 2009, 182, 294–300. [Google Scholar] [CrossRef] [PubMed]
  89. BLAST NCBI (National Center for Biotechnology Information). Available online: https://blast.ncbi.nlm.nih.gov/Blast.cgi (accessed on 15 January 2021).
  90. Wilkens, M.R.; Elfers, K.; Schmicke, M.; Breves, G.; Muscher-Banse, A.S. Dietary nitrogen and calcium modulate CYP27B1 expression in young goats. Domest. Anim. Endocrinol. 2018, 64, 70–76. [Google Scholar] [CrossRef] [PubMed]
  91. Herm, G.; Muscher-Banse, A.S.; Breves, G.; Schröder, B.; Wilkens, M.R. Renal mechanisms of calcium homeostasis in sheep and goats. J. Anim. Sci. 2015, 93, 1608–1621. [Google Scholar] [CrossRef]
  92. Wilkens, M.R.; Mrochen, N.; Breves, G.; Schröder, B. Gastrointestinal calcium absorption in sheep is mostly insensitive to an alimentary induced challenge of calcium homeostasis. Comp. Biochem. Physiol. B Biochem. Mol. Biol. 2011, 158, 199–207. [Google Scholar] [CrossRef] [PubMed]
  93. Muscher, A.; Hattendorf, J.; Pfeffer, E.; Breves, G.; Huber, K. Hormonal regulation of phosphate homeostasis in goats during transition to rumination. J. Comp. Physiol. B 2008, 178, 585–596. [Google Scholar] [CrossRef]
  94. GraphPad. Available online: https://www.graphpad.com/ (accessed on 15 January 2021).
Figure 1. Linear regression of the unidirectional mucosal to serosal (Jms; ⚫, ───) or serosal to mucosal (Jsm; ⚪, - - - -) flux rates of inorganic phosphate (Pi) with the corresponding mannitol flux rates in duodenum (a) (Jms Pi = (1.39 ± 0.17), Jms mannitol = (9.19 ± 5.33); Jsm Pi = (1.02 ± 0.15), Jsm mannitol = (4.88 ± 4.21)) and ileum (b) (Jms Pi = −(1.40 ± 2.10), Jms mannitol = (240.9 ± 72.56), r = 0.189, p = 0.5163; Jsm Pi = (0.74 ± 0.14), Jsm mannitol = (0.28 ± 2.87)) from goats fed different phosphorus supply.
Ijms 22 00866 g001
Figure 2. Effect of adding 5 mmol/L Na+-arsenate to the mucosal side of duodenal epithelia on the short-circuit current (Isc) (a) and the tissue conductance (Gt) (b). Effect of adding 5 mmol/L Na+-arsenate to the mucosal side of ileal epithelia on the short-circuit current (Isc) (c) and the tissue conductance (Gt) (d).
Ijms 22 00866 g002
Figure 3. Effect of adding 20 mmol/L TAP to the mucosal side of duodenal epithelia on the short-circuit current (Isc) (a) and the tissue conductance (Gt) (b). Effect of adding 20 mmol/L TAP to the mucosal side of ileal epithelia on the short-circuit current (Isc) (c) and the tissue conductance (Gt) (d).
Ijms 22 00866 g003
Figure 4. Linear regression of ileal PiT1 mRNA expression normalised to 18S with plasma Ca (PiT1 mRNA = (0.0056 ± 0.0025), plasma Ca = (0.0003 ± 0.0096)) of goats fed different phosphorus supply.
Ijms 22 00866 g004
Figure 5. Linear regression of PiT1 protein expression with plasma Pi (a) (PiT1 protein = (54,130 ± 19,486), plasma Pi = (66,268 ± 30,620)), plasma Ca (b) (PiT1 protein = (−56,174 ± 21,950), plasma Ca = (352,119 ± 83,565)) and serum 25-(OH)D3 (c) (PiT1 protein = (−5133 ± 1765), serum 25-(OH)D3 = (409,943 ± 93,332)).
Ijms 22 00866 g005
Table 1. Mean daily intake of dry matter (DM), concentrate, phosphorus (P) and calcium (Ca) of young goats fed a low P diet. (Mean values with their standard errors; n = 7 animals).
ItemsControlP Reductionp-Value
DM intake (g/day)614 ± 10528 ± 250.008
Concentrate intake (g/day)555 ± 12469 ± 290.017
P intake (g/day)2.40 ± 0.050.53 ± 0.03<0.001
Ca intake (g/day)6.50 ± 0.135.42 ± 0.310.008
Table 2. Initial body weight and effects of a low phosphorus (P) diet on body weight gain and final body weight of young goats fed a low P diet. (Mean values with their standard errors; n = 7 animals).
ItemsControlP Reductionp-Value
Initial body weight (kg) *19.21 ± 0.7518.93 ± 1.090.83
Final body weight (kg) †25.29 ± 0.7420.21 ± 0.930.001
Body weight gain (kg/d)0.14 ± 0.010.03 ± 0.01<0.001
* The initial body weight was determined at the beginning of the experimental feeding at ten weeks of age. † The final body weight was determined at the time of slaughter at 15–17 weeks of age.
Table 3. Inorganic phosphate (Pi) and calcium (Ca) concentrations in saliva, ruminal and abomasal fluids of young goats fed a low phosphorus (P) diet. (Mean values with their standard errors; n = 7 animals).
ItemsControlP Reductionp-Value
Plasma Pi (mmol/L)2.09 ± 0.120.70 ± 0.04<0.001
Plasma Ca (mmol/L)3.16 ± 0.094.34 ± 0.17<0.001
Saliva Pi (mmol/L)31.77 ± 3.9610.41 ± 0.83<0.001
Saliva Ca (mmol/L)0.42 ± 0.030.53 ± 0.020.01
Ruminal fluid Pi (mmol/L)46.69 ± 6.116.07 ± 0.76<0.001
Ruminal fluid Ca (mmol/L)1.68 ± 0.115.75 ± 1.390.01
Abomasal fluid Pi (mmol/L)39.02 ± 3.917.77 ± 0.78<0.001
Abomasal fluid Ca (mmol/L)17.83 ± 1.7923.80 ± 3.480.15
Table 4. Inorganic phosphate (Pi) and mannitol (Man) flux rates of duodenal and ileal epithelia of young goats fed a low phosphorus (P) diet. (Mean values with their standard errors; n = 7 animals).
ItemsControlP Reductionp-Value
Duodenum
Pi Jms46.72 ± 5.6948.85 ± 10.800.87
Pi Jsm 32.92 ± 5.1129.30 ± 3.090.56
Pi Jnet 13.80 ± 4.9119.55 ± 10.590.63
Man Jms 26.31 ± 4.1629.14 ± 6.870.73
Man Jsm26.13 ± 3.9925.08 ± 3.380.84
Man Jnet 0.18 ± 3.524.06 ± 4.900.53
Ileum
Pi Jms 215.49 ± 39.03177.91 ± 45.560.54
Pi Jsm 13.12 ± 2.4915.44 ± 2.140.49
Pi Jnet 202.37 ± 40.09162.47 ± 46.850.53
Man Jms 29.30 ± 5.5133.77 ± 5.990.59
Man Jsm 17.08 ± 1.9520.70 ± 3. 010.33
Man Jnet 12.22 ± 4.4813.07 ± 3.410.88
Table 5. Electrophysiological properties of duodenal and ileal epithelia of young goats fed a low phosphorus (P) diet. (Mean values with their standard errors; n = 7 animals).
ItemsControlP Reductionp-Value
Duodenum
Isc0.61 ± 0.060.71 ± 0.040.20
Gt18.92 ± 1.8318.05 ± 0.970.68
Ileum
Isc1.73 ± 0.291.12 ± 0.240.13
Gt17.18 ± 1.7016.78 ± 1.250.85
Isc, short-circuit current in µeq/(cm2∙h); Gt, tissue conductance in mS/cm2.
Table 6. Changes in tissue conductance (∆Gt) and short-circuit current (∆Isc) after mucosal addition of Na+-arsenate and 2,4,6-triaminopyrimidine (TAP) in duodenum and ileum of young goats fed a low phosphorus (P) diet. (Mean values with their standard errors; n = 7 animals).
ItemsControlP Reductionp-Value
Duodenum
∆Isc Na+-arsenate0.31 ± 0.060.39 ± 0.030.25
∆Isc TAP−0.15 ± 0.03−0.13 ± 0.030.59
∆Gt Na+-arsenate4.91 ± 0.878.65 ± 2.130.13
∆Gt TAP−3.96 ± 0.98−3.03 ± 1.190.56
Ileum
∆Isc Na+-arsenate−0.79 ± 0.21−0.44 ± 0.180.23
∆Isc TAP−0.41 ± 0.17−0.33 ± 0.100.69
∆Gt Na+-arsenate8.42 ± 1.616.10 ± 1.930.37
∆Gt TAP−1.69 ± 0.44−2.17 ± 0.500.49
∆Isc, delta short-circuit current, difference between Isc before and after inhibitor addition in µeq/(cm2∙h); ∆Gt, delta tissue conductance, difference between Gt before and after inhibitor addition in mS/cm2.
Table 7. Relative mRNA expressions of proteins in the duodenum, mid jejunum and ileum of young goats fed a low phosphorus (P) diet, normalised to 18S. (Mean values with their standard errors; n = 7 animals).
ItemsControlP Reductionp-Value
Duodenum
Na+/K+-ATPase1.657 ± 0.3181.615 ± 0.2520.921
NaPiIIb1.361 × 10−6 ± 5.762 × 10⁻⁷ 6.360 × 10⁻⁶ ± 2.581 × 10⁻⁶ 0.083
PiT10.010 ± 0.0010.012 ± 0.0030.606
PiT20.008 ± 0.0040.010 ± 0.0020.621
VDR0.019 ± 0.0020.018 ± 0.0030.966
XPR10.089 ± 0.0160.088 ± 0.0120.959
Cadherin-171.494 ± 0.3841.508 ± 0.1620.974
Claudin-10.017 ± 0.0030.015 ± 0.0030.657
Claudin-20.228 ± 0.0280.215 ± 0.0480.824
Claudin-120.004 ± 0.0010.005 ± 0.0010.603
Claudin-150.104 ± 0.0110.112 ± 0.0190.712
Occludin0.041 ± 0.0060.042 ± 0.0050.948
ZO-10.011 ± 0.0020.010 ± 0.0010.660
Mid jejunum
Na+/K+-ATPase2.925 ± 0.3992.589 ± 0.2080.468
NaPiIIb0.158 ± 0.0500.0831 ± 0.0180.189
PiT10.011 ± 0.0020.013 ± 0.0020.537
PiT20.009 ± 0.0010.008 ± 0.0010.618
VDR0.060 ± 0.0090.050 ± 0.0030.317
XPR10.020 ± 0.0020.020 ± 0.0020.948
Cadherin-172.197 ± 0.3691.718 ± 0.1190.240
Claudin-10.071 ± 0.0080.073 ± 0.0120.889
Claudin-20.759 ± 0.1170.391 ± 0.0880.027
Claudin-120.010 ± 0.0020.009 ± 0.0020.743
Claudin-150.788 ± 0.1340.617 ± 0.0760.287
Occludin0.146 ± 0.0300.111 ± 0.0100.289
ZO-10.014 ± 0.0020.011 ± 0.00050.215
Ileum
Na+/K+-ATPase0.911 ± 0.1951.175 ± 0.1230.274
NaPiIIb0.006 ± 0.0010.005 ± 0.0020.858
PiT10.017 ± 0.0030.025 ± 0.0020.038
PiT20.014 ± 0.0020.020 ± 0.0020.046
VDR0.007 ± 0.0010.007 ± 0.0010.890
XPR10.014 ± 0.0020.017 ± 0.0020.357
Cadherin-172.582 ± 0.4253.478 ± 0.4500.174
Claudin-10.013 ± 0.0020.017 ± 0.0030.277
Claudin-20.461 ± 0.0880.510 ± 0.0850.699
Claudin-120.009 ± 0.0020.009 ± 0.0010.990
Claudin-150.045 ± 0.0120.040 ± 0.0050.718
Occludin0.136 ± 0.0290.187 ± 0.0320.254
ZO-10.020 ± 0.0040.027 ± 0.0030.164
Na+/K+-ATPase, Na+/K+-adenosine triphosphatase; NaPiIIb, Na+-dependent Pi transporter IIb; PiT1, Na+-dependent Pi transporter 1; PiT2, Na+-dependent Pi transporter 2; XPR1, xenotropic and polytropic retrovirus receptor 1; ZO-1, zonula occludens protein-1; VDR, vitamin D receptor.
Table 8. Relative amounts of Na+/K+-ATPase, NaPiIIb and PiT1 protein expression normalised to total protein amounts in the ileum of goats fed a phosphorus (P) reduced diet. (Mean values with their standard errors; n = 7 animals).
ItemsControlP Reductionp-Value
Na+/K+-ATPase0.119 ± 0.0040.115 ± 0.0050.61
NaPiIIb0.040 ± 0.0060.027 ± 0.0050.11
PiT10.012 ± 0.0020.007 ± 0.0010.03
Na+/K+-ATPase, Na+/K+-adenosine triphosphatase; NaPiIIb, Na+-dependent Pi transporter IIb; PiT1, Na+-dependent Pi transporter 1.
Table 9. Components and composition of wheat straw and pelleted concentrate diets *.
ItemsWheat StrawControlP Reduction
Components (as fed) (g/kg)
Soybean meal 68.068.0
Urea 24.524.5
Wheat starch 378379
Beet pulp 399399
Mineral-vitamin premix † 10.010.0
MgHPO₄ · 3 H₂O 9.3-
MgO -2.2
NaH2PO4 · 2 H2O 9.70.4
NaCl 1.41.4
NaHCO3 -5.0
CaCO3 14.314.3
Sipernat 22S ‡ 41.852.3
Molasses 10.010.0
Soybean oil 34.034.0
Composition
DM (g/kg)904880884
Nutrients (g/kg DM)
Crude ash39.8100101
CP25.4165169
ADFom 57987.587.1
aNDFom855157179
Crude fat24.343.247.5
UreaBDL27.831.1
Ca2.812.612.3
P0.64.81.1
Vitamin D3 (IU/kg DM)BDL10001075
ME (MJ/kg DM)8.312.812.9
BDL, below detection level; CP, crude protein; ME, metabolisable energy; ADFom, acid-detergent fibre expressed exclusive of residual ash; aNDFom, neutral-detergent fibre assayed with heat stable amylase expressed exclusive of residual ash. * Composition analysed by the Association of German Agricultural Investigation and Research Centre (VDLUFA). † Mineral-vitamin premix per kg: 0.2 g P; 12.1 g Ca; 1.7 g Na; 2.2 g Mg; 1,200,000 IU vitamin A; 120,000 IU vitamin D; 10,000 mg vitamin E; 675 mg vitamin K; 4960 mg iron; 6336 mg Zn; 501 mg Cu; 3000 mg Mn; 201 mg Co; 15 mg Se; 202 mg I. ‡ Sipernat 22S (Evonik Industries AG, Essen, Germany) is a fine particle salica used in the food and feed industry as a highly absorbent carrier substance, flow regulator, anti-caking and anti-dusting agent.
Table 10. Primers and probes used for TaqMan™ assays.
GenesPrimers and Probes (5′ → 3′)Accession NumberReferences
18SForward: AAAAATAACAATACAGGACTCTTTCG
Reverse: GCTATTGGAGCTGGAATTACCG
6FAM-TggAATgAgTCCACTTTAAATCCTTCCgC--BBQ
KY129860[90]
Claudin-2Forward: CCAAAGACAGAGTGGCGGT
Antisense: TCAAATTTCATGCTGTCAGGCAC
FAM-TCCTGGGCTTCATCCCYGTTGC-BBQ
XM_005700206.3[72]
Claudin-12Sense: GCTGCTCTGCCTCATCGG
Antisense: GCAGCCYGCACTATTGACCA
FAM-TGTGTAACACGGCCTTCAGGTCCTC-BBQ
XM_005678898.3[72]
Table 11. Primers used for SYBR Green assays.
GenesPrimers (5′ → 3′)Accession Number References
Na+/K+-ATPaseSense: TGGAACTCGGAGAAGAAGGA
Antisense: GCCACTCGGTCCTGATATGT
XM_005690616.3[3]
NaPiIIbSense: CGGTCCAAAACAAAAGTATGATCAAG
Reverse: AGCCAAAGGGGTAAGGGAA
XM_005681484.3 to
XM_013964569.2
[3]
PiT1Sense: ATTCATCCTCCGTAAGGCAGATC
Antisense: CAGCAATGGTGCTCCAGTATACA
XM_018055327.1[3]
PiT2Forward: CCAATCTCGGGGACTCACTG
Reverse: GGAACGGGGTCCTCCTTTTT
XM_018041866.1 to
XM_018041872.1
This study
VDRForward: GCACTTCCTTACCTGACCCC
Reverse: CCGCTTGAGGATCATCTCCC
XM_004007435.1[91]
XPR1Forward: AATGCCGATGATCAGACGCT
Reverse: AGCCTTGGATTGAGAAGCGA
XM_018060672.1This study
Cadherin-17Sense: CACCCTTTTGGTCATCGGTAT
Antisense: CATCAGTTTCTCAGAGGCTTGACT
XM_018058228.1[72]
Claudin-1Forward: TTCATCCTGGCGTTTCTGGG
Reverse: GTTGCTTGCAGAGTGCTGTT
XM_005675123.3This study
Claudin-15Forward: AGGGACTTCTTCGACCCCTT
Reverse: CGTTATCACGGGGGCTTTGT
XM_013974836.2 to
XM_018040880.1
This study
OccludinSense: CTCGTCTGGATAAAGAACTGGATGA
Antisense: CTCGTCTGGATAAAGAACTGGATGA
XM_018065677.1 to
XM_018065681.1
[72]
ZO-1Sense: CTCAGTACAGCCAGGGTGCT
Reverse: TCCGGTTTGGACACTAATGAGTT
XM_018066114.1 to
XM_018066118.1
[72]
Publisher’s Note: MDPI stays neutral with regard to jurisdictional claims in published maps and institutional affiliations.

