
Selection and Validation of Reference Genes for RT-qPCR Analysis in Aegilops tauschii (Coss.) under Different Abiotic Stresses


Abstract
:1. Introduction
2. Results
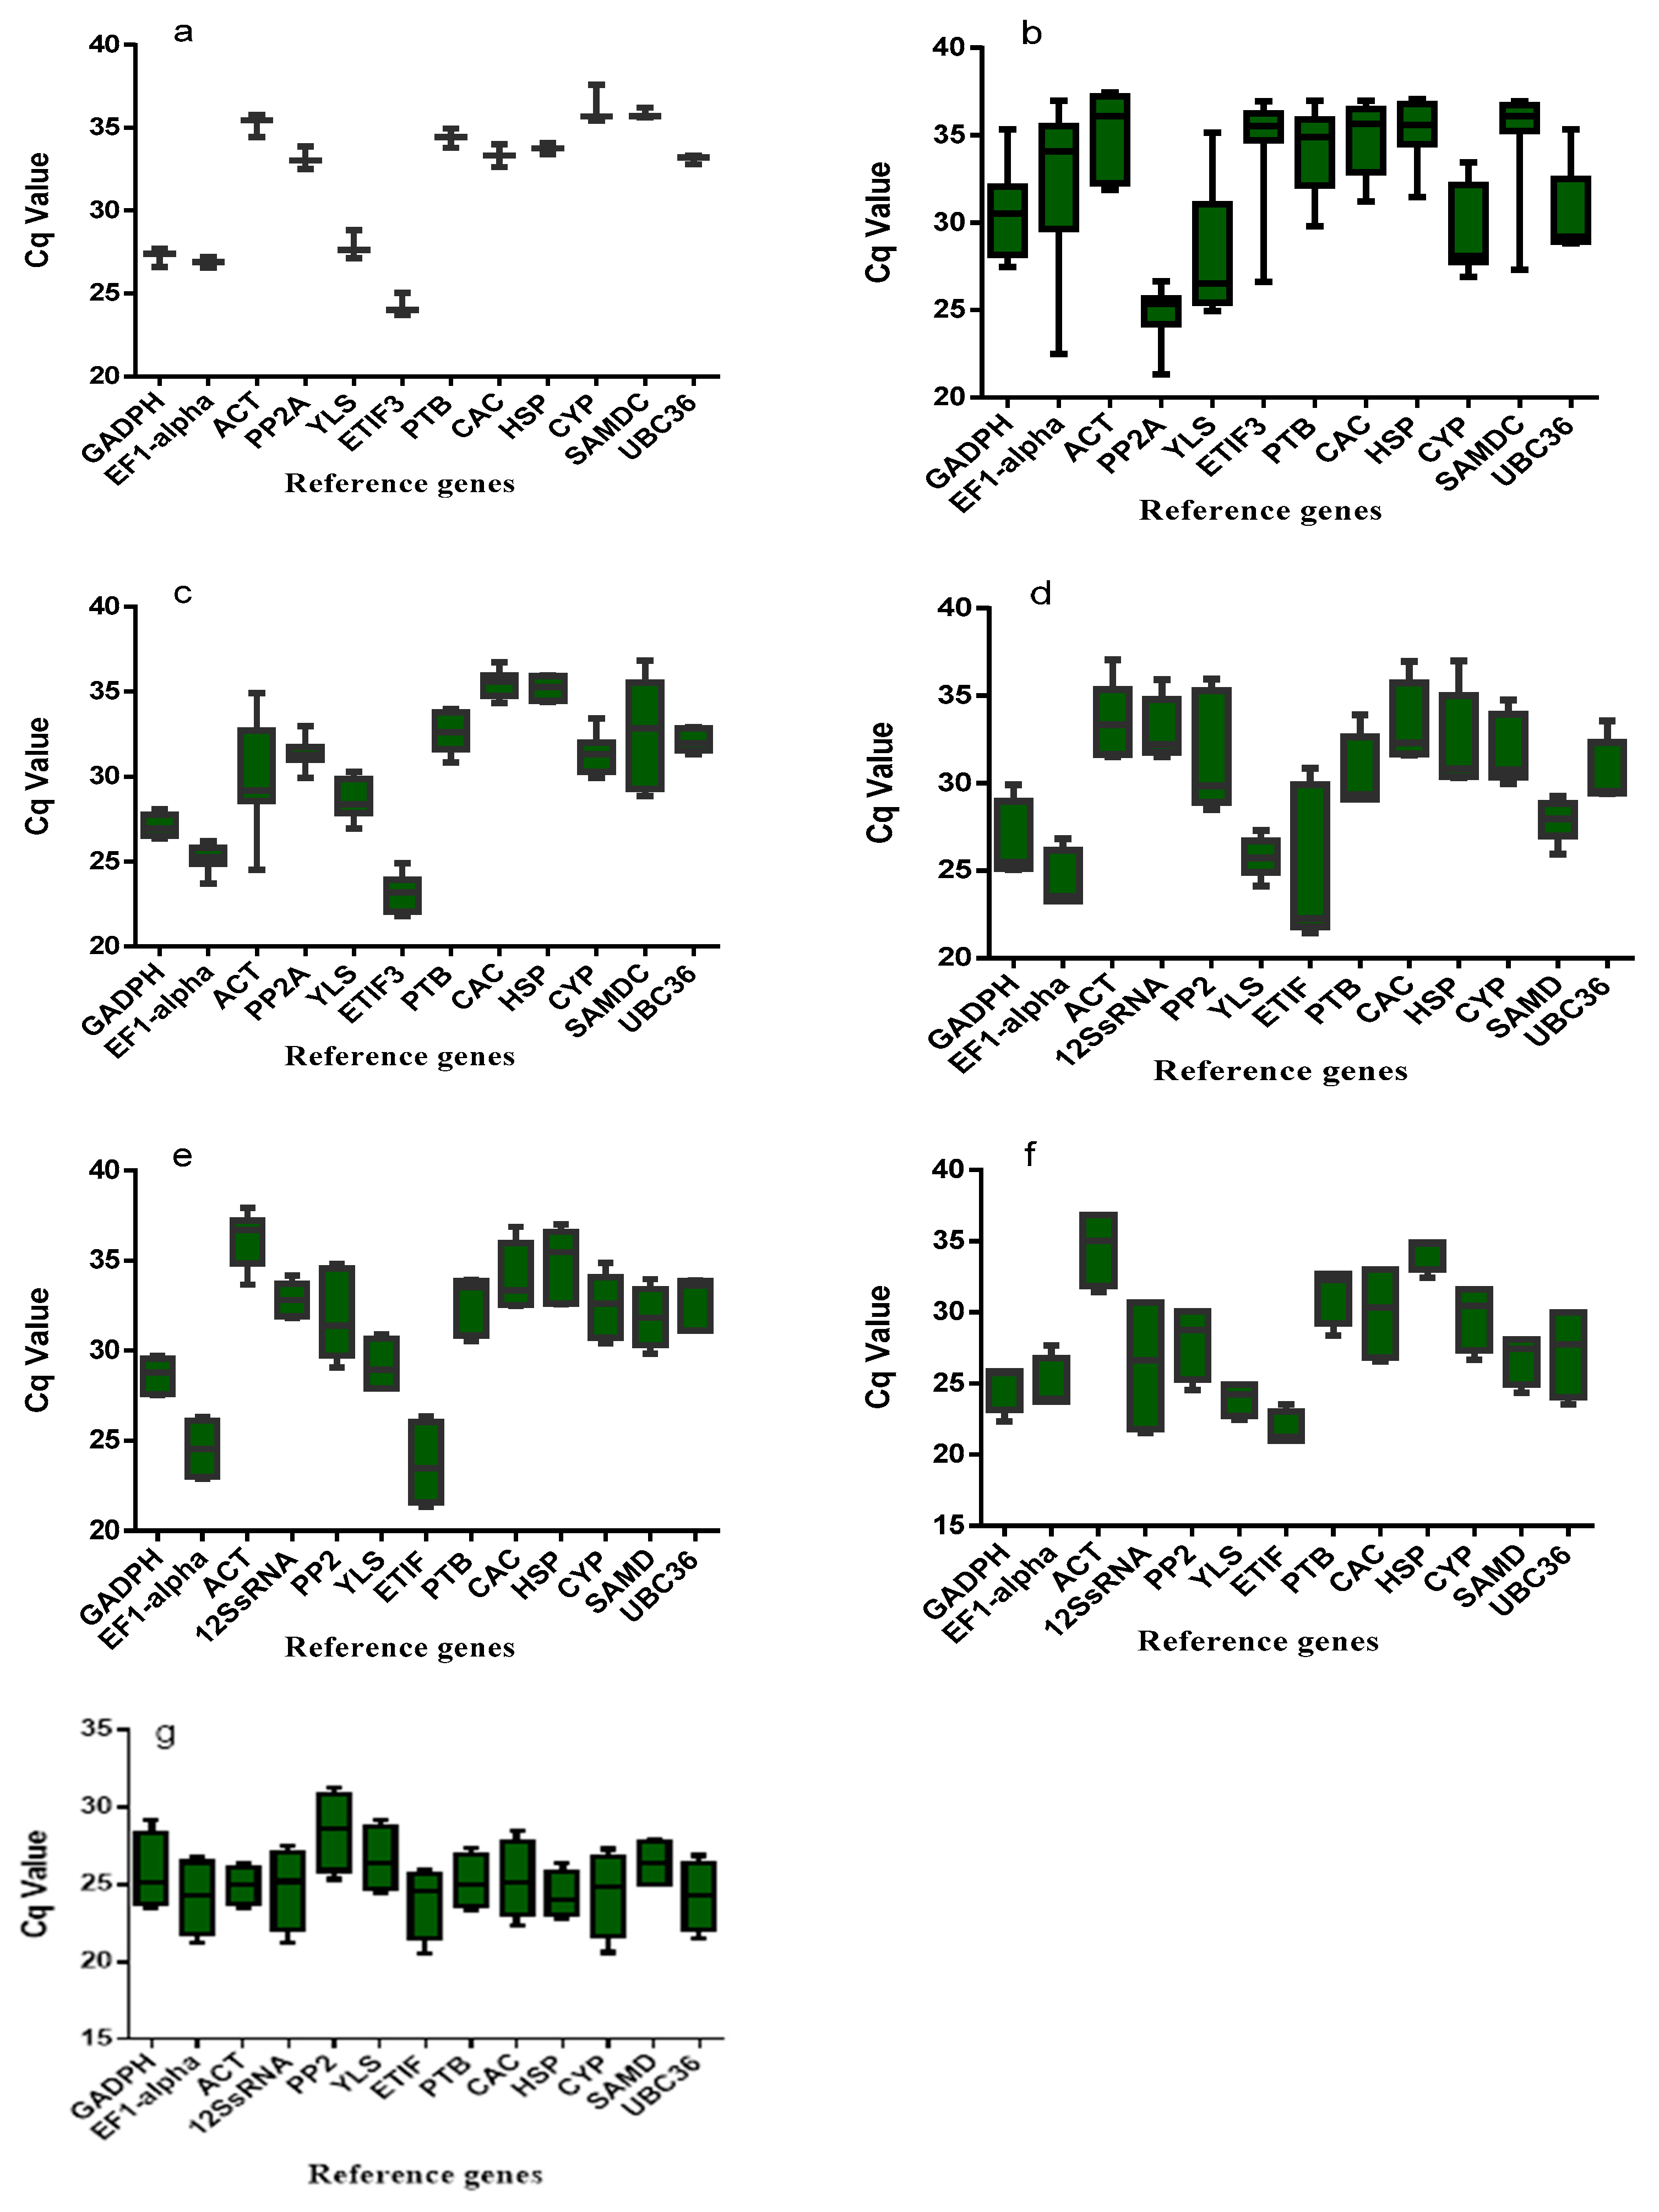
2.1. Reference Genes Selection
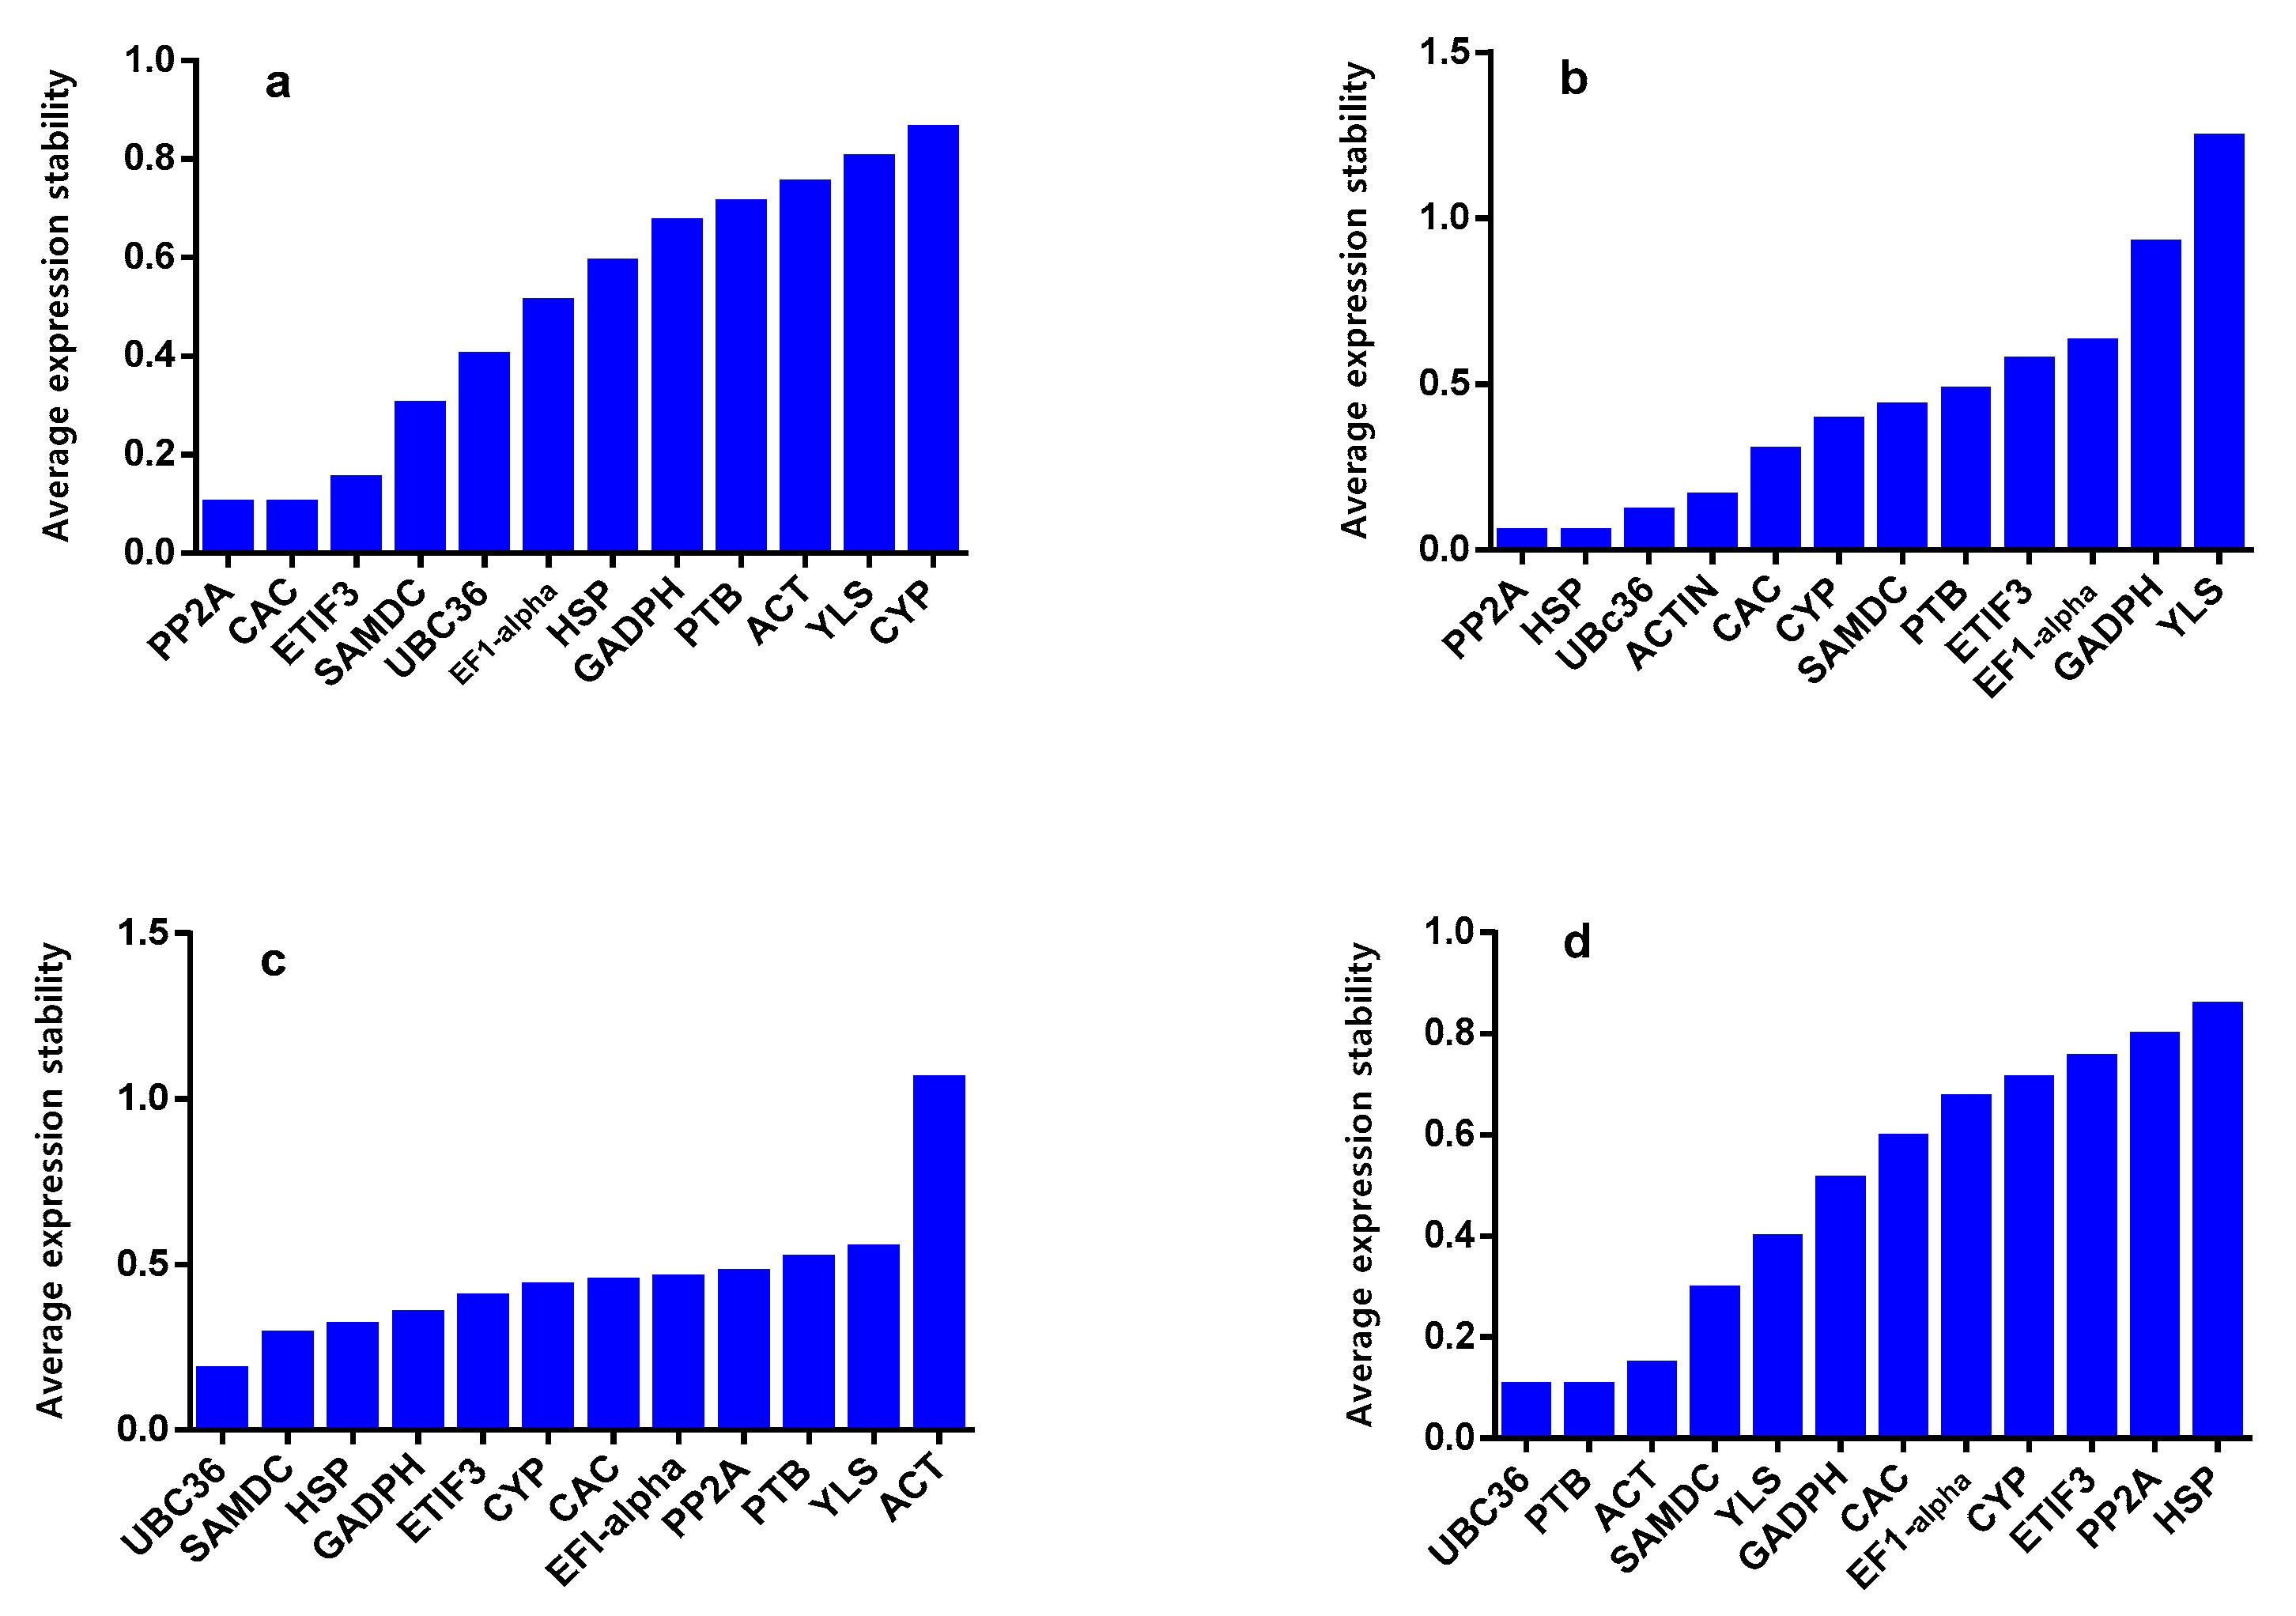
2.2. geNorm Analysis
2.3. NormFinder Analysis
2.4. BestKeeper Analysis
2.5. RefFinder Analysis
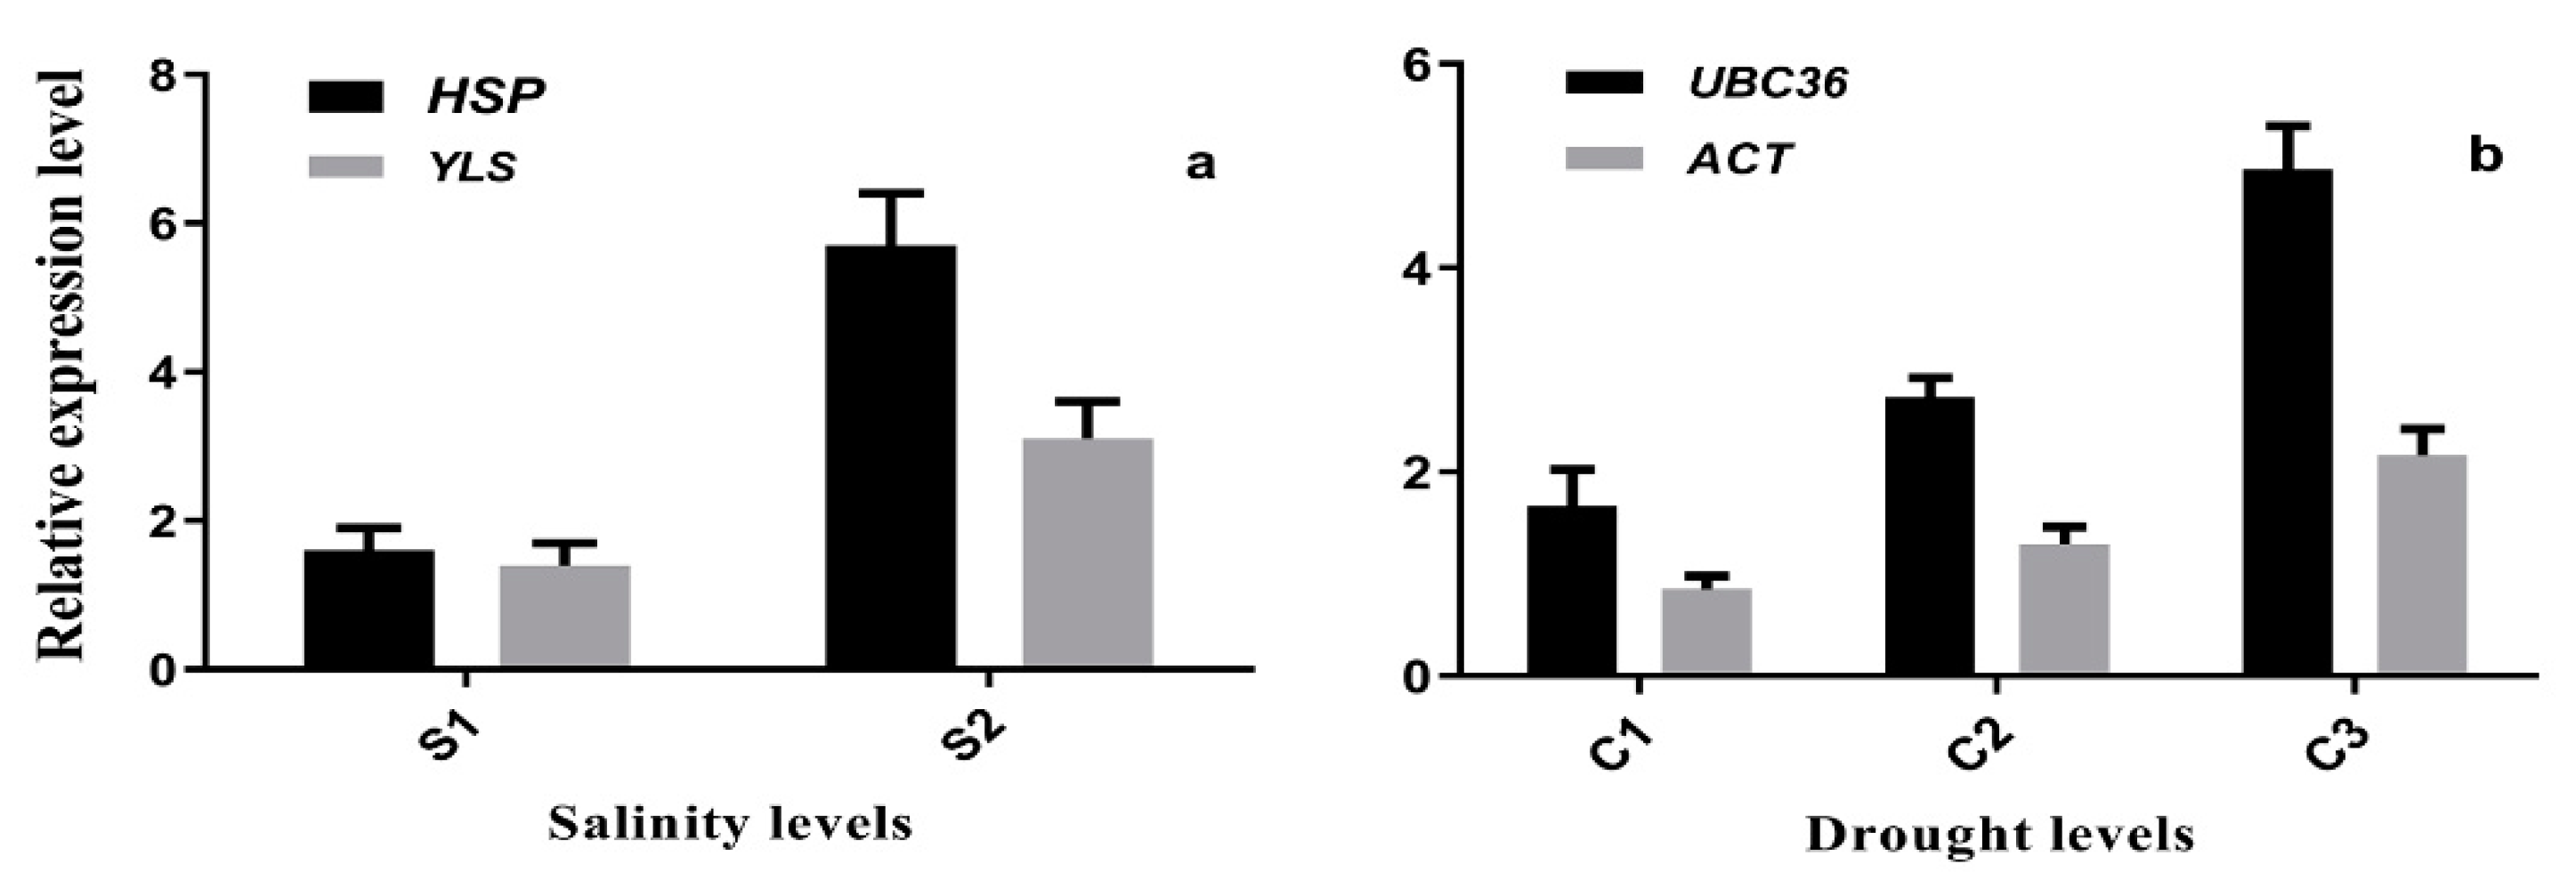
2.6. Reference Gene Validation
3. Discussion
4. Materials and Methods
4.1. Plant Materials
4.2. RNA Isolation and cDNA Synthesis
4.3. Reference Genes Selection, Amplification, and Primer Design
4.4. RT-qPCR Analysis
4.5. Data Analysis
4.6. NHX1 and DREB Expression under Salinity and Drought Stress Condition
Supplementary Materials
Author Contributions
Funding
Institutional Review Board Statement
Informed Consent Statement
Data Availability Statement
Acknowledgments
Conflicts of Interest
References
- Ling, H.-Q.; Ma, B.; Shi, X.; Liu, H.; Dong, L.; Sun, H.; Cao, Y.; Gao, Q.; Zheng, S.; Li, Y. Genome sequence of the progenitor of wheat A subgenome Triticum urartu. Nature 2018, 557, 424–428. [Google Scholar] [CrossRef] [Green Version]
- Miki, Y.; Yoshida, K.; Mizuno, N.; Nasuda, S.; Sato, K.; Takumi, S. Origin of wheat B-genome chromosomes inferred from RNA sequencing analysis of leaf transcripts from section Sitopsis species of Aegilops. DNA Res. 2019, 26, 171–182. [Google Scholar] [CrossRef] [PubMed] [Green Version]
- Kalia, B.; Wilson, D.L.; Bowden, R.L.; Singh, R.P.; Gill, B.S. Adult plant resistance to Puccinia triticina in a geographically diverse collection of Aegilops tauschii. Genet. Resour. Crop. Evol. 2017, 64, 913–926. [Google Scholar] [CrossRef]
- Yu, H.; Li, X. Distribution of Aegilops tauschii Coss. China and its research progress. J. Weed Sci. 2017, 36, 1–7. [Google Scholar]
- Kishii, M. An update of recent use of Aegilops species in wheat breeding. Front. Plant Sci. 2019, 10, 585. [Google Scholar] [CrossRef] [Green Version]
- Sohail, Q.; Inoue, T.; Tanaka, H.; Eltayeb, A.E.; Matsuoka, Y.; Tsujimoto, H. Applicability of Aegilops tauschii drought tolerance traits to breeding of hexaploid wheat. Breed. Sci. 2011, 61, 347–357. [Google Scholar] [CrossRef] [Green Version]
- Brozynska, M.; Furtado, A.; Henry, R.J. Genomics of crop wild relatives: Expanding the gene pool for crop improvement. Plant Biotechnol. J. 2016, 14, 1070–1085. [Google Scholar] [CrossRef]
- Li, T.; Wang, J.; Lu, M.; Zhang, T.; Qu, X.; Wang, Z. Selection and Validation of Appropriate Reference Genes for qRT-PCR Analysis in Isatis indigotica Fort. Front. Plant Sci. 2017, 8, 1139. [Google Scholar] [CrossRef] [Green Version]
- Xie, J.; Liu, T.; Khashaveh, A.; Yi, C.; Liu, X.; Zhang, Y. Identification and Evaluation of Suitable Reference Genes for RT-qPCR Analysis in Hippodamia variegata (Coleoptera: Coccinellidae) Under Different Biotic and Abiotic Conditions. Front. Physiol. 2021, 12. [Google Scholar] [CrossRef] [PubMed]
- Kozera, B.; Rapacz, M. Reference genes in real-time PCR. J. Appl. Genet. 2013, 54, 391–406. [Google Scholar] [CrossRef] [Green Version]
- Kundu, A.; Patel, A.; Pal, A. Defining reference genes for qPCR normalization to study biotic and abiotic stress responses in Vigna mungo. Plant Cell Rep. 2013, 32, 1647–1658. [Google Scholar] [CrossRef]
- Schmidt, G.W.; Delaney, S.K. Stable internal reference genes for normalization of real-time RT-PCR in tobacco (Nicotiana tabacum) during development and abiotic stress. Mol. Genet. Genom. 2010, 283, 233–241. [Google Scholar] [CrossRef]
- Bakir, Y.; Eldem, V.; Zararsiz, G.; Unver, T. Global transcriptome analysis reveals differences in gene expression patterns between nonhyperhydric and hyperhydric peach leaves. Plant Genome 2016, 9. [Google Scholar] [CrossRef] [Green Version]
- Wan, H.; Zhao, Z.; Qian, C.; Sui, Y.; Malik, A.A.; Chen, J. Selection of appropriate reference genes for gene expression studies by quantitative real-time polymerase chain reaction in cucumber. Anal. Biochem. 2010, 399, 257–261. [Google Scholar] [CrossRef]
- Zhu, X.; Li, X.; Chen, W.; Chen, J.; Lu, W.; Chen, L.; Fu, D. Evaluation of new reference genes in papaya for accurate transcript normalization under different experimental conditions. PLoS ONE 2012, 7, e44405. [Google Scholar] [CrossRef]
- Zhao, J.; Zhou, M.; Meng, Y. Identification and validation of reference genes for RT-qPCR analysis in switchgrass under heavy metal stresses. Genes 2020, 11, 502. [Google Scholar] [CrossRef] [PubMed]
- Li, L.; Li, N.; Fang, H.; Qi, X.; Zhou, Y. Selection and validation of reference genes for normalisation of gene expression in Glehnia littoralis. Sci. Rep. 2020, 10, 1–12. [Google Scholar] [CrossRef] [PubMed]
- Garrido, J.; Aguilar, M.; Prieto, P. Identification and validation of reference genes for RT-qPCR normalization in wheat meiosis. Sci. Rep. 2020, 10, 1–12. [Google Scholar] [CrossRef]
- Chen, J.; Huang, Z.; Huang, H.; Wei, S.; Liu, Y.; Jiang, C.; Zhang, J.; Zhang, C. Selection of relatively exact reference genes for gene expression studies in goosegrass (Eleusine indica) under herbicide stress. Sci. Rep. 2017, 7, 1–9. [Google Scholar] [CrossRef] [PubMed] [Green Version]
- Suneja, Y.; Gupta, A.K.; Bains, N.S. Stress adaptive plasticity: Aegilops tauschii and Triticum dicoccoides as potential donors of drought associated morpho-physiological traits in wheat. Front. Plant Sci. 2019, 10, 211. [Google Scholar] [CrossRef] [PubMed] [Green Version]
- Zhao, X.; Bai, S.; Li, L.; Han, X.; Li, J.; Zhu, Y.; Fang, Y.; Zhang, D.; Li, S. Comparative transcriptome analysis of two Aegilops tauschii with contrasting drought tolerance by RNA-Seq. Int. J. Mol. Sci. 2020, 21, 3595. [Google Scholar] [CrossRef]
- Fahad, S.; Hussain, S.; Bano, A.; Saud, S.; Hassan, S.; Shan, D.; Khan, F.A.; Khan, F.; Chen, Y.; Wu, C. Potential role of phytohormones and plant growth-promoting rhizobacteria in abiotic stresses: Consequences for changing environment. Environ. Sci. Pollut. Res. 2015, 22, 4907–4921. [Google Scholar] [CrossRef] [PubMed]
- Mahajan, S.; Tuteja, N. Cold, salinity and drought stresses: An overview. Arch. Biochem. Biophys. 2005, 444, 139–158. [Google Scholar] [CrossRef] [PubMed]
- Parihar, P.; Singh, S.; Singh, R.; Singh, V.P.; Prasad, S.M. Effect of salinity stress on plants and its tolerance strategies: A review. Environ. Sci. Pollut. Res. 2015, 22, 4056–4075. [Google Scholar] [CrossRef] [PubMed]
- Baillo, E.H.; Kimotho, R.N.; Zhang, Z.; Xu, P. Transcription factors associated with abiotic and biotic stress tolerance and their potential for crops improvement. Genes 2019, 10, 771. [Google Scholar] [CrossRef] [PubMed] [Green Version]
- Yu, Y.; Zhang, G.; Chen, Y.; Bai, Q.; Gao, C.; Zeng, L.; Li, Z.; Cheng, Y.; Chen, J.; Sun, X. Selection of reference genes for qPCR analyses of gene expression in ramie leaves and roots across eleven abiotic/biotic treatments. Sci. Rep. 2019, 9, 1–13. [Google Scholar] [CrossRef]
- Akbarabadi, A.; Ismaili, A.; Kahrizi, D.; Firouzabadi, F.N. Validation of expression stability of reference genes in response to herbicide stress in wild oat (Avena ludoviciana). Cell. Mol. Biol. 2018, 64, 113–118. [Google Scholar] [CrossRef]
- Wang, M.; Lu, S. Validation of suitable reference genes for quantitative gene expression analysis in Panax ginseng. Front. Plant Sci. 2016, 6, 1259. [Google Scholar] [CrossRef] [PubMed] [Green Version]
- Vandesompele, J.; De Preter, K.; Pattyn, F.; Poppe, B.; Van Roy, N.; De Paepe, A.; Speleman, F. Accurate normalization of real-time quantitative RT-PCR data by geometric averaging of multiple internal control genes. Genome Biol. 2002, 3, 1–12. [Google Scholar] [CrossRef] [Green Version]
- Le, D.T.; Nishiyama, R.; Watanabe, Y.; Tanaka, M.; Seki, M.; Ham, L.H.; Yamaguchi-Shinozaki, K.; Shinozaki, K.; Tran, L.-S.P. Differential gene expression in soybean leaf tissues at late developmental stages under drought stress revealed by genome-wide transcriptome analysis. PLoS ONE 2012, 7, e49522. [Google Scholar] [CrossRef] [Green Version]
- Zhang, X.; Li, J.; Liu, A.; Zou, J.; Zhou, X.; Xiang, J.; Rerksiri, W.; Peng, Y.; Xiong, X.; Chen, X. Expression profile in rice panicle: Insights into heat response mechanism at reproductive stage. PLoS ONE 2012, 7, e49652. [Google Scholar] [CrossRef] [Green Version]
- Sinha, P.; Saxena, R.K.; Singh, V.K.; Krishnamurthy, L.; Varshney, R.K. Selection and validation of housekeeping genes as reference for gene expression studies in pigeonpea (Cajanus cajan) under heat and salt stress conditions. Front. Plant Sci. 2015, 6, 1071. [Google Scholar] [CrossRef] [Green Version]
- Malone, J.M.; Morran, S.; Shirley, N.; Boutsalis, P.; Preston, C. EPSPS gene amplification in glyphosate-resistant Bromus diandrus. Pest Manag. Sci. 2016, 72, 81–88. [Google Scholar] [CrossRef] [PubMed]
- Kiarash, J.G.; Wilde, H.D.; Amirmahani, F.; Moemeni, M.M.; Zaboli, M.; Nazari, M.; Moosavi, S.S.; Jamalvandi, M. Selection and validation of reference genes for normalization of qRT-PCR gene expression in wheat (Triticum durum L.) under drought and salt stresses. J. Genet. 2018, 97, 1433–1444. [Google Scholar] [CrossRef] [PubMed]
- Wang, J.; Abbas, M.; Wen, Y.; Niu, D.; Wang, L.; Sun, Y.; Li, Y. Selection and validation of reference genes for quantitative gene expression analyses in black locust (Robinia pseudoacacia L.) using real-time quantitative PCR. PLoS ONE 2018, 13, e0193076. [Google Scholar] [CrossRef] [PubMed] [Green Version]
- Ray, S.; Maunsell, J.H. Different origins of gamma rhythm and high-gamma activity in macaque visual cortex. PLoS Biol. 2011, 9, e1000610. [Google Scholar] [CrossRef] [Green Version]
- Hao, X.; Horvath, D.P.; Chao, W.S.; Yang, Y.; Wang, X.; Xiao, B. Identification and evaluation of reliable reference genes for quantitative real-time PCR analysis in tea plant (Camellia sinensis (L.) O. Kuntze). Int. J. Mol. Sci. 2014, 15, 22155–22172. [Google Scholar] [CrossRef]
- Tajti, J.; Pál, M.; Janda, T. Validation of reference genes for studying different abiotic stresses in oat (Avena sativa L.) by RT-qPCR. Plants 2021, 10, 1272. [Google Scholar] [CrossRef]
- Kulkarni, M.; Soolanayakanahally, R.; Ogawa, S.; Uga, Y.; Selvaraj, M.G.; Kagale, S. Drought response in wheat: Key genes and regulatory mechanisms controlling root system architecture and transpiration efficiency. Front. Chem. 2017, 5, 106. [Google Scholar] [CrossRef] [Green Version]
- Hossain, M.S.; Ahmed, R.; Haque, M.S.; Alam, M.M.; Islam, M.S. Identification and validation of reference genes for real-time quantitative RT-PCR analysis in jute. BMC Mol. Biol. 2019, 20, 1–13. [Google Scholar] [CrossRef]
- Zhang, S.; Zeng, Y.; Yi, X.; Zhang, Y. Selection of suitable reference genes for quantitative RT-PCR normalization in the halophyte Halostachys caspica under salt and drought stress. Sci. Rep. 2016, 6, 1–9. [Google Scholar] [CrossRef] [PubMed] [Green Version]
- Abbas, A.; Yu, H.; Cui, H.; Li, X. Effect of drought stress on chlorophyll fluorescence, and biomass portioning of Aegilops tauschii L. Appl. Ecol. Environ. Res. 2019, 17, 1071–1082. [Google Scholar] [CrossRef]
- Abbas, A.; Yu, H.; Cui, H.; Li, X. Genetic diversity and synergistic modulation of salinity tolerance genes in Aegilops tauschii Coss. Plants 2021, 10, 1393. [Google Scholar] [CrossRef] [PubMed]


| Symbol | Gene Description | Gene Symbol in NCBI | Forward Primer (5′-3′) | Reverse Primer (5′-3′) | Amplicon Length (bp) | Correlation Coefficient | RT-qPCR Efficiency |
|---|---|---|---|---|---|---|---|
| ACT | Actin | LOC109759322 | TTGCCTTGGATTATGAACA3′ | GATGGCTGGAACAGAACTT3′ | 109 | 0.98 | 106% |
| GAPDH | Glyceraldehyde-3-phosphate dehydrogenase | LOC109783816 | TACTTCACAGCCGATAGC | CCGATTGTTGGACGATACT | 129 | 0.99 | 107.85% |
| EF1-alpha | Elongation factor 1 alpha | LOC109759403 | ATTGGTGGCATTGGAACT | TCTCAACAGACTTAACCTCAG | 115 | 0.99 | 111.60% |
| SAMDC | Phosphate2Aserine/threonine-protein phosphatase 2A | LOC109775250 | TACTTCACAGCCGATAGC | CCGATTGTTGGACGATACT | 114 | 0.98 | 117.12% |
| UBC36 | Ubiquitin-conjugating enzyme E2 36-like | LOC109787298 | GTATCACATAGACAGCATCATC | AGCATCCAGGACATTCAA | 124 | 0.99 | 109.07% |
| CYP | Peptidyl-prolyl cis-trans isomerase CYP19-4-like | LOC109782168 | GGTTAAGCCATCCTCCTT | CTCGTAGTTACAGTGGTGAT | 116 | 0.98 | 111.44% |
| PTB | Polypyrimidine tract-binding protein homolog 1-like | LOC109755882 | GACGATTCAAGCACGATTCT | TTGTTCCAGCCGATTGTTG | 112 | 0.98 | 107.76% |
| CAC | Intracellular transport protein | LOC109744258 | CACGCTGCTCACTGTTAC | AATCTGGCATCCTTCTACTTCA | 92 | 0.98 | 112.24% |
| PP2A | Serine/threonine protein phosphatase 2A | LOC109772007 | CTGTCACATAGGTAGAGTAGAT | CACGCAAGATGGAGTAAC | 128 | 0.99 | 113.60% |
| ETIF3 | Eukaryotic translation initiation factor 3 | LOC109750994 | AGCCTCTTCATCTTCTTCA | TTGGTCTGGATAGCATTGA | 92 | 0.99 | 117.75% |
| HSP | Protein microrchidia 2-like | LOC109787360 | CTGTATCTGAGGTTCTTGGT | CTACTCGGTGGTCAAACT | 101 | 0.97 | 111.19% |
| YLS | Thioredoxin-like protein | LOC109773417 | GTCAACGGTGATGTTCTTCT | ACAGTCTCCACAATGTCAAC | 103 | 0.99 | 104.74% |
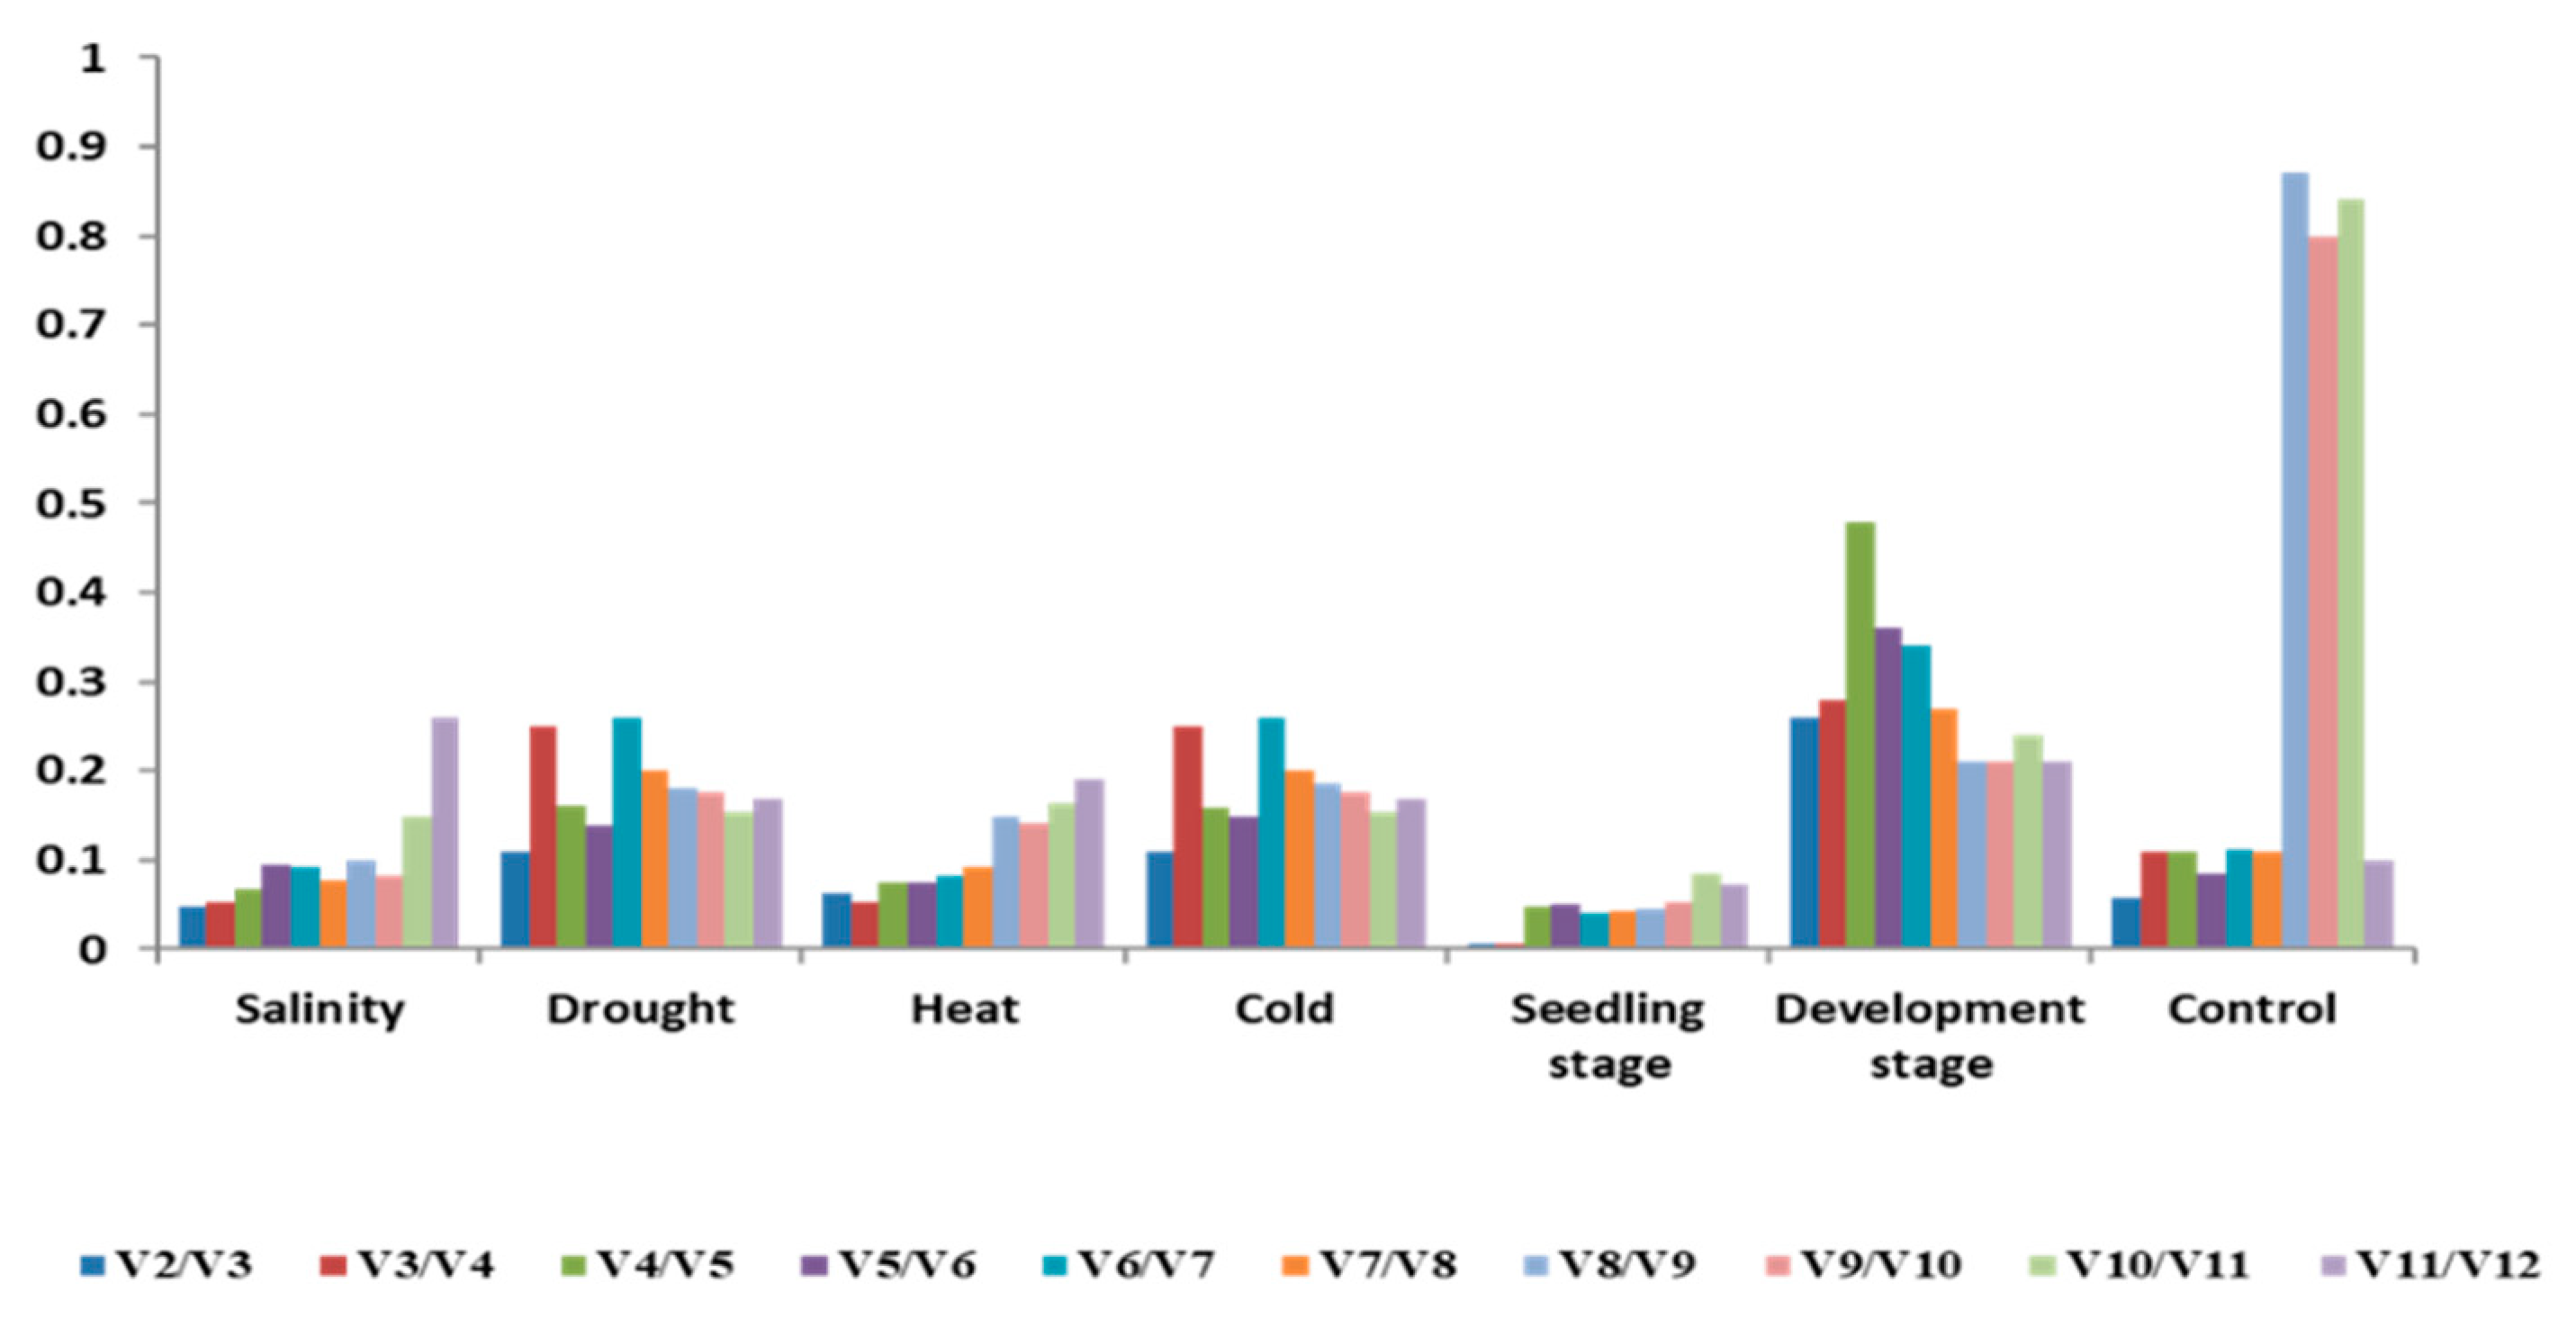
| Gene | Control | Salinity | Drought | Heat | Cold | Seedling Stage | Development Stage | Total |
|---|---|---|---|---|---|---|---|---|
| PP2 | 0.5 | 0.29 | 0.54 | 2.76 | 1.87 | 0.42 | 2.09 | 2.55 |
| CAC | 0.46 | 0.06 | 0.49 | 1.85 | 1.49 | 0.6 | 1.97 | 1.43 |
| ETIF3 | 0.52 | 0.45 | 0.65 | 3.68 | 1.63 | 0.43 | 1.55 | 3.37 |
| SAMDC | 0.24 | 0.22 | 0.71 | 0.18 | 1.16 | 0.17 | 1.54 | 2.67 |
| UBC36 | 0.2 | 0.18 | 0.59 | 1.44 | 1.17 | 0.04 | 2.5 | 1.52 |
| EF1-alpha | 0.22 | 0.48 | 0.32 | 1.33 | 1.08 | 0.46 | 1.71 | 2.25 |
| HSP | 0.24 | 0.26 | 0.62 | 2.26 | 1.56 | 0.09 | 1.4 | 1.23 |
| GADPH | 0.42 | 1.16 | 0.46 | 1.78 | 0.73 | 0.13 | 1.1 | 1.53 |
| PTB | 0.39 | 0.51 | 1.04 | 1.71 | 1.32 | 0.27 | 2.1 | 1.51 |
| ACT | 0.52 | 0.38 | 2.27 | 2 | 1.17 | 0.97 | 1 | 1.54 |
| YLS | 0.64 | 2.21 | 1.03 | 0.58 | 1.04 | 0.45 | 1.85 | 1.75 |
| CYP | 0.9 | 0.17 | 0.38 | 1.66 | 1.27 | 0.97 | 0.81 | 2.24 |
| Rank | Control | Salinity | Drought | Heat | Cold | Seedling Stage | Development Stage | Total |
|---|---|---|---|---|---|---|---|---|
| 1 | UBC36 1.78 | HSP 1.78 | UBC36 1.57 | UBC36 1.78 | YLS 1.78 | PP2A 1.57 | ETIF3 2.06 | CAC 1.68 |
| 2 | SAMDC 2.38 | UBC36 2.28 | SAMDC 3.22 | SAMDC 2.38 | SAMDC 2.83 | ETIF3 2.3 | PTB 2.58 | PTB 1.73 |
| 3 | EF1-alpha 3.46 | PP2A 2.45 | EF1-alpha 3.36 | EF1-alpha 3.46 | ACT 3.41 | YLS 4.12 | PP2A 3.98 | HSP 2.24 |
| 4 | HSP 3.98 | CAC 3.50 | HSP 3.98 | HSP 3.98 | UBC36 3.66 | EF1-alpha 4.56 | EF1-alpha 3.98 | GADPH 3.87 |
| 5 | PP2A 4.28 | ACT 4.60 | GADPH 4.28 | PP2A 4.28 | GADPH 4.41 | PTB 5 | CYP 4.41 | UBC36 4.43 |
| 6 | CAC 4.41 | CYP 4.74 | CYP 4.36 | CAC 4.41 | PTB 4.60 | UBC36 5.62 | SAMDC 4.68 | YLS 5.63 |
| 7 | ETIF 5.89 | SAMDC 6.29 | CAC 4.53 | ETIF 5.89 | EF1-alpha 5.18 | SAMDC 5.63 | GADPH 6.4 | ACT 6.74 |
| 8 | GADPH 6.62 | PTB 7.52 | ETIF3 7.09 | GADPH 6.62 | CAC 5.63 | HSP 6 | CAC 6.92 | EF1-alpha 8.24 |
| 9 | PTB 7.3 | ETIF3 8.74 | PP2A 7.54 | PTB 7.3 | CYP 8.21 | GADPH 6.05 | HSP 6.9 | CYP 8.97 |
| 10 | ACT 9.74 | EF1-alpha 9.74 | PTB 10.24 | ACT 9.74 | ETIF3 10.24 | CAC 7.84 | ACT 7.18 | SAMDC 9.97 |
| 11 | YLS 11 | GADPH 11 | YLS 10.74 | YLS 11 | PP2A 11.24 | CYP 11 | YLS 8.94 | PP2A 10.74 |
| 12 | CYP 12 | YLS 12 | ACT 12 | ETIF3 12 | HSP 11.47 | ACT 12 | UBC36 12 | ETIF3 12 |
Publisher’s Note: MDPI stays neutral with regard to jurisdictional claims in published maps and institutional affiliations. |
© 2021 by the authors. Licensee MDPI, Basel, Switzerland. This article is an open access article distributed under the terms and conditions of the Creative Commons Attribution (CC BY) license (https://creativecommons.org/licenses/by/4.0/).
Share and Cite
Abbas, A.; Yu, H.; Li, X.; Cui, H.; Chen, J.; Huang, P. Selection and Validation of Reference Genes for RT-qPCR Analysis in Aegilops tauschii (Coss.) under Different Abiotic Stresses. Int. J. Mol. Sci. 2021, 22, 11017. https://doi.org/10.3390/ijms222011017
Abbas A, Yu H, Li X, Cui H, Chen J, Huang P. Selection and Validation of Reference Genes for RT-qPCR Analysis in Aegilops tauschii (Coss.) under Different Abiotic Stresses. International Journal of Molecular Sciences. 2021; 22(20):11017. https://doi.org/10.3390/ijms222011017
Chicago/Turabian StyleAbbas, Adeel, Haiyan Yu, Xiangju Li, Hailan Cui, Jingchao Chen, and Ping Huang. 2021. "Selection and Validation of Reference Genes for RT-qPCR Analysis in Aegilops tauschii (Coss.) under Different Abiotic Stresses" International Journal of Molecular Sciences 22, no. 20: 11017. https://doi.org/10.3390/ijms222011017
APA StyleAbbas, A., Yu, H., Li, X., Cui, H., Chen, J., & Huang, P. (2021). Selection and Validation of Reference Genes for RT-qPCR Analysis in Aegilops tauschii (Coss.) under Different Abiotic Stresses. International Journal of Molecular Sciences, 22(20), 11017. https://doi.org/10.3390/ijms222011017