
Serotonin and Melatonin Biosynthesis in Plants: Genome-Wide Identification of the Genes and Their Expression Reveal a Conserved Role in Stress and Development

 , and
, and
Abstract
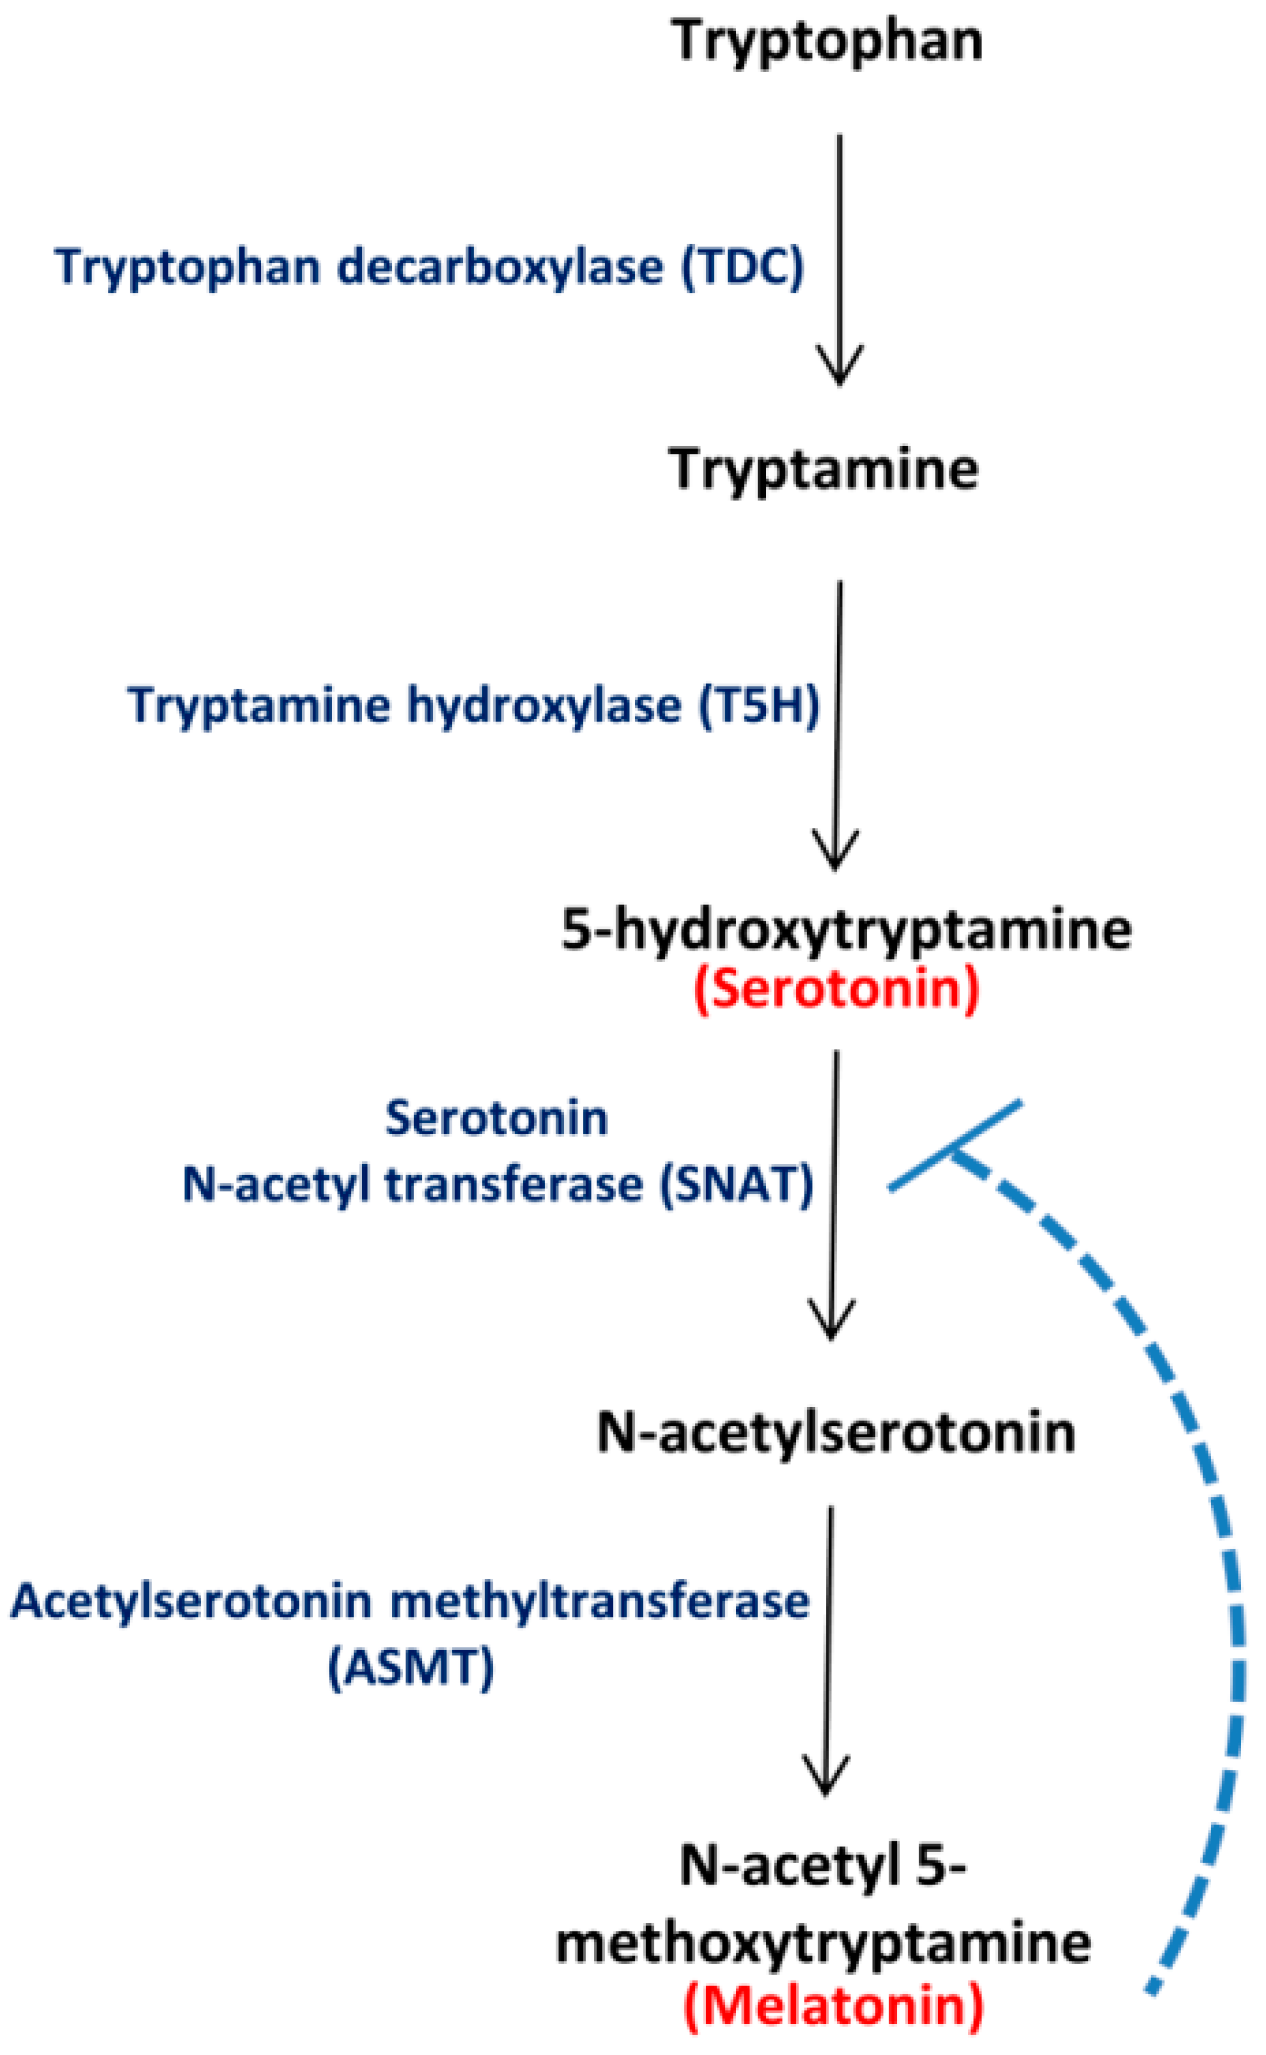
:1. Introduction
2. Results
2.1. Plants Encode Multiple Isoforms of Genes Involved in Ser and Mel Biosynthesis
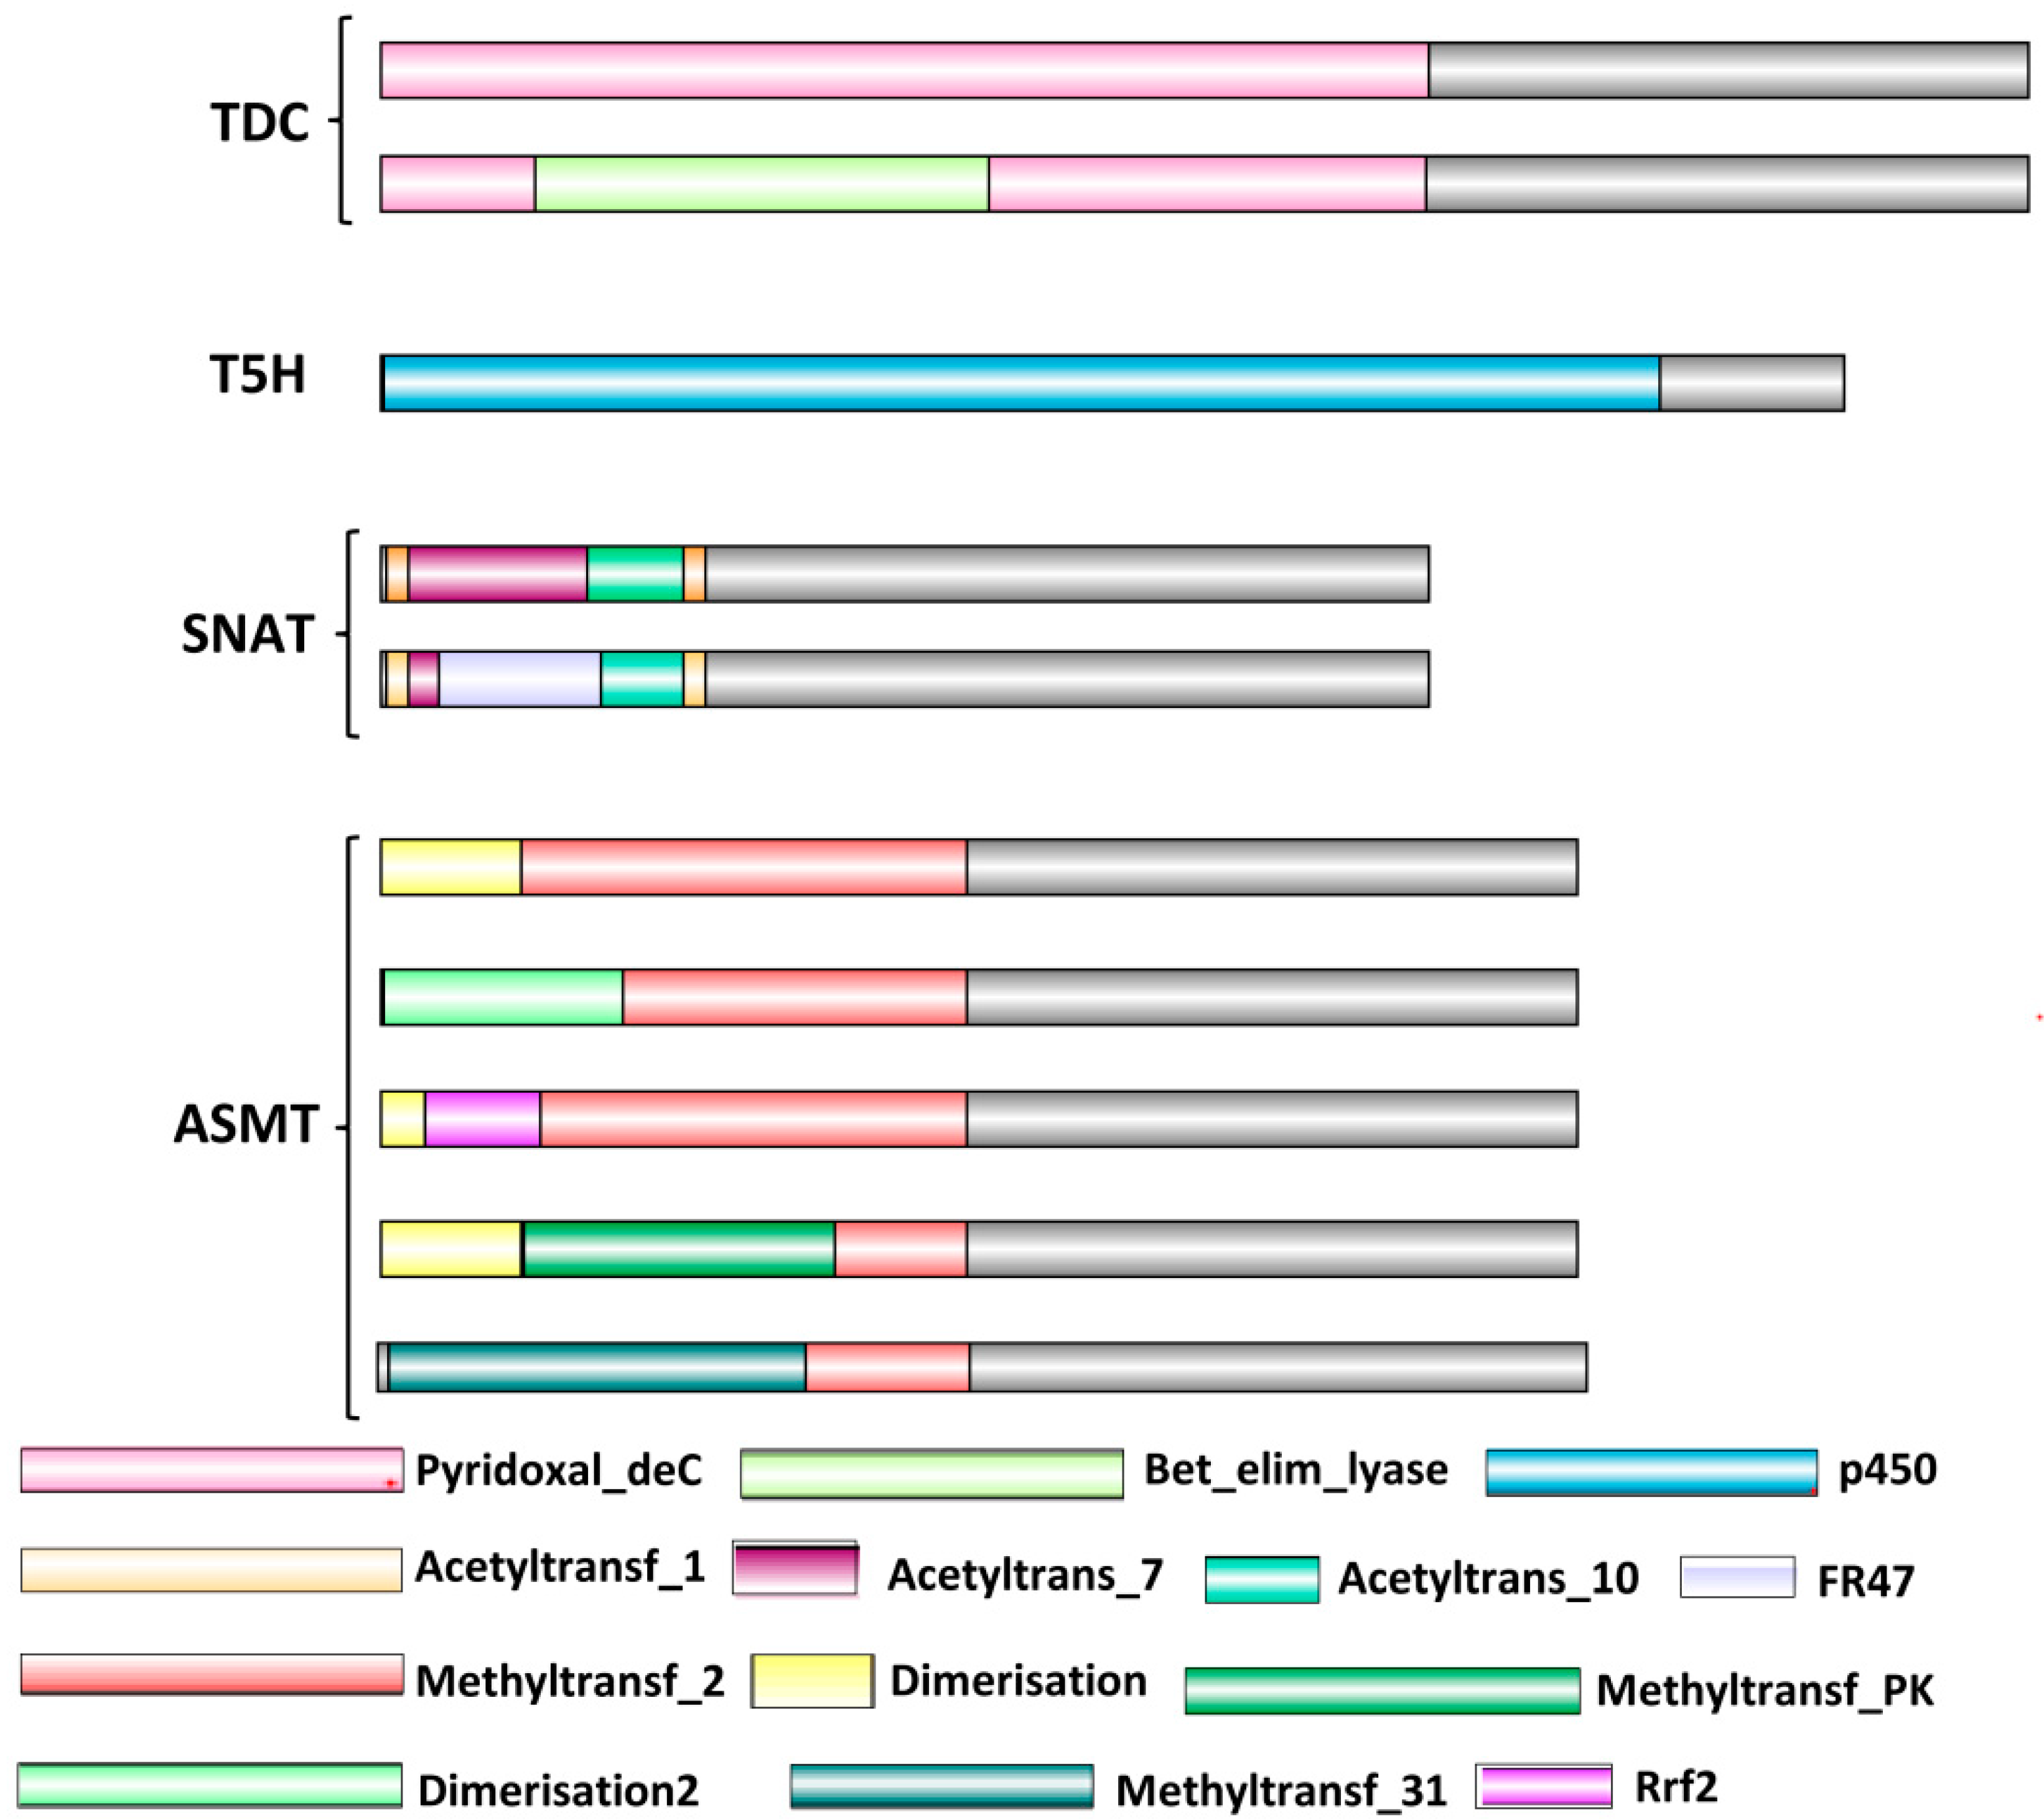
2.2. Proteins Specific to Mel Biosynthesis Show Greater Variations in Domain Architecture
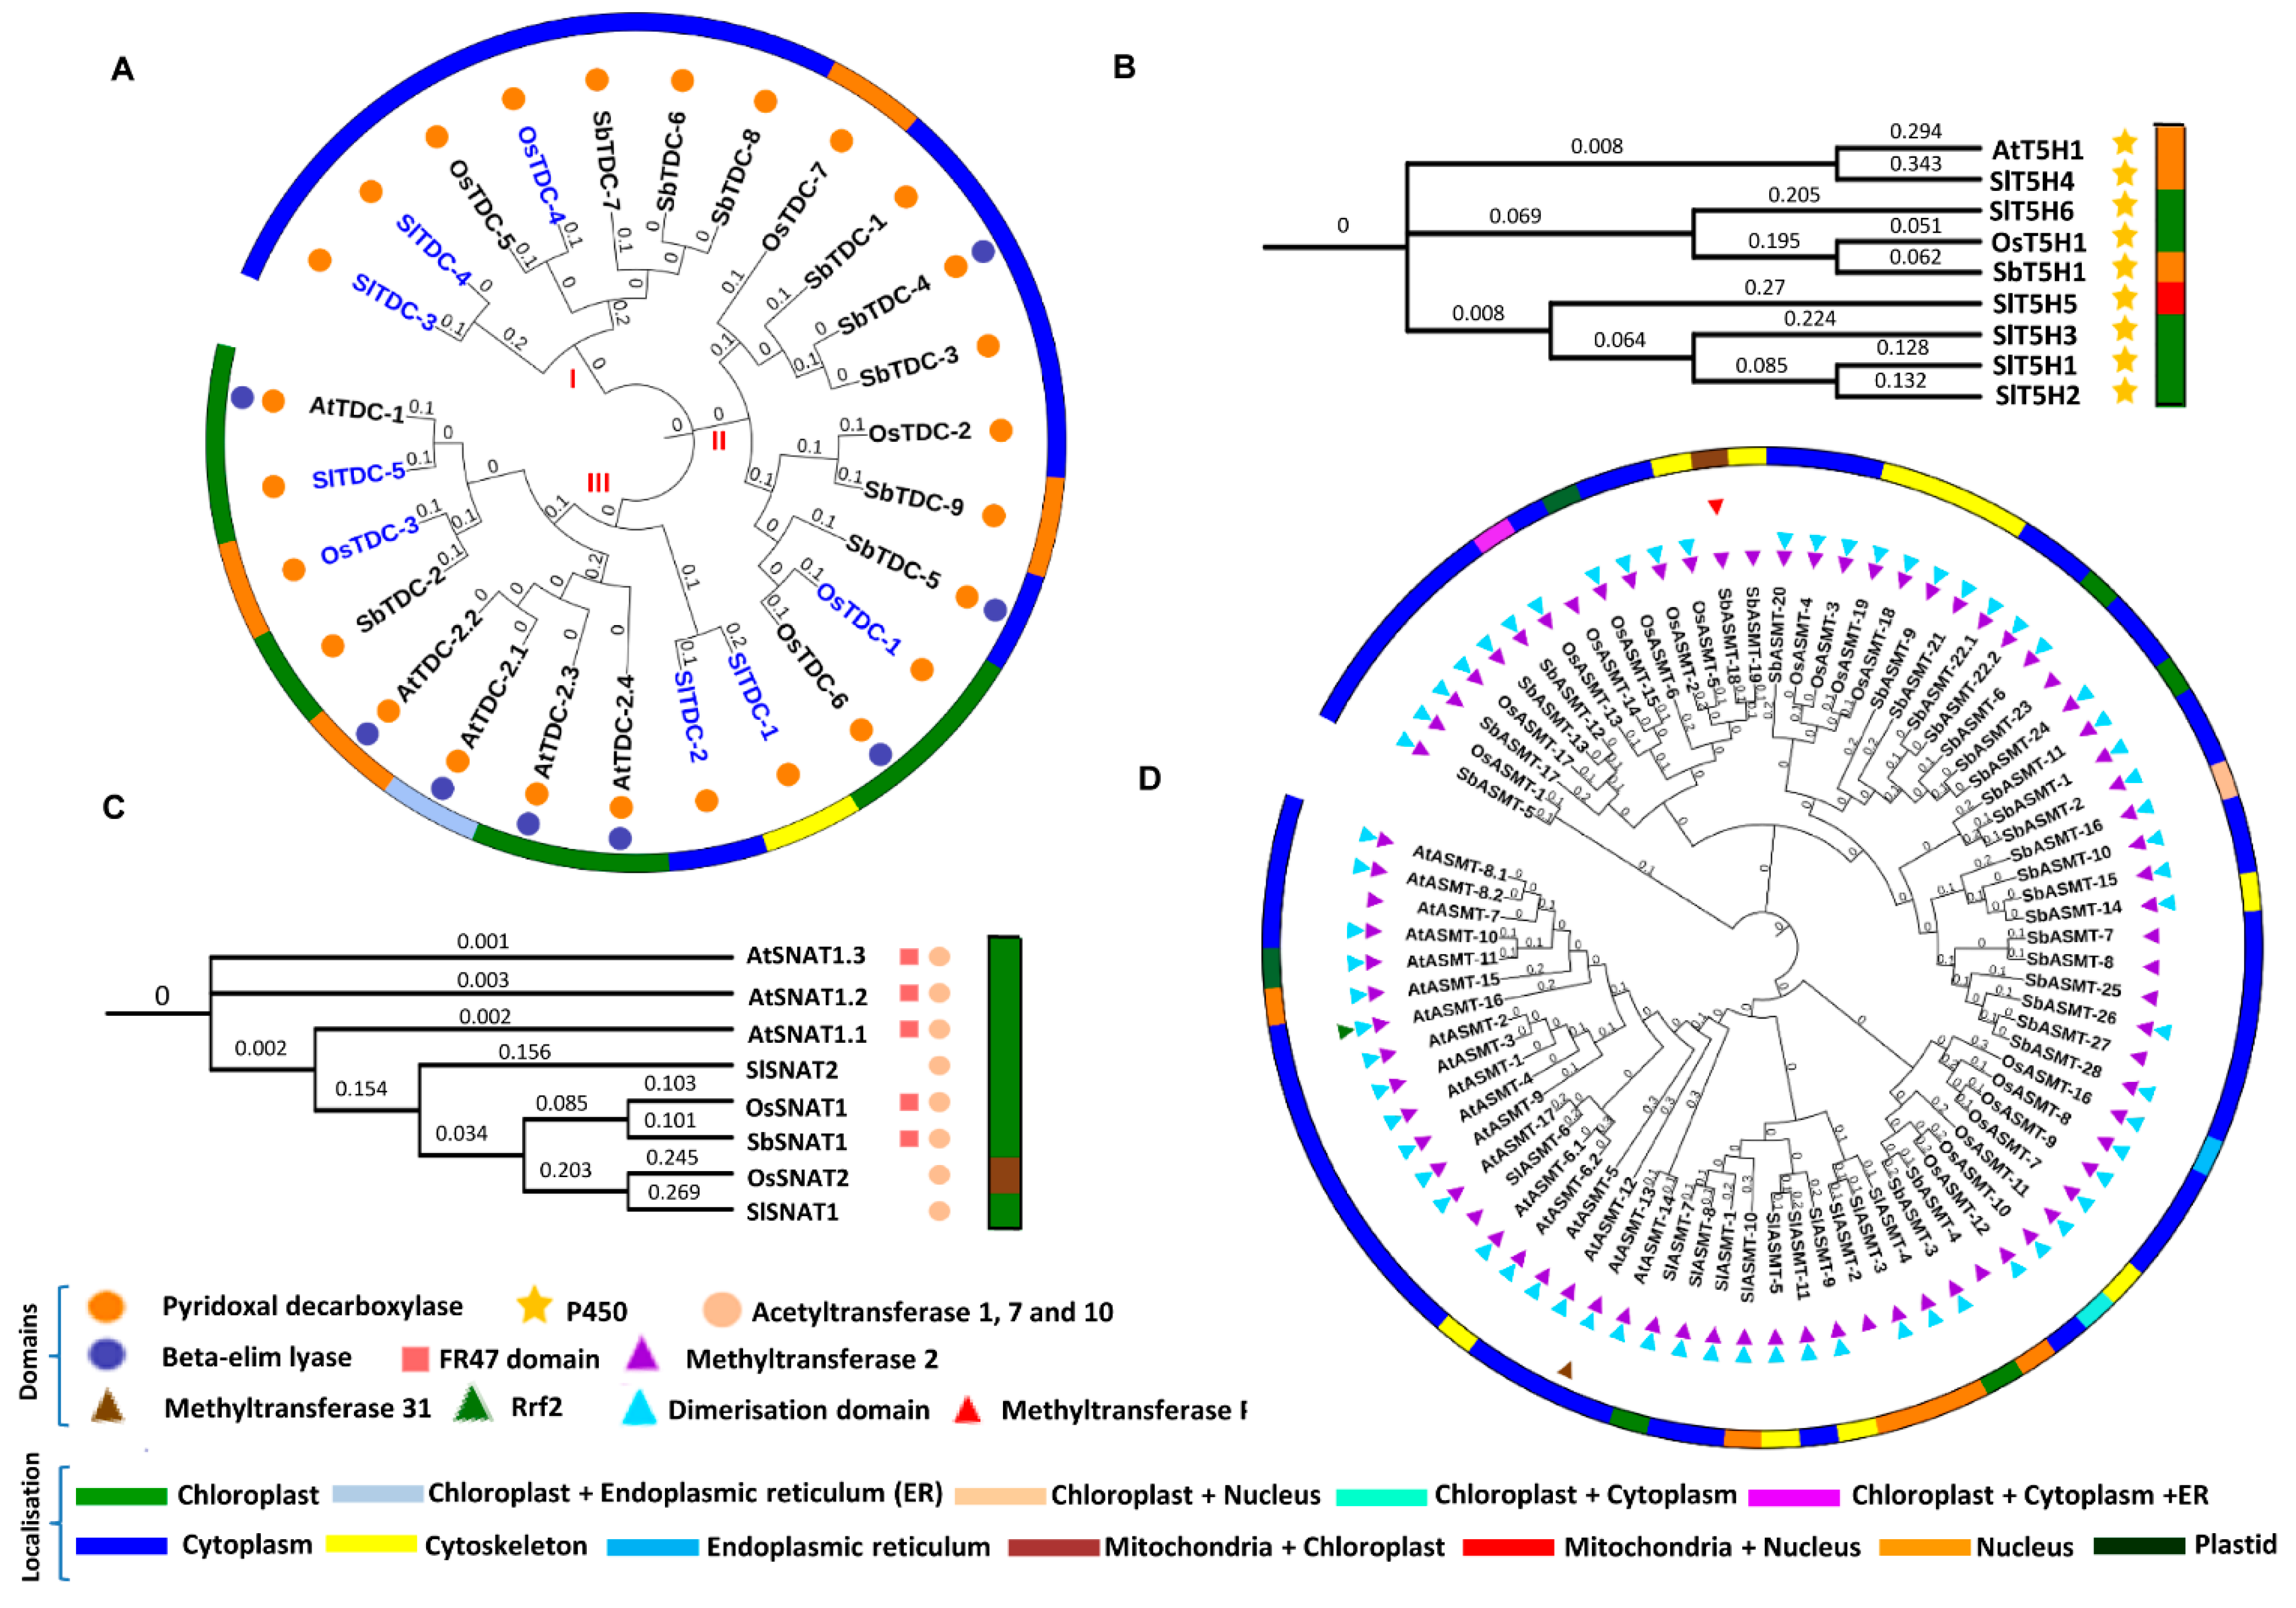
2.3. Enzymes of Ser and Mel Biosynthetic Pathway Exhibit Differential Phylogenetic Relationships with Varied Localization Patterns
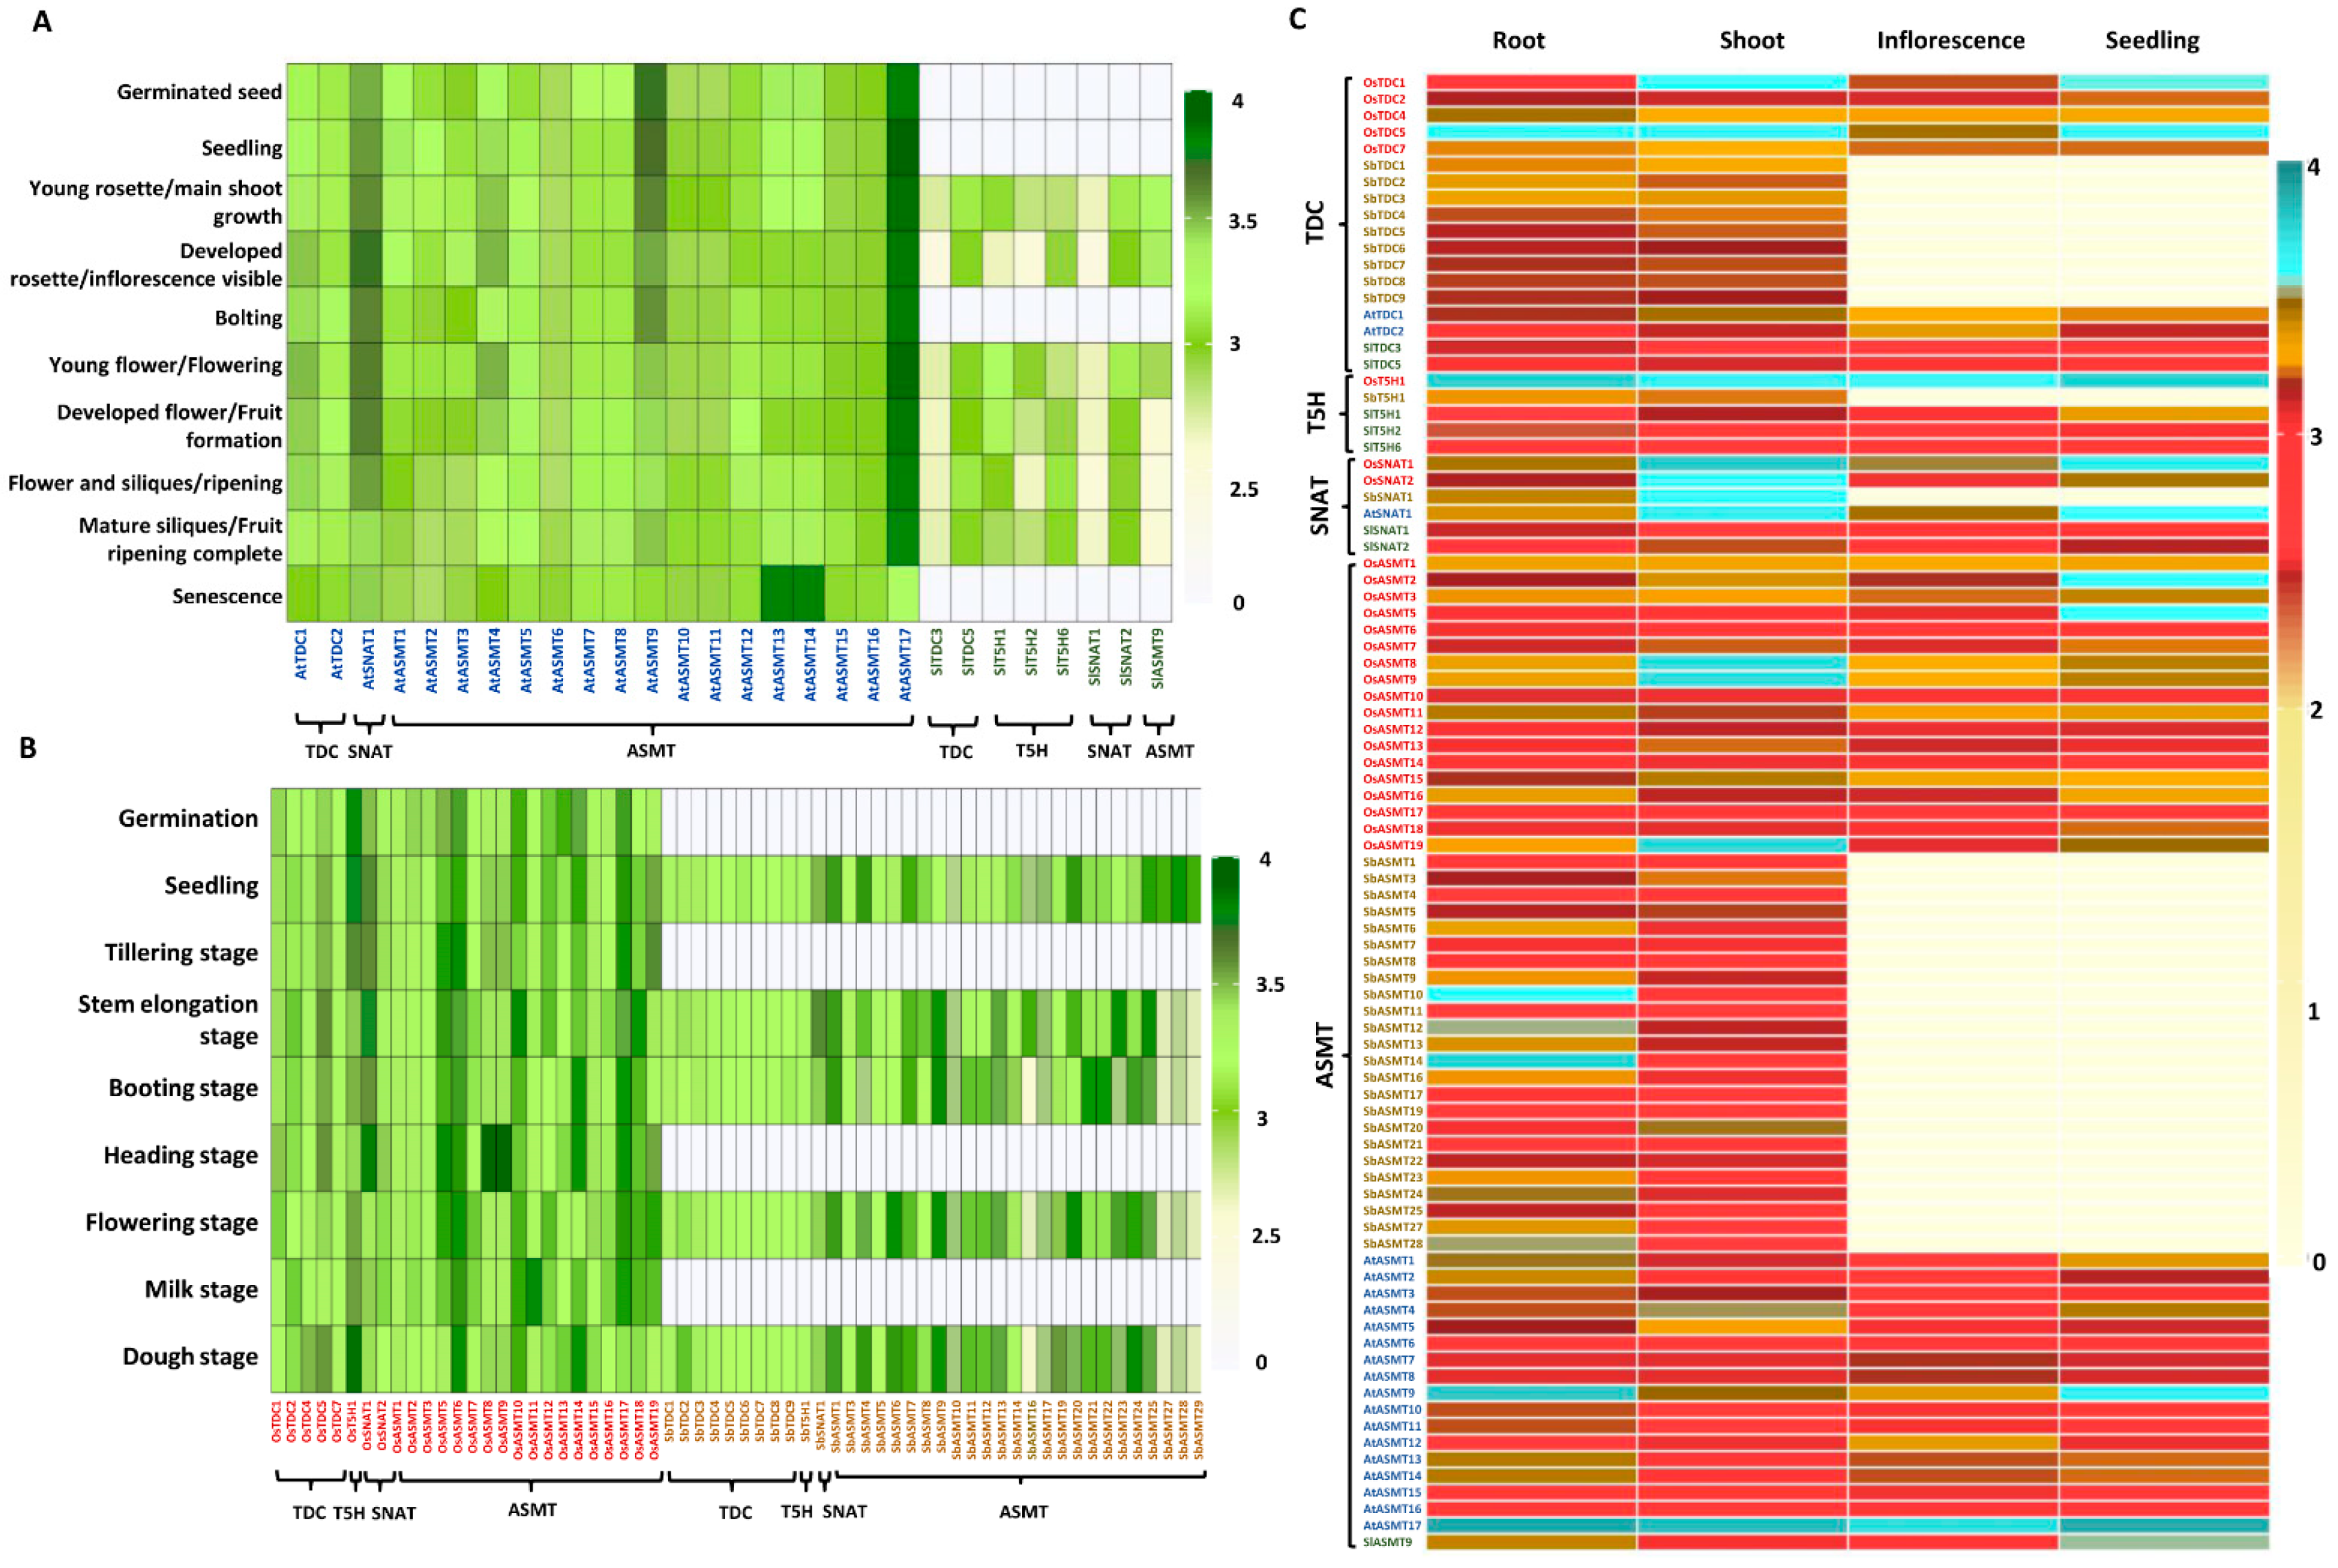
2.4. Expression of Genes Encoding Ser and Mel Biosynthetic Enzymes Is Highly Variable in Tissues during Development
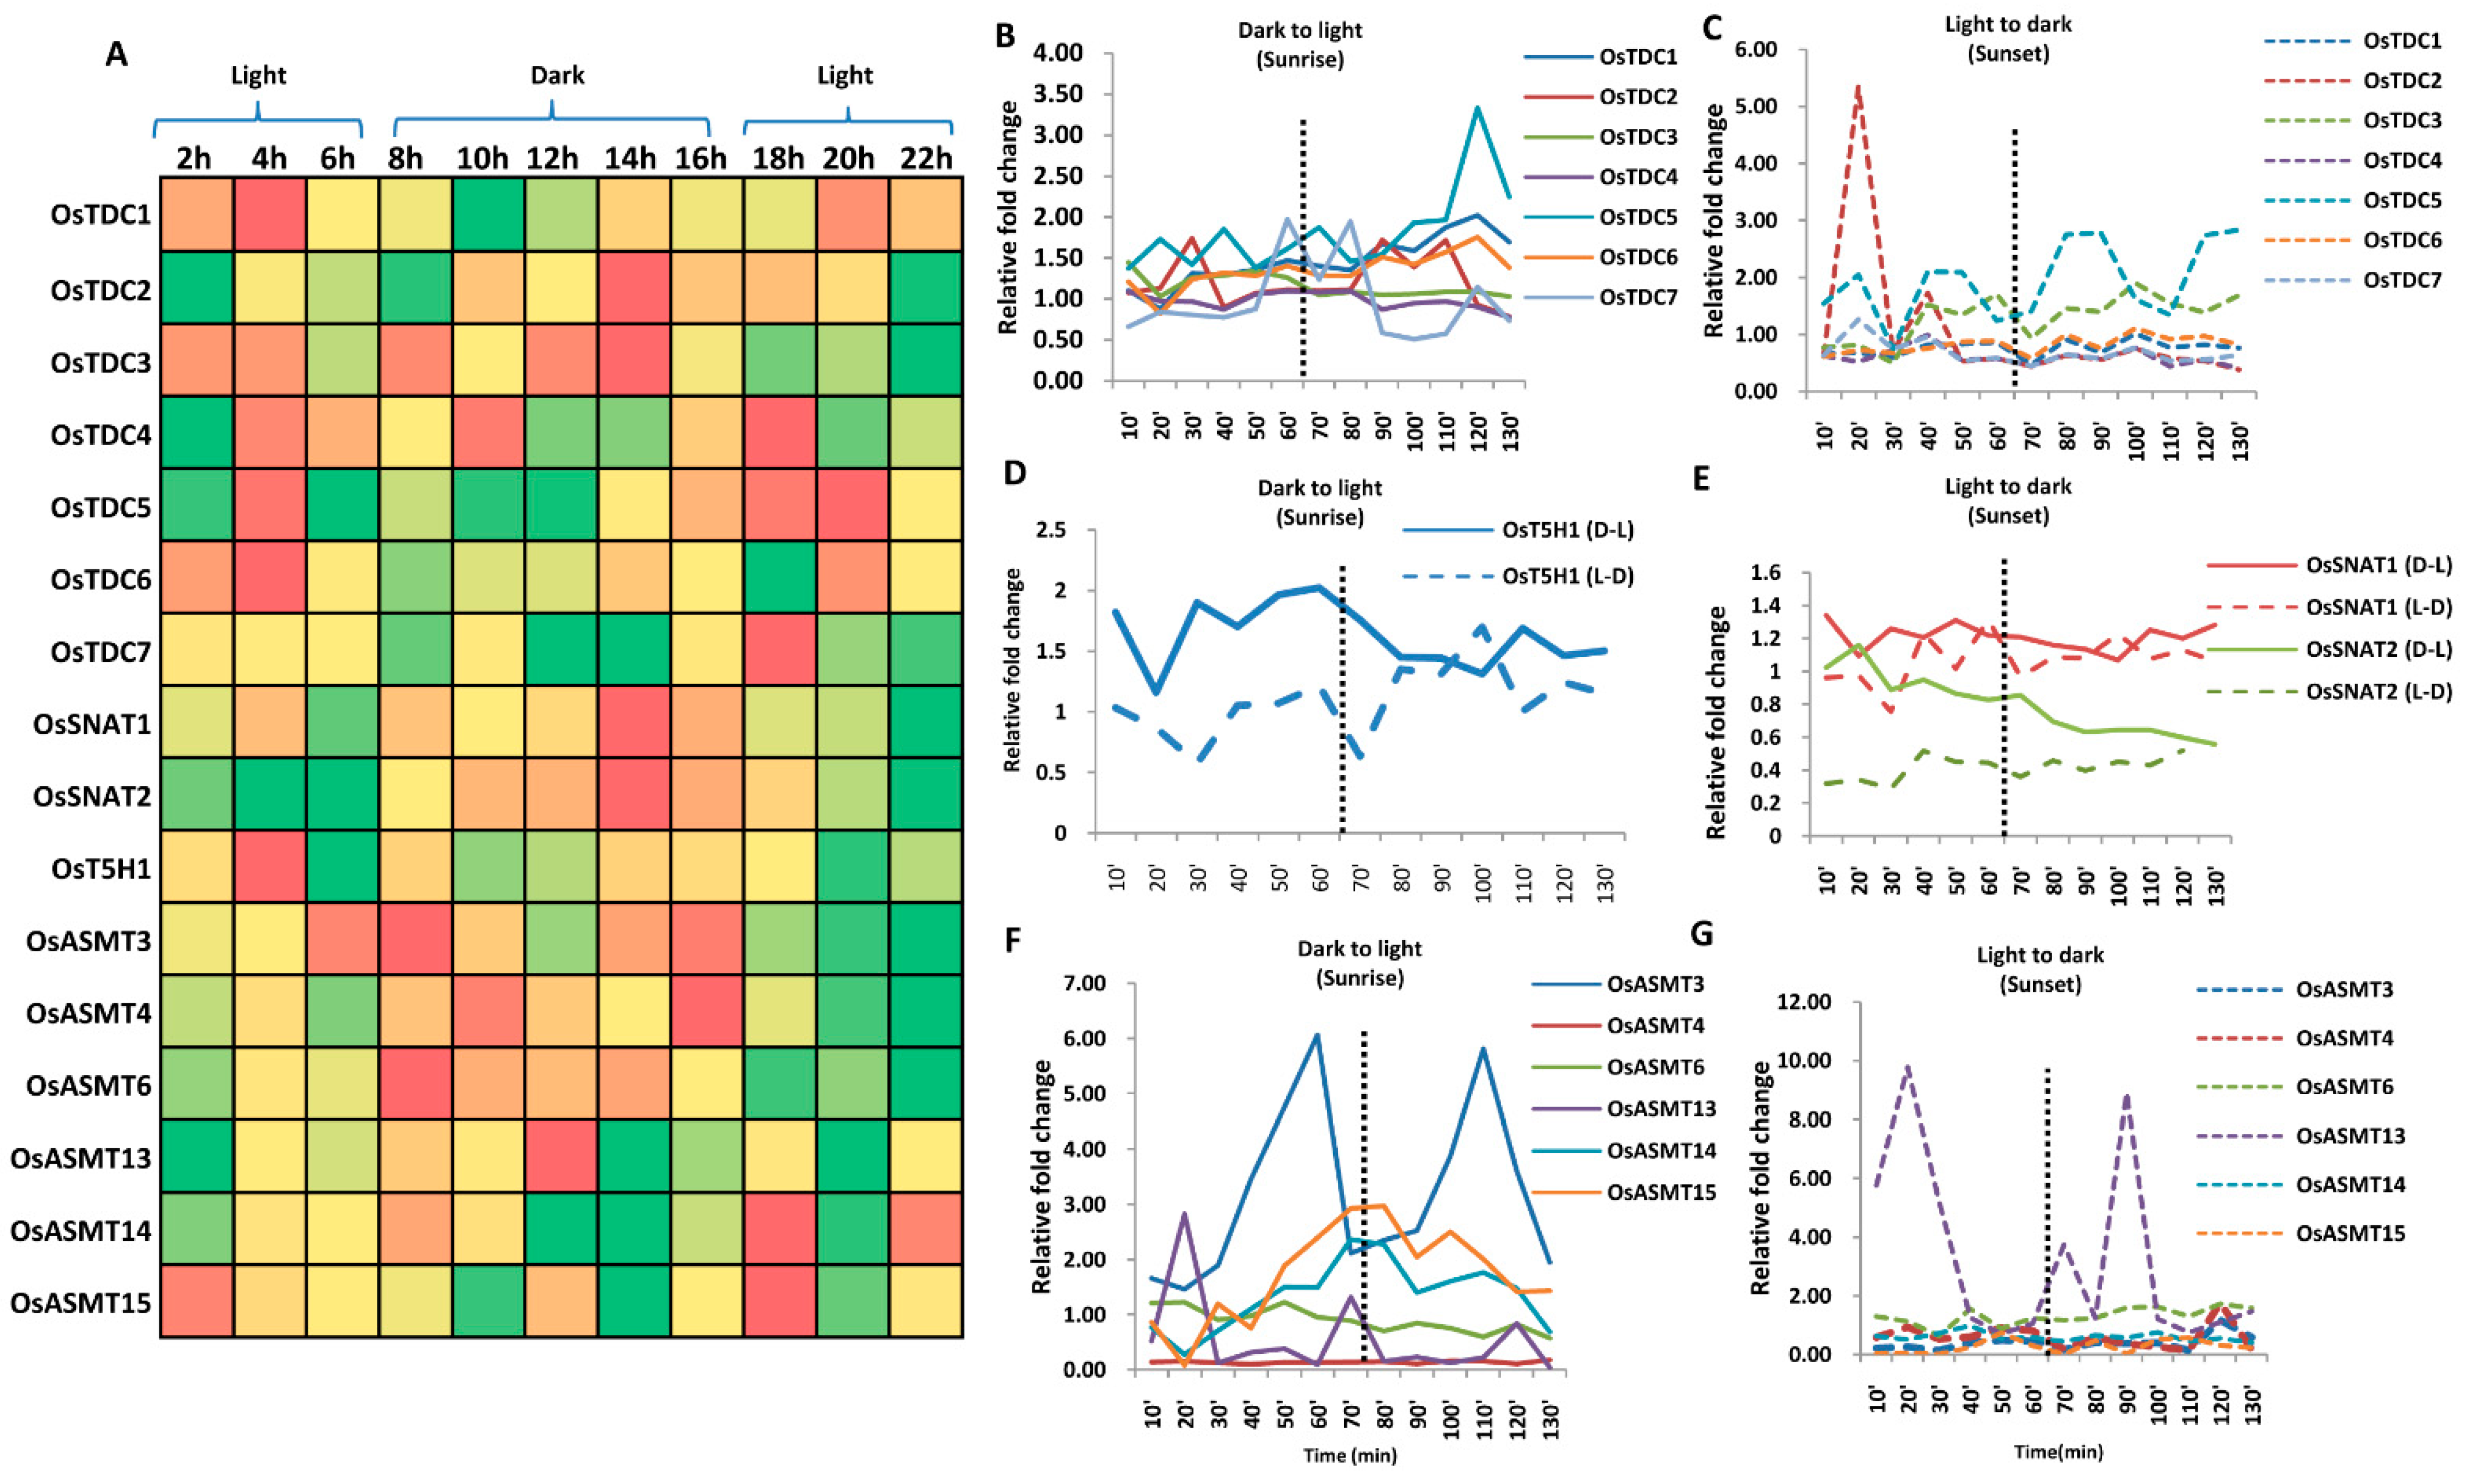
2.5. Genes Involved in Ser and Mel Biosynthesis Have Rhythmic Expression in Response to Light/Dark Conditions
2.6. Genes Encoding Enzymes for Ser and Mel Biosynthesis in Plants Are Highly Stress-Responsive
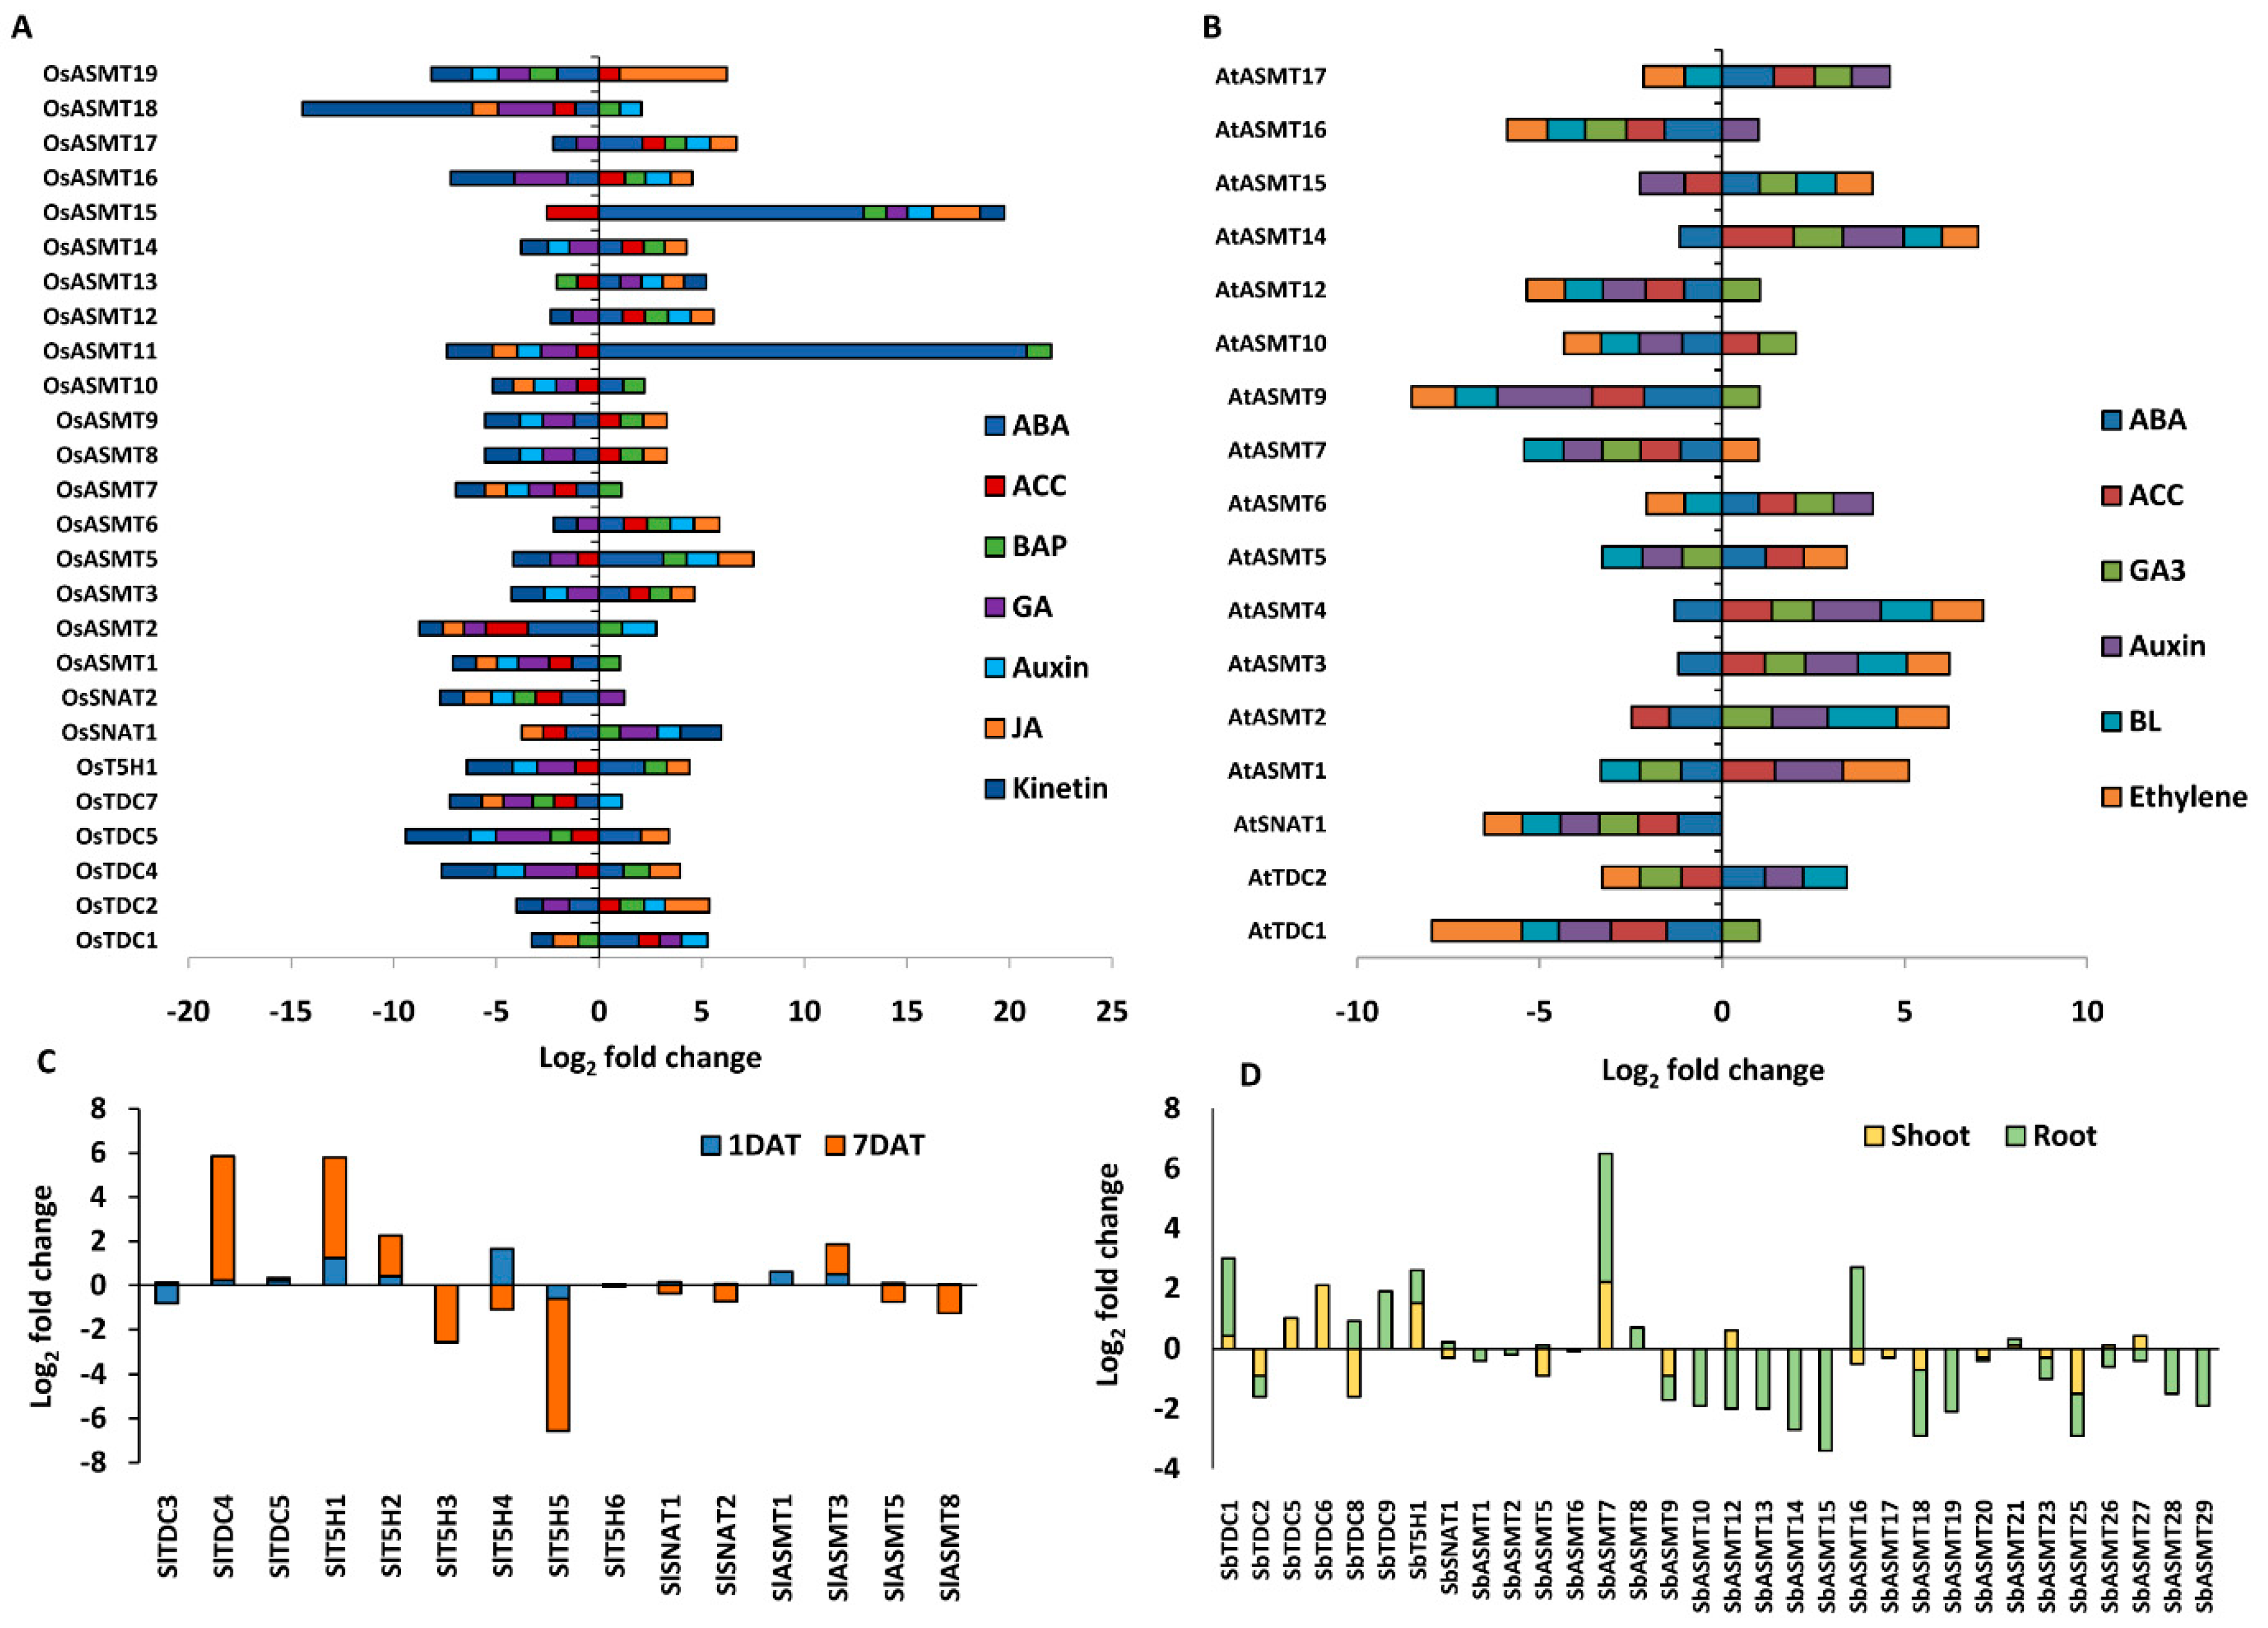
2.7. Phytohormones Regulate the Expression of Genes Encoding Ser and Mel Biosynthetic Enzymes in Plants
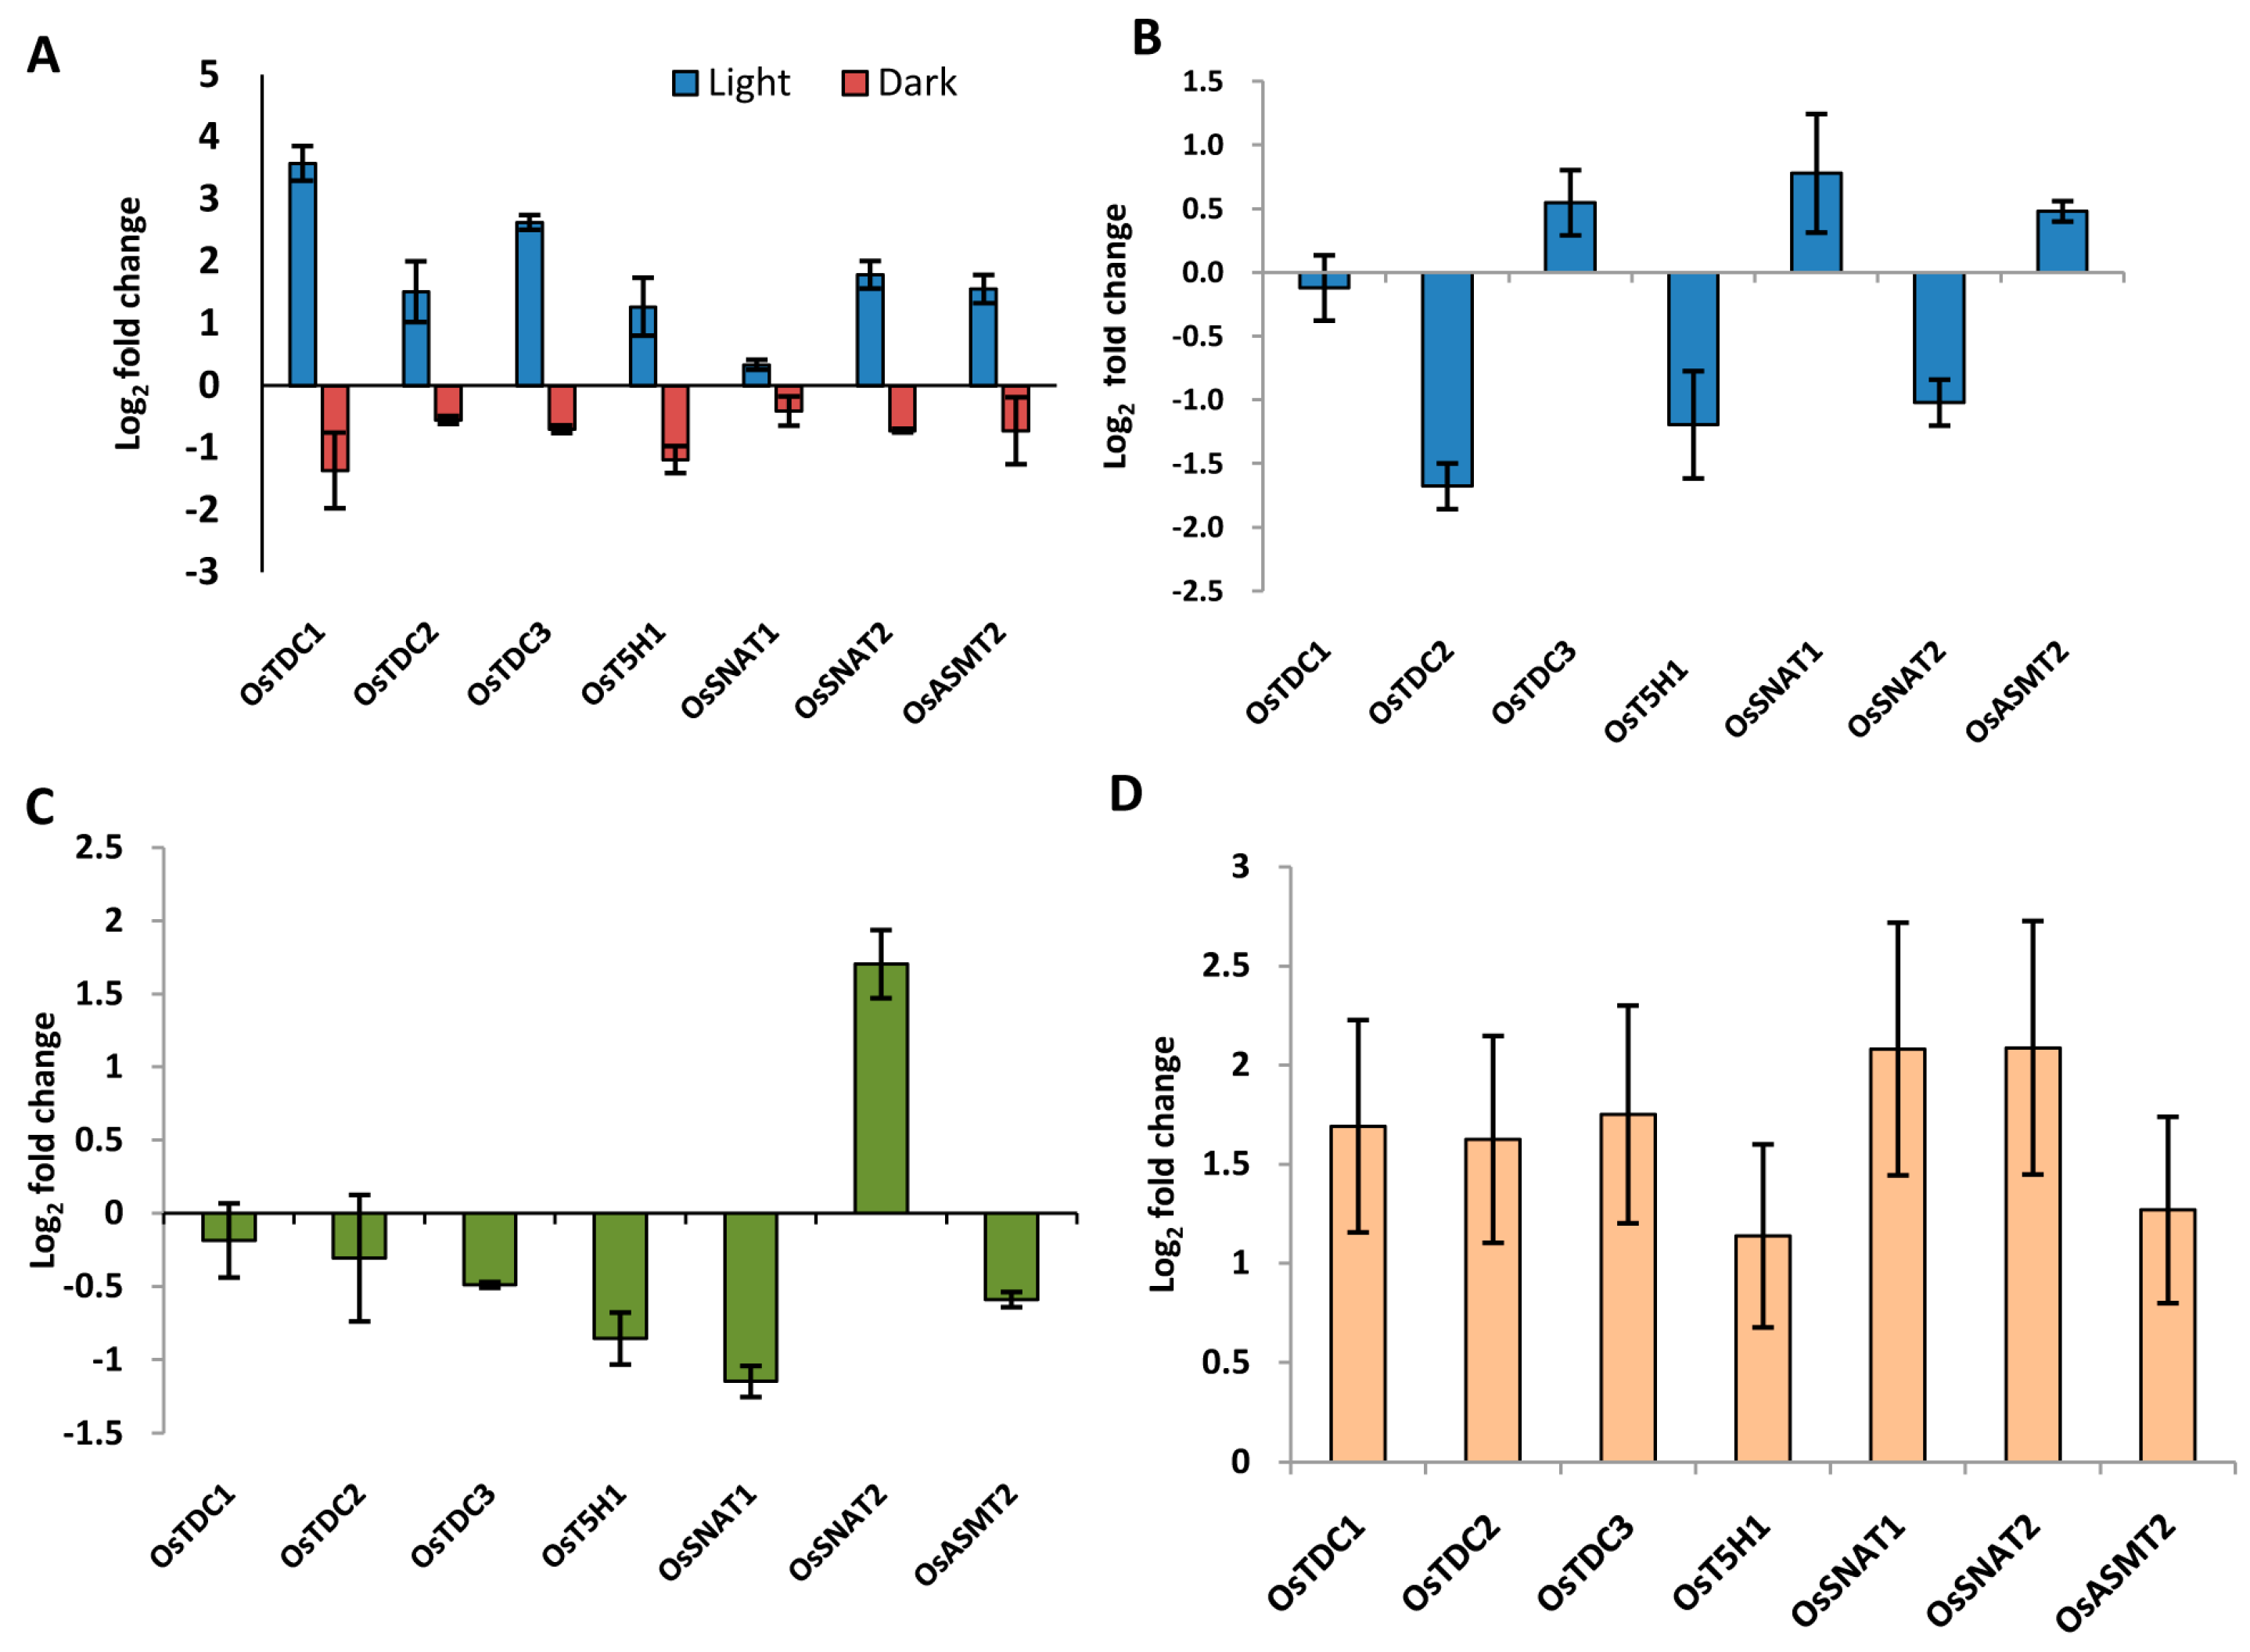
2.8. Genes Involved in Ser and Mel Biosynthesis in Rice Are Affected by Light Availability and Stress as Determined by qRT-PCR
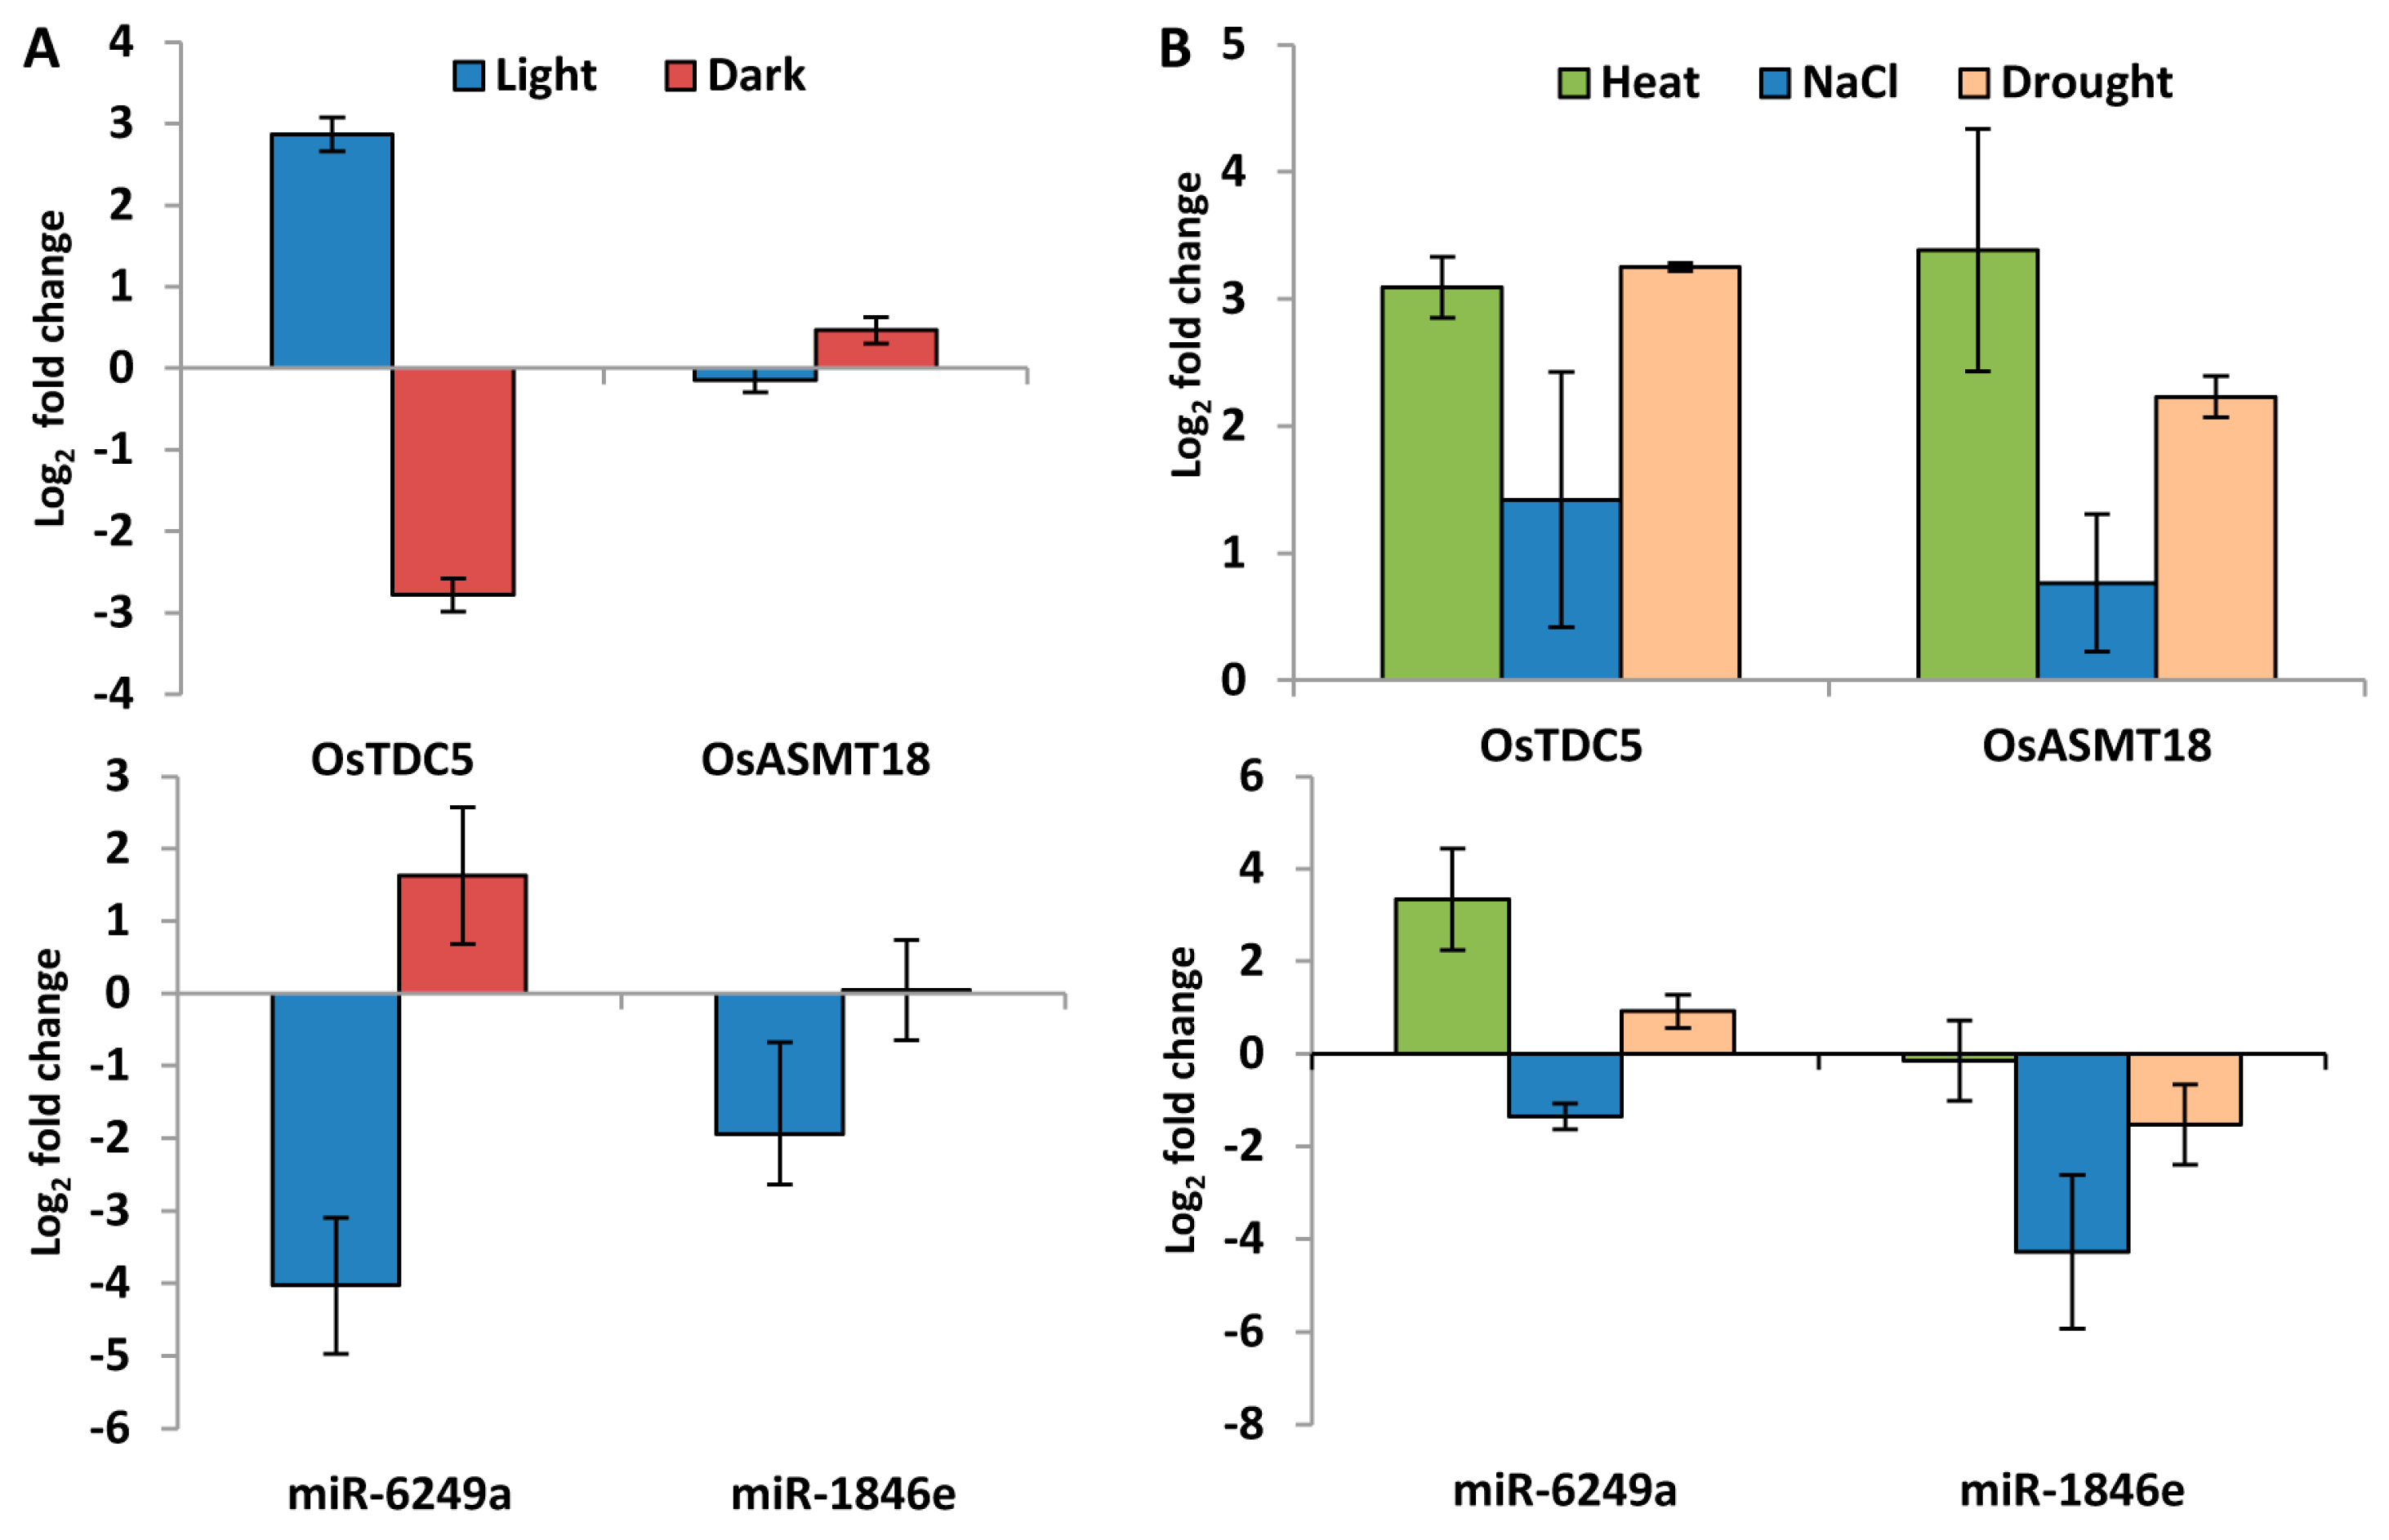
2.9. miRNAs Regulate Expression of Genes Involved in Ser and Mel Biosynthesis
3. Discussion
4. Materials and Methods
4.1. Identification of Ser and Mel Biosynthetic Pathway Genes and Proteins in Selected Model Plants
4.2. Analysis of Protein Sequences, Localization and Phylogenetic Tree Construction
4.3. Expression Profiling of Genes Encoding Ser and Mel Biosynthetic Enzymes Using Publicly Available Transcript Data
4.4. Computational Prediction of miRNAs Targeting Ser and Mel Genes in Plants
4.5. Plant Materials and Growth Conditions
4.6. RNA Isolation and Quantitative Real-Time PCR (qRT-PCR) Analysis
5. Conclusions
Supplementary Materials
Author Contributions
Funding
Data Availability Statement
Acknowledgments
Conflicts of Interest
References
- Tan, D.X.; Hardeland, R.; Back, K.; Manchester, L.C.; Alatorre-Jimenez, M.A.; Reiter, R.J. On the significance of an alternate pathway of melatonin synthesis via 5-methoxytryptomine: Comparisons across species. J. Pineal Res. 2016, 61, 27–40. [Google Scholar] [CrossRef] [Green Version]
- Lv, J.; Liu, F. The role of serotonin beyond the central nervous system during embryogenesis. Front. Cell. Neurosci. 2017, 11, 74. [Google Scholar] [CrossRef]
- Zhao, D.; Yu, Y.; Shen, Y.; Liu, Q.; Zhao, Z.; Sharma, R.; Reiter, R.J. Melatonin Synthesis and Function: Evolutionary History in Animals and Plants. Front. Endocrinol. 2019, 10, 249. [Google Scholar] [CrossRef]
- Iriti, M. Plant Neurobiology, a fascinating perspective in the field of research on plant secondary metabolites. Int. J. Mol. Sci. 2013, 14, 10819–10821. [Google Scholar] [CrossRef]
- Pelagio-Flores, R.; Lopez-Bucio, J. Serotonin and melatonin in plant growth and development. In Serotonin and Melatonin: Their Functional Role in Plants, Food, Phytomedicine, and Human Health; Ravishankar, G.A., Ramakrishna, A., Eds.; CRC Press: Boca Raton, FL, USA, 2016; pp. 97–110. [Google Scholar]
- Erland, L.A.E.; Saxena, P.K. Mammalian neurotransmitters are important signals mediating plant morphogenesis. In Sensory Biology of Plants; Sopory, S., Ed.; Springer Nature: Singapore, 2019; pp. 411–449. [Google Scholar]
- Erland, L.A.E.; Turi, C.E.; Saxena, P.K. Serotonin in Plants: Origin, Functions and Implications. In Serotonin; Pilowsky, P.M., Ed.; Elsevier Inc.: Amsterdam, The Netherlands, 2019; pp. 23–46. [Google Scholar]
- Kang, K.; Kang, S.; Lee, K.; Park, M.; Back, K. Enzymatic features of serotonin biosynthetic enzymes and serotonin biosynthesis in plants. Plant Signal. Behav. 2008, 3, 389–390. [Google Scholar] [CrossRef] [PubMed] [Green Version]
- Back, K.; Tan, D.X.; Reiter, R.J. Melatonin biosynthesis in plants: Multiple pathways catalyze tryptophan to melatonin in the cytoplasm or chloroplasts. J. Pineal Res. 2016, 61, 426–437. [Google Scholar] [CrossRef]
- Liu, W.; Zhao, D.; Zheng, C.; Chen, C.; Peng, X.; Cheng, Y.; Wan, H. Genomic analysis of the ASMT gene family in Solanumlycopersicum. Molecules 2017, 22, 1984. [Google Scholar] [CrossRef] [PubMed] [Green Version]
- Pang, X.; Wei, Y.; Cheng, Y.; Pan, L.; Ye, Q.; Wang, R.; Ruan, M.; Zhou, G.; Yao, Z.; Li, Z.; et al. The tryptophan decarboxylase in Solanumlycopersicum. Molecules 2018, 23, 998. [Google Scholar] [CrossRef] [PubMed] [Green Version]
- De Masi, L.; Castaldo, D.; Pignone, D.; Servillo, L.; Facchiano, A. Experimental evidence and in silico identification of tryptophan decarboxylase in citrus genus. Molecules 2017, 22, 272. [Google Scholar] [CrossRef] [Green Version]
- Zhao, D.; Wang, R.; Liu, D.; Wu, Y.; Sun, J.; Tao, J. Melatonin and expression of tryptophan decarboxylase gene (TDC) in Herbaceous Peony (Paeonialactiflora Pall.) flowers. Molecules 2018, 23, 1164. [Google Scholar] [CrossRef] [PubMed] [Green Version]
- Byeon, Y.; Park, S.; Kim, Y.-S.; Park, D.-H.; Lee, S.; Back, K. Light-regulated melatonin biosynthesis in rice during the senescence process in detached leaves. J. Pineal Res. 2012, 53, 107–111. [Google Scholar] [CrossRef]
- Wei, Y.; Zeng, H.; Hu, W.; Chen, L.; He, C.; Shi, H. Comparative transcriptional profiling of melatonin synthesis and catabolic genes indicates the possible role of melatonin in developmental and stress responses in rice. Front. Plant Sci. 2016, 7, 676. [Google Scholar] [CrossRef] [PubMed] [Green Version]
- Reiter, R.J.; Tan, D.-X.; Zhou, Z.; Cruz, M.H.C.; Fuentes-Broto, L.; Galano, A. Phytomelatonin: Assisting Plants to Survive and Thrive. Molecules 2015, 20, 7396–7437. [Google Scholar] [CrossRef] [PubMed] [Green Version]
- Erland, L.A.E.; Saxena, P.K. Melatonin in plant morphogenesis. In Vitro Cell. Dev. Biol. Plant. 2017, 54, 3–24. [Google Scholar] [CrossRef]
- Arnao, M.B.; Ruiz, J.H. Melatonin and its relationship to plant hormones. Ann. Bot. 2018, 121, 195–207. [Google Scholar] [CrossRef] [Green Version]
- Mukherjee, S. Novel perspectives on the molecular crosstalk mechanisms of serotonin and melatonin in plants. Plant Physiol. Biochem. 2018, 132, 33–45. [Google Scholar] [CrossRef] [PubMed]
- Fan, J.; Xie, Y.; Zhang, Z.; Chen, L. Melatonin: A Multifunctional Factor in Plants. Int. J. Mol. Sci. 2018, 19, 1528. [Google Scholar] [CrossRef] [PubMed] [Green Version]
- Sharif, R.; Xie, C.; Zhang, H.; Arnao, M.B.; Ali, M.; Ali, Q.; Muhammad, I.; Shalmani, A.; Nawaz, M.A.; Chen, P.; et al. Melatonin and Its Effects on Plant Systems. Molecules 2018, 23, 2352. [Google Scholar] [CrossRef] [Green Version]
- Li, Z.-G.; Xu, Y.; Bai, L.-K.; Zhang, S.-Y.; Wang, Y. Melatonin enhances thermotolerance of maize seedlings (Zea mays L.) by modulating antioxidant defense, methylglyoxal detoxification, and osmoregulation systems. Protoplasma 2018, 256, 471–490. [Google Scholar] [CrossRef]
- Arnao, M.B.; Hernández-Ruiz, J. The Potential of Phytomelatonin as a Nutraceutical. Molecules 2018, 23, 238. [Google Scholar] [CrossRef] [Green Version]
- Arnao, M.B.; Ruiz, J.H. Melatonin: A New Plant Hormone and/or a Plant Master Regulator? Trends Plant Sci. 2019, 24, 38–48. [Google Scholar] [CrossRef]
- Ramakrishna, A.; Giridhar, P.; Ravishankar, G.A. Phytoserotonin. Plant Signal. Behav. 2011, 6, 800–809. [Google Scholar]
- Erland, L.A.E.; Saxena, P.K. Beyond a neurotransmitter: The role of serotonin in plants. Neurotransmitter 2017, 4, 1538. [Google Scholar] [CrossRef] [Green Version]
- Kaur, H.; Mukherjee, S.; Baluska, F.; Bhatla, S.C. Regulatory roles of serotonin and melatonin in abiotic stress tolerance in plants. Plant Signal. Behav. 2015, 10, e1049788. [Google Scholar] [CrossRef] [PubMed] [Green Version]
- Shi, H.; Wei, Y.; He, C. Melatonin-induced CBF/DREB1s are essential for diurnal change of disease resistance and CCA1 expression in Arabidopsis. Plant Physiol. Biochem. 2016, 100, 150–155. [Google Scholar] [CrossRef] [PubMed]
- Mandal, M.K.; Suren, H.; Ward, B.; Boroujerdi, A.; Kousik, C. Differential roles of melatonin in plant-host resistance and pathogen suppression in cucurbits. J. Pineal Res. 2018, 65, e12505. [Google Scholar] [CrossRef] [PubMed] [Green Version]
- Bose, S.K.; Howlader, P. Melatonin plays multifunctional role in horticultural crops against environmental stresses: A review. Environ. Exp. Bot. 2020, 176, 104063. [Google Scholar] [CrossRef]
- Mukherjee, S.; David, A.; Yadav, S.; Baluška, F.; Bhatla, S.C. Salt stress-induced seedling growth inhibition coincides with differential distribution of serotonin and melatonin in sunflower seedling roots and cotyledons. Physiol. Plant. 2014, 152, 714–728. [Google Scholar] [CrossRef]
- Kaur, H.; Bhatla, S.C. Melatonin and nitric oxide modulate glutathione content and glutathione reductase activity in sunflower seedling cotyledons accompanying salt stress. Nitric Oxide 2016, 59, 42–53. [Google Scholar] [CrossRef]
- Arora, D.; Bhatla, S.C. Melatonin and nitric oxide regulate sunflower seedling growth under salt stress accompanying differential expression of Cu/Zn SOD and Mn SOD. Free. Radic. Biol. Med. 2017, 106, 315–328. [Google Scholar] [CrossRef]
- Tripathi, A.; Goswami, K.; Sanan-Mishra, N. Role of bioinformatics in establishing microRNAs as modulators of abiotic stress responses: The new revolution. Front. Physiol. 2015, 6, 286. [Google Scholar] [CrossRef] [PubMed] [Green Version]
- Gu, Q.; Chen, Z.; Yu, X.; Cui, W.; Pan, J.; Zhao, G.; Xu, S.; Wang, R.; Shen, W. Melatonin confers plant tolerance against cadmium stress via the decrease of cadmium accumulation and reestablishment of microRNA-mediated redox homeostasis. Plant Sci. 2017, 261, 28–37. [Google Scholar] [CrossRef]
- Salah Ud-Din, A.I.; Tikhomirova, A.; Roujeinikova, A. Structure and functional diversity of GCN5-Related N-Acetyltransferases (GNAT). Int. J. Mol. Sci. 2016, 17, 1018. [Google Scholar] [CrossRef] [PubMed] [Green Version]
- Keon, R.G.; Fu, R.; Voordouw, G. Deletion of two downstream genes alters expression of the hmc operon of Desulfovibrio vulgaris subsp. vulgaris Hildenborough. Arch. Microbiol. 1997, 167, 376–383. [Google Scholar] [CrossRef] [PubMed]
- Arnao, M.B.; Hernández-Ruiz, J. The physiological function of melatonin in Plants. Plant Signal. 2006, 3, 89–95. [Google Scholar] [CrossRef] [Green Version]
- Arnao, M.B.; Hernández-Ruiz, J. Is phytomelatonin a new plant Hormone? Agronomy 2020, 10, 95. [Google Scholar] [CrossRef] [Green Version]
- Erland, L.; Murch, S.J.; Reiter, R.J.; Saxena, P.K. A new balancing act: The many roles of melatonin and serotonin in plant growth and development. Plant Signal. Behav. 2015, 10, e1096469. [Google Scholar] [CrossRef] [PubMed] [Green Version]
- Pan, L.; Zheng, J.; Liu, J.; Guo, J.; Liu, F.; Liu, L.H. Analysis of the ASMT gene family in pepper (Capsicum annuum L.): Identification, phylogeny, and expression profiles. Int. J. Genom. 2019, 2019, 7241096. [Google Scholar] [CrossRef] [PubMed] [Green Version]
- Tan, D.-X.; Hardeland, R.; Manchester, L.C.; Korkmaz, A.; Ma, S.; Rosales-Corral, S.; Reiter, R.J. Functional roles of melatonin in plants, and perspectives in nutritional and agricultural science. J. Exp. Bot. 2012, 63, 577–597. [Google Scholar] [CrossRef]
- Tan, D.-X.; Reiter, R.J. An evolutionary view of melatonin synthesis and metabolism related to its biological functions in plants. J. Exp. Bot. 2020, 71, 4677–4689. [Google Scholar] [CrossRef]
- Byeon, Y.; Lee, K.; Park, Y.I.; Park, S.; Back, K. Molecular cloning and functional analysis of serotonin N-acetyltransferase from the cyanobacterium Synechocystis sp. PCC 6803. J. Pineal Res. 2013, 55, 371–376. [Google Scholar] [CrossRef]
- Byeon, Y.; Lee, H.Y.; Lee, K.; Park, S.; Back, K. Cellular localization and kinetics of the rice melatonin biosynthetic enzymes SNAT and ASMT. J. Pineal Res. 2014, 56, 107–114. [Google Scholar] [CrossRef] [PubMed]
- Engström, K.; Lundgren, L.; Samuelsson, G. Bioassay-guided isolation of serotonin from fruits of Solanum tuberosum L. Acta Pharm. Nord. 1992, 4, 91–92. [Google Scholar]
- Turi, C.E.; Murch, S.J. Targeted and Untargeted Phytochemistry of Ligusticum canbyi: Indoleamines, Phthalides, Antioxidant Potential, and Use of Metabolomics as a Hypothesis-Generating Technique for Compound Discovery. Planta Med. 2013, 79, 1370–1379. [Google Scholar] [CrossRef] [PubMed]
- Ramakrishna, A.; Giridhar, P.; Jobin, M.; Paulose, C.S.; Ravishankar, G.A. Indoleamines and calcium enhance somatic embryogenesis in Coffeacanephora P ex Fr. Plant Cell Tissue Organ Cult. 2012, 108, 267–278. [Google Scholar] [CrossRef]
- Erland, L.A.E.; Yasunaga, A.; Li, I.T.S.; Murch, S.J.; Saxena, P.K. Direct visualization of location and uptake of applied melatonin and serotonin in living tissues and their redistribution in plants in response to thermal stress. J. Pineal Res. 2018, 66, e12527. [Google Scholar] [CrossRef] [PubMed] [Green Version]
- Dubbels, R.; Reiter, R.J.; Klenke, E.; Goebel, A.; Schnakenberg, E.; Ehlers, C.; Schiwara, H.W.; Schloot, W. Melatonin in edible plants identified by radioimmunoassay and by high performance liquid chromatography-mass spectrometry. J. Pineal Res. 1995, 18, 28–31. [Google Scholar] [CrossRef] [PubMed]
- Badria, F.A. Melatonin, Serotonin, and Tryptamine in Some Egyptian Food and Medicinal Plants. J. Med. Food 2002, 5, 153–157. [Google Scholar] [CrossRef]
- Hernández-Ruiz, J.; Cano, A.; Arnao, M.B. Melatonin: A growth-stimulating compound present in lupin tissues. Planta 2004, 220, 140–144. [Google Scholar] [CrossRef]
- Lee, K.; Back, K. Overexpression of rice serotonin N -acetyltransferase1 in transgenic rice plants confers resistance to cadmium and senescence and increases grain yield. J. Pineal Res. 2017, 62, e12392. [Google Scholar] [CrossRef]
- Kang, K.; Kim, Y.-S.; Park, S.; Back, K. Senescence-Induced Serotonin Biosynthesis and Its Role in Delaying Senescence in Rice Leaves. Plant Physiol. 2009, 150, 1380–1393. [Google Scholar] [CrossRef] [PubMed] [Green Version]
- Park, S.; Lee, K.; Kim, Y.-S.; Back, K. Tryptamine 5-hydroxylase-deficient Sekiguchi rice induces synthesis of 5-hydroxytryptophan and N-acetyltryptamine but decreases melatonin biosynthesis during senescence process of detached leaves. J. Pineal Res. 2011, 52, 211–216. [Google Scholar] [CrossRef] [PubMed]
- Wang, P.; Sun, X.; Chang, C.; Feng, F.; Liang, D.; Cheng, L.; Ma, F. Delay in leaf senescence of Malushupehensis by long-term melatonin application is associated with its regulation of metabolic status and protein degradation. J. Pineal Res. 2013, 55, 424–434. [Google Scholar] [CrossRef] [PubMed]
- Liang, C.; Zheng, G.; Li, W.; Wang, Y.; Hu, B.; Wang, H.; Wu, H.; Qian, Y.; Zhu, X.-G.; Tan, D.-X.; et al. Melatonin delays leaf senescence and enhances salt stress tolerance in rice. J. Pineal Res. 2015, 59, 91–101. [Google Scholar] [CrossRef] [PubMed]
- Liang, D.; Shen, Y.; Ni, Z.; Wang, Q.; Lei, Z.; Xu, N.; Deng, Q.; Lin, L.; Wang, J.; Lv, X.; et al. Exogenous melatonin application delays senescence of kiwifruit leaves by regulating the antioxidant capacity and biosynthesis of flavonoids. Front. Plant Sci. 2018, 9, 426. [Google Scholar] [CrossRef]
- Reynolds, J.D.; Kimbrough, T.D.; Weekley, L.B. The effect of light quality on 5-hydroxyindole metabolism in leaves of Sedum morganianum (Crassulaceae). Biochem. Physiol. Pflanz. 1985, 180, 345–351. [Google Scholar] [CrossRef]
- Forsyth, J.; Erland, L.; Shipley, P.; Murch, S. Plant perception of light: The role of indoleamines in Scutellaria species. Melatonin Res. 2020, 3, 161–176. [Google Scholar] [CrossRef]
- Kolář, J.; Macháčková, I.; Eder, J.; Prinsen, E.; van Dongen, W.; van Onckelen, H.; Illnerová, H. Melatonin: Occurrence and daily rhythm in Chenopodium rubrum. Phytochemistry 1997, 44, 1407–1413. [Google Scholar] [CrossRef]
- Murch, S.; Krishnaraj, S.; Saxena, P. Tryptophan is a precursor for melatonin and serotonin biosynthesis in in-vitro regenerated St. John’s wort (Hypericumperofatum L. cv. Anthos) plants. Plant Cell Rep. 2000, 19, 698–704. [Google Scholar] [CrossRef]
- Hardeland, R. Antioxidative Protection by Melatonin: Multiplicity of Mechanisms from Radical Detoxification to Radical Avoidance. Endocrine 2005, 27, 119–130. [Google Scholar] [CrossRef]
- Yu, Y.; Lv, Y.; Shi, Y.; Li, T.; Chen, Y.; Zhao, D.; Zhao, Z. The role of phyto-melatonin and related metabolites in response to stress. Molecules 2018, 23, 1887. [Google Scholar] [CrossRef] [Green Version]
- Pardo-Hernández, M.; López-Delacalle, M.; Rivero, R. ROS and NO Regulation by Melatonin Under Abiotic Stress in Plants. Antioxidants 2020, 9, 1078. [Google Scholar] [CrossRef]
- Zhang, N.; Sun, Q.; Zhang, H.; Cao, Y.; Weeda, S.; Ren, S.; Guo, Y.-D. Roles of melatonin in abiotic stress resistance in plants. J. Exp. Bot. 2015, 66, 647–656. [Google Scholar] [CrossRef] [Green Version]
- Wang, Y.; Reiter, R.J.; Chan, Z. Phytomelatonin: A universal abiotic stress regulator. J. Exp. Bot. 2017, 69, 963–974. [Google Scholar] [CrossRef]
- Ke, Q.; Ye, J.; Wang, B.; Ren, J.; Yin, L.; Deng, X.; Wang, S. Melatonin Mitigates Salt Stress in Wheat Seedlings by Modulating Polyamine Metabolism. Front. Plant Sci. 2018, 9, 914. [Google Scholar] [CrossRef] [PubMed] [Green Version]
- Debnath, B.; Islam, W.; Li, M.; Sun, Y.; Lu, X.; Mitra, S.; Hussain, M.; Liu, S.; Qiu, D. Melatonin Mediates Enhancement of Stress Tolerance in Plants. Int. J. Mol. Sci. 2019, 20, 1040. [Google Scholar] [CrossRef] [Green Version]
- Fujiwara, T.; Maisonneuve, S.; Isshiki, M.; Mizutani, M.; Chen, L.; Wong, H.L.; Kawasaki, T.; Shimamoto, K. Sekiguchi Lesion Gene Encodes a Cytochrome P450 Monooxygenase That Catalyzes Conversion of Tryptamine to Serotonin in Rice. J. Biol. Chem. 2010, 285, 11308–11313. [Google Scholar] [CrossRef] [PubMed] [Green Version]
- Hayashi, K.; Fujita, Y.; Ashizawa, T.; Suzuki, F.; Nagamura, Y.; Hayano-Saito, Y. Serotonin attenuates biotic stress and leads to lesion browning caused by a hypersensitive response to Magnaporthe oryzae penetration in rice. Plant J. 2016, 85, 46–56. [Google Scholar] [CrossRef] [PubMed] [Green Version]
- Moustafa-Farag, M.; Almoneafy, A.; Mahmoud, A.; Elkelish, A.; Arnao, M.B.; Li, L.; Ai, S. Melatonin and Its Protective Role against Biotic Stress Impacts on Plants. Biomolecules 2019, 10, 54. [Google Scholar] [CrossRef] [Green Version]
- Shi, H.; Chen, Y.; Tan, D.-X.; Reiter, R.J.; Chan, Z.; He, C. Melatonin induces nitric oxide and the potential mechanisms relate to innate immunity against bacterial pathogen infection in Arabidopsis. J. Pineal Res. 2015, 59, 102–108. [Google Scholar] [CrossRef] [PubMed]
- Zhang, N.; Zhao, B.; Zhang, H.-J.; Weeda, S.; Yang, C.; Yang, Z.-C.; Ren, S.; Guo, Y.-D. Melatonin promotes water-stress tolerance, lateral root formation, and seed germination in cucumber (Cucumis sativus L.). J. Pineal Res. 2012, 54, 15–23. [Google Scholar] [CrossRef] [PubMed]
- Zhang, N.; Zhang, H.-J.; Zhao, B.; Sun, Q.-Q.; Cao, Y.-Y.; Li, R.; Wu, X.-X.; Weeda, S.; Li, L.; Ren, S.; et al. The RNA-seq approach to discriminate gene expression profiles in response to melatonin on cucumber lateral root formation. J. Pineal Res. 2014, 56, 39–50. [Google Scholar] [CrossRef] [PubMed]
- Li, C.; Tan, D.-X.; Liang, D.; Chang, C.; Jia, D.; Ma, F. Melatonin mediates the regulation of ABA metabolism, free-radical scavenging, and stomatal behaviour in two Malus species under drought stress. J. Exp. Bot. 2015, 66, 669–680. [Google Scholar] [CrossRef] [Green Version]
- Li, H.; Dong, Y.; Chang, J.; He, J.; Chen, H.; Liu, Q.; Wei, C.; Ma, J.; Zhang, Y.; Yang, J.; et al. High-throughput microRNA and mRNA sequencing reveals that microRNAs may be involved in melatonin-mediated cold tolerance in Citrulluslanatus L. Front. Plant Sci. 2016, 7, 1231. [Google Scholar]
- Goswami, K.; Mittal, D.; Gautam, B.; Sopory, S.K.; Sanan-Mishra, N. Mapping the salt stress-induced changes in the Root miRNome in Pokkalirice. Biomolecules 2020, 10, 498. [Google Scholar] [CrossRef] [Green Version]
- Balyan, S.; Kumar, M.; Mutum, R.D.; Raghuvanshi, U.; Agarwal, P.; Mathur, S.; Raghuvanshi, S. Identification of miRNA-mediated drought responsive multi-tiered regulatory network in drought tolerant rice, Nagina 22. Sci. Rep. 2017, 7, 15446. [Google Scholar] [CrossRef]
- Li, J.; Tao, X.; Li, L.; Mao, L.; Luo, Z.; Khan, Z.U.; Ying, T. Comprehensive RNA-Seq Analysis on the Regulation of Tomato Ripening by Exogenous Auxin. PLoS ONE 2016, 11, e0156453. [Google Scholar] [CrossRef] [PubMed]
- R Core Team. R: A Language and Environment for Statistical Computing; R Foundation for Statistical Computing: Vienna, Austria, 2012; Available online: http://www.R-project.org (accessed on 28 August 2021).
- Goswami, K.; Tripathi, A.; Gautam, B.; Sanan-Mishra, N. Impact of next-generation sequencing in elucidating the role of microRNA related to multiple abiotic stresses. In Molecular Plant Abiotic Stress; Roychoudhury, A., Tripathi, D., Eds.; Wiley: Hoboken, NJ, USA, 2019. [Google Scholar] [CrossRef]
- Bhowal, B.; Singla-Pareek, S.L.; Sopory, S.K.; Kaur, C. From methylglyoxal to pyruvate: A genome-wide study for the identification of glyoxalases and D-lactate dehydrogenases in Sorghum bicolor. BMC Genom. 2020, 21, 145. [Google Scholar] [CrossRef] [PubMed] [Green Version]


| Name | Rice | Arabidopsis | Tomato | Sorghum | ||||
|---|---|---|---|---|---|---|---|---|
| Genes | Proteins | Genes | Proteins | Genes | Proteins | Genes | Proteins | |
| TDC | 7 | 7 | 2 | 5 | 5 | 5 | 9 | 9 |
| T5H | 1 | 1 | 1 | 1 | 6 | 6 | 1 | 1 |
| SNAT | 2 | 2 | 1 | 3 | 2 | 2 | 1 | 1 |
| ASMT | 19 | 19 | 17 | 19 | 11 | 11 | 28 | 29 |
Publisher’s Note: MDPI stays neutral with regard to jurisdictional claims in published maps and institutional affiliations. |
© 2021 by the authors. Licensee MDPI, Basel, Switzerland. This article is an open access article distributed under the terms and conditions of the Creative Commons Attribution (CC BY) license (https://creativecommons.org/licenses/by/4.0/).
Share and Cite
Bhowal, B.; Bhattacharjee, A.; Goswami, K.; Sanan-Mishra, N.; Singla-Pareek, S.L.; Kaur, C.; Sopory, S. Serotonin and Melatonin Biosynthesis in Plants: Genome-Wide Identification of the Genes and Their Expression Reveal a Conserved Role in Stress and Development. Int. J. Mol. Sci. 2021, 22, 11034. https://doi.org/10.3390/ijms222011034
Bhowal B, Bhattacharjee A, Goswami K, Sanan-Mishra N, Singla-Pareek SL, Kaur C, Sopory S. Serotonin and Melatonin Biosynthesis in Plants: Genome-Wide Identification of the Genes and Their Expression Reveal a Conserved Role in Stress and Development. International Journal of Molecular Sciences. 2021; 22(20):11034. https://doi.org/10.3390/ijms222011034
Chicago/Turabian StyleBhowal, Bidisha, Annapurna Bhattacharjee, Kavita Goswami, Neeti Sanan-Mishra, Sneh L. Singla-Pareek, Charanpreet Kaur, and Sudhir Sopory. 2021. "Serotonin and Melatonin Biosynthesis in Plants: Genome-Wide Identification of the Genes and Their Expression Reveal a Conserved Role in Stress and Development" International Journal of Molecular Sciences 22, no. 20: 11034. https://doi.org/10.3390/ijms222011034