
Clinical and Prognostic Value of Antigen-Presenting Cells with PD-L1/PD-L2 Expression in Ovarian Cancer Patients

 , , ,
, , , 
Abstract
:1. Introduction
2. Results
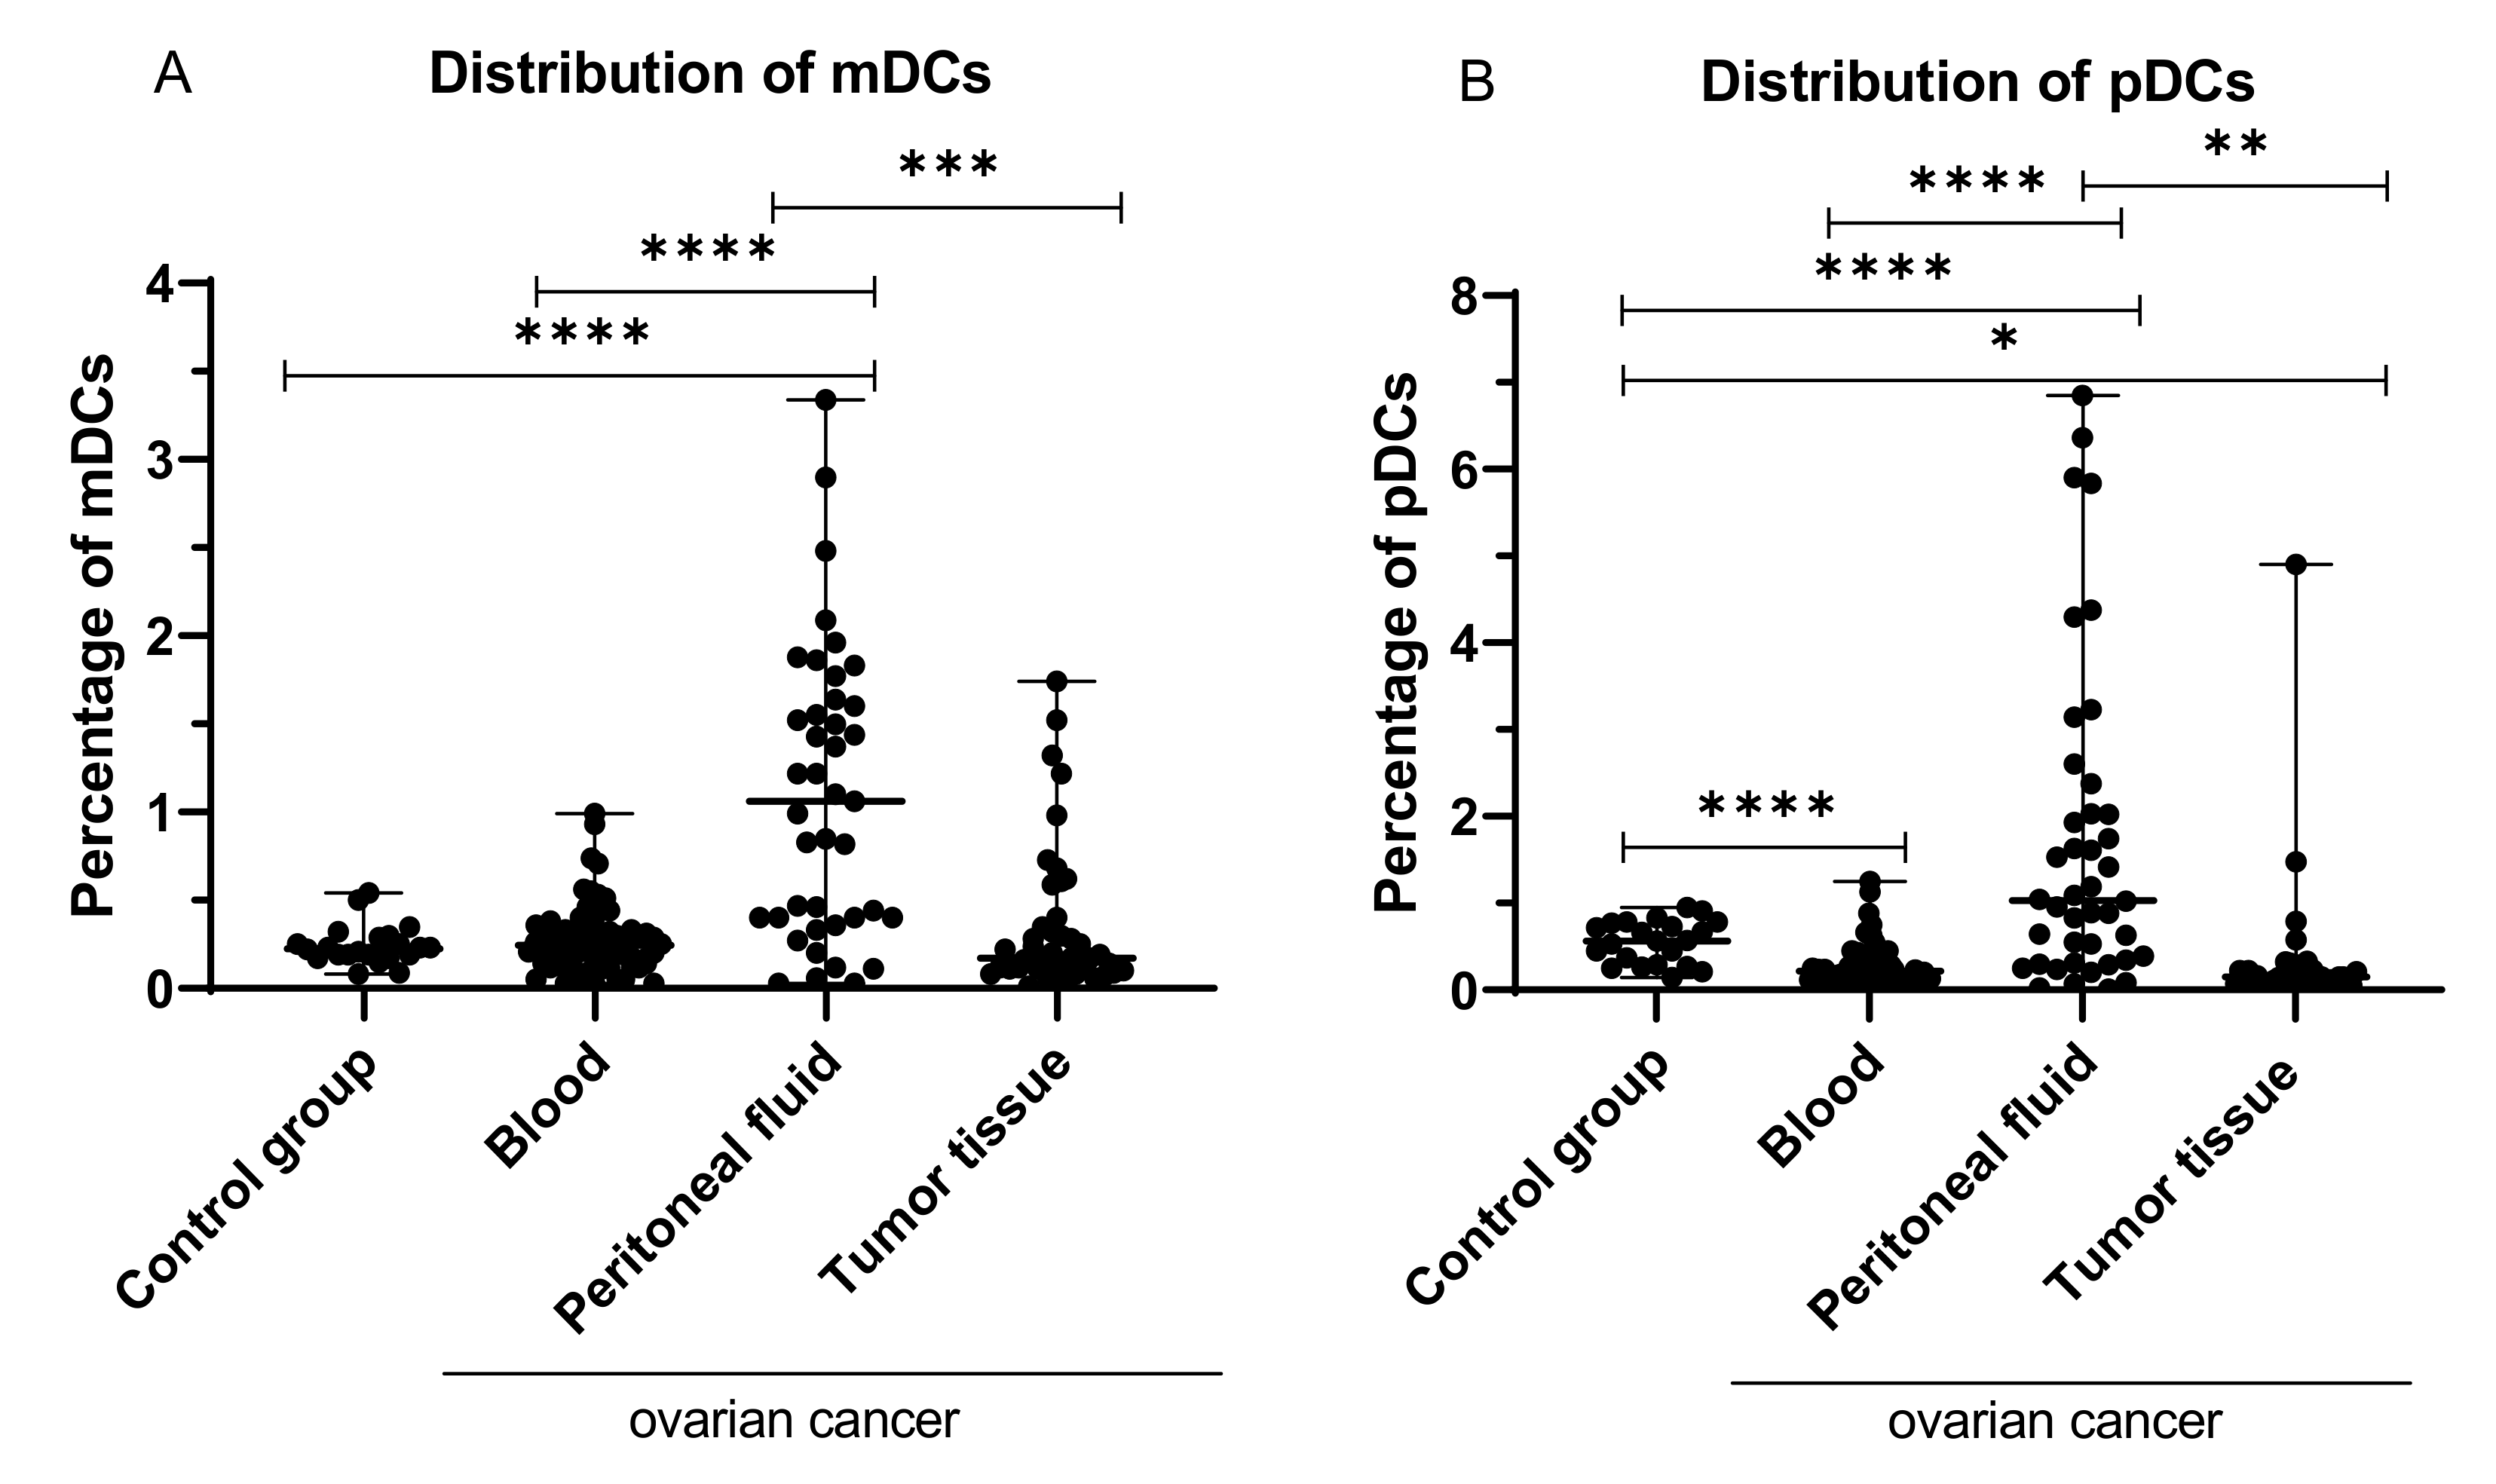
2.1. Percentage of Myeloid (BDCA-1+CD19−) and Plasmacytoid (BDCA-2+CD123+) Dendritic Cells in Peripheral Blood, Peritoneal Fluid, and Tumor Tissue from OC Patients
2.2. Percentage of Myeloid BDCA-1+CD19− DCs with PD-L1 or PD-L2 Expression in PB, PF, and among Ovarian Cancer Infiltrating Cells
2.3. Percentage of Plasmacytoid BDCA-2+CD123+ DCs with PD-L1 or PD-L2 Expression in PB, PF, and among Ovarian Cancer Infiltrating Cells
2.4. Percentage of Myeloid and Plasmacytoid DCs with PD-L1 or PD-L2 Expression in Patients with Different Clinical Manifestations of Ovarian Cancer
2.5. Relationship between Clinicopathological Characteristics of OC Patients and the Percentage of Myeloid and Plasmacytoid DCs with PD-L1 or PD-L2 Expression in PB, PF, and among Ovarian Cancer Infiltrating Cells
2.6. Percentage of MO/MA and MO/MA with PD-L1 or PD-L2 Expression in Peripheral Blood, Peritoneal Fluid, and among Ovarian Cancer Infiltrating Cells
2.7. Percentage of MO/MA with PD-L1 or PD-L2 Expression in Patients with Different Clinical Manifestations of Ovarian Cancer
2.8. Concentration of sPD-L1 and sPD-1 in Patients with Ovarian Cancer and Control Group
2.9. Concentration of sPD-L1 in the Plasma and Peritoneal Fluid of OC Patients with Different FIGO Stages, Grades, and Kurman–Shih Types of Ovarian Cancer
2.10. Assessment of the Relationship between the sPD-L1 Level in Plasma and PF and the Clinical Data of OC Patients
2.11. Relationship between the Level of sPD-1 and sPD-L1 in Plasma of OC Patients and Control Group
2.12. Prediction of OC Patient Prognosis Based on Immune Parameters
2.13. Soluble PD-L1 (sPD-L1) and PD-1 (sPD-1) as a Potential Prognosis Biomarker for OC Patients
2.14. Prediction of Patient Prognosis Based on Clinical Characteristics of OC Patients
3. Discussion
4. Materials and Methods
4.1. Patients, Ethics Statement, Standard Protocol Approvals
4.2. Isolation of Mononuclear Cells (MNCs)
4.3. Flow Cytometric Analysis
4.4. ELISA
4.5. Statistical Analysis
5. Conclusions
Supplementary Materials
Author Contributions
Funding
Institutional Review Board Statement
Informed Consent Statement
Data Availability Statement
Acknowledgments
Conflicts of Interest
References
- Chatterjee, J.; Dai, W.; Aziz, N.H.A.; Teo, P.Y.; Wahba, J.; Phelps, D.L.; Maine, C.J.; Whilding, L.M.; Dina, R.; Trevisan, G.; et al. Clinical Use of Programmed Cell Death-1 and Its Ligand Expression as Discriminatory and Predictive Markers in Ovarian Cancer. Clin. Cancer Res. 2017, 23, 3453–3460. [Google Scholar] [CrossRef] [Green Version]
- Zhu, X.; Lang, J. Programmed Death-1 Pathway Blockade Produces a Synergistic Antitumor Effect: Combined Application in Ovarian Cancer. J. Gynecol. Oncol. 2017, 28, e64. [Google Scholar] [CrossRef] [PubMed] [Green Version]
- Cortez, A.J.; Tudrej, P.; Kujawa, K.A.; Lisowska, K.M. Advances in Ovarian Cancer Therapy. Cancer Chemother. Pharmacol. 2018, 81, 17–38. [Google Scholar] [CrossRef] [Green Version]
- Pawłowska, A.; Suszczyk, D.; Okła, K.; Barczyński, B.; Kotarski, J.; Wertel, I. Immunotherapies Based on PD-1/PD-L1 Pathway Inhibitors in Ovarian Cancer Treatment. Clin. Exp. Immunol. 2019, 195, 334–344. [Google Scholar] [CrossRef] [PubMed] [Green Version]
- Drakes, M.L.; Stiff, P.J. Regulation of Ovarian Cancer Prognosis by Immune Cells in the Tumor Microenvironment. Cancers 2018, 10, 302. [Google Scholar] [CrossRef] [Green Version]
- Swatler, J.; Kozłowska, E. Immune checkpoint-targeted cancer immunotherapies. Postepy Hig. Med. Doswiadczalnej Online 2016, 70, 25–42. [Google Scholar] [CrossRef] [PubMed]
- Pakish, J.B.; Jazaeri, A.A. Immunotherapy in Gynecologic Cancers: Are We There Yet? Curr. Treat. Options Oncol. 2017, 18, 59. [Google Scholar] [CrossRef] [Green Version]
- Meinhold-Heerlein, I.; Fotopoulou, C.; Harter, P.; Kurzeder, C.; Mustea, A.; Wimberger, P.; Hauptmann, S.; Sehouli, J. The New WHO Classification of Ovarian, Fallopian Tube, and Primary Peritoneal Cancer and Its Clinical Implications. Arch. Gynecol. Obstet. 2016, 293, 695–700. [Google Scholar] [CrossRef] [PubMed]
- Qu, Q.-X.; Xie, F.; Huang, Q.; Zhang, X.-G. Membranous and Cytoplasmic Expression of PD-L1 in Ovarian Cancer Cells. Cell. Physiol. Biochem. Int. J. Exp. Cell. Physiol. Biochem. Pharmacol. 2017, 43, 1893–1906. [Google Scholar] [CrossRef] [PubMed]
- Pujade-Lauraine, E.; Fujiwara, K.; Dychter, S.S.; Devgan, G.; Monk, B.J. Avelumab (Anti-PD-L1) in Platinum-Resistant/Refractory Ovarian Cancer: JAVELIN Ovarian 200 Phase III Study Design. Future Oncol. Lond. Engl. 2018, 14, 2103–2113. [Google Scholar] [CrossRef] [PubMed] [Green Version]
- Mittica, G.; Genta, S.; Aglietta, M.; Valabrega, G. Immune Checkpoint Inhibitors: A New Opportunity in the Treatment of Ovarian Cancer? Int. J. Mol. Sci. 2016, 17, 1169. [Google Scholar] [CrossRef] [Green Version]
- Konishi, J.; Yamazaki, K.; Azuma, M.; Kinoshita, I.; Dosaka-Akita, H.; Nishimura, M. B7-H1 Expression on Non-Small Cell Lung Cancer Cells and Its Relationship with Tumor-Infiltrating Lymphocytes and Their PD-1 Expression. Clin. Cancer Res. 2004, 10, 5094–5100. [Google Scholar] [CrossRef] [PubMed] [Green Version]
- Mu, C.-Y.; Huang, J.-A.; Chen, Y.; Chen, C.; Zhang, X.-G. High Expression of PD-L1 in Lung Cancer May Contribute to Poor Prognosis and Tumor Cells Immune Escape through Suppressing Tumor Infiltrating Dendritic Cells Maturation. Med. Oncol. 2011, 28, 682–688. [Google Scholar] [CrossRef] [PubMed]
- Herbst, R.S.; Soria, J.-C.; Kowanetz, M.; Fine, G.D.; Hamid, O.; Gordon, M.S.; Sosman, J.A.; McDermott, D.F.; Powderly, J.D.; Gettinger, S.N.; et al. Predictive Correlates of Response to the Anti-PD-L1 Antibody MPDL3280A in Cancer Patients. Nature 2014, 515, 563–567. [Google Scholar] [CrossRef] [PubMed] [Green Version]
- Thompson, R.H.; Dong, H.; Lohse, C.M.; Leibovich, B.C.; Blute, M.L.; Cheville, J.C.; Kwon, E.D. PD-1 Is Expressed by Tumor-Infiltrating Immune Cells and Is Associated with Poor Outcome for Patients with Renal Cell Carcinoma. Clin. Cancer Res. Off. J. Am. Assoc. Cancer Res. 2007, 13, 1757–1761. [Google Scholar] [CrossRef] [PubMed] [Green Version]
- Huang, Y.; Zhang, S.-D.; McCrudden, C.; Chan, K.-W.; Lin, Y.; Kwok, H.-F. The Prognostic Significance of PD-L1 in Bladder Cancer. Oncol. Rep. 2015, 33, 3075–3084. [Google Scholar] [CrossRef] [PubMed] [Green Version]
- Hamanishi, J.; Mandai, M.; Iwasaki, M.; Okazaki, T.; Tanaka, Y.; Yamaguchi, K.; Higuchi, T.; Yagi, H.; Takakura, K.; Minato, N.; et al. Programmed Cell Death 1 Ligand 1 and Tumor-Infiltrating CD8+ T Lymphocytes Are Prognostic Factors of Human Ovarian Cancer. Proc. Natl. Acad. Sci. USA 2007, 104, 3360–3365. [Google Scholar] [CrossRef] [Green Version]
- Webb, J.R.; Milne, K.; Kroeger, D.R.; Nelson, B.H. PD-L1 Expression Is Associated with Tumor-Infiltrating T Cells and Favorable Prognosis in High-Grade Serous Ovarian Cancer. Gynecol. Oncol. 2016, 141, 293–302. [Google Scholar] [CrossRef] [PubMed] [Green Version]
- Darb-Esfahani, S.; Kunze, C.A.; Kulbe, H.; Sehouli, J.; Wienert, S.; Lindner, J.; Budczies, J.; Bockmayr, M.; Dietel, M.; Denkert, C.; et al. Prognostic Impact of Programmed Cell Death-1 (PD-1) and PD-Ligand 1 (PD-L1) Expression in Cancer Cells and Tumor-Infiltrating Lymphocytes in Ovarian High Grade Serous Carcinoma. Oncotarget 2016, 7, 1486–1499. [Google Scholar] [CrossRef] [PubMed] [Green Version]
- Aust, S.; Felix, S.; Auer, K.; Bachmayr-Heyda, A.; Kenner, L.; Dekan, S.; Meier, S.M.; Gerner, C.; Grimm, C.; Pils, D. Absence of PD-L1 on Tumor Cells Is Associated with Reduced MHC I Expression and PD-L1 Expression Increases in Recurrent Serous Ovarian Cancer. Sci. Rep. 2017, 7, 42929. [Google Scholar] [CrossRef]
- Maine, C.J.; Aziz, N.H.A.; Chatterjee, J.; Hayford, C.; Brewig, N.; Whilding, L.; George, A.J.T.; Ghaem-Maghami, S. Programmed Death Ligand-1 over-Expression Correlates with Malignancy and Contributes to Immune Regulation in Ovarian Cancer. Cancer Immunol. Immunother. CII 2014, 63, 215–224. [Google Scholar] [CrossRef] [PubMed]
- Marinelli, O.; Annibali, D.; Aguzzi, C.; Tuyaerts, S.; Amant, F.; Morelli, M.B.; Santoni, G.; Amantini, C.; Maggi, F.; Nabissi, M. The Controversial Role of PD-1 and Its Ligands in Gynecological Malignancies. Front. Oncol. 2019, 9, 1073. [Google Scholar] [CrossRef] [Green Version]
- Festino, L.; Botti, G.; Lorigan, P.; Masucci, G.V.; Hipp, J.D.; Horak, C.E.; Melero, I.; Ascierto, P.A. Cancer Treatment with Anti-PD-1/PD-L1 Agents: Is PD-L1 Expression a Biomarker for Patient Selection? Drugs 2016, 76, 925–945. [Google Scholar] [CrossRef]
- Zhu, X.; Lang, J. Soluble PD-1 and PD-L1: Predictive and Prognostic Significance in Cancer. Oncotarget 2017, 8, 97671–97682. [Google Scholar] [CrossRef] [Green Version]
- Buderath, P.; Schwich, E.; Jensen, C.; Horn, P.A.; Kimmig, R.; Kasimir-Bauer, S.; Rebmann, V. Soluble Programmed Death Receptor Ligands SPD-L1 and SPD-L2 as Liquid Biopsy Markers for Prognosis and Platinum Response in Epithelial Ovarian Cancer. Front. Oncol. 2019, 9, 1015. [Google Scholar] [CrossRef] [Green Version]
- Pawłowska, A.; Suszczyk, D.; Tarkowski, R.; Paduch, R.; Kotarski, J.; Wertel, I. Programmed Death-1 Receptor (PD-1) as a Potential Prognosis Biomarker for Ovarian Cancer Patients. Cancer Manag. Res. 2020, 12, 9691–9709. [Google Scholar] [CrossRef]
- Miao, Y.R.; Thakkar, K.N.; Qian, J.; Kariolis, M.S.; Wei, H.; Nandagopal, S.; Yang, T.; Diep, A.N.; Cherf, G.M.; Xu, Y.; et al. Neutralizing PD-L1 and PD-L2 Enhances the Efficacy of Immune Checkpoint Inhibitors in Ovarian Cancer. Clin. Cancer Res. 2020, 27, 4435–4448. [Google Scholar] [CrossRef] [PubMed]
- Carenza, C.; Calcaterra, F.; Oriolo, F.; Di Vito, C.; Ubezio, M.; Della Porta, M.G.; Mavilio, D.; Della Bella, S. Costimulatory Molecules and Immune Checkpoints Are Differentially Expressed on Different Subsets of Dendritic Cells. Front. Immunol. 2019, 10, 1325. [Google Scholar] [CrossRef] [PubMed]
- Peng, Q.; Qiu, X.; Zhang, Z.; Zhang, S.; Zhang, Y.; Liang, Y.; Guo, J.; Peng, H.; Chen, M.; Fu, Y.-X.; et al. PD-L1 on Dendritic Cells Attenuates T Cell Activation and Regulates Response to Immune Checkpoint Blockade. Nat. Commun. 2020, 11, 4835. [Google Scholar] [CrossRef] [PubMed]
- Oh, S.A.; Wu, D.-C.; Cheung, J.; Navarro, A.; Xiong, H.; Cubas, R.; Totpal, K.; Chiu, H.; Wu, Y.; Comps-Agrar, L.; et al. PD-L1 Expression by Dendritic Cells Is a Key Regulator of T-Cell Immunity in Cancer. Nat. Cancer 2020, 1, 681–691. [Google Scholar] [CrossRef]
- Sadeghzadeh, M.; Bornehdeli, S.; Mohahammadrezakhani, H.; Abolghasemi, M.; Poursaei, E.; Asadi, M.; Zafari, V.; Aghebati-Maleki, L.; Shanehbandi, D. Dendritic Cell Therapy in Cancer Treatment; the State-of-the-Art. Life Sci. 2020, 254, 117580. [Google Scholar] [CrossRef]
- Nhokaew, W.; Kleebkaow, P.; Chaisuriya, N.; Kietpeerakool, C. Programmed Death Ligand 1 (PD-L1) Expression in Epithelial Ovarian Cancer: A Comparison of Type I and Type II Tumors. Asian Pac. J. Cancer Prev. APJCP 2019, 20, 1161–1169. [Google Scholar] [CrossRef] [PubMed] [Green Version]
- Wang, Z.; Aguilar, E.G.; Luna, J.I.; Dunai, C.; Khuat, L.T.; Le, C.T.; Mirsoian, A.; Minnar, C.M.; Stoffel, K.M.; Sturgill, I.R.; et al. Paradoxical Effects of Obesity on T Cell Function during Tumor Progression and PD-1 Checkpoint Blockade. Nat. Med. 2019, 25, 141–151. [Google Scholar] [CrossRef] [PubMed]
- O’Shea, D.; Corrigan, M.; Dunne, M.R.; Jackson, R.; Woods, C.; Gaoatswe, G.; Moynagh, P.N.; O’Connell, J.; Hogan, A.E. Changes in Human Dendritic Cell Number and Function in Severe Obesity May Contribute to Increased Susceptibility to Viral Infection. Int. J. Obes. 2013, 37, 1510–1513. [Google Scholar] [CrossRef] [PubMed] [Green Version]
- Tworoger, S.S.; Huang, T. Obesity and Ovarian Cancer. In Obesity and Cancer; Pischon, T., Nimptsch, K., Eds.; Recent Results in Cancer Research; Springer International Publishing: Cham, Switzerland, 2016; Volume 208, pp. 155–176. ISBN 978-3-319-42540-5. [Google Scholar]
- Xue, C.; Zhu, D.; Chen, L.; Xu, Y.; Xu, B.; Zhang, D.; Jiang, J. Expression and Prognostic Value of PD-L1 and PD-L2 in Ovarian Cancer. Transl. Cancer Res. 2019, 8, 111–119. [Google Scholar] [CrossRef]
- Gottlieb, C.E.; Mills, A.M.; Cross, J.V.; Ring, K.L. Tumor-Associated Macrophage Expression of PD-L1 in Implants of High Grade Serous Ovarian Carcinoma: A Comparison of Matched Primary and Metastatic Tumors. Gynecol. Oncol. 2017, 144, 607–612. [Google Scholar] [CrossRef] [PubMed]
- Zhang, G.; Liu, C.; Bai, H.; Cao, G.; Cui, R.; Zhang, Z. Combinatorial Therapy of Immune Checkpoint and Cancer Pathways Provides a Novel Perspective on Ovarian Cancer Treatment (Review). Oncol. Lett. 2019, 17, 2583–2591. [Google Scholar] [CrossRef] [PubMed] [Green Version]
- Nowak, M.; Klink, M. The Role of Tumor-Associated Macrophages in the Progression and Chemoresistance of Ovarian Cancer. Cells 2020, 9, 1299. [Google Scholar] [CrossRef] [PubMed]
- Gambardella, V.; Castillo, J.; Tarazona, N.; Gimeno-Valiente, F.; Martínez-Ciarpaglini, C.; Cabeza-Segura, M.; Roselló, S.; Roda, D.; Huerta, M.; Cervantes, A.; et al. The Role of Tumor-Associated Macrophages in Gastric Cancer Development and Their Potential as a Therapeutic Target. Cancer Treat. Rev. 2020, 86, 102015. [Google Scholar] [CrossRef] [Green Version]
- Yang, H.; Zhou, X.; Sun, L.; Mao, Y. Correlation Between PD-L2 Expression and Clinical Outcome in Solid Cancer Patients: A Meta-Analysis. Front. Oncol. 2019, 9. [Google Scholar] [CrossRef] [Green Version]
- Zhang, Y.; Xu, J.; Hua, J.; Liu, J.; Liang, C.; Meng, Q.; Wei, M.; Zhang, B.; Yu, X.; Shi, S. A PD-L2-Based Immune Marker Signature Helps to Predict Survival in Resected Pancreatic Ductal Adenocarcinoma. J. Immunother. Cancer 2019, 7, 233. [Google Scholar] [CrossRef] [Green Version]
- Takamori, S.; Takada, K.; Azuma, K.; Jogo, Y.; Kinoshita, F.; Kozuma, Y.; Matsubara, T.; Haratake, N.; Akamine, T.; Toyokawa, G.; et al. Prognostic Impact of PD-L2 Expression and Association with PD-L1 in Patients with Small-Cell Lung Cancer. Anticancer Res. 2018, 38, 5903–5907. [Google Scholar] [CrossRef]
- Chen, Y.; Wang, Q.; Shi, B.; Xu, P.; Hu, Z.; Bai, L.; Zhang, X. Development of a Sandwich ELISA for Evaluating Soluble PD-L1 (CD274) in Human Sera of Different Ages as Well as Supernatants of PD-L1+ Cell Lines. Cytokine 2011, 56, 231–238. [Google Scholar] [CrossRef] [PubMed]
- Takada, K.; Okamoto, T.; Toyokawa, G.; Kozuma, Y.; Matsubara, T.; Haratake, N.; Akamine, T.; Takamori, S.; Katsura, M.; Shoji, F.; et al. The Expression of PD-L1 Protein as a Prognostic Factor in Lung Squamous Cell Carcinoma. Lung Cancer Amst. Neth. 2017, 104, 7–15. [Google Scholar] [CrossRef] [PubMed]
- Inman, B.A.; Sebo, T.J.; Frigola, X.; Dong, H.; Bergstralh, E.J.; Frank, I.; Fradet, Y.; Lacombe, L.; Kwon, E.D. PD-L1 (B7-H1) Expression by Urothelial Carcinoma of the Bladder and BCG-Induced Granulomata: Associations with Localized Stage Progression. Cancer 2007, 109, 1499–1505. [Google Scholar] [CrossRef] [PubMed]
- McLaughlin, J.; Han, G.; Schalper, K.A.; Carvajal-Hausdorf, D.; Pelekanou, V.; Rehman, J.; Velcheti, V.; Herbst, R.; LoRusso, P.; Rimm, D.L. Quantitative Assessment of the Heterogeneity of PD-L1 Expression in Non-Small-Cell Lung Cancer. JAMA Oncol. 2016, 2, 46–54. [Google Scholar] [CrossRef] [PubMed]
- Shi, S.-J.; Wang, L.-J.; Wang, G.-D.; Guo, Z.-Y.; Wei, M.; Meng, Y.-L.; Yang, A.-G.; Wen, W.-H. B7-H1 Expression Is Associated with Poor Prognosis in Colorectal Carcinoma and Regulates the Proliferation and Invasion of HCT116 Colorectal Cancer Cells. PLoS ONE 2013, 8, e76012. [Google Scholar] [CrossRef] [Green Version]
- Parvathareddy, S.K.; Siraj, A.K.; Al-Badawi, I.A.; Tulbah, A.; Al-Dayel, F.; Al-Kuraya, K.S. Differential Expression of PD-L1 between Primary and Metastatic Epithelial Ovarian Cancer and Its Clinico-Pathological Correlation. Sci. Rep. 2021, 11, 3750. [Google Scholar] [CrossRef] [PubMed]
- Yasuoka, H.; Asai, A.; Ohama, H.; Tsuchimoto, Y.; Fukunishi, S.; Higuchi, K. Increased Both PD–L1 and PD–L2 Expressions on Monocytes of Patients with Hepatocellular Carcinoma Was Associated with a Poor Prognosis. Sci. Rep. 2020, 10, 10377. [Google Scholar] [CrossRef]
- Zhang, J.; Gao, J.; Li, Y.; Nie, J.; Dai, L.; Hu, W.; Chen, X.; Han, J.; Ma, X.; Tian, G.; et al. Circulating PD-L1 in NSCLC Patients and the Correlation between the Level of PD-L1 Expression and the Clinical Characteristics. Thorac. Cancer 2015, 6, 534–538. [Google Scholar] [CrossRef]
- Asanuma, K.; Nakamura, T.; Hayashi, A.; Okamoto, T.; Iino, T.; Asanuma, Y.; Hagi, T.; Kita, K.; Nakamura, K.; Sudo, A. Soluble Programmed Death-Ligand 1 Rather than PD-L1 on Tumor Cells Effectively Predicts Metastasis and Prognosis in Soft Tissue Sarcomas. Sci. Rep. 2020, 10, 9077. [Google Scholar] [CrossRef]
- Zheng, Z.; Bu, Z.; Liu, X.; Zhang, L.; Li, Z.; Wu, A.; Wu, X.; Cheng, X.; Xing, X.; Du, H.; et al. Level of Circulating PD-L1 Expression in Patients with Advanced Gastric Cancer and Its Clinical Implications. Chin. J. Cancer Res. Chung-Kuo Yen Cheng Yen Chiu 2014, 26, 104–111. [Google Scholar] [CrossRef] [PubMed]
- Hilliard, T.S. The Impact of Mesothelin in the Ovarian Cancer Tumor Microenvironment. Cancers 2018, 10, 277. [Google Scholar] [CrossRef] [PubMed] [Green Version]
- Okła, K.; Surówka, J.; Frąszczak, K.; Czerwonka, A.; Kaławaj, K.; Wawruszak, A.; Kotarski, J.; Wertel, I. Assessment of the Clinicopathological Relevance of Mesothelin Level in Plasma, Peritoneal Fluid, and Tumor Tissue of Epithelial Ovarian Cancer Patients. Tumour Biol. J. Int. Soc. Oncodev. Biol. Med. 2018, 40, 1010428318804937. [Google Scholar] [CrossRef] [PubMed] [Green Version]
- Yuan, Q.; Song, J.; Yang, W.; Wang, H.; Huo, Q.; Yang, J.; Yu, X.; Liu, Y.; Xu, C.; Bao, H. The Effect of CA125 on Metastasis of Ovarian Cancer: Old Marker New Function. Oncotarget 2017, 8, 50015–50022. [Google Scholar] [CrossRef] [PubMed] [Green Version]
- Vega, J.F.S.; Bacilio, M.D.R.M.; Condoy, A.S.V.; González, A.P.M.; Astudillo, J.A.C.; Mora-Bravo, F.G. Predictive Equation of Metastasis in Patients with Malignant Ovarian Epithelial Tumors with the Ca-125 Marker. BMC Cancer 2018, 18, 587. [Google Scholar] [CrossRef]
- Huo, Q.; Xu, C.; Shao, Y.; Yu, Q.; Huang, L.; Liu, Y.; Bao, H. Free CA125 Promotes Ovarian Cancer Cell Migration and Tumor Metastasis by Binding Mesothelin to Reduce DKK1 Expression and Activate the SGK3/FOXO3 Pathway. Int. J. Biol. Sci. 2021, 17, 574–588. [Google Scholar] [CrossRef]
- Abiko, K.; Matsumura, N.; Hamanishi, J.; Horikawa, N.; Murakami, R.; Yamaguchi, K.; Yoshioka, Y.; Baba, T.; Konishi, I.; Mandai, M. IFN-γ from Lymphocytes Induces PD-L1 Expression and Promotes Progression of Ovarian Cancer. Br. J. Cancer 2015, 112, 1501–1509. [Google Scholar] [CrossRef] [Green Version]
- Wertel, I.; Polak, G.; Bednarek, W.; Barczyński, B.; Roliński, J.; Kotarski, J. Dendritic Cell Subsets in the Peritoneal Fluid and Peripheral Blood of Women Suffering from Ovarian Cancer. Cytom. B Clin. Cytom. 2008, 74, 251–258. [Google Scholar] [CrossRef] [PubMed]
- Frigola, X.; Inman, B.A.; Krco, C.J.; Liu, X.; Harrington, S.M.; Bulur, P.A.; Dietz, A.B.; Dong, H.; Kwon, E.D. Soluble B7-H1: Differences in Production between Dendritic Cells and T Cells. Immunol. Lett. 2012, 142, 78–82. [Google Scholar] [CrossRef] [PubMed] [Green Version]
- Wei, W.; Xu, B.; Wang, Y.; Wu, C.; Jiang, J.; Wu, C. Prognostic Significance of Circulating Soluble Programmed Death Ligand-1 in Patients with Solid Tumors: A Meta-Analysis. Medicine 2018, 97, e9617. [Google Scholar] [CrossRef] [PubMed]
- De Nola, R.; Menga, A.; Castegna, A.; Loizzi, V.; Ranieri, G.; Cicinelli, E.; Cormio, G. The Crowded Crosstalk between Cancer Cells and Stromal Microenvironment in Gynecological Malignancies: Biological Pathways and Therapeutic Implication. Int. J. Mol. Sci. 2019, 20, 2401. [Google Scholar] [CrossRef] [Green Version]
- Okła, K.; Rajtak, A.; Czerwonka, A.; Bobiński, M.; Wawruszak, A.; Tarkowski, R.; Bednarek, W.; Szumiło, J.; Kotarski, J. Accumulation of Blood-Circulating PD-L1-Expressing M-MDSCs and Monocytes/Macrophages in Pretreatment Ovarian Cancer Patients Is Associated with Soluble PD-L1. J. Transl. Med. 2020, 18, 220. [Google Scholar] [CrossRef]
- Elhag, O.A.O.; Hu, X.-J.; Wen-Ying, Z.; Li, X.; Yuan, Y.-Z.; Deng, L.-F.; Liu, D.-L.; Liu, Y.-L.; Hui, G. Reconstructed Adeno-Associated Virus with the Extracellular Domain of Murine PD-1 Induces Antitumor Immunity. Asian Pac. J. Cancer Prev. APJCP 2012, 13, 4031–4036. [Google Scholar] [CrossRef] [Green Version]
- Silverberg, S.G. Histopathologic Grading of Ovarian Carcinoma: A Review and Proposal. Int. J. Gynecol. Pathol. Off. J. Int. Soc. Gynecol. Pathol. 2000, 19, 7–15. [Google Scholar] [CrossRef] [PubMed]
- Prat, J. FIGO Committee on Gynecologic Oncology Staging Classification for Cancer of the Ovary, Fallopian Tube, and Peritoneum. Int. J. Gynaecol. Obstet. Off. Organ Int. Fed. Gynaecol. Obstet. 2014, 124, 1–5. [Google Scholar] [CrossRef] [PubMed]
- Kurman, R.J.; Shih, I.-M. The Dualistic Model of Ovarian Carcinogenesis: Revisited, Revised, and Expanded. Am. J. Pathol. 2016, 186, 733–747. [Google Scholar] [CrossRef] [PubMed] [Green Version]
- Shih, I.-M.; Kurman, R.J. Ovarian Tumorigenesis: A Proposed Model Based on Morphological and Molecular Genetic Analysis. Am. J. Pathol. 2004, 164, 1511–1518. [Google Scholar] [CrossRef]
- Wertel, I.; Suszczyk, D.; Pawłowska, A.; Bilska, M.; Chudzik, A.; Skiba, W.; Paduch, R.; Kotarski, J. Prognostic and Clinical Value of Interleukin 6 and CD45+CD14+ Inflammatory Cells with PD-L1+/PD-L2+ Expression in Patients with Different Manifestation of Ovarian Cancer. J. Immunol. Res. 2020, 2020, 1715064. [Google Scholar] [CrossRef]


| Peripheral Blood | Peritoneal Fluid | Tumor Tissue | |||||||
|---|---|---|---|---|---|---|---|---|---|
| Median | Minimum | Maximum | Median | Minimum | Maximum | Median | Minimum | Maximum | |
| %CD45+CD14+ | 23.65 °°,°°° | 0.06 | 52.34 | 12.06 | 0.43 | 63.97 | 9.85 | 0.26 | 79.33 |
| %CD45+CD14+PD-L1+ | 10.41 | 0.84 | 99.95 | 20.50 | 2.31 | 100.00 | 40.43 **** | 3.44 | 97.59 |
| %CD45+CD14+ PD-L2+ | 1.43 | 0.07 | 66.54 | 7.12 * | 0.16 | 99.43 | 7.39 ** | 0.12 | 99.39 |
| Concentration of sPD-L1 (pg/mL) in Ovarian Cancer Patients | Plasma (n = 34) | Peritoneal Fluid (n = 34) | ||||||
|---|---|---|---|---|---|---|---|---|
| Median | Minimum | Maximum | Median | Minimum | Maximum | |||
| FIGO stage | I-II (n = 11) | 69.70 | 33.15 | 131.81 | I-II (n = 11) | 75.54 | 61.25 | 207.27 |
| III-IV (n = 23) | 59.54 | 31.32 | 342,31 | III-IV (n = 23) | 100.89 | 22.91 | 231.75 | |
| Grade | G2 (n = 18) | 66.75 | 33.15 | 342.31 | G2 (n = 18) | 74.29 | 51.80 | 231.75 |
| G3 (n = 16) | 61.25 | 31.32 | 131.81 | G3 (n = 16) | 110.85 | 22.91 | 207.27 | |
| Kurman and Shih OC Type | I (n = 25) | 63.80 | 31.32 | 342.31 | I (n = 25) | 99.28 | 34.06 | 231.75 |
| II (n = 9) | 59.54 | 34.06 | 131.81 | II (n = 9) | 128.68 | 22.91 | 207.27 | |
| Control Group (n = 20) | - | 60.40 | 38.58 | 667.2 | - | - | - | |
| Ovarian Cancer Patients | Healthy Donors | ||||||||
|---|---|---|---|---|---|---|---|---|---|
| Median | Minimum | Maximum | Median | Minimum | Maximum | Median | Minimum | Maximum | |
| Concentration of sPD-L1 (pg/mL) | Plasma (n = 34) | PF (n = 34) | Plasma (n = 20) | ||||||
| 63.37 * | 31.32 | 342.3 | 100.5 °°° | 22.91 | 231.8 | 60.40 | 38.58 | 667.2 | |
| Concentration of sPD-1 (pg/mL) | Plasma (n = 30) | PF (n = 27) | Plasma (n = 10) | ||||||
| 72.91 **** | 9.48 | 447.29 | 33.37 | 3.79 | 320.88 | 52.37 ° | 25.02 | 91.28 | |
| The Clinical Features | Ovarian Cancer Patients (n = 53) |
|---|---|
| Age (median), years (range) | 55 (20–80) |
| FIGO Stage, n (%) | |
| Early (I–II) | 22 (42%) |
| I | 9 (17%) |
| II | 13 (25%) |
| Advanced (III–IV) | 31 (58%) |
| III | 20 (37%) |
| IV | 11 (21%) |
| The OC Classification According to Kurman and Shih, n (%) | |
| Type I (endometroid, serous G2, mucinous) | 39 (74%) |
| Type II (serous G3) | 14 (26%) |
| Grading (Histological Differentiation), n (%) | |
| Intermediate grade (G2) | 29 (55%) |
| Low grade (G3) | 24 (45%) |
| Menopausal Status | |
| Before menopause | 21 (40%) |
| After menopause | 32 (60%) |
| Ca125 range, median (U/mL) | 525.30 (9.60–14283.0) |
| Body mass index (BMI) range, median | 25.62 (18.34–38.37) |
Publisher’s Note: MDPI stays neutral with regard to jurisdictional claims in published maps and institutional affiliations. |
© 2021 by the authors. Licensee MDPI, Basel, Switzerland. This article is an open access article distributed under the terms and conditions of the Creative Commons Attribution (CC BY) license (https://creativecommons.org/licenses/by/4.0/).
Share and Cite
Pawłowska, A.; Kwiatkowska, A.; Suszczyk, D.; Chudzik, A.; Tarkowski, R.; Barczyński, B.; Kotarski, J.; Wertel, I. Clinical and Prognostic Value of Antigen-Presenting Cells with PD-L1/PD-L2 Expression in Ovarian Cancer Patients. Int. J. Mol. Sci. 2021, 22, 11563. https://doi.org/10.3390/ijms222111563
Pawłowska A, Kwiatkowska A, Suszczyk D, Chudzik A, Tarkowski R, Barczyński B, Kotarski J, Wertel I. Clinical and Prognostic Value of Antigen-Presenting Cells with PD-L1/PD-L2 Expression in Ovarian Cancer Patients. International Journal of Molecular Sciences. 2021; 22(21):11563. https://doi.org/10.3390/ijms222111563
Chicago/Turabian StylePawłowska, Anna, Agnieszka Kwiatkowska, Dorota Suszczyk, Agata Chudzik, Rafał Tarkowski, Bartłomiej Barczyński, Jan Kotarski, and Iwona Wertel. 2021. "Clinical and Prognostic Value of Antigen-Presenting Cells with PD-L1/PD-L2 Expression in Ovarian Cancer Patients" International Journal of Molecular Sciences 22, no. 21: 11563. https://doi.org/10.3390/ijms222111563
APA StylePawłowska, A., Kwiatkowska, A., Suszczyk, D., Chudzik, A., Tarkowski, R., Barczyński, B., Kotarski, J., & Wertel, I. (2021). Clinical and Prognostic Value of Antigen-Presenting Cells with PD-L1/PD-L2 Expression in Ovarian Cancer Patients. International Journal of Molecular Sciences, 22(21), 11563. https://doi.org/10.3390/ijms222111563