Article

PODNL1 Methylation Serves as a Prognostic Biomarker and Associates with Immune Cell Infiltration and Immune Checkpoint Blockade Response in Lower-Grade Glioma

1
Cure Brain Cancer Biomarkers and Translational Research Group, Prince of Wales Clinical School, University of New South Wales, Sydney, NSW 2031, Australia
2
Adult Cancer Program, Lowy Cancer Research Centre, UNSW Sydney, Randwick, NSW 2031, Australia
3
Faculty of Medicine, University of New South Wales, Randwick, NSW 2031, Australia
4
Garvan-Weizmann Centre for Cellular Genomics, Garvan Institute of Medical Research, Darlinghurst, Sydney, NSW 2010, Australia
5
Centre for Minimally Invasive Neurosurgery, Prince of Wales Private Hospital, Randwick, NSW 2031, Australia
*
Author to whom correspondence should be addressed.
Int. J. Mol. Sci. 2021, 22(22), 12572; https://doi.org/10.3390/ijms222212572
Submission received: 15 October 2021 / Revised: 15 November 2021 / Accepted: 18 November 2021 / Published: 22 November 2021
(This article belongs to the Special Issue Molecular Drivers of Responsiveness to Cancer Immunotherapy)

Abstract

:
Lower-grade glioma (LGG) is a diffuse infiltrative tumor of the central nervous system, which lacks targeted therapy. We investigated the role of Podocan-like 1 (PODNL1) methylation in LGG clinical outcomes using the TCGA-LGG transcriptomics dataset. We identified four PODNL1 CpG sites, cg07425555, cg26969888, cg18547299, and cg24354933, which were associated with unfavorable overall survival (OS) and disease-free survival (DFS) in univariate and multivariate analysis after adjusting for age, gender, tumor-grade, and IDH1-mutation. In multivariate analysis, the OS and DFS hazard ratios ranged from 0.44 to 0.58 (p < 0.001) and 0.62 to 0.72 (p < 0.001), respectively, for the four PODNL1 CpGs. Enrichment analysis of differential gene and protein expression and analysis of 24 infiltrating immune cell types showed significantly increased infiltration in LGGs and its histological subtypes with low-methylation levels of the PODNL1 CpGs. High PODNL1 expression and low-methylation subgroups of the PODNL1 CpG sites were associated with significantly increased PD-L1, PD-1, and CTLA4 expressions. PODNL1 methylation may thus be a potential indicator of immune checkpoint blockade response, and serve as a biomarker for determining prognosis and immune subtypes in LGG.

1. Introduction

Lower-grade gliomas (LGGs) are diffusely infiltrative tumors of the central nervous system (CNS), which consist of WHO grades II and III astrocytomas and oligodendrogliomas [1,2]. Adult LGGs typically affect young patients with a mean age of 41 [3], and are ultimately fatal with a median overall survival between 4 and 13 years [4]. Over the past 30 years, there has been no significant improvement in LGG clinical outcome [3], and with increasing recent knowledge of distinct molecular subgroups within LGGs and its histological subtypes [5,6,7,8], there is a need to identify therapeutically targetable drivers of tumor aggressiveness and malignant transformation. Currently, ongoing clinical trials are underway for targeting the well-established diagnostic and prognostic biomarker isocitrate dehydrogenase 1/2 (IDH1/2) mutation [9,10,11]. There is no molecular targeted therapy under development for the more aggressive IDH1/2 wildtype LGGs [11,12], or the aggressive subgroup within IDH1/2 mutant LGGs [13,14]. Thus, there is a need to identify biomarkers associated with LGG aggressiveness that may serve as therapeutic targets and facilitate the discovery of efficacious treatment options for LGG.
Podocan Like 1 (PODNL1) is a member of the small leucine-rich proteoglycan (SLRP) family [15], and it belongs to the Class V non-canonical class of SLRPs in particular [16,17]. It is highly expressed in tissues and bones [15] and high-grade gliomas [18]. A recent study reported the unfavorable effects of PODNL1 overexpression in glioma overall survival [19]. It has also been reported as a prognostic marker in ovarian cancer [20]. However, the mechanisms of these effects or the PODNL1 regulation machinery remained unknown, as the exploration and characterization of this gene are still in its dawn.
As the frequent IDH1/2 mutation induces global DNA hypermethylation, commonly known as glioma CpG island methylator phenotype (G-CIMP) in LGG [6], in this study, we first investigated the correlation between PODNL1 methylation and PODNL1 mRNA expression in TCGA-LGG to determine whether PODNL1 expression is epigenetically regulated, and identified specific methylated CpG islands that significantly correlate with PODNL1 mRNA expression. We next determined the prognostic effects of PODNL1 mRNA overexpression in LGG disease-free survival (DFS) in order to elucidate its potential role in affecting LGG aggressiveness. We also performed comprehensive overall and disease-free univariate and multivariate survival analysis based on individual PODNL1 CpG site methylations to identify significantly prognostic PODNL1 CpGs. Lastly, we performed differential gene and protein expression analysis based on the methylation levels of all significant CpGs individually, in order to shed light on the mechanism involved in driving LGG aggressiveness, which revealed significant differences in tumor immune microenvironment, thus we further investigated the potential response to immune checkpoint blockade therapies based on methylation subgroups.

2. Results

2.1. PODNL1 Expression and Methylation in LGG

To investigate the differential expression of PODNL1 in LGG, PODNL1 protein expression in normal brain tissues and LGG tissues was compared using immunohistochemical data from the Human Protein Atlas (Figure 1A). Normal brain tissues showed moderate expression of PODNL1 protein in the neuronal cells and weak expression in glial cells. In the two LGG samples analyzed, PODNL1 protein was underexpressed in LGG compared with the two normal brain tissues. Notably, one LGG sample showed particular underexpression of PODNL1 protein compared with the other LGG sample. Thus, intertumoral heterogeneity of PODNL1 expression may exist between LGG samples, depending on unknown factors, and it is possible that there are subgroups of LGGs with high and low PODNL1 expression. As IDH1 mutation, which is highly frequent in up to 70–90% LGGs [11,12], plays a role in inducing global DNA hypermethylation [6], we investigated the methylation levels of PODNL1 CpG islands in TCGA-LGG and found hypermethylation in multiple CpGs in this gene. Methylation patterns of the twelve most hypermethylated PODNL1 CpGs are visualized in Figure 1B. To further examine the potential role of PODNL1 CpG methylations in regulating PODNL1 expression, we determined the correlation between CpG site methylation levels (beta-values) and PODNL1 mRNA expression (RSEM+1). Significant negative correlations between PODNL1 CpG methylations and mRNA expressions were observed in multiple cases with Spearman’s rho correlation coefficients ranging from −0.072 to −0.53 (p < 0.05). Scatterplots of CpG methylations correlating with PODNL1 mRNA with a Spearman’s rho correlation coefficient of −0.28 or below are presented in Figure 1(Ci–Cxii), while data for other CpGs with weaker correlation coefficients are presented in Supplementary Figure S1. These results indicate that methylation of PODNL1 CpG sites is potentially involved in the downregulation of PODNL1 mRNA expressions in varying degrees in LGG.

2.2. Association between PODNL1 Aberrations and Tumor Aggressiveness in LGG

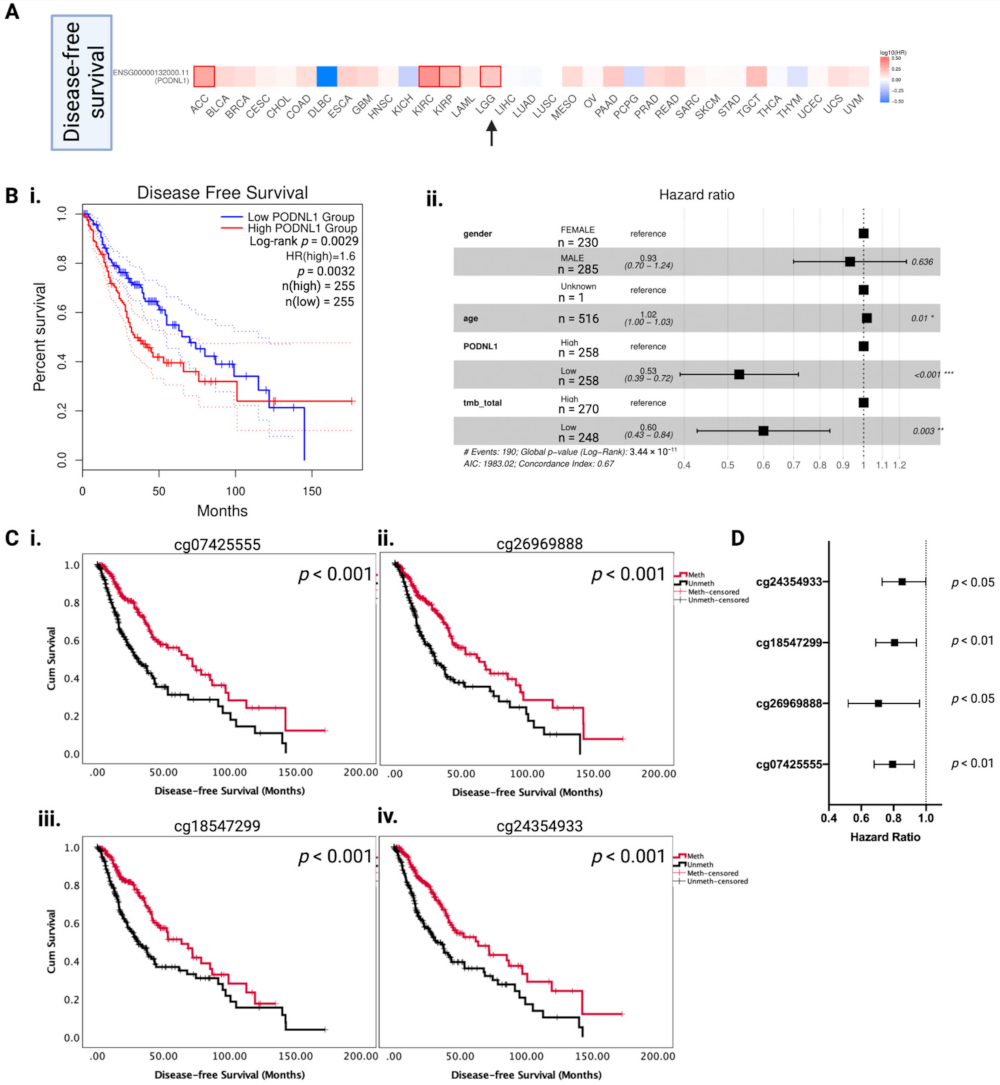
Previously, PODNL1 mRNA overexpression was reported to be associated with unfavorable OS in LGG and glioblastoma [19]. As DFS indicates tumor aggressiveness through faster recurrence, we firstly analyzed the prognostic effects of PODNL1 mRNA in the DFS of all TCGA cancers (Figure 2A), where PODNL1 mRNA overexpression was associated with significantly unfavorable DFS in four TCGA cancers including ACC, KIRC, KIRP, and LGG. These prognostic effects in LGG DFS were further examined with Kaplan–Meier survival analysis where the high PODNL1 mRNA group showed a median DFS of 30 months versus 60 months in the low PODNL1 mRNA group (p < 0.01; Figure 2Bi). Multivariate survival analysis confirmed the independent unfavorable prognostic effects of PODNL1 mRNA overexpression in LGG (Figure 2Bii). As we found a significant association between methylation of PODNL1 CpG sites and mRNA expression, we investigated whether the methylation of these particular CpGs affects the PODNL1 prognostic effects, and performed univariate and multivariate survival analysis (DFS and OS) adjusting for patient age, gender, tumor grade, and IDH1 mutation status (Table 1).
We found that 15 CpG methylations were associated with significantly longer OS, of which 12 CpG methylations were associated with significantly longer DFS in univariate analysis. In multivariate analysis, 7 CpG (cg07425555, cg19921355, cg24354933, cg11802027, cg11453058, cg26969888, and cg18547299) methylations significantly affected LGG OS, of which 4 CpG methylations (cg07425555, cg26969888, cg18547299, and cg24354933) were significant prognostic factors in LGG DFS. The Kaplan–Meier survival curves for CpGs that are significantly prognostic after adjusting for age, gender, tumor grade, and IDH1 mutation are presented in Figure 2(Ci–Civ) for DFS along with forest plot visualization of hazard ratios with 95% CI in Figure 2D. For cg07425555 (Figure 2Ci), the median DFS of high methylation (“Meth”) versus low methylation (“Unmeth”) was 72 (52–91) months versus 31 (21–40) months (p < 0.001). For cg26969888, the median DFS of Meth versus Unmeth was 63 (44–83) months versus 30 (22–37) months (p < 0.001). For cg18547299, the median DFS of Meth versus Unmeth was 63 (44–82) months versus 31 (22–39) months (p < 0.001). For cg24354933, the median DFS of Meth versus Unmeth was 63 (41–86) months versus 32 (25–40) months (p < 0.001). Thus, between these CpGs, the median DFS ranged from 63 to 72 months for Meth versus 31 to 32 months for Unmeth, and these significant differences in DFS confirm the association between low methylation in these CpG sites and increased tumor aggressiveness.
We further investigated the association between these PODNL1 CpG methylation levels (beta-values) and the histological subtypes and grades of LGG (Supplementary Figure S2). In oligodendroglioma, there was no significant difference in CpG methylation levels between grade II and grade III for all four CpGs. In astrocytoma, CpG methylation levels were significantly lower in grade III compared with grade II for all four CpGs (p < 0.001). This indicates the possible demethylation of PODNL1 during grade progression and its role in astrocytoma aggressiveness.
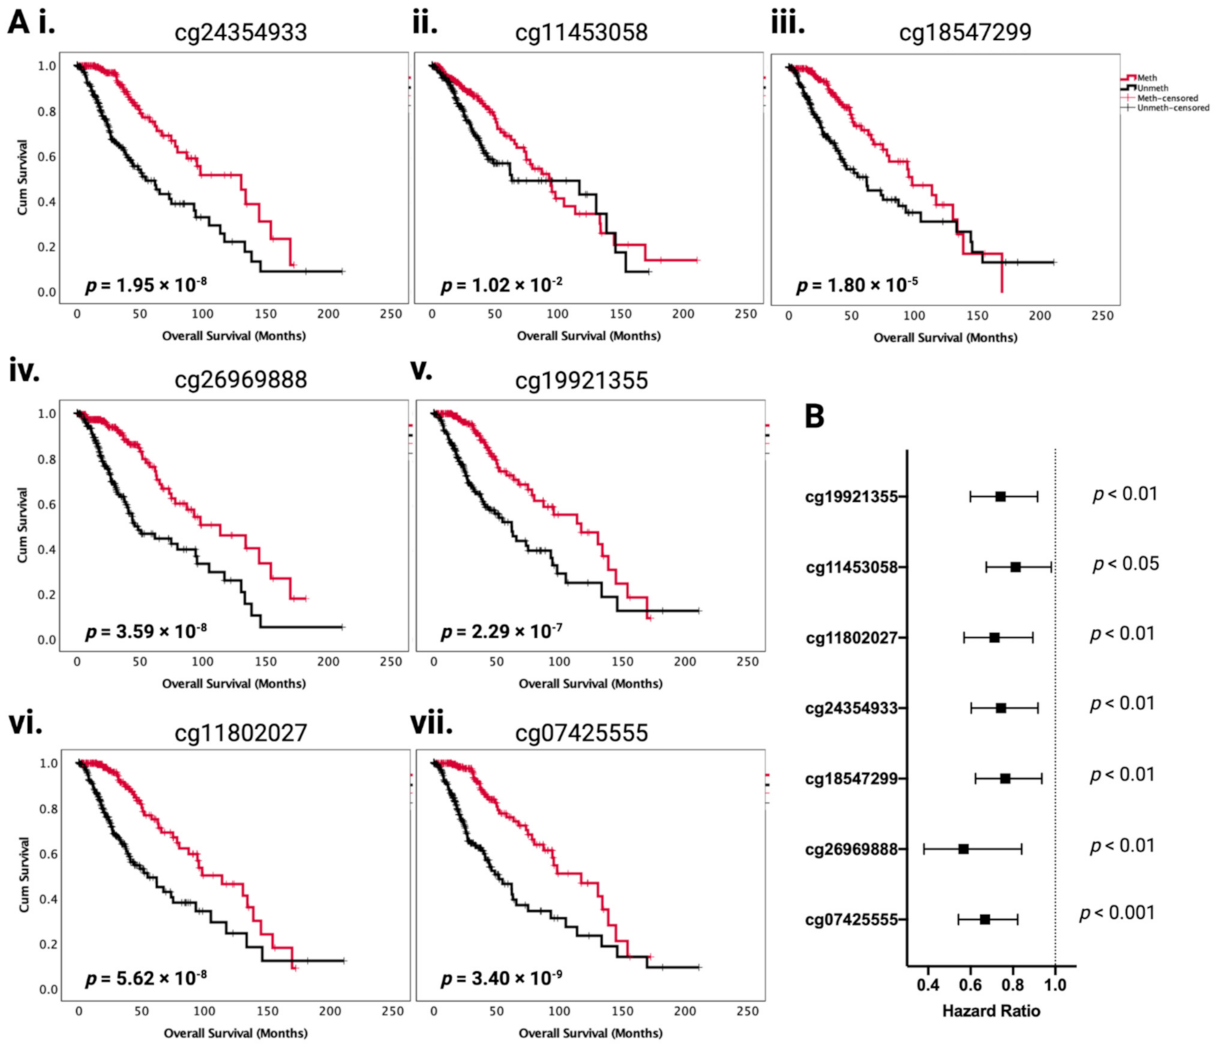
These prognostic effects in DFS are mirrored in the OS analysis, where cg07425555 Meth showed a median OS of 117 (84–150) months versus 52 (35–68) months in Unmeth, cg26969888 Meth showed 114 (71–156) months versus 46 (27–64) in Unmeth, cg18547299 Meth showed 98 (63–132) months versus 61 (39–84) in Unmeth, and cg24354933 Meth showed 130 (70–190) months versus 54 (37–72) months in Unmeth (p < 0.001 or p < 0.01 for all). Three additional CpG sites compared with DFS were significant prognostic factors for OS in multivariate analysis, which also showed the same prognostic patterns (Figure 3((Ai–Avii); Table 1). The hazard ratios with 95% CI are visualized in a forest plot in Figure 3B. Within the IDH1 mutant LGG histological subtypes analysed separately for grade II and grade III tumours (Supplementary Figure S3), cg26969888 was a significant prognostic factor for OS in both grade II and grade III oligodendroglioma, as well as in grade III astrocytoma. In grade II IDH1 mutant astrocytoma, cg07425555 and cg24354933 were significant prognostic factors for OS. Our results are concordant with and validate the known association between PODNL1 mRNA overexpression and unfavorable OS in glioma [19], as we show that methylation of PODNL1 is associated with decreased PODNL1 expression, and specific PODNL1 CpG methylations are associated with significantly improved OS. Thus, PODNL1 methylation is an important occurrence in LGG, which affects disease aggressiveness and clinical outcome. In particular, a set of four CpGs (cg07425555, cg26969888, cg18547299, and cg24354933) may be of importance, as they show significant independent prognostic effects in both OS and DFS, after adjustments for age, gender, tumor grade, and IDH1 mutation in multivariate analysis.

2.3. A Subset of LGGs with Low PODNL1 Methylation Is Associated with Increased Immune Cell Infiltration in the Tumor Microenvironment

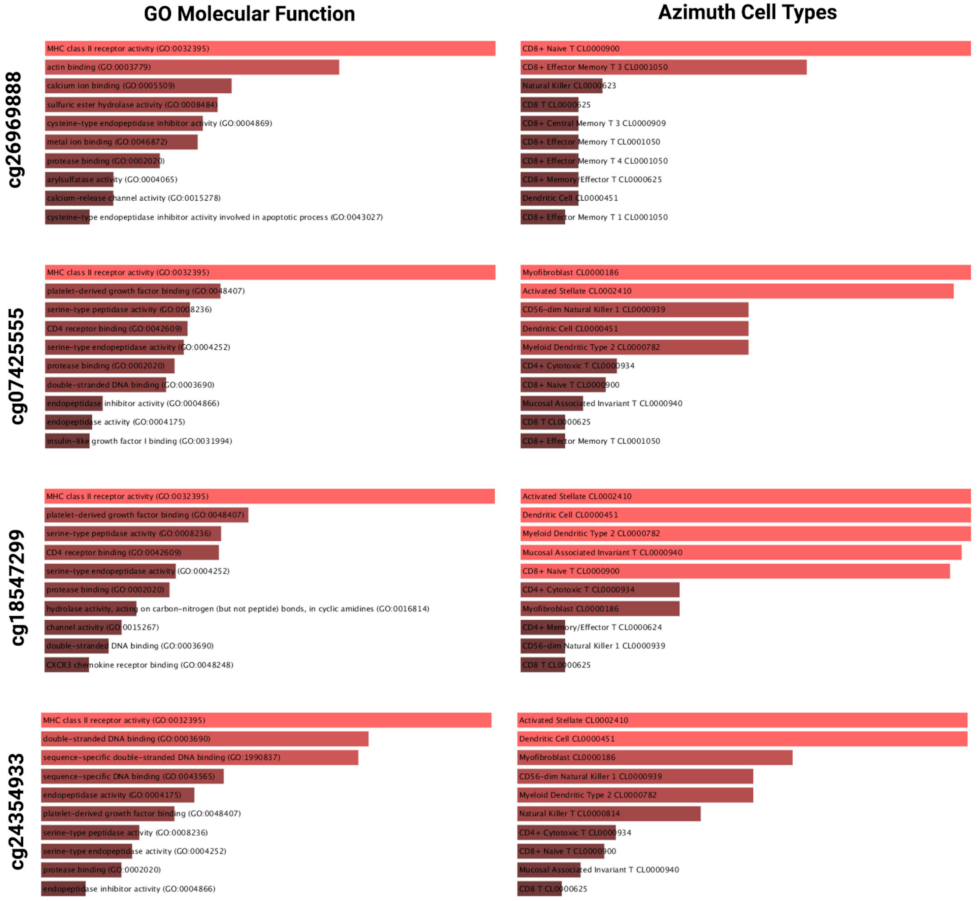
To elucidate the possible mechanisms associated with the increased tumor aggressiveness in the low methylation of specific CpGs, we determined the differentially expressed genes (DEGs) between high and low methylated groups of each of the four significant CpGs that showed significant prognostic effects in the OS and DFS of LGGs in multivariate analysis. The top 1000 genes upregulated in the low methylation group of each CpG were analyzed for enriched GO term, molecular pathways, and cell types. The enriched GO molecular functions and Azimuth cell types are presented in Figure 4 (the corresponding data for the high methylation group are presented in Supplementary Figure S4). For all four CpGs, the low methylation group was most significantly associated with the GO term enrichment of MHC class II receptor activity (GO:0032395), and for two CpGs, there was enrichment of CD4 receptor binding (GO:0042609) (Figure 4). The cell types enriched in these low methylation groups were predominantly immune cells for all CpGs, including different types of T cells, dendritic cells, and natural killer cells (Figure 4). In contrast, in the groups with high methylation of these CpGs, significant enrichments related to RNA binding (GO:0003723) and ligand-gated channel activity (GO:0022834), and cell types related to oligodendroglial precursor cell (CL0002453) were present (Supplementary Figure S4).
WikiPathway and KEGG pathway analysis of the DEGs showed significant enrichments of inflammatory response pathway (WP453) and other immune-related pathways in all low methylation groups of each CpG type (Supplementary Figure S5). In the high methylation groups, significant enrichments of pathways involved nicotine addiction, neuro-active ligand–receptor interaction, ribosome, and other non-oncogenic pathways. Descartes cell type analysis showed enrichment of lymphoid cells and stromal cells in low methylation groups for all CpGs, and neurons and oligodendrocytes in the high methylation groups for all CpGs (Supplementary Figure S5).
Collectively, these results indicate that, in LGGs with low methylation levels of these CpGs, there may be enrichments of immune cells in the tumor microenvironment and activated inflammatory response pathways. Whereas, in LGGs with high methylation levels of these CpGs, non-oncogenic cells and functions are enriched. These results support the findings of unfavorable survival associated with low methylation of these CpGs in LGG, as immunity-high LGGs have been reported to show higher tumor stemness and epithelial–mesenchymal transition scores, leading to unfavorable survival [21,22].
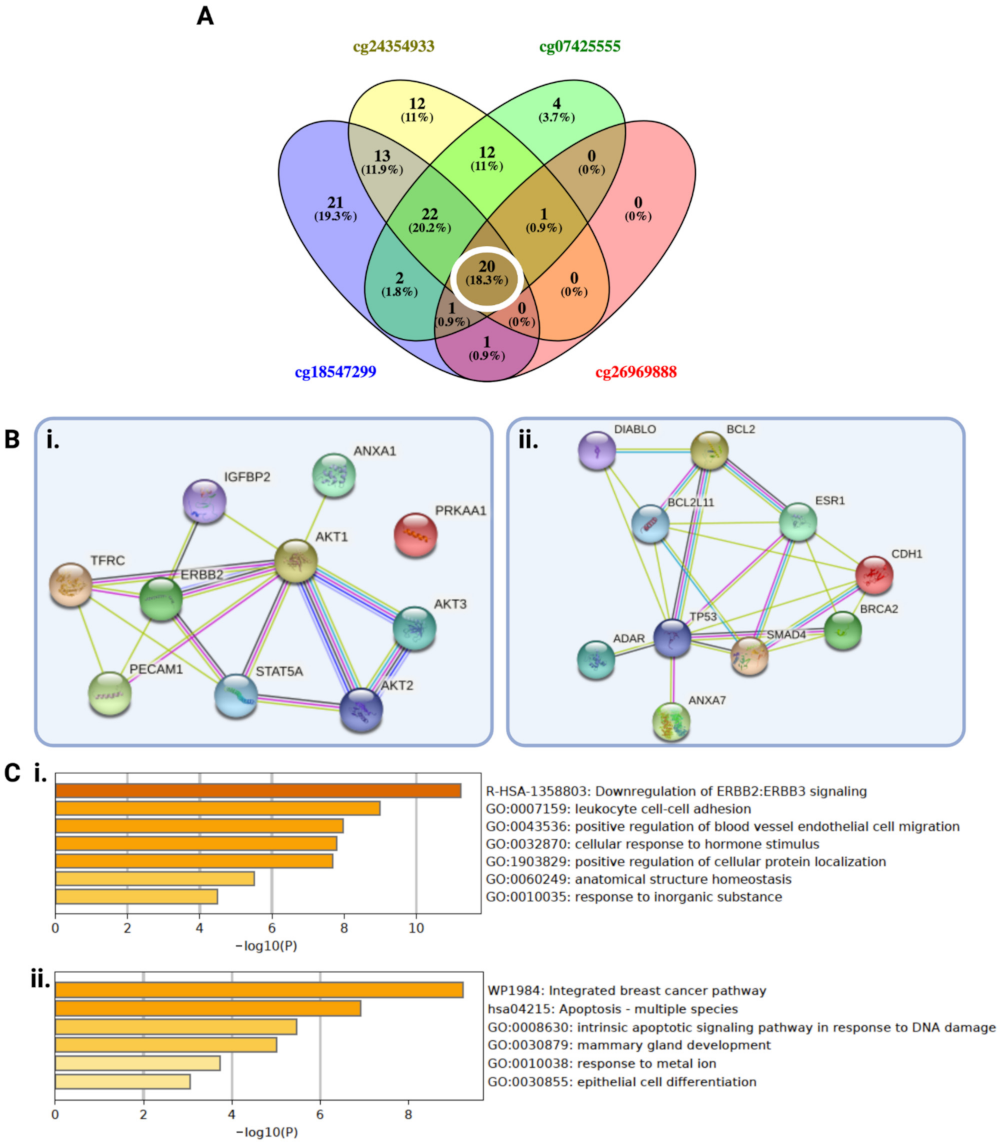
As significantly differentially expressed proteins and PPI network analysis can shed light on the protein networks involved in the different behavior of the tumor, we identified twenty common differentially expressed proteins that are significantly upregulated in the low methylation groups (ten proteins) and the high methylation groups (ten proteins) of all four CpGs (Figure 5A). The identification of these common proteins upregulated in the low methylation group suggests that the mechanism of prognostication may be similar among all four significant CpGs. We performed and visualized the PPI network analysis for upregulated proteins in low and high groups separately in STRING (Figure 5(Bi,Bii)), which showed the significant interactions between these proteins.
Enrichment analysis of upregulated proteins in low methylation groups of CpGs showed the most significant GO term enrichment of leukocyte cell–cell adhesion (Figure 5Ci), which is associated with immune response, thus reflecting the findings from DEGs’ analysis. Apoptosis, apoptosis signalling pathway in response to DNA damage, and epithelial cell differentiation were enriched in the high methylation group, potentially reflecting the inherent lower aggressiveness of these LGGs (Figure 5Cii). These results further support the survival analysis and DEG analysis, and suggest the association between immune cell infiltration and low PODNL1 methylation groups.
The PPI network of AKT1, AKT2, AKT3, ERBB2, and STAT5A was particularly strongly connected in the low PODNL1 methylation group (Figure 5Bi) and there was enrichment of the reactome pathway, upstream of the AKT signaling pathway, related to downregulation of ERBB2/ERBB3 signaling (Figure 5Ci).
We explored the association between PODNL1 methylation levels and a range of immune cell infiltration levels across TCGA cancers (Figure 6A). A clear negative correlation between immune cell infiltration and PODNL1 methylation in LGG and PRAD was observed. A significant negative correlation between LGG PODNL1 methylation and 27 out of 28 immune cells was observed (Figure 6A). We found enrichment of immune-related MHC class II receptor activity in the DEG analysis, thus we also investigated the correlation between PODNL1 methylation and MHC class II molecules (Figure 6B). In accordance with the other findings, we observed a significant negative correlation between PODNL1 methylation and all 21 MHC class II molecules analyzed (Figure 6B). These findings suggest that PODNL1 may play a role in immune infiltration in LGG; however, it may not be involved in the immune microenvironment of other cancers. Further studies incorporating tumor histological and molecular subtypes and tumor grades are required to investigate its potential immunomodulatory role in other cancers.
We found a significant association between LGG immune subtypes [23] and PODNL1 mRNA expression, where high PODNL1 mRNA expression (potentially corresponding to low methylation) was associated with “C3: inflammatory” subtype, moderate PODNL1 mRNA expression was associated with “C4: lymphocyte depleted” subtype, and low PODNL1 mRNA expression was associated with “C5: immunologically quiet” subtype (Figure 6C).
A significant association between immune cell infiltration and all of the four prognostic CpGs were observed for multiple immune infiltrates including CD4+ T cells, CD8+ T cells, dendritic cells, and natural killer cells (Figure 6D–G). Data for other immune infiltrates are presented in Supplementary Figure S6. In all significant observations, the immune infiltrate level was higher in lower methylation groups of these CpGs.
We further investigated the immune cell infiltration levels of 24 immune cell types within PODNL1 high/low oligodendroglioma and astrocytoma separately for all four CpGs, and found that there was increased immune cell infiltration in the low methylation groups of these CpGs within both LGG subtypes (Supplementary Figure S7 and S8). In astrocytoma, the majority of the 24 immune cell types were significantly increased in the low methylation subgroups of the four CpGs, whereas in oligodendroglioma, the number of infiltrating immune cell types was lower than in astrocytoma, and depended on the specific CpG site.
Collectively, these results strongly support the potential high immune cell infiltration and inflammatory response activity in LGGs with low PODNL1 methylation levels. It is possible that the observed unfavorable prognosis and tumor aggressiveness associated with low PODNL1 methylation/high PODNL1 expression is related to the enrichment of immune cell infiltration in the tumor microenvironment, as previous reports identified shorter glioma survival in patients with high immune infiltration [21,22,23,24,25].

2.4. PODNL1 Methylation May Affect Immune Checkpoint Blockade Response in LGG

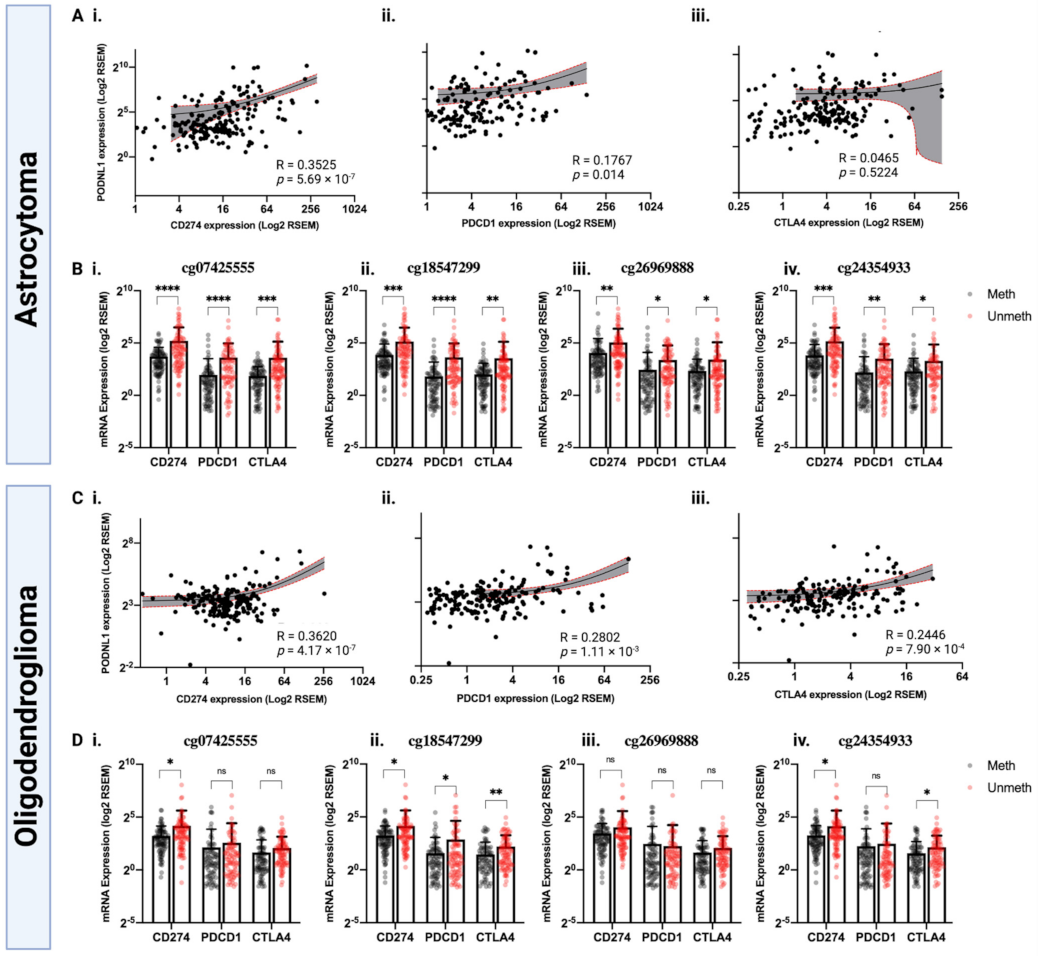
As the methylation status of specific PODNL1 CpGs showed strong associations with immune cell infiltration, we investigated the potential efficacy of immune checkpoint blockade (PD-L1, PD-1, and CTLA4) in groups of TCGA-LGG histological subtypes, astrocytoma and oligodendroglioma, based on PODNL1 expression and CpG methylation status (Figure 7). In astrocytoma, PODNL1 expression showed significant positive correlations with PD-1 and PD-L1 expression (Figure 7(Ai,Aii)). Low methylated groups of all of the four PODNL1 CpG sites showed significantly increased expression of PD-1, PD-L1, and CTLA4, compared with the high methylated groups (Figure 7(Bi–Biv)). In oligodendroglioma, there was significant positive correlation between PODNL1 expression and the expression of all three immunotherapeutic targets (Figure 7(Ci–Ciii)). The association between PODNL1 CpG methylation status and the three immunotherapeutic targets in oligodendroglioma depended on the specific CpG sites, with no association observed for cg26969888, significantly higher expression of only PD-L1 in low methylated cg07425555, significantly higher expression of PD-L1 and CTLA4 in low methylated cg24354933, and significantly higher expression of all three targets in low methylated cg18547299 (Figure 7(Di–Div)).
Collectively, these results indicate that PODNL1 methylation may affect immune checkpoint blockade therapy response in both astrocytoma and oligodendroglioma in varying degrees. Additionally, the methylation levels of cg07425555, cg26969888, cg18547299, and cg24354933 can potentially serve as biomarkers for strategizing immune checkpoint blockade therapy in LGG.

3. Discussion

In this study, we investigated the potential role of an SLRP class V member, PODNL1, in determining LGG aggressiveness. It is a largely uncharacterized and understudied gene; however, its high expression in high-grade glioma [18] and its role as a prognostic factor in high and low-grade gliomas [19,26] and ovarian cancers [27] warranted a comprehensive analysis of its influence in LGG aggressiveness, which this study has conducted. We have found that PODNL1 overexpression is associated with a significantly more unfavorable DFS, thus PODNL1 overexpressed LGGs recurred at a faster rate than underexpressed PODNL1. This finding complements the OS analysis carried out by Geng et. al., where PODNL1 overexpression was associated with a significantly shorter OS [19].
As little is known about PODNL1 mRNA regulation, we investigated the role of PODNL1 methylation in regulating gene expression, particularly owing to the high frequency of IDH1 mutation in LGGs [11], which is associated with global DNA hypermethylation [6]. We reported multiple CpGs that showed significant negative correlations with PODNL1 mRNA expression in the TCGA-LGG dataset. CpG methylation has been commonly associated with gene expression silencing in normal and cancer cells [28,29,30,31]. Thus, it is possible that PODNL1 mRNA expression is epigenetically regulated in LGG. A comprehensive survival analysis revealed four PODNL1 CpGs (cg07425555, cg26969888, cg18547299, and cg24354933) that were significant independent prognostic factors for both OS and DFS in multivariate analysis (adjusted for age, gender, tumor grade, and IDH1 mutation status), where low methylation levels were associated with a more unfavorable clinical outcome. Methylations in these CpGs negatively correlate with PODNL1 mRNA expression in LGG, thus our findings are concordant with the previous report of improved OS in PODNL1-underexpressed LGGs [19]. Furthermore, their significant associations with LGG DFS suggest that low methylation of these CpGs may contribute to LGG aggressiveness. The relationship between global demethylation patterns in recurrent gliomas and tumor aggressiveness has been reported previously [32], and particular demethylation patterns were noted in tumors that exhibited malignant transformation [33]. However, the influences of individual genes methylations, and particularly specific CpG methylations, are important to be elucidated in order to potentially find therapeutic targets, as the prognostic roles of particular gene methylations may be opposing in nature, complicating the efficacies of demethylating therapeutic agents such as 5-Azacytidine [34,35,36,37,38,39]. Our study elucidates the importance of specific PODNL1 CpG methylations in LGG aggressiveness, which may potentially facilitate the development of targeted therapy.
Our findings from the differential gene and protein expression analysis suggest that the aggressive tumor behavior in hypomethylated PODNL1 CpGs may involve increased inflammatory pathways and immune cell infiltration levels. Further analysis of the association between the four significant CpGs and immune cell infiltration levels confirmed the significant enrichment of a range of immune infiltrates in low-methylated groups of all four CpGs. Specific CpG methylations have previously been associated with immune cell infiltration levels (thoroughly reviewed by Bacolod et. al, 2020) [40]. Increased immune cell infiltration levels are linked to heightened tumor aggressiveness in a range of cancers including breast cancer, kidney renal clear cell carcinoma, uveal melanoma, pancreatic cancer, and osteosarcoma [41,42,43,44,45,46,47,48]. In gliomas, including LGG, increased immune cell infiltration levels showed poor prognosis and more aggressive phenotypes [21,22,49,50,51,52,53,54,55,56,57]. Thus, we report that low PODNL1 methylation, specifically of CpG sites cg07425555, cg26969888, cg18547299, and cg24354933, may be a key factor in the modulation of immune infiltrates in the LGG tumor microenvironment, affecting its aggressiveness and prognosis.
Another factor that may determine LGG aggressiveness in low methylation groups of these PODNL1 CpGs could involve the AKT signaling pathway, which we found to be enriched in this group, as previous studies reported the association between phosphorylation of AKT and glioma aggressiveness [58,59,60,61].
Lastly, we showed that high PODNL1 expression subgroups and low methylation subgroups of the identified PODNL1 CpGs within the histological subtypes of LGG may be particularly responsive to immune checkpoint blockade therapy; however, in vitro and in vivo studies are warranted to confirm these findings. Thus, PODNL1 CpG methylation may also be a potential biomarker for LGG immune subtypes and immune checkpoint blockade response prediction.

4. Materials and Methods

4.1. Tumor Cohort

The Cancer Genome Atlas (TCGA) lower-grade glioma (LGG) was used for analysis in this study. Clinical and mutational data for the LGG tumors were downloaded from the cBioPortal platform (www.cbioportal.org, accessed on 7 September 2021). Duplicate samples were removed where more than one sample existed for a patient, and the total cohort size with the required clinical information available was n = 508. The median age of the TCGA-LGG cohort was 41 (14–87) and the male/female ratio was 1.2/1.

4.2. PODNL1 Expression and Methylation Analysis

Normal brain and LGG PODNL1 protein expression in the form of immunohistochemistry data was queried and retrieved from the Human Protein Atlas (www.proteinatlas.org, accessed on 15 September 2021).
PODNL1 methylation data were explored in MethSurv [62] and TCGA-Wanderer [63] to identify commonly methylated PODNL1 CpG sites in LGG. CpG site methylations with statistically significant correlation (p < 0.05) with PODNL1 mRNA expression were identified through correlation scatterplots in TCGA-Wander [63]. Methylation beta values for each PODNL1 CpG site in TCGA LGG samples, which significantly correlated with PODNL1 mRNA, were downloaded from SMART App [64].

4.3. Survival Analysis

Disease-free survival (DFS) was termed in this study as the period of time from the patient’s primary treatment end until the date of relapse or censored at last follow-up. Overall survival (OS) was termed as the period of time the patient survived from the date of diagnosis until the date of death (or censored at the last follow update). Survival analysis was performed using the Kaplan–Meier survival method and Cox proportional hazard’s model. Statistical significance was determined by a log-rank p-value of less than 0.05.
Survival analysis of DFS based on PODNL1 mRNA expression (median cut-off) was performed in GEPIA2.0 [65]. Multivariate analysis to determine independent prognostic effects of PODNL1 mRNA expression was performed in CVCDAP [66]. The prognostic effects of PODNL1 mRNA expression across all TCGA cancers were visualized in a heatmap using GEPIA2.0 [65].
For survival analysis (DFS and OS) based on individual methylated CpG sites, median beta-value was used as a cut-off for each methylated CpG site. IBM SPSS version 27 was used to perform Kaplan–Meier and Cox proportional analysis. Multivariate analysis adjusting for age, gender, tumor grade, and IDH1 mutation status was performed in IBM SPSS using Cox proportional hazard’s model. Hazard ratios with 95% confidence interval (95% CI) that are statistically significant were visualized in forest plots generated using GraphPad Prism version 9.

4.4. Differential Gene and Protein Expression Analysis

Median beta value cut-off was used for each prognostically significant CpG site to stratify the TCGA samples into two groups with high (methylated) and low (unmethylated) PODNL1 methylation. Custom groups were created in the cBioPortal platform by importing TCGA sample IDs of methylated and unmethylated groups for each CpG site, separately. Methylated and unmethylated groups for each CpG site were analyzed and compared in cBioPortal to identify significantly differentially expressed genes. The top 1000 most upregulated genes in methylated and the top 1000 most upregulated genes in unmethylated groups were identified with p-values corrected for multiple comparisons using the Benjamini–Hochberg procedure false discovery rate (FDR < 0.01). The gene lists were imported to EnrichR platform [67] for Gene Ontology (GO) term, pathway, and cell-type enrichment analysis in methylated and unmethylated groups separately. GO cellular component, molecular function and biological process, KEGG pathway, WikiPathways, Descartes cell types, and Azimuth cell types enrichments were analyzed for each group of CpGs.
Differential protein expression (p-values corrected for multiple comparisons using the Benjamini–Hochberg procedure; FDR < 0.05) between groups of methylated and unmethylated CpGs (for four significant CpGs) was downloaded from cBioPortal, and proteins that were differentially expressed between methylated and unmethylated groups for all four CpGs were curated. The protein–protein interaction (PPI) network was generated and visualized using STRING (www.string-db.org, accessed on 16 September 2021) by importing the curated list of differentially expressed genes. Proteins upregulated in unmethylated groups and methylated groups were analyzed separately in MetaScape [68] to determine significant GO terms and pathway enrichments within each group.

4.5. Immune Cell Infiltration Analysis

Correlations between PODNL1 methylation and immune cell infiltration levels and MHC class II molecules were analyzed using TISIDB [69]. Associations between individual CpG methylation and immune cell infiltration levels were analyzed using LGG transcriptomics data retrieved from cBioPortal and ImmuCellAI [70]. PODNL1 mRNA expression within each immune subtype [23] of TCGA LGG was visualized and analyzed in TISIDB [69].

4.6. Immune Checkpoint Blockade (ICB) Therapy Response Prediction

TCGA-LGG transcriptomics data were retrieved from cBioPortal, and expression data for PODNL1, PD-1, PD-L1, and CTLA4 were extracted for astrocytoma and oligodendroglioma samples. Methylation beta values for each CpG site were retrieved from SMART App [64]. Using beta value median cut-off, the TCGA-LGG histological subtype samples were stratified by “meth” (high methylation) and “unmeth” (low methylation) groups of CpG sites. Correlation and association between PODNL1 expression and PODNL1 CpG methylation, respectively, were then analyzed in GraphPad Prism v9 (San Diego, CA, USA).

Supplementary Materials

The following are available online at https://www.mdpi.com/article/10.3390/ijms222212572/s1.

Author Contributions

Conceptualization, methodology, formal analysis, visualization, and writing—original draft preparation H.N.; writing—review and editing—final version preparation, A.Z., C.T., and M.E.S. All authors have read and agreed to the published version of the manuscript.

Funding

This research received no external funding.

Institutional Review Board Statement

Not applicable.

Informed Consent Statement

Not applicable.

Data Availability Statement

All data accessed in this study are available on publicly available databases as described in Section 4.

Acknowledgments

We thank TCGA and cBioPortal for the LGG clinical and transcriptomics data.

Conflicts of Interest

The authors declare no conflict of interest.

References

  1. Tom, M.C.; Cahill, D.P.; Buckner, J.C.; Dietrich, J.; Parsons, M.W.; Yu, J.S. Management for Different Glioma Subtypes: Are All Low-Grade Gliomas Created Equal? Am. Soc. Clin. Oncol. Educ. Book 2019, 39, 133–145. [Google Scholar] [CrossRef]
  2. Louis, D.N.; Perry, A.; Reifenberger, G.; von Deimling, A.; Figarella-Branger, D.; Cavenee, W.K.; Ohgaki, H.; Wiestler, O.D.; Kleihues, P.; Ellison, D.W. The 2016 World Health Organization Classification of Tumors of the Central Nervous System: A summary. Acta Neuropathol. 2016, 131, 803–820. [Google Scholar] [CrossRef] [Green Version]
  3. Claus, E.B.; Walsh, K.M.; Wiencke, J.K.; Molinaro, A.M.; Wiemels, J.L.; Schildkraut, J.M.; Bondy, M.L.; Berger, M.; Jenkins, R.; Wrensch, M. Survival and low-grade glioma: The emergence of genetic information. Neurosurg. Focus 2015, 38, E6. [Google Scholar] [CrossRef] [PubMed]
  4. Miller, J.J.; Wen, P.Y. Emerging targeted therapies for glioma. Expert Opin. Emerg. Drugs 2016, 21, 441–452. [Google Scholar] [CrossRef] [PubMed]
  5. Killela, P.J.; Pirozzi, C.J.; Healy, P.; Reitman, Z.J.; Lipp, E.; Rasheed, B.A.; Yang, R.; Diplas, B.H.; Wang, Z.H.; Greer, P.K.; et al. Mutations in IDH1, IDH2, and in the TERT promoter define clinically distinct subgroups of adult malignant gliomas. Oncotarget 2014, 5, 1515–1525. [Google Scholar] [CrossRef] [Green Version]
  6. Noushmehr, H.; Weisenberger, D.J.; Diefes, K.; Phillips, H.S.; Pujara, K.; Berman, B.P.; Pan, F.; Pelloski, C.E.; Sulman, E.P.; Bhat, K.P.; et al. Cancer Genome Atlas Research, N. Identification of a CpG island methylator phenotype that defines a distinct subgroup of glioma. Cancer Cell 2010, 17, 510–522. [Google Scholar] [CrossRef] [PubMed] [Green Version]
  7. Mur, P.; Mollejo, M.; Ruano, Y.; de Lope, A.R.; Fiano, C.; Garcia, J.F.; Castresana, J.S.; Hernandez-Lain, A.; Rey, J.A.; Melendez, B. Codeletion of 1p and 19q determines distinct gene methylation and expression profiles in IDH-mutated oligodendroglial tumors. Acta Neuropathol. 2013, 126, 277–289. [Google Scholar] [CrossRef] [PubMed]
  8. Cancer Genome Atlas Research Network; Brat, D.J.; Verhaak, R.G.; Aldape, K.D.; Yung, W.K.; Salama, S.R.; Cooper, L.A.; Rheinbay, E.; Miller, C.R.; Vitucci, M.; et al. Comprehensive, Integrative Genomic Analysis of Diffuse Lower-Grade Gliomas. N. Engl. J. Med. 2015, 372, 2481–2498. [Google Scholar]
  9. Popovici-Muller, J.; Lemieux, R.M.; Artin, E.; Saunders, J.O.; Salituro, F.G.; Travins, J.; Cianchetta, G.; Cai, Z.W.; Zhou, D.; Cui, D.W.; et al. Discovery of AG-120 (Ivosidenib): A First-in-Class Mutant IDH1 Inhibitor for the Treatment of IDH1 Mutant Cancers. Acs Med. Chem. Lett. 2018, 9, 300–305. [Google Scholar] [CrossRef] [Green Version]
  10. Kopinja, J.; Sevilla, R.S.; Levitan, D.; Dai, D.; Vanko, A.; Spooner, E.; Ware, C.; Forget, R.; Hu, K.; Kral, A.; et al. A Brain Penetrant Mutant IDH1 Inhibitor Provides In Vivo Survival Benefit. Sci. Rep. 2017, 7, 13853. [Google Scholar] [CrossRef] [Green Version]
  11. Hartmann, C.; Meyer, J.; Balss, J.; Capper, D.; Mueller, W.; Christians, A.; Felsberg, J.; Wolter, M.; Mawrin, C.; Wick, W.; et al. Type and frequency of IDH1 and IDH2 mutations are related to astrocytic and oligodendroglial differentiation and age: A study of 1,010 diffuse gliomas. Acta Neuropathol. 2009, 118, 469–474. [Google Scholar] [CrossRef] [Green Version]
  12. Yan, H.; Parsons, D.W.; Jin, G.; McLendon, R.; Rasheed, B.A.; Yuan, W.; Kos, I.; Batinic-Haberle, I.; Jones, S.; Riggins, G.J.; et al. IDH1 and IDH2 mutations in gliomas. N. Engl. J. Med. 2009, 360, 765–773. [Google Scholar] [CrossRef] [PubMed]
  13. Appay, R.; Dehais, C.; Maurage, C.A.; Alentorn, A.; Carpentier, C.; Colin, C.; Ducray, F.; Escande, F.; Idbaih, A.; Kamoun, A.; et al. CDKN2A homozygous deletion is a strong adverse prognosis factor in diffuse malignant IDH-mutant gliomas. Neuro-Oncology 2019, 21, 1519–1528. [Google Scholar] [CrossRef] [PubMed]
  14. Reis, G.F.; Pekmezci, M.; Hansen, H.M.; Rice, T.; Marshall, R.E.; Molinaro, A.M.; Phillips, J.J.; Vogel, H.; Wiencke, J.K.; Wrensch, M.R.; et al. CDKN2A loss is associated with shortened overall survival in lower-grade (World Health Organization Grades II-III) astrocytomas. J. Neuropathol. Exp. Neurol. 2015, 74, 442–452. [Google Scholar] [CrossRef] [PubMed] [Green Version]
  15. Mochida, Y.; Kaku, M.; Yoshida, K.; Katafuchi, M.; Atsawasuwan, P.; Yamauchi, M. Podocan-like protein: A novel small leucine-rich repeat matrix protein in bone. Biochem. Biophys. Res. Commun. 2011, 410, 333–338. [Google Scholar] [CrossRef] [PubMed] [Green Version]
  16. Schaefer, L.; Iozzo, R.V. Biological functions of the small leucine-rich proteoglycans: From genetics to signal transduction. J. Biol. Chem. 2008, 283, 21305–21309. [Google Scholar] [CrossRef] [Green Version]
  17. Shimizu-Hirota, R.; Sasamura, H.; Kuroda, M.; Kobayashi, E.; Saruta, T. Functional characterization of podocan, a member of a new class in the small leucine-rich repeat protein family. FEBS Lett. 2004, 563, 69–74. [Google Scholar] [CrossRef] [Green Version]
  18. Yan, Y.; Zhang, L.; Xu, T.; Zhou, J.; Qin, R.; Chen, C.; Zou, Y.; Fu, D.; Hu, G.; Chen, J. SAMSN1 is highly expressed and associated with a poor survival in glioblastoma multiforme. PLoS ONE 2013, 8, e81905. [Google Scholar]
  19. Geng, Y.; Zuo, P.; Li, X.O.; Zhang, L. PODNL1 promotes cell proliferation and migration in glioma via regulating Akt/mTOR pathway. J. Cancer 2020, 11, 6234–6242. [Google Scholar] [CrossRef]
  20. Teng, C.; Zheng, H. Low expression of microRNA-1908 predicts a poor prognosis for patients with ovarian cancer. Oncol. Lett. 2017, 14, 4277–4281. [Google Scholar] [CrossRef] [Green Version]
  21. Feng, Q.; Li, L.; Li, M.; Wang, X. Immunological classification of gliomas based on immunogenomic profiling. J. Neuroinflamm. 2020, 17, 360. [Google Scholar] [CrossRef]
  22. Kang, K.; Xie, F.; Wu, Y.; Han, C.; Bai, Y.; Long, J.; Lian, X.; Zhang, F. Genomic instability in lower-grade glioma: Prediction of prognosis based on lncRNA and immune infiltration. Mol. Ther. Oncolyt. 2021, 22, 431–443. [Google Scholar] [CrossRef] [PubMed]
  23. Thorsson, V.; Gibbs, D.L.; Brown, S.D.; Wolf, D.; Bortone, D.S.; Ou Yang, T.H.; Porta-Pardo, E.; Gao, G.F.; Plaisier, C.L.; Eddy, J.A.; et al. The Immune Landscape of Cancer. Immunity 2018, 48, 812–830.e14. [Google Scholar] [CrossRef] [PubMed] [Green Version]
  24. Marinari, E.; Allard, M.; Gustave, R.; Widmer, V.; Philippin, G.; Merkler, D.; Tsantoulis, P.; Dutoit, V.; Dietrich, P.Y. Inflammation and lymphocyte infiltration are associated with shorter survival in patients with high-grade glioma. Oncoimmunology 2020, 9, 1779990. [Google Scholar] [CrossRef] [PubMed]
  25. Zhou, Q.; Yan, X.; Liu, W.; Yin, W.; Xu, H.; Cheng, D.; Jiang, X.; Ren, C. Three Immune-Associated Subtypes of Diffuse Glioma Differ in Immune Infiltration, Immune Checkpoint Molecules, and Prognosis. Front. Oncol. 2020, 10, 586019. [Google Scholar] [CrossRef]
  26. Brennan, C.W.; Verhaak, R.G.; McKenna, A.; Campos, B.; Noushmehr, H.; Salama, S.R.; Zheng, S.; Chakravarty, D.; Sanborn, J.Z.; Berman, S.H.; et al. The somatic genomic landscape of glioblastoma. Cell 2013, 155, 462–477. [Google Scholar] [CrossRef]
  27. Uhlen, M.; Zhang, C.; Lee, S.; Sjostedt, E.; Fagerberg, L.; Bidkhori, G.; Benfeitas, R.; Arif, M.; Liu, Z.; Edfors, F.; et al. A pathology atlas of the human cancer transcriptome. Science 2017, 357, 6352. [Google Scholar] [CrossRef] [Green Version]
  28. Deng, G.; Chen, A.; Hong, J.; Chae, H.S.; Kim, Y.S. Methylation of CpG in a small region of the hMLH1 promoter invariably correlates with the absence of gene expression. Cancer Res. 1999, 59, 2029–2033. [Google Scholar]
  29. Lapidus, R.G.; Ferguson, A.T.; Ottaviano, Y.L.; Parl, F.F.; Smith, H.S.; Weitzman, S.A.; Baylin, S.B.; Issa, J.P.; Davidson, N.E. Methylation of estrogen and progesterone receptor gene 5′ CpG islands correlates with lack of estrogen and progesterone receptor gene expression in breast tumors. Clin. Cancer Res. 1996, 2, 805–810. [Google Scholar]
  30. Strathdee, G.; Davies, B.R.; Vass, J.K.; Siddiqui, N.; Brown, R. Cell type-specific methylation of an intronic CpG island controls expression of the MCJ gene. Carcinogenesis 2004, 25, 693–701. [Google Scholar] [CrossRef] [Green Version]
  31. Zochbauer-Muller, S.; Fong, K.M.; Maitra, A.; Lam, S.; Geradts, J.; Ashfaq, R.; Virmani, A.K.; Milchgrub, S.; Gazdar, A.F.; Minna, J.D. 5′ CpG island methylation of the FHIT gene is correlated with loss of gene expression in lung and breast cancer. Cancer Res. 2001, 61, 3581–3585. [Google Scholar] [PubMed]
  32. de Souza, C.F.; Sabedot, T.S.; Malta, T.M.; Stetson, L.; Morozova, O.; Sokolov, A.; Laird, P.W.; Wiznerowicz, M.; Iavarone, A.; Snyder, J.; et al. A Distinct DNA Methylation Shift in a Subset of Glioma CpG Island Methylator Phenotypes during Tumor Recurrence. Cell Rep. 2018, 23, 637–651. [Google Scholar] [CrossRef] [PubMed]
  33. Mazor, T.; Pankov, A.; Johnson, B.E.; Hong, C.; Hamilton, E.G.; Bell, R.J.A.; Smirnov, I.V.; Reis, G.F.; Phillips, J.J.; Barnes, M.J.; et al. DNA Methylation and Somatic Mutations Converge on the Cell Cycle and Define Similar Evolutionary Histories in Brain Tumors. Cancer Cell 2015, 28, 307–317. [Google Scholar] [CrossRef] [Green Version]
  34. Issa, J.P. DNA methylation as a therapeutic target in cancer. Clin. Cancer Res. 2007, 13, 1634–1637. [Google Scholar] [CrossRef] [PubMed] [Green Version]
  35. Mellai, M.; Piazzi, A.; Caldera, V.; Annovazzi, L.; Monzeglio, O.; Senetta, R.; Cassoni, P.; Schiffer, D. Promoter hypermethylation of the EMP3 gene in a series of 229 human gliomas. Biomed. Res. Int. 2013, 2013, 756302. [Google Scholar] [CrossRef] [PubMed] [Green Version]
  36. Ohka, F.; Natsume, A.; Motomura, K.; Kishida, Y.; Kondo, Y.; Abe, T.; Nakasu, Y.; Namba, H.; Wakai, K.; Fukui, T.; et al. The global DNA methylation surrogate LINE-1 methylation is correlated with MGMT promoter methylation and is a better prognostic factor for glioma. PLoS ONE 2011, 6, e23332. [Google Scholar] [CrossRef] [Green Version]
  37. Qi, C.; Lei, L.; Hu, J.; Wang, G.; Liu, J.; Ou, S. Serine Incorporator 2 (SERINC2) Expression Predicts an Unfavorable Prognosis of Low-Grade Glioma (LGG): Evidence from Bioinformatics Analysis. J. Mol. Neurosci. 2020, 70, 1521–1532. [Google Scholar] [CrossRef]
  38. Sharma, N.; Saxena, S.; Agrawal, I.; Singh, S.; Srinivasan, V.; Arvind, S.; Epari, S.; Paul, S.; Jha, S. Differential Expression Profile of NLRs and AIM2 in Glioma and Implications for NLRP12 in Glioblastoma. Sci. Rep. 2019, 9, 8480. [Google Scholar] [CrossRef] [PubMed]
  39. Zhang, L.; Wang, M.; Wang, W.; Mo, J. Incidence and prognostic value of multiple gene promoter methylations in gliomas. J. Neurooncol. 2014, 116, 349–356. [Google Scholar] [CrossRef]
  40. Bacolod, M.D.; Barany, F.; Fisher, P.B. Can CpG methylation serve as surrogate markers for immune infiltration in cancer? Adv. Cancer Res. 2019, 143, 351–384. [Google Scholar]
  41. Chen, F.; Fan, Y.; Hou, J.; Liu, B.; Zhang, B.; Shang, Y.; Chang, Y.; Cao, P.; Tan, K. Integrated analysis identifies TfR1 as a prognostic biomarker which correlates with immune infiltration in breast cancer. Aging 2021, 13, 21671–21699. [Google Scholar] [CrossRef] [PubMed]
  42. Koirala, P.; Roth, M.E.; Gill, J.; Piperdi, S.; Chinai, J.M.; Geller, D.S.; Hoang, B.H.; Park, A.; Fremed, M.A.; Zang, X.; et al. Immune infiltration and PD-L1 expression in the tumor microenvironment are prognostic in osteosarcoma. Sci. Rep. 2016, 6, 30093. [Google Scholar] [CrossRef]
  43. Liao, G.; Lv, J.; Ji, A.; Meng, S.; Chen, C. TLR3 Serves as a Prognostic Biomarker and Associates with Immune Infiltration in the Renal Clear Cell Carcinoma Microenvironment. J. Oncol. 2021, 2021, 3336770. [Google Scholar] [CrossRef]
  44. Sawe, R.T.; Kerper, M.; Badve, S.; Li, J.; Sandoval-Cooper, M.; Xie, J.; Shi, Z.; Patel, K.; Chumba, D.; Ofulla, A.; et al. Aggressive breast cancer in western Kenya has early onset, high proliferation, and immune cell infiltration. BMC Cancer 2016, 16, 204. [Google Scholar] [CrossRef] [PubMed] [Green Version]
  45. Sun, K.; Zhang, X.D.; Liu, X.Y.; Lu, P. YAP1 is a Prognostic Biomarker and Correlated with Immune Cell Infiltration in Pancreatic Cancer. Front. Mol. Biosci. 2021, 8, 625731. [Google Scholar] [CrossRef]
  46. Tan, P.; Chen, H.; Huang, Z.; Huang, M.; Du, Y.; Li, T.; Chen, Z.; Liu, Y.; Fu, W. MMP25-AS1/hsa-miR-10a-5p/SERPINE1 axis as a novel prognostic biomarker associated with immune cell infiltration in KIRC. Mol. Ther. Oncol. 2021, 22, 307–325. [Google Scholar] [CrossRef] [PubMed]
  47. Wang, B.; Chen, D.; Hua, H. TBC1D3 family is a prognostic biomarker and correlates with immune infiltration in kidney renal clear cell carcinoma. Mol. Ther. Oncol. 2021, 22, 528–538. [Google Scholar] [CrossRef]
  48. Zhao, H.; Chen, Y.; Shen, P.; Gong, L. Identification of Immune Cell Infiltration Landscape and Their Prognostic Significance in Uveal Melanoma. Front. Cell Dev. Biol. 2021, 9, 713569. [Google Scholar] [CrossRef]
  49. Fan, Y.; Peng, X.; Wang, Y.; Li, B.; Zhao, G. Comprehensive Analysis of HDAC Family Identifies HDAC1 as a Prognostic and Immune Infiltration Indicator and HDAC1-Related Signature for Prognosis in Glioma. Front. Mol. Biosci. 2021, 8, 720020. [Google Scholar] [CrossRef]
  50. Ge, X.; Wang, Z.; Jiang, R.; Ren, S.; Wang, W.; Wu, B.; Zhang, Y.; Liu, Q. SCAMP4 is a novel prognostic marker and correlated with the tumor progression and immune infiltration in glioma. Int. J. Biochem. Cell Biol. 2021, 139, 106054. [Google Scholar] [CrossRef]
  51. Gong, X.; Liu, L.; Xiong, J.; Li, X.; Xu, J.; Xiao, Y.; Li, J.; Luo, X.; Mao, D.; Liu, L. Construction of a Prognostic Gene Signature Associated with Immune Infiltration in Glioma: A Comprehensive Analysis Based on the CGGA. J. Oncol. 2021, 2021, 6620159. [Google Scholar] [CrossRef] [PubMed]
  52. Hao, Z.; Guo, D. EGFR mutation: Novel prognostic factor associated with immune infiltration in lower-grade glioma; an exploratory study. BMC Cancer 2019, 19, 1184. [Google Scholar] [CrossRef] [Green Version]
  53. Hu, Z.; Qu, S. EVA1C Is a Potential Prognostic Biomarker and Correlated With Immune Infiltration Levels in WHO Grade II/III Glioma. Front. Immunol. 2021, 12, 683572. [Google Scholar] [CrossRef] [PubMed]
  54. Ju, Q.; Li, X.; Zhang, H.; Yan, S.; Li, Y.; Zhao, Y. NFE2L2 Is a Potential Prognostic Biomarker and Is Correlated with Immune Infiltration in Brain Lower Grade Glioma: A Pan-Cancer Analysis. Oxid. Med. Cell Longev. 2020, 2020, 3580719. [Google Scholar] [CrossRef] [PubMed]
  55. Shi, H.; Song, Y.; Song, Z.; Huang, C. CKMT1B is a potential prognostic biomarker and associated with immune infiltration in Lower-grade glioma. PLoS ONE 2021, 16, e0245524. [Google Scholar] [CrossRef] [PubMed]
  56. Wang, G.; Zhou, H.; Tian, L.; Yan, T.; Han, X.; Chen, P.; Li, H.; Wang, W.; Xiao, Z.; Hou, L.; et al. A Prognostic DNA Damage Repair Genes Signature and Its Impact on Immune Cell Infiltration in Glioma. Front. Oncol. 2021, 11, 682932. [Google Scholar] [CrossRef]
  57. Xiao, M.; Du, C.; Zhang, C.; Zhang, X.; Li, S.; Zhang, D.; Jia, W. Bioinformatics analysis of the prognostic value of NEK8 and its effects on immune cell infiltration in glioma. J. Cell Mol. Med. 2021, 25, 8748–8763. [Google Scholar] [CrossRef]
  58. Annovazzi, L.; Mellai, M.; Caldera, V.; Valente, G.; Tessitore, L.; Schiffer, D. mTOR, S6 and AKT expression in relation to proliferation and apoptosis/autophagy in glioma. Anticancer Res. 2009, 29, 3087–3094. [Google Scholar]
  59. Bhaskara, V.K.; Sundaram, C.; Babu, P.P. pERK, pAkt and pBad: A possible role in cell proliferation and sustained cellular survival during tumorigenesis and tumor progression in ENU induced transplacental glioma rat model. Neurochem. Res. 2006, 31, 1163–1170. [Google Scholar] [CrossRef]
  60. Suzuki, Y.; Shirai, K.; Oka, K.; Mobaraki, A.; Yoshida, Y.; Noda, S.E.; Okamoto, M.; Suzuki, Y.; Itoh, J.; Itoh, H.; et al. Higher pAkt expression predicts a significant worse prognosis in glioblastomas. J. Rad. Res. 2010, 51, 343–348. [Google Scholar] [CrossRef] [Green Version]
  61. Antonelli, M.; Massimino, M.; Morra, I.; Garre, M.L.; Gardiman, M.P.; Buttarelli, F.R.; Arcella, A.; Giangaspero, F. Expression of pERK and pAKT in pediatric high grade astrocytomas: Correlation with YKL40 and prognostic significance. Neuropathology 2012, 32, 133–138. [Google Scholar] [CrossRef]
  62. Modhukur, V.; Iljasenko, T.; Metsalu, T.; Lokk, K.; Laisk-Podar, T.; Vilo, J. MethSurv: A web tool to perform multivariable survival analysis using DNA methylation data. Epigenomics 2018, 10, 277–288. [Google Scholar] [CrossRef] [PubMed] [Green Version]
  63. Diez-Villanueva, A.; Mallona, I.; Peinado, M.A. Wanderer, an interactive viewer to explore DNA methylation and gene expression data in human cancer. Epigenet. Chrom. 2015, 8, 22. [Google Scholar] [CrossRef] [PubMed] [Green Version]
  64. Li, Y.; Ge, D.; Lu, C. The SMART App: An interactive web application for comprehensive DNA methylation analysis and visualization. Epigenet. Chrom. 2019, 12, 71. [Google Scholar] [CrossRef] [PubMed] [Green Version]
  65. Tang, Z.; Li, C.; Kang, B.; Gao, G.; Li, C.; Zhang, Z. GEPIA: A web server for cancer and normal gene expression profiling and interactive analyses. Nucl. Acids Res. 2017, 45, W98–W102. [Google Scholar] [CrossRef] [PubMed] [Green Version]
  66. Guan, X.; Cai, M.; Du, Y.; Yang, E.; Ji, J.; Wu, J. CVCDAP: An integrated platform for molecular and clinical analysis of cancer virtual cohorts. Nucl. Acids Res. 2020, 48, W463–W471. [Google Scholar] [CrossRef] [PubMed]
  67. Chen, E.Y.; Tan, C.M.; Kou, Y.; Duan, Q.; Wang, Z.; Meirelles, G.V.; Clark, N.R.; Ma’ayan, A. Enrichr: Interactive and collaborative HTML5 gene list enrichment analysis tool. BMC Bioinf. 2013, 14, 128. [Google Scholar] [CrossRef] [Green Version]
  68. Zhou, Y.; Zhou, B.; Pache, L.; Chang, M.; Khodabakhshi, A.H.; Tanaseichuk, O.; Benner, C.; Chanda, S.K. Metascape provides a biologist-oriented resource for the analysis of systems-level datasets. Nat. Commun. 2019, 10, 1523. [Google Scholar] [CrossRef]
  69. Ru, B.; Wong, C.N.; Tong, Y.; Zhong, J.Y.; Zhong, S.S.W.; Wu, W.C.; Chu, K.C.; Wong, C.Y.; Lau, C.Y.; Chen, I.; et al. TISIDB: An integrated repository portal for tumor-immune system interactions. Bioinformatics 2019, 35, 4200–4202. [Google Scholar] [CrossRef]
  70. Miao, Y.R.; Zhang, Q.; Lei, Q.; Luo, M.; Xie, G.Y.; Wang, H.; Guo, A.Y. ImmuCellAI: A Unique Method for Comprehensive T-Cell Subsets Abundance Prediction and its Application in Cancer Immunotherapy. Adv. Sci. 2020, 7, 1902880. [Google Scholar] [CrossRef] [Green Version]
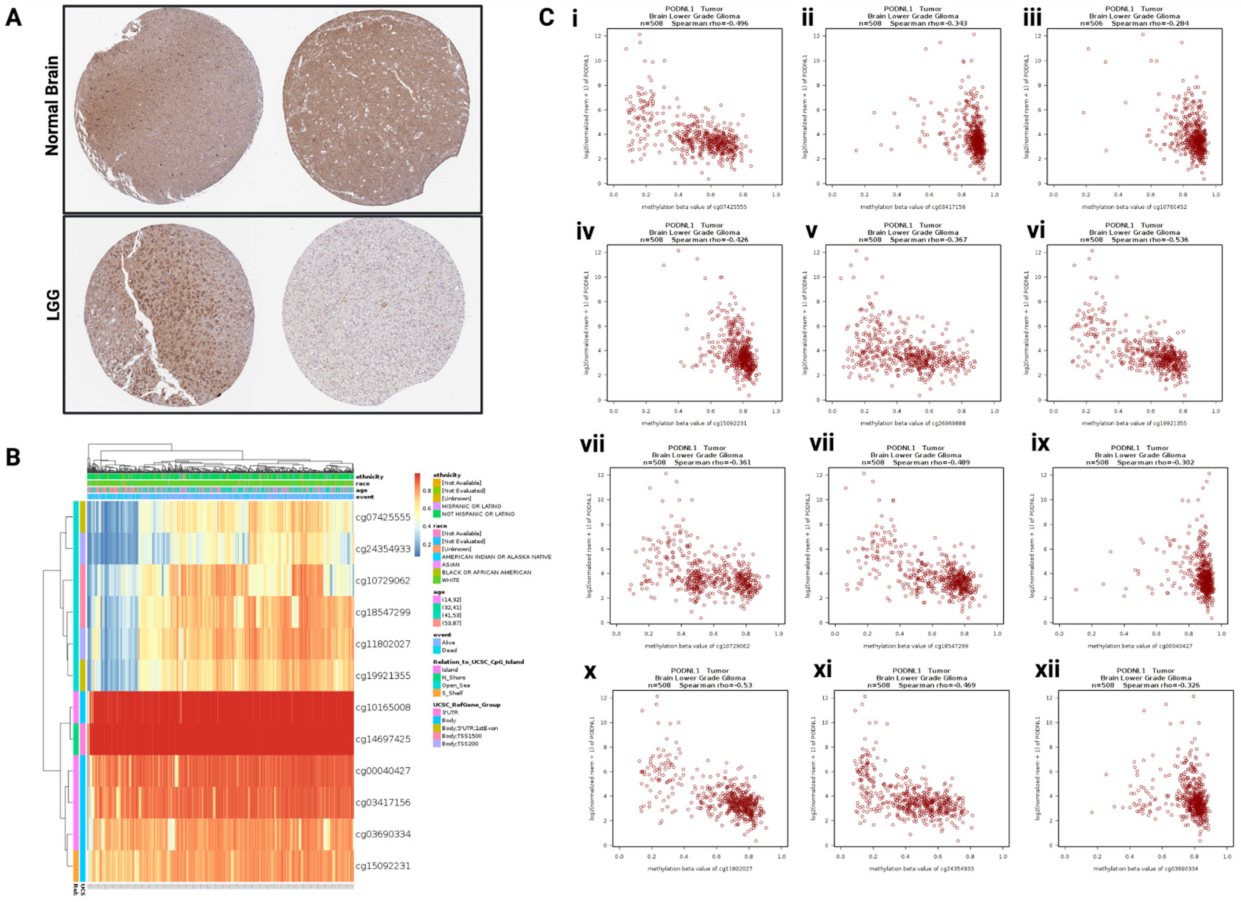
Figure 1. PODNL1 protein expression, CpG methylations, and its correlation with PODNL1 mRNA levels. (A) Immunohistochemical images showing PODNL1 protein expression in normal brain and lower-grade glioma (LGG) tissues (Human Protein Atlas). Weak PODNL1 expression in glial cells and moderate expression in neuronal cells were reported in normal brain tissues. Moderate expression was reported for one LGG sample (left), while weak expression was reported in the other (right). (B) Heatmap showing methylation levels in the top twelve PODNL1 CpG loci in TCGA-LGG (MethSurv). (C) (ixii.) Correlation between TCGA-LGG PODNL1 CpG methylations (beta-values) and PODNL1 mRNA expressions (RSEM+1) (p < 0.05 for all). Spearman’s rho correlation coefficients are reported within each figure.
Ijms 22 12572 g001
Figure 2. PODNL1 mRNA expression and methylation associates with LGG disease-free survival (DFS). (A) Log10 hazard ratio heatmap showing the association between PODNL1 mRNA expression and DFS across TCGA cancers. Solid outlined border represents statistically significant prognostic effects (p < 0.05). Lower-grade glioma (LGG) is indicated with a black arrow. (B) (i). Kaplan–Meier survival curve showing DFS based on PODNL1 mRNA levels (median expression cut-off). The curves show 95% confidence intervals for each group in dotted lines. (ii). Forest plot showing multivariate hazard ratio based on gender, age, tumor mutational burden (TMB), and PODNL1 mRNA expression groups (median expression cut-off) for TCGA-LGG. *** p < 0.001, ** p < 0.01 and * p < 0.05. (C) (iiv). Kaplan–Meier survival curves (DFS) based on methylation levels (median beta value cut-off) of four PODNL1 CpGs. The red line indicates “Meth” or the high methylation group and the black line indicates “Unmeth” or the low methylation group. Sample numbers n = 254 for each methylation group, for all figures. Log-rank p-values are marked in each figure. A p-value of <0.05 was considered significant. (D) Forest plot of DFS multivariate analysis hazard ratios for each significant CpG, after adjusting for age, gender, tumor grade, and IDH1 mutation.
Ijms 22 12572 g002
Figure 3. PODNL1 CpG methylation status affects LGG overall survival (OS). (A) (ivii). Kaplan–Meier survival curves for LGG OS based on the methylation status of specific PODNL1 CpGs (median beta value cut-off). The red line indicates “Meth” or high methylation group and the black line indicates “Unmeth” or low methylation group. Log-rank p-values are marked in each figure. A p-value of <0.05 was considered significant. Sample numbers n = 254 for each methylation group, for all figures. (B) Forest plot of OS multivariate analysis hazard ratios for each significant CpG, after adjusting for age, gender, tumor grade, and IDH1 mutation.
Ijms 22 12572 g003
Figure 4. Gene Ontology (GO) molecular function and Azimuth cell type analysis using the top 1000 significantly upregulated genes (Benjamini–Hochberg false discovery rate < 0.01) in PODNL1 low methylation groups of four significant CpGs. Data represents −log10 p-values. All enriched terms have p-values < 0.05.
Ijms 22 12572 g004
Figure 5. Differential protein expression, protein–protein interaction (PPI), and enrichment analysis. (A) Venn diagram presenting the overlap between differentially expressed proteins in four significant PODNL1 CpGs. The white circle represents common differentially expressed proteins between all four CpGs, used for further analysis. (B) PPI network visualization of ten proteins upregulated in (i). low CpG methylation groups and (ii). high CpG methylation groups (STRING). (C) Enrichment analysis (MetaScape) of ten upregulated proteins in (i). low CpG methylation groups and (ii). high CpG methylation groups. Data represents −log10 p-values. All enriched terms have p-values < 0.05.
Ijms 22 12572 g005
Figure 6. Association of PODNL1 methylation and expression, with immune cell infiltration and immune subtypes. Correlation heatmap between PODNL1 methylation (beta values) and (A) immune infiltrates and (B) MHC class II molecules across TCGA cancers (LGG marked with a black arrow; analyzed using TISIDB). (C) PODNL1 mRNA expression levels in TCGA-LGG immune subtypes. C3: inflammatory (n = 10), C4: lymphocyte depleted (n = 147), C5: immunologically quiet (n = 356), C6: TGF-b dominant (n = 1). One-way ANOVA p-value = 2.9 × 10⁻¹¹. (DG) Association between specific PODNL1 CpG methylation group (group 1 = high methylation and group 2 = low methylation; stratified by median beta value cut-off) infiltrating immune cells in all four significant CpGs. Statistical significance was determined by a Student’s t-test with a p-value < 0.05. **** p < 0.0001, *** p < 0.001, ** p < 0.01, and * p < 0.05.
Ijms 22 12572 g006
Figure 7. Association between PODNL1 expression/specific PODNL1 CpG methylations and immunotherapeutic targets—PD-L1 (CD274), PD-1 (PDCD1) and CTLA4, in TCGA astrocytoma (AiAiii) and (BiBiv) and in TCGA oligodendroglioma (CiCiii) and (DiDiv). R = Spearman’s rho correlation coefficient. Methylation groups of high (meth) and low (unmeth) were determined with a median beta-value cutoffs for each CpG. A p-value of less than 0.05 was considered statistically significant. **** p < 0.0001, *** p < 0.001, ** p < 0.01, * p < 0.05, and ns = not significant.
Ijms 22 12572 g007
Table 1. Univariate and multivariate survival analysis based on PODNL1 CpG methylation high/low subgroups.
Univariate AnalysisMultivariate Analysis
Overall SurvivalDisease-Free SurvivalOverall SurvivalDisease-Free Survival
CpG lociPositionHR [95% CI]p-ValueHR [95% CI]p-ValueHR [95% CI]p-ValueHR [95% CI]p-Value
cg26498537139295630.68 [0.48–0.97]3.40 × 10−20.75 [0.56–1.00]5.26 × 10−21.01 [0.69–1.47]9.60 ×10−10.95 [0.70–1.28]7.68 × 10⁻¹
cg21993464139304930.60 [0.42–0.87]6.56 × 10−30.82 [0.62–1.09]1.89 × 10−10.91 [0.63–1.33]6.57 × 10−10.99 [0.74–1.33]9.82 × 10⁻¹
cg14697425139320271.02 [0.72–1.46]8.81 × 10−11.05 [0.79–1.39]7.23 × 10−11.20 [0.83–1.73]3.12 × 10−11.19 [0.89–1.60]2.25 × 10⁻¹
cg03417156139328330.66 [0.46–0.94]2.34 × 10−20.78 [0.58–1.04]9.42 × 10−21.09 [0.73–1.62]6.50 × 10−11.07 [0.79–1.45]6.47 × 10⁻¹
cg03690334139330040.57 [0.40–0.82]2.43 × 10−30.72 [0.54–0.96]2.62 × 10−20.72 [0.49–1.04]8.64 × 10−20.85 [0.63–1.14]2.93 × 10⁻¹
cg10165008139330980.60 [0.42–0.86]6.25 × 10−30.72 [0.54–0.96]2.83 × 10−20.83 [0.57–1.21]3.45 × 10−10.83 [0.61–1.12]2.40 × 10⁻¹
cg00040427139333840.43 [0.29–0.62]6.00 × 10−60.59 [0.44–0.79]4.20 × 10−40.71 [0.48–1.06]1.01 × 10−10.79 [0.58–1.08]1.54 × 10⁻¹
cg15092231139358530.49 [0.34–0.71]1.49 × 10−40.65 [0.49–0.87]3.66 × 10−30.79 [0.53–1.18]2.62 × 10−10.87 [0.64–1.18]3.82 × 10⁻¹
cg07425555139382060.32 [0.22–0.46]3.40 × 10−90.47 [0.35–0.63]5.45 × 10−70.44 [0.29–0.67]1.39 × 10−40.62 [0.46–0.85]3.53 × 10⁻³
cg19921355139382800.37 [0.25–0.54]2.29 × 10−70.56 [0.42–0.74]8.30 × 10−50.54 [0.35–0.84]5.70 × 10−30.76 [0.55–1.05]1.03 × 10⁻¹
cg24354933139384820.33 [0.22–0.49]1.95 × 10−80.51 [0.38–0.68]7.00 × 10−60.55 [0.36–0.84]5.93 × 10−30.72 [0.53–0.99]4.74 × 10⁻²
cg11802027139386300.35 [0.24–0.51]5.62 × 10−80.53 [0.39–0.70]1.70 × 10−50.50 [0.32–0.79]3.32 × 10−30.76 [0.54–1.07]1.25 × 10⁻¹
cg18547299139387660.44 [0.30–0.64]1.80 × 10−50.52 [0.39–0.70]1.50 × 10−50.58 [0.38–0.87]9.25 × 10−30.64 [0.47–0.88]6.52 × 10⁻³
cg10729062139390100.48 [0.33–0.69]1.05 × 10−40.50 [0.37–0.67]5.00 × 10−60.73 [0.48–1.10]1.37 × 10−10.73 [0.53–1.01]5.73 × 10⁻²
cg11453058139533640.62 [0.44–0.89]1.02 × 10−20.70 [0.53–0.94]1.73 × 10−20.66 [0.45–0.96]3.03 × 10−20.79 [0.59–1.06]1.18 × 10⁻¹
cg26969888139534420.34 [0.24–0.50]3.59 × 10−80.51 [0.38–0.68]7.00 × 10−60.56 [0.38–0.84]4.85 × 10−30.70 [0.51–0.96]2.65 × 10⁻²
cg10760452139537760.72 [0.50–1.02]7.00 × 10−20.83 [0.62–1.10]2.07 × 10−10.79 [0.55–1.13]2.06 ×10−10.94 [0.71–1.27]7.26 × 10⁻¹
cg10609371139540600.94 [0.66–1.34]7.38 × 10−11.04 [0.78–1.39]7.50 × 10−11.14 [0.79–1.65]4.60 × 10−11.14 [0.85–1.52]3.68 × 10⁻¹
Publisher’s Note: MDPI stays neutral with regard to jurisdictional claims in published maps and institutional affiliations.