Article

Quality Traits, Volatile Organic Compounds, and Expression of Key Flavor Genes in Strawberry Genotypes over Harvest Period

by
Varvara K. Leonardou
1,
Evangelos Doudoumis
2,
Evangelos Tsormpatsidis
3,
Eleni Vysini
3,
Theofanis Papanikolopoulos
3,
Vasileios Papasotiropoulos
2,* and
Fotini N. Lamari
1,*
1
Laboratory of Pharmacognosy & Chemistry of Natural Products, Department of Pharmacy, University of Patras, 26504 Patras, Greece
2
Laboratory of Agricultural Genetics & Plant Breeding, Department of Agriculture, University of Patras, 27200 Amaliada, Greece
3
Berryplasma World Ltd., 27052 Varda, Greece
*
Authors to whom correspondence should be addressed.
Int. J. Mol. Sci. 2021, 22(24), 13499; https://doi.org/10.3390/ijms222413499
Submission received: 28 November 2021 / Revised: 9 December 2021 / Accepted: 13 December 2021 / Published: 16 December 2021

Abstract

:
Six strawberry genotypes were examined for fruit yield and size, important chemical traits (sugars, phenolics, anthocyanins, ascorbic acid, volatiles) and antioxidant properties (ferric reducing power). In addition, we determined the expression of genes and transcription factors (SAAT, FaNES1, FaFAD1, FaEGS2, FaEOBII and FaMYB10) controlling the main flavor and aroma traits, and finally evaluated the effect of the genotype and harvest time on the examined chemical and genetic factors, as well as their intercorrelations. The commercial varieties ‘Fortuna’, ‘Victory’, ‘Calderon’, ‘Rociera’, and two advanced selections Ber22/6 and Ber23/3 were cultivated under the same conditions at Berryplasma World Ltd. plantations (Varda, Ilia, Region of Western Greece). Strawberries were harvested at three different time points over the main harvest period in Greece, i.e., early March (T1), late March (T2) and late April (T3). ‘Fortuna’ exhibited the highest early and total yield, while ‘Calderon’, the highest average berry weight. General Linear Model repeated measures ANOVA demonstrated that the interaction of the genotype and harvest time was significant (p < 0.001) on all tested quality attributes and gene expression levels, showing that each genotype behaves differently throughout the harvest period. Exceptions were observed for: (a) the volatile anhydrides, fatty acids, aromatics and phenylpropanoids (all were greatly affected by the harvest time), and (b) lactones, furaneol and FaEGS2 that were affected only by the genotype. We observed significant intercorrelations among those factors, e.g., the positive correlation of FaFAD1 expression with decalactone and nerolidol, of SAAT with furaneol, trans-cinnamic acid and phenylpropanoids, and of FaEGS2 with decalactone and FaFAD1. Moreover, a strong positive correlation between SAAT and FaMYB10 and a moderate negative one between SAAT and glucose were also detected. Those correlations can be further investigated to reveal potential markers for strawberry breeding. Overall, our study contributes to a better understanding of strawberry physiology, which would facilitate breeding efforts for the development of new strawberry varieties with superior qualitative traits.

1. Introduction

The octoploid cultivated strawberry (Fragaria × ananassa (Duchesne ex Weston) Duchesne ex Rozier) is a typical non-climacteric, horticultural crop cultivated worldwide. Strawberry fruits satisfy the consumers’ preference due to their sweet and aromatic flavor, nutritional value and health-promoting ingredients [1]. In the last decades, strawberry breeding objectives have been focused on the development of new cultivars with high yield, resistance to pathogens and transport damages, adaptation to different climatic conditions and cultivation systems, season-wide production, fruit size and firmness [2]. In addition to the agronomic performance of the plant, the development of cultivars with superior organoleptic quality and nutritional value is now a priority across many breeding programs.
The term organoleptic quality refers to the core collection of qualities that are observable through the consumer’s five senses and are typically connected to specific chemical and physicochemical traits. Flavor perception arises from the integration of taste and aroma co-exposure; strawberry sweetness primarily correlates to the amount and type of sugars, but afterwards its perception involves aroma [3]. Aroma is the result of the presence of hundreds of volatile organic compounds (VOCs), although not all of them are responsible for the odor perception [4]. Consumer quality acceptance generally relies on specific characteristics, e.g., fruit color, shape, acidity, and sweetness in combination with flavor and aroma [5].
Strawberry aroma has been a topic of intense research since the mixture of strawberry VOCs is very complex. Nearly one thousand VOCs have been described so far [6]; 380 compounds were described in the comprehensive review of Zabetakis and Holden [7] and 567 VOCs were determined in the study of Cannon et al. [8]. Only few are consistently present in all genotypes and determine the aroma; their concentration varies by the genotype, fruit maturity and environmental conditions. The most frequent and aroma determining VOCs are acids and esters—with butanoic and hexanoic acids and their methyl- or ethyl-esters being consistently present—furanones like mesifurane and its precursor furaneol, lactones with γ-decalactone and γ-dodecalactone being the predominant ones, and terpenoids like linalool [6]. Progress in the study of their metabolism has revealed several key biosynthetic enzymes and their genes, e.g., the strawberry alcohol acyl transferase (SAAT) that catalyzes the formation of esters, the fatty acid desaturase (FaFAD1) that positively controls γ-decalactone production in ripening strawberry fruit, and the nerolidol synthase (FaNES1), which is involved in the formation of nerolidol and linalool and is mainly expressed in the receptacle tissue during ripening [9]. Eugenol that is synthesized in fruits or flowers, contributes to their aroma, and plays a role as floral attractant for pollinators [10]. A previous study demonstrated that the FaEGS2 gene coding for eugenol synthase in strawberry was expressed in the receptacle during the last stages of ripening [11]. FaMYB10, a R2R3-MYB transcription factor (TF), is a general regulator of early and late anthocyanin biosynthetic genes and other structural genes in the flavonoid/phenylpropanoid pathway during the ripening of strawberry [12,13]. FaEOBII, encodes a R2R3-MYB TF and has been identified as a positive regulator of the metabolic pathway that determines the production of the phenylpropanoid volatile eugenol in ripe receptacles [10,14]. FaEOBII regulates eugenol production through the activation of FaCAD1 and FaEGS2. These genes encode a cinnamyl alcohol dehydrogenase and an eugenol synthase, respectively, which are part of this metabolic pathway [14,15].
Strawberry nutritional quality derives from all the macro- and micronutrients, vitamins and bioactive compounds present in strawberries. The strawberries’ nutritional quality is due to their high levels of both nutritive (vitamins, minerals, fibers) and non-nutritive (polyphenols) bioactive ingredients. Human studies have demonstrated that strawberry consumption confers antioxidant, cardioprotective, anti-inflammatory, antihyperglycemic, anti-obesity, cancer chemopreventive, antimicrobial and neuroprotective benefits and mediates the attenuation of metabolic syndrome [16]. Their potential to combat chronic degenerative diseases derives from their phytochemical content. The fruits contain high concentrations of vitamin C (ascorbic acid). It has been suggested that ascorbic acid could be one of the selection targets in new breeding programs, since strawberry genotypes containing a large amount of vitamin C (>12 mg/100 g) could bear the functional health claims on vitamin C according to article 13.1 (EU Directive 1924/2006) [2]. Anthocyanins are the predominant polyphenol class responsible for fruit color, whereas other bioactive polyphenols present in the fruits are flavanols (catechins and procyanidins), ellagitannins, flavonols and phenolic acids [16]. Those polyphenols confer significant antioxidant and concomitantly anti-inflammatory protection, not only because they act as antioxidants themselves, but more importantly because they interact with cellular signaling cascades regulating the activity of transcription factors and influencing the expression of genes essential in cellular metabolism and survival [17,18]. Bearing in mind the impact of the digestion process on the structure of polyphenols and therefore on their antioxidant capacity, bioaccessibility and bioavailability, Cervantes et al. [19] compared raspberries, blueberries and strawberries and demonstrated that although raw strawberries did not have the highest phenolic/anthocyanin content or antioxidant capacity, they had the highest total phenolic content and antioxidant capacity in the bioavailable fractions after digestion, possibly due to their lower dietary fiber content. The content of total polyphenols, anthocyanins and in vitro antioxidant capacity have been used in some breeding programs as markers for the selection of genotypes that would offer more healthfulness [20,21,22].
Quality traits are controlled by a complex genetic background. A great variability of strawberry quality is observed not only among the different genotypes, but also derives from environmental (different latitude, soil conditions, light exposition, etc.), agronomic factors related to the cultivation systems (fertilization, water stress and salinity), harvest dates and processes, and shelf-life [5]. In addition, the plant vegetative growth pattern and the crop load greatly affect fruit quality characteristics [23].
Our aim was to assess the fruit quality of four strawberry commercial cultivars (‘Rociera’, ‘Calderon’, ‘Florida Fortuna’, ‘Victory’) and two advanced selections (Ber22/6 and Ber23/3) over the main harvest period in Greece (March–April), to describe and understand the impact of harvest time and genotype on agronomic, nutritional and aroma traits and the expression of key genes influencing flavor.
For this reason, the six strawberry genotypes were cultivated under the same conditions in the same plantation, and their fruits were harvested at three different time points. At each time-point and for each genotype, the fruit yield and weight, the content of total sugars and glucose, total phenolics, anthocyanins, ascorbic acid, and ferric reducing antioxidant power as an index of antioxidant capacity were determined. Volatile composition was recorded with GC-MS, whereas the expression of strawberry alcohol acyltransferase (SAAT), nerolidol synthase-1 (FaNES1), omega-6 fatty acid desaturase (FaFAD1), eugenol synthase 2 (FaEGS2) genes and of the transcription factors FaEOBII and FaMYB10 were determined by qRT-PCR. Finally, statistical analysis was used to study the intercorrelations among all these factors to define their possible interactions.

2. Results and Discussion

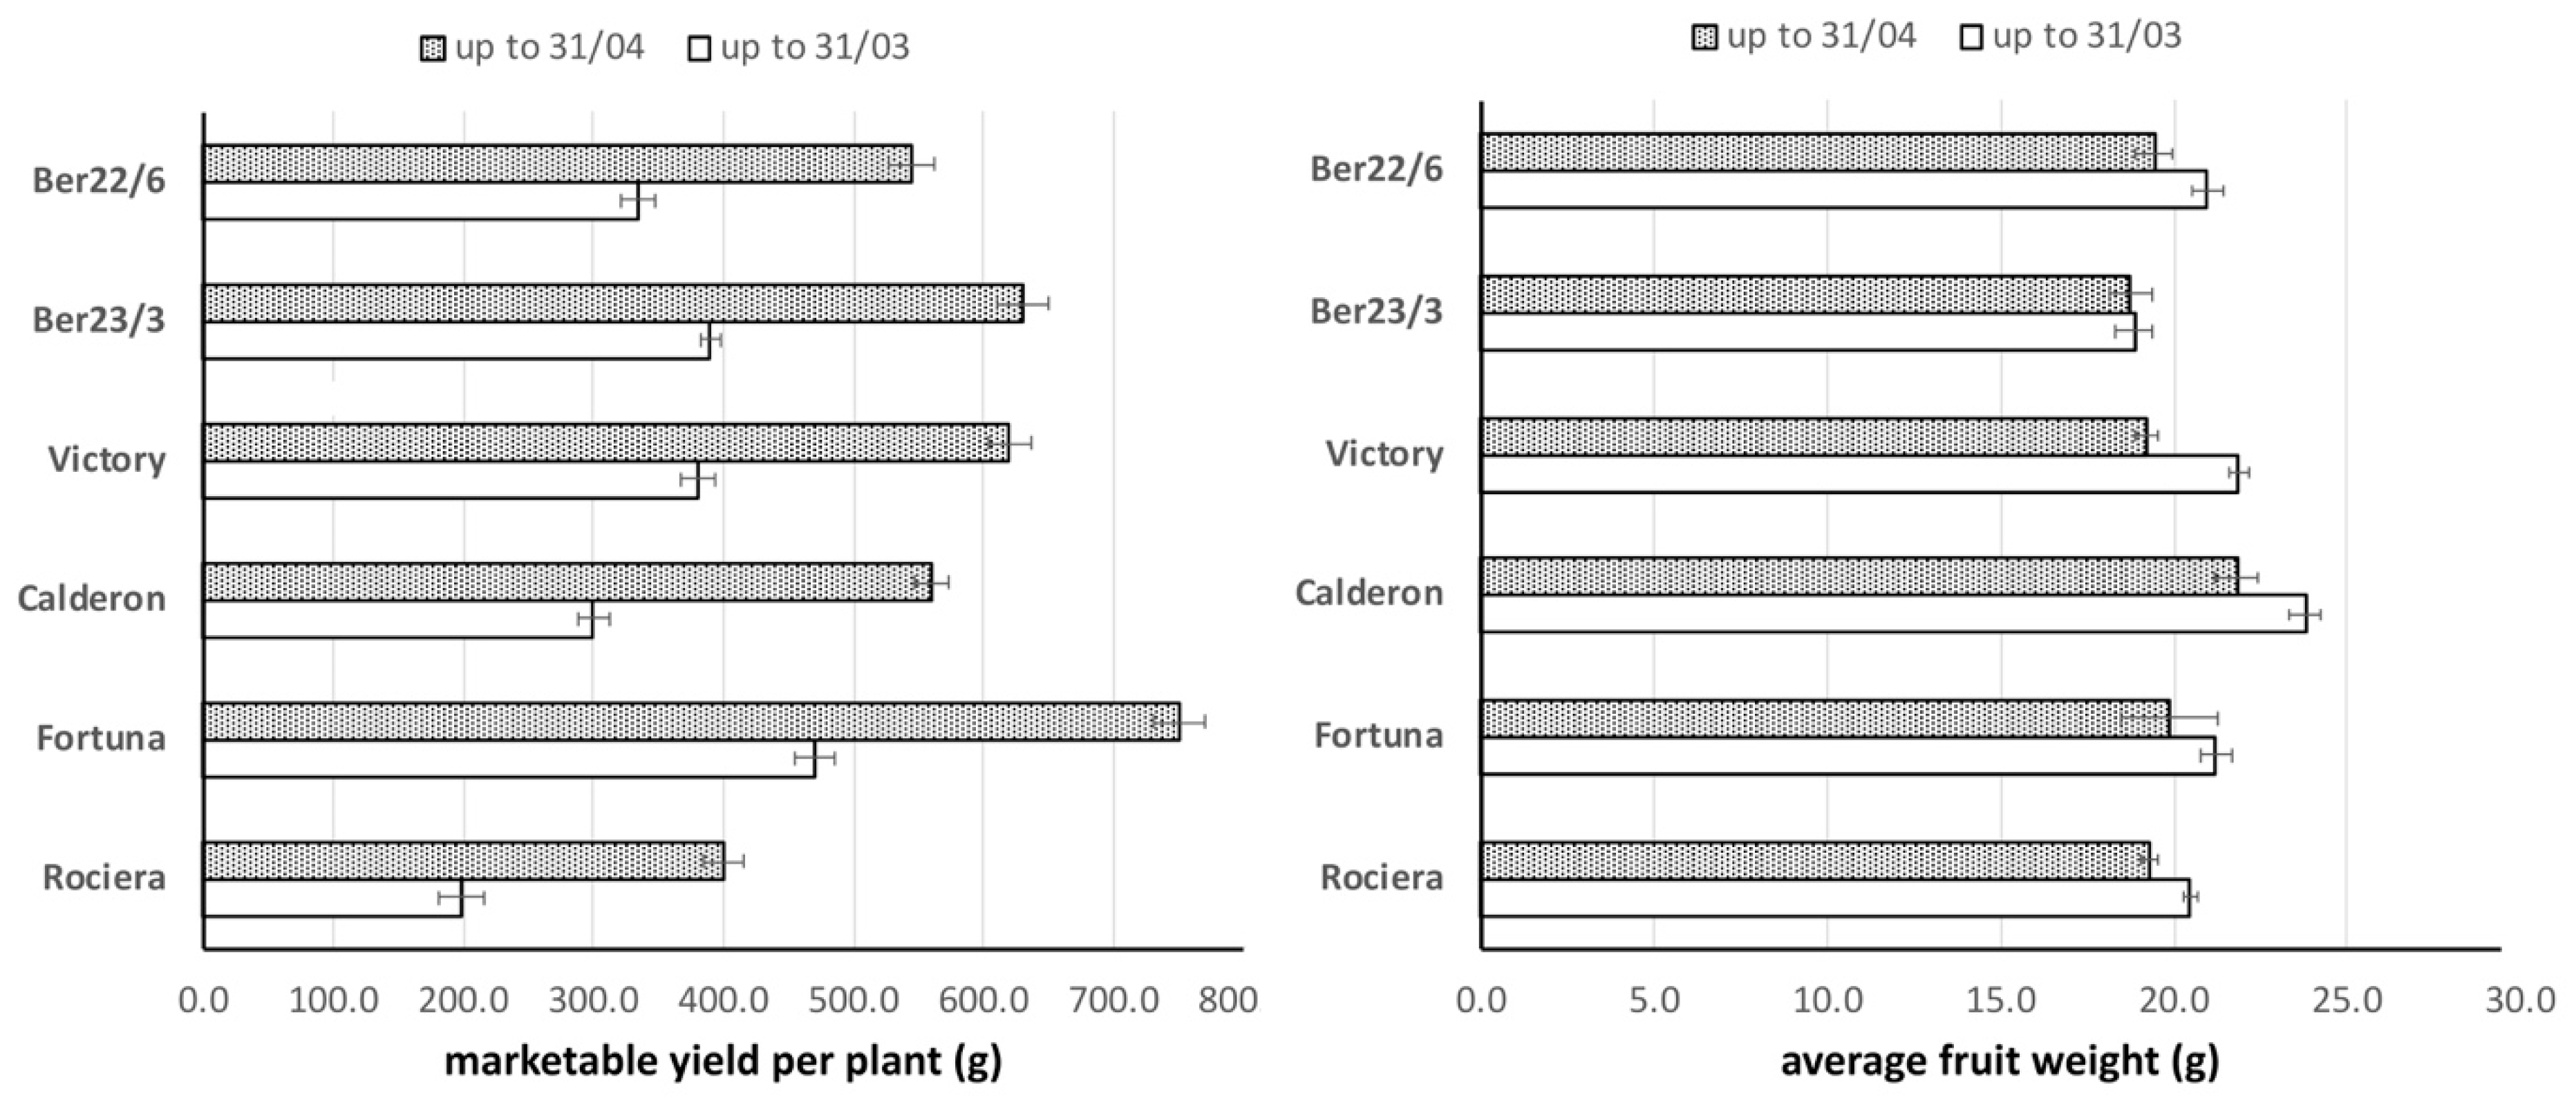
2.1. Fruit Yield and Weight

‘Fortuna’ exhibited the highest early (470 g) and total yield (750 g) compared to any other genotype tested (Figure 1). Moreover, there was no significant difference in the early yield between Ber23/3 and ‘Victory’; however, Ber23/3 had higher early yield than Ber22/6, ‘Calderon’ and ‘Rociera’ by 17%, 30% and 96%, respectively. A similar trend was observed in total yield values as measured up to 31/04. For example, Ber23/3 had higher total yield than Ber22/6, ‘Calderon’ and ‘Rociera’ by 16%, 13% and 58%, respectively.
The highest average berry weight was observed in ‘Calderon’ as measured up to 31/03 and 30/04. The smallest average berry weight was observed in Ber23/3 as measured in both time points. All genotypes dropped the average berry weight from 6–12% in April (31/03–30/04), except Ber23/3 which had a stable average berry weight in both periods despite the increase in yield.

2.2. Fruit Quality Parameters

General Linear Model (GLM) repeated measures ANOVA analysis demonstrated that the interaction of genotype and harvest time was significant (p < 0.001) for all tested quality attributes showing that each genotype behaves differently throughout the harvest time (Table S1).

2.2.1. Sugars

Total sugars were determined with the method of anthrone and were expressed as mg glucose equivalent/g F.W. The values ranged from 36.21 ± 3.04 (‘Victory’, T1) to 61.01 ± 2.56 mg/g F.W. (Ber23/3, T2) (Figure 2). These values are in accordance with those previously reported for strawberries cultivated in the same area by Zeliou et al. [24]; in that study it was demonstrated that total sugars correlated positively with the ratio of total soluble sugars/total acids that in turn correlated with the perception of sweetness.
Total sugar content at T2 was different from that at T1 and T3 (p < 0.001), whereas the glucose concentration of strawberries was not significantly different at T1 and T2 (Figure 2). Concerning glucose concentration, ‘Fortuna’, ‘Rociera’ and ‘Victory’ were constant across all timepoints. The sugar content in ‘Rociera’ and ‘Calderon’ was also constant over the harvest period, whereas the rest of the genotypes exhibited the highest values at T2 (bell-shaped pattern). Glucose was nearly 50% of total sugars in all genotypes at T1 and T3, whereas at T2 it represented on average 39% of total sugars, suggesting that other sugars are produced in that time-point increasing the concentration of total sugars. This is further evidenced by the low correlation of those two variables (0.415, p = 0.002). In the study of Davik et al. [25], glucose determined with HPLC-RI was nearly 40% of total sugars, fructose was nearly 50% and sucrose was 10%. Each of them contributes differently to the perception of sweetness; glucose sweetness is only 55 to 60% that of fructose or sucrose [26,27]. Thus, the results suggest that fructose and/or sucrose are overproduced at T2 contributing to a significant increase of total sugars and sweetness.
With respect to the genotypic differences over all time points, the total sugars content was lower in ‘Victory’ than ‘Calderon’, whereas ‘Fortuna’ had significantly lower content than ‘Calderon’, ‘Rociera’ and Ber23/3 (p < 0.05); showing that the latter ones had a high sugar content, although it was not constant through time. Accordingly, ‘Fortuna’ and ‘Victory’ fruits had lower glucose concentration than Ber23/3 and ‘Calderon’ fruits (p < 0.05).

2.2.2. Phenolics and Anthocyanins

The total phenolic content significantly increased during the harvest period in all genotypes but not in ‘Victory’; the rise at T3 in comparison to T1 ranged from a 9% in Ber23/3 to a 36% in Ber22/6 (Figure 3). The comparison of anthocyanin content at T3 and at T1 (p < 0.001) showed an even greater rise from 30% in ‘Victory’ to the remarkable 84% in ‘Rociera’; the difference was also significant (p < 0.001) from T2 to T3. However, anthocyanins in Ber22/6 did not differ significantly among the various time points. Kawanobu et al. [28] had also demonstrated that anthocyanin content rises as the cultivation season of two cultivars ‘Nyoko’ and ‘Toyonoka’ progresses. Tomić et al. [29] investigated the effect of harvest time in five-day intervals (from May 26 to June 16) on the phenolic and anthocyanin content of three strawberry cultivars (‘Clery’, ‘Joly’ and ‘Dely’) and recorded an increase of both parameters as the harvest time progressed.
A medium but significant correlation of those two analytes was noted (0.426, p = 0.001), which is not surprising since anthocyanins are a subcategory of phenolics particularly responsible for the fruit color. Interestingly, a correlation was noted between phenolics content and glucose concentration (0.533, p < 0.001), which might be attributed to the biosynthesis of phenolics via the shikimate pathway deriving from intermediates of glucose metabolism.
Taking all time points into account, Ber23/3 did not differ from ‘Calderon’ (the highest values), followed by Ber22/6 from ‘Rociera’; notably, ‘Fortuna’ fruits had the lowest phenolics concentration. Accordingly, Ber23/3 fruits had significantly higher content of anthocyanins than those of Ber22/6, ‘Calderon’, ‘Rociera’, and ‘Victory’, whereas ‘Victory’ had lower values than Ber23/3, ‘Calderon’ and ‘Fortuna’.
Our results confirm previous studies [29,30] and show that phenolic and anthocyanin production is a quality parameter greatly dependent on the genotype.

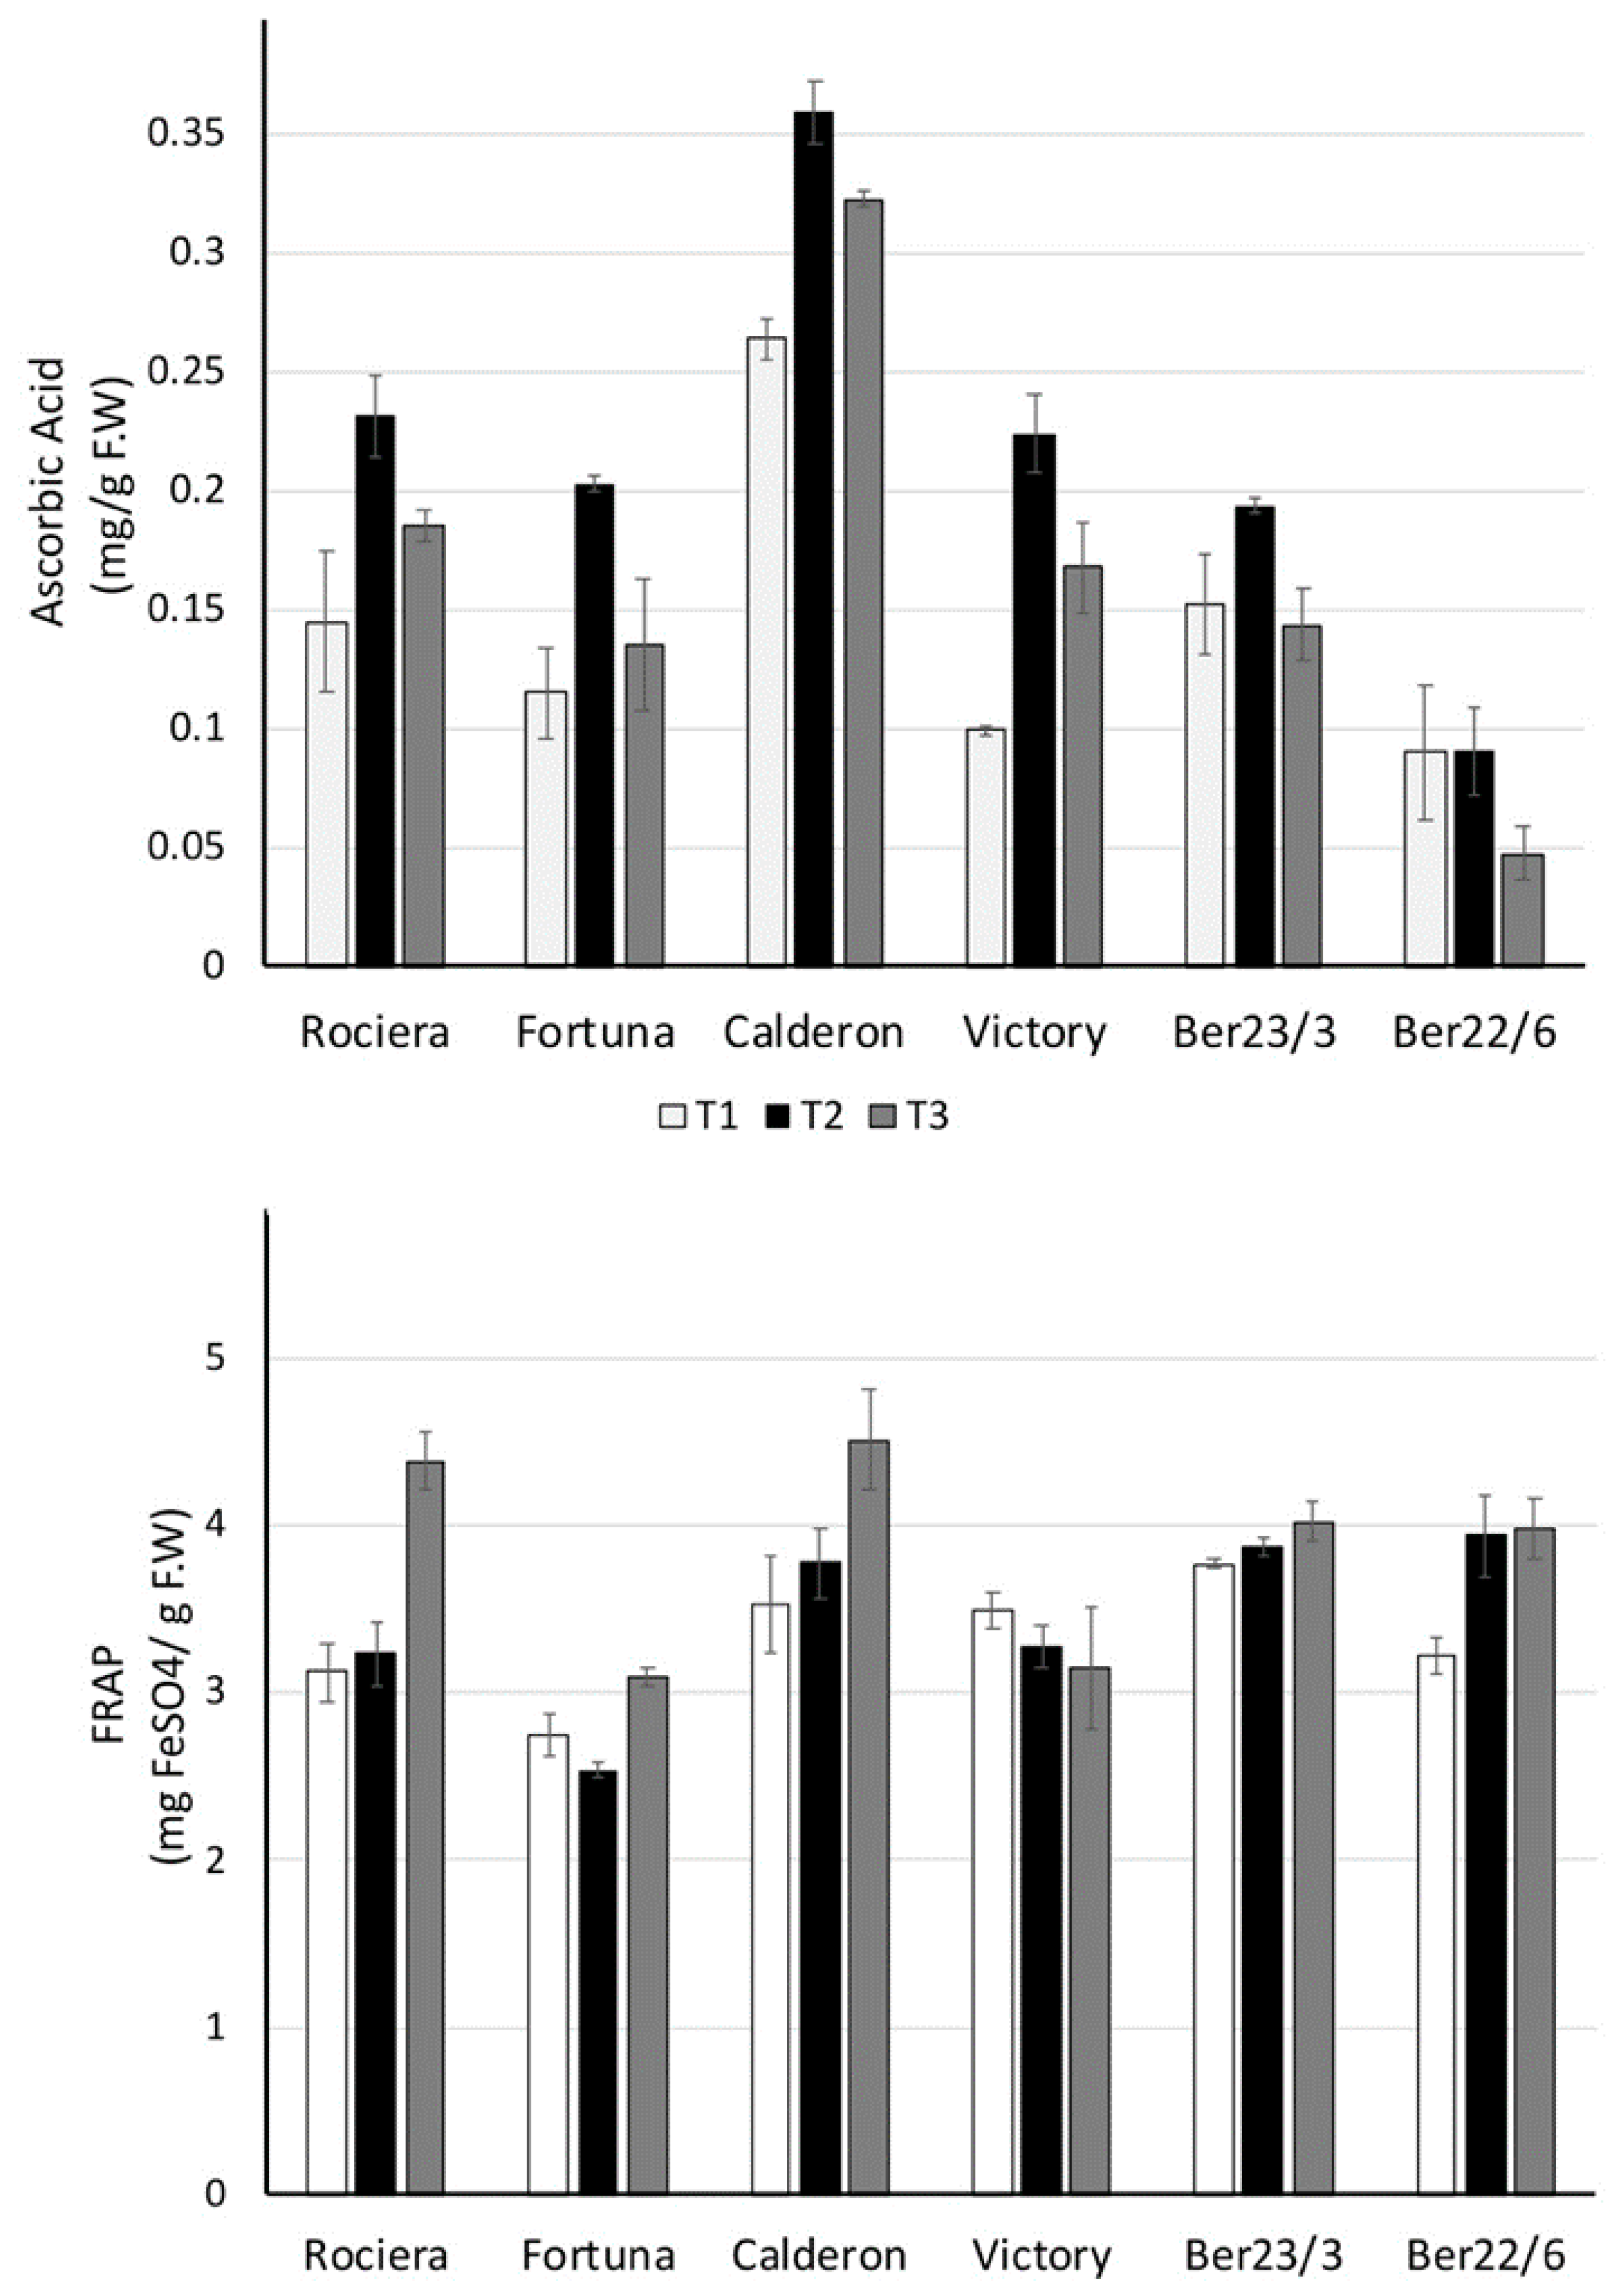
2.2.3. Ascorbic Acid and Antioxidant Activity

One of the key nutritional benefits of strawberries is their very high vitamin C level. The vitamin C content of strawberry fruits varies between 0.1 and 1 mg g−1 FW (fresh fruit) for several strawberry genotypes [31]. In our study, when considering all time points, ‘Calderon’ had the highest levels of vitamin C from all other genotypes and Ber22/6 the lowest ones (p < 0.001) (Figure 4). However, the lowest Ferric-Reducing Antioxidant Power (FRAP) values (index of antioxidant capacity) were noted in ‘Fortuna’ fruits, while those in Ber22/6 were not different from those in Ber23/3, ‘Calderon’ and ‘Rociera’ (all of them high) (Figure 4).
Strawberries have a much higher antioxidant capacity than other fruits such as apples, peaches, pears, grapes, tomatoes, oranges or kiwifruit, with vitamin C accounting for more than 30% of the total antioxidant capacity, anthocyanins accounting for 25–40% (depending on the cultivar), and other phenolics (ellagic acid derivatives and flavonols) accounting for the remainder [32]. In our study, FRAP values correlated strongly with total phenolic content (0.928, p < 0.001) and glucose concentration (0.502, p < 0.001), but not with ascorbic acid, which could be attributed to the nature of the assay. Ascorbic acid had a moderate correlation with total sugars content (0.515, p < 0.001) and followed a bell-shaped pattern in most cultivars; it is biosynthesized from sugars.
A decrease in ascorbic acid content in midterm harvest time (up to early May in Japan) followed by an increase later has been shown by Kawanobu et al. [28] in two cultivars. Their results are in accordance with the significant increase we noticed at T2 and differences in the dates probably stem from the difference in the geographic locations. It has previously been demonstrated that the ascorbic acid concentration is influenced by the effective cumulative temperature and sun radiation between flowering and harvest [33]. Fruit quality and antioxidant qualities of ten cultivars were higher in mid- (21 March) to late-season (9 April) harvests in Spain [34]. Accordingly, in our study, fruit antioxidant FRAP values at T3 were higher than those at T1 and T2 (p < 0.001); ‘Victory’ and Ber23/3 fruit FRAP values were constant throughout the harvest time (Figure 4).

2.3. Strawberry Volatiles

More than a hundred VOCs were identified, whereas other minor peaks were also present; the identification range in terms of peak areas was 55–79%. The high abundance of acids which eluted as tailing peaks in the apolar GC HP-5MS column hampered the identification process on several occasions (Figure S1). Out of those, we selected the ones that were at least 0.1% at one measurement to proceed with the comparison among genotypes and harvest points (Table 1 and Table S2).
The predominant compound was trans-cinnamic acid with a total average of 26.4% and was followed by citraconic anhydride (4.4%), maleic anhydride (3.9%), hexanoic acid (3.9%) and coumaran (3.2%). Phenylpropanoids (trans- and cis-cinnamic acid and ferulic acid) accounted for 27% of total peak area in all genotypes and were the major aromatic compounds (in total 33%), whereas the average percentage of anhydrides (maleic, citraconic, succinic and itaconic anhydrides) was higher than 10%. The abundance of those non-volatiles and the determination of esters and terpenes in low relative amounts (0.2 and 0.7%, respectively) can be explained by the nature of the cleanup process we adopted, i.e., liquid–liquid extraction with ethyl acetate, since aromatic compounds are highly soluble in that solvent. In addition, previous studies [46,47] have demonstrated that liquid–liquid extraction is advantageous for lactone determination, and this is also evidenced by our study in which lactones accounted for an average of 1.6%. Ulrich et al. [6] have thoroughly presented the advantages (high number of extracted VOC, high recovery rates, concentration) and the disadvantages (high workload, lack of automation, extraction of non-volatiles) of the commonly used liquid–liquid extraction clean-up process.
The occurrence of all those compounds except maleic anhydride in strawberries has been earlier reported [7,8,38]; and the exact references for every compound are presented in Table 1. Regarding maleic anhydride we further certified its presence by a standard, whereas when we injected maleic acid, the anhydride was not detected. Concerning coumaran, its presence was earlier reported by Gaborieau et al. [39]. When we injected standard p-coumaric acid in the GC-MS, we observed only the peak of coumaran, which led us to the conclusion that coumaran does not exist naturally in strawberries but is formed during the high temperature GC analysis. In accordance, the thermolability of p-coumaric acid has earlier been described by Salameh et al. [48]; interestingly, those authors also demonstrated its bioconversion to vinyl- and 4-ethylphenol, which might explain the determination of 4-ethylphenol in the present study (probably a result of enzymatic action in the homogenized fruits although an inorganic salt was added), since it has not been earlier described in strawberries.
The rest of the identified compounds are presented in Table 1. A considerable portion of those are the lactones with γ-decalactone being the major one, albeit in some genotypes (‘Victory’ and Ber22/6) it was not detected. Short chain straight and branched acids (hexanoic, 3-hydroxybutanoic acid, butanoic, 2-methylpropanoic acid) and longer fatty acids (from twelve to eighteen carbons including odd ones) were present in high percentages (9.32 and 2.60%, respectively), whereas alcohols (mainly 2,3-butanediol) and alkenes were in very low percentages (<0.3%).
When considering the available data of which compound affects aroma and flavor (Table 1), ‘Rociera’ surpassed all other genotypes in the percentage of those compounds that affect flavor (trans-cinnamic acid was subtracted), whereas Ber23/3 and ‘Fortuna’ ranked second (Table S3).

Effect of Genotype and Harvest Time on Volatiles

GLM repeated measures ANOVA was used to evaluate the impact of genotype and harvest time on the major volatiles and volatile categories, and the F values are presented in Table 2. Genotype, harvest time, and/or their interaction had a significant effect (p < 0.05) on all major compounds except for benzyl alcohol and all volatile categories.
The genotype was the only source of variation for butanoic acid, 3-hydroxybutanoic acid, hexanoic acid, furaneol and γ-decalactone, and for the category of lactones. In the study of Jouquand et al. [47], apart from the great effect of the genotype, harvest time also influenced lactone content in the sense that the lower temperatures in February increased their content consecutively. Furaneol and γ-decalactone are characteristic strawberry volatiles that impart a sweet flavor to strawberries (see Table 1), and the fact that they are affected only by genotype suggests that their content should be considered as potential target in breeding programs and cultivar selection. Interestingly, Samykanno et al. [49] had demonstrated that predominantly the genotype (the environment to a lesser degree but their interaction was significant) affected γ-decalactone and furaneol in two different strawberry cultivars (‘Albion’ and ‘Juliette’).
Only the harvest time affected phenylpropanes, aromatics, furans/lactones and anhydrides; the effect on furans/lactones seems to derive from their high content in anhydrides. In accordance, styrene, citraconic anhydride, coumaran, trans-cinnamic acid, oleic and stearic acid were affected only by harvest time. The interaction of both factors was significant (p < 0.05) for esters, terpenes, short-chain acids, fatty acids and alkenes, showing that harvest time might affect the volatile composition in a different way for each genotype; however, the effect of harvest time on esters, fatty acids and alkenes overshadowed that of genotype. With regards to volatile compounds, the effect of their interaction was significant on maleic anhydride, 2-methylbutanoic acid, mesifurane, linalool, trans-nerolidol and hexadecenoic acid with an overwhelming effect of genotype on 2-methylbutanoic acid and linalool, and of harvest time on maleic anhydride and n-hexadecanoic acid. Noteworthy, trans-nerolidol was determined only in ‘Rociera’ and ‘Fortuna’. Our results are in accordance with those of Pelayo-Zaldívar et al. [50] on esters, linalool and furaneol although they had examined two distant harvest points for three strawberry varieties (‘Aromas’, ‘Diamante’ and ‘Selva’), and those of Jouquand et al. [47] on esters and terpenes of eight different genotypes over two seasons.

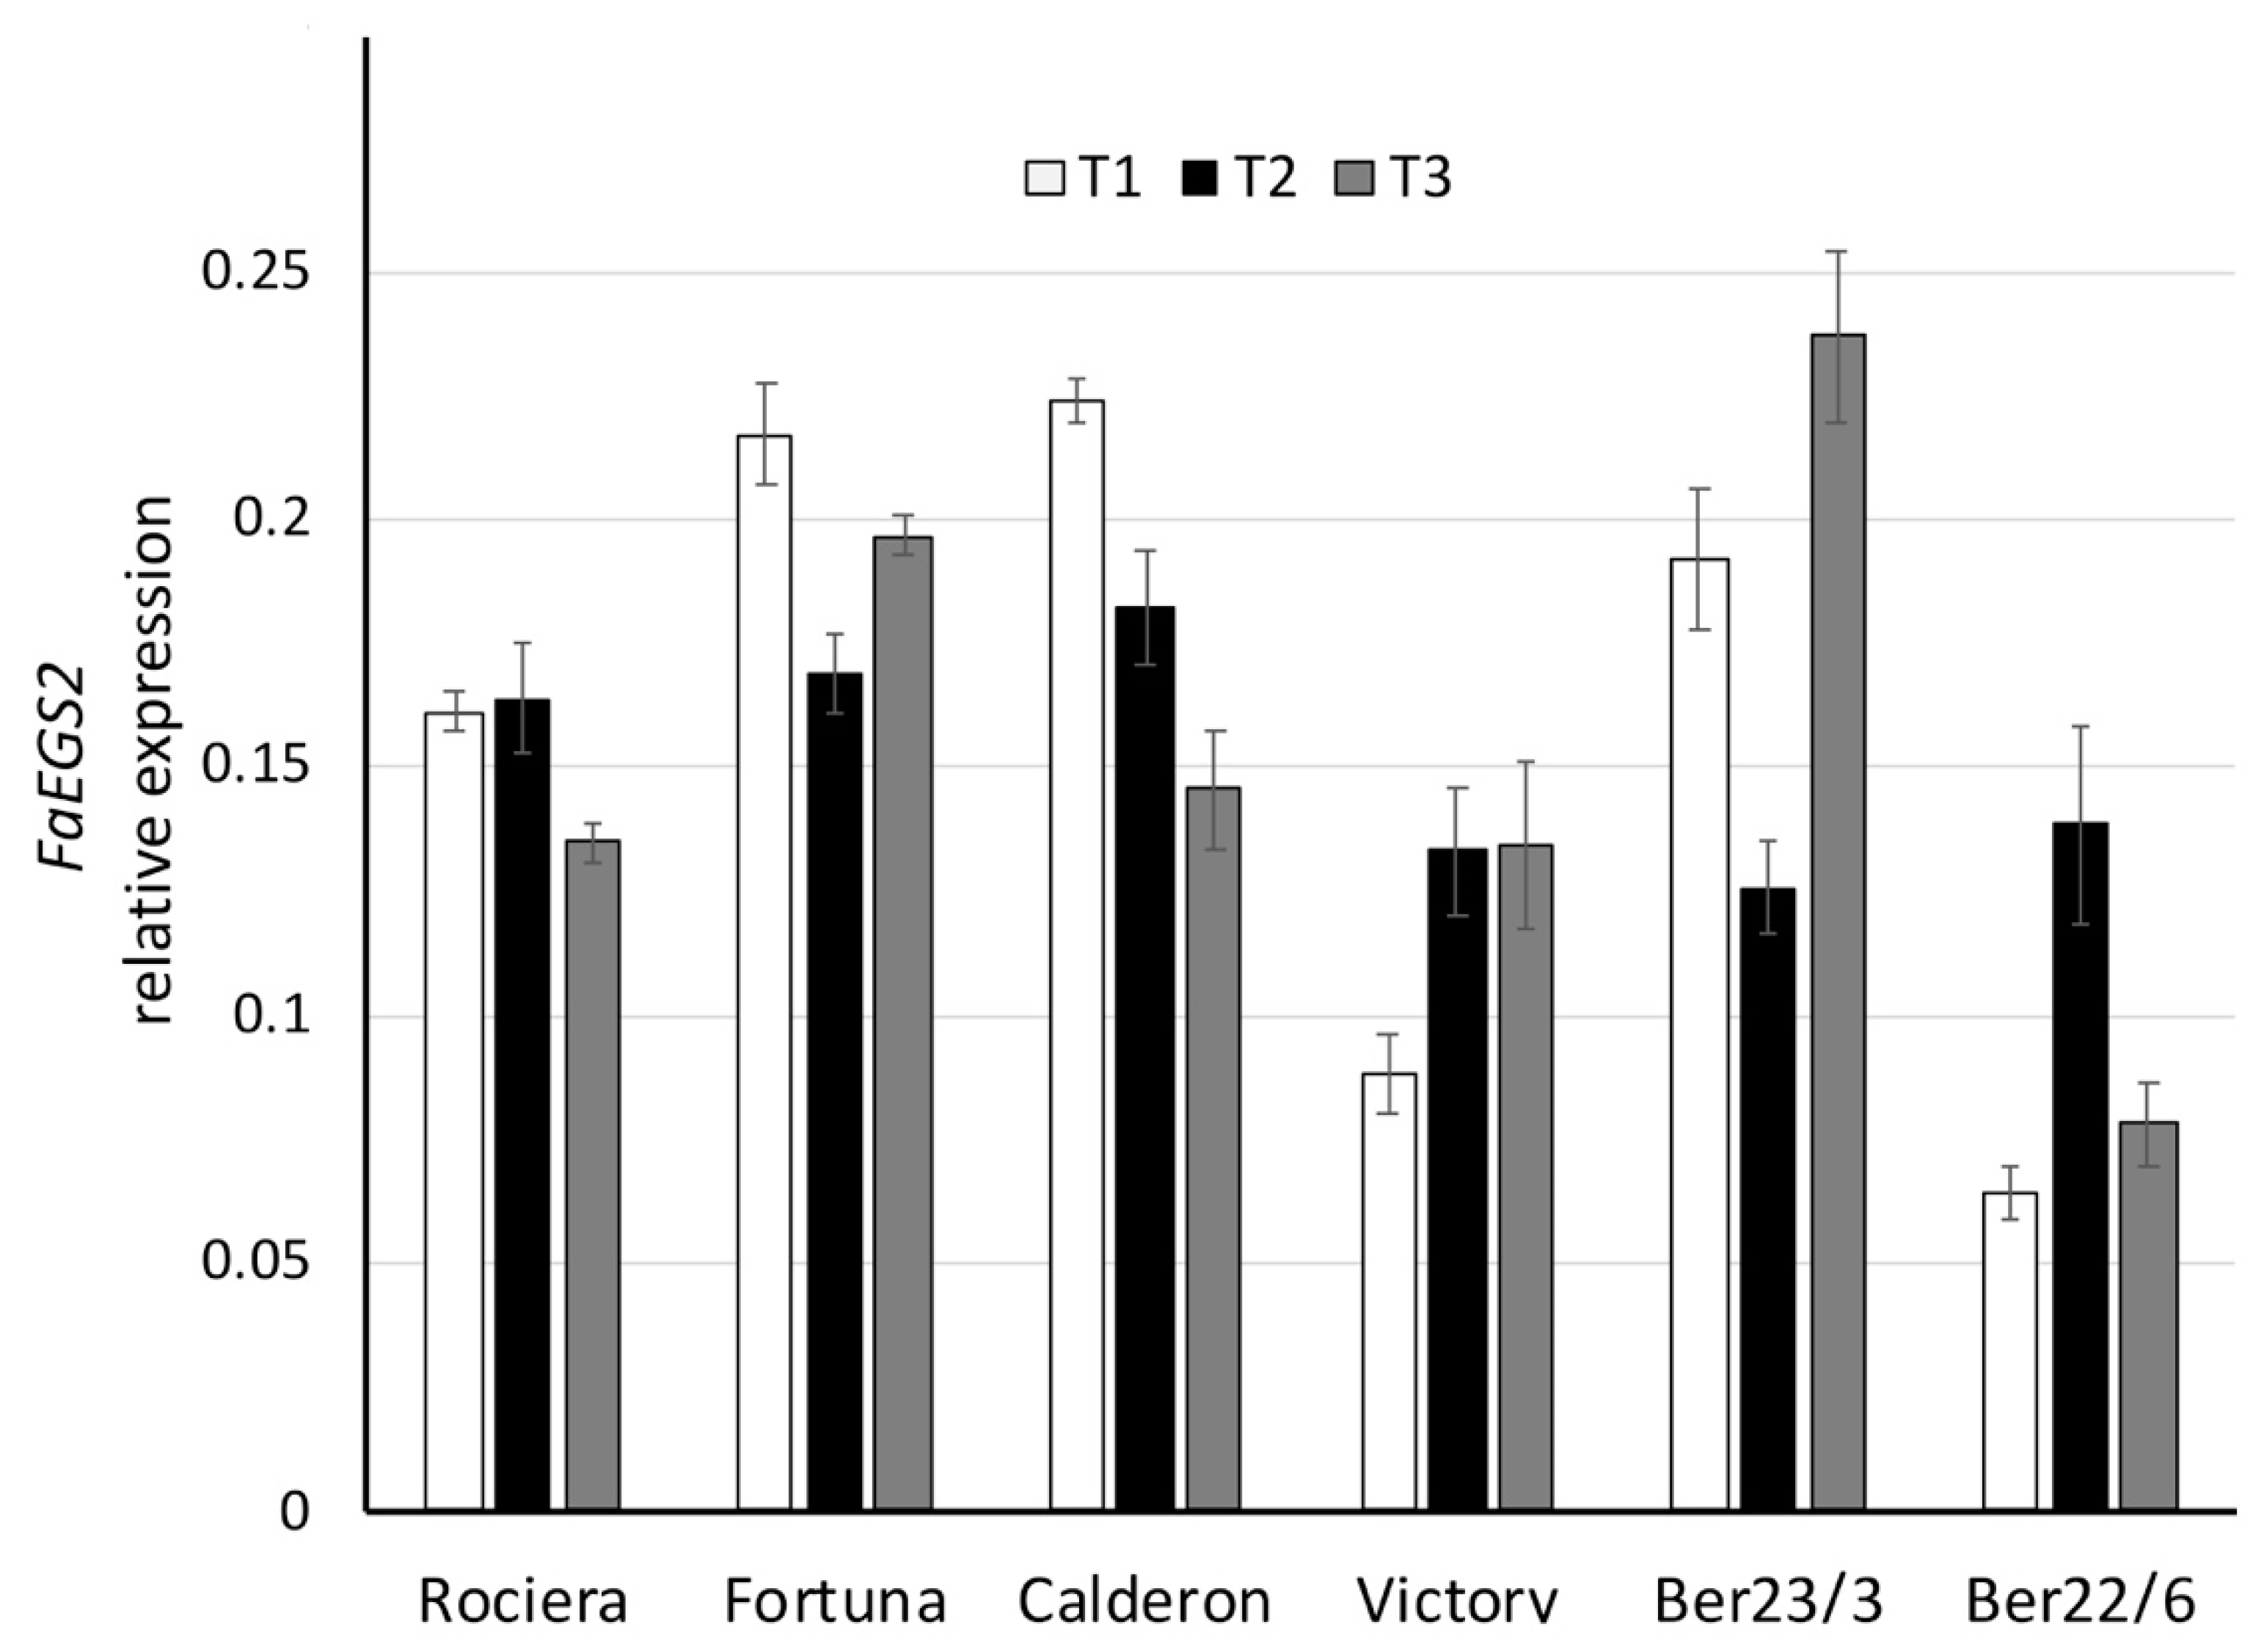
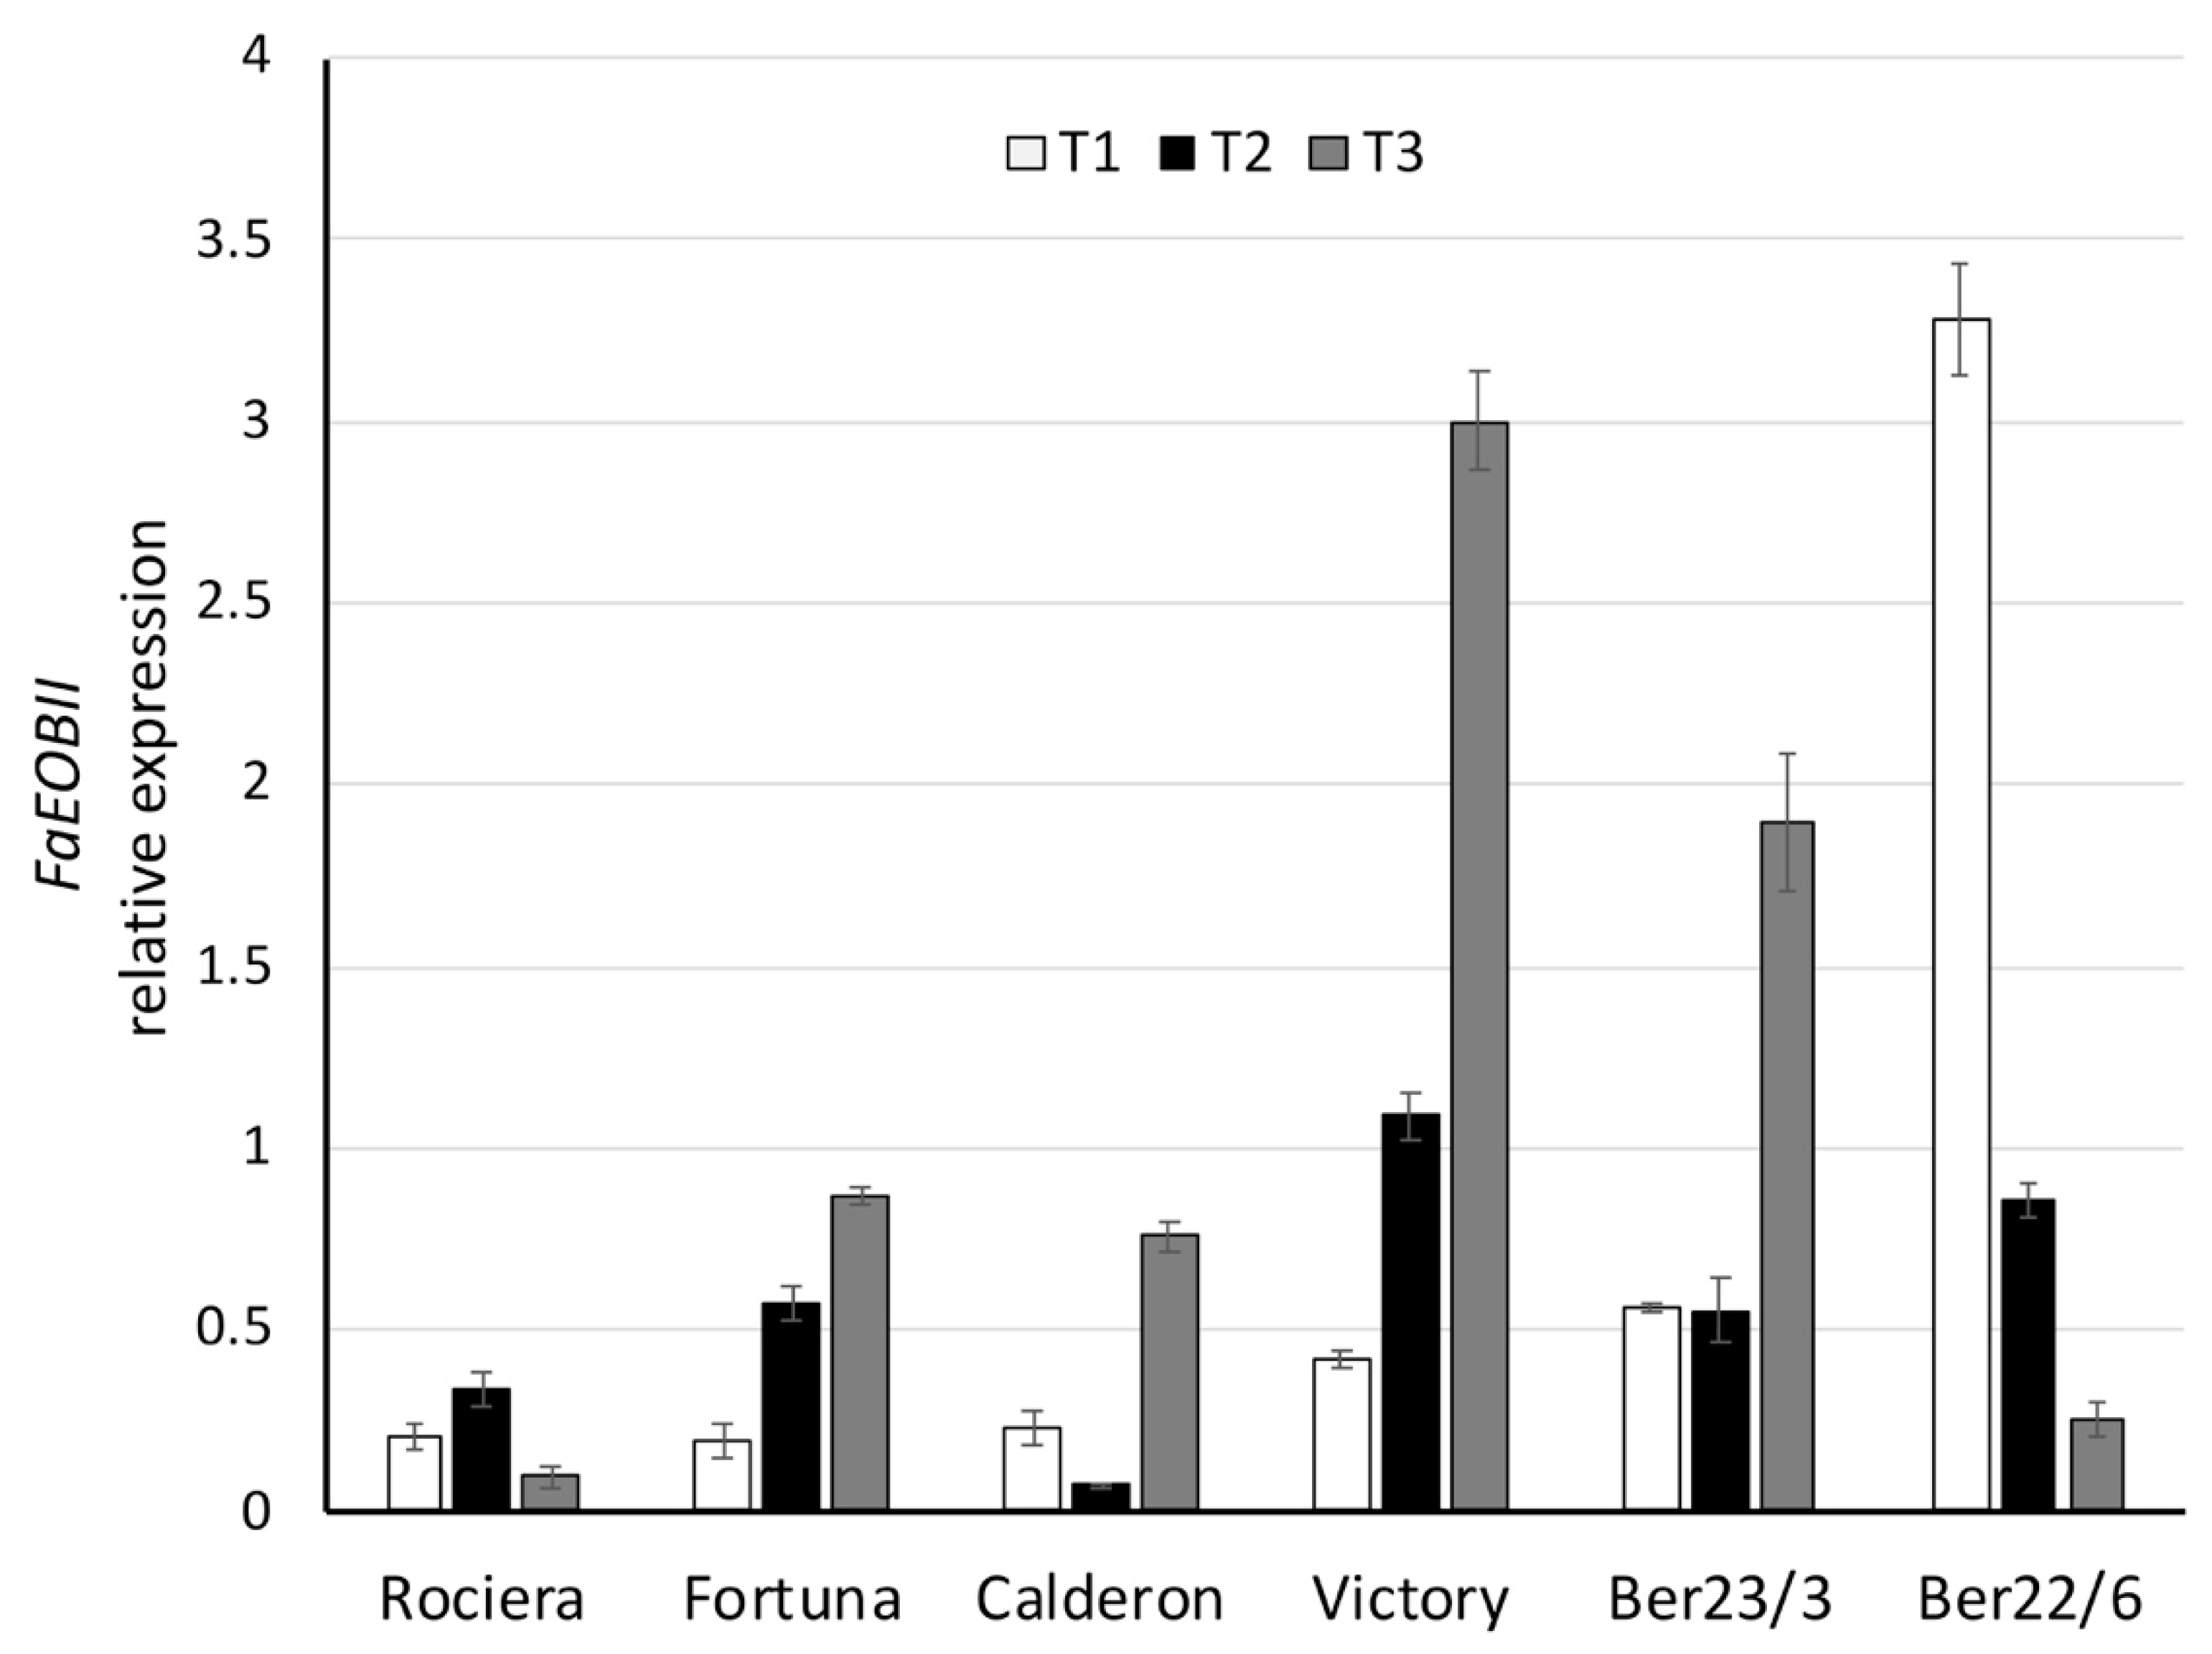
2.4. Expression Analysis of Key Flavor Genes and Transcription Factors (TFs)

qRT-PCR studies were performed to determine the temporal expression levels (on the three time points) of the six strawberry key genes (SAAT, FaFAD1, FaNES1, FaEGS2, FaMYB10 and FaEOBII) involved in fruit aroma, among the selected strawberry genotypes (‘Fortuna’, ‘Rociera’, ‘Victory’, Ber22/6, Ber23/3 and ‘Calderon’). GLM repeated measures ANOVA was used to evaluate the impact of genotype and harvest time on the expression of the six genes and the F values are presented in Table 3. Genotype, harvest time and their interaction had a significant effect (p < 0.001) on all genes, except for FaEGS2 that was not affected by harvest time.
SAAT expression analysis revealed that ‘Fortuna’, ‘Rociera’, ‘Victory’ and Ber23/3 genotypes showed a similar pattern with a peak at T2 (Figure 5, Table S3). On the contrary, Ber22/6 and ‘Calderon’ exhibited a different expression profile, showing a continuous decrease across the three time points. Ber22/6 revealed the higher SAAT transcript level at T1 (0.58), while ‘Calderon’—the lowest at T3 (0.17). In all genotypes we observed statistically significant expression differences over time (p ≤ 0.006), excluding Ber23/3 (Figure 5). Considering all time points, we observed the highest expression level for SAAT in the Ber22/6 genotype, while the lowest in the Ber23/3 and ‘Calderon’.
Regarding the FaFAD1 transcript analysis, ‘Fortuna’, ‘Rociera’ and Ber23/3 genotypes showed a similar expression profile revealing a peak at T2 followed by a significant decrease at T3, although Ber23/3 exhibited a smaller reduction compared to the others (Figure 6, Table S3). It is interesting to note that we did not detect any transcript titer neither in ‘Victory’ nor in Ber22/6 genotypes, while when considering all time points, the FaFAD1 transcript levels in ‘Calderon’ were significantly lower than the other three genotypes (‘Fortuna’, ‘Rociera’ and Ber23/3). In all genotypes we observed statistically significant different expression levels over time (p ≤ 0.001).
Regarding FaNES1 expression analysis, there was no common trend for the genotypes studied (Figure 7, Table S3). Nevertheless, all of them except Ber22/6 exhibited a peak at T2. On the other hand, in Ber22/6 a strong decrease of the mRNA transcripts was detected across the three time points (from 0.47 at T1 to 0.36 at T2, and finally to 0.14 at T3). We observed statistically significant expression differences over time in all genotypes (p < 0.04), except for ‘Calderon’ (Figure 7).
Although FaEGS2 expression levels were lower compared to the other genes, we observed various expression patterns among the six genotypes (Figure 8, Table S3). More specifically ‘Fortuna’ and Ber23/3 exhibited a decrease at T2, while Ber22/6 showed a high peak at that time point. Additionally, the expression level in the ‘Calderon’ decreased significantly through time. In all genotypes we observed statistically significant differences in expression over time (p < 0.05), excluding ‘Rociera’ (Figure 8). Considering the transcript levels of FaEGS2 at all time-points, the Ber22/6 genotype showed the lowest level (0.09), followed by ‘Victory’ (0.12) and ‘Rociera’ (0.15), while ‘Fortuna’, Ber23/3 and ‘Calderon’ exhibited higher expression levels.
In contrast with the above-mentioned genes, FaMYB10 exhibited a similar expression pattern across all analyzed strawberry genotypes (Figure 9, Table S3). The trend was an increase of gene expression at T2, followed by a decrease at T3. For all genotypes the transcript level was the highest at T2, while the lowest was detected at T3. The highest expression level (0.73) was observed in ‘Victory’, followed by ‘Fortuna’ (0.64). On the other hand, the lowest transcript level was detected in ‘Calderon’. In all genotypes we observed statistically significant different levels of expression over time (p < 0.001), excluding Ber23/3.
Regarding FaEOBII expression analysis, various expression profiles were observed among the genotypes examined (Figure 10, Table S3). More specifically, in ‘Fortuna’, ‘Victory’, Ber23/3 and ‘Calderon’, the expression level showed a peak at T3; in ‘Victory’ increased more than seven-fold over the harvest period (from 0.42 at T1 to 1.09 at T2, and finally to 3.00 at T3). In contrast, we detected a remarkable repression of FaEOBII gene in Ber22/6 over time; from 3.28 at T1 to 0.86 at T2, and to 0.25 at the last time point. The huge variance in the expression level among the different genotypes (ranging from 0.07 to 3.28), as well as within the same genotype (in Ber22/6 and ‘Victory’) is of great interest. Considering all time points, FaEOBII transcript levels were the lowest in ‘Rociera’ (0.21), followed by ‘Calderon’ (0.35) and ‘Fortuna’ (0.55), while in ‘Victory’ and Ber22/6 were significantly higher (1.50 and 1.46, respectively). Multivariate analysis revealed statistically significant expression differences over time in all genotypes studied (p < 0.025).

2.5. Correlation of Chemical and Genetic Data

SAAT expression did not correlate with the volatile esters’ content in this study. This lack of correlation is not in agreement with previous studies [51]. We believe that this discrepancy stems from the analytical approach we adopted for volatiles, since the percentage of esters was very small (<2%), whereas in other studies, e.g., on the headspace volatile fraction, it reaches up to 80% [51]. Moreover, in a pivotal study by Beekwilder et al. [52], it was shown that SAAT engineering in transgenic plants was not enough to increase volatile esters and their content depended on substrate availability (especially alcohols). Therefore, this lack of correlation might also be linked to the extremely low alcohol levels in our study.
On the other hand, moderate significant (p < 0.001) correlations of SAAT expression with furaneol (0.528), trans-cinnamic acid (0.519) and phenylpropanes (0.491) were observed for the first time. Yauk et al. [53] demonstrated that SAAT, like other alcohol acyl transferases, can utilize both p-coumaryl and coniferyl alcohol to produce p-hydroxycinnamyl acetates, and finally phenylpropanes, and is thus involved in their biosynthesis. In addition, in the recent thorough study on 148 different strawberry genotypes [1] a candidate for the quantitative trait locus for medium-chain volatile esters was a cinnamoyl-CoA reductase; the authors suggested that reduction may provide substrates for esterification.
A low significant negative correlation (−0.361, p = 0.007) of SAAT was recorded with decalactone; Although no such evidence exists for strawberry, the implication of peach AAT in decalactone biosynthesis has recently been reported [54].
FaFAD1 expression had a strong correlation (0.716, p = 0.000) with decalactone levels which is in accordance with previous studies [55,56,57]; more importantly, we confirm the previous findings that the FaFAD1 gene is present in every genotype where γ-decalactone has been detected, and it is missing in non-producers. Recently, a deletion of 8262 bp was consistently found in the FaFAD1 region of γ-decalactone non-producing varieties [58]. Another interesting observation was the strong correlation of FaFAD1 expression with nerolidol levels (0.665, p < 0.001) and a low negative correlation with trans-cinnamic acid and phenylpropanes (−0.316 and −0.327, p < 0.05). Concerning the latter, Sanchez-Sevilla et al. [56] comprised a list of the top 25 highly up-regulated genes in high decalactone-producing germplasm and the number one gene was a cinnamyl alcohol dehydrogenase-like that might decrease trans-cinnamic acid concentration in the fruits having high decalactone content, but this suggestion needs to be further investigated.
It is also interesting that FaEGS2 expression is moderately correlated with decalactone (0.536) and FaFAD1 expression (0.55). Eugenol was not quantified in our experimental setup and thus we could not test its correlation with FaEGS2, but we observed a low significant (p < 0.05) negative correlation with trans-cinnamic acid and phenylpropanes (−0.361 and −0.326, respectively) that might be explained in the following way: trans-cinnamic acid is a metabolic precursor of coniferyl acetate which is the substrate of EGS2, and thus the more active the enzyme is, the lower the cinnamic acid concentration gets.
FaNES1 does not correlate with nerolidol and linalool; nerolidol was quantified only in ‘Fortuna’ and ‘Rociera’ varieties and was absent in the other genotypes, whereas linalool was produced in all of them. Post-translational modifications, including phosphorylation, ubiquitination and arginine monomethylation of enzymes, might help in explaining situations where the mRNA level does not match with the metabolite or protein level, suggesting that post-translational modifications provide an additional regulatory step in determining the expression of key enzyme activities in secondary metabolic pathways [59].
FaMYB10 expression correlates positively with trans-cinnamic acid (0.398, p = 0.003), phenylpropanes (0.35, p = 0.009), and volatile aromatics (0.311, p = 0.022). This association confirms previous findings that FaMYB10 controls key genes involved either early in the shikimate pathway, the phenylpropanoid biosynthesis or later in the flavonoid biosynthesis [12,60].
FaMYB10 expression does not correlate with anthocyanin levels in our study. Moreover, in F. ananassa it does not regulate the anthocyanin synthase (ANS) gene [12], which seems to be regulated by other transcription factors like MYB1 or MYB5 [61]. When Wang et al. [62] silenced the gene encoding FaMYB5 in cultivar ‘Toyonaka’ (Fragaria × ananassa), they observed that FaANS expression level and anthocyanins were decreased, while the expression of FaMYB10 had no significant change. The expression of FaANS and of the other genes involved in the flavonoid biosynthetic pathway is positively or negatively correlated with anthocyanin or total phenolics level in a genotype specific manner [63], which might explain the lack of correlation we noticed with total anthocyanins and the negative correlation with total phenolics in the six genotypes. Moreover, in the study of Lin-Wang et al. [60], the volatile esters concentration was higher in 35S:MYB10 overexpressing F. vesca fruits and decreased in the knockdowns. The latter association with esters explains the strong positive correlation of SAAT expression with FaMYB10 (0.685, p < 0.001) which we report here for the first time. Another interesting correlation was that of FaMYB10 expression and glucose concentration (−0.436, p < 0.001), but not with the total sugars. It has been demonstrated that FaMYB10 regulates carbohydrate metabolism interacting also with other TFs such as FaMYB44.2 [12,64]. However, the strongest correlation of FaMYB10 was noted with FaNES expression (0.824, p < 0.001), which might denote involvement of FaMYB10 in the regulation of terpenoid biosynthesis as other R2R3-MYB TFs do [65]. We also observed a significant but low positive correlation (0.288, p = 0.034) with FaEOBII. According to Medina-Puche et al. [14], FaEOBII is under the control of FaMYB10 and plays a regulating role in the volatile phenylpropanoid pathway gene expression that gives rise to eugenol production in ripe strawberry receptacles.
Negative significant correlation was detected between FaEOBII and FaFAD1 (−0.383, p = 0.004) and between FaEOBII and nerolidol (−0.418, p = 0.002). It has been found that a similar R2R3-MYB TF (hcMYB2) is regulating floral volatile terpene production [66].
We were not able to detect any significant correlation between FaEOBII and FaEGS2 when we compared all the genotypes, although as it has been reported by Medina-Puche et al. [14], these two genes present similar expression patterns during ripening. Nevertheless, we found positive correlation between these two transcripts in ‘Rociera’ (0.748, p = 0.020), in ‘Victory’ (0.650, p = 0.050) and Ber23/3 (0.683, p = 0.042), indicating that activation of FaEGS2 promoter by FaEOBII could be genotype dependent. Medina-Puche et al. [14] observed significant differences in EGS2 expression between F. vesca and F. ananassa (more than 20-fold), whereas EOBII expression values were similar in both species, suggesting that higher expression levels of EGS2 and eugenol content in F. vesca could be the result of a higher degree of FvEGS2 promoter activation due to the presence of a greater number of MBSII regulatory boxes compared to the FaEGS2 promoter. In addition, other transcription factors may regulate FaEGS2 expression, synergistically with FaEOBII. For example, FaDOF2 has been found to physically interact with FaEOBII, suggesting that they could both act to regulate FaEGS2 expression and hence eugenol production in red-ripe receptacles [15].

3. Materials and Methods

3.1. Plant Cultivation

The experiment was conducted during the growing season 2019/2020 at the Research and Development (R&D) Department of Berryplasma World Ltd, Varda Ilias, Greece. Six different genotypes were cultivated at the same plantation under the same conditions. Four of them are commercial cultivars: ‘Rociera’ was developed by Nuevos Materiales (FNM) in Spain and launched in 2017, ‘Calderon’ by Masiá Ciscar S.A. in Spain, Florida ‘Fortuna’ by the University of Florida and is widely cultivated in many areas of the world, and finally ‘Victory’ by Plant Sciences/Berry Genetics. The rest (Ber22/6 and Ber23/3) are advanced selections of BerryPlasma World Ltd. The experiment was carried in commercial tunnels, each measuring 8.2 × 3.5 × 6.8 m (W × H × L). Mother plants of each variety were planted in 10L pots in summer 2019 and grown until they produced runner tips. All runner tips from each variety were harvested in July 2019 and plugged into trays. All misted tips were grown under the same conditions until planting in plastic tunnels of the R&D department. Strawberry plants were irrigated with a standard commercial nutrient solution applied through a drip irrigation system via a Dosatron (Dosatron International, Bordeaux, France) set at an electrical conductivity of 1.85 mS (N: 120 ppm, P: 50 ppm, K: 180 ppm, Mg: 30 ppm, Ca: 100 ppm, Fe: 5 ppm, Mn: 0.15 ppm, Zn: 0.15 ppm, B: 0.2 ppm, Cu: 0.02 ppm, Mo: 0.015 ppm, pH: 6.00). Plug plants of all genotypes were planted in 1 M coir growbags (Dutch Plantin, India) and were placed in raised beds at a density of 5 plants per growbag and 60,000 plants per ha in total.

3.2. Fruit Measurements and Experimental Design

Strawberry fruits were harvested at 5-day intervals during the autumn/winter (November–February) period and at 2-day intervals throughout the spring period (March-May). The experiment was conducted as a randomized complete block design with 6 genotypes (‘Fortuna’, ‘Victory’, ‘Rociera’, ‘Calderon’, Ber23/3 and Ber22/6), replicated 4 times (n = 4). Each replication consisted of 120 plants. All harvested fruits were used for the fruit number and fresh weights (g) analysis of each variety. The fruit yield and weight data were subjected to analysis of variance (ANOVA). Statistically significant differences among means were detected with the Least Significant Difference (LSD) method.
For the fruit quality parameters, samples for each variety and replication were taken at three time intervals—T1: early March (1/3–15/3), T2: late March (24/3–31/3), and T3: April (18/4–30/4). Each sample consisted of a minimum 500 g of fruit per replication. After collection, the fruits were stored at −20 °C before extraction.

3.3. Determination of Total Phenolics, Sugars, Anthocyanins and Antioxidant Capacity

Strawberry fruits (20–25 fruits of about 500 g total weight per biological replicate) were washed with deionized water and pulped with a hand mixer. The puree was collected in falcons and was stored at −20 °C. Four grams of puree was extracted with pure methanol–water (5:2, v/v) with stirring for 3 hours. Then, the mixture was centrifuged at 3000 rpm for 8 min. The supernatant was collected and totally dried using a speed vacuum (LabConco Corporation, Kansas City, MO, USA).
The total phenolic content (Folin–Ciocalteu method), ferric reducing antioxidant capacity (FRAP) method, total sugars, and anthocyanins, were determined in the solid extracts with colorimetric assays. The absorbance was measured in a UV/vis microplate reader (Sunrise, Tecan Group Ltd., Männedorf, Austria) against blanks using 96-well plates [24].
The total phenolic content was measured with the Folin–Ciocalteu reagent method and was expressed as mg of gallic acid equivalents (GAE) per g of fresh weight (FW) [24,67]. The absorbance was measured at 620 nm after one hour of incubation in the dark. A calibration curve was plotted with gallic acid standard dissolved in pure water (0.025–0.3 mg/mL).
Total sugar content was measured with the anthrone-sulfuric acid method and expressed as mg glucose equivalents per g of FW [24,68]. A standard aqueous glucose solution (0.08–1.00 mg/mL) was prepared to construct the calibration curve. The absorbance was measured at 620 nm.
The antioxidant capacity was measured with the ferric reducing antioxidant power (FRAP) method; when the [Fe(TPTZ)2]3+ complex reduces to the [Fe(TPTZ)2]2+ form in the presence of antioxidants, an intense blue color with absorption maximum at 593 nm develops [24,69]. The measurements were performed at 595 nm. An aqueous solution of FeSO4 × 7H2O (0.0069–0.1112 mg/mL) was used for calibration of the instrument. The results were expressed as mg of Fe2+ equivalents per g of FW.
Total monomeric anthocyanins were estimated by the pH differential method and were spectrophotometrically determined at 540 nm and 620 nm. The anthocyanin content was expressed as mg pelargonidin-3-glucoside (P-3-G) equivalents per g of FW (ε = 15,600 L/mol cm) [24,70].

3.4. Determination of Glucose and Ascorbic Acid Content

Glucose and ascorbic acid content in fruits of different strawberry varieties were determined with Reflectometer RQflex®20 (Merck S.A. Hellas, Athens, Greece). For this purpose, a part of the slurry was centrifuged at 4 °C at 13,000 rpm. The supernatant was collected and was used to estimate ascorbic acid and glucose concentration by reflectometric determination.
The Reflectoquant® Glucose test is appropriate for determining glucose in different food matrices and fruits. Under the catalytic effect of glucose oxidase, glucose is converted into gluconic acid lactone. In the presence of peroxidase, the hydrogen peroxide formed in the process reacts with an organic redox indicator to form a blue-green dye that is determined reflectometrically. Similarly, the Reflectoquant® Ascorbic acid test strips quickly measure levels of natural ascorbic acid. Ascorbic acid reduces yellow molybdophosphoric acid to phosphormolybdenum blue that is determined reflectometrically on the Reflectometer RQflex®.

3.5. GC/MS Analysis of Strawberry Volatiles

The fruit puree was centrifuged at 13,000 rpm for 30 min at 4 °C. Approximately, 30 g of supernatant were used to extract the volatile compounds of the strawberry. A quantity of 9.5 g of (NH4)2SO4 was added and dissolved by magnetic stirring [71]. Afterwards, 60 mL ethyl acetate (HPLC analysis grade) was added, and the mixture was stirred magnetically for 45 min. Τhe extract was collected and filtered through absorbent paper. Afterwards, 60 mL ethyl acetate was added again in the puree and the extraction was performed as before. The two extracts were combined and concentrated in the evaporator to final volume 1 mL. The solution was transferred in a 2 mL vial and the solvent was evaporated under air nitrogen flow. The dry extract was stored at −20 °C. For the determination of the volatile components, the dry extract was redissolved in tetrahydrofuran.
All samples were analyzed using a 6890 N Network GC System equipped with an 5975B mass selective detector (MSD) from Agilent Technologies (Santa Clara, CA, USA) in the electron impact (EI) mode of 70eV. The analysis of samples was performed according to Ayala-Zavala et al. [72] with small modifications. The capillary column was HP-5MS (30 m × 0.25 mm, 0.25 μm) with helium as carrier gas with flow 1 mL min−1, in a splitless mode and the m/z range was 38–1050. The injection volume was 1 μL. The column oven temperature was held for 1 min at 40 °C, then raised at 4 °C min−1 until it reached 230 °C. Furthermore, alkanes (C8–C15) were analyzed under the same conditions and were used as reference points for the calculation of retention indices with the van Den Dool and Kratz equation [36]. Compounds were identified by comparing the retention indices and mass spectra with library entries (NIST/EPA/NIH Mass Spectral Library, NIST) and Adams [73]. Finally, the program WSEARCH32 (Ver. 16/2005) was used for the quantification of volatile compounds.

3.6. RNA Isolation and Gene Expression Analysis by Quantitative Real-Time PCR (qRT-PCR)

Total RNA was extracted from the collected samples (three biological replicates per sample) through RNeasy Plant Minikit (Qiagen, Redwood City, CA, USA), according to the manufacturer’s protocol. First-strand cDNA synthesis of 500 ng of RNA in a final volume of 20 μL was performed using iScript cDNA synthesis kit (Bio-Rad Laboratories, Hercules, CA, USA), according to the manufacturer’s protocol. The synthesized cDNA was used as the template for qRT-PCR reactions in a total volume of 15 μL, consisting of 7 μL Sso Advanced Universal SYBR Green Supermix (Bio-Rad Laboratories, Hercules, CA, USA), 0.28 μL of each primer (10 μM), 6.94 μL of water, and 0.5 μL of cDNA on a CFX 96™ Real-Time PCR Detection System (Bio-Rad Laboratories, Hercules, CA, USA). The reaction was performed with an initial denaturation step at 95 °C for 5 min, followed by 39 cycles at 95 °C for 30 s, primer annealing temperature 59 °C for 30 s and extension temperature 72 °C for 1 min, with a plate read between each cycle. A melting curve analysis was conducted between 65 and 95 °C with a read every 0.5 °C held for 2 s between each read, to verify specificity of primer amplification, based on the presence of a single and sharp peak. Negative controls were included in all amplification reactions to check for potential reagent contamination.
The Relative Standard Curve method was used to calculate the transcript levels of the genes analyzed (SAAT, FaFAD1, FaNES1, FaEGS2, FaMYB10 and FaEOBII), using the corresponding specific primers [14,56,74,75,76,77] (the primers are listed in Table S4), among the analyzed strawberry genotypes. Expression data were normalized to the reference gene glyceraldehyde-3-phosphate dehydrogenase (GAPDH) as an internal control gene. Standard curves were prepared for all target genes, as well as the internal control gene, and were included in all qRT-PCR reactions. For each experimental sample, we determined the amount of target and internal reference gene from the appropriate standard curve. For each qRT-PCR run we used two technical replicates per cDNA sample (biological replicate).

3.7. Statistical Analysis of Chemical Traits and Gene Expression Data

General Linear Model (GLM) repeated measures ANOVA and Tukey post hoc test were used to statistically analyze (a) the chemical traits content (b) the VOCs, and (c) the RNA expression levels, for each genotype and harvest time point, evaluating the impact of the factors studied (genotype, harvest time and their interaction) on every variable. Moreover, Spearman’s nonparametric correlation analysis was performed to examine the correlation among the genetic and the chemical data. Significant differences were accepted if the p-value was <0.05. All analyses were carried out with IBM SPSS Statistics for Windows, version 27 (IBM Corp., Armonk, NY, USA).

4. Conclusions

The strawberry market is a high-value market with consumers expecting quality and freshness. Moreover, the need to cover consumers’ preferences, as well as the increasing demand for early production and at the same time constant supply, throughout the season, made growers and researchers work closely together to develop and introduce new varieties to meet the market needs.
The evaluation of new varieties is based on plant physiological measurements such as plant architecture, appearance of the fruit, earliness, continuity of production, total productivity, fruit size and marketability. In addition, fruit quality aspects such as fruit color, glossiness, sugar-to-acid ratio during the harvest period, flavor and aroma, resistance to diseases and postharvest life play a key role in strawberry acceptance. Finally, in recent years, fruit phytochemical compounds that benefit human health due to antioxidant activity also attracted attention as varietal quality attributes.
In this context, we evaluated fruit yield and size, sugars, phenolics and anthocyanins, ascorbic acid, antioxidant properties, fifty-five major volatiles and the expression levels of key enzymes in six strawberry genotypes (four cultivars and two advanced selections) cultivated under the same conditions in Greece. Earlier studies highlighted the key role of sugars and volatiles on final consumer acceptance, whereas phenolics, anthocyanins and ascorbic acid contribute to antioxidant activity and therefore to the nutritional benefits for human health. This is the first time, however, that all important agronomic, organoleptic and nutritional characteristics of many strawberry genotypes were simultaneously evaluated, combined also with gene expression analysis; therefore, we were able to reach meaningful observations. Using the appropriate statistical tools, we demonstrated significant intercorrelations among the variables studied. The most profound ones were those of FaFAD1 expression with decalactone and nerolidol, of SAAT with furaneol, trans-cinnamic acid and phenylpropanes, and of FaEGS2 with decalactone and FaFAD1. In addition, a strong positive correlation of SAAT expression was recorded with FaMYB10, and a moderate negative with glucose concentration. These correlations may indicate a strong genetic influence and therefore the responsible genes can be further investigated, as potential markers in strawberry breeding schemes for better aroma and other organoleptic traits. We further showed that both genotype and harvest time affected all traits, and gene expression levels, except for (1) anhydrides, fatty acids, aromatics and phenylpropanes, that were greatly affected by the harvest time, and (2) lactones, furaneol and FaEGS2 that were affected only by genotype. Therefore, the most important traits are determined by the genotype emphasizing the necessity and the potential of breeding programs.
The all-level comparison of the commercial varieties and the advanced breeding selections enabled us to pinpoint their merits. Both ‘Rociera’ and ‘Calderon’ had a high sugar content that was constant throughout the harvest period. ‘Calderon’ had the greatest average fruit weight, phenolic content, vitamin C levels and furans/lactones content. ‘Rociera’ surpassed all genotypes in the percentage of volatile compounds that impact flavor and particularly in the content of esters and short-chain acids. ‘Fortuna’ had many interesting intermediate traits and the highest terpene content, whereas the selection Ber23/3 presents a particular interest since it had a high sugar content, the highest phenolic, anthocyanin and lactone concentration and a high content of short-chain acids.

Supplementary Materials

The following are available online at https://www.mdpi.com/article/10.3390/ijms222413499/s1.

Author Contributions

Conceptualization, E.T., T.P., V.P. and F.N.L.; methodology, E.T., V.P. and F.N.L.; validation, E.T., V.P. and F.N.L.; investigation, V.K.L., E.D., E.T., E.V., T.P., V.P. and F.N.L.; resources, T.P., V.P. and F.N.L.; writing—original draft preparation, E.D., V.P., F.N.L.; writing—review and editing, E.T., V.P. and F.N.L.; supervision, E.T., V.P. and F.N.L.; funding acquisition, T.P., V.P. and F.N.L. All authors have read and agreed to the published version of the manuscript.

Funding

This research has been co-financed by the European Union and Greek national funds through the Regional Operational Program “Western Greece 2014-2020”, under the Call “Regional research and innovation strategies for smart specialization (RIS3) in Agri-Food” in the context of the project MIS 5040311 entitled “Selection of strawberry genotypes for variety breeding and integration into modern commercial production systems (Fragagen)”.

Institutional Review Board Statement

Not applicable.

Informed Consent Statement

Not applicable.

Data Availability Statement

Not applicable.

Acknowledgments

The authors wish to thank Charikleia Papaioannou and Eleni Liveri for technical assistance.

Conflicts of Interest

E.T., E.V. are employees, T.P. is the owner and managing director of Berryplasma World Ltd. Berryplasma World Ltd. has developed and owns the two strawberry advanced selection lines.

References

  1. Fan, Z.; Hasing, T.; Johnson, T.S.; Garner, D.M.; Schwieterman, M.L.; Barbey, C.R.; Colquhoun, T.A.; Sims, C.A.; Resende, M.F.R.; Whitaker, V.M. Strawberry sweetness and consumer preference are enhanced by specific volatile compounds. Hortic. Res. 2021, 8, 1–15. [Google Scholar] [CrossRef]
  2. Mezzetti, B.; Giampieri, F.; Zhang, Y.-T.; Zhong, C.-F. Status of strawberry breeding programs and cultivation systems in Europe and the rest of the world. J. Berry Res. 2018, 8, 205–221. [Google Scholar] [CrossRef]
  3. Prescott, J. Multisensory processes in flavour perception and their influence on food choice. Curr. Opin. Food Sci. 2015, 3, 47–52. [Google Scholar] [CrossRef]
  4. Yan, J.-W.; Ban, Z.-J.; Lu, H.-Y.; Li, D.; Poverenov, E.; Luo, Z.-S.; Li, L. The aroma volatile repertoire in strawberry fruit: A review. J. Sci. Food Agric. 2018, 98, 4395–4402. [Google Scholar] [CrossRef] [PubMed]
  5. Di Vittori, L.; Mazzoni, L.; Battino, M.; Mezzetti, B. Pre-harvest factors influencing the quality of berries. Sci. Hortic. 2018, 233, 310–322. [Google Scholar] [CrossRef]
  6. Ulrich, D.; Kecke, S.; Olbricht, K. What Do We Know about the Chemistry of Strawberry Aroma? J. Agric. Food Chem. 2018, 66, 3291–3301. [Google Scholar] [CrossRef]
  7. Zabetakis, I.; Holden, M.A. Strawberry Flavour: Analysis and Biosynthesis. J. Sci. Food Agric. 1997, 74, 421–434. [Google Scholar] [CrossRef]
  8. Cannon, R.J.; Agyemang, D.; Curto, N.L.; Yusuf, A.; Chen, M.Z.; Janczuk, A.J. In-depth analysis of Ciflorette strawberries (Fragaria × ananassa ‘Ciflorette’) by multidimensional gas chromatography and gas chromatography-olfactometry. Flavour Fragr. J. 2015, 30, 302–319. [Google Scholar] [CrossRef]
  9. Aharoni, A.; Giri, A.P.; Verstappen, F.W.; Bertea, C.M.; Sevenier, R.; Sun, Z.; Jongsma, M.; Schwab, W.; Bouwmeester, H. Gain and Loss of Fruit Flavor Compounds Produced by Wild and Cultivated Strawberry Species. Plant Cell 2004, 16, 3110–3131. [Google Scholar] [CrossRef] [PubMed] [Green Version]
  10. Koeduka, T.; Fridman, E.; Gang, D.R.; Vassão, D.G.; Jackson, B.L.; Kish, C.M.; Orlova, I.; Spassova, S.M.; Lewis, N.; Noel, J.P.; et al. Eugenol and isoeugenol, characteristic aromatic constituents of spices, are biosynthesized via reduction of a coniferyl alcohol ester. Proc. Natl. Acad. Sci. USA 2006, 103, 10128–10133. [Google Scholar] [CrossRef] [Green Version]
  11. Aragüez, I.; Osorio, S.; Hoffmann, T.; Rambla, J.L.; Medina-Escobar, N.; Granell, A.; Botella, M.Á.; Schwab, W.; Valpuesta, V. Eugenol Production in Achenes and Receptacles of Strawberry Fruits Is Catalyzed by Synthases Exhibiting Distinct Kinetics. Plant Physiol. 2013, 163, 946–958. [Google Scholar] [CrossRef] [Green Version]
  12. Medina-Puche, L.; Cumplido-Laso, G.; Amil-Ruiz, F.; Hoffmann, T.; Ring, L.; Franco, A.R.; Caballero, J.L.; Schwab, W.; Blanco, J.M.; Portales, R.B. MYB10 plays a major role in the regulation of flavonoid/phenylpropanoid metabolism during ripening of Fragaria × ananassa fruits. J. Exp. Bot. 2014, 65, 401–417. [Google Scholar] [CrossRef] [Green Version]
  13. Zhang, Z.; Shi, Y.; Ma, Y.; Yang, X.; Yin, X.; Zhang, Y.; Xiao, Y.; Liu, W.; Li, Y.; Li, S.; et al. The strawberry transcription factor FaRAV1 positively regulates anthocyanin accumulation by activation of FaMYB10 and anthocyanin pathway genes. Plant Biotechnol. J. 2020, 18, 2267–2279. [Google Scholar] [CrossRef] [PubMed] [Green Version]
  14. Medina-Puche, L.; Molina-Hidalgo, F.J.; Boersma, M.; Schuurink, R.C.; López-Vidriero, I.; Solano, R.; Franco-Zorrilla, J.M.; Caballero, J.L.; Portales, R.B.; Muñoz-Blanco, J. An R2R3-MYB Transcription Factor Regulates Eugenol Production in Ripe Strawberry Fruit Receptacles. Plant Physiol. 2015, 168, 598–614. [Google Scholar] [CrossRef] [PubMed] [Green Version]
  15. Molina-Hidalgo, F.J.; Medina-Puche, L.; Cañete-Gómez, C.; Franco-Zorrilla, J.M.; López-Vidriero, I.; Solano, R.; Caballero, J.L.; Rodríguez-Franco, A.; Blanco-Portales, R.; Muñoz-Blanco, J.; et al. The fruit-specific transcription factor FaDOF2 regulates the production of eugenol in ripe fruit receptacles. J. Exp. Bot. 2017, 68, 4529–4543. [Google Scholar] [CrossRef] [PubMed] [Green Version]
  16. Afrin, S.; Gasparrini, M.; Forbes-Hernandez, T.Y.; Reboredo-Rodriguez, P.; Mezzetti, B.; Varela-López, A.; Giampieri, F.; Battino, M. Promising Health Benefits of the Strawberry: A Focus on Clinical Studies. J. Agric. Food Chem. 2016, 64, 4435–4449. [Google Scholar] [CrossRef] [PubMed]
  17. Forbes-Hernandez, T.Y.; Gasparrini, M.; Afrin, S.; Bompadre, S.; Mezzetti, B.; Quiles, J.L.; Giampieri, F.; Battino, M. The Healthy Effects of Strawberry Polyphenols: Which Strategy behind Antioxidant Capacity? Crit. Rev. Food Sci. Nutr. 2016, 56, S46–S59. [Google Scholar] [CrossRef]
  18. Li, D.; Wang, P.; Luo, Y.; Zhao, M.; Chen, F. Health benefits of anthocyanins and molecular mechanisms: Update from recent decade. Crit. Rev. Food Sci. Nutr. 2017, 57, 1729–1741. [Google Scholar] [CrossRef]
  19. Cervantes, L.; Martínez-Ferri, E.; Soria, C.; Ariza, M.T. Bioavailability of phenolic compounds in strawberry, raspberry and blueberry: Insights for breeding programs. Food Biosci. 2020, 37, 100680. [Google Scholar] [CrossRef]
  20. Diamanti, J.; Capocasa, F.; Battino, M.; Mezzetti, B. Evaluation of F. × ananassa intra-specific and inter-specific backcrosses to generate new genetic material with increased fruit nutritional quality. J. Berry Res. 2010, 1, 103–114. [Google Scholar] [CrossRef] [Green Version]
  21. Fredericks, C.H.; Fanning, K.J.; Gidley, M.J.; Netzel, G.; Zabaras, D.; Herrington, M.; Netzel, M. High-anthocyanin strawberries through cultivar selection. J. Sci. Food Agric. 2013, 93, 846–852. [Google Scholar] [CrossRef]
  22. Mezzetti, B.; Balducci, F.; Capocasa, F.; Zhong, C.-F.; Cappelletti, R.; Di Vittori, L.; Mazzoni, L.; Giampieri, F.; Battino, M. Breeding Strawberry for Higher Phytochemicals Content and Claim It: Is It Possible? Int. J. Fruit Sci. 2016, 16, 194–206. [Google Scholar] [CrossRef]
  23. Correia, P.; Pestana, M.; Martínez, F.; Ribeiro, E.; Gama, F.; Saavedra, T.; Palencia, P. Relationships between strawberry fruit quality attributes and crop load. Sci. Hortic. 2011, 130, 398–403. [Google Scholar] [CrossRef]
  24. Zeliou, K.; Papasotiropoulos, V.; Manoussopoulos, Y.; Lamari, F.N. Physical and chemical quality characteristics and antioxidant properties of strawberry cultivars (Fragaria × ananassa Duch.) in Greece: Assessment of their sensory impact. J. Sci. Food Agric. 2018, 98, 4065–4073. [Google Scholar] [CrossRef]
  25. Davik, J.; Bakken, A.K.; Holte, K.; Blomhoff, R. Effects of genotype and environment on total anti-oxidant capacity and the content of sugars and acids in strawberries (Fragaria × ananassa Duch.). J. Hortic. Sci. Biotechnol. 2006, 81, 1057–1063. [Google Scholar] [CrossRef]
  26. Pangborn, R.M. Relative Taste Intensities of Selected Sugars and Organic Acids. J. Food Sci. 1963, 28, 726–733. [Google Scholar] [CrossRef]
  27. Doty, T.E. Fructose sweetness: A new dimension. Cereal Foods World 1976, 21, 62–63. [Google Scholar]
  28. Kawanobu, S.; Wajima, T.; Zushi, K.; Mori, T.; Matsuzoe, N. Seasonal Variations in the Maturation Period, Anthocyanin Content, and Ascorbic Acid Content in Strawberry Fruits. Environ. Control. Biol. 2010, 48, 175–184. [Google Scholar] [CrossRef]
  29. Tomić, J.; Pešaković, M.; Milivojevic, J.; Miletić, R.; Karaklajić-Stajić, Ž.; Paunović, S.; Milinković, M. Changes in anthocyanins and total phenols in fruit of three strawberry cultivars during five harvests. Acta Hortic. 2016, 1139, 633–638. [Google Scholar] [CrossRef]
  30. Jimenez-Garcia, S.N.; Guevara-Gonzalez, R.G.; Miranda-Lopez, R.; Feregrino-Perez, A.A.; Torres-Pacheco, I.; Vazquez-Cruz, M.A. Functional properties and quality characteristics of bioactive compounds in berries: Biochemistry, biotechnology, and genomics. Food Res. Int. 2013, 54, 1195–1207. [Google Scholar] [CrossRef]
  31. Giampieri, F.; Tulipani, S.; Alvarez-Suarez, J.M.; Quiles, J.L.; Mezzetti, B.; Battino, M. The strawberry: Composition, nutritional quality, and impact on human health. Nutrition 2012, 28, 9–19. [Google Scholar] [CrossRef] [PubMed]
  32. Tulipani, S.; Mezzetti, B.; Capocasa, F.; Bompadre, S.; Beekwilder, J.; de Vos, C.H.R.; Capanoglu, E.; Bovy, A.; Battino, M. Antioxidants, Phenolic Compounds, and Nutritional Quality of Different Strawberry Genotypes. J. Agric. Food Chem. 2008, 56, 696–704. [Google Scholar] [CrossRef] [PubMed]
  33. Kangina, I.B.; Bondarenko, N.F. Vliyanie meteorologicheskikh faktorov na kachestvo yagod zemlyaniki. The effect of meteorological factors on strawberry quality. Sadovodstvo 1987, 35, 65–69. [Google Scholar]
  34. Ariza, M.; Martínez-Ferri, E.; Domínguez, P.; Medina, J.; Miranda, L.; Soria, C. Effects of harvest time on functional compounds and fruit antioxidant capacity in ten strawberry cultivars. J. Berry Res. 2015, 5, 71–80. [Google Scholar] [CrossRef]
  35. National Institute of Standards and Technology. NIST WebBook. Available online: http://webbook.nist.gov/chemistry/ (accessed on 1 July 2021).
  36. Van Den Dool, H.; Kratz, P.D. A generalization of the retention index system including linear temperature programmed gas—liquid partition chromatography. J. Chromatogr. A 1963, 11, 463–471. [Google Scholar] [CrossRef]
  37. Acree, T.; Arn, H. Flavornet and Human Odor Space. Available online: http://www.flavornet.org/flavornet.html (accessed on 24 August 2021).
  38. Pérez, A.G.; Sanz, C. Strawberry Flavor. In Handbook of Fruit and Vegetable Flavors of Fruit and Vegetables Flavors; Hui, Y.H., Chen, F., Nollet, L.M.L., Eds.; John Wiley & Sons, Inc.: Hoboken, NJ, USA, 2010; pp. 431–449. ISBN 978-047-062-283-4. [Google Scholar]
  39. Gaborieau, S.; Cendrès, A.; Page, D.; Ginies, C.; Renard, C.M. Variability of free and glycosylated volatiles from strawberries destined for the fresh market and for processing, assessed using direct enzymatic hydrolysis. LWT 2018, 98, 187–196. [Google Scholar] [CrossRef] [Green Version]
  40. Song, Y.; Zhang, Y.-J.; Liu, N.; Ye, D.-Q.; Gong, X.; Qin, Y.; Liu, Y.-L. Volatile compounds in wild strawberry and their odorants of wild strawberry wines: Effects of different stages of fermentation. Int. J. Food Prop. 2017, 20, S399–S415. [Google Scholar] [CrossRef] [Green Version]
  41. Hussein, B.; Aldhaher, Z.A.; Abdu-Allah, S.N.; Hamdan, A. Bioactivity of Phenolic Compounds Extracted from Strawberry against Formation of Pseudomonas aeruginosa Biofilm. Int. J. Pharm. Qual. Assur. 2019, 10, 160–167. [Google Scholar] [CrossRef]
  42. Wintoch, H.; Krammer, G.; Schreier, P. Glycosidically bound aroma compounds from two strawberry fruit species, Fragaria vesca f. semperflorens and Fragaria × ananassa, cv. Korona. Flavour Fragr. J. 1991, 6, 209–215. [Google Scholar] [CrossRef]
  43. Álvarez-Fernández, M.A.; Cerezo, A.B.; Rodríguez, A.M.C.; Troncoso, A.M.; García-Parrilla, M.C. Composition of Nonanthocyanin Polyphenols in Alcoholic-Fermented Strawberry Products Using LC–MS (QTRAP), High-Resolution MS (UHPLC-Orbitrap-MS), LC-DAD, and Antioxidant Activity. J. Agric. Food Chem. 2015, 63, 2041–2051. [Google Scholar] [CrossRef]
  44. Kosar, M.; Kafkas, E.; Paydas, S.; Baser, K.H.C. Phenolic Composition of Strawberry Genotypes at Different Maturation Stages. J. Agric. Food Chem. 2004, 52, 1586–1589. [Google Scholar] [CrossRef] [PubMed]
  45. Herrera, M.; de Castro, M.D.L. Ultrasound-assisted extraction of phenolic compounds from strawberries prior to liquid chromatographic separation and photodiode array ultraviolet detection. J. Chromatogr. A 2005, 1100, 1–7. [Google Scholar] [CrossRef]
  46. Pérez, A.G.; Olías, R.; Sanz, C.; Olías, J.M. Furanones in Strawberries: Evolution during Ripening and Postharvest Shelf Life. J. Agric. Food Chem. 1996, 44, 3620–3624. [Google Scholar] [CrossRef]
  47. Jouquand, C.; Chandler, C.; Plotto, A.; Goodner, K. A Sensory and Chemical Analysis of Fresh Strawberries Over Harvest Dates and Seasons Reveals Factors That Affect Eating Quality. J. Am. Soc. Hortic. Sci. 2008, 133, 859–867. [Google Scholar] [CrossRef] [Green Version]
  48. Salameh, D.; Brandam, C.; Medawar, W.; Lteif, R.; Strehaiano, P. Highlight on the problems generated by p-coumaric acid analysis in wine fermentations. Food Chem. 2008, 107, 1661–1667. [Google Scholar] [CrossRef] [Green Version]
  49. Samykanno, K.; Pang, E.; Marriott, P.J. Genotypic and environmental effects on flavor attributes of ‘Albion’ and ‘Juliette’ strawberry fruits. Sci. Hortic. 2013, 164, 633–642. [Google Scholar] [CrossRef]
  50. Pelayo-Zaldivar, C.; Ebeler, S.E.; Kader, A.A. Cultivar and harvest date effects on flavor and other quality attributes of California strawberries. J. Food Qual. 2005, 28, 78–97. [Google Scholar] [CrossRef]
  51. Parra-Palma, C.; Úbeda, C.; Gil, M.; Ramos, P.; Castro, R.I.; Morales-Quintana, L. Comparative study of the volatile organic compounds of four strawberry cultivars and it relation to alcohol acyltransferase enzymatic activity. Sci. Hortic. 2019, 251, 65–72. [Google Scholar] [CrossRef]
  52. Beekwilder, J.; Alvarez-Huerta, M.; Neef, E.; Verstappen, F.W.; Bouwmeester, H.; Aharoni, A. Functional Characterization of Enzymes Forming Volatile Esters from Strawberry and Banana. Plant Physiol. 2004, 135, 1865–1878. [Google Scholar] [CrossRef] [Green Version]
  53. Yauk, Y.-K.; Souleyre, E.J.; Matich, A.J.; Chen, X.; Wang, M.Y.; Plunkett, B.; Dare, A.P.; Espley, R.; Tomes, S.; Chagné, D.; et al. Alcohol acyl transferase 1 links two distinct volatile pathways that produce esters and phenylpropenes in apple fruit. Plant J. 2017, 91, 292–305. [Google Scholar] [CrossRef] [PubMed]
  54. Peng, B.; Yu, M.; Zhang, B.; Xu, J.; Ma, R. Differences in PpAAT1 Activity in High- and Low-Aroma Peach Varieties Affect γ-Decalactone Production. Plant Physiol. 2020, 182, 2065–2080. [Google Scholar] [CrossRef] [PubMed]
  55. Chambers, A.H.; Pillet, J.; Plotto, A.; Bai, J.; Whitaker, V.M.; Folta, K.M. Identification of a strawberry flavor gene candidate using an integrated genetic-genomic-analytical chemistry approach. BMC Genom. 2014, 15, 217. [Google Scholar] [CrossRef] [Green Version]
  56. Sánchez-Sevilla, J.F.; Cruz-Rus, E.; Valpuesta, V.; A Botella, M.; Amaya, I. Deciphering gamma-decalactone biosynthesis in strawberry fruit using a combination of genetic mapping, RNA-Seq and eQTL analyses. BMC Genom. 2014, 15, 218. [Google Scholar] [CrossRef] [PubMed] [Green Version]
  57. Cruz-Rus, E.; Sesmero, R.; Ángel-Pérez, J.A.; Sevilla, J.F.S.; Ulrich, D.; Amaya, I. Validation of a PCR test to predict the presence of flavor volatiles mesifurane and γ-decalactone in fruits of cultivated strawberry (Fragaria × ananassa). Mol. Breed. 2017, 37, 1–15. [Google Scholar] [CrossRef]
  58. Oh, Y.; Barbey, C.R.; Chandra, S.; Bai, J.; Fan, Z.; Plotto, A.; Pillet, J.; Folta, K.M.; Whitaker, V.M.; Lee, S. Genomic Characterization of the Fruity Aroma Gene, FaFAD1, Reveals a Gene Dosage Effect on γ-Decalactone Production in Strawberry (Fragaria × ananassa). Front. Plant Sci. 2021, 12, 1–14. [Google Scholar] [CrossRef]
  59. Singh, P.; Kalunke, R.M.; Giri, A.P. Towards comprehension of complex chemical evolution and diversification of terpene and phenylpropanoid pathways in Ocimum species. RSC Adv. 2015, 5, 106886–106904. [Google Scholar] [CrossRef]
  60. Lin-Wang, K.; McGhie, T.K.; Wang, M.Y.; Liu, Y.; Warren, B.; Storey, R.; Espley, R.V.; Allan, A.C. Engineering the anthocyanin regulatory complex of strawberry (Fragaria vesca). Front. Plant Sci. 2014, 5, 1–14. [Google Scholar] [CrossRef] [Green Version]
  61. Aharoni, A.; De Vos, C.H.R.; Wein, M.; Sun, Z.; Greco, R.; Kroon, A.; Mol, J.N.M.; O’Connell, A.P. The strawberry FaMYB1 transcription factor suppresses anthocyanin and flavonol accumulation in transgenic tobacco. Plant J. 2001, 28, 319–332. [Google Scholar] [CrossRef] [PubMed]
  62. Wang, L.; Tang, H.; Wang, X.; Chen, Q.; Jiang, L.; Lin, Y. Virus-induced gene silencing as a tool for FaMYB5 gene functional studies in strawberry. Acta Hortic. Sin. 2017, 44, 33–42. [Google Scholar]
  63. Parra-Palma, C.; Morales-Quintana, L.; Ramos, P. Phenolic Content, Color Development, and Pigment−Related Gene Expression: A Comparative Analysis in Different Cultivars of Strawberry during the Ripening Process. Agronomy 2020, 10, 588. [Google Scholar] [CrossRef] [Green Version]
  64. Wei, L.; Mao, W.; Jia, M.; Xing, S.; Ali, U.; Zhao, Y.; Chen, Y.; Cao, M.; Dai, Z.; Zhang, K.; et al. FaMYB44.2, a transcriptional repressor, negatively regulates sucrose accumulation in strawberry receptacles through interplay with FaMYB. J. Exp. Bot. 2018, 69, 4805–4820. [Google Scholar] [CrossRef] [PubMed] [Green Version]
  65. Abbas, F.; Ke, Y.; Zhou, Y.; Yu, R.; Imran, M.; Amanullah, S.; Rothenberg, D.O.; Wang, Q.; Wang, L.; Fan, Y. Functional Characterization of Hedychium coronarium J. Koenig MYB132 Confers the Potential Role in Floral Aroma Synthesis. Plants 2021, 10, 2014. [Google Scholar] [CrossRef] [PubMed]
  66. Ke, Y.; Abbas, F.; Zhou, Y.; Yu, R.; Fan, Y. Auxin-Responsive R2R3-MYB Transcription Factors HcMYB1 and HcMYB2 Activate Volatile Biosynthesis in Hedychium coronarium Flowers. Front. Plant Sci. 2021, 12, 1–18. [Google Scholar] [CrossRef]
  67. Singleton, V.L.; Rossi, J.A., Jr. Colorimetry of total phenolics with phosphomolybdic-phosphotungstic acid reagents. Am. J. Enol. Vitic. 1965, 16, 144–158. [Google Scholar]
  68. Laurentin, A.; Edwards, C. A microtiter modification of the anthrone-sulfuric acid colorimetric assay for glucose-based carbohydrates. Anal. Biochem. 2003, 315, 143–145. [Google Scholar] [CrossRef]
  69. Benzie, I.F.F.; Strain, J.J. The ferric reducing ability of plasma (FRAP) as a measure of “antioxidant power”: The FRAP assay. Anal. Biochem. 1996, 239, 70–76. [Google Scholar] [CrossRef] [Green Version]
  70. Giusti, M.M.; Wrolstad, R.E. Characterization and measurement of anthocyanins by UV-visible spectroscopy. In Current Protocols in Food Analytical Chemistry; Wrolstad, R.E., Acree, T.E., An, H., Decker, E.A., Penner, M.H., Reid, D.S., Schwartz, S.J., Shoemaker, C.F., Sporns, P., Eds.; John Wiley & Sons: New York, NY, USA, 2001; pp. F1.2.1–F1.2.13. [Google Scholar] [CrossRef]
  71. López, R.; Aznar, M.; Cacho, J.; Ferreira, V. Determination of minor and trace volatile compounds in wine by solid-phase extraction and gas chromatography with mass spectrometric detection. J. Chromatogr. A 2002, 966, 167–177. [Google Scholar] [CrossRef]
  72. Zavala, J.F.A.; Wang, S.Y.; Wang, C.Y.; A González-Aguilar, G. Effect of storage temperatures on antioxidant capacity and aroma compounds in strawberry fruit. LWT 2004, 37, 687–695. [Google Scholar] [CrossRef]
  73. Adams, R.P. Identification of Essential Oil Components by Gas Chromatography/Mass Spectrometry, 4th ed.; Allured Publishing Corporation: Carol Stream, IL, USA, 2007; ISBN 978-1-932633-21-4. [Google Scholar]
  74. Negri, A.S.; Allegra, D.; Simoni, L.; Rusconi, F.; Tonelli, C.; Espen, L.; Galbiati, M. Comparative analysis of fruit aroma patterns in the domesticated wild strawberries “Profumata di Tortona” (F. moschata) and “Regina delle Valli” (F. vesca). Front. Plant Sci. 2015, 6, 56. [Google Scholar] [CrossRef] [PubMed] [Green Version]
  75. Fu, X.; Cheng, S.; Zhang, Y.; Du, B.; Feng, C.; Zhou, Y.; Mei, X.; Jiang, Y.; Duan, X.; Yang, Z. Differential responses of four biosynthetic pathways of aroma compounds in postharvest strawberry (Fragaria × ananassa Duch.) under interaction of light and temperature. Food Chem. 2017, 221, 356–364. [Google Scholar] [CrossRef]
  76. Baldi, P.; Orsucci, S.; Moser, M.; Brilli, M.; Giongo, L.; Ammour, A.S. Gene expression and metabolite accumulation during strawberry (Fragaria × ananassa) fruit development and ripening. Planta 2018, 248, 1143–1157. [Google Scholar] [CrossRef] [PubMed]
  77. Salvatierra, A.; Pimentel, P.; Moya-Leon, M.A.; Caligari, P.D.; Herrera, R. Comparison of transcriptional profiles of flavonoid genes and anthocyanin contents during fruit development of two botanical forms of Fragaria chiloensis ssp. chiloensis. Phytochemistry 2010, 71, 1839–1847. [Google Scholar] [CrossRef] [PubMed]
Figure 1. Marketable fruit yield per plant (g) and average fruit weight (g) over the harvest period.
Ijms 22 13499 g001
Figure 2. Total sugar and glucose concentration at each time-point for each genotype. Three biological and at least three technical replicates per sample were used.
Ijms 22 13499 g002
Figure 3. Total phenolics and anthocyanin concentration at each time-point for each genotype. Three biological and at least three technical replicates per sample were used.
Ijms 22 13499 g003
Figure 4. Ascorbic acid concentration and ferric reducing capacity (FRAP), a measure of antioxidant power of each genotype, at each time-point. Three biological and at least three technical replicates per sample were used.
Ijms 22 13499 g004
Figure 5. Comparative analysis of SAAT gene expression at 3 different time points in 6 different strawberry genotypes. Relative SAAT transcript levels were normalized using GAPDH as an internal control gene (expression level = ratio SAAT molecules/GAPDH molecules). Three biological and two technical replicates per sample were used.
Ijms 22 13499 g005
Figure 6. Comparative analysis of FaFAD1 gene expression at 3 different time points in 6 different strawberry genotypes. Relative FaFAD1 transcript levels were normalized using GAPDH as an internal control gene (expression level = ratio FaFAD1 molecules/GAPDH molecules). Three biological and two technical replicates per sample were used.
Ijms 22 13499 g006
Figure 7. Comparative analysis of FaNES1 gene expression at 3 different time points in 6 different strawberry genotypes. Relative FaNES1 transcript levels were normalized using GAPDH as an internal control gene (expression level = ratio FaNES1 molecules/GAPDH molecules). Three biological and two technical replicates per sample were used.
Ijms 22 13499 g007
Figure 8. Comparative analysis of FaEGS2 gene expression at 3 different time points in 6 different strawberry genotypes. Relative FaEGS2 transcript levels were normalized using GAPDH as an internal control gene (expression level = ratio FaEGS2 molecules/GAPDH molecules). Three biological and two technical replicates per sample were used.
Ijms 22 13499 g008
Figure 9. Comparative analysis of FaMYB10 gene expression at 3 different time points in 6 different strawberry genotypes. Relative FaMYB10 transcript levels were normalized using GAPDH as an internal control gene (expression level = ratio FaMYB10 molecules/GAPDH molecules). Three biological and two technical replicates per sample were used.
Ijms 22 13499 g009
Figure 10. Comparative analysis of FaEOBII gene expression at 3 different time points in 6 different strawberry genotypes. Relative FaEOBII transcript levels were normalized using GAPDH as an internal control gene (Expression level = Ratio FaEOBII molecules/GAPDH molecules). Three biological and two technical replicates per sample were used.
Ijms 22 13499 g010
Table 1. List of abundant identified VOCs (>0.1% at least at one time point). The experimental and literature retention indices (RIs) are presented along with the compound category, the range of % peak area percentages, references whether it impacts flavor and references of previous occurrence in strawberries.
NoRIexpRIlitCompoundCompound CategoryFlavor ImpactRange of Peak Area PercentagesRef.
17777852-Methylpropanoic acid
(isobutyric acid)
Acidsa: rancid, butter, cheese0.08–0.94b, c, d
27998022,3-ButanediolAlcoholsa: fruit, onion; f: creamy<0.31e, f
3803802Ethyl butanoateEstersa: apple; b: estery, fruity, sweet; g<0.33b, c, d, g
4805790Butanoic acid
(butyric acid)
Acidsa: rancid, cheese, sweat; b: cheesy, fruity; gtr.<4.23b, c, d, g
5831811bMethyl 2-hydroxybutanoate (methyl 2-hydroxy butyrate)Esters <0.21b
6834830/832/839FurfuralFuransa: bread, almond, sweet<0.22b, c, d
7856827 (Kovat’s index)Maleic anhydridestd
(cis-butenedioic anhydride; 2,5-furandione)
Furans/Anhydrides 0.59–8.83
8871846/8862-Methylbutanoic acidAcidsb: cheesy, stinky; g0.03–4.86b, c, d, g
9890890Styrene
(vinylbenzene)
Aromatic compoundsa: balsamic, gasoline<1.44b
10915915/916/922Butyrolactone
[dihydrofuran-2(3H)-one]
Furans/Lactonesa: caramel-sweet0.12–0.66c
11925924Methyl n-hexanoate
(methyl caproate)
Estersa: fruit, fresh, sweet<0.12b, c, d, g
12947949 (ZB-5)Citraconic anhydride
(3-methyl-2,5-furandione)
Furans/Anhydrides 0.73–9.00b
13979977 (VF-5MS)3-Hydroxybutanoic acidAcids <6.49
14990981PhenolAromatic compoundsa: phenol<0.51b,f
151001996Ethyl hexanoate
(ethyl caproate)
Estersa: apple, peel, fruit; b: fruity, sweet; g<0.15b, c, d, g
16992996/1001/1003/1005/1006α-Phellandrene *Terpenesa: dill<0.17 *d
17992987/994/970/988/992/998/990/9932-Pentylfuran *Furansa: green bean, butter b, d
181006977/981Hexanoic acid
(n-caproic acid)
Acidsb: sour, cheesy0.44–12.84b, c, d, g
191016995/1008/1013-1018Terpilene
(α-terpinene)
Terpenesa: lemon<0.11b, d
2010261022 (non-polar)Succinic anhydride std
(dihydro-2,5-furandione)
Furans/Anhydrides 0.59–3.15e
2110281007/1020/1022/1025–1033LimoneneTerpenesa: citrus, mint<0.30b, c, d
2210381020/1033–1036/1042Benzyl AlcoholAromatic compoundsa: sweet, flower; g0.43–1.39b, c, d, g
231040967 (DB-1)Itaconic anhydride *
(dihydro-3-methylene-2,5-furandione)
Furans/Anhydrides 0.90–2.75 *e
2410401014bPantolactone *
[dihydro-3-hydroxy-4,4-dimethyl-2(3H)-furanone;
2-hydroxy-3,3-dimethyl-γ-butyrolactone]
Furans/Lactonesa: cotton candy b
2510491017/1020/1029/1033/1037–1040cis-Ocimene
(cis-3,7-dimethyl-1,3,6-octatriene)
Terpenesa: citrus, herb, flower<0.16b
2610571056γ-Hexalactone
[γ-ethyl-γ-butyrolactone,
dihydro-5-ethyl-2(3H)-furanone, γ-caprolactone]
Furans/Lactones <0.27b, c, d
2710631065Mesifurane
[2,5-dimethyl-4-methoxy-3(2H)-furanone; DMMF]
Furansb: toffee, sugary, sweet; g0.24–1.29b, c, d, g
2810761055/1072/1097Furaneol
[2,5-dimethyl-4-hydroxy-3(2H)-furanone; DMHF]
Furansa: caramel; b: sweet, candy, caramellic; g0.42–4.55b, c, d, g
2910881067/1071/1076/1080/1085–1089Terpinolene
[p-mentha-1,4(8)-diene]
Terpenes <0.16b, d
3010891065/1069/1087–1088/1091trans-Linalool oxide (furanoid)
[trans-5-ethenyltetrahydro-α,α,5-trimethyl-2-furanmethanol]
Terpenesa: flower<0.18b, c
3110981084 (DB-5)δ-Hexalactone
(tetrahydro-6-methyl-2H-pyran-2-one; δ-caprolactone)
Lactones <0.26b, c, d
3211021079/1082/1092/1094/1097–1105Linalool
(3,7-dimethyl-1,6-octadien-3-ol)
Terpenesa: flower, lavender; b: floral0.06–0.63b, c, d
331115-Levoglucosenone *Ketones 0.20–1.03 *h
3411151109/1114–1119/11392-Phenylethyl Alcohol *
(benzeneethanol)
Aromatic compoundsa: honey, spice, rose, lilac b, c, d
3511731163 (DB-5MS)4-EthylphenolAromatic compoundsa: must0.14–0.87
3611801159/1178Benzoic AcidAromatic compoundsa: urine0.09–0.45b, c, d
3711921187/11921-DodeceneAlkenes <0.20
3812161197 (DB-5)1,2-Benzenediol
(pyrocatechol; 2-hydroxyphenol; catechol)
Aromatic compounds <0.52i
3912281223–1224 (SPB-5)Coumaran
(2,3-dihydrobenzofuran)
Aromatic compoundse: green tea1.35–5.62e
4013191326 (VF-5MS)Salicylic acid std *
(o-hydroxybenzoic acid; phenol-2-carboxylic acid)
Aromatic compounds 0.13–1.30 *c, d
4113191314–13182-Methoxy-4-vinylphenol *Aromatic compounds b, c, d
4213861343bcis-Cinnamic acid
[(Z)-3-phenyl-2-propenoic acid)
Aromatic compounds/Phenylpropanoids 0.07–0.47b, d, i
4314421432Tyrosol
(4-hydroxyphenylethyl alcohol)
Aromatic compounds <0.88b, c, i
4414711450/1462 (DB-1)trans-Cinnamic acid std
[(E)-3-phenyl-2-propenoic acid]
Aromatic compounds/Phenylpropanoidsa: honey19.41–37.28b, c, d, i
4514721470γ-Decalactone
[5-hexyldihydro-2(3H)-furanone]
Furans/Lactonesa: peach, fat; b: sweet, peach, lactonic; g<2.49b, c, d, g
4615531491 (LM-5)Levoglucosan *
(1,6-anhydro-β-D-glucopyranose)
Others 0.30–7.88 *
4715531538 (VF-5MS)p-Salicylic acid * std
(4-hydroxybenzoic acid; paraben-acid; 4-carboxyphenol )
Aromatic compounds
4815661544/1561–1563/1568/1569trans-Nerolidol
[(E)-3,7,11-trimethyldodeca-1,6,10-trien-3-ol]
Terpenesa: wax; g<0.57b, c, d, g
4915711559/1566/−1568/1570/1573/1576Dodecanoic acid
(lauric acid)
Acids/Fatty acids <0.23b, c, d
5016591659Homovanilic acid *
(4-hydroxy-3-methoxybenzeneacetic acid; vanilacetic acid)
Aromatic compounds 1.08–2.69 *j
5116591658Bisabolol oxide II *Terpenes
5216831675γ-Dodecalactone
[dihydro-5-octyl-2(3H)-furanone]
Furans/Lactonesa: sweet, flower, fruit; g<0.24b, c, d, g
5317651759/1767/1769/1770/1777/1780/1787/1790Tetradecanoic acid
(myristic acid)
Acids/Fatty acids <0.53b, c, d
5418641869/1878Pentadecanoic acidAcids/Fatty acids <0.44c
5518811871/1879/18821-Hexadecanol
(cetyl alcohol)
Alcoholsa: flower, wax<0.33
5618881881 (DB-1)Ferulic acid
[(E)-4-hydroxy-3-methoxycinnamic acid]
Aromatic compounds/Phenylpropanoids <0.31j, l
5719441953 (HP-5)Z-11-Hexadecenoic acidAcids/Fatty acids <0.89
5819681962/1963/1969/1971/1972/1975/1977/1978/1991/1995/2003n-Hexadecanoic acid
(palmitic acid)
Acids/Fatty acidsg0.66–3.70b, c, d, g
59 2086 (HP-5)Heptadecanoic acid
(margaric acid)
Acids/Fatty acids <0.11c, d
60 2095/2104/2130/2140/2144/2170Linoleic acid
[(9Z,12Z)-octadeca-9,12-dienoic acid]
Acids/Fatty acids <0.32b, c, d
61 2102/2141/2152/2175Oleic Acid
[(Z)-octadec-9-enoic acid]
Acids/Fatty acidsa: fat<1.65b, c, d
62 2172/2178/2180/2188Stearic acid
(Octadecanoic acid)
Acids/Fatty acids 0.16–1.60c
The literature RI (RIlit) has been retrieved from the NIST database [35] based on van Dool and Kratz calculation [36] on a HP-5MS column, unless otherwise stated. The superscript std in the third column denotes that an external standard compound has been used for the identification. Asterisks in two adjacent rows denote that those compounds co-elute and thus the percentage is given in the first row. Small letters indicate the references: a: [37]; b: [8]; c: [7]; d: [38]; e: [39]; f: [40]; g: [6]; h: [41]; i: [42]; j: [43]; k: [44]; l: [45].
Table 2. Effect of genotype and the time of harvest on major strawberry volatiles (>1% including the two important terpenes linalool and p-trans-nerolidol that exist in lower percentages) and volatile categories.
NoCompoundF Value (Significance)
Genotype (G)Harvest Time (T)G × T
4Butanoic acid 4.528 *3.2041.238
7Maleic anhydride 5.622 **96.337 ***3.126 *
82-Methylbutanoic acid27.251 ***3.782 *4.455 **
9Styrene 0.76110.253 **0.772
12Citraconic anhydride 0.51141.542 ***1.421
133-Hydroxybutanoic acid14.102 ***3.2261.885
18Hexanoic acid 6.905 **2.5161.162
20Succinic anhydride18.202 ***71.895 ***1.754
22Benzyl Alcohol2.1062.7251.245
27Mesifurane 4.238 *9.043 **2.504 *
28Furaneol 10.051 ***0.6782.087
32Linalool 35.484 ***5.703 **4.911 **
39Coumaran 2.33736.473 ***1.749
44trans-Cinnamic acid1.8457.947 **0.774
45γ-Decalactone15.220 ***0.0882.019
48trans-Nerolidol10.032 ***21.210 ***8.688 ***
58n-Hexadecanoic acid 1.81413.736 ***3.986 **
61Oleic Acid 1.83011.371 ***2.079
62Stearic acid 0.8155.865 *1.503
IEsters9.828 ***28.988 ***9.912 ***
IITerpenes57.438 ***33.892 ***26.161 ***
IIIPhenylpropanes2.76115.185 ***1.226
IVAromatics1.41117.622 ***1.183
VShort-chain Acids6.215 **8.228 **2.515 *
VIFatty Acids2.07916.449 ***4.047 **
VIIAlcohols13.772 ***8.754 **2.426
VIIIAlkenes3.289 *78.197 ***4.270 **
IXFurans/Lactones0.45062.117 ***1.601
XLactones7.724 **1.3540.650
XIAnhydrides1.55879.254 ***1.484
The numbers of compounds in the 1st column (No) are the same as those of Table 1. * Significant at 0.05 ≥ p > 0.01, ** significant at 0.01 ≥ p > 0.001, *** significant at p ≤ 0.001.
Table 3. Effect of genotype and the time of harvest on expression of the six examined strawberry genes potentially involved in biosynthesis of fruit aroma and flavor.
NoGeneF Value (Significance)
Genotype (G)Harvest Time (T)G × T
1SAAT86.308 **46.455 **7.211 **
2FaFAD1440.261 **164.941 **32.417 **
3FaNES16.338 *39.625 **8.138 **
4FaEGS2162.835 **0.2808.875 **
5FaMYB1019.579 **119.515 **5.430 **
6FaEOBII107.590 **102.887 **202.098 **
* Significant at 0.01 > p > 0.001, ** significant at p < 0.001.
Publisher’s Note: MDPI stays neutral with regard to jurisdictional claims in published maps and institutional affiliations.

