2.1. Volatile Composition of Celery Samples
In total, 100 compounds were identified in the headspace of the six celery samples (
Table 1) including 28 monoterpenes, 16 sesquiterpenes, 12 alcohols (five of which are classified as monoterpenoid alcohols), nine aldehydes and five phthalides. Quantitative differences were observed between the genotypes used in this study and one-way ANOVA revealed significant differences in the relative abundance of aroma compounds between the genotypes in most compounds. Compounds such as (
E)-2-penten-1-ol, (
Z)-3-hexenol, lavandulyl acetate, δ-3-carene, β-thujone,
p-1,3,8-menthatriene, fenchol and β-eudesmol expressed no significant difference between genotypes accompanied by several alkanes and unknown compounds.
A large proportion of the aroma profile was comprised of monoterpenes and sesquiterpenes with limonene, β-pinene, myrcene, γ-terpinene and β-caryophyllene exhibiting the highest relative abundance within their compound groups. These compounds are commonly present in celery and have been reported to contribute to odour notes such as woody, herbal, green, waxy, and earthy [
3,
9]. Monoterpenes have been shown to have the highest proportion of the aroma composition in various studies [
3,
5,
6]. Genotype 12 exhibited the highest abundance of monoterpenes, sesquiterpenes and phthalides, followed by hybrids 22x12 and 12x22, while genotype 25 and hybrid 25x12 had a much lower abundance of these compounds. However, as reported by the authors, these terpenes are not the characteristic compounds in celery [
4].
Sesquiterpenes, whilst at a lower relative abundance to monoterpenes are more typical to the mature celery aroma. Previously reported by the authors [
9], during maturation, the celery aroma developed significantly, starting as a fresh, citrus, green aroma due to the high proportion of monoterpenes and lack of sesquiterpene and phthalide compounds. As the celery matured, the abundance of sesquiterpenes and phthalides became much more apparent and thus, a change in the perceived aroma was identified [
9]. β-Caryophyllene and β-selinene (
Table 1) exhibited the highest relative abundance within all genotypes, and this was most obviously observed in genotype 12 and hybrid 22x12. Ehiabhi et al. [
17] reported β-caryophyllene and β-selinene to be major constituents of Nigerian grown celery and Lund, Wagner, and Bryan [
18] identified β-selinene to impart a strong celery aroma. Although less abundant in other genotypes, genotype 12 had a high abundance of kessane. Kessane was identified by Philippe, Suvarnalatha, Sankar and Suresh [
19] in the essential oil of Indian-grown celery seed, comprising between 2.2 and 7.6% of the volatile profile.
Phthalides have been shown to contribute to strong celery-like odours in addition to being the most odour-active compounds within celery crop. Upon completing aroma extraction dilution analysis (AEDA), Kurobayashi [
20] detected phthalide compounds including 3-n-butylphthalide and sedanenolide, also identified within this study, to contribute most to celery odour. This was further confirmed by Lund, Wagner and Bryan [
18], whereby sedanenolide, 3-n-butylphthalide and hexahydro-3-n-butylphthalide imparted strong celery odour characteristics. Genotype 12 displayed the highest abundance of phthalide compounds (
Table 1) including sedanenolide and 3-n-butylphthalide followed by hybrids 12x22 and 22x12 that also displayed a high abundance of phthalides within their aroma profile. As these compounds consist of strong celery odour notes [
8], we can assume these celeries consist of a typical celery flavour.
The maternal inheritance of compounds from parent to hybrid was observed most clearly between genotype 25 and hybrid 25x12, whereby similarities between the presence and absence of compounds within the aroma profile as well as the abundance of compounds was apparent (
Table 1). Monoterpene, sesquiterpene and phthalide abundances for these celery samples were the lowest out of the six samples and for example camphor and p-mentha-2,8-diene were both not identified in genotype 25 and 25x12. Furthermore, apart from 3-propylidene phthalide, the relative abundances of phthalide compounds were not significantly different between 25 and 25x12. The influence of the female counterpart of the crop is clear, with 25x12 inheriting more similarities from the female parent, 25 than male parent 12. This is less clearly observed when both parents, 12 and 22, were used in the hybrids 12x22 and 22x12. The relationship of these genotypes is unknown but if there is a close relation, genetically, then this would explain the fewer significant differences observed between these hybrids (
Table 1). m-Tolualdehyde was only identified in genotype 22 and hybrid 22x12 and other aldehydes such as (E, E)-2,4-octadienal and hexanal were either only expressed in 12, 12x22 and 22x12 or were expressed in high abundance in these samples. The chemical inheritance of monoterpenes and sesquiterpene compounds appeared to be less clear; however, β-selinene and β-caryophyllene were expressed in a high relative abundance in genotype 12 and hybrid 22x12, displaying a stronger influence from the male parent, 12. Genotype 12 also displayed a high influence over the phthalide content for the hybrids 12x22 and 22x12, where both expressed a higher relative abundance for phthalide compounds than genotype 22.
Table 1.
Relative abundance of aroma compounds identified in the headspace of fresh celery samples.
Table 1.
Relative abundance of aroma compounds identified in the headspace of fresh celery samples.
| Code | Compound Name | LRI a | ID b | Relative Abundance (AU) c | p-Value |
|---|
| 12 | 22 | 25 | 25x12 | 12x22 | 22x12 |
|---|
| | Alcohols | | | | | | | | | |
| A1 | (E)-2-penten-1-ol | 758 | A | nd | 0.53 ± 0.74 | 0.43 ± 0.05 | nd | nd | 0.83 ± 0.09 | ns |
| A2 | pentanol | 762 | A | nd b | nd b | nd b | 0.48 ± 0.14 ab | 0.68 ± 0.33 a | 0.15 ± 0.21 ab | ** |
| A3 | (Z)-3-hexenol | 849 | B [21] | 4.1 ± 2.5 a | 4.1 ± 1.7 | nd | 2.0 ± 0.47 | 4.3 ± 1.1 | 1.2 ± 0.18 | ns |
| A4 | (E)-3-hexenol | 852 | A | 6.2 ± 2.9 a | 3.5 ± 1.8 ab | 1.3 ± 0.26 b | nd b | 3.7 ± 0.53 ab | 0.69 ± 0.49 b | * |
| A5 | hexanol | 862 | A | nd b | nd b | 0.53 ± 0.03 b | 0.65 ± 0.04 b | 3.0 ± 0.98 a | 3.6 ± 1.1 a | *** |
| A6 | octanol | 1072 | A | 4.9 ± 0.70 ab | 5.3 ± 0.61 a | 1.3 ± 0.13 cd | nd d | 2.9 ± 1.2 bc | 3.8 ± 0.36 ab | *** |
| A7 | (Z)-3-nonenol | 1153 | B [22] | 5.6 ± 2.9 | 6.1 ± 2.6 | 1.8 ± 0.81 | 1.3 ± 0.16 | 6.9 ± 1.7 | 5.9 ± 0.98 | * |
| | Aldehydes | | | | | | | | | |
| AL1 | hexanal | 800 | A | 9.23 ± 0.33 ab | 0.43 ± 0.06 b | 0.15 ± 0.12 b | 0.30 ± 0.05 b | 0.46 ± 0.31 b | 91 ± 18 a | *** |
| AL2 | benzaldehyde | 964 | A | nd b | nd b | nd b | nd b | 0.24 ± 0.04 a | nd b | *** |
| AL3 | octanal | 1008 | A | 7.6 ± 1.4 ab | 9.5 ± 2.4 a | 3.6 ± 0.62 bc | 2.4 ± 0.58 c | 5.3 ± 1.3 abc | 9.4 ± 1.1 a | ** |
| AL4 | benzeneacetaldehyde | 1058 | A | 6.4 ± 1.3 a | 6.5 ± 2.4 a | 1.9 ± 0.25 bc | 0.96 ± 0.43 c | 3.7 ± 1.6 abc | 5.2 ± 0.60 ab | ** |
| AL5 | m-tolualdehyde | 1083 | B [23] | nd b | 19 ± 2.4 a | nd b | nd b | nd b | 16 ± 1.2 a | *** |
| AL6 | (E,E)-2,4-octadienal | 1116 | A | 2.0 ± 1.1 b | nd b | nd b | nd b | 1.6 ± 0.57 b | 4.2 ± 0.72 a | *** |
| AL7 | (E,E)-2,6-nonadienal | 1155 | A | 2.3 ± 1.6 | nd | nd | 0.39 ± 0.55 | nd | nd | * |
| AL8 | (E)-2-nonenal | 1171 | A | 3.2 ± 0.44 a | 2.7 ± 0.46 a | 0.69 ± 0.09 b | 0.89 ± 0.14 b | 0.69 ± 0.97 b | 1.8 ± 0.07 ab | *** |
| AL9 | undecanal | 1306 | | nd c | nd c | 0.93 ± 0.28 bc | 1.4 ± 0.35 bc | 1.6 ± 0.44 b | 3.8 ± 0.79 a | *** |
| | Esters | | | | | | | | | |
| E1 | allyl hexanoate | 1080 | A | 3.9 ± 0.62 ab | nd c | 2.0 ± 0.43 bc | 1.2 ± 0.92 bc | 3.1 ± 0.96 ab | 6.0 ± 1.5 a | *** |
| E2 | (E,Z)-3,6 nonadienol acetate | 1174 | B [24] | 4.4 ± 0.45 a | 2.2 ± 0.49 bc | 1.0 ± 0.12 c | 1.5 ± 0.15 c | 2.2 ± 0.41 bc | 3.3 ± 0.48 ab | *** |
| E3 | (Z)-3-hexenyl butanoate | 1185 | A | 2.5 ± 0.23 b | 2.6 ± 0.10 b | nd d | nd d | 1.3 ± 0.45 c | 4.5 ± 0.54 a | *** |
| E4 | lavandulyl acetate | 1285 | B [25] | 0.34 ± 0.48 | 0.72 ± 0.20 | 0.15 ± 0.22 | 0.64 ± 0.14 | 0.15 ± 0.22 | 1.1 ± 0.79 | ns |
| | Ketones | | | | | | | | | |
| K1 | acetophenone | 1077 | A | 8.4 ± 1.1 a | nd b | 1.8 ± 0.26 b | 0.68 ± 0.35 b | 8.2 ± 0.86 a | 14 ± 1.5 a | *** |
| K2 | (Z)-jasmone | 1405 | A | 2.3 ± 0.38 a | 0.24 ± 0.33 c | 0.48 ± 0.04 bc | 0.10 ± 0.15 c | nd c | 0.99 ± 0.05 b | *** |
| | Alkanes | | | | | | | | | |
| AK1 | nonane | 897 | A | 17 ± 2.8 b | 46 ± 1.9 a | 8.4 ± 1.5 b | 19 ± 1.1 b | 21 ± 1.6 b | 52 ± 11 a | *** |
| AK2 | decane | 998 | A | nd c | 10 ± 3.5 ab | 4.9 ± 0.93 bc | 5.0 ± 0.93 bc | 6.3 ± 3.2 bc | 14 ± 1.3 a | *** |
| AK3 | undecane | 1097 | A | 27 ± 9.6 | 23 ± 11.2 | 10 ± 2.1 | 9.3 ± 1.9 | 12 ± 4.1 | 22 ± 5.1 | ns |
| AK4 | dodecane | 1197 | A | 14 ± 9.6 | 6.3 ± 3.6 | 1.5 ± 0.65 | 2.9 ± 0.85 | 4.5 ± 1.2 | 6.8 ± 0.60 | ns |
| AK5 | tridecane | 1297 | A | 18 ± 1.2 | 4.0 ± 3.8 | 1.1 ± 0.20 | 1.1 ± 0.92 | 1.7 ± 1.3 | 1.9 ± 1.2 | ns |
| AK6 | tetradecane | 1397 | A | 40 ± 1.5 | 9.5 ± 7.9 | 3.2 ± 1.8 | 2.7 ± 2.0 | 4.6 ± 3.5 | 5.5 ± 2.8 | ns |
| AK7 | pentadecane | 1498 | A | 35 ± 9.1 | 9.3 ± 6.1 | 3.3 ± 0.84 | 3.3 ± 1.9 | 6.0 ± 3.9 | 3.2 ± 2.3 | ns |
| AK8 | hexadecane | 1599 | A | 17 ± 11 | 4.6 ± 2.2 | 1.7 ± 0.71 | 1.8 ± 0.84 | 3.4 ± 1.8 | 4.0 ± 1.3 | ns |
| AK9 | heptadecane | 1699 | A | 8.2 ± 2.6 a | 2.3 ± 0.49 b | 0.99 ± 0.08 b | 1.0 ± 0.20 b | 2.2 ± 1.1 b | 2.8 ± 0.13 b | *** |
| AK10 | octadecane | 1800 | A | nd | 0.76 ± 0.20 | 0.13 ± 0.19 | 0.25 ± 0.19 | 0.32 ± 0.45 | 0.75 ± 0.17 | * |
| | Monoterpenes | | | | | | | | | |
| M1 | α-thujene | 932 | B [26] | 10 ± 1.8 a | 4.8 ± 0.42 b | 2.7 ± 0.39 b | 3.7 ± 0.49 b | 4.2 ± 0.49 b | 5.0 ± 0.45 b | *** |
| M2 | α-pinene | 941 | A | 22 ± 2.9 a | 24 ± 2.1 a | 6.2 ± 0.97 b | 8.5 ± 0.80 b | 19 ± 1.8 a | 20 ± 2.8 a | *** |
| M3 | camphene | 958 | A | 5.6 ± 0.59 a | 6.0 ± 1.3 a | 2.0 ± 0.13 b | 2.5 ± 0.25 b | 4.3 ± 0.46 ab | 5.4 ± 0.81 a | *** |
| M4 | sabinene | 980 | A | 34 ± 5.5 a | 18 ± 5.9 b | 5.8 ± 1.1 b | 8.7 ± 1.3 b | 12 ± 1.1 b | 19 ± 6.8 | ** |
| M5 | β-pinene | 987 | A | 110 ± 15 ab | 122 ± 23 ab | 70 ± 12 b | 86 ± 12 b | 120 ± 8.2 ab | 145 ± 23 a | ** |
| M6 | myrcene | 990 | A | 799 ± 67 a | 100 ± 9.0 bcd | 42 ± 4.4 d | 59 ± 7.7 cd | 149 ± 24 bc | 173 ± 25 b | *** |
| M7 | p-mentha-2,8-diene | 1005 | B [27] | 2.5 ± 1.1 | 5.2 ± 0.89 | nd | nd | 3.3 ± 1.1 | 4.3 ± 0.64 | * |
| M8 | α-phellandrene | 1013 | A | 19 ± 2.6 a | 14 ± 2.6 ab | 6.3 ± 0.87 c | 5.5 ± 1.1 c | 9.6 ± 2.1 bc | 17 ± 0.80 a | *** |
| M9 | δ-3-carene | 1019 | A | 1.2 ± 1.6 | nd | nd | 0.82 ± 0.19 | nd | nd | ns |
| M10 | α-terpinene | 1024 | A | 30 ± 5.6 a | 14 ± 1.9 b | 8.0 ± 0.89 b | 11 ± 3.0 b | 8.1 ± 2.7 b | 14 ± 2.4 b | *** |
| M11 | o-cymene | 1030 | A | 469 ± 11 a | 190 ± 22 de | 128 ± 20 e | 213 ± 0.16 cd | 299 ± 37 b | 267 ± 14 bc | *** |
| M12 | limonene | 1037 | A | 6524 ± 207 a | 3259 ± 236 b | 1188 ± 89 d | 1285 ± 84 d | 2371 ± 246 c | 3638 ± 441 b | *** |
| M13 | β-(E)-ocimene | 1048 | B [28] | 54 ± 6.2 a | 63 ± 2.3 a | 13 ± 0.89 c | 5.1 ± 0.95 c | 34 ± 8.6 b | 45 ± 7.2 ab | *** |
| M14 | γ-terpinene | 1065 | A | 1455 ± 112 a | 732 ± 127 b | 329 ± 39 c | 539 ± 96 bc | 389 ± 89 bc | 689 ± 179 bc | *** |
| M15 | p-cymenene | 1095 | A | nd b | 19 ± 2.6 a | nd b | nd b | nd b | 7.0 ± 9.9 ab | ** |
| M16 | terpinolene | 1096 | A | 38 ± 4.6 a | nd c | 7.0 ± 0.48 bc | 6.5 ± 1.0 bc | 14 ± 3.9 b | 11 ± 7.6 bc | *** |
| M17 | β-thujone | 1119 | A | 1.9 ± 1.3 | 0.58 ± 0.82 | 0.45 ± 0.32 | 0.13 ± 0.18 | nd | nd | ns |
| M18 | allo-ocimene | 1130 | B [29] | 150 ± 16 ab | 177 ± 13 a | 30 ± 3.2 c | 9.2 ± 0.74 c | 106 ± 20 b | 144 ± 17 ab | *** |
| M19 | p-1,3,8 menthatriene | 1134 | B [30] | 6.2 ± 8.7 | 11 ± 7.7 | 2.4 ± 1.7 | 1.2 ± 0.05 | 13 ± 2.0 | 8.7 ± 6.1 | ns |
| M20 | trans-allo-ocimene | 1144 | B [31] | 81 ± 5.9 a | 79 ± 8.6 a | 20 ± 2.3 bc | 12 ± 2.9 c | 42 ± 11 b | 78 ± 11 a | *** |
| M21 | camphor | 1157 | A | nd c | 2.2 ± 0.16 b | nd c | nd c | 1.9 ± 0.39 b | 3.2 ± 0.28 a | *** |
| M22 | pentylcyclohexa-1,3-diene | 1161 | B [32] | 3.3 ± 0.64 b | 5.4 ± 1.2 b | 16 ± 1.1 ab | 17 ± 2.0 ab | 56 ± 13 a | 25 ± 7.1 ab | * |
| M23 | trans-dihydrocarvone | 1206 | A | 4.1 ± 0.95 a | 1.9 ± 0.41 b | 1.3 ± 0.86 b | 0.91 ± 0.19 b | 1.9 ± 0.34 b | 2.7 ± 0.32 ab | ** |
| M24 | safranal | 1215 | A | 11 ± 2.6 a | 4.6 ± 0.69 bc | 1.5 ± 0.63 c | 2.5 ± 0.68 c | 2.7 ± 0.98 c | 7.9 ± 0.44 ab | *** |
| M25 | β-cyclocitral | 1235 | A | 3.6 ± 0.79 a | 1.9 ± 0.50 ab | 0.73 ± 0.19 b | 1.0 ± 0.29 b | 0.81 ± 0.61 b | 3.5 ± 0.35 a | *** |
| M26 | L-carvone | 1251 | A | 2.5 ± 0.86 ab | 2.1 ± 0.57 ab | nd c | 0.89 ± 0.18 bc | 1.5 ± 0.39 abc | 2.9 ± 0.64 a | *** |
| M27 | D-carvone | 1259 | A | 3.5 ± 0.31 | 2.9 ± 1.2 | 1.5 ± 0.51 | 1.4 ± 0.23 | 1.7 ± 0.39 | 3.4 ± 0.77 | * |
| M28 | carvacrol | 1318 | A | nd b | nd b | 0.12 ± 0.17 b | 0.42 ± 0.09 b | 0.51 ± 0.39 ab | 1.1 ± 0.15 a | ** |
| | Monoterpenoid Alcohols | | | | | | | | | |
| MA1 | (+)-cis-p-mentha-2,8-dien-1-ol | 1124 | A | 5.0 ± 1.1 a | 5.5 ± 0.35 a | 0.95 ± 0.17 b | 0.15 ± 0.21 b | 4.7 ± 0.97 a | 4.0 ± 0.15 a | *** |
| MA2 | fenchol | 1127 | A | 0.55 ± 0.76 | nd | nd | 0.14 ± 0.19 | nd | 0.87 ± 0.64 | ns |
| MA3 | trans-carveol | 1225 | B [33] | 9.8 ± 4.5 a | 1.9 ± 0.18 c | 0.99 ± 0.10 d | 1.4 ± 0.10 cd | 1.7 ± 0.13 c | 3.0 ± 0.26 b | *** |
| MA4 | cis-carveol | 1238 | A | 3.3 ± 0.10 a | 2.3 ± 0.18 a | 0.63 ± 0.48 b | 0.63 ± 0.18 b | 0.45 ± 0.63 b | 2.6 ± 0.16 a | *** |
| MA5 | (Z)-8-hydroxy linalool | 1346 | B [34] | 2.7 ± 0.43 a | 0.76 ± 0.08 c | 0.27 ± 0.19 c | 0.59 ± 0.14 c | 0.50 ± 0.37 c | 1.7 ± 0.12 b | *** |
| | Sesquiterpenes | | | | | | | | | |
| S1 | α-ylangene | 1387 | B [35] | 3.1 ± 1.1 a | 3.0 ± 0.65 a | 1.7 ± 0.16 ab | 0.69 ± 0.09 b | 1.1 ± 0.39 b | 1.8 ± 0.17 ab | ** |
| S2 | α-copaene | 1392 | A | nd e | 9.2 ± 0.11 a | 6.2 ± 0.18 b | 2.0 ± 0.18 d | 1.8 ± 0.30 d | 4.5 ± 0.43 c | *** |
| S3 | (E)-β-caryophyllene | 1427 | B [31] | 2.2 ± 0.42 a | 0.25 ± 0.35 b | 0.49 ± 0.05 b | 0.33 ± 0.07 b | nd b | 0.87 ± 0.68 b | ** |
| S4 | β-caryophyllene | 1442 | A | 217 ± 9.8 a | 71 ± 1.3 c | 60 ± 1.2 cd | 46 ± 4.5 d | 44 ± 8.4 d | 97 ± 11 b | *** |
| S5 | (+)-aromadend rene | 1461 | A | 2.2 ± 0.10 ab | 1.2 ± 0.38 cd | 2.7 ± 0.42 a | 0.21 ± 0.30 d | 0.98 ± 0.32 cd | 1.5 ± 0.14 bc | *** |
| S6 | curcumene | 1470 | B [36] | 3.3 ± 0.15 a | nd b | 0.78 ± 0.11 b | 0.72 ± 0.13 b | nd b | 0.59 ± 0.83 b | *** |
| S7 | α-humulene | 1477 | A | 19 ± 1.2 a | 12 ± 0.69 b | 4.5 ± 0.10 c | 6.3 ± 0.66 c | 6.1 ± 1.3 c | 11 ± 0.89 b | *** |
| S8 | γ-himachalene | 1493 | B [33] | 2.8 ± 0.33 a | 2.1 ± 0.16 ab | 1.1 ± 0.05 c | 0.92 ± 0.14 c | 1.3 ± 0.35 bc | 2.3 ± 0.19 a | *** |
| S9 | β-selinene | 1511 | B [33] | 192 ± 14 a | 31 ± 0.93 c | 24 ± 0.82 c | 24 ± 1.9 c | 29 ± 4.7 c | 59 ± 4.9 b | *** |
| S10 | valencene | 1515 | A | 261 ± 31 a | 3.5 ± 1.5 b | 3.6 ± 0.16 b | 1.6 ± 0.16 b | 34 ± 4.4 b | 33 ± 2.4 b | *** |
| S11 | α-selinene | 1519 | B [32] | 22 ± 1.3 a | 5.4 ± 0.16 bc | 3.7 ± 0.19 c | 3.2 ± 0.27 c | 3.8 ± 0.64 c | 7.4 ± 0.71 b | *** |
| S12 | (E)-nerolidol | 1540 | B [37] | nd d | 2.3 ± 0.19 a | 1.7 ± 0.05 b | 0.91 ± 0.21 c | 0.21 ± 0.29 d | 1.2 ± 0.11 bc | *** |
| S13 | kessane | 1555 | B [32] | 200 ± 39 a | 2.3 ± 0.30 b | 0.51 ± 0.04 b | 0.51 ± 0.09 b | 26 ± 3.1 b | 27 ± 1.9 b | *** |
| S14 | liguloxide$ | 1561 | B [38] | 5.2 ± 0.89 a | nd b | nd b | nd b | 0.67 ± 0.11 b | 0.66 ± 0.47 b | *** |
| S15 | rosifoliol | 1588 | B [39] | nd c | 0.45 ± 0.32 abc | 0.16 ± 0.23 bc | 0.70 ± 0.09 ab | 0.41 ± 0.29 abc | 0.99 ± 0.04 a | ** |
| S16 | β-eudesmol | 1633 | B [40 | nd | nd | nd | 0.29 ± 0.19 | 0.65 ± 0.92 | nd | ns |
| | Oxides | | | | | | | | | |
| O1 | caryophyllene oxide | 1608 | A | 2.0 ± 0.26 a | 0.30 ± 0.23 d | 0.39 ± 0.05 d | 0.59 ± 0.08 cd | 1.2 ± 0.02 bc | 1.7 ± 0.23 ab | *** |
| | Phthalides | | | | | | | | | |
| P1 | 3-propylidene phthalide | 1603 | A | 7.7 ± 0.91 a | 0.87 ± 0.37 b | 0.54 ± 0.03 b | nd b | 0.46 ± 0.33 b | nd b | *** |
| P2 | 3-n-butylphthalide | 1675 | B [9,12,13] | 18 ± 7.8 a | 8.7 ± 2.9 ab | 3.8 ± 1.3 b | 3.4 ± 0.70 b | 13 ± 1.4 ab | 13 ± 1.7 ab | * |
| P3 | sedanenolide | 1747 | B [9,12,13] | 58 ± 4.0 a | 16 ± 2.9 c | 5.2 ± 0.50 d | 4.5 ± 0.35 d | 25 ± 3.4 b | 21 ± 2.2 bc | *** |
| P4 | trans-neocnidilide | 1754 | B [32] | 2.7 ± 0.24 a | 2.8 ± 0.33 a | 1.3 ± 0.12 b | 1.8 ± 0.08 b | 2.7 ± 0.05 a | 2.9 ± 0.19 a | *** |
| P5 | (Z)-ligustilide | 1763 | B [9,12,13] | 4.0 ± 0.49 a | 0.41 ± 0.08 b | 0.21 ± 0.08 b | 0.24 ± 0.04 b | 1.0 ± 0.79 b | 0.77 ± 0.10 b | *** |
| | Unknowns | | | | | | | | | |
| U1 | unknown 1 | 840 | | 2.6 ± 0.79 | nd | 3.1 ± 0.71 | 2.0 ± 0.23 | nd | 4.5 ± 3.5 | ns |
| U2 | unknown 2 | 1076 | | nd b | 19 ± 5.5 a | nd b | nd b | nd b | nd b | *** |
| U3 | unknown 3 | 1084 | | 15 ± 2.0 a | nd b | nd b | 2.7 ± 0.54 b | 11 ± 3.3 a | nd b | *** |
| U4 | unknown 4 | 1141 | | 2.2 ± 0.38 a | 1.4 ± 0.98 ab | nd b | 0.30 ± 0.25 ab | 1.6 ± 0.35 ab | 1.4 ± 0.98 ab | * |
| U5 | unknown 5 | 1189 | | 1.2 ± 1.7 | 0.62 ± 0.88 | 1.2 ± 1.7 | 0.15 ± 0.21 | 0.35 ± 0.49 | nd | ns |
| U6 | unknown 6 | 1243 | | 2.4 ± 0.16 | 2.0 ± 1.1 | 0.93 ± 0.12 | 1.2 ± 0.23 | 2.0 ± 0.37 | 3.4 ± 1.3 | ns |
| U7 | unknown 7 | 1276 | | 7.3 ± 1.5 a | 4.1 ± 2.1 ab | 1.0 ± 0.29 b | 0.66 ± 0.09 b | 2.2 ± 0.88 b | 3.2 ± 0.71 b | ** |
| U8 | unknown 8 | 1450 | | 12 ± 3.8 a | 3.3 ± 0.53 b | nd b | 2.0 ± 0.34 b | 1.9 ± 0.48 b | 4.3 ± 0.50 b | *** |
| U9 | unknown 9 | 1543 | | 2.0 ± 1.7 | 0.38 ± 0.53 | nd | 0.22 ± 0.31 | 0.36 ± 0.50 | nd | ns |
| U10 | unknown 10 | 1652 | | 5.5 ± 0.70 a | 1.3 ± 0.35 bc | 3.2 ± 0.62 b | 1.2 ± 0.86 c | 1.3 ± 0.31 bc | 1.7 ± 0.17 bc | *** |
| U11 | unknown 11 | 1710 | | 2.0 ± 0.50 a | nd b | nd b | nd b | nd b | nd b | *** |
| U12 | unknown 12 | 1758 | | 2.1 ± 1.2 a | 0.27 ± 0.20 b | 0.18 ± 0.06 b | 0.19 ± 0.08 b | 0.87 ± 0.38 ab | 0.44 ± 0.31 ab | * |
| U13 | unknown 13 | 1842 | | 1.4 ± 0.07 a | 0.69 ± 0.10 b | 0.11 ± 0.16 c | nd c | 0.55 ± 0.10 b | nd c | *** |
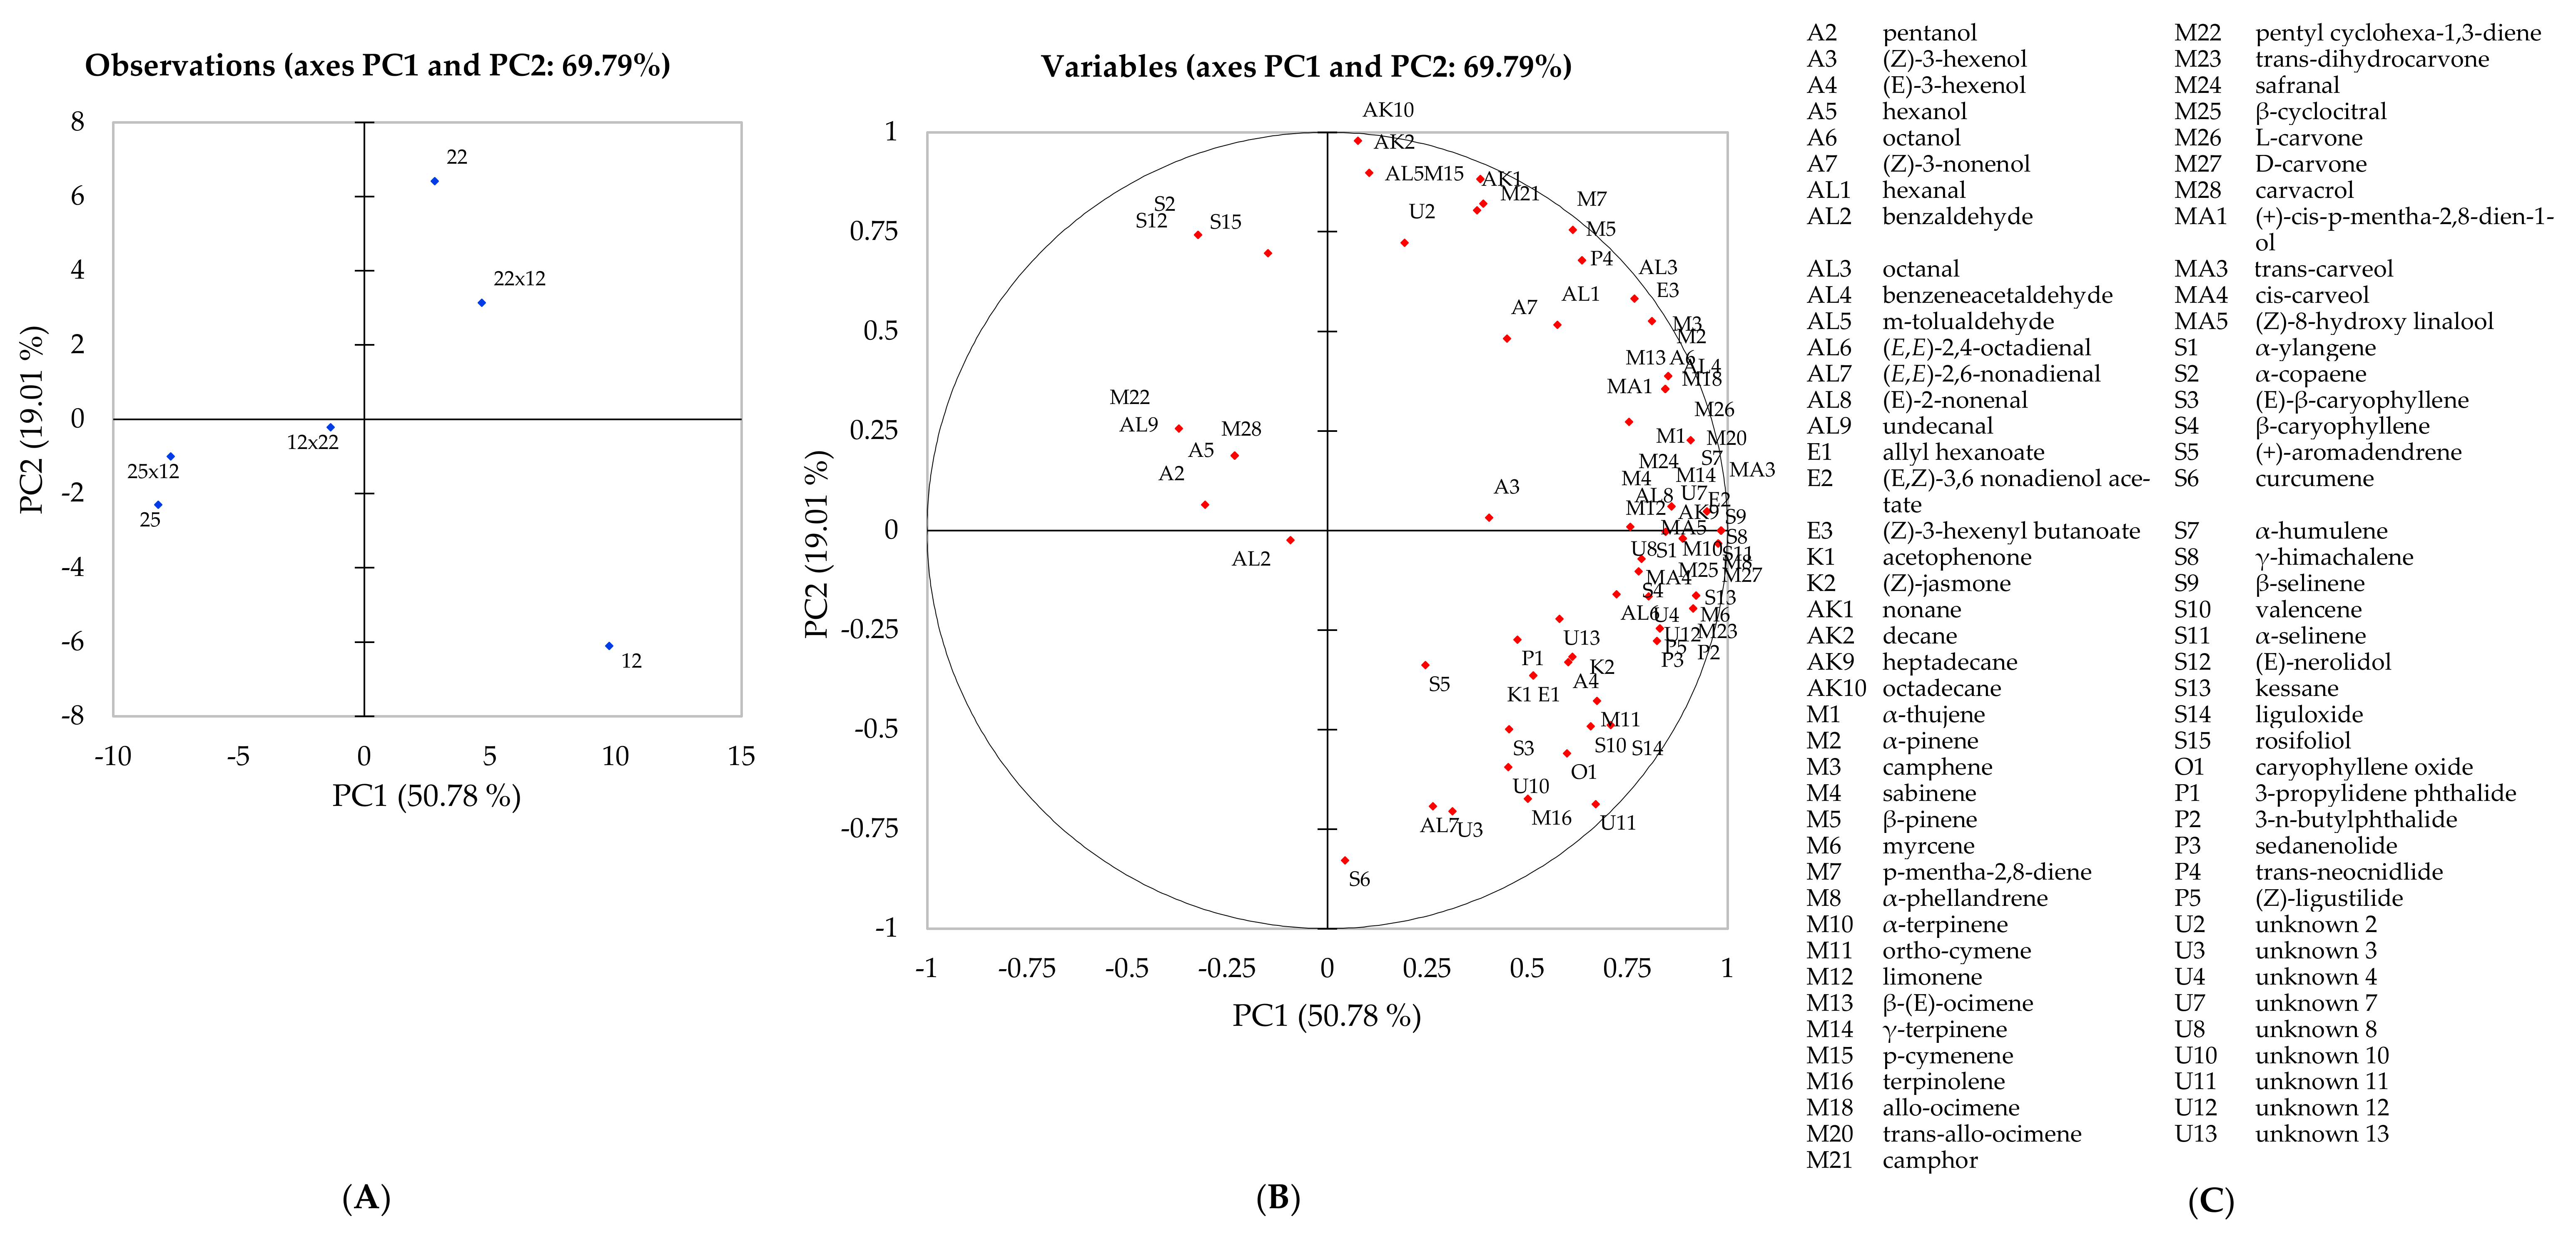
Principal component analysis was used to visualise graphically the differences in the volatile composition of three parental genotypes and their hybrids and to examine any correlations occurring between genotypes (
Figure 1). Using only the significant compounds according to the one-way ANOVA, a separation between genotypes was observed. Principal components one (PC1) and two (PC2) explained 69.79% of the total variation present within the data. Samples 12, 25, 25x12 and 12x22 were separated across F1, whereas samples 12, 22 and 22x12 along F2, respectively. The observation plot confirmed the findings presented in
Table 2, where samples 12 and 22x12 expressed a strong association with many volatile compounds due to the high abundance identified. Conversely, samples 25 and 25x12, observed on the opposite side of the observation plot, displayed little or weak association with all volatile compounds (
Figure 1). Due to the low abundance of volatile compounds, we can assume that these genotypes would be perceived as less aromatic when compared to the other genotypes. The hybrid 12x22 was positioned in the middle of the observation plot, displaying a stronger association with volatile compounds than genotype 25 and its hybrid 25x12; however, the relative abundance expressed within this hybrid remains consistently lower than 22x12 in all compound groups, except for phthalides. Thus, we could assume that this hybrid (12x22) was less aromatic than 22x12 but still had the typical, distinctive celery aroma. Comparing the aroma profile between the three parental genotypes and the hybrid lines, genotype 12 and hybrid 22x12 expressed the highest relative abundance of volatile compounds and it can be hypothesised that these will be more aromatic genotypes in comparison to the other samples. The current results (
Table 1) confirmed previous work [
12,
13] where genotype 12 was shown to be very aromatic with strong flavour associations but low scoring in mouthfeel attributes such as crunchy and moist yet scored high for stringiness. Genotype 25 was reported to be less aromatic with a distinct cucumber flavour but was profiled as very crunchy, moist and with a firm first bite. The volatile content of genotype 22 was not significantly higher to genotype 12 or lower than 25 [
12,
13].
Overall, genotype 25 and hybrid 25x12 displayed clear maternal inheritance within the volatile content in terms of the compounds identified and their relative abundance. The high abundance of volatile compounds identified in genotype 12 appeared to have been inherited by hybrids 22x12 and 12x22 (
Table 1). This relationship is also clear in the observation plot (
Figure 1), where genotypes 12 and 22 with 22x12 and 12x22 expressing strong associations with all volatile compounds identified. We hypothesised that the parental genotypes would perform as previously [
12,
13] and maternal and paternal inheritance patterns become clearer upon sensory assessment, identifying phenotypic similarities between the parents and hybrids. Therefore, sensory evaluation was performed using a trained panel to further investigate these assumptions.
2.2. Sensory Evaluation of Celery Samples
The sensory profile of the three parental genotypes and hybrids was generated by a trained panel who came to the consensus of 28 terms for the quantitative assessment of celery samples and mean panel scores for these attributes are presented in
Table 2. Out of the 28 attributes that were profiled, 15 of these were identified to be significantly different between genotypes. Few significant assessor x sample interactions were identified, suggesting that the panellists scored the samples in a consistent manner [
41].
Table 2.
Mean panel scores for sensory attributes of six celery samples.
Table 2.
Mean panel scores for sensory attributes of six celery samples.
| Code | Attribute | Scores A | p-Value B |
|---|
| 12 | 25 | 22 | 25x12 | 22x12 | 12x22 |
|---|
| | Appearance |
| CA | Colour | 66.9 a | 31.1 d | 62.9 ab | 51.1 c | 59.6 abc | 55.6 bc | *** |
| STA | Stalk thickness (depth of cross-section) | 25.2 c | 61.2 a | 60.0 a | 58.4 a | 45.4 b | 49.3 ab | *** |
| RA | Ribbed (well-defined ribs) | 77.3 a | 52.5 d | 61.1 bc | 58.5 cd | 65.1 bc | 68.9 b | *** |
| | Aroma |
| FFA | Fresh fennel | 16.3 | 14.2 | 18 | 15.9 | 13.1 | 20 | ns |
| GGA | Grassy/green | 34.5 a | 19.9 b | 31.3 ab | 28.9 ab | 29.5 ab | 32.9 a | ** |
| FPA | Fresh parsley | 23.7 a | 12.3 b | 22.3 ab | 13.1 ab | 23.4 ab | 16.8 ab | ** |
| FCA | Fresh coriander | 14.5 | 10.5 | 16.9 | 16.7 | 13.2 | 14.2 | ns |
| | Taste/flavour |
| BT | Bitter | 44.5 a | 26.0 c | 36.1 ab | 28.6 bc | 32.1 bc | 34.1 bc | *** |
| ST | Sweet | 3.4 b | 11.7 a | 7.9 ab | 7.5 ab | 8.9 ab | 9.1 ab | * |
| SAT | Salt | 19.1 | 14.9 | 17.6 | 17.3 | 17.9 | 17.6 | ns |
| UT | Umami | 2.7 | 4 | 2.9 | 3.7 | 3.3 | 3.6 | ns |
| FFF | Fresh fennel | 15.8 | 12 | 20.3 | 15.7 | 15.7 | 23.5 | ns |
| RF | Rocket | 4.8 | 1.1 | 2.5 | 3.9 | 3.4 | 2.9 | ns |
| FCF | Fresh coriander | 16.1 | 14.5 | 18.9 | 18.7 | 13 | 16.8 | ns |
| FPF | Fresh parsley | 25.9 a | 9.8 b | 20.9 ab | 16.3 ab | 20.7 ab | 16.5 ab | * |
| SF | Soapy | 18.6 | 10.5 | 13.4 | 16.8 | 15.3 | 15.9 | ns |
| GGF | Grassy/green | 28.4 | 26.5 | 26.5 | 24.4 | 24.4 | 30 | ns |
| | Mouthfeel |
| CM | Crunchy | 54.7 a | 55.4 a | 63.8 a | 65.7 a | 59.3 a | 63.2 a | * |
| SM | Stringy | 68.1 a | 45.2 b | 44.5 b | 55.3 ab | 54.4 b | 55.5 ab | *** |
| MM | Moist | 42.6 c | 70.7 a | 67.5 a | 66.1 a | 53.6 b | 61.3 ab | *** |
| FM | Firmness of first bite | 50.5 b | 54.5 ab | 62.3 ab | 62.2 ab | 54.4 ab | 65.2 a | ** |
| | After-effects |
| CAE | Celery residue in the mouth | 40.4 a | 29.9 b | 29.8 b | 31.9 b | 30.5 b | 34.5 ab | *** |
| NAE | Numbness | 21.7 a | 10.3 b | 17.6 ab | 16.4 ab | 16.2 ab | 15.4 ab | ** |
| BAE | Bitter | 31.9 a | 16.8 b | 23.9 ab | 22.9 b | 21.2 b | 22.3 b | *** |
| UAE | Umami | 3.2 | 3.3 | 3.1 | 1.4 | 3.2 | 3.5 | ns |
| SAE | Salty | 13.5 | 11.7 | 11.8 | 12.9 | 12.6 | 13.4 | ns |
| SOAE | Soapy | 11.7 | 9.3 | 9.5 | 13.3 | 12.3 | 12.5 | ns |
| GGAE | Grassy/green | 27.1 | 21.2 | 21.9 | 20.8 | 21.5 | 24 | ns |
Appearance and mouthfeel attributes expressed the highest number of significant differences between genotypes. The appearance of the celery samples can be found in Table 9. Genotype 12 was scored high for appearance attributes (CA, RA) and hybrids descended from this genotype appear to have inherited these phenotypic characteristics, as high scores for both colour and ribbed were apparent. Their resemblance is also clear as shown in Table 9. Hybrid 22x12 displayed less prominent ribs and the scoring of this attribute was further decreased for 25x12 hybrid. Clearly, genotype 25 had a stronger influence on 25x12, where lower scores were observed for appearance. In terms of mouthfeel attributes, genotype 12 was shown to be the least crunchy, most stringy, with the driest petiole with a soft first bite. The genetic crosses appear to have these altered mouthfeel attributes, expressing higher scores for crunchiness, stringiness, and moistness. Hybrids 12x22 and 25x12 exhibited higher mean moistness and lower mean stringiness scores when compared to genotype 12. The data provide evidence of the influence of the female counterpart (the first number expressed in the hybrid cross) upon the appearance outcome of the offspring but when the male counterpart used displayed less prominent ribs (22 and 25), the ribbed appearance is reduced in the hybrids accordingly (
Table 2).
Seven out of the ten odour and flavour attributes evaluated showed no significant differences between genotypes apart from grass odour and fresh parsley odour and flavour. Genotype 12 was scored significantly higher for grass and fresh parsley odour and flavour followed by genotype 22. The resemblance in scoring is reflected by the volatile content between these parents, whereby fewer significant differences were observed (
Table 1). Although the genetic code of these genotypes was not revealed, it is possible that these parents are closely related as they share several characteristics. Investigating their hybrids, 12x22 displayed a high score for grass odour, like genotype 12, whereas 22x12 was scored high for fresh parsley odour and flavour as genotype 22. The parental genotype is closely associated with the descendent hybrid, with the hybrids expressing similar appearance, odour, and flavour characteristics (
Table 2).
PCA was used to visualise the sensory and chemical differences observed across the genotypes and hybrids with the volatile compounds identified (
Table 1) and odour and flavour attributes (
Table 2) used as variables (
Figure 2). Principal components one (PC1) and two (PC2) explained 70.27% of the total variation present within the dataset where the first axis separated genotypes 22, 25 and 12x22 and the second axis separated genotypes 12, 22 and 12x22, respectively. Genotypes 12 and 25 were displayed as opposites with genotype 12 expressing associations with many aroma compounds due to the high relative abundance identified and genotype 25 displayed no association with any flavour attribute due to its low relative abundance (
Table 1). The profiling of genotypes 12 and 25 reflects previous studies, whereby both 12 and 25 were profiled as high and low extremes when grown in different geographical locations and across multiple years [
12,
13]. Throughout these experiments, these genotypes have represented the most significantly different genotypes for all sensory attributes as well as behaved consistently in terms of their volatile profile when grown in different geographical locations and across multiple years. For this reason, they were recommended as “stable” genotypes for fresh produce growers [
9,
12,
13]. Genotypes 12, 22 and 12x22 were mostly associated with flavour and odour attributes including fresh fennel, coriander, and parsley and with most of the volatile compounds. Hybrid 25x12 expressed lower associations with these flavour attributes due to its lower relative abundance of monoterpenes, sesquiterpenes and phthalides and low scoring by the trained panel (
Table 1 and
Table 2).
The grass odour observed in the hybrid 12x22 was inherited from its female parent genotype 12, both expressing high relative abundance in (
Z)- and (
E)-3-hexenol, (
Z)-3-hexenyl butanoate and (
E,
Z)-3,6-nonadienol acetate, compounds observed to express a fresh, grass-like odour. Whereas the fresh parsley odour observed in hybrid 22x12 was inherited from the female parent genotype 22, both expressing a high relative abundance of monoterpene compounds also identified in fresh parsley including α-pinene, camphene,
p-mentha-2,8-diene and β-pinene [
5,
42] (
Table 2). Along with this, genotype 12 was positively correlated with soapy flavour and the associations to flavour and odour attributes, combined with the high abundance of many volatile compounds (
Table 1) confirms that genotype 12 is very aromatic. On the other hand, genotype 25 expresses no close association with any of the flavour and odour attributes confirming the previous statement that this genotype is not aromatic compared to genotype 12 or 22. Similar odour and flavour characteristics of genotype 25 were displayed in hybrid 25x12 (
Figure 2,
Table 2).
In terms of the sensory attributes, grass odour and flavour and parsley flavour were positively correlated with genotype 12, 22 and their hybrids. Alcohols (A3, A4), monoterpenes (M6, M11), sesquiterpenes (S13, S14) and phthalides (P3, P4) also displayed positive correlation with these samples and attributes. Fresh parsley odour and flavour that was scored highly in genotype 22 and hybrid 22x12 expressed a positive relationship with each other accompanied by; esters (E1, E2), monoterpenes (M1-M4, M6, M8, M10, M12, M14, M20, M23–27), sesquiterpenes (S7–S9, S11, S13) and phthalides (P2, P3) (
Figure 2). Many compounds displayed a positive correlation with fresh parsley which was expected due to similarities between the celery and parsley aroma composition. Genotype 25 and hybrid 25x12 displayed the lowest scores of fresh parsley aroma and flavour due to the lower relative abundance of these compounds that were identified (
Table 1).
The results presented in
Table 1 and
Table 2 showed significant differences in the aroma composition and sensory characteristics between the parental genotypes and hybrids and inherited characteristics were observed between parents and their offspring. Whether these celery hybrids meet the desires of the consumer, if there is a more preferred hybrid and what are the drivers of preference in celery was determined through the completion of a consumer trial, whereby the consumer acceptability of these hybrids and parental genotypes was investigated.
2.3. Consumer Evaluation of Celery Samples
One hundred and eighteen consumers evaluated the celery samples, and the demographic data are summarised in
Table 3. A higher proportion of the consumers were female (63.6%), and the mean and median ages were 34.9 and 30, respectively. Close to half of the consumers were working (48.3%) and 47.5% were students. In total, 43.2% of consumers related to the food and nutrition department at the University of Reading. The largest ethnic group was White (English, Welsh, Scottish, Northern Irish or British), making up 42.4% of the sample population. Most consumers taking part stated that they liked celery (70.3%) and the most frequent consumption was less than once a month (45.8%).
The mean liking scores of the celery samples are presented in
Table 4. The results demonstrated a significant difference in appearance, aroma, texture, and overall liking for all the samples that were tested, with results ranging from dislike slightly to like slightly. No significant difference was identified in taste liking for all samples and all samples were scored with an average score of 5; ‘neither like nor dislike’. While consumers did not like the celery samples extremely, the attributes of the hybrids, particularly 25x12 and 12x22, were scored higher for appearance, aroma and texture liking than the parental genotypes. Genotype 12 was scored the lowest for overall liking. When consumers were asked to rank the hybrids from the most liked (1) to least liked (3), no significant difference was observed; samples were scored at approximately 2, which demonstrated no significant preference.
Consumers were also asked to rank a list of six attributes that they found most important when consuming celery. The list that was presented to them contained attributes that are common in celery and in some cases, were very prominent in the samples such as the smooth exterior (not stringy). The attribute ‘crunchy’ was ranked as the most important followed by sweet taste, whereas the attribute bitter taste ranked as the least important when consuming celery (
Table 5). Although ranked as least important, bitterness should still be considered an important characteristic to celery taste as the compounds that inflict bitterness and astringency often possess multiple health benefits upon consumption including antioxidant, anti-inflammatory, and anticancer properties [
43,
44,
45]. These are predominately from non-volatile compounds such as phenolic acids and flavonoids [
43,
44,
45].
Agglomerative Hierarchical Cluster Analysis of Consumer Data and Internal Preference Mapping
Agglomerative hierarchical cluster (AHC) analysis was completed to identify relatively homogeneous groups of consumers based on their overall liking scores. Three clusters of consumers were identified and the mean liking scores of the clusters are presented in
Table 6. Consumers in cluster 1 (43.2%) neither liked or disliked hybrids 25x12 and 22x12 and expressed a moderate dislike for genotype 12. Cluster 2 (38.9%) behaved in a similar manner to cluster 1, liking slightly genotypes 25, 22 and 25x12 and neither liked or disliked genotype 12 and hybrid 22x12. Opposing clusters 1 and 2, consumers in cluster 3 (17.8%) liked slightly genotype 12 and moderately disliked 25x12 due to its strong flavour attributes.
Labelling each participant present within each cluster as a liker or non-liker, 60.8, 82.6 and 57.1% were celery likers in clusters 1, 2 and 3. Interestingly, cluster 3 contained the highest proportion of celery non-likers and they liked the most genotype 12, a genotype that expressed a high abundance of volatile compounds and profiled as very aromatic with a strong bitter taste, whereas 25x12 was the least liked and profiled as less aromatic (
Table 2). On the other hand, hybrid 25x12 was the most liked of the hybrids according to clusters 1 and 2. One reason might be the high score of crunchiness and moist mouthfeel by the trained panel (
Table 2); both attributes ranked as important according to consumers (
Table 5). There was also significant interaction between sample x cluster for overall liking confirming that consumers scored differently the samples in each cluster (
Table 6).
Sensory attributes assessed by the trained panel (
Table 2) and mean liking scores of each cluster were regressed onto the first two principal components of the consumer overall liking data to form an internal preference map (
Figure 3). Principal components one (PC1) and two (PC2) explained 47.63% of the variation in the data with hybrids and genotype 22 separated from genotypes 12 and 25 across PC1, driven by sweet taste (ST), moist mouthfeel (MM) and stalk thickness (STA) attributes. Genotypes 12 and 25 were separated across PC2 with genotype 12 being positively correlated with grass/green flavour (GGF), bitter taste (BT) and stringy mouthfeel (SM) attributes.
Cluster 1 displayed no significant relationship with any sensory characteristics (
Figure 3), therefore, confirming that celery not possessing a strong aroma such as hybrids 22x12 and 25x12 (
Table 1 and
Table 2), were more liked. Genotypes 25 and 22 and hybrid 25x12 were scored highly for stalk thickness (STA), moist mouthfeel (MM) and had a firm first bite (FM) with a sweet taste (ST) as discussed during sensory profiling (
Table 2) and these attributes were closely associated to the most liked genotypes within cluster 2. Both clusters expressed no significant correlation with any flavour or odour attributes and preferred the celery that expressed low relative abundance of the volatile compounds (
Table 1). For this reason, genotype 12 was the most disliked celery sample for clusters 1 and 2. Genotype 12 expressed a high relative abundance of volatile compounds (
Table 1) in addition to scoring significantly higher in grass/green flavour (
Table 2). Ribbed appearance (RA), grass/green aroma (GGA), bitter taste (BT) and fresh parsley aroma and flavour (FPA and FPF) were attributes positively correlated with this genotype.
Clusters 1 and 2 displayed similar overall liking scores in comparison to cluster 3. However, observed in the bottom right quadrant there appears to be a ‘gap’ where none of the clusters are placed (
Figure 3) yet genotype 22 and hybrids 22x12 and 12x22 are positioned there. Although no cluster were associated with these hybrids, the consumers that are situated there displayed preference to celery that expressed a fresh fennel flavour and aroma accompanied by a soapy aftertaste. Hybrid 25x12 was the closest match to the highest proportion of consumers that were grouped into clusters 1 and 2. However, the hybrid requires further development with particular focus on the moist mouthfeel, stalk thickness and sweet taste attributes. These attributes are the drivers of liking for 82% of the consumers in this study. On the other hand, the drivers of liking for those consumers placed in cluster 3 (18%) were grassy flavour and bitter taste.
Penalty analysis was used to relate Just-About-Right (JAR) data to liking scores and explain drivers of overall liking in relation to aroma, sweetness, bitterness, flavour and stringiness intensity and the results are presented in
Table 7.
When the attributes are not at the optimum intensity for a consumer this may influence the overall liking. Sweetness was ranked by the consumers as the second most important characteristic, and this was reflected in
Table 7, whereby for all genotypes and hybrids, there was a negative impact on the overall liking when the sweetness of the samples was considered too low. This agreed with over 50% of the consumers in all samples. On the other hand, there was a significant drop in the liking of all samples when the bitter taste intensity was “too much” by the consumers with the genotypes 12 and 22 perceived the most bitter and genotype 25 the least bitter. Hybrid samples were scored in between the parent genotypes. Interestingly, regarding the flavour intensity attribute, it can be observed that there was a significant drop in the liking for almost all samples when the flavour intensity of the samples was considered either “too little” or “too much”. Where significant drops were observed for flavour intensity attribute, no significant drop in overall liking was observed for aroma intensity, too little or too much, displaying that consuming celery is more important for deciding preference than just smelling the sample. Stringiness, which expressed a negative correlation with crunchy texture by the sensory panel (
Table 2), displayed significant drops in overall liking if samples were considered to be “too much” in genotype 12 and all the hybrids. Genotype 12 and hybrid 12x22 were considered to be the most stringy, and a mean drop of 1.3 and 0.9 in the overall liking occurred, respectively. Although scored lower, the stringiness scored by the panel of 12x22 was like genotype 12 (
Table 2). The maternal inheritance of the ribbed appearance is clearly demonstrated from genotype 12 in 12x22. As texture was scored as an important attribute for consumers (
Table 5), we would recommend to breeders to use a female parent that expresses the desirable appearance and textural attributes as a strong maternal inheritance has been observed in this study.
Additional comments on the samples provided by the participants contained both positive and negative points and these are shown in
Table 8. Although bitter and sweet taste have been identified as drivers of disliking and liking, the results from the consumer evaluation of celery samples demonstrated that consumers could not identify differences in taste (
Table 4) whereas the trained panel clearly identified significant differences between all samples in sweetness and bitterness (
Table 2).
Overall, there was no hybrid that was significantly preferred by the consumer with all hybrids scoring between 2.0 and 2.1 (
Table 4). Both 25x12 and 22x12 were scored in a similar manner in preference ranking (
Table 4) as well as in sensory analysis; however, upon combining the data collected from liking (
Table 4), attribute ranking (
Table 5), cluster analysis (
Table 6) and JAR (
Table 7), with further developing, 25x12 holds the potential to be a new hybrid that matches most of the consumers’ desire. Expressing characteristics including a crunchy and moist mouthfeel, low stringiness and an odour and flavour that was not scored too highly by the panel (
Table 1 and
Table 2,
Figure 1 and
Figure 2). Contrastingly, hybrid 12x22 expressed high abundance of volatile compounds (
Table 1) and was scored accordingly by the panel, with strong associations to fresh parsley flavour (
Figure 2 and
Figure 3). The maternal inheritance was clear in both 12x22 and 25x12, with the characteristics of both female parents displayed within the hybrids. This was less apparent in hybrid 22x12, whereby the possibility of these genotypes being closely related causes difficulties with matching parental characteristics. The overall liking score for genotype 12 was the lowest (
Table 4), possibly due to the sample expressing a stringy and dry mouthfeel attributes yet high scoring flavour attributes such as soapy, fresh parsley and grass (
Table 2). This genotype was also scored as the most bitter and least sweet. Bitterness was an attribute ranked as least important and sweetness was ranked as second most important for consumers, when considering their most desirable characteristics for a celery (
Table 5). 25x12 was the only hybrid that expressed a mean drop in liking if an increase or decrease in bitterness occurred (
Table 7) possibly indicating that the bitter intensity of this crop is at an acceptable level for 21% of consumers. This hybrid contains genetic material from both genotypes 25 and 12, the most sweet and bitter parental genotypes, and we can clearly see that the favourable attributes of both genotypes have been passed on; the preferred mouthfeel attributes of genotype 25 combined with the distinct flavour of genotype 12 without being overpowering. The taste characteristics have been combined to produce a less bitter hybrid.


