
A Potential Quorum-Sensing Inhibitor for Bronchiectasis Therapy: Quercetin–Chitosan Nanoparticle Complex Exhibiting Superior Inhibition of Biofilm Formation and Swimming Motility of Pseudomonas aeruginosa to the Native Quercetin


Abstract
:
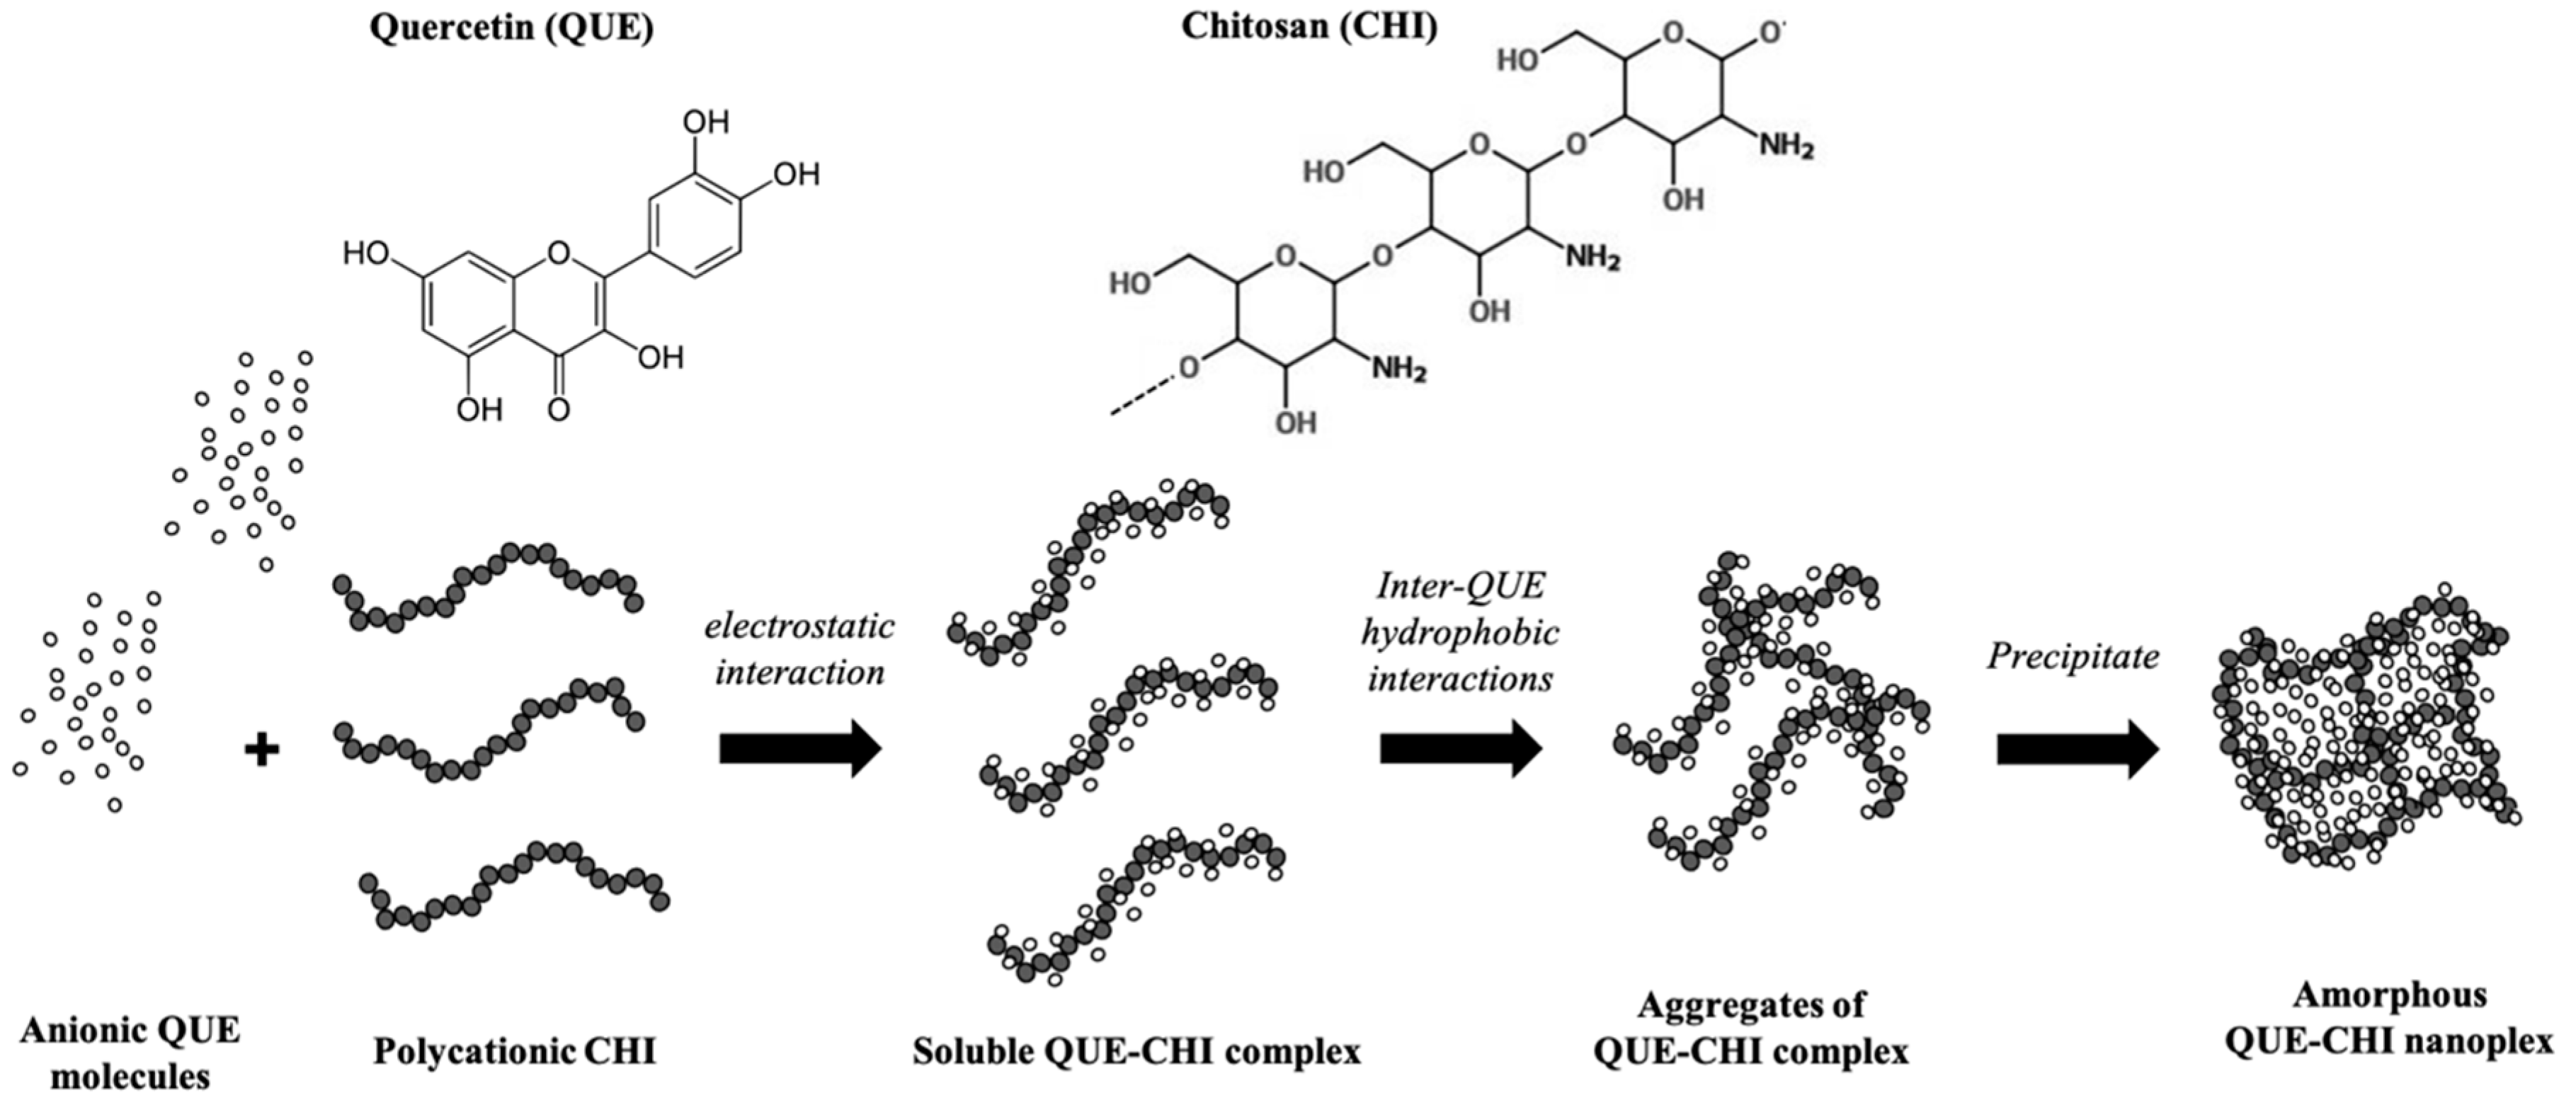
1. Introduction
2. Results and Discussion
2.1. Optimal Preparation pH
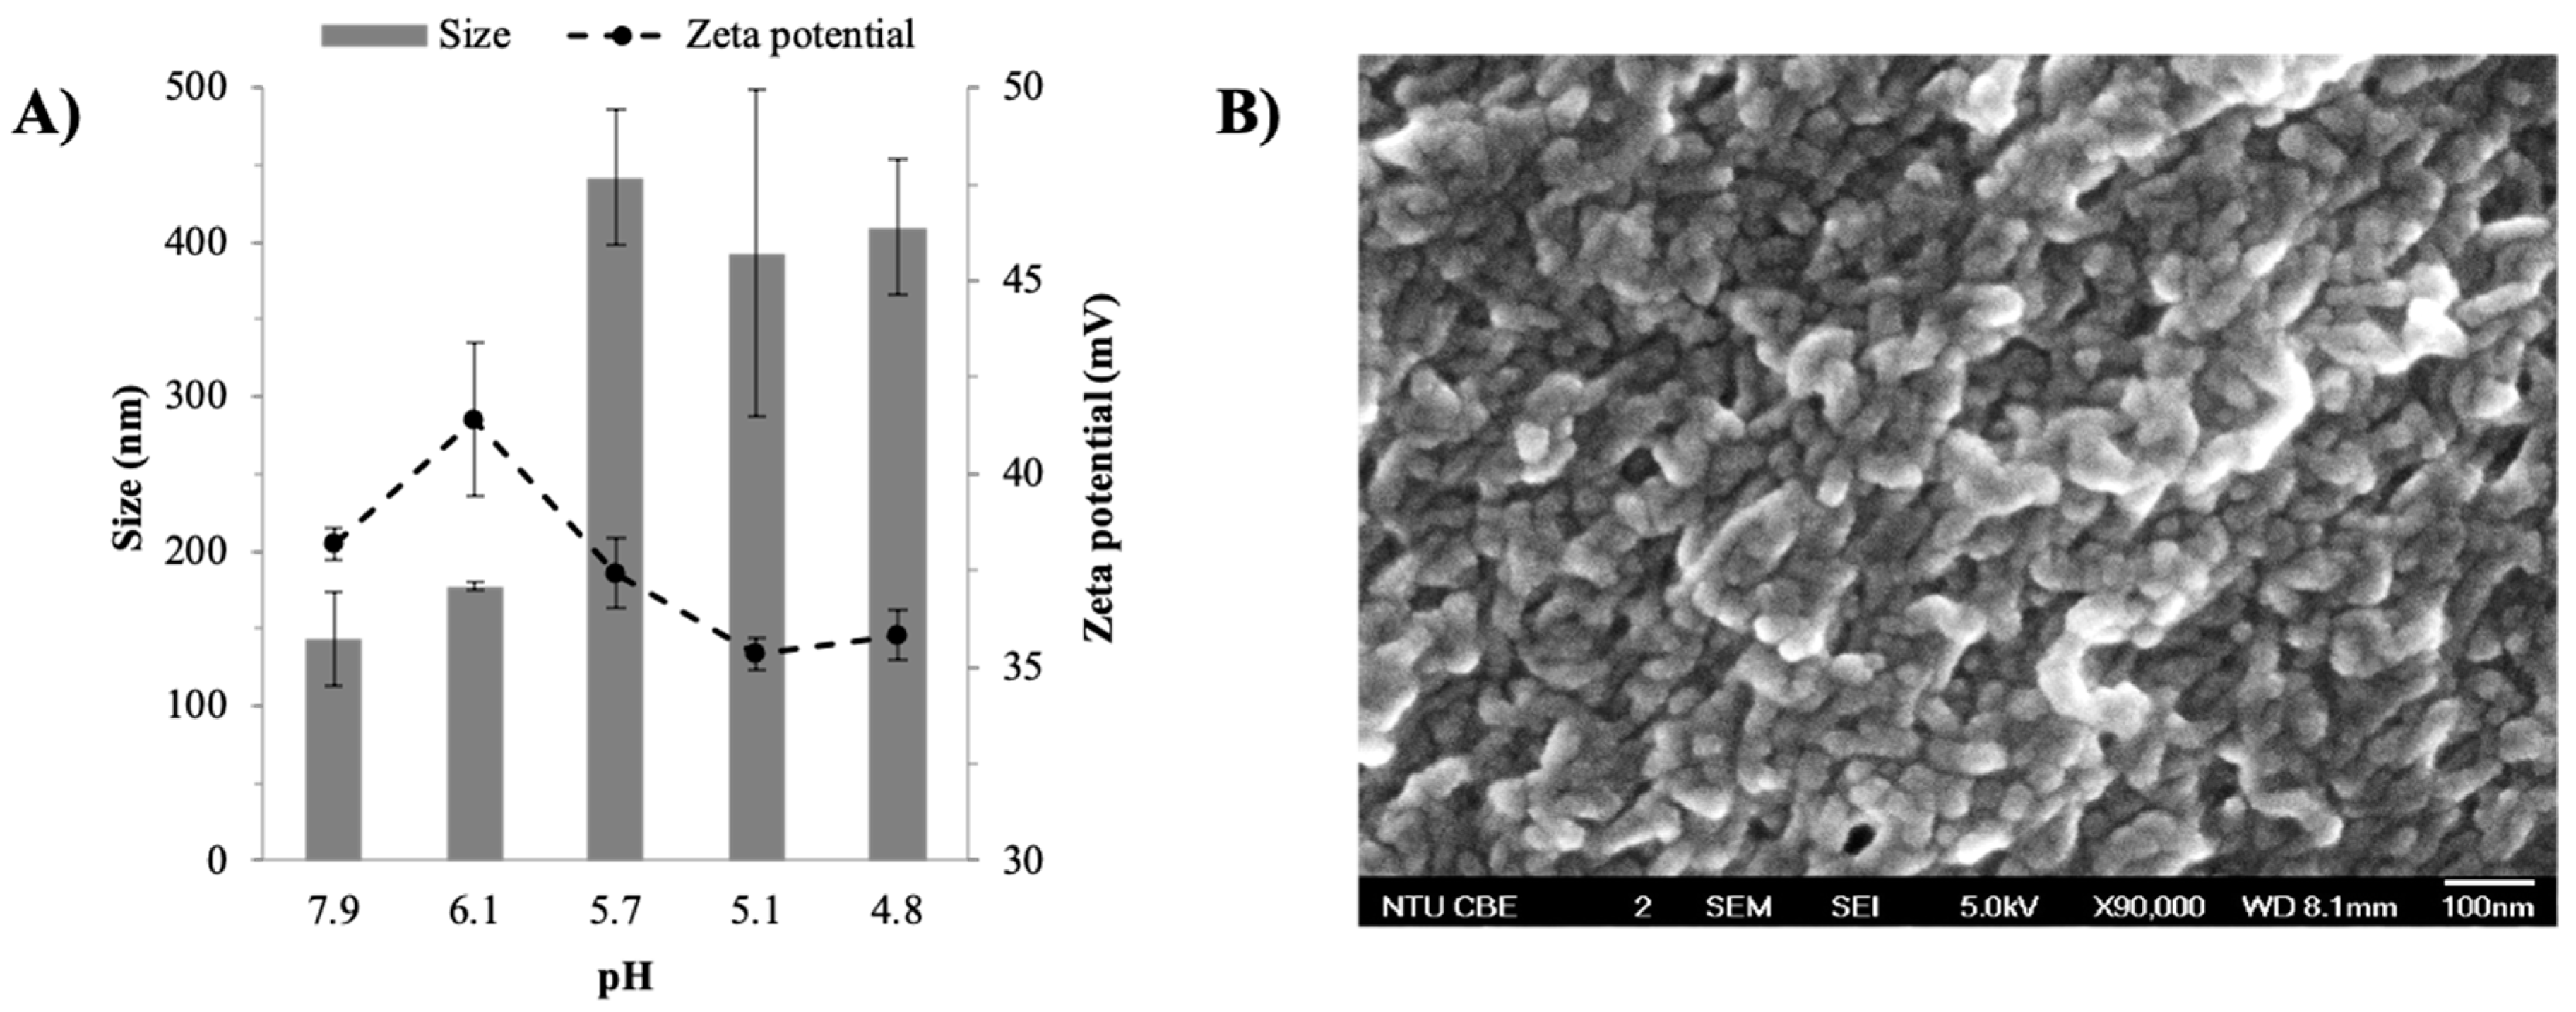
2.1.1. Effects of pH on Size and Zeta Potential
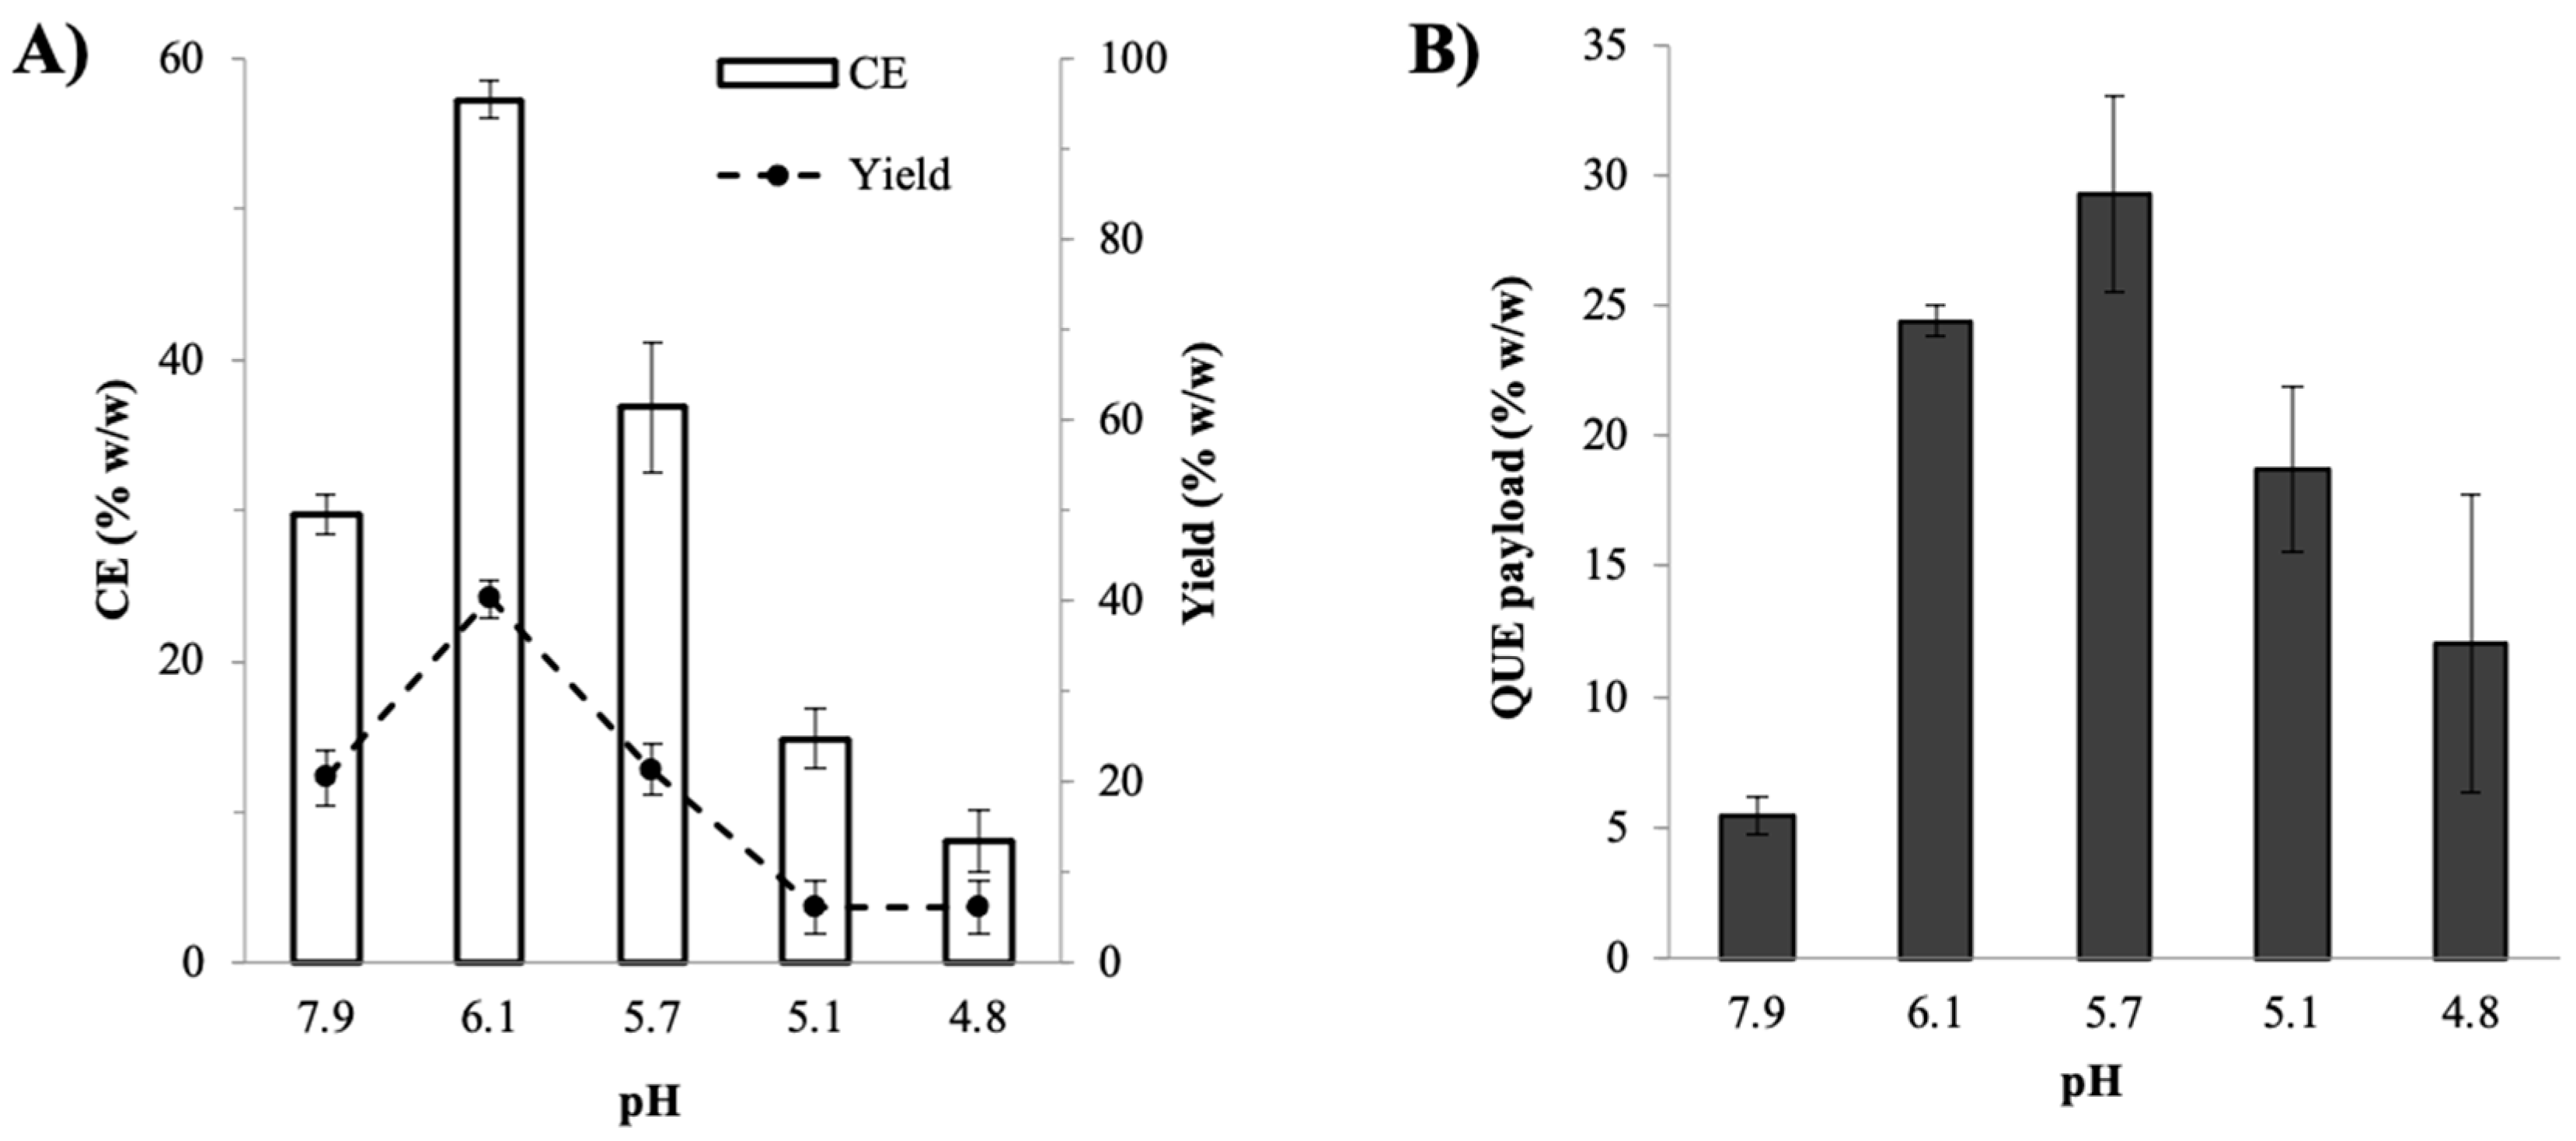
2.1.2. Effects of pH on the Preparation Efficiency and QUE Payload
2.2. Physical Characteristics of the Optimal QUE–CHI Nanoplex
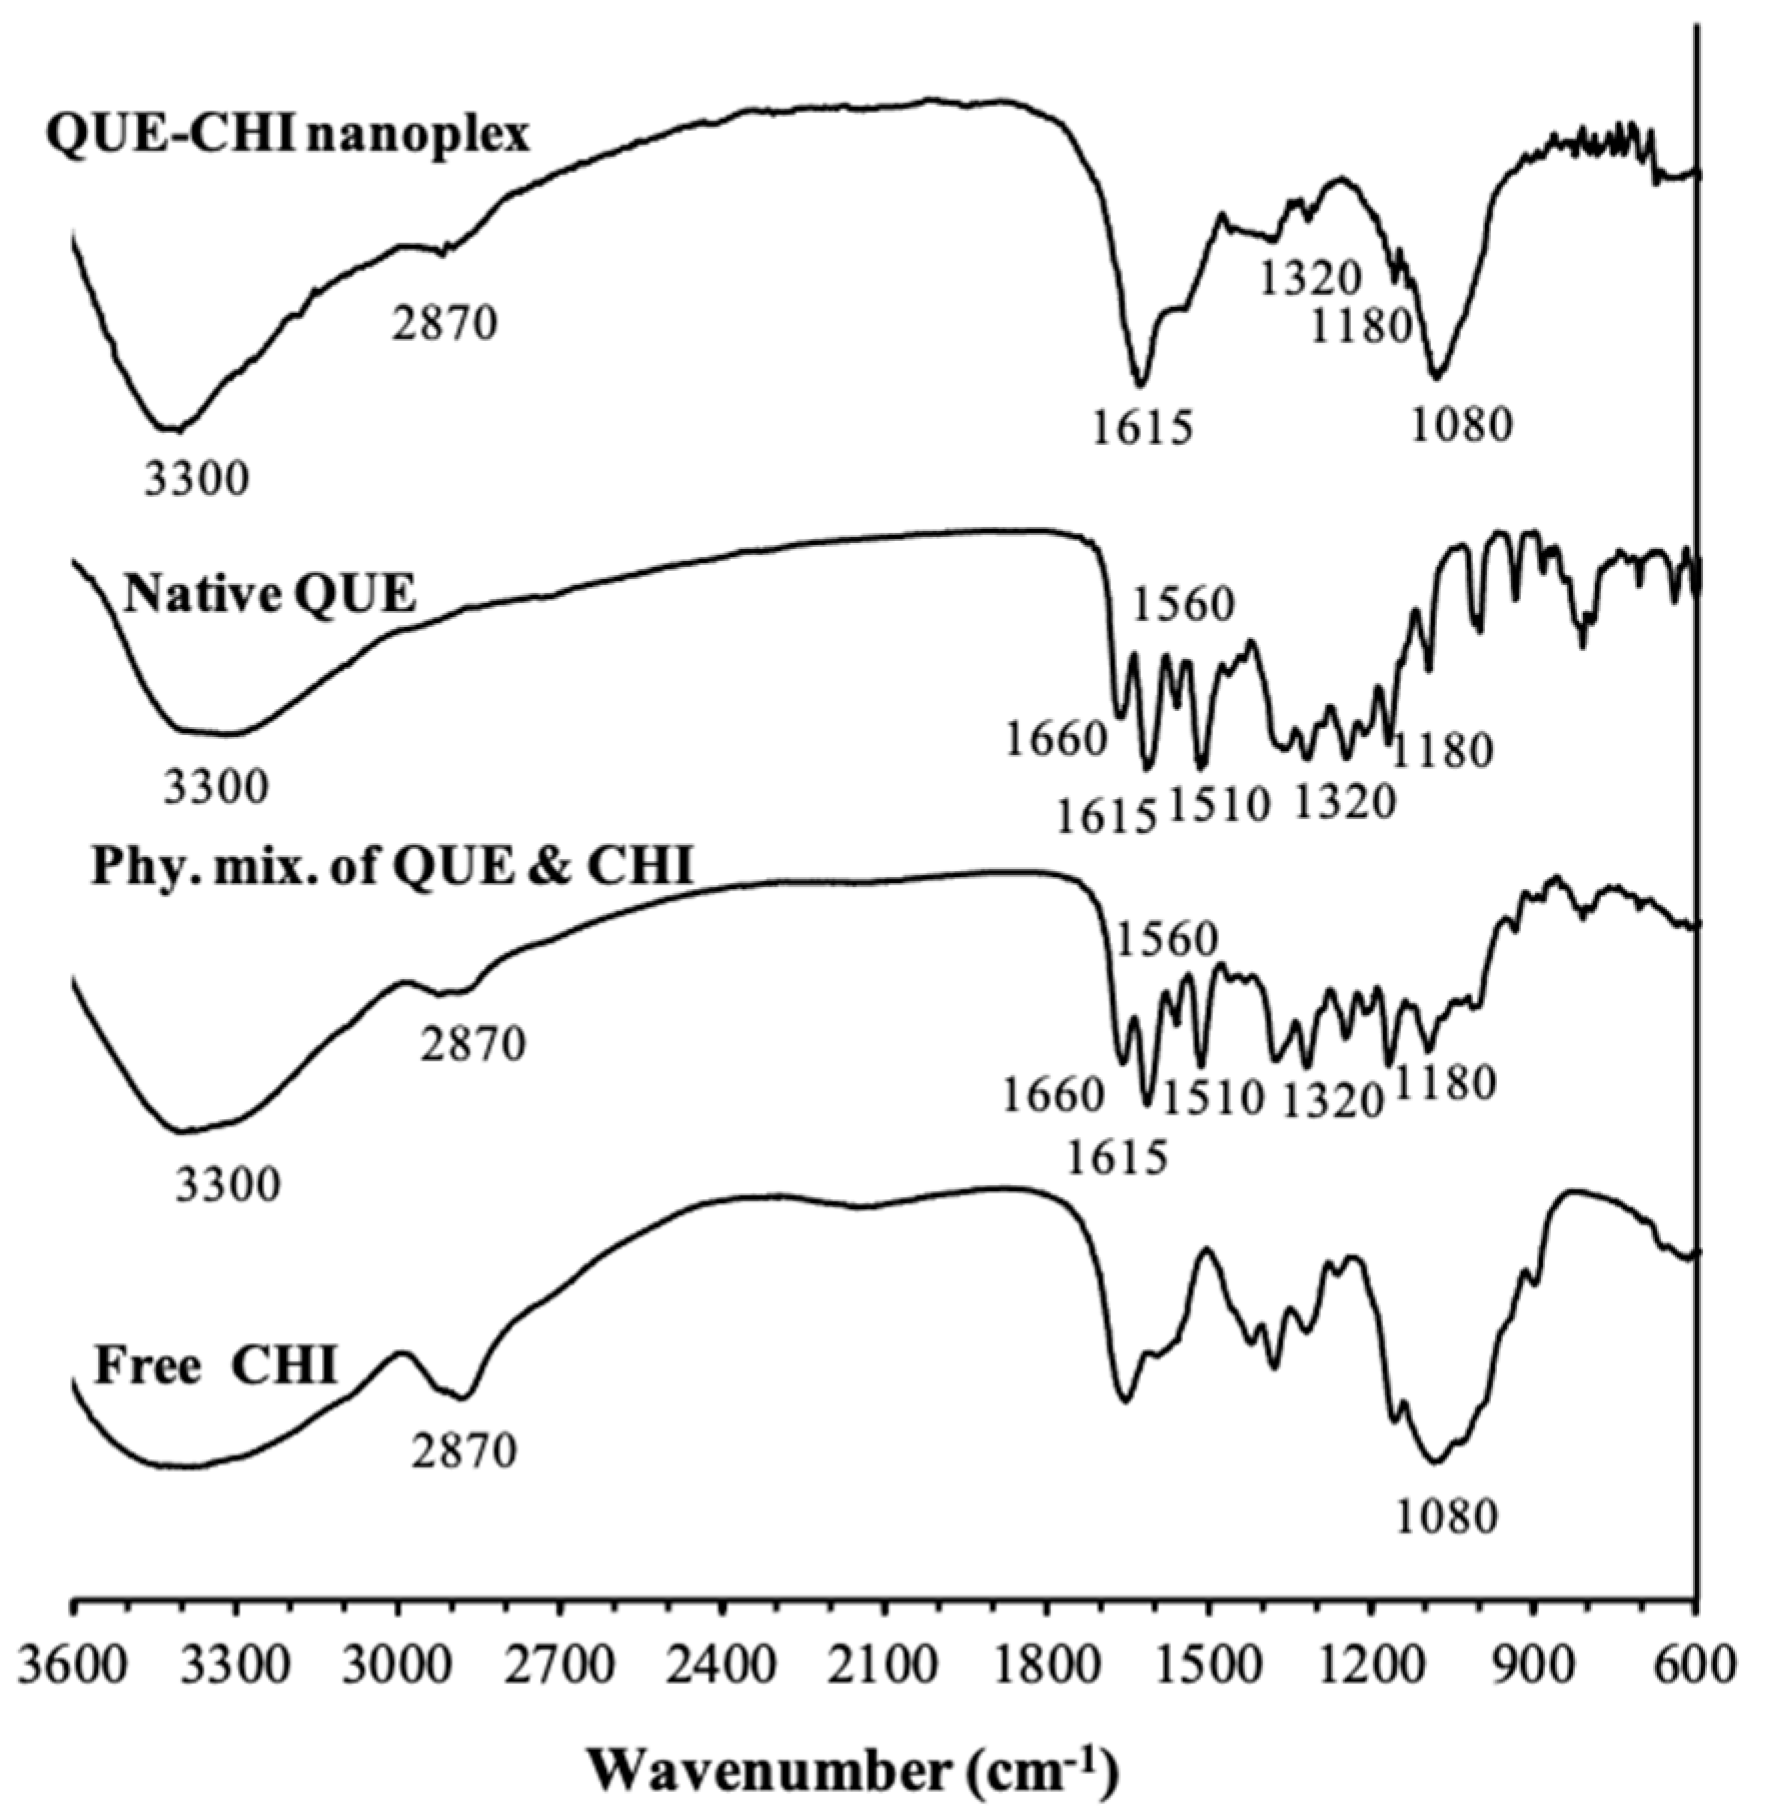
2.2.1. FTIR
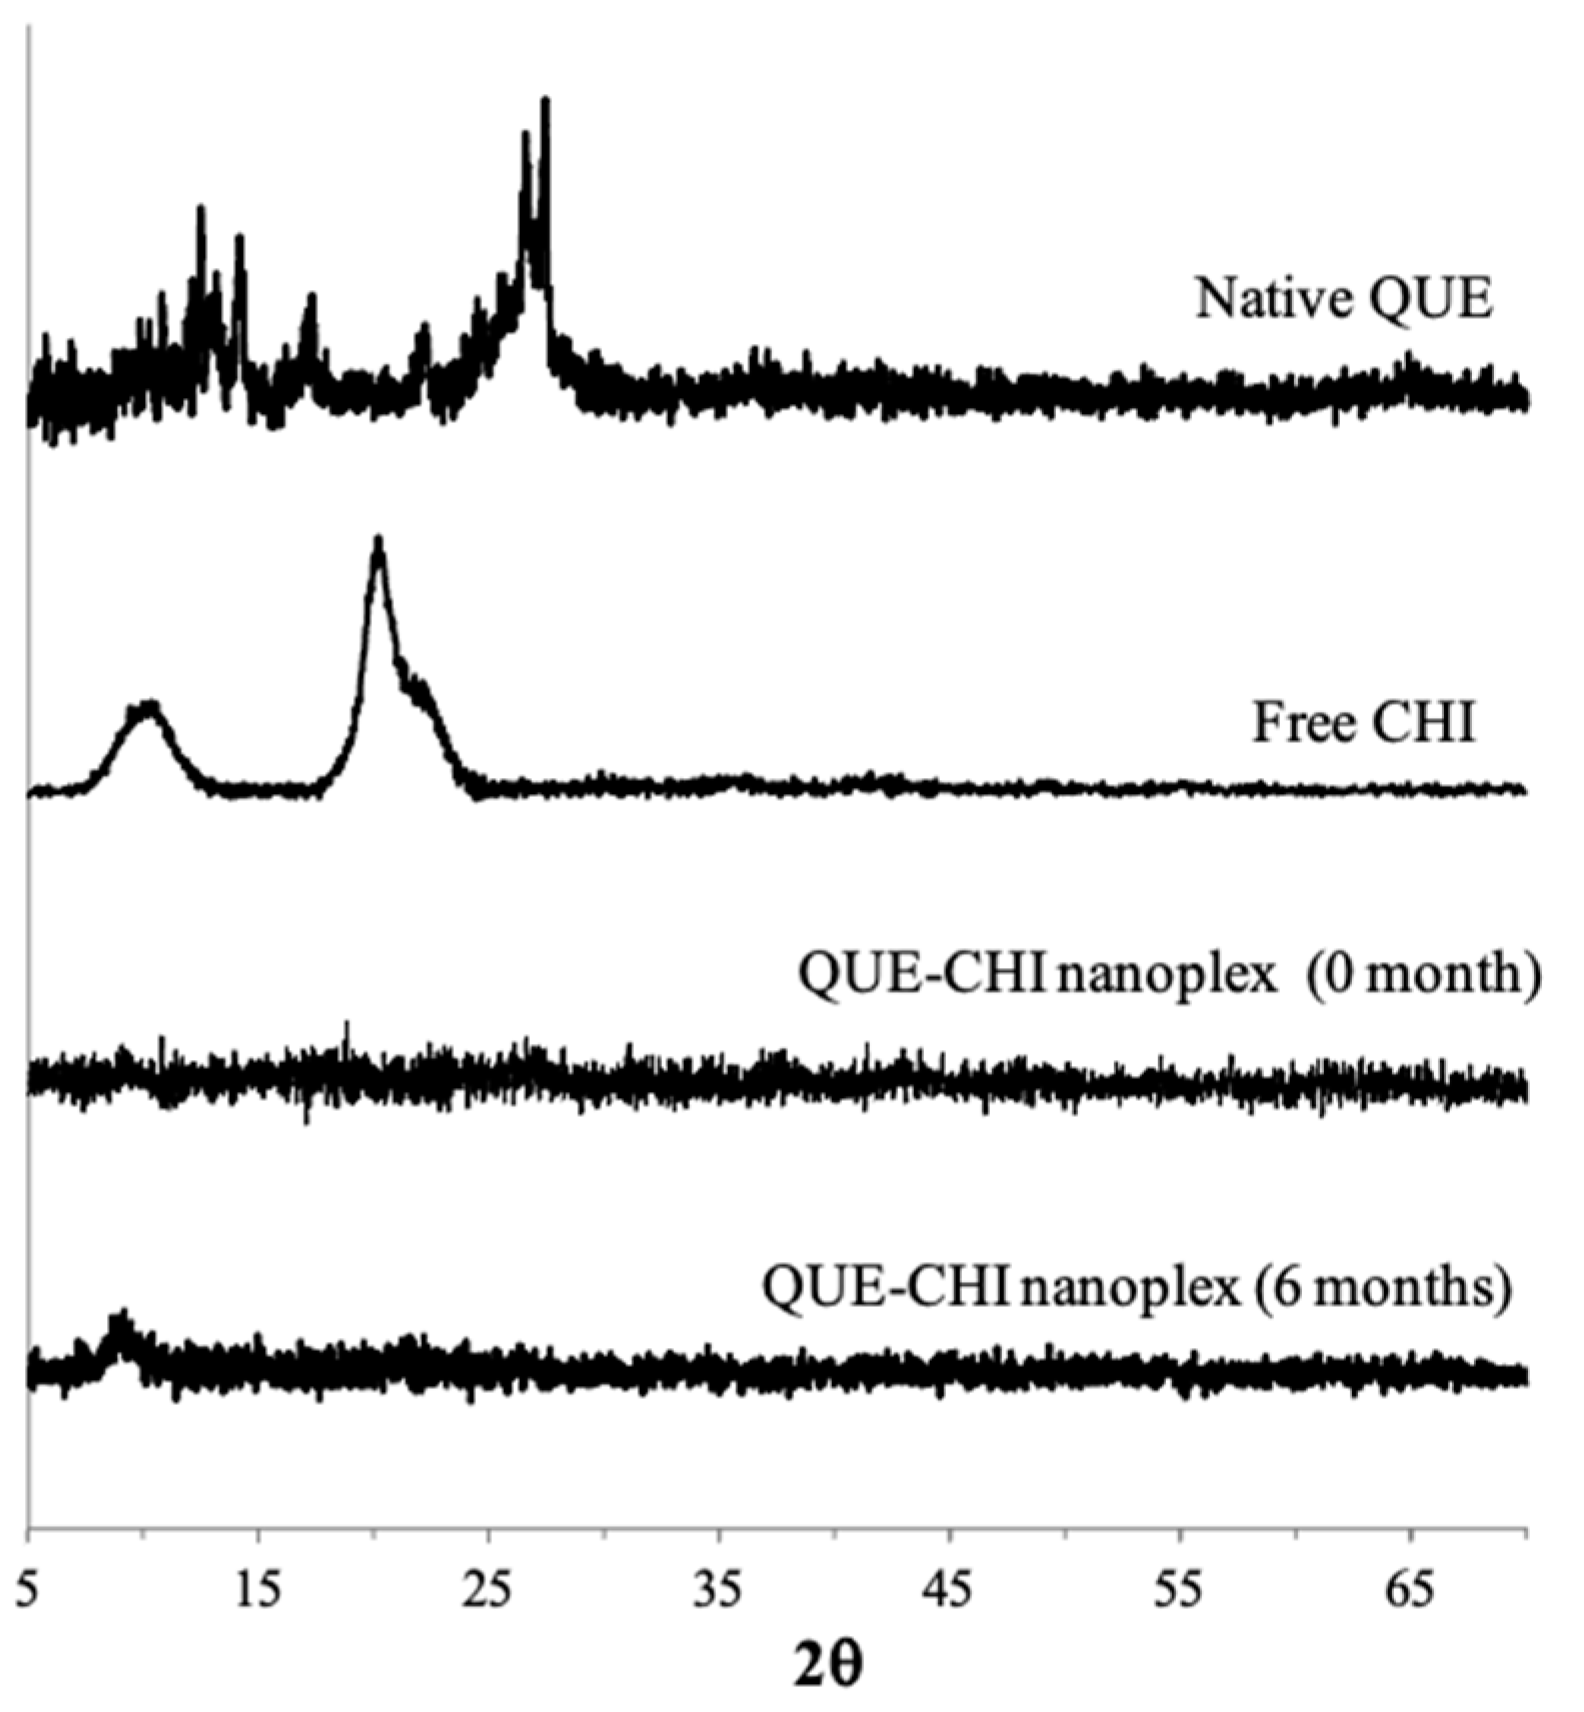
2.2.2. PXRD
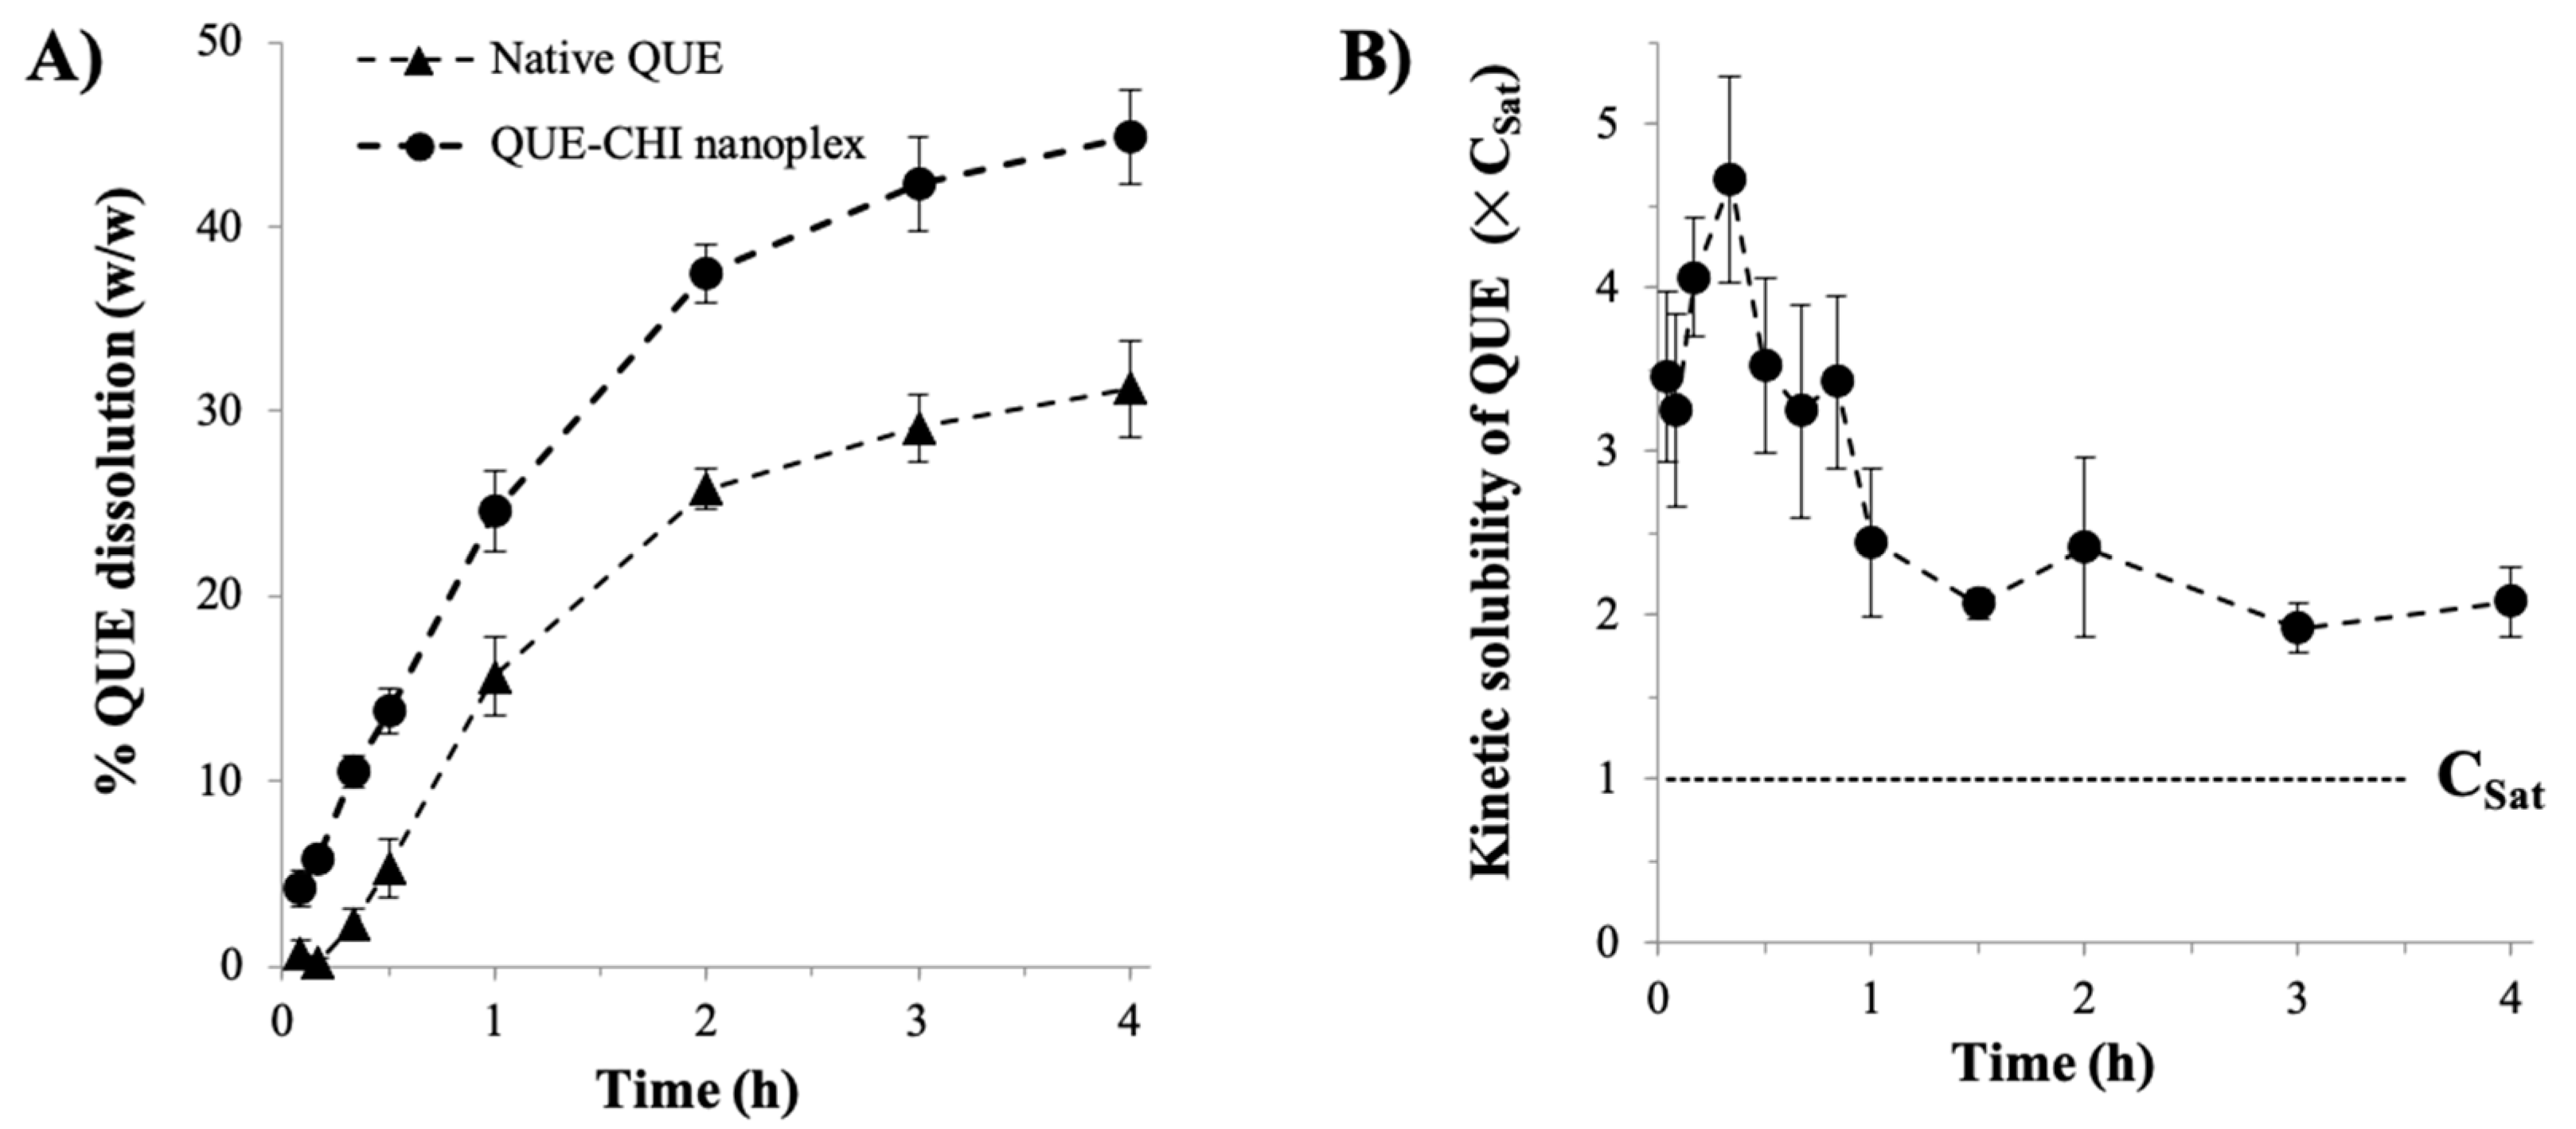
2.3. Dissolution Characteristics
2.4. Antibacterial Activity
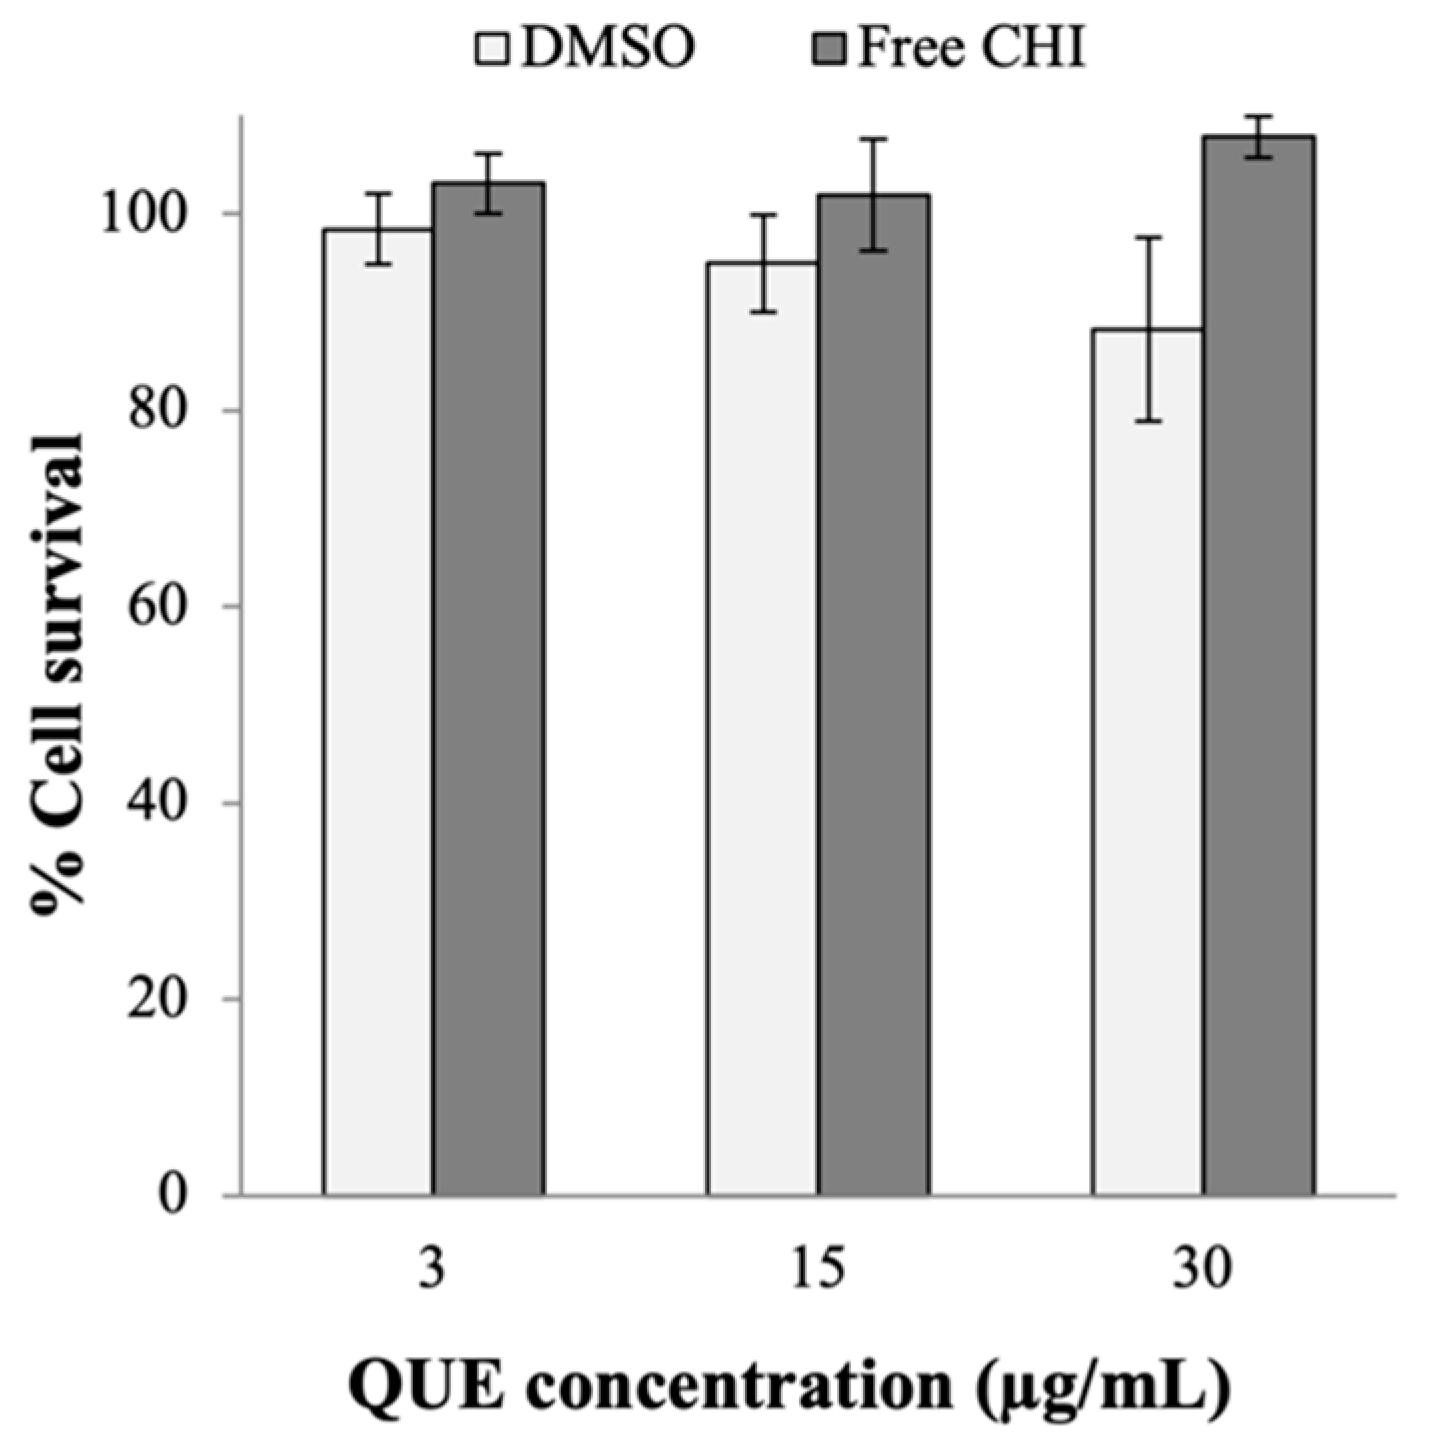
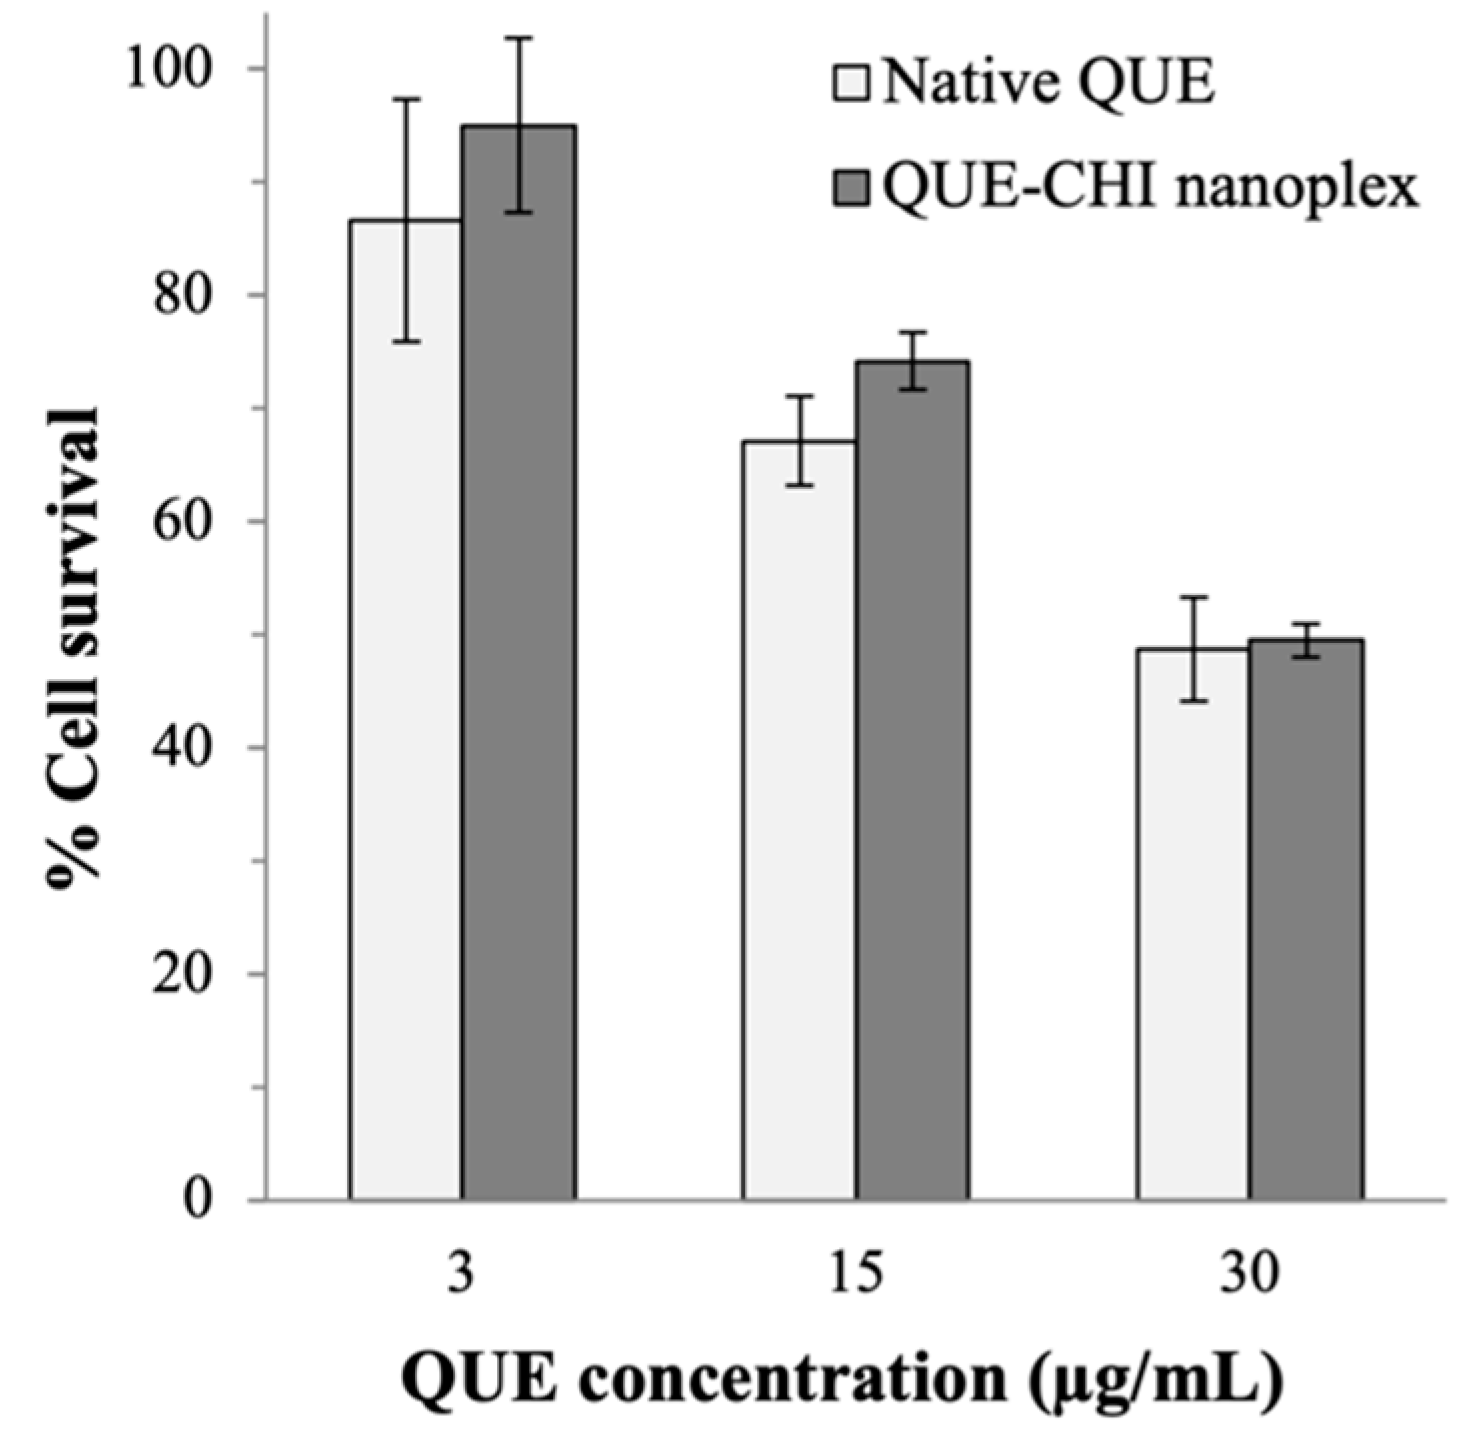
2.5. Anticancer Activity
2.6. QS Inhibition
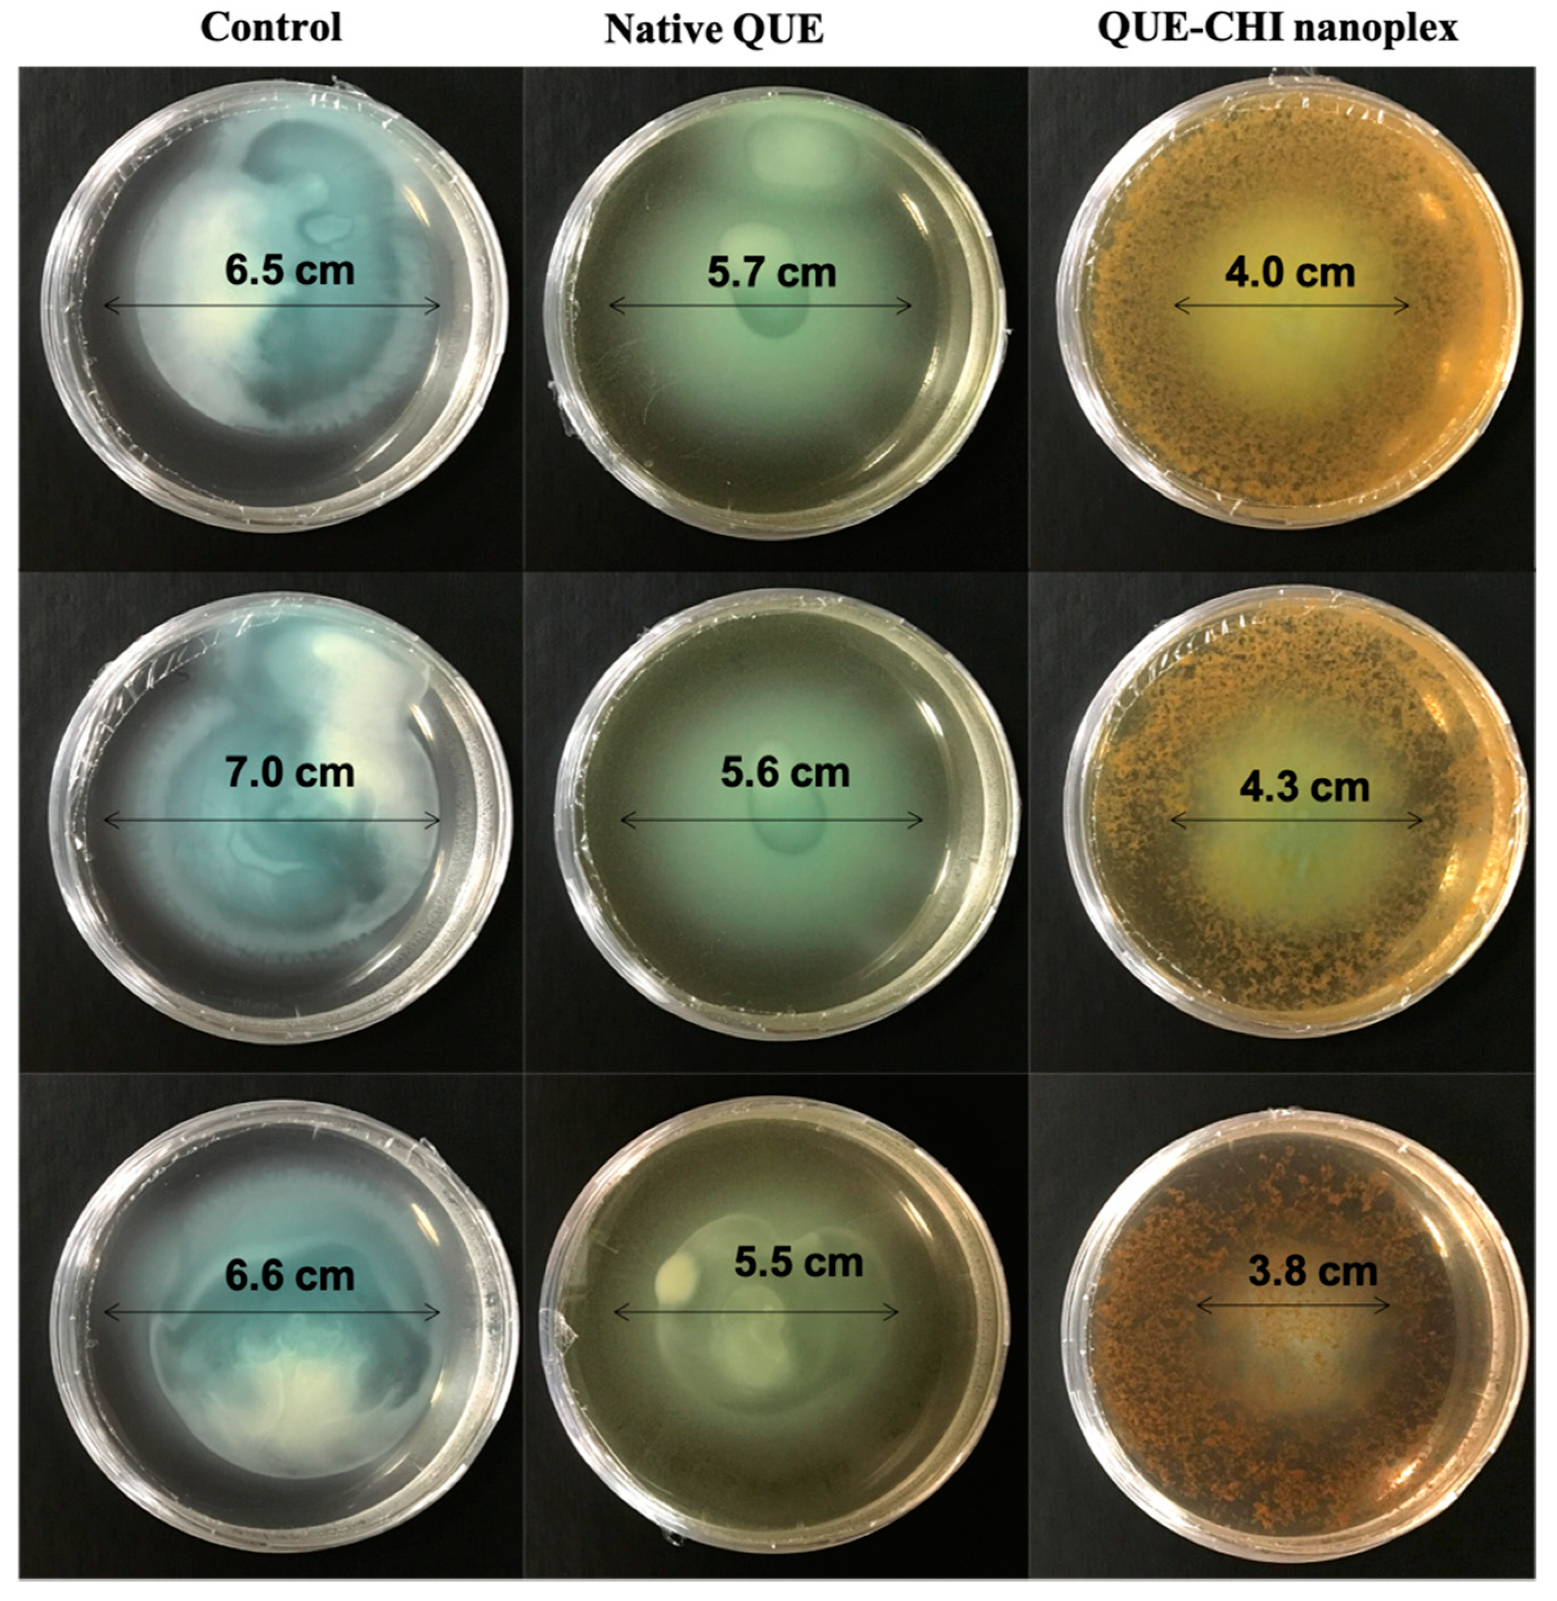
2.6.1. Swimming Motility
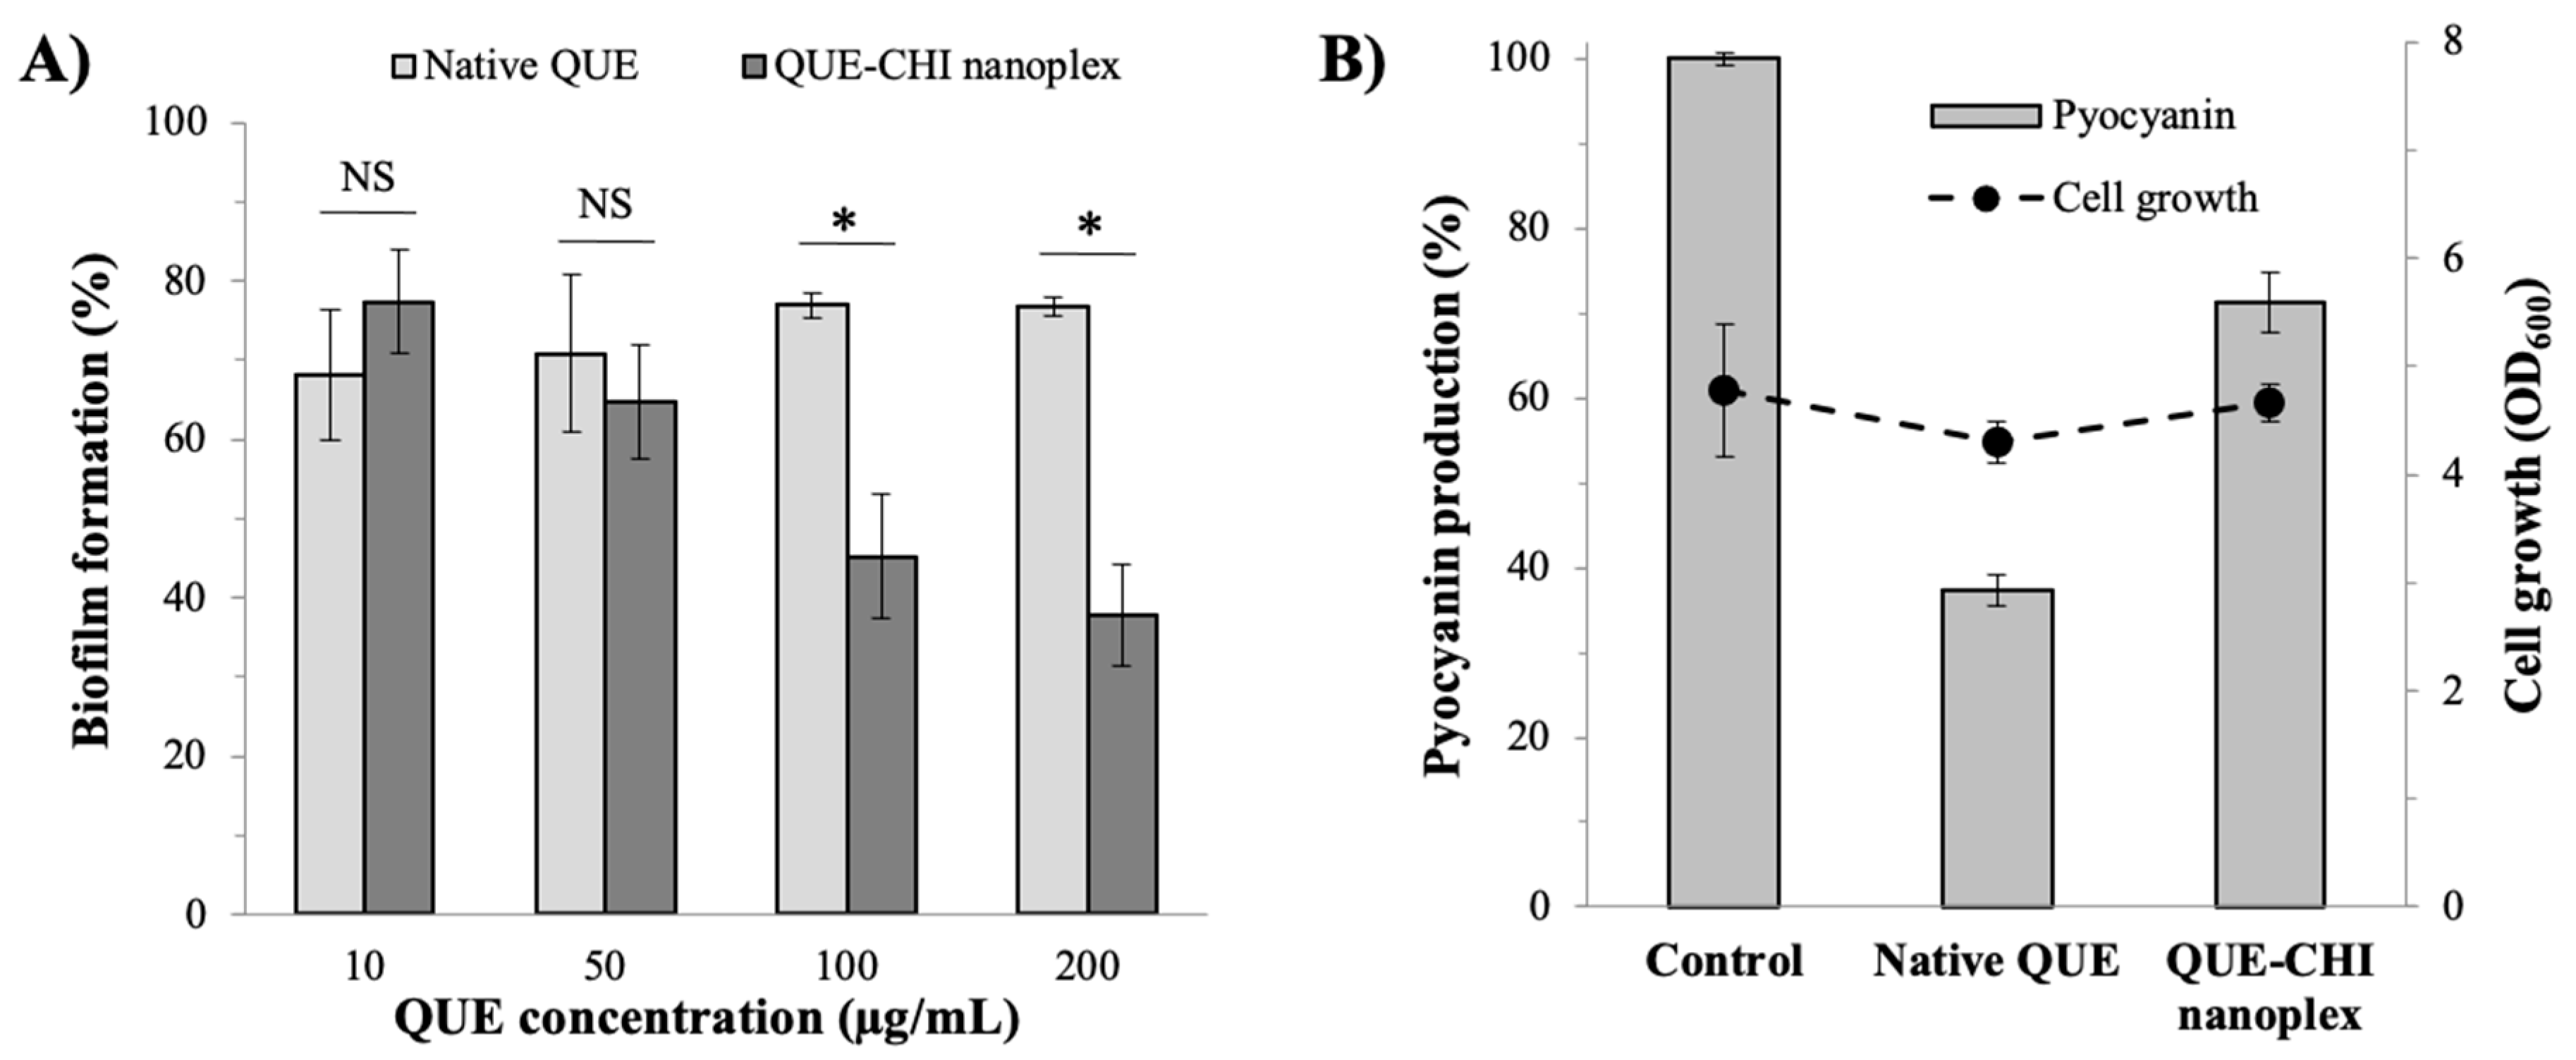
2.6.2. Rate of Biofilm Formation
2.6.3. Virulence Factor Production
3. Materials and Methods
3.1. Materials
3.2. Methods
3.2.1. Preparation of QUE–CHI Nanoplex
3.2.2. Physical Characterizations of QUE–CHI Nanoplex
3.2.3. Kinetic Solubility and Dissolution Rate
3.2.4. Antibacterial Activity
3.2.5. Cytotoxicity towards the Human Lung Cancer Cells
3.2.6. Rate of Biofilm Formation
3.2.7. Swimming Motility and Pyocyanin Production
3.2.8. Statistical Analysis
4. Conclusions
Author Contributions
Funding
Institutional Review Board Statement
Informed Consent Statement
Data Availability Statement
Acknowledgments
Conflicts of Interest
Abbreviations
| AA | Acetic acid |
| CSat | Thermodynamic saturation solubility |
| CHI | Chitosan |
| COPD | Chronic obstructive pulmonary disease |
| DLS | Dynamic light scattering |
| DMEM | Dulbecco’s modified Eagle’s medium |
| DMSO | Dimethyl sulfoxide |
| EPS | Extracellular polymeric substance |
| FESEM | Field emission scanning electron microscope |
| FTIR | Fourier-transform infrared |
| HPLC | High-performance liquid chromatography |
| LB | Luria–Bertani |
| MHB | Mueller–Hinton broth |
| MIC | Minimum inhibitory concentration |
| MW | Molecular weight |
| OD | Optical density |
| PBS | Phosphate-buffered saline |
| PDI | Polydispersity index |
| PXRD | Powder X-ray diffraction |
| QUE | Quercetin |
| QS | Quorum sensing |
| UV-vis | Ultraviolet-visible |
Appendix A
Appendix A.1. MIC of the Free CHI

| CHI (µg/mL) | 25 | 50 | 75 | 125 | 250 |
|---|---|---|---|---|---|
| OD600 | 0.754 ± 0.010 | 0.860 ± 0.003 | 0.926 ± 0.008 | 0.048 ± 0.009 | 0.046 ± 0.003 |
Appendix A.2. Cytotoxicity of DMSO and the Free CHI
References
- Turner, R.M.; DePietro, M.; Ding, B.; Duplaga, M.; El Akkary, I. Overlap of Asthma and Chronic Obstructive Pulmonary Disease in Patients in the United States: Analysis of Prevalence, Features, and Subtypes. JMIR Public Health Surveill. 2018, 4, 94–104. [Google Scholar] [CrossRef] [PubMed] [Green Version]
- Schluger, N.W.; Koppaka, R. Lung disease in a global context. A call for public health action. Ann. Am. Thorac. Soc. 2014, 11, 407–416. [Google Scholar] [CrossRef] [PubMed]
- Quaderi, S.; Hurst, J.R. The unmet global burden of COPD. Glob. Health Epidemiol. Genom. 2018, 3, e4. [Google Scholar] [CrossRef] [PubMed] [Green Version]
- Hurst, J.R.; Elborn, J.S.; Soyza, A.D. COPD–bronchiectasis overlap syndrome. Eur. Respir. J. 2015, 45, 310. [Google Scholar] [CrossRef] [PubMed]
- Sethi, S. Infection as a comorbidity of COPD. Eur. Respir. J. 2010, 35, 1209. [Google Scholar] [CrossRef] [PubMed] [Green Version]
- Chalmers, J.D.; Aliberti, S.; Blasi, F. Management of bronchiectasis in adults. Eur. Respir. J. 2015, 45, 1446. [Google Scholar] [CrossRef] [Green Version]
- Pereira, P.S.M.; Gomes, L.; Costa, J.; Ferreira, C. Multidrug resistant bacteria in bronchiectasis exacerbations. Respir. Infect. 2019, 54 (Suppl. 63), PA2872. [Google Scholar] [CrossRef]
- Gao, Y.; Guan, W.-J.; Zhu, Y.-N.; Chen, R.-C.; Zhang, G. Antibiotic-resistant Pseudomonas aeruginosa infection in patients with bronchiectasis: Prevalence, risk factors and prognostic implications. Int. J. Chronic Obstr. Pulm. Dis. 2018, 13, 237–246. [Google Scholar] [CrossRef] [Green Version]
- Regan, K.H.; Hill, A.T. Emerging therapies in adult and paediatric bronchiectasis. Respirology 2018, 23, 1127–1137. [Google Scholar] [CrossRef] [Green Version]
- Wilson, R.; Aksamit, T.; Aliberti, S.; De Soyza, A.; Elborn, J.S.; Goeminne, P.; Hill, A.T.; Menendez, R.; Polverino, E. Challenges in managing Pseudomonas aeruginosa in non-cystic fibrosis bronchiectasis. Respir. Med. 2016, 117, 179–189. [Google Scholar] [CrossRef] [Green Version]
- Hadinoto, K.; Cheow, W.S. Nano-antibiotics in chronic lung infection therapy against Pseudomonas aeruginosa. Colloids Surf. B Biointerfaces 2014, 116, 772–785. [Google Scholar] [CrossRef] [PubMed]
- Sharma, D.; Misba, L.; Khan, A.U. Antibiotics versus biofilm: An emerging battleground in microbial communities. Antimicrob. Resist. Infect. Control 2019, 8, 76. [Google Scholar] [CrossRef] [PubMed]
- De Kievit, T.R.; Gillis, R.; Marx, S.; Brown, C.; Iglewski, B.H. Quorum-sensing genes in Pseudomonas aeruginosa biofilms: Their role and expression patterns. Appl. Environ. Microbiol. 2001, 67, 1865. [Google Scholar] [CrossRef] [PubMed] [Green Version]
- Karatuna, O.; Yagci, A. Analysis of quorum sensing-dependent virulence factor production and its relationship with antimicrobial susceptibility in Pseudomonas aeruginosa respiratory isolates. Clin. Microbiol. Infect. 2010, 16, 1770–1775. [Google Scholar] [CrossRef] [Green Version]
- Li, Y.; Qu, H.-P.; Liu, J.-L.; Wan, H.-Y. Correlation between group behavior and quorum sensing in Pseudomonas aeruginosa isolated from patients with hospital-acquired pneumonia. J. Thorac. Dis. 2014, 6, 810–817. [Google Scholar]
- Burr, L.D.; Rogers, G.B.; Chen, A.C.; Hamilton, B.R.; Pool, G.F.; Taylor, S.L.; Venter, D.; Bowler, S.D.; Biga, S.; McGuckin, M.A. Macrolide treatment inhibits pseudomonas aeruginosa quorum sensing in non-cystic fibrosis bronchiectasis. An analysis from the bronchiectasis and low-dose erythromycin study trial. Ann. Am. Thorac. Soc. 2016, 13, 1697–1703. [Google Scholar]
- Ouyang, J.; Sun, F.; Feng, W.; Sun, Y.; Qiu, X.; Xiong, L.; Liu, Y.; Chen, Y. Quercetin is an effective inhibitor of quorum sensing, biofilm formation and virulence factors in Pseudomonas aeruginosa. J. Appl. Microbiol. 2016, 120, 966–974. [Google Scholar] [CrossRef] [Green Version]
- Manner, S.; Fallarero, A. Screening of natural product derivatives identifies two structurally related flavonoids as potent quorum sensing inhibitors against gram-negative bacteria. Int. J. Mol. Sci. 2018, 19, 1346. [Google Scholar] [CrossRef] [Green Version]
- Memariani, H.; Memariani, M.; Ghasemian, A. An overview on anti-biofilm properties of quercetin against bacterial pathogens. World J. Microbiol. Biotechnol. 2019, 35, 143. [Google Scholar] [CrossRef]
- Vipin, C.; Saptami, K.; Fida, F.; Mujeeburahiman, M.; Rao, S.S.; Athmika; Arun, A.B.; Rekha, P.D. Potential synergistic activity of quercetin with antibiotics against multidrug-resistant clinical strains of Pseudomonas aeruginosa. PLoS ONE 2020, 15, e0241304. [Google Scholar] [CrossRef]
- Han, M.K.; Barreto, T.A.; Martinez, F.J.; Comstock, A.T.; Sajjan, U.S. Randomised clinical trial to determine the safety of quercetin supplementation in patients with chronic obstructive pulmonary disease. BMJ Open Respir. Res. 2020, 7, e000392. [Google Scholar] [CrossRef] [PubMed] [Green Version]
- Cai, X.; Fang, Z.; Dou, J.; Yu, A.; Zhai, G. Bioavailability of quercetin: Problems and promises. Curr. Med. Chem. 2013, 20, 2572–2582. [Google Scholar] [CrossRef] [PubMed]
- Gao, Y.; Wang, Y.; Ma, Y.; Yu, A.; Cai, F.; Shao, W.; Zhai, G. Formulation optimization and in situ absorption in rat intestinal tract of quercetin-loaded microemulsion. Colloids Surf. B Biointerfaces 2009, 71, 306–314. [Google Scholar] [CrossRef]
- Karadag, A.; Özçelik, B.; Huang, Q. Quercetin nanosuspensions produced by high-pressure homogenization. J. Agric. Food Chem. 2014, 62, 1852–1859. [Google Scholar] [CrossRef] [PubMed]
- Kakran, M.; Sahoo, N.; Li, L. Dissolution enhancement of quercetin through nanofabrication, complexation, and solid dispersion. Colloids Surf. B Biointerfaces 2011, 88, 121–130. [Google Scholar] [CrossRef] [PubMed]
- Smith, A.J.; Kavuru, P.; Wojtas, L.; Zaworotko, M.J.; Shytle, R.D. Cocrystals of Quercetin with Improved Solubility and Oral Bioavailability. Mol. Pharm. 2011, 8, 1867–1876. [Google Scholar] [CrossRef] [PubMed]
- Li, B.; Konecke, S.; Harich, K.; Wegiel, L.; Taylor, L.S.; Edgar, K.J. Solid dispersion of quercetin in cellulose derivative matrices influences both solubility and stability. Carbohydr. Polym. 2013, 92, 2033–2040. [Google Scholar] [CrossRef]
- Kim, M.K.; Park, K.-S.; Yeo, W.-S.; Choo, H.; Chong, Y. In vitro solubility, stability and permeability of novel quercetin–amino acid conjugates. Bioorg. Med. Chem. 2009, 17, 1164–1171. [Google Scholar] [CrossRef]
- Benhabiles, M.; Salah, R.; Lounici, H.; Drouiche, N.; Goosen, M.; Mameri, N. Antibacterial activity of chitin, chitosan and its oligomers prepared from shrimp shell waste. Food Hydrocoll. 2012, 29, 48–56. [Google Scholar] [CrossRef]
- Rivera Aguayo, P.; Bruna Larenas, T.; Alarcón Godoy, C.; Cayupe Rivas, B.; González-Casanova, J.; Rojas-Gómez, D.; Caro Fuentes, N. Antimicrobial and antibiofilm capacity of chitosan nanoparticles against wild type strain of pseudomonas sp. isolated from milk of cows diagnosed with bovine mastitis. Antibiotics 2020, 9, 551. [Google Scholar] [CrossRef]
- Cheow, W.S.; Hadinoto, K. Green amorphous nanoplex as a new supersaturating drug delivery system. Langmuir 2012, 28, 6265–6275. [Google Scholar] [CrossRef] [PubMed]
- Rho, K.; Hadinoto, K. Dry powder inhaler delivery of amorphous drug nanoparticles: Effects of the lactose carrier particle shape and size. Powder Technol. 2013, 233, 303–311. [Google Scholar]
- Momić, T.; Savić, J.Z.; Černigoj, U.; Trebše, P.; Vasić, V.M. Protolytic equilibria and photodegradation of quercetin in aqueous solution. Collect. Czechoslov. Chem. Commun. 2007, 72, 1447–1460. [Google Scholar] [CrossRef]
- Jurasekova, Z.; Torreggiani, A.; Tamba, M.; Sanchez-Cortes, S.; Garcia-Ramos, J. Raman and surface-enhanced Raman scattering (SERS) investigation of the quercetin interaction with metals: Evidence of structural changing processes in aqueous solution and on metal nanoparticles. J. Mol. Struct. 2009, 918, 129–137. [Google Scholar] [CrossRef]
- Herrero-Martínez, J.M.; Sanmartin, M.; Rosés, M.; Bosch, E.; Ràfols, C. Determination of dissociation constants of flavonoids by capillary electrophoresis. Electrophoresis 2005, 26, 1886–1895. [Google Scholar] [CrossRef]
- Catauro, M.; Papale, F.; Bollino, F.; Piccolella, S.; Marciano, S.; Nocera, P.; Pacifico, S.; Bollini, F. Silica/quercetin sol–gel hybrids as antioxidant dental implant materials. Sci. Technol. Adv. Mater. 2015, 16, 035001. [Google Scholar] [CrossRef] [Green Version]
- Dong, B.; Lim, L.M.; Hadinoto, K. Enhancing the physical stability and supersaturation generation of amorphous drug-polyelectrolyte nanoparticle complex via incorporation of crystallization inhibitor at the nanoparticle formation step: A case of HPMC versus PVP. Eur. J. Pharm. Sci. 2019, 138, 105035. [Google Scholar] [CrossRef]
- Khan, F.; Pham, D.T.N.; Oloketuyi, S.F.; Manivasagan, P.; Oh, J.; Kim, Y.-M. Chitosan and their derivatives: Antibiofilm drugs against pathogenic bacteria. Colloids Surf. B Biointerfaces 2020, 185, 110627. [Google Scholar] [CrossRef]
- Boots, A.W.; Veith, C.; Albrecht, C.; Bartholome, R.; Drittij, M.-J.; Claessen, S.M.H.; Bast, A.; Rosenbruch, M.; Jonkers, L.; Van Schooten, F.-J.; et al. The dietary antioxidant quercetin reduces hallmarks of bleomycin-induced lung fibrogenesis in mice. BMC Pulm. Med. 2020, 20, 112. [Google Scholar] [CrossRef]
- Rubini, D.; Banu, S.F.; Subramani, P.; Hari, B.N.V.; Gowrishankar, S.; Pandian, S.K.; Wilson, A.; Nithyanand, P. Extracted chitosan disrupts quorum sensing mediated virulence factors in Urinary tract infection causing pathogens. Pathog. Dis. 2019, 77, ftz009. [Google Scholar] [CrossRef]
- Badawy, M.S.E.; Riad, O.K.M.; Taher, F.; Zaki, S.A. Chitosan and chitosan-zinc oxide nanocomposite inhibit expression of LasI and RhlI genes and quorum sensing dependent virulence factors of Pseudomonas aeruginosa. Int. J. Biol. Macromol. 2020, 149, 1109–1117. [Google Scholar] [CrossRef] [PubMed]
- Ilk, S.; Sağlam, N.; Özgen, M.; Korkusuz, F. Chitosan nanoparticles enhances the anti-quorum sensing activity of kaempferol. Int. J. Biol. Macromol. 2017, 94, 653–662. [Google Scholar] [CrossRef] [PubMed]
- Usher, L.R.; Lawson, R.A.; Geary, I.; Taylor, C.J.; Bingle, C.D.; Taylor, G.W.; Whyte, M.K.B. Induction of neutrophil apoptosis by the pseudomonas aeruginosa exotoxin pyocyanin: A potential mechanism of persistent infection. J. Immunol. 2002, 168, 1861–1868. [Google Scholar] [CrossRef] [PubMed] [Green Version]
- Rinaudo, M.; Pavlov, G.; Desbrières, J. Influence of acetic acid concentration on the solubilization of chitosan. Polymer 1999, 40, 7029–7032. [Google Scholar] [CrossRef]
- Atala, E.; Fuentes, J.; Wehrhahn, M.J.; Speisky, H. Quercetin and related flavonoids conserve their antioxidant properties despite undergoing chemical or enzymatic oxidation. Food Chem. 2017, 234, 479–485. [Google Scholar] [CrossRef]
| QUE (µg/mL) | 100 | 200 | 300 | 400 | 500 |
|---|---|---|---|---|---|
| QUE–CHI nanoplex | 0.504 ± 0.044 | 0.333 ± 0.049 | 0.271 ± 0.095 | 0.163 ± 0.149 | 0.048 ± 0.067 |
| Native QUE | 0.329 ± 0.051 | 0.301 ± 0.039 | 0.252 ± 0.001 | 0.195 ± 0.054 | 0.097 ± 0.029 |
Publisher’s Note: MDPI stays neutral with regard to jurisdictional claims in published maps and institutional affiliations. |
© 2021 by the authors. Licensee MDPI, Basel, Switzerland. This article is an open access article distributed under the terms and conditions of the Creative Commons Attribution (CC BY) license (http://creativecommons.org/licenses/by/4.0/).
Share and Cite
Tran, T.-T.; Hadinoto, K. A Potential Quorum-Sensing Inhibitor for Bronchiectasis Therapy: Quercetin–Chitosan Nanoparticle Complex Exhibiting Superior Inhibition of Biofilm Formation and Swimming Motility of Pseudomonas aeruginosa to the Native Quercetin. Int. J. Mol. Sci. 2021, 22, 1541. https://doi.org/10.3390/ijms22041541
Tran T-T, Hadinoto K. A Potential Quorum-Sensing Inhibitor for Bronchiectasis Therapy: Quercetin–Chitosan Nanoparticle Complex Exhibiting Superior Inhibition of Biofilm Formation and Swimming Motility of Pseudomonas aeruginosa to the Native Quercetin. International Journal of Molecular Sciences. 2021; 22(4):1541. https://doi.org/10.3390/ijms22041541
Chicago/Turabian StyleTran, The-Thien, and Kunn Hadinoto. 2021. "A Potential Quorum-Sensing Inhibitor for Bronchiectasis Therapy: Quercetin–Chitosan Nanoparticle Complex Exhibiting Superior Inhibition of Biofilm Formation and Swimming Motility of Pseudomonas aeruginosa to the Native Quercetin" International Journal of Molecular Sciences 22, no. 4: 1541. https://doi.org/10.3390/ijms22041541